27
A Look Under The Hood How TV Drives Digital Interactions For Automotive

A Look Under The HoodHow TV Drives Digital Interactions For
Automotive
2
VAB: A LOOK UNDER THE HOOD
Contents
Overview 3-4
Automotive Brands 5
TV Spend vs. Website Traffic 6-18Total Universe 7-9
Domestic Auto Segment 10-12
Asian Auto Segment 13-15
European Auto Segment 16-18
TV Spend vs. Other Digital Interactions 19-25Search Queries 20-21
Social Actions 22-23
Online Video Views 24-25
Summary 26
Contact Information 27
3
Automotive continues to be one of the largest category spenders in media and has even recently seen
double-digit growth in TV advertising expenditures during the all-important fourth quarter time period
when new model year vehicles are released.
While many automotive brands have increased their TV investment because savvy marketers know that it
works, some brands have recently decreased their investment in TV and re-allocated their dollars to
other platforms.
In this analysis we take a look under the hood of several top automotive manufacturers to examine the
relationship between their TV spend and key digital metrics like website traffic, search queries, social
actions and online video views.
Throughout the analysis, which focuses on a year-over-year comparison of the crucial 4Q time period, we
provide numerous examples of how TV spend, both increases and decreases, has an effect on the desire
of a consumer to further engage with a brand through online investigation, conversation and exploration.
This report, a follow-up to our 2016 automotive analysis entitled Shifting Gears, serves as another proof
point in our series of analyses that showcases the strong correlation between TV investment and digital
interactions across categories.
A Look Under The Hood:
The Effects Of TV Spend On Digital Interactions
VAB: A LOOK UNDER THE HOOD
4
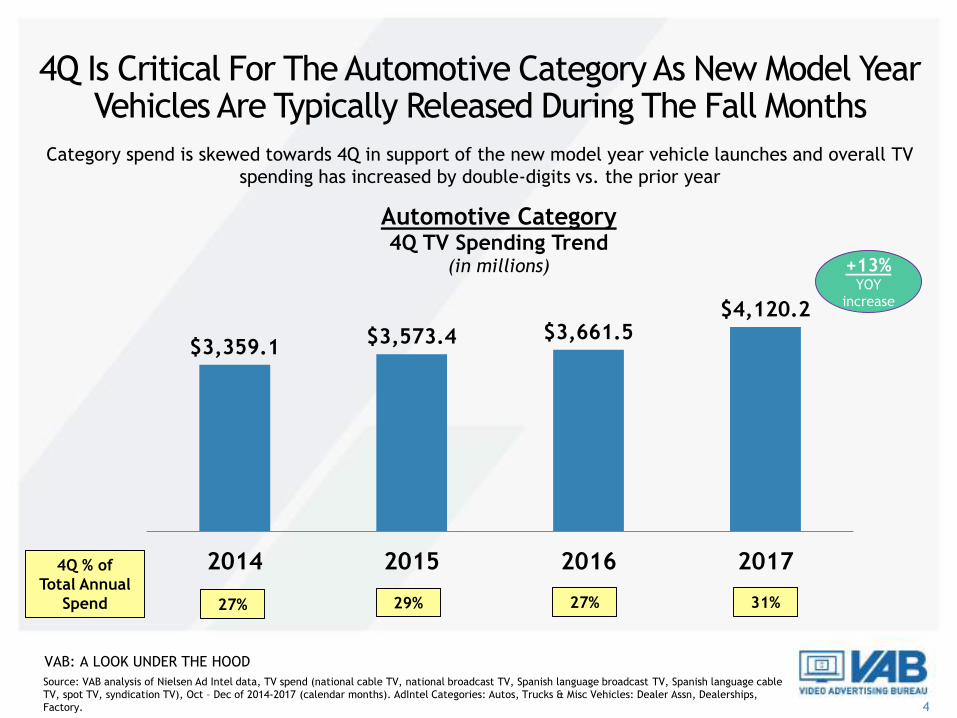
4Q Is Critical For The Automotive Category As New Model Year Vehicles Are Typically Released During The Fall Months
Source: VAB analysis of Nielsen Ad Intel data, TV spend (national cable TV, national broadcast TV, Spanish language broadcast TV, Spanish language cable
TV, spot TV, syndication TV), Oct – Dec of 2014-2017 (calendar months). AdIntel Categories: Autos, Trucks & Misc Vehicles: Dealer Assn, Dealerships,
Factory.
$3,359.1$3,573.4 $3,661.5
$4,120.2
2014 2015 2016 2017
Automotive Category4Q TV Spending Trend
(in millions)
4Q % of
Total Annual
Spend 27% 29% 27% 31%
+13%YOY
increase
Category spend is skewed towards 4Q in support of the new model year vehicle launches and overall TV
spending has increased by double-digits vs. the prior year
VAB: A LOOK UNDER THE HOOD

5
4Q Analysis: Top 25 TV Spending Automotive Manufacturers Analyzed Across Both Foreign & Domestic Categories
• We analyzed the TV spend and key digital metrics – brand website traffic, search queries, social actions and online video
views – for 25 automotive manufacturers based on a year-over-year 4Q comparison (4Q’16 vs. 4Q’17)
• The brands analyzed represent a cross-section of the category: domestic and foreign, luxury and economy, trucks and cars
Top 25 Automotive Manufacturer TV Advertisers
*The automotive manufacturers group reflects the top 25 TV spending brands in CY 2017 as measured by Nielsen AdIntel; all brands had $100MM+ in TV
spending (national cable TV, national broadcast TV, Spanish language broadcast TV, Spanish language cable TV, spot TV, syndication TV) between their
factory and dealer association categories.
VAB: A LOOK UNDER THE HOOD

6
TV Spend vs. Website Traffic Correlation

7
“Total Universe” Findings:A Definitive Correlation Between TV Spend & Website Traffic
19 of the 25 Automotive Manufacturers (76%) Analyzed Exhibited a Direct
Correlation Between TV Spend & Website Traffic (4Q’16 vs. 4Q’17)
19 Brands11 Brands Were In Both TV Spend & Monthly Unique Visitors
8 Brands Were In Both TV Spend & Monthly Unique Visitors
6 BrandsLack of correlation between TV Spend &
Monthly Unique Visitors
VAB: A LOOK UNDER THE HOOD
Source: VAB analysis of comScore mediametrix multiplatform media trend data; total audience (Desktop P2+, Mobile 18+), Oct ’16 - Dec ‘16 vs Oct ’17 -
Dec ‘17 (calendar months). VAB analysis of Nielsen Ad Intel data, TV spend (natl cable TV, natl broadcast TV, Spanish lang broadcast TV, Spanish lang
cable TV, spot TV, syndication TV), Oct ’16 - Dec ‘16 vs Oct ’17 - Dec ‘17 (calendar months). Figures are based on a monthly average within each quarter.
8
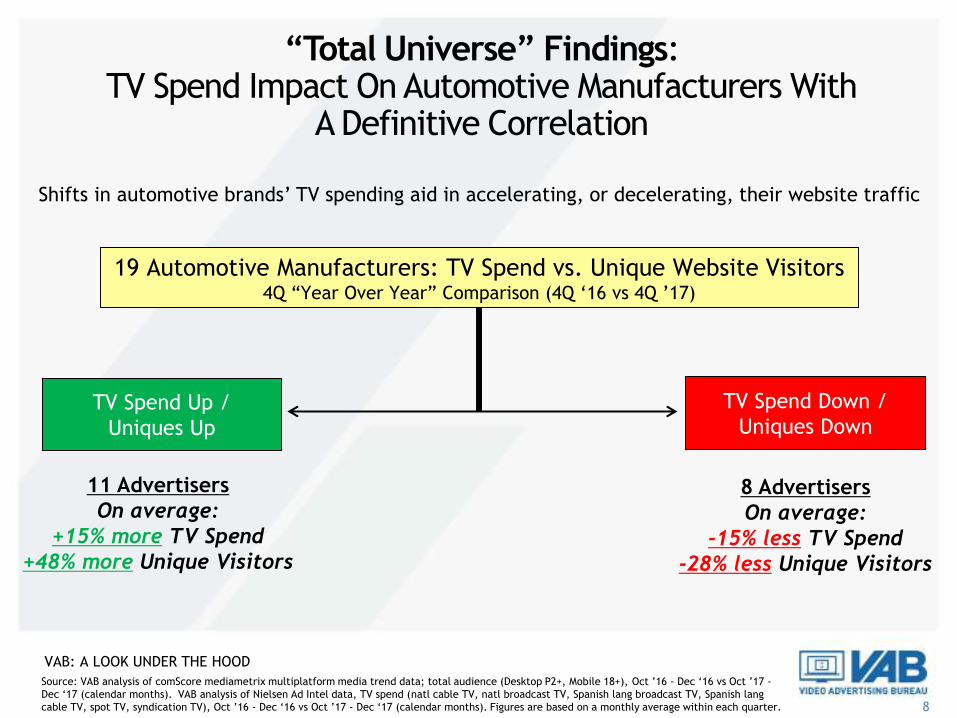
19 Automotive Manufacturers: TV Spend vs. Unique Website Visitors4Q “Year Over Year” Comparison (4Q ‘16 vs 4Q ’17)
TV Spend Up /
Uniques Up
TV Spend Down /
Uniques Down
8 Advertisers
On average:
-15% less TV Spend
-28% less Unique Visitors
11 Advertisers
On average:
+15% more TV Spend
+48% more Unique Visitors
Source: VAB analysis of comScore mediametrix multiplatform media trend data; total audience (Desktop P2+, Mobile 18+), Oct ’16 - Dec ‘16 vs Oct ’17 -
Dec ‘17 (calendar months). VAB analysis of Nielsen Ad Intel data, TV spend (natl cable TV, natl broadcast TV, Spanish lang broadcast TV, Spanish lang
cable TV, spot TV, syndication TV), Oct ’16 - Dec ‘16 vs Oct ’17 - Dec ‘17 (calendar months). Figures are based on a monthly average within each quarter.
Shifts in automotive brands’ TV spending aid in accelerating, or decelerating, their website traffic
“Total Universe” Findings:TV Spend Impact On Automotive Manufacturers With
A Definitive Correlation
VAB: A LOOK UNDER THE HOOD

9
8 of the 10 Domestic Automotive Manufacturers (80%) Analyzed Exhibited a Direct
Correlation Between TV Spend & Website Traffic (4Q’16 vs. 4Q’17)
8 Brands5 Brands Were In Both TV Spend & Monthly Unique Visitors
3 Brands Were In Both TV Spend & Monthly Unique Visitors
2 BrandsLack of correlation between TV Spend &
Monthly Unique Visitors
Domestic Auto Segment:An 80% Correlation Between TV Spend & Website Traffic
VAB: A LOOK UNDER THE HOOD
Source: VAB analysis of comScore mediametrix multiplatform media trend data; total audience (Desktop P2+, Mobile 18+), Oct ’16 - Dec ‘16 vs Oct ’17 -
Dec ‘17 (calendar months). VAB analysis of Nielsen Ad Intel data, TV spend (natl cable TV, natl broadcast TV, Spanish lang broadcast TV, Spanish lang
cable TV, spot TV, syndication TV), Oct ’16 - Dec ‘16 vs Oct ’17 - Dec ‘17 (calendar months). Figures are based on a monthly average within each quarter.
10
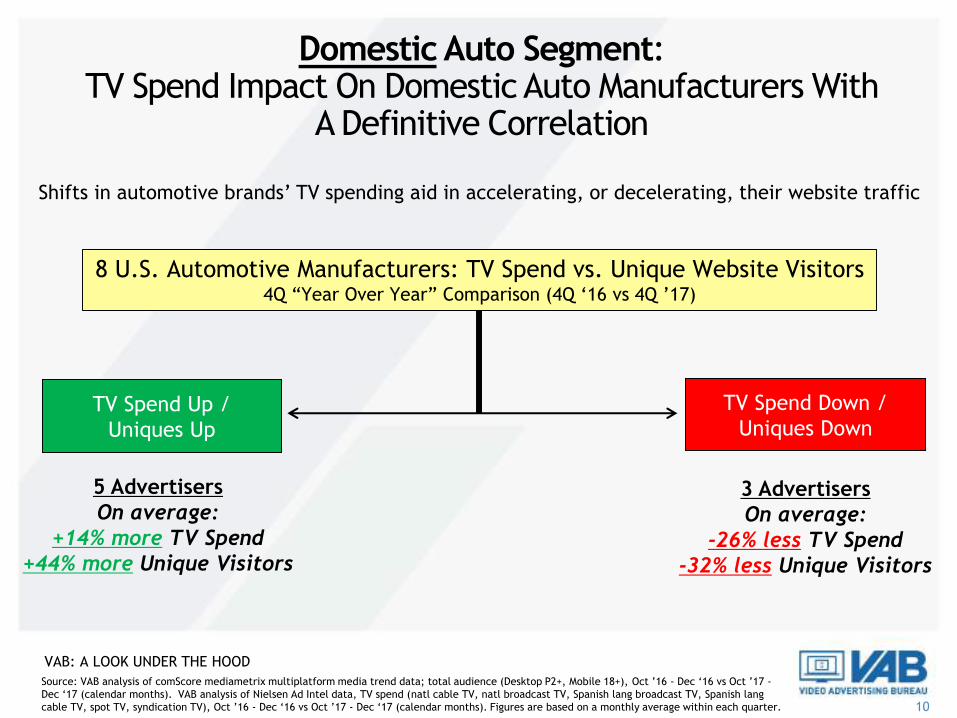
8 U.S. Automotive Manufacturers: TV Spend vs. Unique Website Visitors4Q “Year Over Year” Comparison (4Q ‘16 vs 4Q ’17)
TV Spend Up /
Uniques Up
TV Spend Down /
Uniques Down
3 Advertisers
On average:
-26% less TV Spend
-32% less Unique Visitors
5 Advertisers
On average:
+14% more TV Spend
+44% more Unique Visitors
Shifts in automotive brands’ TV spending aid in accelerating, or decelerating, their website traffic
Domestic Auto Segment:TV Spend Impact On Domestic Auto Manufacturers With
A Definitive Correlation
VAB: A LOOK UNDER THE HOOD
Source: VAB analysis of comScore mediametrix multiplatform media trend data; total audience (Desktop P2+, Mobile 18+), Oct ’16 - Dec ‘16 vs Oct ’17 -
Dec ‘17 (calendar months). VAB analysis of Nielsen Ad Intel data, TV spend (natl cable TV, natl broadcast TV, Spanish lang broadcast TV, Spanish lang
cable TV, spot TV, syndication TV), Oct ’16 - Dec ‘16 vs Oct ’17 - Dec ‘17 (calendar months). Figures are based on a monthly average within each quarter.
11
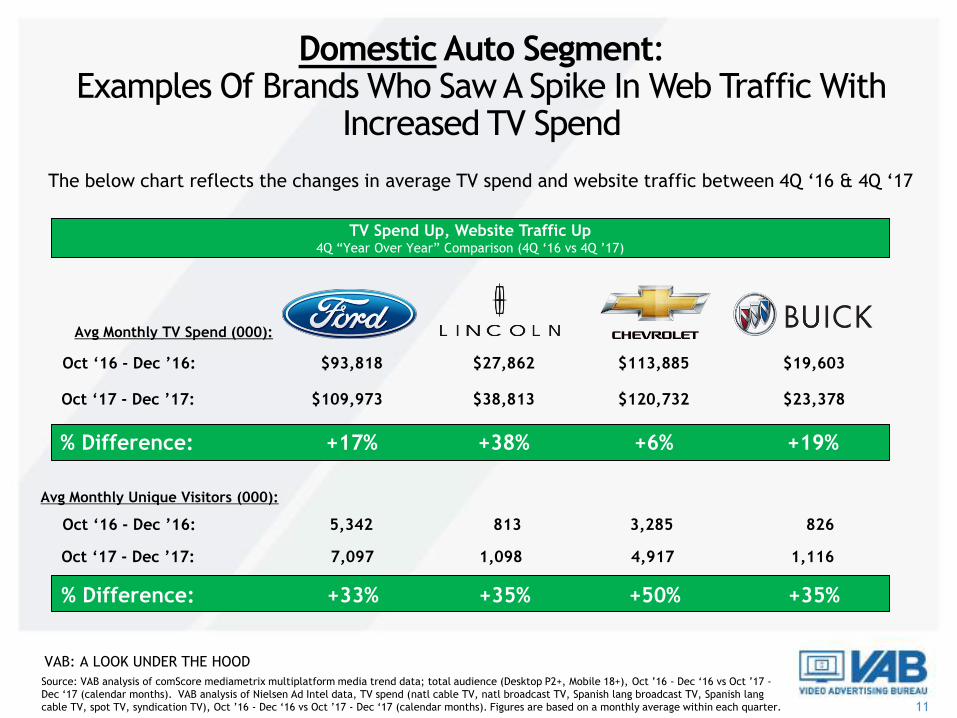
The below chart reflects the changes in average TV spend and website traffic between 4Q ‘16 & 4Q ‘17
Avg Monthly TV Spend (000):
Avg Monthly Unique Visitors (000):
% Difference:
% Difference:
$19,603
$23,378
+19%
826
1,116
+35%
$93,818
$109,973
+17%
5,342
7,097
+33%
Oct ‘16 - Dec ’16:
Oct ‘17 - Dec ’17:
Oct ‘16 - Dec ’16:
Oct ‘17 - Dec ’17:
$113,885
$120,732
+6%
3,285
4,917
+50%
TV Spend Up, Website Traffic Up 4Q “Year Over Year” Comparison (4Q ‘16 vs 4Q ’17)
$27,862
$38,813
+38%
813
1,098
+35%
Domestic Auto Segment:Examples Of Brands Who Saw A Spike In Web Traffic With
Increased TV Spend
VAB: A LOOK UNDER THE HOOD
Source: VAB analysis of comScore mediametrix multiplatform media trend data; total audience (Desktop P2+, Mobile 18+), Oct ’16 - Dec ‘16 vs Oct ’17 -
Dec ‘17 (calendar months). VAB analysis of Nielsen Ad Intel data, TV spend (natl cable TV, natl broadcast TV, Spanish lang broadcast TV, Spanish lang
cable TV, spot TV, syndication TV), Oct ’16 - Dec ‘16 vs Oct ’17 - Dec ‘17 (calendar months). Figures are based on a monthly average within each quarter.
12
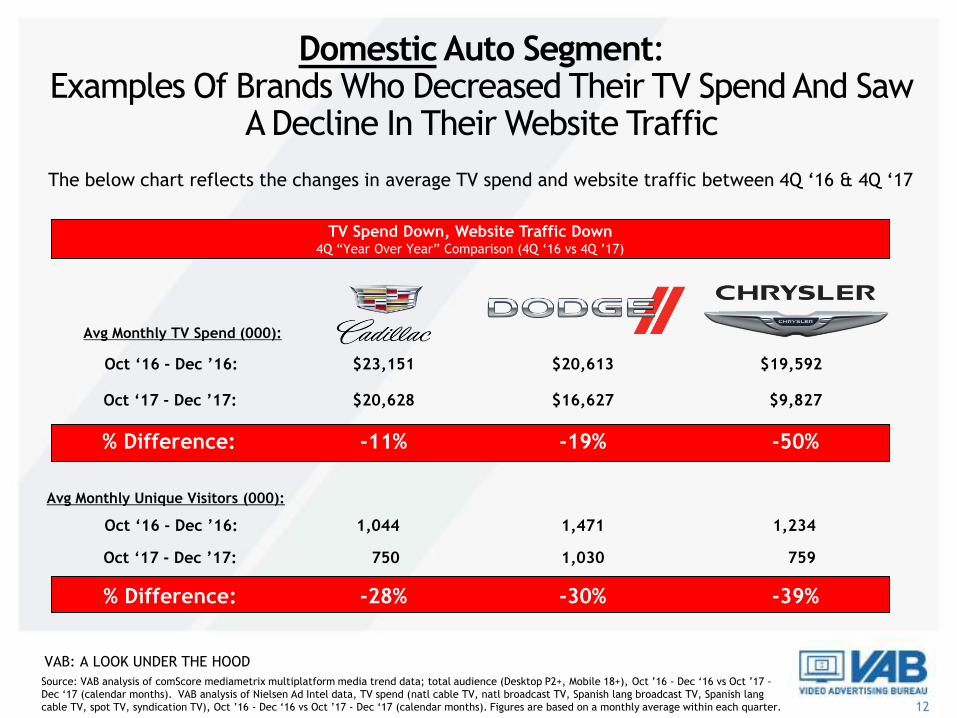
Avg Monthly TV Spend (000):
Avg Monthly Unique Visitors (000):
% Difference:
% Difference:
$19,592
$9,827
-50%
1,234
759
-39%
$23,151
$20,628
-11%
1,044
750
-28%
Oct ‘16 - Dec ’16:
Oct ‘17 - Dec ’17:
Oct ‘16 - Dec ’16:
Oct ‘17 - Dec ’17:
$20,613
$16,627
-19%
1,471
1,030
-30%
TV Spend Down, Website Traffic Down4Q “Year Over Year” Comparison (4Q ‘16 vs 4Q ’17)
Domestic Auto Segment:Examples Of Brands Who Decreased Their TV Spend And Saw
A Decline In Their Website Traffic
The below chart reflects the changes in average TV spend and website traffic between 4Q ‘16 & 4Q ‘17
VAB: A LOOK UNDER THE HOOD
Source: VAB analysis of comScore mediametrix multiplatform media trend data; total audience (Desktop P2+, Mobile 18+), Oct ’16 - Dec ‘16 vs Oct ’17 -
Dec ‘17 (calendar months). VAB analysis of Nielsen Ad Intel data, TV spend (natl cable TV, natl broadcast TV, Spanish lang broadcast TV, Spanish lang
cable TV, spot TV, syndication TV), Oct ’16 - Dec ‘16 vs Oct ’17 - Dec ‘17 (calendar months). Figures are based on a monthly average within each quarter.

13
7 of the 10 Asian Automotive Manufacturers (70%) Analyzed Exhibited a Direct
Correlation Between TV Spend & Website Traffic (4Q’16 vs. 4Q’17)
7 Brands3 Brands Were In Both TV Spend & Monthly Unique Visitors
4 Brands Were In Both TV Spend & Monthly Unique Visitors
3 BrandsLack of correlation between TV Spend &
Monthly Unique Visitors
Asian Auto Segment:An 70% Correlation Between TV Spend & Website Traffic
VAB: A LOOK UNDER THE HOOD
Source: VAB analysis of comScore mediametrix multiplatform media trend data; total audience (Desktop P2+, Mobile 18+), Oct ’16 - Dec ‘16 vs Oct ’17 -
Dec ‘17 (calendar months). VAB analysis of Nielsen Ad Intel data, TV spend (natl cable TV, natl broadcast TV, Spanish lang broadcast TV, Spanish lang
cable TV, spot TV, syndication TV), Oct ’16 - Dec ‘16 vs Oct ’17 - Dec ‘17 (calendar months). Figures are based on a monthly average within each quarter.

14
7 Asian Automotive Manufacturers: TV Spend vs. Unique Website Visitors4Q “Year Over Year” Comparison (4Q ‘16 vs 4Q ’17)
TV Spend Up /
Uniques Up
TV Spend Down /
Uniques Down
4 Advertisers
On average:
-5% less TV Spend
-33% less Unique Visitors
3 Advertisers
On average:
+13% more TV Spend
+59% more Unique Visitors
Shifts in automotive brands’ TV spending aid in accelerating, or decelerating, their website traffic
Asian Auto Segment:TV Spend Impact On Asian Auto Manufacturers With
A Definitive Correlation
VAB: A LOOK UNDER THE HOOD
Source: VAB analysis of comScore mediametrix multiplatform media trend data; total audience (Desktop P2+, Mobile 18+), Oct ’16 - Dec ‘16 vs Oct ’17 -
Dec ‘17 (calendar months). VAB analysis of Nielsen Ad Intel data, TV spend (natl cable TV, natl broadcast TV, Spanish lang broadcast TV, Spanish lang
cable TV, spot TV, syndication TV), Oct ’16 - Dec ‘16 vs Oct ’17 - Dec ‘17 (calendar months). Figures are based on a monthly average within each quarter.
15
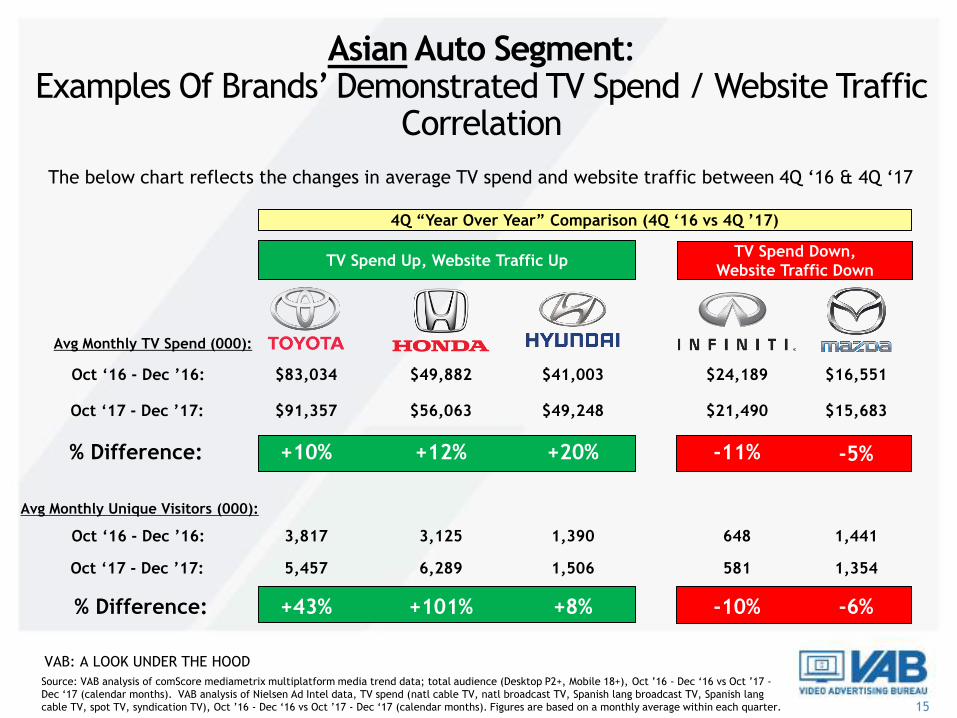
-10% -6%
Avg Monthly TV Spend (000):
Avg Monthly Unique Visitors (000):
% Difference:
% Difference:
$41,003
$49,248
+20%
1,390
1,506
+8%
$83,034
$91,357
+10%
3,817
5,457
+43%
Oct ‘16 - Dec ’16:
Oct ‘17 - Dec ’17:
Oct ‘16 - Dec ’16:
Oct ‘17 - Dec ’17:
$49,882
$56,063
+12%
3,125
6,289
+101%
$24,189
$21,490
-11%
648
581
$16,551
$15,683
-5%
1,441
1,354
TV Spend Down,
Website Traffic Down
4Q “Year Over Year” Comparison (4Q ‘16 vs 4Q ’17)
TV Spend Up, Website Traffic Up
Asian Auto Segment:Examples Of Brands’ Demonstrated TV Spend / Website Traffic
Correlation
The below chart reflects the changes in average TV spend and website traffic between 4Q ‘16 & 4Q ‘17
VAB: A LOOK UNDER THE HOOD
Source: VAB analysis of comScore mediametrix multiplatform media trend data; total audience (Desktop P2+, Mobile 18+), Oct ’16 - Dec ‘16 vs Oct ’17 -
Dec ‘17 (calendar months). VAB analysis of Nielsen Ad Intel data, TV spend (natl cable TV, natl broadcast TV, Spanish lang broadcast TV, Spanish lang
cable TV, spot TV, syndication TV), Oct ’16 - Dec ‘16 vs Oct ’17 - Dec ‘17 (calendar months). Figures are based on a monthly average within each quarter.

16
4 of the 5 European Automotive Manufacturers (80%) Analyzed Exhibited a Direct
Correlation Between TV Spend & Website Traffic (4Q’16 vs. 4Q’17)
4 Brands3 Brands Were In Both TV Spend & Monthly Unique Visitors
1 Brand Was In Both TV Spend & Monthly Unique Visitors
1 BrandLack of correlation between TV Spend &
Monthly Unique Visitors
European Auto Segment:An 80% Correlation Between TV Spend & Website Traffic
VAB: A LOOK UNDER THE HOOD
Source: VAB analysis of comScore mediametrix multiplatform media trend data; total audience (Desktop P2+, Mobile 18+), Oct ’16 - Dec ‘16 vs Oct ’17 -
Dec ‘17 (calendar months). VAB analysis of Nielsen Ad Intel data, TV spend (natl cable TV, natl broadcast TV, Spanish lang broadcast TV, Spanish lang
cable TV, spot TV, syndication TV), Oct ’16 - Dec ‘16 vs Oct ’17 - Dec ‘17 (calendar months). Figures are based on a monthly average within each quarter.

17
4 European Automotive Manufacturers: TV Spend vs. Unique Website Visitors4Q “Year Over Year” Comparison (4Q ‘16 vs 4Q ’17)
TV Spend Up /
Uniques Up
TV Spend Down /
Uniques Down
1 Advertiser
On average:
-22% less TV Spend
-2% less Unique Visitors
3 Advertisers
On average:
+27% more TV Spend
+36% more Unique Visitors
Shifts in automotive brands’ TV spending aid in accelerating, or decelerating, their website traffic
European Auto Segment:TV Spend Impact On European Auto Manufacturers With
A Definitive Correlation
VAB: A LOOK UNDER THE HOOD
Source: VAB analysis of comScore mediametrix multiplatform media trend data; total audience (Desktop P2+, Mobile 18+), Oct ’16 - Dec ‘16 vs Oct ’17 -
Dec ‘17 (calendar months). VAB analysis of Nielsen Ad Intel data, TV spend (natl cable TV, natl broadcast TV, Spanish lang broadcast TV, Spanish lang
cable TV, spot TV, syndication TV), Oct ’16 - Dec ‘16 vs Oct ’17 - Dec ‘17 (calendar months). Figures are based on a monthly average within each quarter.
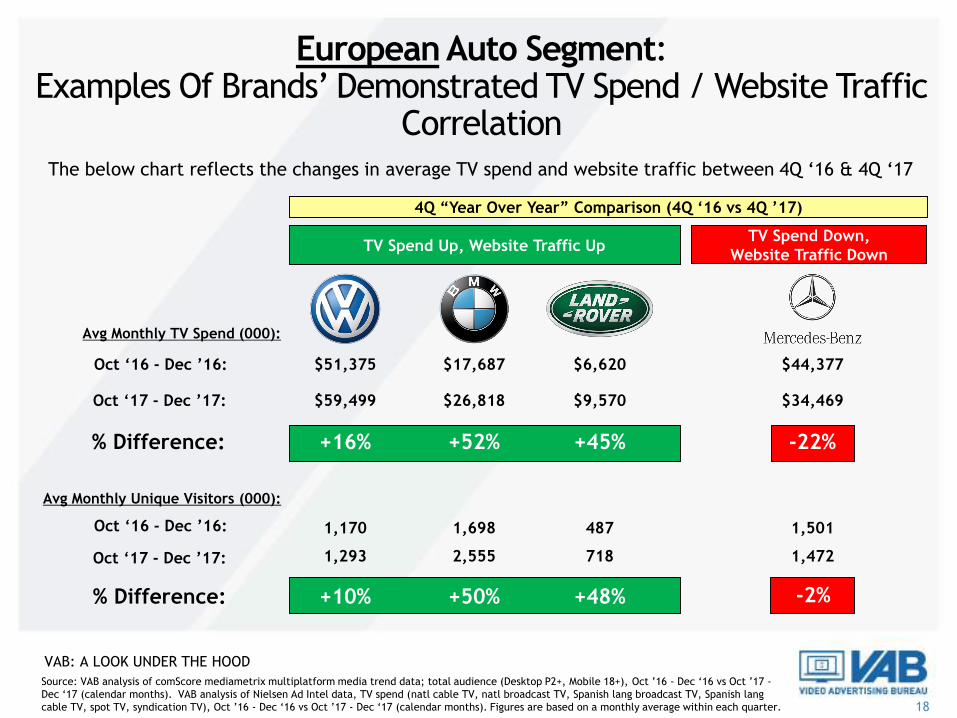
18
Avg Monthly TV Spend (000):
Avg Monthly Unique Visitors (000):
% Difference:
% Difference:
$6,620
$9,570
+45%
487
718
+48%
$51,375
$59,499
+16%
1,170
1,293
+10%
Oct ‘16 - Dec ’16:
Oct ‘17 - Dec ’17:
Oct ‘16 - Dec ’16:
Oct ‘17 - Dec ’17:
$17,687
$26,818
+52%
1,698
2,555
+50%
$44,377
$34,469
-22%
1,501
1,472
-2%
TV Spend Down,
Website Traffic Down
4Q “Year Over Year” Comparison (4Q ‘16 vs 4Q ’17)
TV Spend Up, Website Traffic Up
European Auto Segment:Examples Of Brands’ Demonstrated TV Spend / Website Traffic
CorrelationThe below chart reflects the changes in average TV spend and website traffic between 4Q ‘16 & 4Q ‘17
VAB: A LOOK UNDER THE HOOD
Source: VAB analysis of comScore mediametrix multiplatform media trend data; total audience (Desktop P2+, Mobile 18+), Oct ’16 - Dec ‘16 vs Oct ’17 -
Dec ‘17 (calendar months). VAB analysis of Nielsen Ad Intel data, TV spend (natl cable TV, natl broadcast TV, Spanish lang broadcast TV, Spanish lang
cable TV, spot TV, syndication TV), Oct ’16 - Dec ‘16 vs Oct ’17 - Dec ‘17 (calendar months). Figures are based on a monthly average within each quarter.

19
TV Spend vs. Other Digital Interactions
20
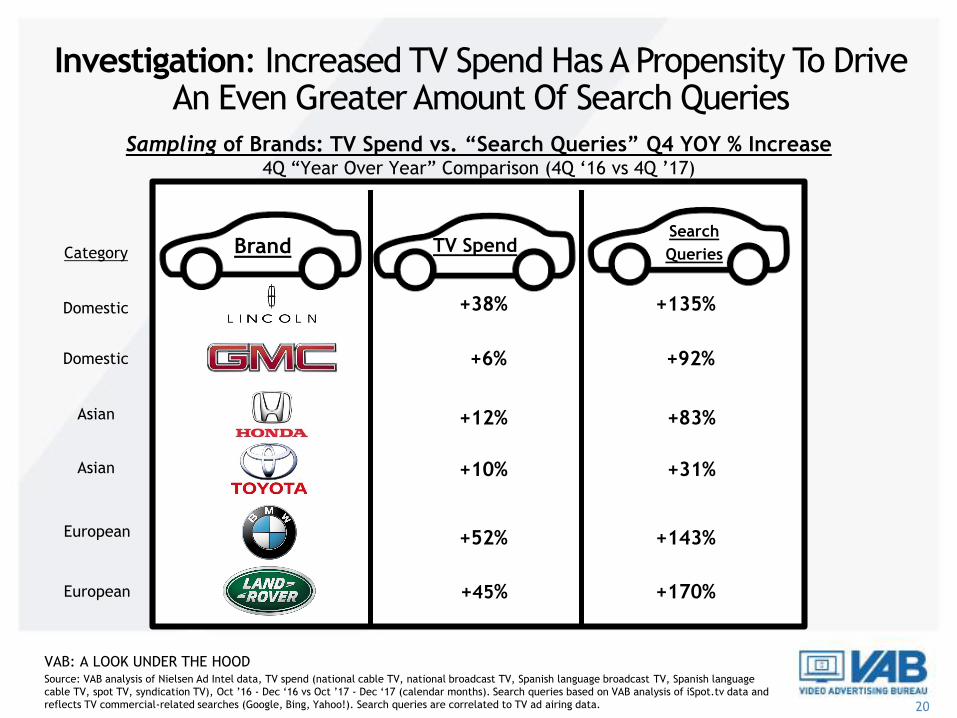
Sampling of Brands: TV Spend vs. “Search Queries” Q4 YOY % Increase4Q “Year Over Year” Comparison (4Q ‘16 vs 4Q ’17)
Source: VAB analysis of Nielsen Ad Intel data, TV spend (national cable TV, national broadcast TV, Spanish language broadcast TV, Spanish language
cable TV, spot TV, syndication TV), Oct ’16 - Dec ‘16 vs Oct ’17 - Dec ‘17 (calendar months). Search queries based on VAB analysis of iSpot.tv data and
reflects TV commercial-related searches (Google, Bing, Yahoo!). Search queries are correlated to TV ad airing data.
+12% +83%
+38% +135%
+52% +143%
+10% +31%
Investigation: Increased TV Spend Has A Propensity To Drive An Even Greater Amount Of Search Queries
Brand TV SpendSearch
Queries
+45% +170%
+6% +92%
Domestic
Domestic
Asian
Asian
European
European
Category
VAB: A LOOK UNDER THE HOOD

21
Sampling of Brands: TV Spend vs. “Search Queries” Q4 YOY % Increase4Q “Year Over Year” Comparison (4Q ‘16 vs 4Q ’17)
Source: VAB analysis of Nielsen Ad Intel data, TV spend (national cable TV, national broadcast TV, Spanish language broadcast TV, Spanish language
cable TV, spot TV, syndication TV), Oct ’16 - Dec ‘16 vs Oct ’17 - Dec ‘17 (calendar months). Search queries based on VAB analysis of iSpot.tv data and
reflects TV commercial-related searches (Google, Bing, Yahoo!). Search queries are correlated to TV ad airing data.
-50% -51%
Investigation: Conversely, Search Queries Declined Proportionally With Decreases In TV Spend
Brand TV SpendSearch
Queries
Domestic
Category
Domestic -19% -27%
Asian -5% -15%
European-22% -24%
VAB: A LOOK UNDER THE HOOD
22
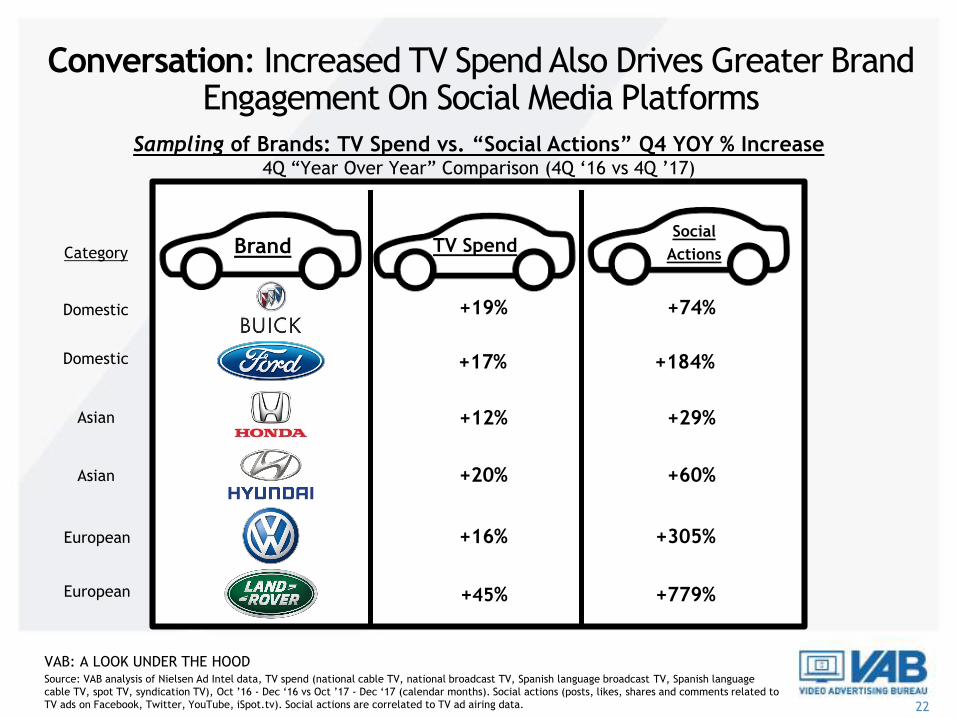
Sampling of Brands: TV Spend vs. “Social Actions” Q4 YOY % Increase4Q “Year Over Year” Comparison (4Q ‘16 vs 4Q ’17)
Source: VAB analysis of Nielsen Ad Intel data, TV spend (national cable TV, national broadcast TV, Spanish language broadcast TV, Spanish language
cable TV, spot TV, syndication TV), Oct ’16 - Dec ‘16 vs Oct ’17 - Dec ‘17 (calendar months). Social actions (posts, likes, shares and comments related to
TV ads on Facebook, Twitter, YouTube, iSpot.tv). Social actions are correlated to TV ad airing data.
+12% +29%
+19% +74%
+16% +305%
+20% +60%
TV SpendSocial
Actions
+45% +779%
+17% +184%
Domestic
Domestic
Asian
Asian
European
European
BrandCategory
Conversation: Increased TV Spend Also Drives Greater Brand Engagement On Social Media Platforms
VAB: A LOOK UNDER THE HOOD

23
Sampling of Brands: TV Spend vs. “Social Actions” Q4 YOY % Increase4Q “Year Over Year” Comparison (4Q ‘16 vs 4Q ’17)
Source: VAB analysis of Nielsen Ad Intel data, TV spend (national cable TV, national broadcast TV, Spanish language broadcast TV, Spanish language
cable TV, spot TV, syndication TV), Oct ’16 - Dec ‘16 vs Oct ’17 - Dec ‘17 (calendar months). Social actions (posts, likes, shares and comments related to
TV ads on Facebook, Twitter, YouTube, iSpot.tv). Social actions are correlated to TV ad airing data.
-50% -25%
TV SpendSocial
Actions
Domestic
BrandCategory
Conversation: However, Social Chatter Decreased For Brands Who Spent Less On TV
Asian -11% -64%
Asian -2% -4%
European -9% -95%
VAB: A LOOK UNDER THE HOOD
24
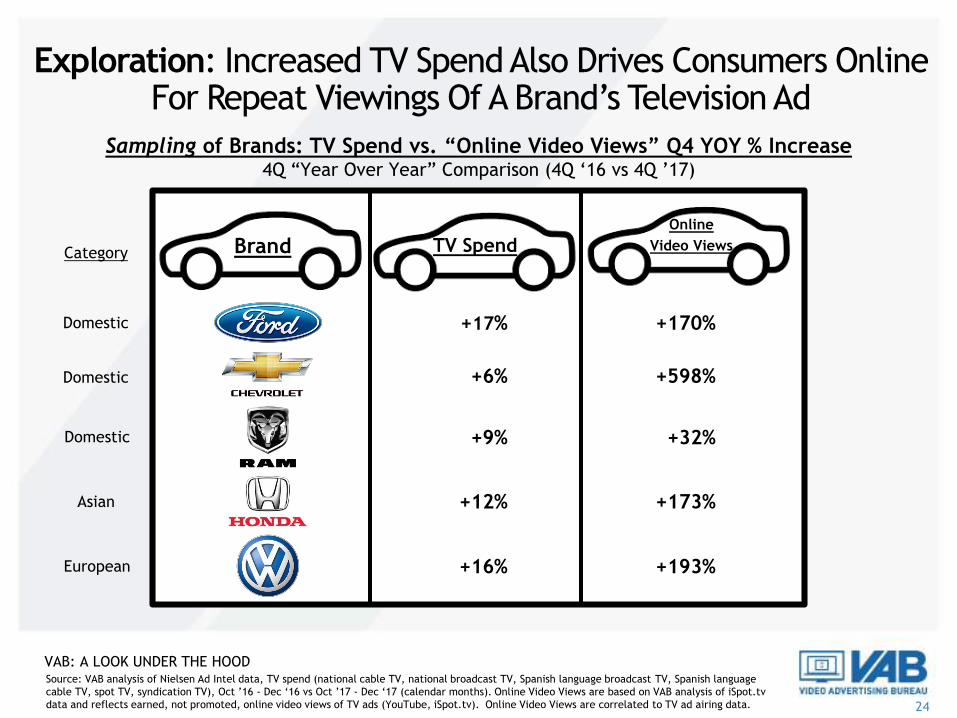
Sampling of Brands: TV Spend vs. “Online Video Views” Q4 YOY % Increase4Q “Year Over Year” Comparison (4Q ‘16 vs 4Q ’17)
Source: VAB analysis of Nielsen Ad Intel data, TV spend (national cable TV, national broadcast TV, Spanish language broadcast TV, Spanish language
cable TV, spot TV, syndication TV), Oct ’16 - Dec ‘16 vs Oct ’17 - Dec ‘17 (calendar months). Online Video Views are based on VAB analysis of iSpot.tv
data and reflects earned, not promoted, online video views of TV ads (YouTube, iSpot.tv). Online Video Views are correlated to TV ad airing data.
+17% +170%
+6% +598%
+12% +173%
+16% +193%
Brand TV SpendOnline
Video Views
Domestic
Domestic
Asian
European
Domestic +9% +32%
Category
Exploration: Increased TV Spend Also Drives Consumers Online For Repeat Viewings Of A Brand’s Television Ad
VAB: A LOOK UNDER THE HOOD

25
Sampling of Brands: TV Spend vs. “Online Video Views” Q4 YOY % Increase4Q “Year Over Year” Comparison (4Q ‘16 vs 4Q ’17)
Source: VAB analysis of Nielsen Ad Intel data, TV spend (national cable TV, national broadcast TV, Spanish language broadcast TV, Spanish language
cable TV, spot TV, syndication TV), Oct ’16 - Dec ‘16 vs Oct ’17 - Dec ‘17 (calendar months). Online Video Views are based on VAB analysis of iSpot.tv
data and reflects earned, not promoted, online video views of TV ads (YouTube, iSpot.tv). Online Video Views are correlated to TV ad airing data.
-11% -44%
Brand TV SpendOnline
Video Views
Domestic
Category
Exploration: But Online Viewing Of A Brand’s TV Ads Declines As Their Television Spend Decreases
Asian -6% -38%
Asian -11% -87%
European -9% -99%
VAB: A LOOK UNDER THE HOOD
26
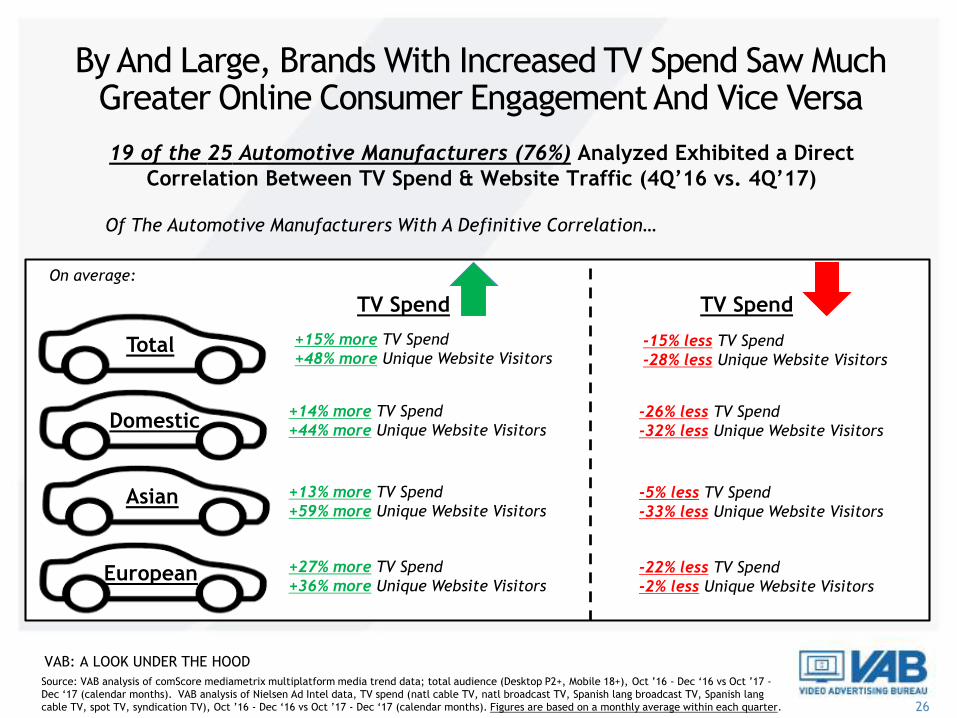
By And Large, Brands With Increased TV Spend Saw Much Greater Online Consumer Engagement And Vice Versa
TV Spend
19 of the 25 Automotive Manufacturers (76%) Analyzed Exhibited a Direct
Correlation Between TV Spend & Website Traffic (4Q’16 vs. 4Q’17)
Of The Automotive Manufacturers With A Definitive Correlation…
TV Spend
-15% less TV Spend
-28% less Unique Website Visitors
+15% more TV Spend
+48% more Unique Website Visitors Total
Domestic
Asian
European
-26% less TV Spend
-32% less Unique Website Visitors
+14% more TV Spend
+44% more Unique Website Visitors
On average:
-5% less TV Spend
-33% less Unique Website Visitors
+13% more TV Spend
+59% more Unique Website Visitors
-22% less TV Spend
-2% less Unique Website Visitors
+27% more TV Spend
+36% more Unique Website Visitors
Source: VAB analysis of comScore mediametrix multiplatform media trend data; total audience (Desktop P2+, Mobile 18+), Oct ’16 - Dec ‘16 vs Oct ’17 -
Dec ‘17 (calendar months). VAB analysis of Nielsen Ad Intel data, TV spend (natl cable TV, natl broadcast TV, Spanish lang broadcast TV, Spanish lang
cable TV, spot TV, syndication TV), Oct ’16 - Dec ‘16 vs Oct ’17 - Dec ‘17 (calendar months). Figures are based on a monthly average within each quarter.
VAB: A LOOK UNDER THE HOOD

For More Information Visit Us Online
TheVAB.com
Follow us:
@VideoAdBureau
Like us:
facebook.com/VideoAdvertisingBureau


