CELLULOSE CHEMISTRY AND TECHNOLOGY Cellulose Chem. Technol., 48 (1-2), 61-68 (2014) HPLC METHOD FOR THE EVALUATION OF CHROMATOGRAPHIC CONDITIONS FOR SEPARATION OF NEW XANTHINE DERIVATIVES ADRIANA TAMBA, BOGDAN CIOROIU, LENUTA PROFIRE and MIHAI IOAN LAZAR “Grigore T. Popa” University of Medicine and Pharmacy, Faculty of Pharmacy, Department of Analytical Drugs, 16, University Str., 700115, Iasi, Romania Received November 4, 2012 The aim of this study is to develop a suitable HPLC method to determine with efficiency and selectivity the individual components of a series of 8 xanthine derivative compounds. HPLC analysis was performed using a high performance liquid chromatography system and a Phenomenex C18 column (octadecylsilyl) with 250 mm length, 4.6 mm internal diameter, 5 μm particle size and high pH stability. The UV spectra for the eight new xanthine derivatives were drawn. The retention times, number of theoretical plates and purity factor in different solvents were also established by using the HPLC method. The method is suitable for determining the xanthine derivatives from different pharmaceutical coated matrices, based on their physicochemical properties, such as the affinity to polar compounds or vegetable proteins. Keywords: HPLC, methylxanthines INTRODUCTION Theophylline, also known as 1,3- dimethylxanthine, is a proven bronchodilator drug used in the therapy of respiratory diseases, such as asthma or chronic obstructive pulmonary disease (COPD). 1 One of the action mechanisms of theophylline is that of adenosine receptor antagonism. Theophylline is a non-specific adenosine antagonist, antagonizing A1, A2, and A3 receptors almost equally. 1 It is unclear if this mechanism is significant, because enprofylline, another methylxanthine drug, which does not antagonize the adenosine receptors, is a more potent bronchodilator than theophylline. 2 Another proposed mechanism of action includes a non- specific inhibition of phosphodiesterase enzymes, producing an increase in intracellular cyclic AMP (3'-5'-cyclic adenosine monophosphate). 2 The pharmacological profile of theophylline also includes anti-inflammatory and immunomo- dulatory effects. 3 In order to improve the pharmacological properties of theophylline, new xanthine (1-8) derivatives have been synthesized and biologically characterized. 4 Studies on the kinetic diffusion exponent for theophylline and xanthine derivatives D1 and D2 have been developed and it was considered that on the inclusion of substances in chitosan- montmorillonite composite hydrogels, a certain value of releasing degree is established. Regarding the theophylline and the other xanthinic compounds, the highest rate of release was established for the derivative D2 on the chitosan hydrogel formed by certain crosslinking with glutaraldehyde. Anyway, based on theoretical calculations and correlated with the previously mentioned results, a certain affinity to polar compounds has been determined taking in consideration the structure and affinity of the xanthine derivatives. For drug release rate determinations, spectrophotometric methods with specific absorption wavelengths are usually used. Experimental designs are usually included for various biosynthesis optimization 6 or extraction methodologies, 7 but may be included in the development of the working conditions for various analytical methods, especially for selectivity and specificity optimization. 8,9 This study was performed in order to establish the preliminary chromatographic conditions for a suitable HPLC method with high throughput for the determination of the xanthinic derivatives. An experimental design was applied in order to verify the predictability model used in the development of the chromatographic method. The method was
Transcript
CELLULOSE CHEMISTRY AND TECHNOLOGY
Cellulose Chem. Technol., 48 (1-2), 61-68 (2014)
HPLC METHOD FOR THE EVALUATION OF CHROMATOGRAPHIC
CONDITIONS FOR SEPARATION OF NEW XANTHINE DERIVATIVES
ADRIANA TAMBA, BOGDAN CIOROIU, LENUTA PROFIRE and MIHAI IOAN LAZAR
“Grigore T. Popa” University of Medicine and Pharmacy, Faculty of Pharmacy, Department of Analytical
Drugs, 16, University Str., 700115, Iasi, Romania
Received November 4, 2012
The aim of this study is to develop a suitable HPLC method to determine with efficiency and selectivity the individual components of a series of 8 xanthine derivative compounds. HPLC analysis was performed using a high performance liquid chromatography system and a Phenomenex C18 column (octadecylsilyl) with 250 mm length, 4.6 mm internal diameter, 5 µm particle size and high pH stability. The UV spectra for the eight new xanthine derivatives were drawn. The retention times, number of theoretical plates and purity factor in different solvents were also established by using the HPLC method. The method is suitable for determining the xanthine derivatives from different pharmaceutical coated matrices, based on their physicochemical properties, such as the affinity to polar compounds or vegetable proteins. Keywords: HPLC, methylxanthines
INTRODUCTION Theophylline, also known as 1,3-
dimethylxanthine, is a proven bronchodilator drug used in the therapy of respiratory diseases, such as asthma or chronic obstructive pulmonary disease (COPD).1 One of the action mechanisms of theophylline is that of adenosine receptor antagonism. Theophylline is a non-specific adenosine antagonist, antagonizing A1, A2, and A3 receptors almost equally.1 It is unclear if this mechanism is significant, because enprofylline, another methylxanthine drug, which does not antagonize the adenosine receptors, is a more potent bronchodilator than theophylline.2 Another proposed mechanism of action includes a non-specific inhibition of phosphodiesterase enzymes, producing an increase in intracellular cyclic AMP (3'-5'-cyclic adenosine monophosphate).2 The pharmacological profile of theophylline also includes anti-inflammatory and immunomo-dulatory effects.3 In order to improve the pharmacological properties of theophylline, new xanthine (1-8) derivatives have been synthesized and biologically characterized.4
Studies on the kinetic diffusion exponent for theophylline and xanthine derivatives D1 and D2 have been developed and it was considered that on the inclusion of substances in chitosan-
montmorillonite composite hydrogels, a certain value of releasing degree is established. Regarding the theophylline and the other xanthinic compounds, the highest rate of release was established for the derivative D2 on the chitosan hydrogel formed by certain crosslinking with glutaraldehyde. Anyway, based on theoretical calculations and correlated with the previously mentioned results, a certain affinity to polar compounds has been determined taking in consideration the structure and affinity of the xanthine derivatives. For drug release rate determinations, spectrophotometric methods with specific absorption wavelengths are usually used. Experimental designs are usually included for various biosynthesis optimization6 or extraction methodologies,7 but may be included in the development of the working conditions for various analytical methods, especially for selectivity and specificity optimization.8,9
This study was performed in order to establish the preliminary chromatographic conditions for a suitable HPLC method with high throughput for the determination of the xanthinic derivatives. An experimental design was applied in order to verify the predictability model used in the development of the chromatographic method. The method was
ADRIANA TAMBA et al.
62
necessary due to the possibility of existing by-products of the newly synthetized products.
EXPERIMENTAL Reagents
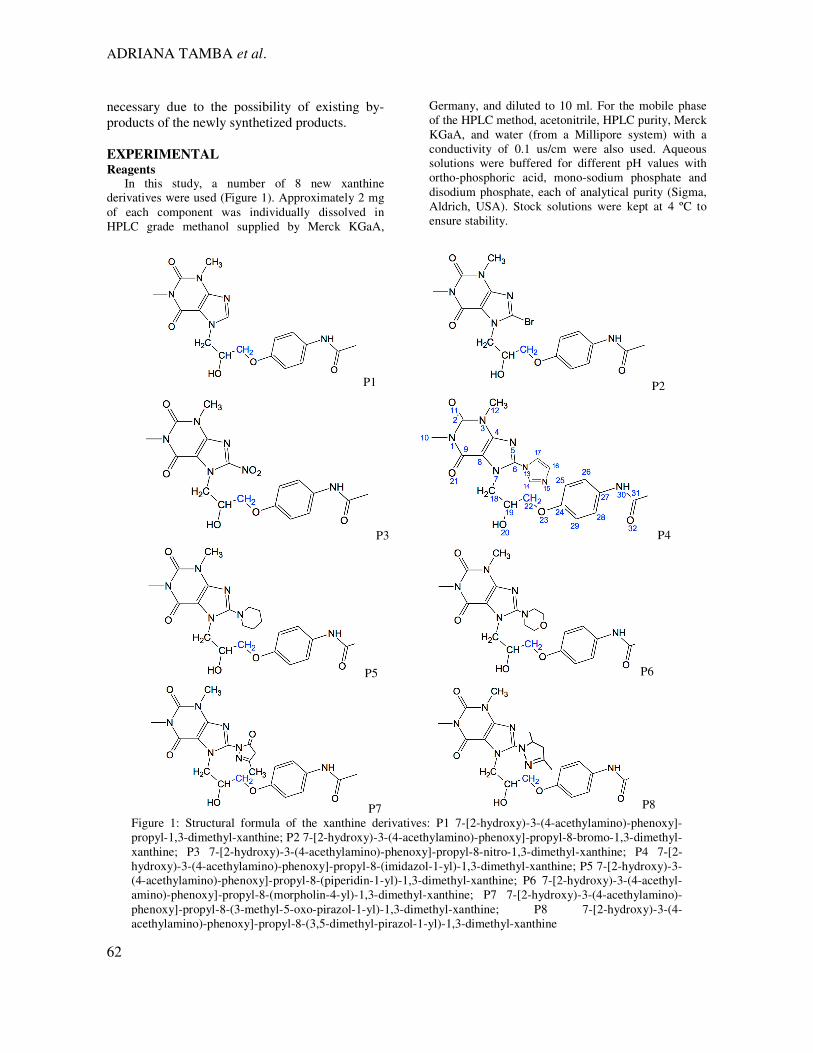
In this study, a number of 8 new xanthine derivatives were used (Figure 1). Approximately 2 mg of each component was individually dissolved in HPLC grade methanol supplied by Merck KGaA,
Germany, and diluted to 10 ml. For the mobile phase of the HPLC method, acetonitrile, HPLC purity, Merck KGaA, and water (from a Millipore system) with a conductivity of 0.1 us/cm were also used. Aqueous solutions were buffered for different pH values with ortho-phosphoric acid, mono-sodium phosphate and disodium phosphate, each of analytical purity (Sigma, Aldrich, USA). Stock solutions were kept at 4 ºC to ensure stability.
P1 P2
P3 P4
P5 P6
P7 P8
Figure 1: Structural formula of the xanthine derivatives: P1 7-[2-hydroxy)-3-(4-acethylamino)-phenoxy]-propyl-1,3-dimethyl-xanthine; P2 7-[2-hydroxy)-3-(4-acethylamino)-phenoxy]-propyl-8-bromo-1,3-dimethyl-xanthine; P3 7-[2-hydroxy)-3-(4-acethylamino)-phenoxy]-propyl-8-nitro-1,3-dimethyl-xanthine; P4 7-[2-hydroxy)-3-(4-acethylamino)-phenoxy]-propyl-8-(imidazol-1-yl)-1,3-dimethyl-xanthine; P5 7-[2-hydroxy)-3-(4-acethylamino)-phenoxy]-propyl-8-(piperidin-1-yl)-1,3-dimethyl-xanthine; P6 7-[2-hydroxy)-3-(4-acethyl-amino)-phenoxy]-propyl-8-(morpholin-4-yl)-1,3-dimethyl-xanthine; P7 7-[2-hydroxy)-3-(4-acethylamino)-phenoxy]-propyl-8-(3-methyl-5-oxo-pirazol-1-yl)-1,3-dimethyl-xanthine; P8 7-[2-hydroxy)-3-(4-acethylamino)-phenoxy]-propyl-8-(3,5-dimethyl-pirazol-1-yl)-1,3-dimethyl-xanthine
Xanthine
63
Instrumentation Chromatography determinations were performed
on a high performance liquid chromatography system Surveyor Plus, provided by Thermo-Fisher Scientific USA, equipped with a Surveyor LC-Pump, 400 bar maximum pressure, a Surveyor autosampler with sample tray and column thermostated compartments, and a photo diode array detector PDA with 650 photo-sensible diodes capable of recording molecular UV-VIS spectra of the analyzed samples. ChromQuest software permitted to record each chromatographic test, improving the sensitivity of the method and on-line screening of each absorption maximum of the analyzed component.
The HPLC method development was performed on a stationary phase, provided by Phenomenex Inc. USA. Octadecylsilyl C18 columns with 250 mm length and 4.6 mm internal diameter were used. Differences consisted in particle size and stationary phase properties. A Gemini NX column with 5 µm particle size was optimal and the chromatographic separations were confirmed on a Luna C18 (2) with 10 µm particle size.
Chromatographic conditions Final chromatographic conditions for the analysis
of the 8 new xanthine derivatives were applied using a mobile phase, consisting in a mixture of 0.025 M disodium phosphate solution (pH = 7.2): acetonitrile: methanol (65:15:20 v/v). The analysis temperature was
37 ºC and the detection was performed using a fully UV-VIS spectrum range on 190-360 nm at a frequency of 10 Hz.
Total flow was maintained at 1.0 ml/min and the chromatographic time was of 20 minutes. Injection volume was 5 µl, enough to ensure detection and avoid column overload and cross contamination by carryover.
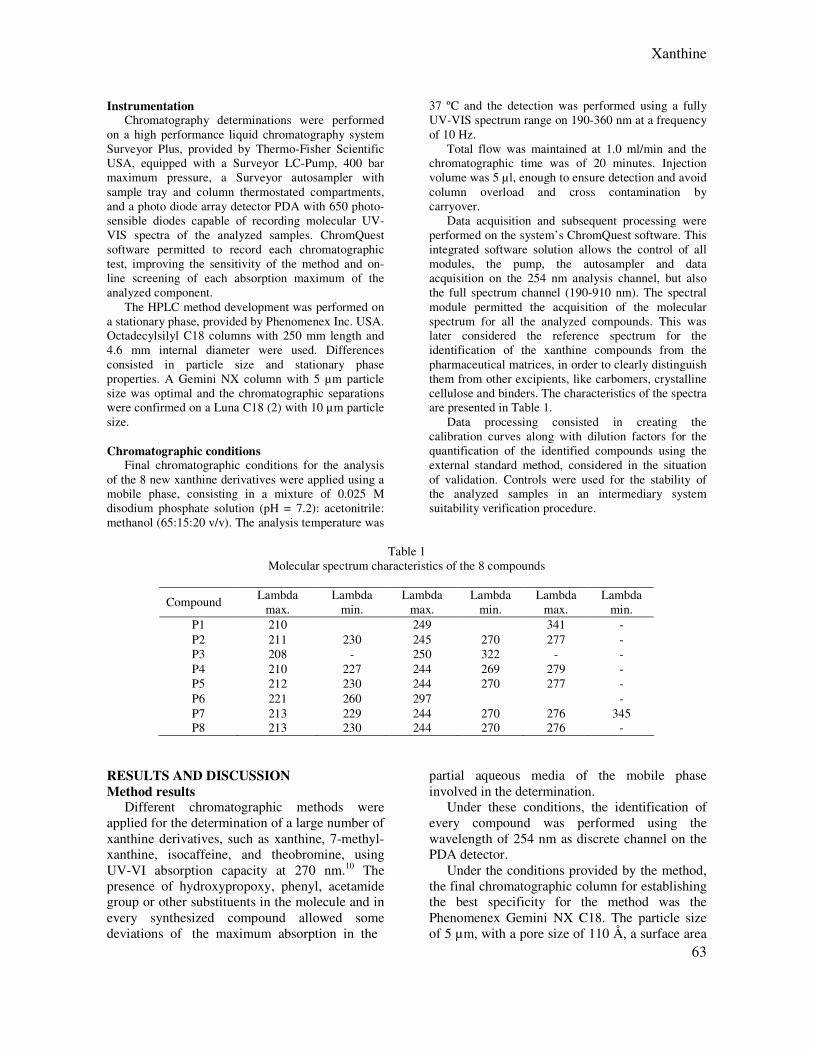
Data acquisition and subsequent processing were performed on the system’s ChromQuest software. This integrated software solution allows the control of all modules, the pump, the autosampler and data acquisition on the 254 nm analysis channel, but also the full spectrum channel (190-910 nm). The spectral module permitted the acquisition of the molecular spectrum for all the analyzed compounds. This was later considered the reference spectrum for the identification of the xanthine compounds from the pharmaceutical matrices, in order to clearly distinguish them from other excipients, like carbomers, crystalline cellulose and binders. The characteristics of the spectra are presented in Table 1.
Data processing consisted in creating the calibration curves along with dilution factors for the quantification of the identified compounds using the external standard method, considered in the situation of validation. Controls were used for the stability of the analyzed samples in an intermediary system suitability verification procedure.
Table 1
Molecular spectrum characteristics of the 8 compounds
Method results Different chromatographic methods were
applied for the determination of a large number of xanthine derivatives, such as xanthine, 7-methyl-xanthine, isocaffeine, and theobromine, using UV-VI absorption capacity at 270 nm.10 The presence of hydroxypropoxy, phenyl, acetamide group or other substituents in the molecule and in every synthesized compound allowed some deviations of the maximum absorption in the
partial aqueous media of the mobile phase involved in the determination.
Under these conditions, the identification of every compound was performed using the wavelength of 254 nm as discrete channel on the PDA detector.
Under the conditions provided by the method, the final chromatographic column for establishing the best specificity for the method was the Phenomenex Gemini NX C18. The particle size of 5 µm, with a pore size of 110 Å, a surface area
ADRIANA TAMBA et al.
64
of 375 m2/g and a Carbon load of 13.5% assured the best separation of every individual compound.11-13
A typical chromatogram for the association of each compound, determined at the same time, is
presented in Figure 2. The parameters for the qualitative characterization of the separation process (retention time, separation efficiency, height, asymmetry, peak capacity and purity factor) are presented in Table 2.
Table 2
Retention time, asymmetry, theoretical plates, height, peak capacity and purity factor of the method
Figure 2: Association of every xanthinic compound determined using the chromatographic method
Discussion The resolution factors for a mixture of the 8
compounds had the minimum value of 1.5, based on the relative retention parameter determined by the values of retention time obtained for every compound. Asymmetry, calculated at the inflexion points of every peak, for every analyzed
compound, had the maximum value of 1.15, which was in the limits of the allowed interval of 0.8-1.2.
Purity factor was calculated using the method of the least squares point-to-point comparison of the two spectra in digital format, in order to establish the presence or absence of significant
Xanthine
65
differences.14 For a minimum condition in spectral identification, the value of 0.6 was considered, the maximum being 1.00. For every compound, the purity factor was minimum 0.951, which indicated the absence of co-eluting impurities.
The peak capacity, using the method’s chromatographic conditions, was minimum 19.32 for the P1 sample, which indicated that the method was optimal with respect to an un-retained compound, which had a retention time of 0.5 minutes.
The analysis of the derivatives of xanthinic acid, substituted in position 2 relative to purine core with hydroxypropoxy, phenyl, acetamide group, and different substituents in position 8, involved the consideration of physicochemical parameters like water-octanol partition coefficient (Poct) and acid-basic dissociation constant (pKa).
Based on the PKa value of 7.715 for xanthine and an octanol/water partition coefficient Poct of -0.69 at pH 7.4,16 the partition coefficients (Poct) for every derivative were calculated using an ACD/Lab PubChem, LogP calculator in order to establish differences in the physicochemical structure parameters. Considering the uncertainty of the calculation, it was established that every compound showed a different Poct value, against the molecular mass. These results create the possibility of separation using ion suppression reversed phase chromatography. The predicted Poct values for every compound are presented in Table 3.
These values show some minor differences for the polarity of these compounds, relative to xanthine, which had a value of -0.69. The presence of hydroxypropoxy, phenyl, and acetamide increased the acidity of the
compounds, so in partial aqueous media they showed an ionization capacity.
Considering these physicochemical properties, a medium with pH 3 was considered in the method development. The Gemini NX column shows stability between pH 1 and 12,12 and the same elution conditions of the mobile phase with pH 2.2, 7.2 and 10 for the buffer solution were tested. Also, for the gradient method, a binary mobile phase was used, consisting in a mixture of buffer solution with pH 7.2 and methanol and three alternatives regarding the elution program. The linear variation of the mobile phase components was from 100% mobile phase A to 65% mobile phase B in 15 minutes and also from 100% mobile phase B to 35% mobile phase A in same time interval. The 3rd choice considered the mobile phase under isocratic conditions, when mobile phase A was established at 65% and mobile phase B at 35%. For the gradient elution method, the factor considered was the slope of the linear variation of the methanol concentration as a function of elution time. Considering the chromatographic conditions, when the percentage of methanol increased, the value of the slope was positive (+4) and when the methanol content decreased under the same conditions, the value of the slope was negative (-4); otherwise in the isocratic elution, the slope had a value of 0. Based on the consideration of the previously mentioned parameters, a central composite experimental design was used to investigate the effects of pH on an isocratic method (X1) and a gradient elution method with linear composition variation of the methanol (X2) for the responses considered in the separation process (Table 4).
Table 3
Predicted Poct values using ACD/Lab PubChem, LogP calculator software
consideration of two factors (xi), at 3 levels each. In this distribution, 3 blocks were created by the association of the mentioned factors, and 9 unique determinations were performed for the mathematical model estimation.
By applying a multiple regression analysis on the data set (median values for the resolution factors, theoretical plates and asymmetry, n=9), it was possible to obtain a mathematical model that would take into account linear, quadratic and cross product terms.17
The regression model was considered as follows: Y = b0 + b1X1 + b2X2 + b11X1
2 + b22X22 + b12X1X2
In the equation above, b values are the
estimates of the polynomial coefficients and Xi are the coded values of the factors (pH and the gradient method). The linear terms biXi are responsible for the main effects; in these situations the quadratic terms bijXi
2 influence the curvature effects and the bifactorial terms bijXij correspond to the effects produced by the interaction between factors.
The mathematical model was applied in order to estimate the Y responses, which are the result of the three parameters’ interaction included in the monitoring of the chromatography evaluation (resolution factor YRs, theoretical plates YTp and the asymmetry YT). The determined values were calculated as a median value obtained for every xanthine compound that was monitored during each of the 9 determinations included in the study. The resulting mathematical model obtained by applying Equation 1 was determined. In the variable selection, the significant parameters were considered (p<0.1). The values are presented in Table 5.
In order to assess the predictability of the model, the analysis of variance, ANOVA, was performed. For a suitable predictability, the confidence level was considered to be of 90%, the p value of the F ratio had to be lower than 0.1; thus, the goodness-of-fit of the calculated model for the experimental data was considered to be significant. The synthesis of the values for the polynomial coefficients, according to Equation 1, is presented in Table 5.
Table 5 Response model coefficients and statistics obtained from ANOVA analysis
Figure 3: Response surface plot of resolution factor (a), theoretical plates (b) and asymmetry (c) as a function of pH and gradient method variation parameters
According to the data listed in Table 5, some
of the predicted terms are not significant (P>0.1) and they are eliminated from the prediction equation. Therefore, the correlation coefficients R2 have to be higher than 0.8. In the case of the resolution factor (Rs) and asymmetry (T), the values are 0.995 and 0.989. In the situation of the theoretical plates monitoring, the correlation coefficient is 0.678.
Considering these results, it may be concluded that the data fit well second-degree equations for resolution factor and chromatographic asymme-
try, parameters that are directly affected by the overall performance of the method.
The three-dimensional plots of the modeled response surfaces for the three responses are shown in Figure 3, which confirms the predictability and the correlation of the distributed models.
CONCLUSION The variation of pH under the same
chromatographic conditions, using the same ratio of the aqueous solution and the organic modifiers
ADRIANA TAMBA et al.
68
produces a significant increase of the retention time, but is not accompanied by a relative selectivity improvement.
Considering the relative efficiency of the three pH values of the media, the best efficiency was proved at pH 7.2, close to which the dissociation of the xanthines is produced. This is due to the significantly improved values of the theoretical plates involved in the absorption-desorption process of the solid/liquid chromatography technique. There is a significant improvement of the asymmetry and also an assured selectivity of the individual major compound from the impurities of the synthesis process.
The intended use of the chromatographic method is for determining the xanthine compounds from pharmaceutical matrices (with immediate, modified or prolonged release), whose structure is conditioned by the presence of excipients with the role of diluents, binders, disintegrating agents, lubricants or substances capable of modifying the behavior of the drug in the digestive tract.
REFERENCES 1 K. H. Banner, C. P. Page, Eur. Respir. J., 8, 996 (1995). 2 B. Berk, H. Akgün, K. Erol, B. Sirmagül, Z. G. Gao et al., Il Farmaco, 60, 974 (2005). 3 M. Kanehara, A. Yokoyama, Y. Tomoda, N. Shiota, H. Iwamoto et al., Pulm. Pharmacol. Ther., 21, 874
(2008).
4 L. Profire, V. Şunel, D. Lupaşcu, M. C. Baican, N. Bibire et al., Farmacia, 58, 170 (2010). 5 A. Cojocariu, L. Profire, C. Cheaburu, C. Vasile, Cellulose Chem. Technol., 2, 35 (2012). 6 G. Coman and G. Bahrim, Cellulose Chem. Technol., 4, 245 (2011). 7 P. F. Vena, J. F. Görgens and T. Pypstra, Cellulose
Chem. Technol., 6, 153 (2010). 8 S. Fekete, J. Fekete, I. Molnar, K. Ganzler, J. Chromatogr. A, 1216, 7816 (2009). 9 S. Furlanetto, S. Orlandini, G. Aldini, R. Gotti, E. Dreassi et al., Anal. Chim. Acta, 413, 229 (2000). 10 I. N. Papadoyannis, V. F. Samanidoua, K. A. Georga, J. Liq. Chromatogr. R. T., 16, 2559 (1996). 11 C. E. Jones, C. Darcy, J. Woodberry, N. M. Anstey, Y. R. McNeil, J. Chromatogr. B, 878, 8 (2010). 12 http://www.phenomenex.com/Products/HPLCDetail/Gemini-NX 13 A. Fanigliulo, D. Cabooterb, G. Bellazzia, B. Allieria, A. Rottignia et al., J. Chromatogr. A, 1218, 3351 (2011). 14 F. C. Poole, “The Essence of Chromatography”, edited by F. C. Poole, Elsevier Science B.V., 2003, pp. 467-469. 15 E. Kulikowska, B. Kierdaszuk, D. Shugar, Acta
Biochim. Pol., 2, 493 (2004). 16 M. Doubrovin, V. Ponomarev, I. Serganova, S. Soghomonian, T. Myagawa et al., Molecular Imaging, 2, 93 (2003). 17 W. R. Baeyens, G. Van der Weken, Y. Vander-Heyden, V. Van Bossche, H. Y. Aboul-Enein et al., Anal. Chim. Acta, 498, 450 (2003).