36
23 JUNE 2021 HSBC 5th Annual Asia Credit Conference
23 JUNE 2021
HSBC 5th Annual Asia Credit
Conference
2
Disclaimer
This presentation contains information about BOC Aviation Limited (“BOC Aviation”), current as at the date hereof or as at such earlier date as may be specified herein. Thisdocument does not constitute or form part of and should not be construed as, an offer to sell or issue or the solicitation of an offer to buy or acquire securities of BOC Aviation orany of its subsidiaries or affiliates or any other person in any jurisdiction or an inducement to enter into investment activity and does not constitute marketing material in connectionwith any such securities.
Certain of the information contained in this document has not been independently verified and no representation or warranty, expressed or implied, is made as to, and no relianceshould be placed on, the information or opinions contained herein or in any verbal or written communication made in connection with this presentation. The information set outherein may be subject to revision and may change materially. BOC Aviation is not under any obligation to keep current the information contained in this document and any opinionsexpressed in it are subject to change without notice.
No part of this document, nor the fact of its distribution, should form the basis of, or be relied on in connection with, any contract or commitment or investment decision whatsoever.No representation, warranty or undertaking, express or implied, is made as to, and no reliance should be placed on, the fairness, accuracy, completeness or correctness of theinformation or the opinions contained herein. Neither BOC Aviation nor any of its affiliates, advisors, agents or representatives including directors, officers and employees shallhave any liability whatsoever (in negligence or otherwise) for any loss howsoever arising from any use of this document or its contents or otherwise arising in connection with thisdocument. This document is highly confidential and is being given solely for your information and for your use and may not be shared, copied, reproduced or redistributed to anyother person in any manner.
This document may contain “forward-looking statements”, which include all statements other than statements of historical facts, including, without limitation, any statementspreceded by, followed by or that include the words “will”, “would”, “aim”, “aimed”, “will likely result”, “is likely”, “are likely”, “believe”, “expect”, “expected to”, “will continue”, “willachieve”, “anticipate”, “estimate”, “estimating”, “intend”, “plan”, “contemplate”, “seek to”, “seeking to”, “trying to”, “target”, “propose to”, “future”, “objective”, “goal”, “project”, “should”,“can”, “could”, “may”, “will pursue” or similar expressions or the negative thereof. Such forward-looking statements involve known and unknown risks, uncertainties and otherimportant factors beyond BOC Aviation’s control that could cause the actual results, performance or achievements of BOC Aviation to be materially different from future results,performance or achievements expressed or implied by such forward-looking statements. Neither BOC Aviation nor any of its affiliates, agents, advisors or representatives (includingdirectors, officers and employees) intends or has any duty or obligation to supplement, amend, update or revise any of the forward-looking statements contained in this document.
Any securities or strategies mentioned herein (if any) may not be suitable for all investors. Recipients of this document are required to make their own independent investigation andappraisal of the business and financial condition of BOC Aviation and/or any other relevant person, and any tax, legal, accounting and economic considerations that may berelevant. This document contains data sourced from and the views of independent third parties. In replicating such data in this document, BOC Aviation does not make anyrepresentation, whether express or implied, as to the accuracy of such data. The replication of any views in this document should not be treated as an indication that BOC Aviationagrees with or concurs with such views.
3
2020 RESULTS RECAP
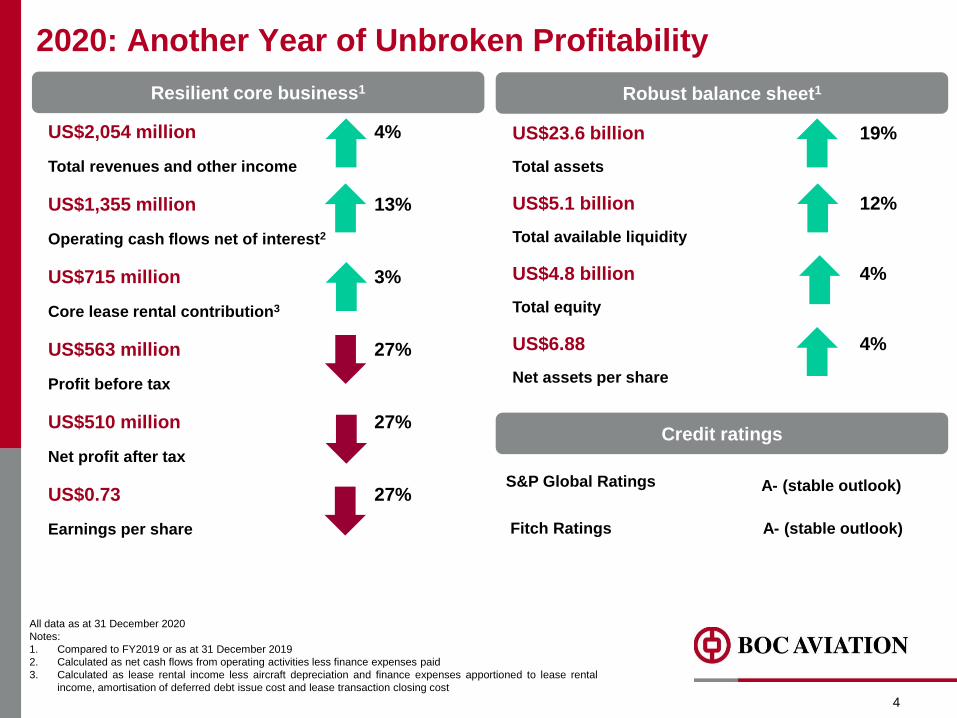
US$2,054 million 4%
Total revenues and other income
US$1,355 million 13%
Operating cash flows net of interest2
US$715 million 3%
Core lease rental contribution3
US$563 million 27%
Profit before tax
US$510 million 27%
Net profit after tax
US$0.73 27%
Earnings per share
2020: Another Year of Unbroken Profitability
4
All data as at 31 December 2020
Notes:
1. Compared to FY2019 or as at 31 December 2019
2. Calculated as net cash flows from operating activities less finance expenses paid
3. Calculated as lease rental income less aircraft depreciation and finance expenses apportioned to lease rental
income, amortisation of deferred debt issue cost and lease transaction closing cost
US$23.6 billion 19%
Total assets
US$5.1 billion 12%
Total available liquidity
US$4.8 billion 4%
Total equity
US$6.88 4%
Net assets per share
Resilient core business1 Robust balance sheet1
Credit ratings
S&P Global Ratings A- (stable outlook)
Fitch Ratings A- (stable outlook)
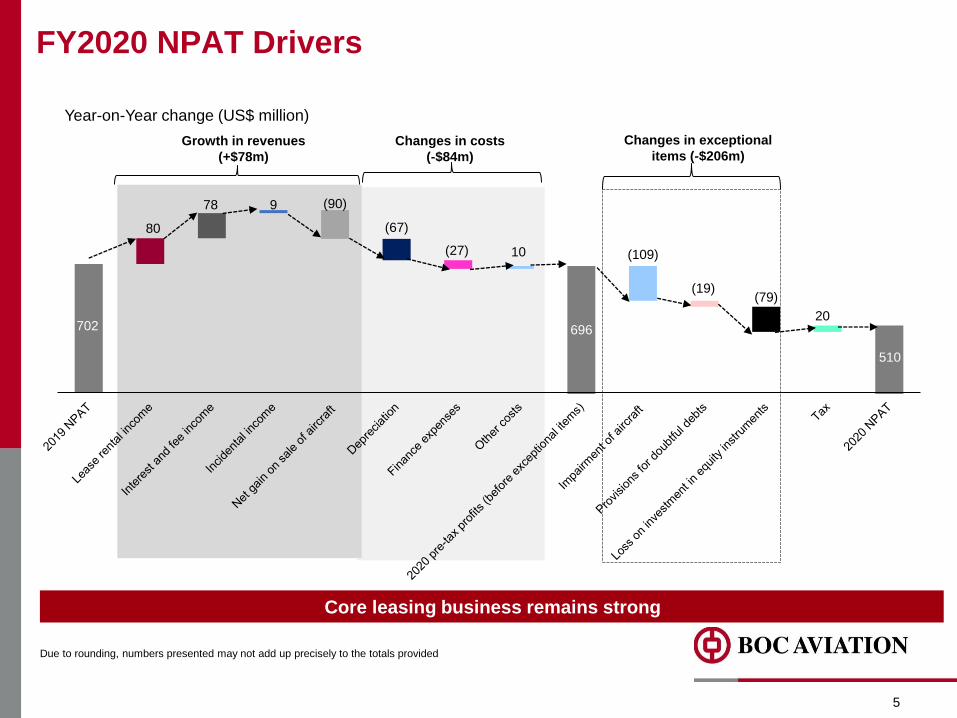
702
80
78 9 (90)
(67)
(27) 10
696
(109)
(19)(79)
20
510
FY2020 NPAT Drivers
5
Growth in revenues
(+$78m)
Year-on-Year change (US$ million)
Core leasing business remains strong
Due to rounding, numbers presented may not add up precisely to the totals provided
Changes in costs
(-$84m)
Changes in exceptional
items (-$206m)
• We had a downturn plan
• Key was to execute rapidly
• Experienced management team has successfully led the Company through multiple cycles
• Started 2020 with US$4.6 billion in total available liquidity and grew it to over US$5 billion by
year-end
• Proactive dialogues with airline customers and manufacturers
• We expect our airline customers to emerge stronger from the Covid-19 pandemic
• Purchase-and-leasebacks to support capital needs
• Deferrals when required
• Placed all new aircraft scheduled for delivery prior to 2023
• Proactively resculpted orderbook
• Acquired or committed to acquire 97 aircraft in 2020, of which 77 aircraft were from the
PLB market
• Added our 300th Boeing aircraft in June 2020 and our 400th Airbus aircraft in January 2021
• Very focused on asset quality and cashflows
• Highly diversified global customer base of 87 airlines in 39 countries and regions
• Portfolio utilization of 99.6%
• Total operating cash flows net of interest increased 13% year-on-year
Key Success Factors in a Challenging Environment
6
Executed on our downturn plan
All data as at 31 December 2020
7 14 1727 22 22
3141 44
58 6148 50
11 6
12
315
6 5
17
16 6
913
7 4
43
11
(12) (12) (3) (10) (10) (6)(21)
(33)(43) (37) (30) (34) (28)
(12) (6)
(10)(11)
(3)(5) (12)
(1) (3)
(5)
14
45
22 18 21
27 24
(3)
19 41
16 14 41
8
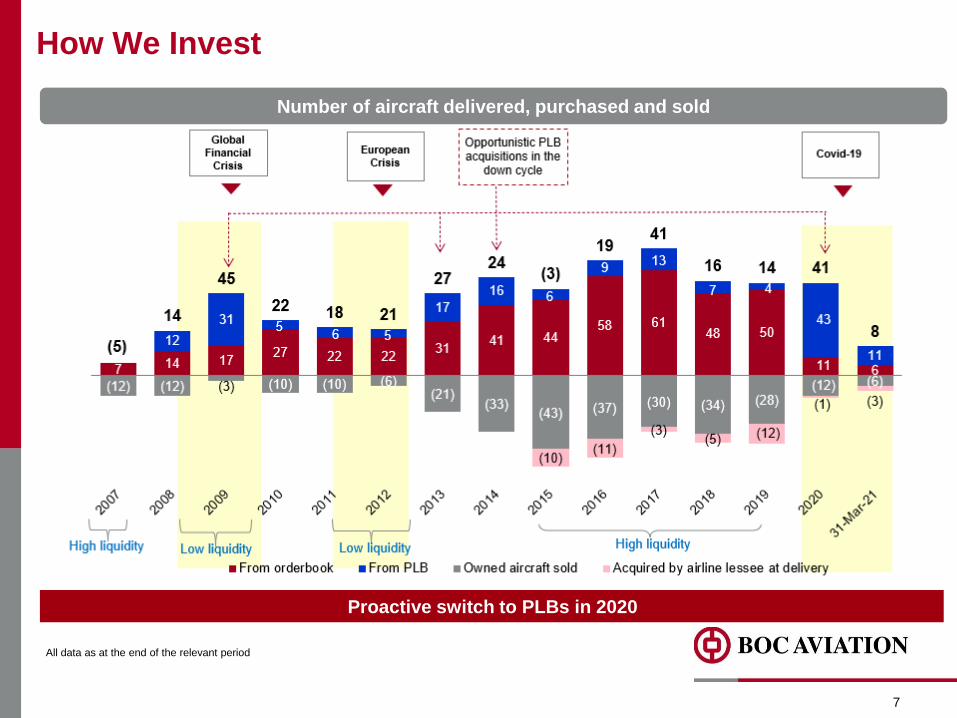
From orderbook From PLB Owned aircraft sold Acquired by airline lessee at delivery
Low liquidity Low liquidity High liquidityHigh liquidity
Opportunistic PLB
acquisitions in the
down cycle
European
Crisis
Global
Financial
Crisis
How We Invest
All data as at the end of the relevant period
7
Number of aircraft delivered, purchased and sold
Covid-19
Proactive switch to PLBs in 2020
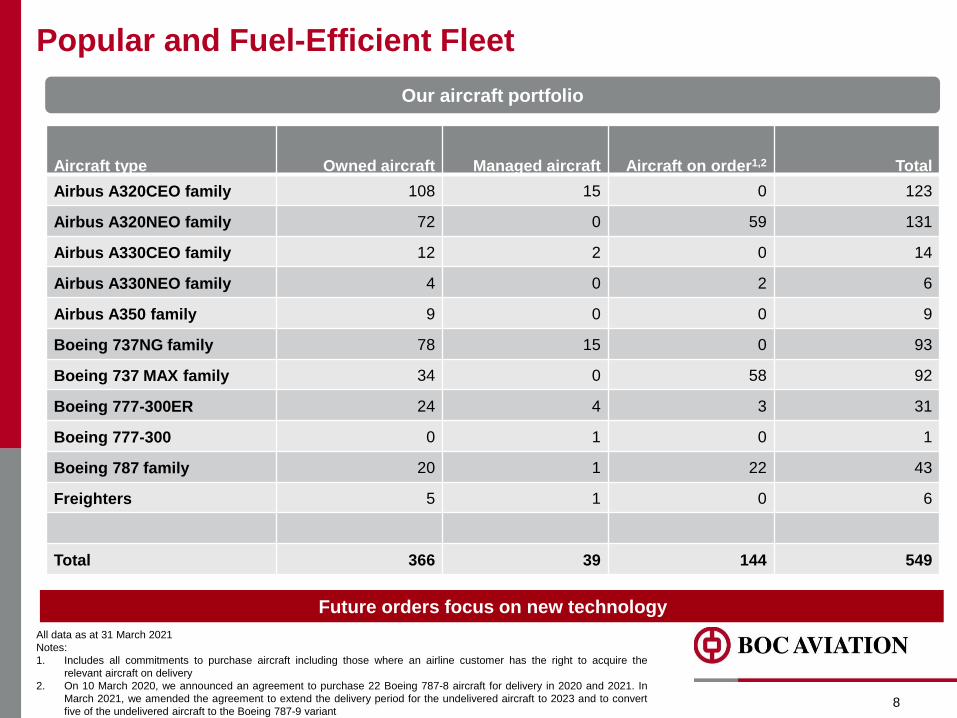
Popular and Fuel-Efficient Fleet
8
All data as at 31 March 2021
Notes:
1. Includes all commitments to purchase aircraft including those where an airline customer has the right to acquire the
relevant aircraft on delivery
2. On 10 March 2020, we announced an agreement to purchase 22 Boeing 787-8 aircraft for delivery in 2020 and 2021. In
March 2021, we amended the agreement to extend the delivery period for the undelivered aircraft to 2023 and to convert
five of the undelivered aircraft to the Boeing 787-9 variant
Our aircraft portfolio
Aircraft type Owned aircraft Managed aircraft Aircraft on order1,2 Total
Airbus A320CEO family 108 15 0 123
Airbus A320NEO family 72 0 59 131
Airbus A330CEO family 12 2 0 14
Airbus A330NEO family 4 0 2 6
Airbus A350 family 9 0 0 9
Boeing 737NG family 78 15 0 93
Boeing 737 MAX family 34 0 58 92
Boeing 777-300ER 24 4 3 31
Boeing 777-300 0 1 0 1
Boeing 787 family 20 1 22 43
Freighters 5 1 0 6
Total 366 39 144 549
Future orders focus on new technology
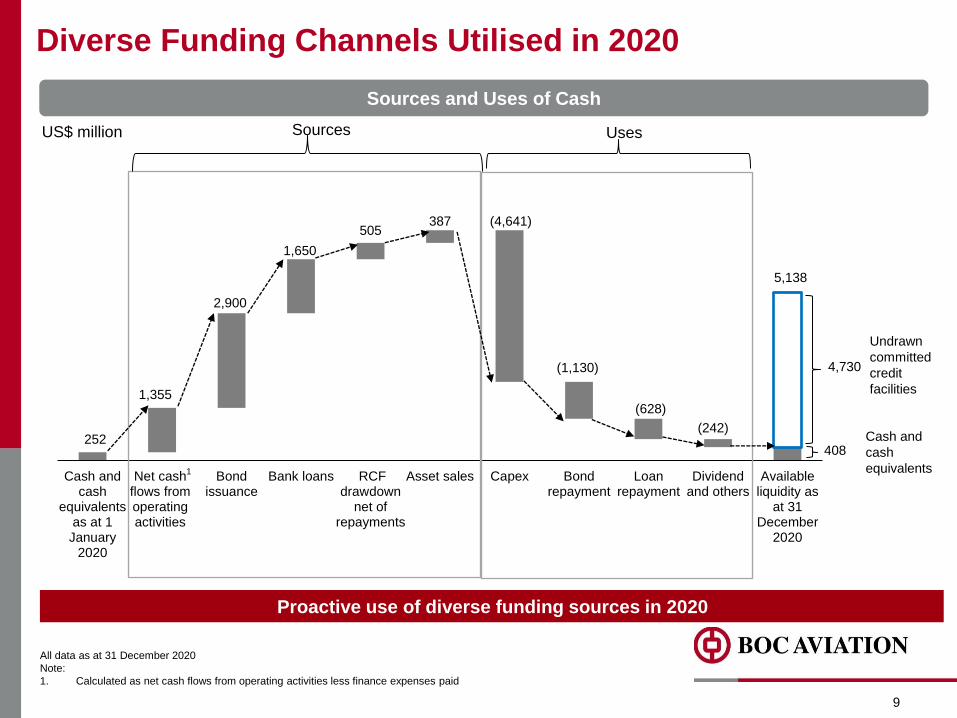
252
1,355
2,900
1,650
505387 (4,641)
(1,130)
(628)
(242)
Cash andcash
equivalentsas at 1January
2020
Net cashflows fromoperatingactivities
Bondissuance
Bank loans RCFdrawdown
net ofrepayments
Asset sales Capex Bondrepayment
Loanrepayment
Dividendand others
Availableliquidity as
at 31December
2020
Diverse Funding Channels Utilised in 2020
9
Proactive use of diverse funding sources in 2020
US$ million
Sources and Uses of Cash
All data as at 31 December 2020
Note:
1. Calculated as net cash flows from operating activities less finance expenses paid
Sources Uses
1
Cash and
cash
equivalents
Undrawn
committed
credit
facilities
5,138
408
4,730
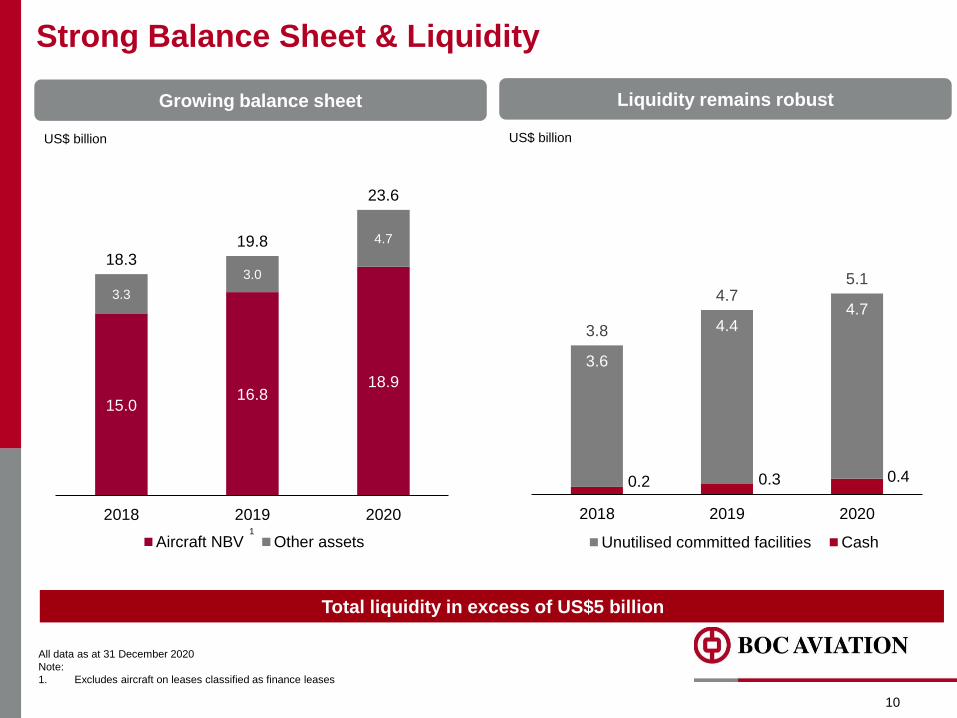
0.2 0.3 0.4
3.6
4.44.7
3.8
4.75.1
2018 2019 2020
Unutilised committed facilities Cash
Strong Balance Sheet & Liquidity
Liquidity remains robust
11
US$ billion
All data as at 31 December 2020
Note:
1. Excludes aircraft on leases classified as finance leases
10
Operating cash flow net of interest is significantly positiveTotal liquidity in excess of US$5 billion
Growing balance sheet
15.016.8
18.9
3.3
3.0
4.7
18.319.8
23.6
2018 2019 2020
Aircraft NBV Other assets
US$ billion
1
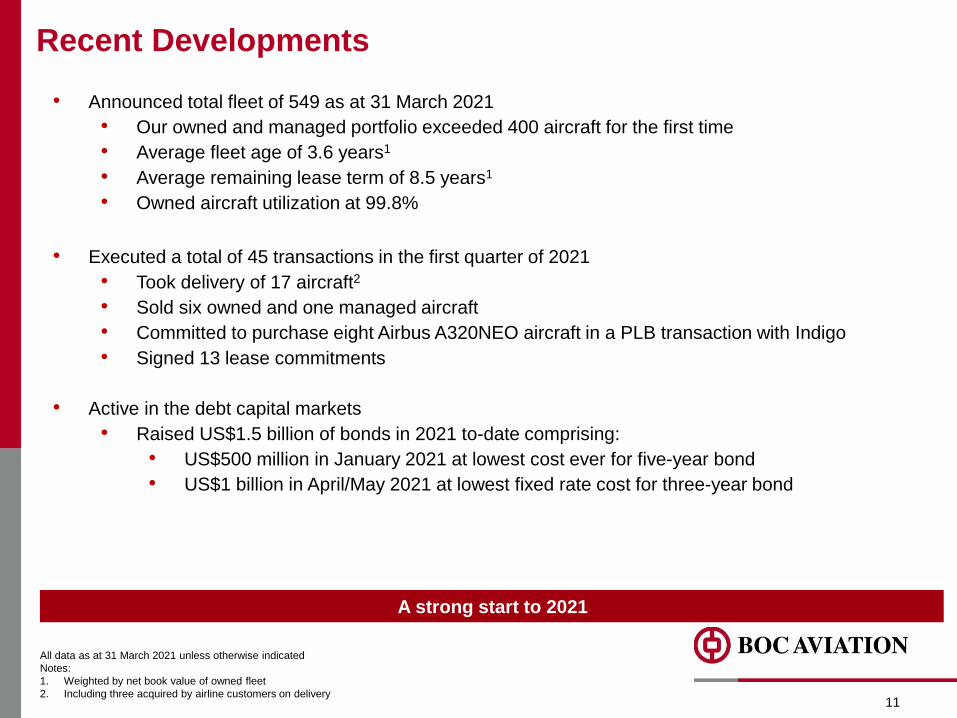
• Announced total fleet of 549 as at 31 March 2021
• Our owned and managed portfolio exceeded 400 aircraft for the first time
• Average fleet age of 3.6 years1
• Average remaining lease term of 8.5 years1
• Owned aircraft utilization at 99.8%
• Executed a total of 45 transactions in the first quarter of 2021
• Took delivery of 17 aircraft2
• Sold six owned and one managed aircraft
• Committed to purchase eight Airbus A320NEO aircraft in a PLB transaction with Indigo
• Signed 13 lease commitments
• Active in the debt capital markets
• Raised US$1.5 billion of bonds in 2021 to-date comprising:
• US$500 million in January 2021 at lowest cost ever for five-year bond
• US$1 billion in April/May 2021 at lowest fixed rate cost for three-year bond
Recent Developments
11
All data as at 31 March 2021 unless otherwise indicated
Notes:
1. Weighted by net book value of owned fleet
2. Including three acquired by airline customers on delivery
A strong start to 2021
12
INDUSTRY UPDATE
Strong Government Support Underpins Airlines Liquidity
13
Notes:
1. Source: IATA (COVID-19 has been an unprecedented shock, March 2021)
2. Bloomberg
3. Source: Financial Times, 13 April 2021
4. Source: Channel News Asia, 1 March 2021
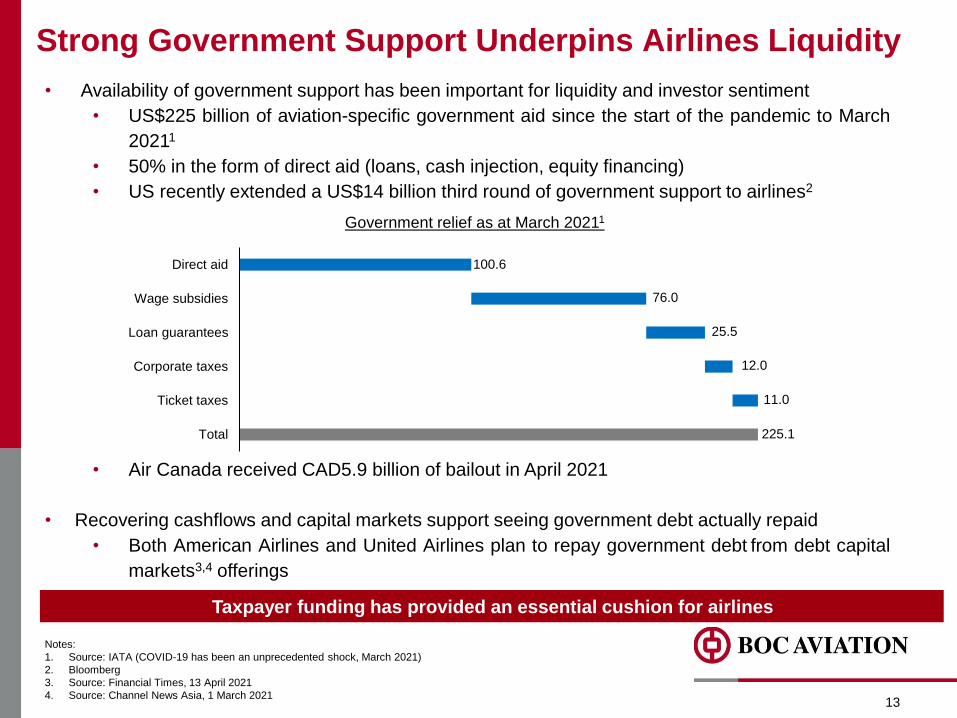
• Availability of government support has been important for liquidity and investor sentiment
• US$225 billion of aviation-specific government aid since the start of the pandemic to March
20211
• 50% in the form of direct aid (loans, cash injection, equity financing)
• US recently extended a US$14 billion third round of government support to airlines2
• Air Canada received CAD5.9 billion of bailout in April 2021
• Recovering cashflows and capital markets support seeing government debt actually repaid
• Both American Airlines and United Airlines plan to repay government debt from debt capital
markets3,4 offerings
100.6
76.0
25.5
12.0
225.1
11.0
Total
Ticket taxes
Corporate taxes
Loan guarantees
Wage subsidies
Direct aid
Government relief as at March 20211
Taxpayer funding has provided an essential cushion for airlines
Active Airline Capital Raising in 1Q 20211
14
Notes:
1. Bloomberg, 16 June 2021
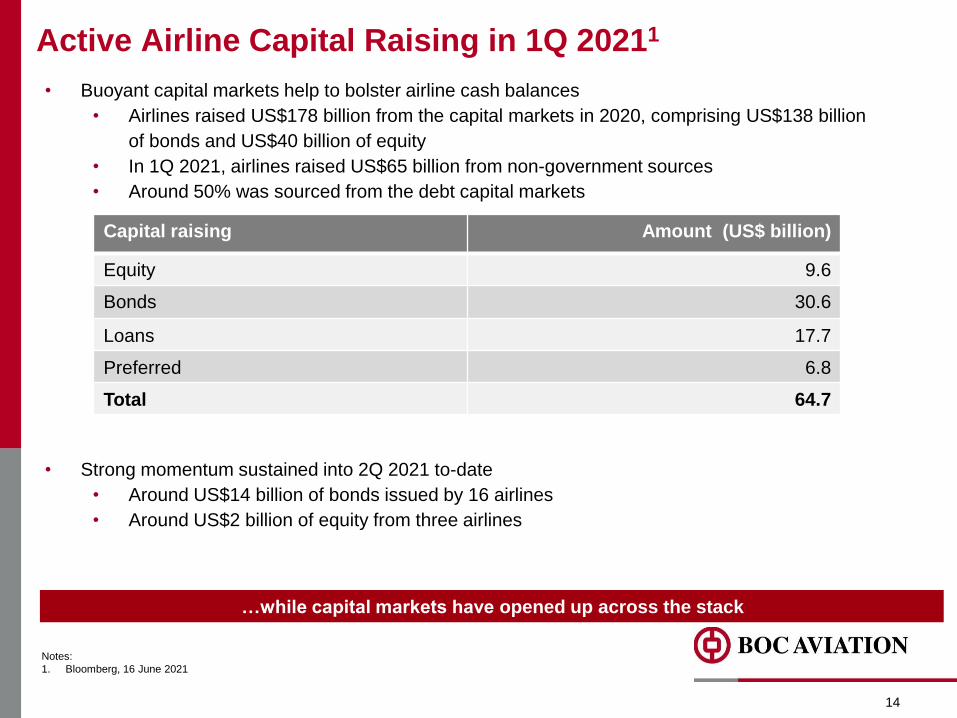
• Buoyant capital markets help to bolster airline cash balances
• Airlines raised US$178 billion from the capital markets in 2020, comprising US$138 billion
of bonds and US$40 billion of equity
• In 1Q 2021, airlines raised US$65 billion from non-government sources
• Around 50% was sourced from the debt capital markets
• Strong momentum sustained into 2Q 2021 to-date
• Around US$14 billion of bonds issued by 16 airlines
• Around US$2 billion of equity from three airlines
Capital raising Amount (US$ billion)
Equity 9.6
Bonds 30.6
Loans 17.7
Preferred 6.8
Total 64.7
…while capital markets have opened up across the stack
15
Short Haul Leisure Travel Will Be First To Return
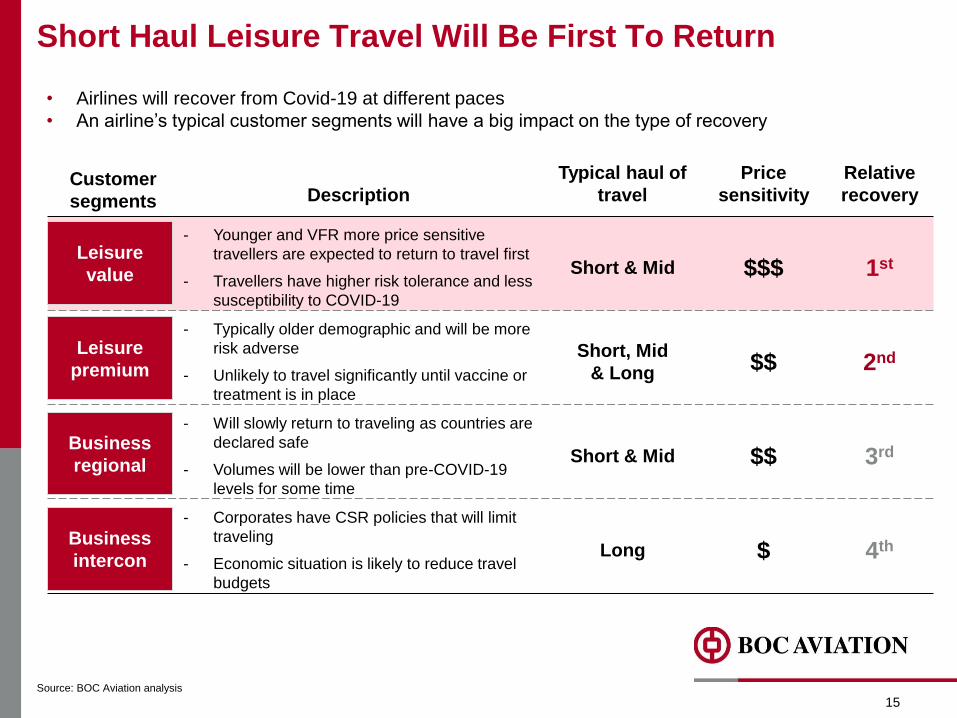
Leisure
value
Leisure
premium
Business
regional
Customer
segments
Business
intercon
Description
Typical haul of
travel
Price
sensitivity
Relative
recovery
- Younger and VFR more price sensitive
travellers are expected to return to travel first
- Travellers have higher risk tolerance and less
susceptibility to COVID-19
Short & Mid $$$ 1st
- Typically older demographic and will be more
risk adverse
- Unlikely to travel significantly until vaccine or
treatment is in place
Short, Mid
& Long$$ 2nd
- Will slowly return to traveling as countries are
declared safe
- Volumes will be lower than pre-COVID-19
levels for some time
Short & Mid $$ 3rd
- Corporates have CSR policies that will limit
traveling
- Economic situation is likely to reduce travel
budgets
Long $ 4th
Source: BOC Aviation analysis
• Airlines will recover from Covid-19 at different paces
• An airline’s typical customer segments will have a big impact on the type of recovery
16
Interim Bubbles And Strong Domestic Markets
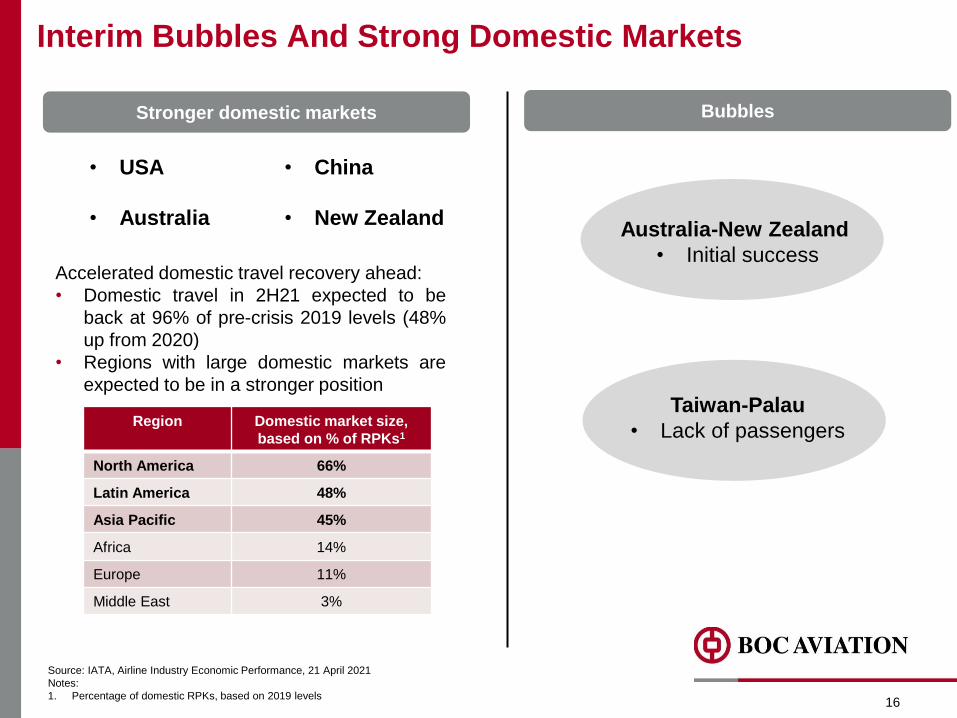
Australia-New Zealand
• Initial success
Taiwan-Palau
• Lack of passengers
• USA • China
• Australia • New Zealand
Accelerated domestic travel recovery ahead:
• Domestic travel in 2H21 expected to be
back at 96% of pre-crisis 2019 levels (48%
up from 2020)
• Regions with large domestic markets are
expected to be in a stronger position
Source: IATA, Airline Industry Economic Performance, 21 April 2021
Notes:
1. Percentage of domestic RPKs, based on 2019 levels
Region Domestic market size,
based on % of RPKs1
North America 66%
Latin America 48%
Asia Pacific 45%
Africa 14%
Europe 11%
Middle East 3%
Stronger domestic markets Bubbles
17
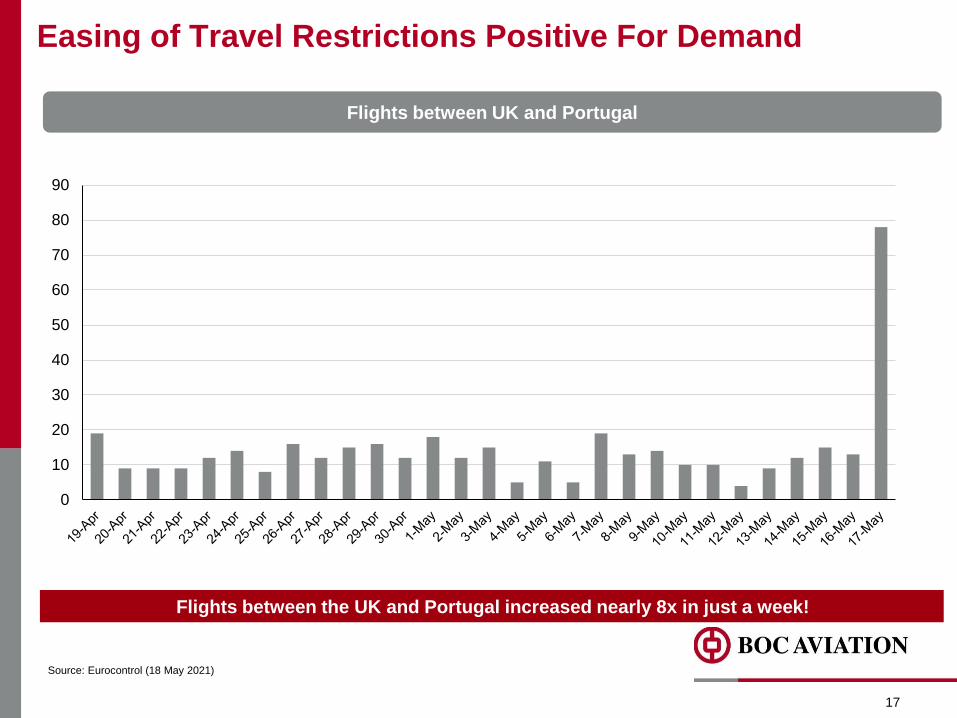
Easing of Travel Restrictions Positive For Demand
Source: Eurocontrol (18 May 2021)
Flights between UK and Portugal
0
10
20
30
40
50
60
70
80
90
Flights between the UK and Portugal increased nearly 8x in just a week!
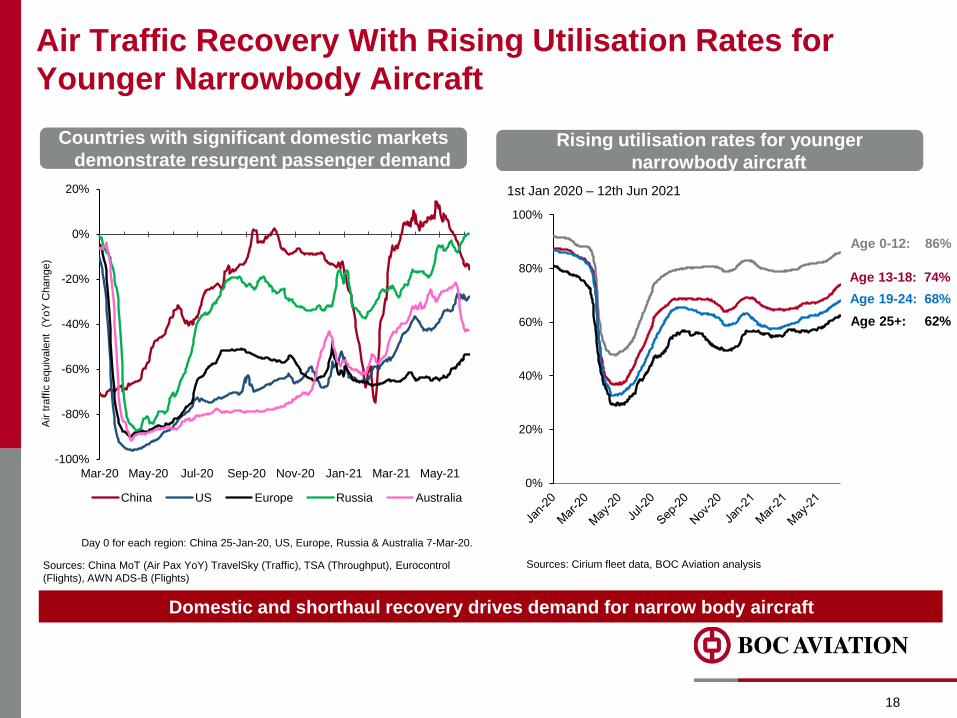
Air Traffic Recovery With Rising Utilisation Rates for
Younger Narrowbody Aircraft
18
Sources: China MoT (Air Pax YoY) TravelSky (Traffic), TSA (Throughput), Eurocontrol
(Flights), AWN ADS-B (Flights)
Air tra
ffic
equiv
ale
nt
(Y
oY
Change)
Countries with significant domestic markets
demonstrate resurgent passenger demand
Day 0 for each region: China 25-Jan-20, US, Europe, Russia & Australia 7-Mar-20.
0%
20%
40%
60%
80%
100%
Sources: Cirium fleet data, BOC Aviation analysis
Rising utilisation rates for younger
narrowbody aircraft
Age 0-12: 86%
Age 13-18: 74%
Age 19-24: 68%
Age 25+: 62%
1st Jan 2020 – 12th Jun 2021
Domestic and shorthaul recovery drives demand for narrow body aircraft
-100%
-80%
-60%
-40%
-20%
0%
20%
Mar-20 May-20 Jul-20 Sep-20 Nov-20 Jan-21 Mar-21 May-21
China US Europe Russia Australia
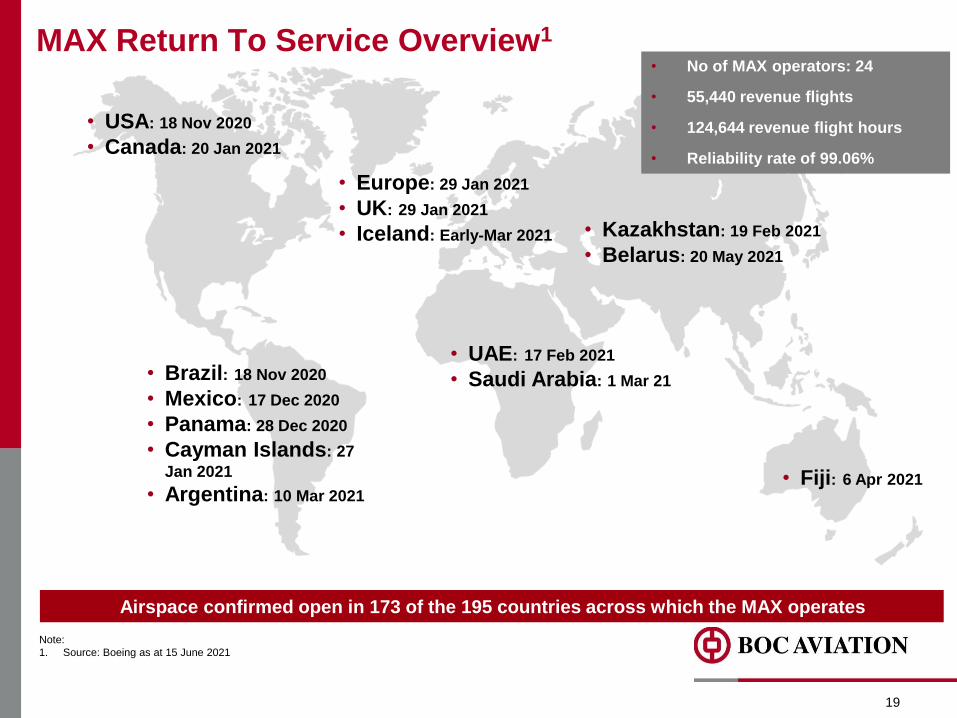
MAX Return To Service Overview1
19
Note:
1. Source: Boeing as at 15 June 2021
• USA: 18 Nov 2020
• Canada: 20 Jan 2021
• Brazil: 18 Nov 2020
• Mexico: 17 Dec 2020
• Panama: 28 Dec 2020
• Cayman Islands: 27
Jan 2021
• Argentina: 10 Mar 2021
• Europe: 29 Jan 2021
• UK: 29 Jan 2021
• Iceland: Early-Mar 2021
• Fiji: 6 Apr 2021
• UAE: 17 Feb 2021
• Saudi Arabia: 1 Mar 21
• Kazakhstan: 19 Feb 2021
• Belarus: 20 May 2021
Airspace confirmed open in 173 of the 195 countries across which the MAX operates
• No of MAX operators: 24
• 55,440 revenue flights
• 124,644 revenue flight hours
• Reliability rate of 99.06%
Num
ber
of aircra
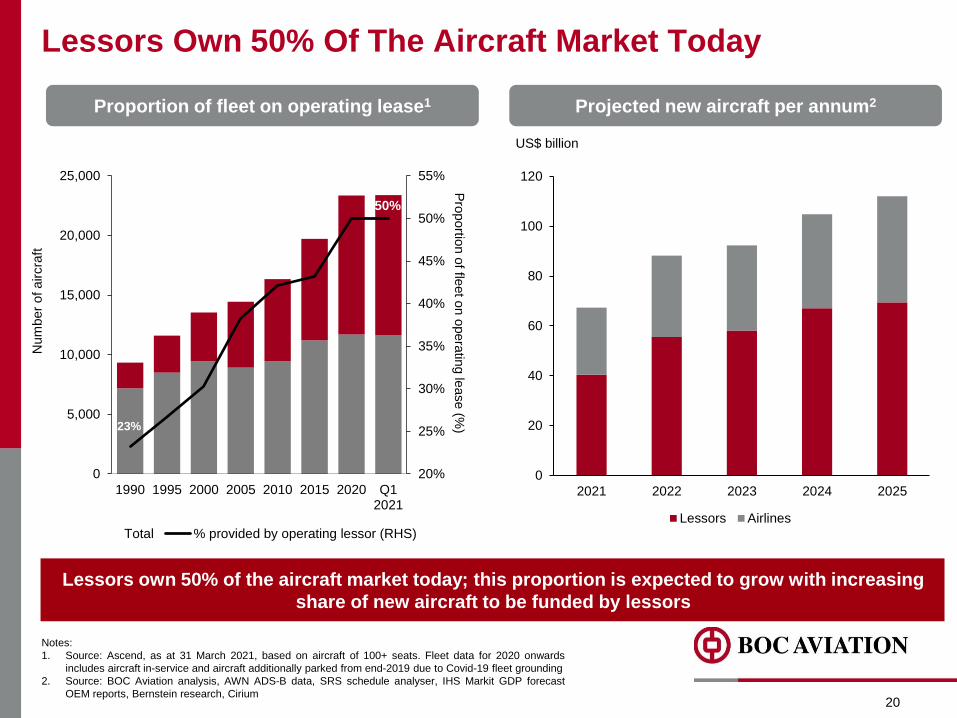
ftLessors Own 50% Of The Aircraft Market Today
Notes:
1. Source: Ascend, as at 31 March 2021, based on aircraft of 100+ seats. Fleet data for 2020 onwards
includes aircraft in-service and aircraft additionally parked from end-2019 due to Covid-19 fleet grounding
2. Source: BOC Aviation analysis, AWN ADS-B data, SRS schedule analyser, IHS Markit GDP forecast
OEM reports, Bernstein research, Cirium
23%
50%
20%
25%
30%
35%
40%
45%
50%
55%
0
5,000
10,000
15,000
20,000
25,000
1990 1995 2000 2005 2010 2015 2020 Q12021
Total % provided by operating lessor (RHS)
Pro
portio
n o
f fleet o
n o
pera
ting le
ase (%
)
20
Lessors own 50% of the aircraft market today; this proportion is expected to grow with increasing
share of new aircraft to be funded by lessors
Proportion of fleet on operating lease1 Projected new aircraft per annum2
US$ billion
0
20
40
60
80
100
120
2021 2022 2023 2024 2025
Lessors Airlines
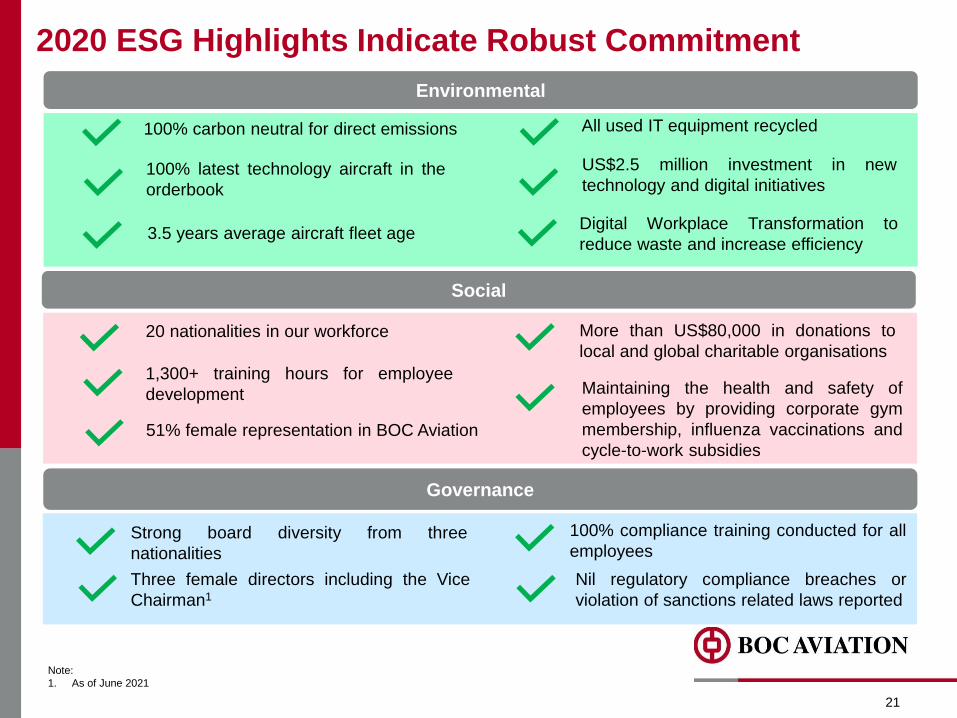
2020 ESG Highlights Indicate Robust Commitment
21
Environmental
100% carbon neutral for direct emissions
100% latest technology aircraft in the
orderbook
All used IT equipment recycled
3.5 years average aircraft fleet age
US$2.5 million investment in new
technology and digital initiatives
Digital Workplace Transformation to
reduce waste and increase efficiency
Social
20 nationalities in our workforce
51% female representation in BOC Aviation
1,300+ training hours for employee
development
More than US$80,000 in donations to
local and global charitable organisations
Maintaining the health and safety of
employees by providing corporate gym
membership, influenza vaccinations and
cycle-to-work subsidies
Governance
Strong board diversity from three
nationalities
Three female directors including the Vice
Chairman1
100% compliance training conducted for all
employees
Nil regulatory compliance breaches or
violation of sanctions related laws reported
Note:
1. As of June 2021
1
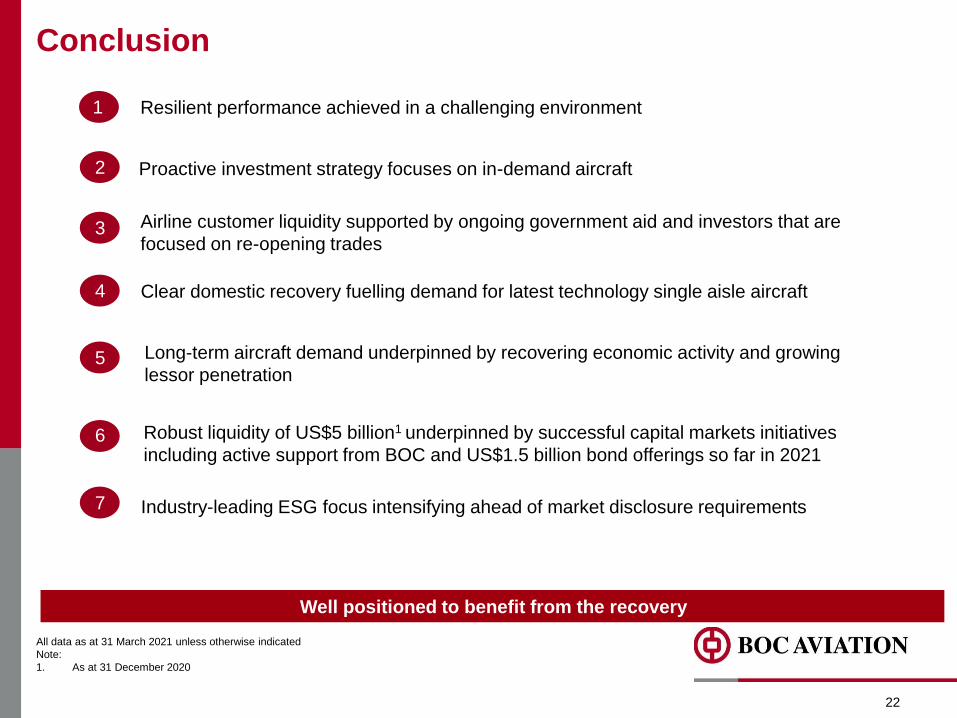
Conclusion
22
All data as at 31 March 2021 unless otherwise indicated
Note:
1. As at 31 December 2020
Well positioned to benefit from the recovery
Resilient performance achieved in a challenging environment
2 Proactive investment strategy focuses on in-demand aircraft
3 Airline customer liquidity supported by ongoing government aid and investors that are
focused on re-opening trades
5 Long-term aircraft demand underpinned by recovering economic activity and growing
lessor penetration
7
Robust liquidity of US$5 billion1 underpinned by successful capital markets initiatives
including active support from BOC and US$1.5 billion bond offerings so far in 2021 6
Industry-leading ESG focus intensifying ahead of market disclosure requirements
4 Clear domestic recovery fuelling demand for latest technology single aisle aircraft
23
APPENDICES
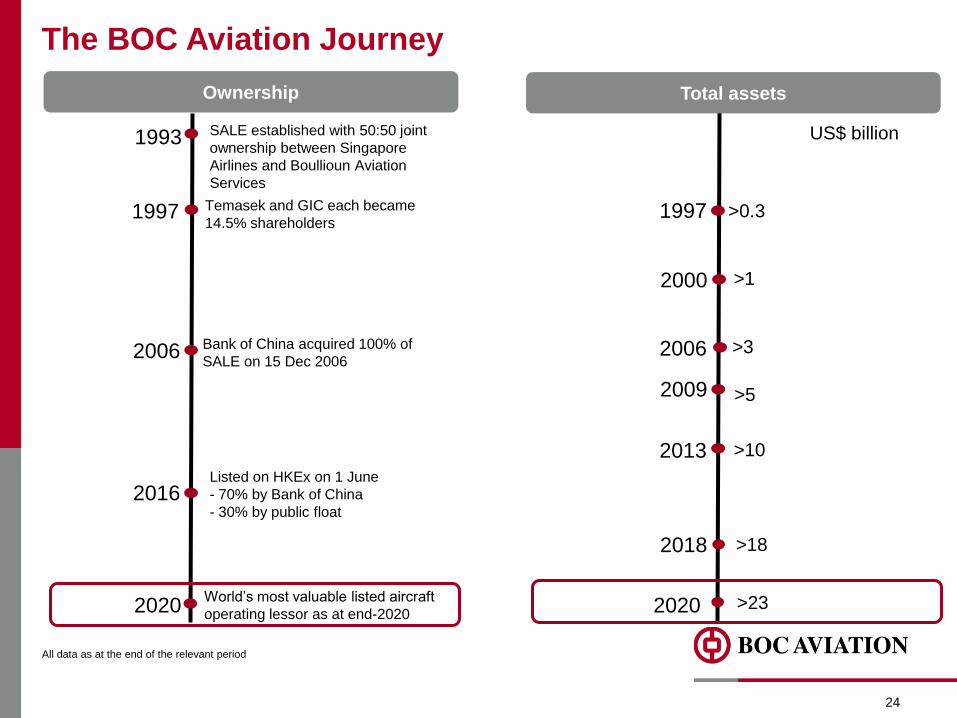
The BOC Aviation Journey
All data as at the end of the relevant period
Ownership
US$ billion1993
1997
SALE established with 50:50 joint
ownership between Singapore
Airlines and Boullioun Aviation
Services
Temasek and GIC each became
14.5% shareholders
2006 Bank of China acquired 100% of
SALE on 15 Dec 2006
2016Listed on HKEx on 1 June
- 70% by Bank of China
- 30% by public float
24
2009 >5
2006
>10
2000 >1
2013
>3
1997 >0.3
>182018
2020 >23
Total assets
2020World’s most valuable listed aircraft
operating lessor as at end-2020
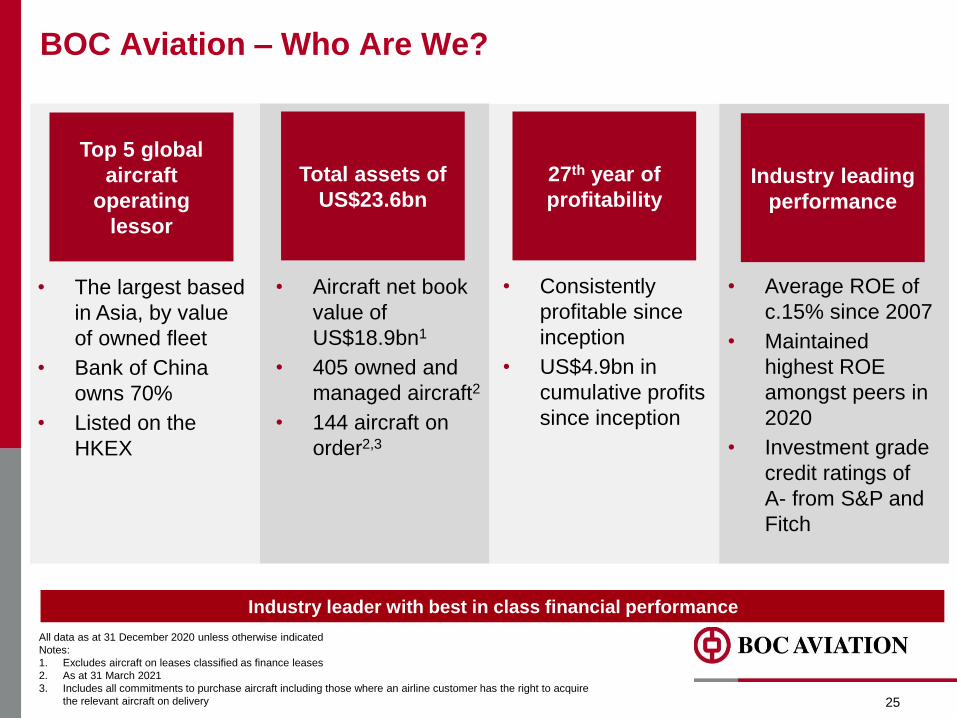
BOC Aviation – Who Are We?
All data as at 31 December 2020 unless otherwise indicated
Notes:
1. Excludes aircraft on leases classified as finance leases
2. As at 31 March 2021
3. Includes all commitments to purchase aircraft including those where an airline customer has the right to acquire
the relevant aircraft on delivery 25
Industry leader with best in class financial performance
Top 5 global
aircraft
operating
lessor
• The largest based
in Asia, by value
of owned fleet
• Bank of China
owns 70%
• Listed on the
HKEX
Total assets of
US$23.6bn
• Aircraft net book
value of
US$18.9bn1
• 405 owned and
managed aircraft2
• 144 aircraft on
order2,3
27th year of
profitability
• Consistently
profitable since
inception
• US$4.9bn in
cumulative profits
since inception
Industry leading
performance
• Average ROE of
c.15% since 2007
• Maintained
highest ROE
amongst peers in
2020
• Investment grade
credit ratings of
A- from S&P and
Fitch
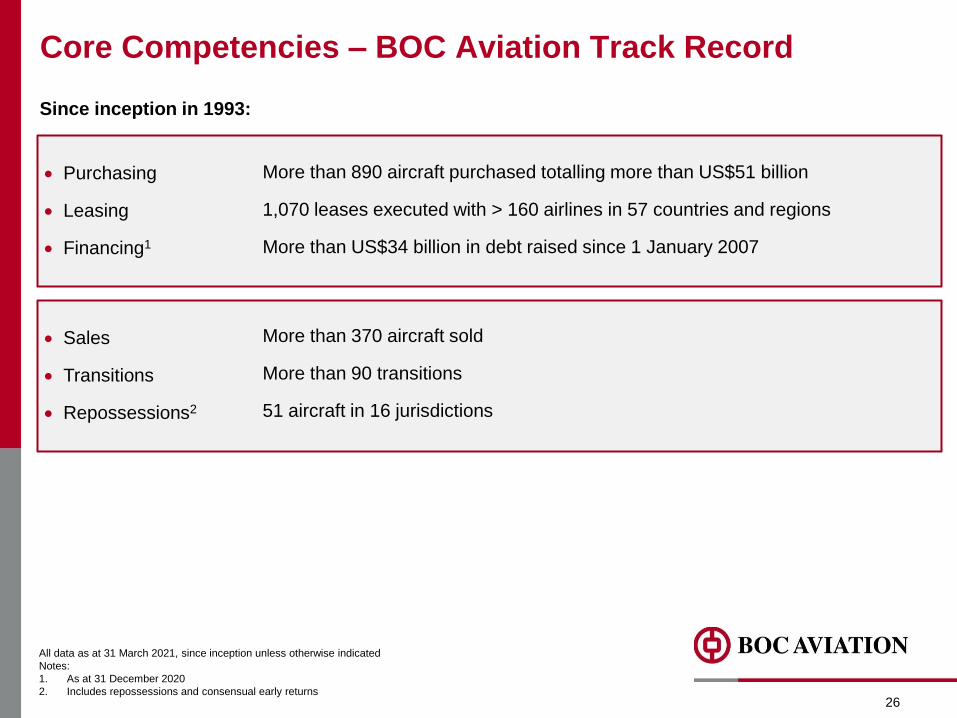
Core Competencies – BOC Aviation Track Record
• Sales
• Transitions
• Repossessions2
• Purchasing
• Leasing
• Financing1
More than 370 aircraft sold
More than 90 transitions
51 aircraft in 16 jurisdictions
More than 890 aircraft purchased totalling more than US$51 billion
1,070 leases executed with > 160 airlines in 57 countries and regions
More than US$34 billion in debt raised since 1 January 2007
All data as at 31 March 2021, since inception unless otherwise indicated
Notes:
1. As at 31 December 2020
2. Includes repossessions and consensual early returns26
Since inception in 1993:
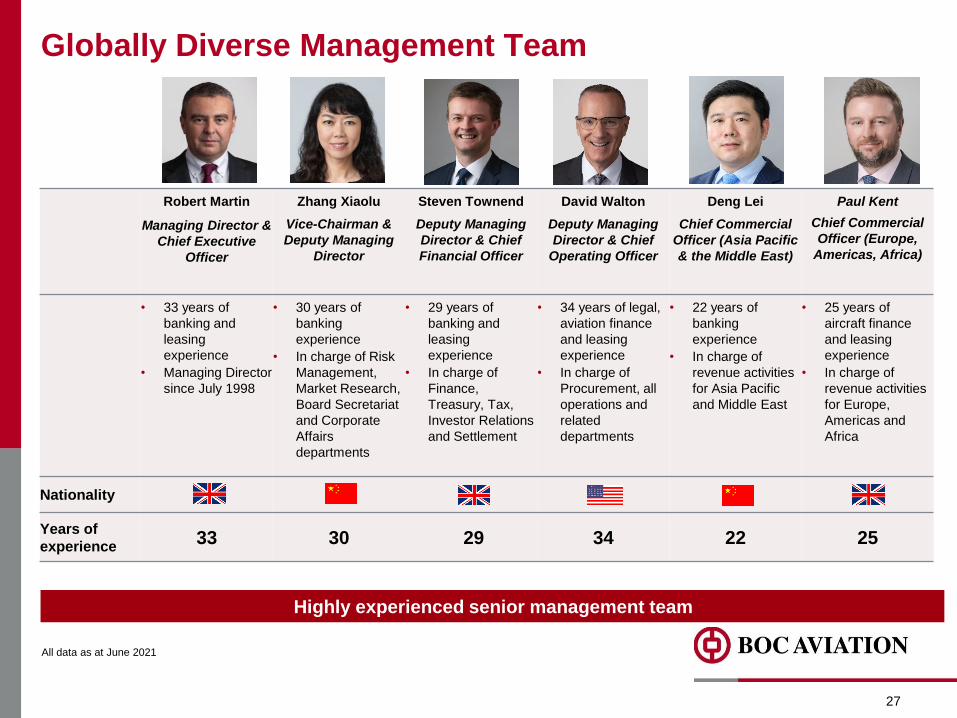
Robert Martin
Managing Director &
Chief Executive
Officer
Zhang Xiaolu
Vice-Chairman &
Deputy Managing
Director
Steven Townend
Deputy Managing
Director & Chief
Financial Officer
David Walton
Deputy Managing
Director & Chief
Operating Officer
Deng Lei
Chief Commercial
Officer (Asia Pacific
& the Middle East)
Paul Kent
Chief Commercial
Officer (Europe,
Americas, Africa)
• 33 years of
banking and
leasing
experience
• Managing Director
since July 1998
• 30 years of
banking
experience
• In charge of Risk
Management,
Market Research,
Board Secretariat
and Corporate
Affairs
departments
• 29 years of
banking and
leasing
experience
• In charge of
Finance,
Treasury, Tax,
Investor Relations
and Settlement
• 34 years of legal,
aviation finance
and leasing
experience
• In charge of
Procurement, all
operations and
related
departments
• 22 years of
banking
experience
• In charge of
revenue activities
for Asia Pacific
and Middle East
• 25 years of
aircraft finance
and leasing
experience
• In charge of
revenue activities
for Europe,
Americas and
Africa
Nationality
Years of
experience33 30 29 34 22 25
Globally Diverse Management Team
All data as at June 2021
27
Highly experienced senior management team
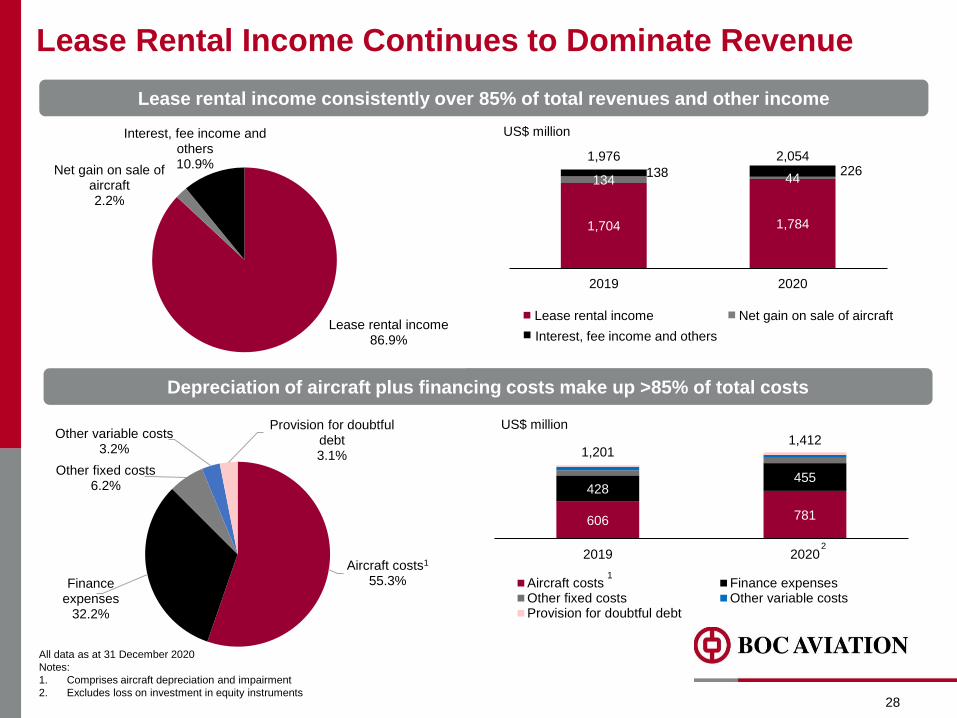
Lease Rental Income Continues to Dominate Revenue
28
US$ million
US$ million
Lease rental income consistently over 85% of total revenues and other income
Depreciation of aircraft plus financing costs make up >85% of total costs
All data as at 31 December 2020
Notes:
1. Comprises aircraft depreciation and impairment
2. Excludes loss on investment in equity instruments
Lease rental income Net gain on sale of aircraft
Interest, fee income and othersLease rental income
86.9%
Net gain on sale of aircraft2.2%
Interest, fee income and others10.9%
1,704 1,784
134 44138 2261,976 2,054
2019 2020
Aircraft costs1
55.3%Finance expenses
32.2%
Other fixed costs6.2%
Other variable costs3.2%
Provision for doubtful debt3.1%
606 781
428455
1,2011,412
2019 2020
Aircraft costs Finance expensesOther fixed costs Other variable costsProvision for doubtful debt
1
2
16.8 18.9
3.2
(0.3) (0.8)
Aircraft NBVat 1 January
2020
Additions Sales Aircraft costs Aircraft NBVat 31
December2020
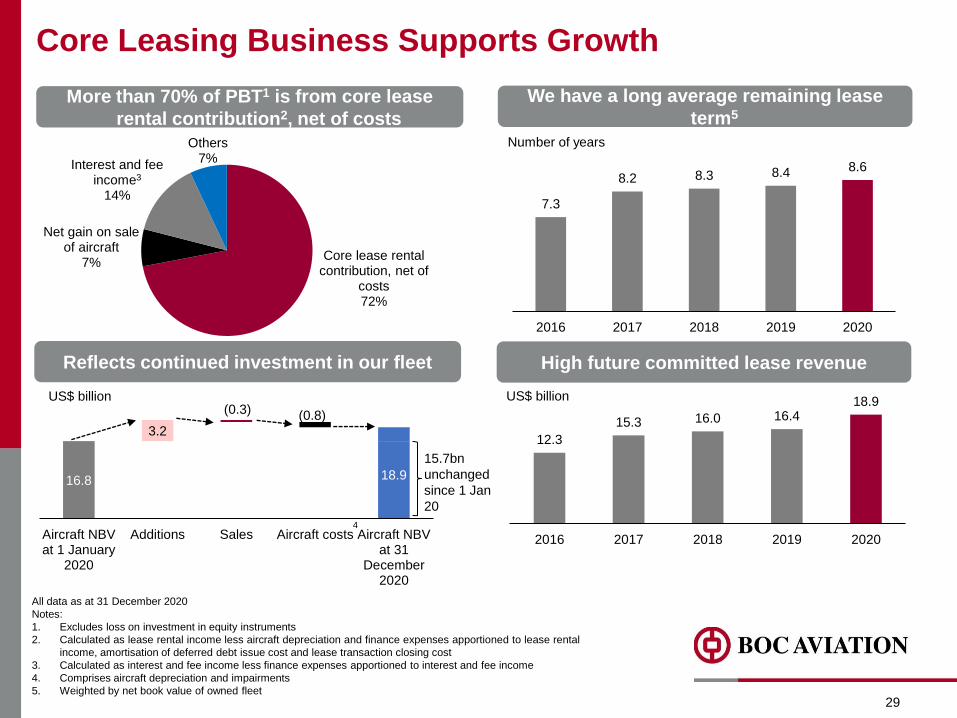
Core Leasing Business Supports Growth
29
All data as at 31 December 2020
Notes:
1. Excludes loss on investment in equity instruments
2. Calculated as lease rental income less aircraft depreciation and finance expenses apportioned to lease rental
income, amortisation of deferred debt issue cost and lease transaction closing cost
3. Calculated as interest and fee income less finance expenses apportioned to interest and fee income
4. Comprises aircraft depreciation and impairments
5. Weighted by net book value of owned fleet
Number of years
US$ billion
More than 70% of PBT1 is from core lease
rental contribution2, net of costs
We have a long average remaining lease
term5
High future committed lease revenue
15.7bn
unchanged
since 1 Jan
20
Reflects continued investment in our fleet
US$ billion
4
Core lease rental contribution, net of
costs72%
Net gain on sale of aircraft
7%
Interest and fee income3
14%
Others7%
7.3
8.2 8.3 8.4 8.6
2016 2017 2018 2019 2020
12.3
15.3 16.0 16.418.9
2016 2017 2018 2019 2020
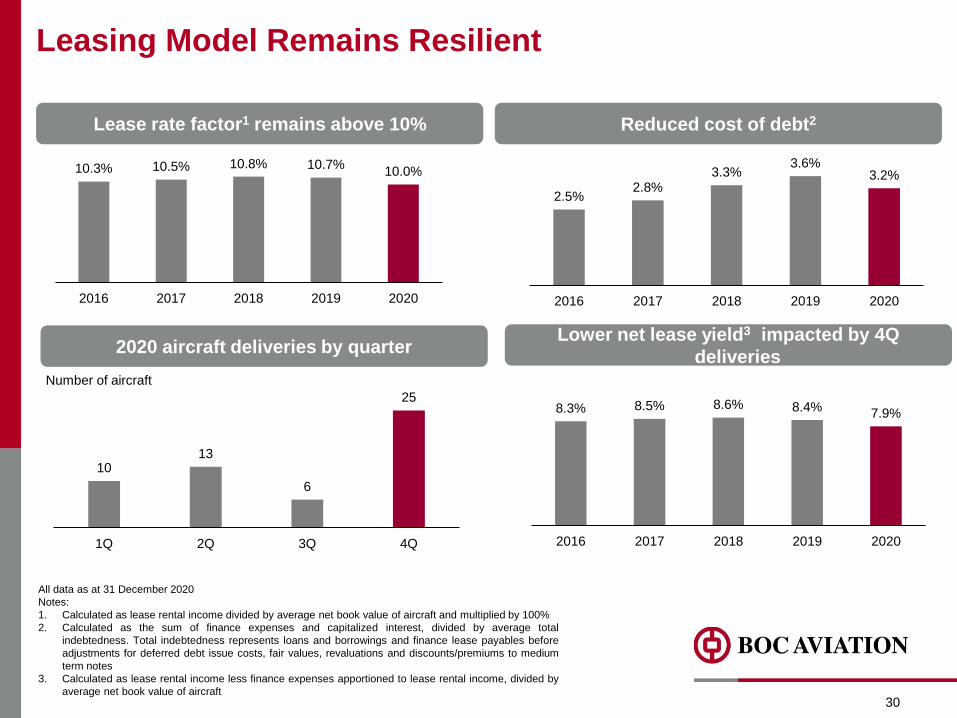
Leasing Model Remains Resilient
30
Number of aircraft
Lease rate factor1 remains above 10% Reduced cost of debt2
2020 aircraft deliveries by quarterLower net lease yield3 impacted by 4Q
deliveries
All data as at 31 December 2020
Notes:
1. Calculated as lease rental income divided by average net book value of aircraft and multiplied by 100%
2. Calculated as the sum of finance expenses and capitalized interest, divided by average total
indebtedness. Total indebtedness represents loans and borrowings and finance lease payables before
adjustments for deferred debt issue costs, fair values, revaluations and discounts/premiums to medium
term notes
3. Calculated as lease rental income less finance expenses apportioned to lease rental income, divided by
average net book value of aircraft
10.3% 10.5% 10.8% 10.7%10.0%
2016 2017 2018 2019 2020
2.5%2.8%
3.3%3.6%
3.2%
2016 2017 2018 2019 2020
8.3% 8.5% 8.6% 8.4%7.9%
2016 2017 2018 2019 2020
1013
6
25
1Q 2Q 3Q 4Q
31
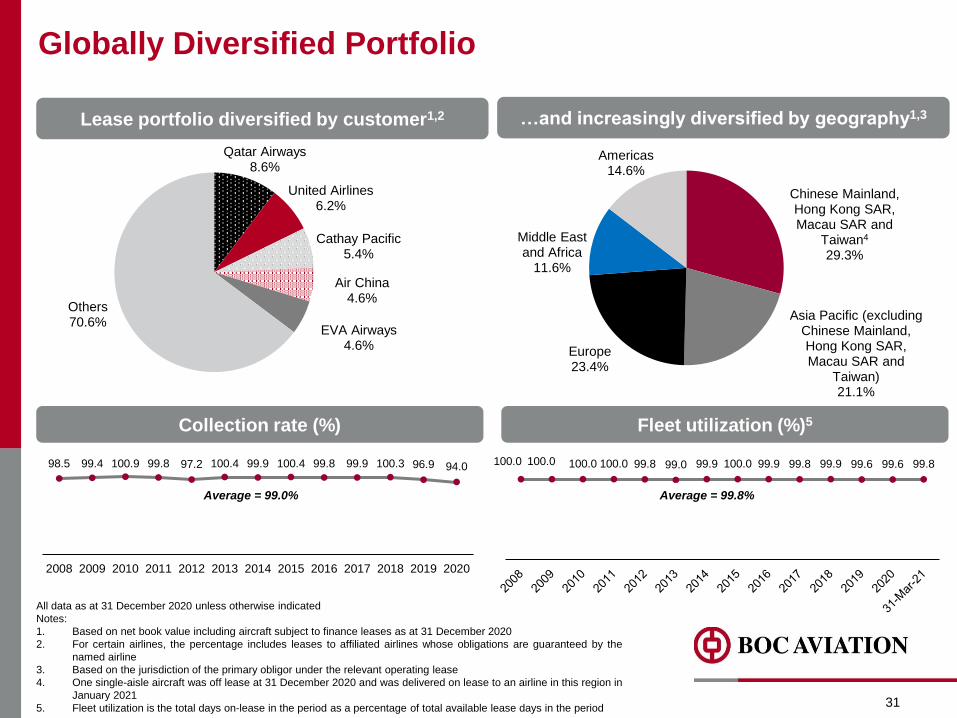
98.5 99.4 100.9 99.8 97.2 100.4 99.9 100.4 99.8 99.9 100.3 96.9 94.0
2008 2009 2010 2011 2012 2013 2014 2015 2016 2017 2018 2019 2020
100.0 100.0 100.0 100.0 99.8 99.0 99.9 100.0 99.9 99.8 99.9 99.6 99.6 99.8
All data as at 31 December 2020 unless otherwise indicated
Notes:
1. Based on net book value including aircraft subject to finance leases as at 31 December 2020
2. For certain airlines, the percentage includes leases to affiliated airlines whose obligations are guaranteed by the
named airline
3. Based on the jurisdiction of the primary obligor under the relevant operating lease
4. One single-aisle aircraft was off lease at 31 December 2020 and was delivered on lease to an airline in this region in
January 2021
5. Fleet utilization is the total days on-lease in the period as a percentage of total available lease days in the period
Globally Diversified Portfolio
Average = 99.0% Average = 99.8%
Qatar Airways8.6%
United Airlines6.2%
Cathay Pacific 5.4%
Air China4.6%
EVA Airways4.6%
Others70.6%
Lease portfolio diversified by customer1,2 …and increasingly diversified by geography1,3
Collection rate (%) Fleet utilization (%)5
Chinese Mainland, Hong Kong SAR, Macau SAR and
Taiwan4
29.3%
Asia Pacific (excluding Chinese Mainland, Hong Kong SAR, Macau SAR and
Taiwan)21.1%
Europe23.4%
Middle East and Africa
11.6%
Americas14.6%
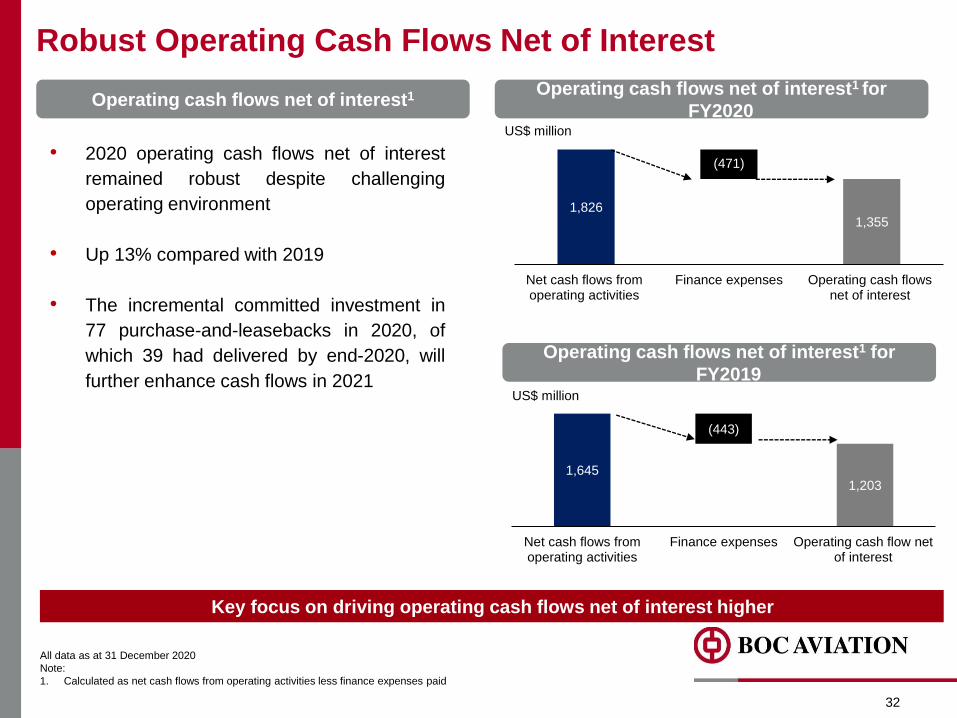
1,645
(443)
1,203
Net cash flows fromoperating activities
Finance expenses Operating cash flow netof interest
1,826
(471)
1,355
Net cash flows fromoperating activities
Finance expenses Operating cash flowsnet of interest
Robust Operating Cash Flows Net of Interest
32
Key focus on driving operating cash flows net of interest higher
US$ million
Operating cash flows net of interest1 for
FY2020
All data as at 31 December 2020
Note:
1. Calculated as net cash flows from operating activities less finance expenses paid
Operating cash flows net of interest1 for
FY2019
• 2020 operating cash flows net of interest
remained robust despite challenging
operating environment
• Up 13% compared with 2019
• The incremental committed investment in
77 purchase-and-leasebacks in 2020, of
which 39 had delivered by end-2020, will
further enhance cash flows in 2021US$ million
Operating cash flows net of interest1
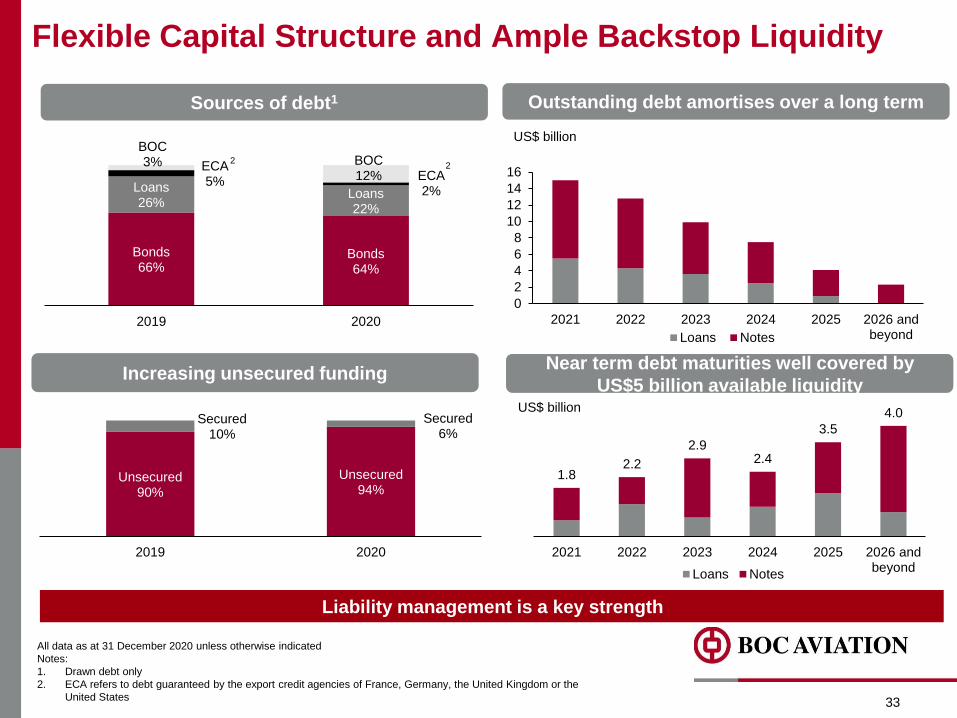
Bonds66%
Bonds64%
Loans26%
Loans22%
ECA5% ECA
2%
BOC3% BOC
12%
2019 2020
Flexible Capital Structure and Ample Backstop Liquidity
33
US$ billion
US$ billion
All data as at 31 December 2020 unless otherwise indicated
Notes:
1. Drawn debt only
2. ECA refers to debt guaranteed by the export credit agencies of France, Germany, the United Kingdom or the
United States
Sources of debt1
Increasing unsecured funding
Outstanding debt amortises over a long term
Debt repayment by yearNear term debt maturities well covered by
US$5 billion available liquidity
22
0
2
4
6
8
10
12
14
16
2021 2022 2023 2024 2025 2026 andbeyondLoans Notes
1.82.2
2.92.4
3.5
4.0
2021 2022 2023 2024 2025 2026 andbeyond
Loans Notes
Unsecured90%
Unsecured94%
Secured10%
Secured6%
2019 2020
Liability management is a key strength

Long Term Leases Enhance Revenue Visibility
34
All data as at 31 December 2020 unless otherwise indicated
Notes:
1. Owned aircraft with lease expiring in each calendar year excluding any aircraft for which BOC
Aviation has a sale or lease commitment, weighted by net book value of owned fleet as at 31
March 2021
2. Weighted by net book value of owned fleet as at 31 March 2021 for BOC Aviation, Aercap and Air
Lease, as at 31 December 2020 for Avolon
3. By net book value including aircraft subject to finance lease and aircraft held for sale, and
excluding aircraft off lease
4. Fixed rate debt included floating rate debt swapped to fixed rate liabilities
Source: Respective company websites
By net book value
Number of years
Well-dispersed lease expiries1 Proportion of fixed rate leases rising steadily3
Long average remaining lease term2 Stable proportion of fixed rate debt4
8.57.3 6.9 6.8
BOC Aviation Aercap Air Lease Corp Avolon
43% 47%61%
77% 75%
57% 53%39%
23% 25%
2016 2017 2018 2019 2020
Fixed rate Floating rate
54%66% 76% 83% 87%
46%34% 24% 17% 13%
2016 2017 2018 2019 2020
Fixed rate Floating rate
1.2% 2.0% 3.3% 4.8% 6.4%
82.3%
0%
20%
40%
60%
80%
100%
0
50
100
150
200
250
300
2021 2022 2023 2024 2025 2026 andbeyond
Number of leases expiring (LHS)
Percentage of aircraft NBV with leases expiring (RHS)
Average remaining lease term of 8.5 years
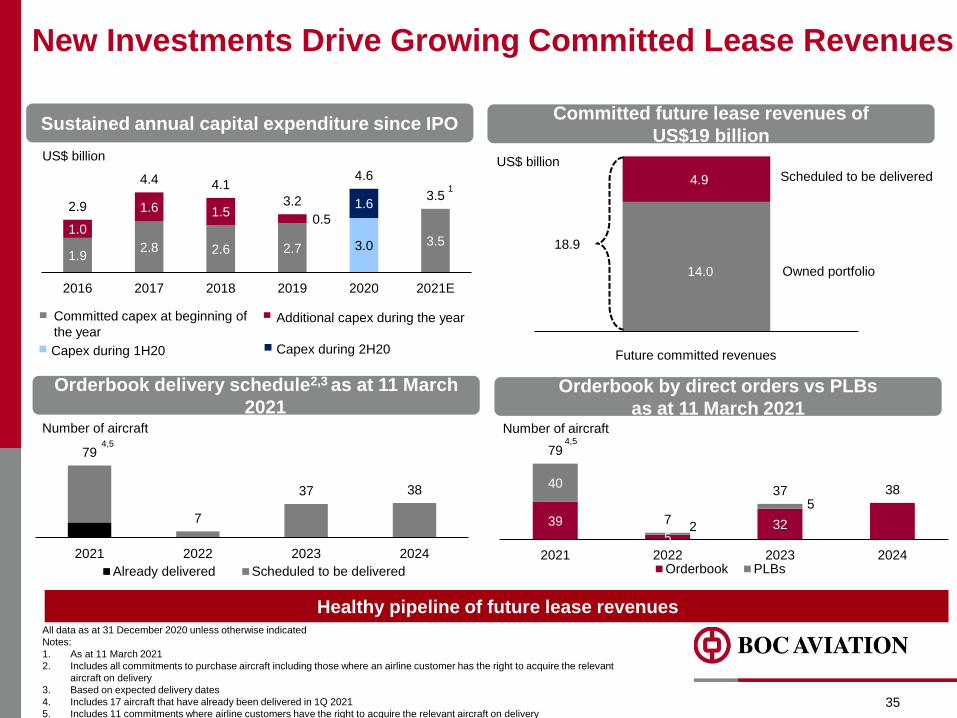
79
7
37 38
2021 2022 2023 2024
Already delivered Scheduled to be delivered
1.92.8 2.6 2.7 3.0 3.5
1.0
1.6 1.50.5
1.62.9
4.4 4.1
3.2
4.6
3.5
2016 2017 2018 2019 2020 2021E
New Investments Drive Growing Committed Lease Revenues
35
All data as at 31 December 2020 unless otherwise indicated
Notes:
1. As at 11 March 2021
2. Includes all commitments to purchase aircraft including those where an airline customer has the right to acquire the relevant
aircraft on delivery
3. Based on expected delivery dates
4. Includes 17 aircraft that have already been delivered in 1Q 2021
5. Includes 11 commitments where airline customers have the right to acquire the relevant aircraft on delivery
US$ billion
Healthy pipeline of future lease revenues
Committed capex at beginning of
the yearAdditional capex during the year
Capex during 1H20 Capex during 2H20
Orderbook delivery schedule2,3 as at 11 March
2021
Sustained annual capital expenditure since IPOCommitted future lease revenues of
US$19 billion
14.0
4.9
1
US$ billion
18.9
Scheduled to be delivered
Owned portfolio
Future committed revenues
Orderbook by direct orders vs PLBs
as at 11 March 2021Number of aircraft Number of aircraft
4,5
1
39
532
40
2
5
79
7
37 38
2021 2022 2023 2024Orderbook PLBs
4,5
36
www.bocaviation.com
BOC Aviation Limited 8 Shenton Way #18-01 Singapore 068811 Phone +65 6323 5559 Facsimile +65 6323 6962
Incorporated in the Republic of Singapore with limited liability
Company Registration No. 199307789K


