54
HSBC Asset Management (India) Private Limited Annual Report 2013 - 2014

HSBC Asset Management (India) Private Limited
Annual Report 2013 - 2014

HSBC Asset Management (India) Private Limited
DIRECTORS’ REPORT
FOR THE YEAR ENDED MARCH 31, 2014 The Directors have pleasure in submitting their report along with the audited financials for the Financial Year ended March 31, 2014. 1. FINANCIAL RESULTS
(Rs. 000s)
Particulars Current
financial year ended
March 31, 2014
Previous financial year ended
March 31, 2013
Gross income 720,696 431,810 Profit / (loss) before finance charges and depreciation 42,090 (191,661) Finance charges 2,036 1,994 Depreciation 13,758 18,503 Exceptional Items 101,715 - Profit / (loss) for the period (75,419) (212,158) Provision for Tax - -
Deferred Tax & Fringe benefit tax Credit / (Charge) - - Net Profit / (loss) for the period after adjustment of deferred tax credit (75,419) (212,158) Dividend, Dividend Distribution tax & Other Appropriations - - Net Profit / (loss) after taxes carried forward to the Balance Sheet (75,419) (212,158) Previous period figures have been regrouped and reclassified wherever necessary to confirm the current period’s presentation. 2 OPERATIONS a) Mutual Fund While the markets continued to remain challenging during the financial year ending March 31, 2014, we observed diverse trends in Assets under Management.

HSBC Asset Management (India) Private Limited
During the year, the following schemes were launched/matured by HSBC Mutual Fund:
Name of the Scheme Date of Launch
HSBC Capital Protection Oriented Fund April 18, 2013
HSBC Fixed Term Series 91 August 01, 2013
HSBC Fixed Term Series 94 August 16, 2013
HSBC Fixed Term Series 95 August 23, 2013
HSBC Fixed Term Series 98 October 14, 2013
HSBC Fixed Term Series 97 October 24, 2013
HSBC Fixed Term Series 99 November 08, 2013
HSBC Fixed Term Series 100 November 27, 2013
HSBC Fixed Term Series 101 January 15, 2014
HSBC Fixed Term Series 105 February 05, 2014
HSBC Fixed Term Series 106 February 24, 2014
HSBC Asia Pacific (Ex Japan) Dividend Yield Fund
February 03, 2014
HSBC Fixed Term Series 107 March 06, 2014
HSBC Fixed Term Series 109 March 24, 2014
HSBC Managed Solutions April 09, 2014
Name of Scheme Date of Maturity
HSBC Fixed Term Series 86 April 02, 2013
The Company earned Investment Management fees to the tune of Rs. 39.73 crores (net of Service Tax) for managing the assets of HSBC Mutual Fund. The fund under management of the Schemes of HSBC Mutual Fund as at March 31, 2014 was Rs. 6,976.47 crores. The Fund had 219898 live investor accounts as at March 31, 2014 in its various Schemes. b) Portfolio Management Services (PMS) The Company launched its Portfolio Management Services (PMS) offering on 27 March 2006. Portfolio Management Services is a customized proposition for high net worth clients. The service aims to provide personalized portfolio management services to select clientele depending on the investor's risk appetite, growth expectations and personal investment requirements. Currently the Company provides Discretionary and Advisory Portfolio Management Services to individual and institutional customers.

HSBC Asset Management (India) Private Limited
As on March 31, 2014, the PMS business had Assets under Management (AUM) of INR 83884.27 crores including the Employee Provident Fund Organization (EPFO) corpus. There were 128 (including EPFO) clients under Discretionary PMS and 1 client under Advisory PMS. 3. PERFORMANCE
The performance of the Schemes of HSBC Mutual Fund as on March 31, 2014 is presented below:
1) HSBC Equity Fund (HEF) – an open-ended diversified Equity Scheme
HEF seeks to generate long-term capital growth from an actively managed portfolio of equity and equity related securities. The net assets of HEF amounted to Rs. 453.11 crores as at March 31, 2014 as against Rs. 537.32 crores as at March 31, 2013. Around 97.81% of the net assets were invested in equities, 2.51% of the net assets were invested in reverse repos/CBLO and (- 0.32%) was in the net current assets as at March 31, 2014. HEF remained invested in a diversified portfolio across large capitalization stocks. The relative overweight in Technology resulted in outperformance against scheme benchmark for the period 2013-14.
Date Of Inception : 10 Dec 02 Absolute (%)
Compounded Annualized
(%)
Scheme Name & Benchmarks
April 13 - March 14
April 12 - March 13
April 11 - March 12
Since Inception
HSBC Equity Fund – Growth 16.82 4.20 -8.90 24.34
S&P BSE 200 (Scheme Benchmark)
16.65 5.41 -9.55 18.72
CNX Nifty (Standard Benchmark)
17.53 6.93 -9.13 17.67
Rs. 10,000, if invested in HEF, would have become
11,682 10,420 9,110 118,277
Rs. 10,000, if invested in S&P BSE 200, would have become
11,665 10,541 9,045 69,977
Rs. 10,000, if invested in CNX Nifty, would have
11,753 10,693 9,087 63,309

HSBC Asset Management (India) Private Limited
Date Of Inception : 10 Dec 02 Absolute (%)
Compounded Annualized
(%)
Scheme Name & Benchmarks
April 13 - March 14
April 12 - March 13
April 11 - March 12
Since Inception
become
Past performance may or may not be sustained in future. Returns data as on March 31, 2014. Data for the period April to March has been considered in all cases, except for Since Inception. ‘Since Inception’ returns are calculated on Rs. 10 invested at inception. Standard benchmark is prescribed by SEBI for long term equity schemes and is used for comparison purposes. Returns on Rs. 10,000 are point-to-point returns for the specific time period, invested at the start of the period. The returns provided above have been rounded off and hence there may be a minor difference between point-to-point returns vis-à-vis returns indicated above. Calculations are based on Growth NAVs. 2) HSBC India Opportunities Fund (HIOF) – an open-ended flexi-cap Equity
Scheme HIOF seeks long term capital growth through investments across all market capitalizations, including small, mid and large cap stocks. It aims to be predominantly invested in equity and equity related securities. However, it could move a significant portion of its assets towards fixed income securities if the fund manager becomes negative on equity markets. The net assets of HIOF amounted to Rs. 177.60 crores as at March 31, 2014 as compared to Rs. 212.70 crores as at March 31, 2013. Around 98.47% of the net assets were invested in equities, 3.09 % of the net assets were invested in reverse repos/CBLO and (-1.56%) were in the net current assets as at March 31, 2014. HIOF outperformed its benchmark on a 1-year, 3-year basis and since its inception. The overweight in Technology resulted in outperformance against its benchmark for the period 2013-14. In addition, stock selections in sectors like Consumer Discretionary, Healthcare, Industrials, Materials and Utility contributed to the outperformance during this period.

HSBC Asset Management (India) Private Limited
Date Of Inception : 24 Feb 04 Absolute (%)
Compounded Annualized
(%)
Scheme Name & Benchmarks
April 13 - March 14
April 12 - March 13
April 11 - March 12
Since Inception
HSBC India Opportunities Fund – Growth 27.93 0.21 -3.60 15.97
S&P BSE 500 (Scheme Benchmark) 16.44 4.14 -9.47 13.76
CNX Nifty (Standard Benchmark) 17.53 6.93 -9.13 13.77
Rs. 10,000, if invested in HIOF, would have become
12,793 10,021 9,640 44,698
Rs. 10,000, if invested in S&P BSE 500, would have become
11,644 10,414 9,053 36,805
Rs. 10,000, if invested in CNX Nifty, would have become
11,753 10,693 9,087 36,822
Past performance may or may not be sustained in future. Returns data as on March 31, 2014. Data for the period April to March has been considered in all cases, except for Since Inception. ‘Since Inception’ returns are calculated on Rs. 10 invested at inception. Standard benchmark is prescribed by SEBI for long term equity schemes and is used for comparision purposes. Returns on Rs. 10,000 are point-to-point returns for the specific time period, invested at the start of the period. The returns provided above have been rounded off and hence there may be a minor difference between point-to-point returns vis-à-vis returns indicated above. Calculations are based on Growth NAVs. 3) HSBC Midcap Equity Fund (HMEF) – an open-ended diversified Equity Scheme HMEF seeks to generate long term capital growth from an actively managed portfolio of equity and equity related securities primarily being midcap stocks. However, it could move a portion of its assets towards fixed income securities if the fund manager becomes negative on the Indian equity markets. The net assets of HMEF amounted to Rs. 82.03 crores as at March 31, 2014 as compared to Rs. 82.29 crores as at March 31, 2013. Around 98.61 % of the net assets were invested in equities, 2.12% of the net assets were invested in reverse repos/CBLO and (-0.73 %) were in the net current assets as at March 31, 2014.

HSBC Asset Management (India) Private Limited
HMEF has done well in terms of outperformance v/s benchmark due to stock selection across various sectors for the period 2013-14. The focus on reasonable growth oriented companies available at attractive valuations (PB/ROE) paid off. HMEF continues to be overweight in Auto Ancillary, Agro Chemicals, Capital Goods, Pharma and underweight in FMCG sector.
Date Of Inception : 19 May 05 Absolute (%)
Compounded Annualized
(%)
Scheme Name & Benchmarks
April 13 - March 14
April 12 - March 13
April 11 - March 12
Since Inception
HSBC Midcap Equity Fund – Growth 28.40 -8.82 -8.51 9.51
S&P BSE Midcap (Scheme Benchmark) 13.86 -4.30 -9.14 9.19
CNX Nifty (Standard Benchmark) 17.53 6.93 -9.13 14.67
Rs. 10,000, if invested in HMEF, would have become
12,840 9,118 9,149 22,400
Rs. 10,000, if invested in S&P BSE Midcap, would have become
11,386 9,570 9,086 21,818
Rs. 10,000, if invested in CNX Nifty, would have become
11,753 10,693 9,087 33,688
Past performance may or may not be sustained in future. Returns data as on March 31, 2014. Data for the period April to March has been considered in all cases, except for Since Inception. ‘Since Inception’ returns are calculated on Rs. 10 invested at inception. Standard benchmark is prescribed by SEBI for long term equity schemes and is used for comparision purposes. Returns on Rs. 10,000 are point-to-point returns for the specific time period, invested at the start of the period. The returns provided above have been rounded off and hence there may be a minor difference between point-to-point returns vis-à-vis returns indicated above. Calculations are based on Growth NAVs. 4) HSBC Progressive Themes Fund (HPTF) – an open-ended flexi-theme
Equity Scheme HPTF seeks to generate long term capital growth from an actively managed portfolio of equity and equity related securities by investing primarily in sectors, areas and themes that play an important role in, and / or benefit from, India's progress, reform process and economic development.

HSBC Asset Management (India) Private Limited
The net assets of HPTF amounted to Rs. 110.41 crores as at March 31, 2014 as compared to Rs. 130.40 crores as at March 31, 2013. Around 99.88% of the net assets were invested in equities, 0.93% of the net assets were invested in reverse repos/CBLO and (-0.81%) were in the net current assets as at March 31, 2014. HPTF is a theme based scheme. The focus of the scheme being on Infrastructure and Economic Reforms suffered due to delay in the government policy, high interest rates, etc. as against a more diversified benchmark. However, post-election the fund has managed to recover sharply on expectations of increased infrastructure thrust, improvement in investment cycle, easing of regulatory hurdles etc.
Date Of Inception : 23 Feb 06 Absolute (%)
Compounded Annualized
(%)
Scheme Name & Benchmarks
April 13 - March 14
April 12 - March 13
April 11 - March 12
Since Inception
HSBC Progressive Themes Fund – Growth 4.65 -10.58 -4.28 1.06
S&P BSE 200 (Scheme Benchmark) 16.65 5.41 -9.55 9.56
CNX Nifty (Standard Benchmark) 17.53 6.93 -9.13 10.15
Rs. 10,000, if invested in HPTF, would have become
10,465 8,942 9,572 10,896
Rs. 10,000, if invested in S&P BSE 200, would have become
11,665 10,541 9,045 20,962
Rs. 10,000, if invested in CNX Nifty, would have become
11,753 10,693 9,087 21,900
Past performance may or may not be sustained in future. Returns data as on March 31, 2014. Data for the period April to March has been considered in all cases, except for Since Inception. ‘Since Inception’ returns are calculated on Rs. 10 invested at inception. Standard benchmark is prescribed by SEBI for long term equity schemes and is used for comparision purposes. Returns on Rs. 10,000 are point-to-point returns for the specific time period, invested at the start of the period. The returns provided above have been rounded off and hence there may be a minor difference between point-to-point returns vis-à-vis returns indicated above. Calculations are based on Growth NAVs.
HSBC Asset Management (India) Private Limited
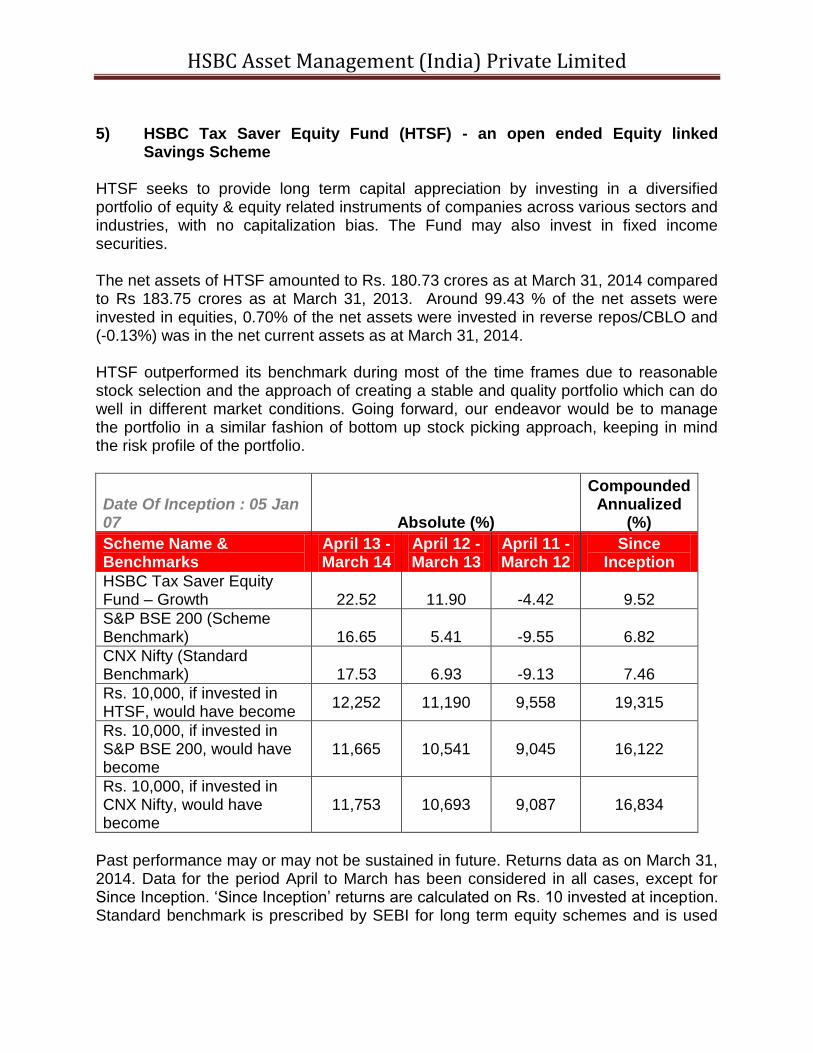
5) HSBC Tax Saver Equity Fund (HTSF) - an open ended Equity linked Savings Scheme
HTSF seeks to provide long term capital appreciation by investing in a diversified portfolio of equity & equity related instruments of companies across various sectors and industries, with no capitalization bias. The Fund may also invest in fixed income securities. The net assets of HTSF amounted to Rs. 180.73 crores as at March 31, 2014 compared to Rs 183.75 crores as at March 31, 2013. Around 99.43 % of the net assets were invested in equities, 0.70% of the net assets were invested in reverse repos/CBLO and (-0.13%) was in the net current assets as at March 31, 2014. HTSF outperformed its benchmark during most of the time frames due to reasonable stock selection and the approach of creating a stable and quality portfolio which can do well in different market conditions. Going forward, our endeavor would be to manage the portfolio in a similar fashion of bottom up stock picking approach, keeping in mind the risk profile of the portfolio.
Date Of Inception : 05 Jan 07 Absolute (%)
Compounded Annualized
(%)
Scheme Name & Benchmarks
April 13 - March 14
April 12 - March 13
April 11 - March 12
Since Inception
HSBC Tax Saver Equity Fund – Growth 22.52 11.90 -4.42 9.52
S&P BSE 200 (Scheme Benchmark) 16.65 5.41 -9.55 6.82
CNX Nifty (Standard Benchmark) 17.53 6.93 -9.13 7.46
Rs. 10,000, if invested in HTSF, would have become
12,252 11,190 9,558 19,315
Rs. 10,000, if invested in S&P BSE 200, would have become
11,665 10,541 9,045 16,122
Rs. 10,000, if invested in CNX Nifty, would have become
11,753 10,693 9,087 16,834
Past performance may or may not be sustained in future. Returns data as on March 31, 2014. Data for the period April to March has been considered in all cases, except for Since Inception. ‘Since Inception’ returns are calculated on Rs. 10 invested at inception. Standard benchmark is prescribed by SEBI for long term equity schemes and is used
HSBC Asset Management (India) Private Limited
for comparision purposes. Returns on Rs. 10,000 are point-to-point returns for the specific time period, invested at the start of the period. The returns provided above have been rounded off and hence there may be a minor difference between point-to-point returns vis-à-vis returns indicated above. Calculations are based on Growth NAVs.
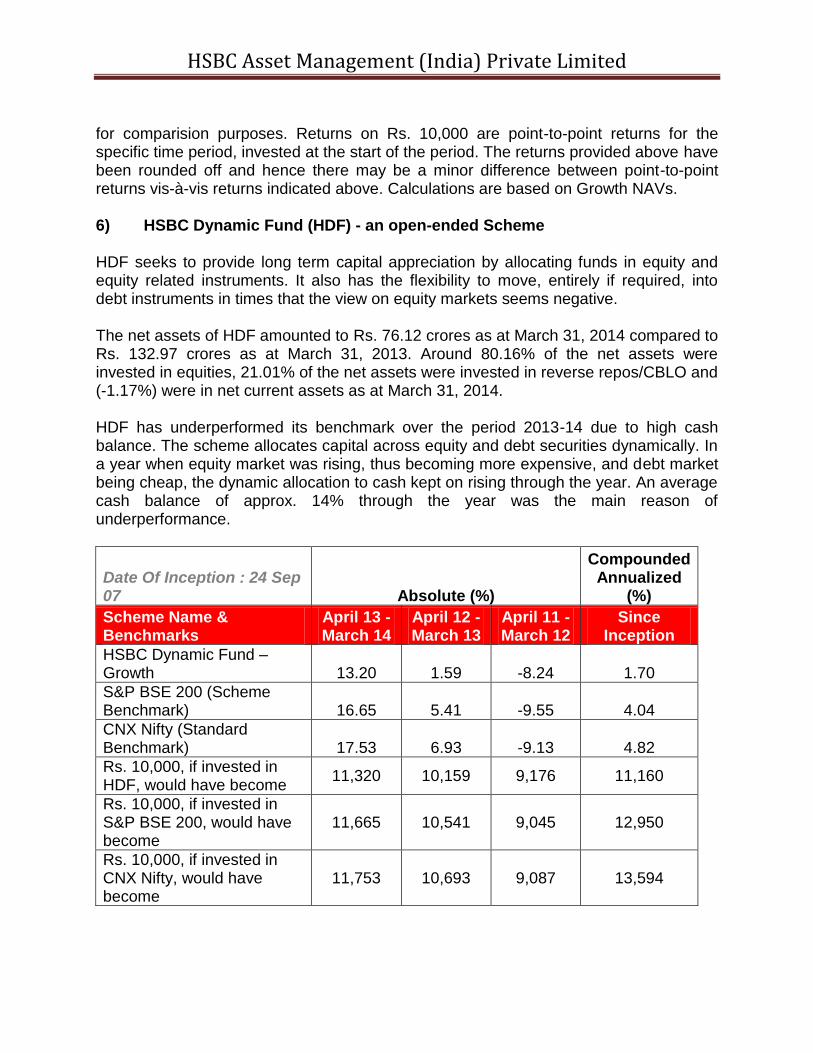
6) HSBC Dynamic Fund (HDF) - an open-ended Scheme HDF seeks to provide long term capital appreciation by allocating funds in equity and equity related instruments. It also has the flexibility to move, entirely if required, into debt instruments in times that the view on equity markets seems negative. The net assets of HDF amounted to Rs. 76.12 crores as at March 31, 2014 compared to Rs. 132.97 crores as at March 31, 2013. Around 80.16% of the net assets were invested in equities, 21.01% of the net assets were invested in reverse repos/CBLO and (-1.17%) were in net current assets as at March 31, 2014. HDF has underperformed its benchmark over the period 2013-14 due to high cash balance. The scheme allocates capital across equity and debt securities dynamically. In a year when equity market was rising, thus becoming more expensive, and debt market being cheap, the dynamic allocation to cash kept on rising through the year. An average cash balance of approx. 14% through the year was the main reason of underperformance.
Date Of Inception : 24 Sep 07 Absolute (%)
Compounded Annualized
(%)
Scheme Name & Benchmarks
April 13 - March 14
April 12 - March 13
April 11 - March 12
Since Inception
HSBC Dynamic Fund – Growth 13.20 1.59 -8.24 1.70
S&P BSE 200 (Scheme Benchmark) 16.65 5.41 -9.55 4.04
CNX Nifty (Standard Benchmark) 17.53 6.93 -9.13 4.82
Rs. 10,000, if invested in HDF, would have become
11,320 10,159 9,176 11,160
Rs. 10,000, if invested in S&P BSE 200, would have become
11,665 10,541 9,045 12,950
Rs. 10,000, if invested in CNX Nifty, would have become
11,753 10,693 9,087 13,594
HSBC Asset Management (India) Private Limited
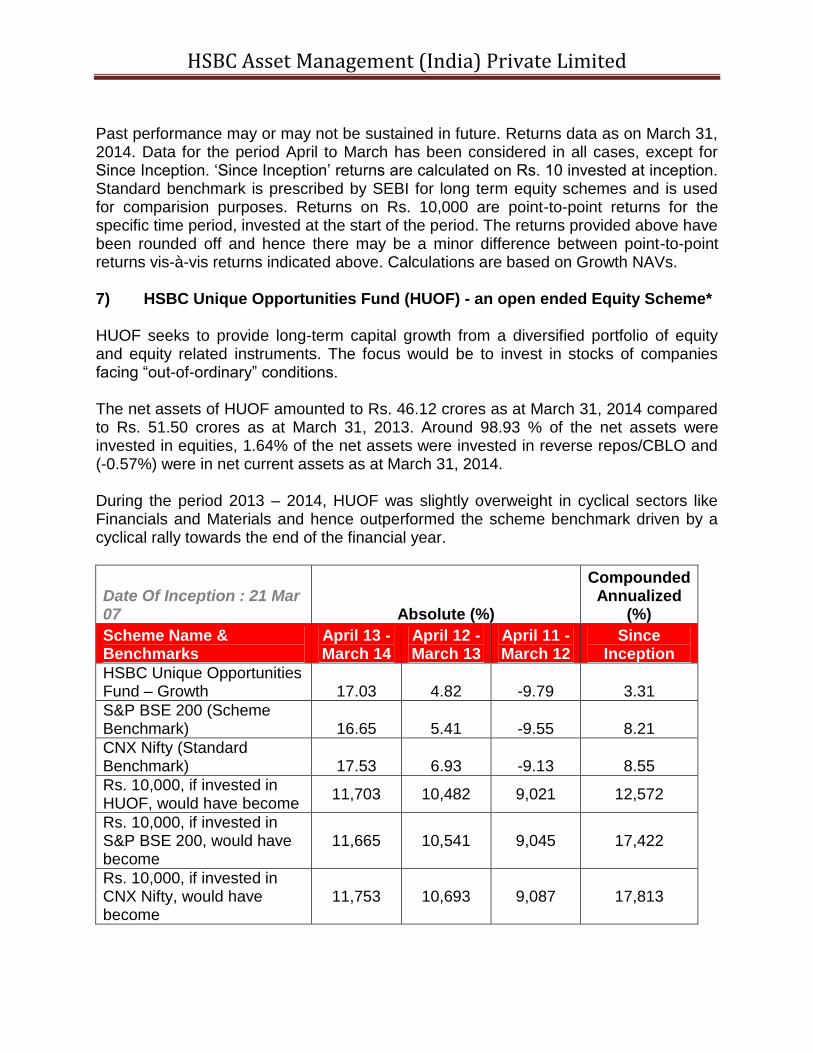
Past performance may or may not be sustained in future. Returns data as on March 31, 2014. Data for the period April to March has been considered in all cases, except for Since Inception. ‘Since Inception’ returns are calculated on Rs. 10 invested at inception. Standard benchmark is prescribed by SEBI for long term equity schemes and is used for comparision purposes. Returns on Rs. 10,000 are point-to-point returns for the specific time period, invested at the start of the period. The returns provided above have been rounded off and hence there may be a minor difference between point-to-point returns vis-à-vis returns indicated above. Calculations are based on Growth NAVs. 7) HSBC Unique Opportunities Fund (HUOF) - an open ended Equity Scheme* HUOF seeks to provide long-term capital growth from a diversified portfolio of equity and equity related instruments. The focus would be to invest in stocks of companies facing “out-of-ordinary” conditions. The net assets of HUOF amounted to Rs. 46.12 crores as at March 31, 2014 compared to Rs. 51.50 crores as at March 31, 2013. Around 98.93 % of the net assets were invested in equities, 1.64% of the net assets were invested in reverse repos/CBLO and (-0.57%) were in net current assets as at March 31, 2014. During the period 2013 – 2014, HUOF was slightly overweight in cyclical sectors like Financials and Materials and hence outperformed the scheme benchmark driven by a cyclical rally towards the end of the financial year.
Date Of Inception : 21 Mar 07 Absolute (%)
Compounded Annualized
(%)
Scheme Name & Benchmarks
April 13 - March 14
April 12 - March 13
April 11 - March 12
Since Inception
HSBC Unique Opportunities Fund – Growth 17.03 4.82 -9.79 3.31
S&P BSE 200 (Scheme Benchmark) 16.65 5.41 -9.55 8.21
CNX Nifty (Standard Benchmark) 17.53 6.93 -9.13 8.55
Rs. 10,000, if invested in HUOF, would have become
11,703 10,482 9,021 12,572
Rs. 10,000, if invested in S&P BSE 200, would have become
11,665 10,541 9,045 17,422
Rs. 10,000, if invested in CNX Nifty, would have become
11,753 10,693 9,087 17,813

HSBC Asset Management (India) Private Limited
Past performance may or may not be sustained in future. Returns data as on March 31, 2014. Data for the period April to March has been considered in all cases, except for Since Inception. ‘Since Inception’ returns are calculated on Rs. 10 invested at inception. Standard benchmark is prescribed by SEBI for long term equity schemes and is used for comparision purposes. Returns on Rs. 10,000 are point-to-point returns for the specific time period, invested at the start of the period. The returns provided above have been rounded off and hence there may be a minor difference between point-to-point returns vis-à-vis returns indicated above. Calculations are based on Growth NAVs. *HUOF is undergoing a change in its investment objective, investment strategy etc. and will be re-named as the HSBC Dividend Yield Equity Fund. The changes being in the nature of fundamental attribute changes, the investors have been notified of the same giving then an option to redeem from the Fund. The change will be effective from July 18, 2014. Kindly refer the notice dated May 26, 2014 (published in Financial Express and Navshakti newspapers dated May 27, 2014 and available on www.assetmanagement.hsbc.com/in) for more details. 8) HSBC Small Cap Fund (HSCF) – an open ended Equity Scheme* HSCF seeks to provide long-term capital appreciation primarily from a diversified portfolio of equity and equity related instruments of small cap companies. The net assets of HSCF amounted to Rs. 15.08 crores as at March 31, 2014 compared to Rs. 13.77 crores as at March 31, 2013. Around 98.21 % of the net assets were invested in equities, 3.92% of the net assets were invested in reverse repos/CBLO and (-2.13%) were in the net current assets as at March 31, 2014. HSCF had shown better performance across different time periods against its scheme benchmark. Stock selection had improved the performance vis-a-vis benchmark. Further, the valuation difference between large and small cap is not justified and unlikely to sustain, thus creating opportunities for better risk-return in mid-small cap segment.
Date Of Inception : 24 Mar 08 Absolute (%)
Compounded Annualized
(%)
Scheme Name & Benchmarks
April 13 - March 14
April 12 - March 13
April 11 - March 12
Since Inception
HSBC Small Cap Fund – Growth 35.67 -6.02 -18.39 2.93
S&P BSE Small Cap (Scheme Benchmark) 19.09 -14.05 -20.74 0.29

HSBC Asset Management (India) Private Limited
Date Of Inception : 24 Mar 08 Absolute (%)
Compounded Annualized
(%)
Scheme Name & Benchmarks
April 13 - March 14
April 12 - March 13
April 11 - March 12
Since Inception
CNX Nifty (Standard Benchmark) 17.53 6.93 -9.13 6.42
Rs. 10,000, if invested in HSCF, would have become
13,567 9,398 8,161 11,903
Rs. 10,000, if invested in S&P BSE Smallcap, would have become
11,909 8,595 7,926 10,175
Rs. 10,000, if invested in CNX Nifty, would have become
11,753 10,693 9,087 14,546
Past performance may or may not be sustained in future. Returns data as on March 31, 2014. Data for the period April to March has been considered in all cases, except for Since Inception. ‘Since Inception’ returns are calculated on Rs. 10 invested at inception. Standard benchmark is prescribed by SEBI for long term equity schemes and is used for comparision purposes. Returns on Rs. 10,000 are point-to-point returns for the specific time period, invested at the start of the period. The returns provided above have been rounded off and hence there may be a minor difference between point-to-point returns vis-à-vis returns indicated above. Calculations are based on Growth NAVs. * HSBC Small Cap Fund merged with HSBC Midcap Equity Fund with effect from April 26, 2014 and consequently ceases to exist. 9) HSBC Income Fund (HIF) – an open-ended Income Scheme HIF seeks to generate reasonable income through a diversified portfolio of fixed income securities. The AMC’s view of interest rate trends and the nature of the plans will be reflected in the type and maturities of securities in which the Short Term and Investment Plans are invested.
The Scheme has two plans – the Investment Plan and the Short Term Plan. The net assets of HSBC Income Fund – Investment Plan (HIF – IP) amounted to Rs. 61.65 crores as at March 31, 2014 as compared to Rs. 89.77 crores as at March 31, 2013. Around 94.86% of the net assets were invested in debt and money market instruments, 1.26% of the net assets were invested in reverse repos/CBLO and 3.88 % were in net current assets as at March 31, 2014. The net assets of HSBC Income Fund – Short Term Plan (HIF – STP) amounted to Rs. 727.27 crores as at March 31, 2014 as

HSBC Asset Management (India) Private Limited
compared to Rs. 1035.16 crores as at March 31, 2013. Around 96.70 % of the net assets were invested in debt and money market instruments, 0.23 % of the net assets were invested in reverse repos/CBLO and 3.07 % were in net current assets as at March 31, 2014.
HIF-IP and HIF – STP underperformed their benchmark due to higher volatility in rates during the year as RBI hiked the short end rates substantially in July 2013 to counter pressure on currency. Although the measures were gradually rolled back, long end of the curve remained anchored to 8.75-9% range due to supply and absence of open market operations.
HIF – IP
Date Of Inception : 10 Dec 02 Simple Annualized (%)
Compounded Annualized
(%)
Scheme Name & Benchmarks
April 13 - March 14
April 12 - March 13
April 11 - March 12
Since Inception
HSBC Income Fund - Investment Plan – Growth 1.85 11.19 8.86 6.65
Crisil Composite Bond Fund Index (Scheme Benchmark) 4.34 9.27 7.68 5.72
Crisil 10 Year Gilt Index (Standard Benchmark) -0.79 11.31 2.41 5.03
Rs. 10,000, if invested in HIF - IP, would have become
10,185 11,119 10,886 20,725
Rs. 10,000, if invested in Crisil Composite Bond Fund Index, would have become
10,434 10,927 10,768 18,767
Rs. 10,000, if invested in Crisil 10 Year Gilt Index, would have become
9,921 11,131 10,241 17,431
HIF – STP
Date Of Inception : 10 Dec 02 Simple Annualized (%)
Compounded Annualized
(%)
Scheme Name & Benchmarks
April 13 - March 14
April 12 - March 13
April 11 - March 12
Since Inception
HSBC Income Fund - S T P – Growth 7.23 9.26 8.41 6.80
Crisil Short Term Bond Fund Index (Scheme 8.79 9.09 8.28 6.64

HSBC Asset Management (India) Private Limited
Date Of Inception : 10 Dec 02 Simple Annualized (%)
Compounded Annualized
(%)
Scheme Name & Benchmarks
April 13 - March 14
April 12 - March 13
April 11 - March 12
Since Inception
Benchmark)
Crisil 1 Year T-Bill Index (Standard Benchmark) 5.78 8.37 6.59 5.44
Rs. 10,000, if invested in HIF -ST, would have become
10,723 10,926 10,841 21,047
Rs. 10,000, if invested in Crisil Short Term Bond Fund Index, would have become
10,879 10,909 10,828 20,691
Rs. 10,000, if invested in Crisil 1 Year T-Bill Index, would have become
10,578 10,837 10,659 18,205
Past performance may or may not be sustained in future. Returns data as on March 31, 2014. Data for the period April to March has been considered in all cases, except for Since Inception. ‘Since Inception’ returns are calculated on Rs. 10 invested at inception. Standard benchmark is prescribed by SEBI for long term equity schemes and is used for comparision purposes. Returns on Rs. 10,000 are point-to-point returns for the specific time period, invested at the start of the period. The returns provided above have been rounded off and hence there may be a minor difference between point-to-point returns vis-à-vis returns indicated above. Calculations are based on Growth NAVs. 10) HSBC Gilt Fund (HGF) – an open-ended Gilt Scheme HGF seeks to generate reasonable returns through investments in Government Securities of various maturities. The AMC’s view of interest rate trends will be reflected in the maturities of securities in which the scheme is invested. The net assets of HGF amounted to Rs. 2.64 crores as at March 31, 2014 as compared to Rs. 2.20 crores as at March 31, 2013. Around 28.54% of the net assets were invested in reverse repos/CBLO and 69.24 % were invested in government securities and 2.22 % were in net current assets as at March 31, 2014. HGF underperformed its benchmark due to higher volatility in rates during the year as RBI hiked the short end rates substantially in July 2013 to counter pressure on currency. Although the measures were gradually rolled back, long end of the curve

HSBC Asset Management (India) Private Limited
remained anchored to 8.75-9% range due to supply and absence of open market operations.
Date Of Inception : 05 Dec 03 Simple Annualized (%)
Compounded Annualized
(%)
Scheme Name & Benchmarks
April 13 - March 14
April 12 - March 13
April 11 - March 12
Since Inception
HSBC Gilt Fund - Growth 1.99 12.37 8.15 4.30
I-Sec Composite Bond Fund Index (Scheme Benchmark) 3.95 11.71 6.77 6.50
Crisil 10 Year Gilt Index (Standard Benchmark) -0.79 11.31 2.41 4.20
Rs. 10,000, if invested in HGF, would have become
10,199 11,237 10,815 15,453
Rs. 10,000, if invested in I-Sec Composite Bond Fund Index, would have become
10,395 11,171 10,677 19,156
Rs. 10,000, if invested in Crisil 10 Year Gilt Index, would have become
9,921 11,131 10,241 15,295
Past performance may or may not be sustained in future. Returns data as on March 31, 2014. Data for the period April to March has been considered in all cases, except for Since Inception. ‘Since Inception’ returns are calculated on Rs. 10 invested at inception. Standard benchmark is prescribed by SEBI for long term equity schemes and is used for comparision purposes. Returns on Rs. 10,000 are point-to-point returns for the specific time period, invested at the start of the period. The returns provided above have been rounded off and hence there may be a minor difference between point-to-point returns vis-à-vis returns indicated above. Calculations are based on Growth NAVs 11) HSBC Floating Rate Fund – Long Term Plan (HFRF – LTP) – an open-ended
Income Scheme HFRF seeks to generate reasonable return with commensurate risk from a portfolio comprised of floating rate debt instruments and fixed rate debt instruments swapped for floating rate returns. The scheme may also invest in fixed rate money market and debt instruments. The net assets of the HFRF - LTP amounted to Rs. 112.48 crores as at March 31, 2014 as compared to Rs. 232.34 crores as at March 31, 2013. Around 99.94% of the net assets were invested in money market instruments, 0.48% was invested in reverse repos/CBLO and (-0.42%) were in net current assets as at March 31, 2014.

HSBC Asset Management (India) Private Limited
HFRF-LTP performed close to its benchmark by focusing on accruals and investing in the shorter-end of the yield curve. Short end yield curve also faced higher volatility in rates during the year as RBI hiked the short end rates substantially in July 2013 to counter pressure on currency.
Date Of Inception : 16 Nov 04 Simple Annualized (%)
Compounded Annualized
(%)
Scheme Name & Benchmarks
April 13 - March 14
April 12 - March 13
April 11 - March 12
Since Inception
HSBC FRF - LTP – Growth 9.21 9.17 9.38 7.68
Crisil Liquid Fund Index (Scheme Benchmark) 9.46 8.22 8.45 6.96
Crisil 1 Year T-Bill Index (Standard Benchmark) 5.78 8.37 6.59 5.67
Rs. 10,000, if invested HFRF - LTP, would have become
10,921 10,917 10,938 20,014
Rs. 10,000, if invested in Crisil Liquid Fund Index, would have become
10,946 10,822 10,845 18,798
Rs. 10,000, if invested in Crisil 1 Year T-Bill Index, would have become
10,578 10,837 10,659 16,776
Past performance may or may not be sustained in future. Returns data as on March 31, 2014. Data for the period April to March has been considered in all cases, except for Since Inception. ‘Since Inception’ returns are calculated on Rs. 10 invested at inception. Standard benchmark is prescribed by SEBI for long term equity schemes and is used for comparision purposes. Returns on Rs. 10,000 are point-to-point returns for the specific time period, invested at the start of the period. The returns provided above have been rounded off and hence there may be a minor difference between point-to-point returns vis-à-vis returns indicated above. Calculations are based on Growth NAVs. 12) HSBC Cash Fund (HCF) – an open-ended Liquid Scheme* HCF aims to provide reasonable returns, commensurate with low risk while providing a high level of liquidity, through a portfolio of money market and debt securities. The net assets of HCF amounted to Rs. 1394.74 crores as at March 31, 2014 as compared to Rs. 469.01 crores as at March 31, 2013. The entire net asset remains

HSBC Asset Management (India) Private Limited
invested in debt and money market instruments including reverse repos/CBLO as at March 31, 2014. HCF performed broadly in line with its benchmark for a year due to conservative investments in line with the internal guidelines alongwith focus on accruals and credits.
Date Of Inception : 04 Dec 02 Simple Annualized (%)
Compounded Annualized
(%)
Scheme Name & Benchmarks
Last 7 Days as
on 31 March 2014
Last 15 Days as on
31 March 2014
Last 30 Days as
on 31 March 2014
April 13 - March
14 Since
Inception
HSBC Cash Fund – Growth 10.31 9.92 9.44 9.42 8.98
Crisil Liquid Fund Index (Scheme Benchmark) 13.20 12.94 11.69 9.46 8.76
Crisil 91 Day T-Bill Index (Standard Benchmark) 12.05 11.69 10.15 8.55 8.24
Rs. 10,000, if invested in HCF, would have become
10,020 10,041 10,078 10,942 12,802
Rs. 10,000, if invested in Crisil Liquid Fund Index, would have become
10,025 10,053 10,096 10,946 12,727
Rs. 10,000, if invested in Crisil 91 Day T-Bill Index, would have become
10,023 10,048 10,083 10,855 12,554
Past performance may or may not be sustained in future. Returns data as on March 31, 2014. Data for the period April to March has been considered in all cases, except for Since Inception. ‘Since Inception’ returns are calculated on Rs. 10 invested at inception. Standard benchmark is prescribed by SEBI for long term equity schemes and is used for comparision purposes. Returns on Rs. 10,000 are point-to-point returns for the specific time period, invested at the start of the period. The returns provided above have been rounded off and hence there may be a minor difference between point-to-point returns vis-à-vis returns indicated above. Calculations are based on Growth NAVs.

HSBC Asset Management (India) Private Limited
* Pursuant to SEBI circular dated Sept 13, 2012, certain plans/options within the schemes have been discontinued to comply with a single plan structure. Since there was no continuous NAV history available for the surviving plan prior to 19 May 2011, returns since the said date have been considered for calculating performance. The inception date of HSBC Cash Fund however is December 04, 2002.
13) HSBC Ultra Short Term Bond Fund (HUSBF) – an open ended Debt Scheme HUSBF seeks to provide liquidity and reasonable returns by investing primarily in a mix of short term debt and money market instruments. The net assets of HUSBF amounted to Rs. 153.71 crores as at March 31, 2014 as compared to Rs. 45.73 crores as at March 31, 2013. Around 95.64% of the net assets were invested in debt and money market instruments, 4.38% were invested in reverse repos/CBLO and (-0.02%) were in net current assets as at March 31, 2014. HUSBF outperformed its benchmark due to focus on better placed positions on the yield curve. HUSBF also faced higher volatility in rates during the year as RBI hiked the short end rates substantially in July 2013 to counter pressure on currency.
Date Of Inception : 17 Oct 06
Simple Annualized
(%) Compounded
Annualized (%)
Scheme Name & Benchmarks April 13 - March 14 Since Inception
HSBC Ultra Short Term Bond Fund - Growth $ 9.04 8.91
Customized Benchmark Index (Scheme Benchmark)* 8.60 8.18
Crisil 1 Year T-Bill Index (Standard Benchmark) 5.78 6.59
Rs. 10,000, if invested in HUSTBF, would have become
10,904 11,365
Rs. 10,000, if invested in Customized Benchmark Index, would have become
10,860 11,250
Rs. 10,000, if invested in Crisil 1 Year T-Bill Index, would have become
10,578 11,004
Past performance may or may not be sustained in future. Returns data as on March 31, 2014. Data for the period April to March has been considered in all cases, except for Since Inception. ‘Since Inception’ returns are calculated on Rs. 10 invested at inception. Standard benchmark is prescribed by SEBI for long term equity schemes and is used

HSBC Asset Management (India) Private Limited
for comparision purposes. Returns on Rs. 10,000 are point-to-point returns for the specific time period, invested at the start of the period. The returns provided above have been rounded off and hence there may be a minor difference between point-to-point returns vis-à-vis returns indicated above. Calculations are based on Growth NAVs. $Pursuant to SEBI circular dated Sept 13, 2012, certain plans/options within the schemes have been discontinued to comply with a single plan structure. Since there was no continuous NAV history available for the surviving plan prior to 1 October 2012, returns since the said date have been considered for calculating performance ‘Since Inception’. The inception date of HSBC Ultra Short Term Bond Fund however is October 17, 2006. *Composite index of Crisil Liquid Fund Index (90%) and Crisil Short Term Bond Fund Index (10%). 14) HSBC Flexi Debt Fund (HFDF) – an open ended Debt Scheme HFDF seeks to deliver returns in the form of interest income and capital gains, along with high liquidity, commensurate with the current view on the markets and the interest rate cycle, through active investment in debt and money market instruments. The net assets of HFDF amounted to Rs. 540.42 crores as at March 31, 2014 as compared to Rs.792.49 crores as at March 31, 2013. Around 97.11% of the net assets were invested in debt and money market instruments, 0.18% was invested in reverse repos/CBLO and 2.71% were in the net current assets as at March 31, 2014. HFDF underperformed its benchmark due to higher volatility in rates during the year as RBI hiked the short end rates substantially in July 2013 to counter pressure on currency. Although the measures were gradually rolled back, long end of the curve remained anchored to 8.75-9% range due to supply and absence of open market operations.
Date Of Inception : 05 Oct 07 Simple Annualized (%)
Compounded Annualized
(%)
Scheme Name & Benchmarks
April 13 - March 14
April 12 - March 13
April 11 - March 12
Since Inception
HSBC Flexi Debt Fund – Growth 3.69 11.26 9.54 8.38
Crisil Composite Bond Fund Index (Scheme Benchmark) 4.34 9.27 7.68 6.54
Crisil 10 Year Gilt Index (Standard Benchmark) -0.79 11.31 2.41 5.49

HSBC Asset Management (India) Private Limited
Date Of Inception : 05 Oct 07 Simple Annualized (%)
Compounded Annualized
(%)
Scheme Name & Benchmarks
April 13 - March 14
April 12 - March 13
April 11 - March 12
Since Inception
Rs. 10,000, if invested in HFDF, would have become
10,369 11,126 10,954 16,862
Rs. 10,000, if invested in Crisil Composite Bond Fund Index, would have become
10,434 10,927 10,768 15,091
Rs. 10,000, if invested in Crisil 10 Year Gilt Index, would have become
9,921 11,131 10,241 14,147
Past performance may or may not be sustained in future. Returns data as on March 31, 2014. Data for the period April to March has been considered in all cases, except for Since Inception. ‘Since Inception’ returns are calculated on Rs. 10 invested at inception. Standard benchmark is prescribed by SEBI for long term equity schemes and is used for comparision purposes. Returns on Rs. 10,000 are point-to-point returns for the specific time period, invested at the start of the period. The returns provided above have been rounded off and hence there may be a minor difference between point-to-point returns vis-à-vis returns indicated above. Calculations are based on Growth NAVs. 15) HSBC MIP (HMIP) – an open-ended Fund (Monthly income is not assured and is subject to availability of distributable surplus.) HMIP is an open-ended fund which seeks to generate reasonable returns through investments in Debt and Money Market Instruments. The secondary objective of the scheme is to invest in equity and equity related instruments to seek capital appreciation. The scheme offers two plans: Regular Plan and Savings Plan. The Regular Plan can have up to 15% of the corpus invested in equities while the Savings Plan can have up to 25 % invested in equities. The net assets of HMIP – Regular Plan (HMIP – R) amounted to Rs. 111.44 crores as at March 31, 2014 as compared to Rs. 190.42 crores as at March 31, 2013. Around 82.16% of the net assets were invested in debt and money market instruments & 15.29% of the net assets were invested in equities as at March 31, 2014. The net assets of HMIP – Savings Plan (HMIP – S) amounted to Rs. 186.36 crores as at March 31, 2014 as compared to Rs. 317.36 crores as at March 31, 2013. Around 71.55% of the net assets were invested in debt and money market instruments & 26.60% % of the net assets were invested in equities as at March 31, 2014. HMIP-R and HMIP-S also faced higher volatility in rates during the year as RBI hiked the short end rates substantially in July 2013 to counter pressure on currency. Although

HSBC Asset Management (India) Private Limited
the measures were gradually rolled back, long end of the curve remained anchored to 8.75-9% range due to supply and absence of open market operations. HMIP – Regular Plan
Date Of Inception : 24 Feb 04 Simple Annualized (%)
Compounded Annualized
(%)
Scheme Name & Benchmarks
April 13 - March 14
April 12 - March 13
April 11 - March 12
Since Inception
HSBC MIP - Regular Plan – Growth 6.60 10.07 5.20 7.67
Crisil MIP Blended Index (Scheme Benchmark) 6.42 9.09 5.26 7.12
Crisil 1 Year T-Bill Index (Standard Benchmark) 5.78 8.37 6.59 5.45
Crisil 10 Year Gilt Index (Standard Benchmark) -0.79 11.31 2.41 4.21
Rs. 10,000, if invested in HMIP - R, would have become
10,660 11,007 10,520 21,103
Rs. 10,000, if invested in Crisil MIP Blended Index, would have become
10,642 10,909 10,526 20,049
Rs. 10,000, if invested in Crisil 1 Year T-Bill Index, would have become
10,578 10,837 10,659 17,090
Rs. 10,000, if invested in Crisil 10 Year Gilt Index, would have become
9,921 11,131 10,241 15,170
Past performance may or may not be sustained in future. Returns data as on March 31, 2014. Data for the period April to March has been considered in all cases, except for Since Inception. ‘Since Inception’ returns are calculated on Rs. 10 invested at inception. Standard benchmark is prescribed by SEBI for long term equity schemes and is used for comparision purposes. Returns on Rs. 10,000 are point-to-point returns for the specific time period, invested at the start of the period. The returns provided above have been rounded off and hence there may be a minor difference between point-to-point returns vis-à-vis returns indicated above. Calculations are based on Growth NAVs.

HSBC Asset Management (India) Private Limited
HMIP – Savings Plan
Date Of Inception : 24 Feb 04 Simple Annualized (%)
Compounded Annualized
(%)
Scheme Name & Benchmarks
April 13 - March 14
April 12 - March 13
April 11 - March 12
Since Inception
HSBC MIP - Savings Plan – Growth 8.99 10.74 4.94 9.30
Crisil MIP Blended Index (Scheme Benchmark) 6.42 9.09 5.26 7.12
Crisil 1 Year T-Bill Index (Standard Benchmark) 5.78 8.37 6.59 5.45
Crisil 10 Year Gilt Index (Standard Benchmark) -0.79 11.31 2.41 4.21
Rs. 10,000, if invested in HMIP - S, would have become
10,899 11,074 10,494 24,561
Rs. 10,000, if invested in Crisil MIP Blended Index, would have become
10,642 10,909 10,526 20,049
Rs. 10,000, if invested in Crisil 1 Year T-Bill Index, would have become
10,578 10,837 10,659 17,090
Rs. 10,000, if invested in Crisil 10 Year Gilt Index, would have become
9,921 11,131 10,241 15,170
Past performance may or may not be sustained in future. Returns data as on March 31, 2014. Data for the period April to March has been considered in all cases, except for Since Inception. ‘Since Inception’ returns are calculated on Rs. 10 invested at inception. Standard benchmark is prescribed by SEBI for long term equity schemes and is used for comparision purposes. Returns on Rs. 10,000 are point-to-point returns for the specific time period, invested at the start of the period. The returns provided above have been rounded off and hence there may be a minor difference between point-to-point returns vis-à-vis returns indicated above. Calculations are based on Growth NAVs. 16) HSBC Fixed Term Series – a close ended Income Scheme The scheme seeks to generate returns by investing in a portfolio of fixed income instruments which mature on or before the maturity date of the plans under the scheme.

HSBC Asset Management (India) Private Limited
Details of schemes launched during the period are provided below -
Name of Scheme Date of Launch
HSBC Fixed Term Series 91 August 01, 2013
HSBC Fixed Term Series 94 August 16, 2013
HSBC Fixed Term Series 95 August 23, 2013
HSBC Fixed Term Series 98 October 14, 2013
HSBC Fixed Term Series 97 October 24, 2013
HSBC Fixed Term Series 99 November 08, 2013
HSBC Fixed Term Series 100 November 27, 2013
HSBC Fixed Term Series 101 January 15, 2014
HSBC Fixed Term Series 105 February 05, 2014
HSBC Fixed Term Series 106 February 24, 2014
HSBC Fixed Term Series 107 March 06, 2014
HSBC Fixed Term Series 109 March 24, 2014
HSBC Fixed Term Series 102 April 28, 2014
Being close ended fixed maturity plans, the performance of these schemes are not provided. 17) HSBC Capital Protection Oriented Fund – a close ended Capital Protection
Oriented Scheme The scheme seeks protection of capital by investing a portion of the portfolio in high quality debt securities and money market instruments and also to provide capital appreciation by investing in equities through NIFTY (Index) Call Options. The scheme launched one plan namely, HSBC Capital Protection Oriented Fund – Series I – Plan I having a tenure of 790 days. HSBC Capital Oriented Protection Fund – Series I – Plan I was launched on April 18, 2013. The performance of the scheme is benchmarked against CRISIL MIP Blended Index. Being a close ended scheme, the performance of the scheme is not provided.
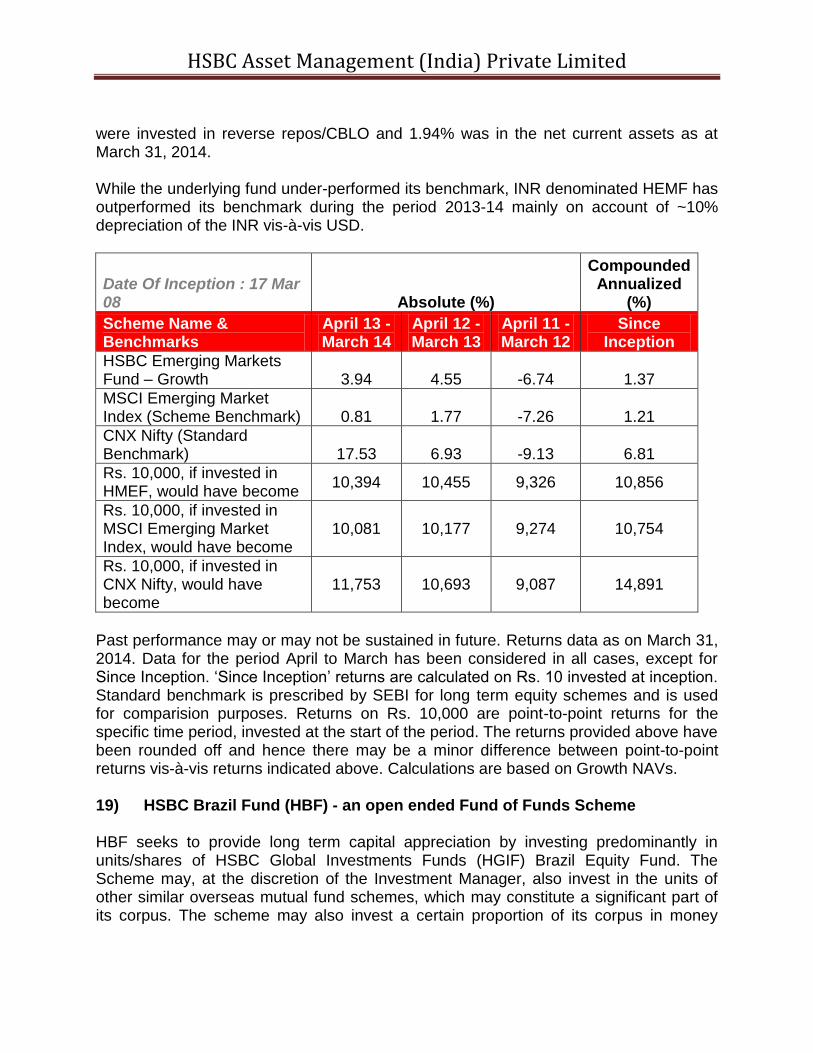
18) HSBC Emerging Markets Fund (HEMF) - an open-ended Scheme HEMF seeks to provide long term capital appreciation by investing in India and in the emerging markets, in equity and equity related instruments, share classes and units/securities issued by overseas mutual funds or unit trusts. The fund may also invest a limited proportion in debt and money market instruments. The net assets of HEMF amounted to Rs. 14.47 crores as at March 31, 2014 compared to Rs. 19.11 crores as at March 31, 2013. Around 97.56% of the net assets were invested in HSBC GEM Equity Fund (overseas mutual fund), 0.50% of the net assets
HSBC Asset Management (India) Private Limited
were invested in reverse repos/CBLO and 1.94% was in the net current assets as at March 31, 2014. While the underlying fund under-performed its benchmark, INR denominated HEMF has outperformed its benchmark during the period 2013-14 mainly on account of ~10% depreciation of the INR vis-à-vis USD.
Date Of Inception : 17 Mar 08 Absolute (%)
Compounded Annualized
(%)
Scheme Name & Benchmarks
April 13 - March 14
April 12 - March 13
April 11 - March 12
Since Inception
HSBC Emerging Markets Fund – Growth 3.94 4.55 -6.74 1.37
MSCI Emerging Market Index (Scheme Benchmark) 0.81 1.77 -7.26 1.21
CNX Nifty (Standard Benchmark) 17.53 6.93 -9.13 6.81
Rs. 10,000, if invested in HMEF, would have become
10,394 10,455 9,326 10,856
Rs. 10,000, if invested in MSCI Emerging Market Index, would have become
10,081 10,177 9,274 10,754
Rs. 10,000, if invested in CNX Nifty, would have become
11,753 10,693 9,087 14,891
Past performance may or may not be sustained in future. Returns data as on March 31, 2014. Data for the period April to March has been considered in all cases, except for Since Inception. ‘Since Inception’ returns are calculated on Rs. 10 invested at inception. Standard benchmark is prescribed by SEBI for long term equity schemes and is used for comparision purposes. Returns on Rs. 10,000 are point-to-point returns for the specific time period, invested at the start of the period. The returns provided above have been rounded off and hence there may be a minor difference between point-to-point returns vis-à-vis returns indicated above. Calculations are based on Growth NAVs. 19) HSBC Brazil Fund (HBF) - an open ended Fund of Funds Scheme HBF seeks to provide long term capital appreciation by investing predominantly in units/shares of HSBC Global Investments Funds (HGIF) Brazil Equity Fund. The Scheme may, at the discretion of the Investment Manager, also invest in the units of other similar overseas mutual fund schemes, which may constitute a significant part of its corpus. The scheme may also invest a certain proportion of its corpus in money

HSBC Asset Management (India) Private Limited
market instruments and /or units of liquid mutual fund schemes, in order to meet liquidity requirements from time to time. The net assets of HBF amounted to Rs. 94.05 crores as at March 31, 2014 compared to Rs. 184.79 crores as at March 31, 2013. Around 99.05 % of the net assets were invested in HSBC Brazil Equity Fund (overseas mutual fund), 1.11% of the net assets were invested in reverse repos/CBLO and (-0.16%) were in the net current assets as at March 31, 2014. HBF had outperformed its scheme benchmark during the period 2013-14 mainly on account of depreciation of the INR vis-à-vis the USD.
Date Of Inception : 06 May 11 Absolute (%)
Compounded Annualized
(%)
Scheme Name & Benchmarks April 13 - March 14
April 12 - March
13 Since
Inception
HSBC Brazil Fund – Growth -11.37 -2.50 -4.90
MSCI Brazil 10/40 Index (Scheme Benchmark) -14.46 -14.53 -13.38
CNX Nifty (Standard Benchmark) 17.53 6.93 6.71
Rs. 10,000, if invested in HBF, would have become
8,863 9,750 8,642
Rs. 10,000, if invested in MSCI Brazil 10/40 Index, would have become
8,554 8,547 6,587
Rs. 10,000, if invested in CNX Nifty, would have become
11,753 10,693 12,079
Past performance may or may not be sustained in future. Returns data as on March 31, 2014. Data for the period April to March has been considered in all cases, except for Since Inception. ‘Since Inception’ returns are calculated on Rs. 10 invested at inception. Standard benchmark is prescribed by SEBI for long term equity schemes and is used for comparision purposes. Returns on Rs. 10,000 are point-to-point returns for the specific time period, invested at the start of the period. The returns provided above have been rounded off and hence there may be a minor difference between point-to-point returns vis-à-vis returns indicated above. Calculations are based on Growth NAVs. All returns have been sourced from Mutual Funds India Explorer software unless otherwise stated. With regard to equity schemes (including the equity component of MIPs), fund performance is calculated on a total return basis (i.e. it includes dividends re-invested) while the benchmark is calculated on a price return basis (i.e. it does not consider dividends re-invested).

HSBC Asset Management (India) Private Limited
20) HSBC Asia Pacific (Ex Japan) Dividend Yield Fund (HAPDF) – an open ended Fund of Funds Scheme
HAPDF seeks to provide long term capital appreciation by investing predominantly in units of HSBC Global Investment Funds (HGIF) Asia Pacific Ex Japan Equity High Dividend Fund (HEHDF). The Scheme may, also invest a certain proportion of its corpus in money market instruments and / or units of liquid mutual fund schemes, in order to meet liquidity requirements from time to time. However, there is no assurance that the investment objective of the Scheme will be achieved. The net assets of HADPF amounted to Rs. 56.26 crores as at March 31, 2014. Around 97.42 % of the net assets were invested in HSBC Global Investment Funds (HGIF) Asia Pacific Ex Japan Equity High Dividend Fund (overseas mutual fund), 2.78% of the net assets were invested in reverse repos/CBLO and (-0.20%) were in the net current assets as at March 31, 2014. The scheme was launched on February 03, 2014. The performance of the scheme is benchmarked against MSCI AC Asia Pacific Ex Japan. Performance data has not been provided as the scheme has not completed 1 year period from its launch. 21) HSBC Managed Solution (HMS) – an open ended Fund of Funds Scheme HMS seeks to provide long term total return primarily by seeking capital appreciation through an active asset allocation with diversification commensurate with the risk profile of investments by investing predominantly in units of equity mutual funds as well as in a basket of debt mutual funds gold exchange traded funds (ETFs) and other ETFs, offshore mutual funds and money market instruments. The scheme has three plans namely, HMS – Growth Plan, HMS – Moderate Plan and HMS – Conservative Plan. The scheme was launched on April 09, 2014. The performance of HMS – Growth Plan is benchmarked against Composite Index constituting 80% of BSE 200 Index and 20% of CRISIL Composite Bond Index while the performance of HMS – Moderate Plan is benchmarked against CRICIL Balanced Fund Index. The performance of HMS – Conservative Plan is benchmarked against Composite Index constituting of 90% into CRISIL Composite Bond Index and 10% of BSE 200 Index. Performance data has not been provided as the scheme has not completed 1 year period from its launch. 4. INVESTOR SERVICES The number of official points of acceptance of transactions is 198 locations. In addition to the offices of the Registrar & Transfer agents, the AMC has Investor Service Centres in 5 locations at its own offices - namely Mumbai, New Delhi, Kolkata, Bangalore and

HSBC Asset Management (India) Private Limited
Chennai. With a view to enhance customer convenience, the AMC has extended the facility of priority based servicing to key distributors through the enhancement of the Interactive Voice Reponses. Call Center number has now been converted to a single Toll Free number which can be dialed from anywhere in India. The call center service is being managed by the Registrar and Transfer Agents. The AMC continues to retain the outsourced back office services with HSBC Electronic Data Processing India Private Limited. On the distribution front, the number of empanelled distributors was 664 as on March 31, 2014. During the year, the AMC initiated tie-ups for online distribution of the Mutual Fund’s schemes with several channel partners taking the total number of such tie-ups to 46. 5. DIRECTORS Mr. Dinesh Kumar Mittal was appointed as a Director of HSBC Asset Management (India) Private Limited w.e.f. February 05, 2014. As required by the Securities and Exchange Board of India (Mutual Funds) Regulations, 1996, the Board of Directors of the Company comprises 50% directors who are not associate of or associated in any manner with, the Sponsor of HSBC Mutual Fund (HSBC Securities and Capital Markets (India) Private Limited) or any of its subsidiaries or the Trustees of HSBC Mutual Fund. Directors’ Responsibility Statement The Directors confirm that: (i) in the preparation of the annual accounts, the applicable accounting standards
have been followed along with proper explanation relating to material departures; (ii) the accounting policies have been consistently applied and reasonable and
prudent judgement and estimates have been made so as to give a true and fair view of the state of affairs of the Company as at March 31, 2014 and of the profit or loss of the Company for the Financial Year ended March 31, 2014;
(iii) proper and sufficient care for the maintenance of adequate accounting records in accordance with the provisions of the Companies Act, 1956 has been taken for safeguarding the assets of the Company and for preventing and detecting fraud and other irregularities; and
(iv) the annual accounts have been prepared on a going concern basis.

HSBC Asset Management (India) Private Limited
6. PERSONNEL Particulars of employees required under section 217(2A) of the Companies Act, 1956 read with the Companies (Particulars of Employees) Rules, 1975 are given in the Annexure forming part of this Report. 7. CONSERVATION OF ENERGY, TECHNOLOGY ABSORPTION AND
FOREIGN EXCHANGE EARNINGS AND OUTGO As the Company is the asset management company to HSBC Mutual Fund and provides portfolio management services, no reporting in respect of conservation of energy and technology absorption is required. Information regarding foreign exchange earnings and outgo is contained in points 20.2 and 20.3 of the Notes to the financial statements. 8. AUDITORS M/s B S R & Associates retire as auditors at the ensuing annual general meeting and are eligible for reappointment. By authority of the Board Sd/- Sd/-
Naina Lal Kidwai Puneet Chaddha Chairperson Whole Time Director & Chief Executive Officer Place: Mumbai Mutual Fund investments are subject to market risks, read all scheme related documents carefully.

HSBC Asset Management (India) Private Limited
Financial statementstogether with Auditors’ Reportfor the year ended 31 March 2014

HSBC Asset Management (India) Private Limited
Financial statements together with Auditors’ Reportfor the year ended 31 March 2014
Contents Pages
Auditors’ Report 3 – 7
Balance sheet 8
Statement of profit and loss 9
Cash flow statement 10 – 11
Schedules to the financial statements 12 – 25

Independent Auditors’ Report
To the Members of HSBC Asset Management (India) Private Limited Report on the Financial Statements
We have audited the accompanying financial statements of HSBC Asset Management (India) Private Limited (‘the Company’), which comprises the balance sheet as at 31 March 2014, the statement of profit and loss and the cash flow statement for the year then ended, and a summary of significant accounting policies and other explanatory information.
Management’s Responsibility for the Financial Statements
The Management is responsible for the preparation of these financial statements that give a true and fair view of the financial position, financial performance and cash flows of the Company in accordance with the Accounting Standards referred to in sub-section (3C) of section 211 of the Companies Act, 1956 (‘the Act’). This responsibility includes the design, implementation and maintenance of internal control relevant to the preparation and presentation of the financial statements that give a true and fair view and are free from material misstatement, whether due to fraud or error.
Auditor’s Responsibility
Our responsibility is to express an opinion on these financial statements based on our audit. We conducted our audit in accordance with the Standards on Auditing issued by the Institute of Chartered Accountants of India. Those Standards require that we comply with ethical requirements and plan and perform the audit to obtain reasonable assurance about whether the financial statements are free from material misstatement.
An audit involves performing procedures to obtain audit evidence about the amounts and disclosures in the financial statements. The procedures selected depend on the auditor’s judgment, including the assessment of the risks of material misstatement of the financial statements, whether due to fraud or error. In making those risk assessments, the auditor considers internal control relevant to the Company’s preparation and fair presentation of the financial statements in order to design audit procedures that are appropriate in the circumstances, but not for the purpose of expressing an opinion on the effectiveness of the Company’s internal control. An audit also includes evaluating the appropriateness of accounting policies used and the reasonableness of the accounting estimates made by management, as well as evaluating the overall presentation of the financial statements. We believe that the audit evidence we have obtained is sufficient and appropriate to provide a basis for our audit opinion.
Opinion
In our opinion and to the best of our information and according to the explanations given to us, the financial statements give the information required by the Act in the manner so required and give a true and fair view in conformity with the accounting principles generally accepted in India: (a) in the case of the balance sheet, of the state of affairs of the Company as at 31 March 2014; (b) in the case of the statement of profit and loss, of the loss for the year ended on that date;
and (c) in the case of the cash flow statement, of the cash flows for the year ended on that date.
3
Independent Auditors’ Report (Continued) HSBC Asset Management (India) Private Limited Report on Other Legal and Regulatory Requirements
1. As required by the Companies (Auditor’s Report) Order, 2003 (“the Order”), as amended, issued by the Central Government of India in terms of sub-section (4A) of section 227 of the Act, we give in the Annexure a statement on the matters specified in paragraphs 4 and 5 of the said Order.
2. As required by section 227(3) of the Act, we report that:
a. we have obtained all the information and explanations which to the best of our knowledge and belief were necessary for the purpose of our audit;
b. in our opinion proper books of account as required by law have been kept by the Company so far as appears from our examination of those books;
c. the balance sheet, the statement of profit and loss and the cash flow statement dealt with by this report are in agreement with the books of account;
d. in our opinion, the balance sheet, the statement of profit and loss and the cash flow statement comply with the Accounting Standards referred to in subsection (3C) of section 211 of the Companies Act, 1956; and
e. on the basis of written representations received from the directors as on 31 March 2014, and taken on record by the Board of Directors, none of the directors is disqualified as on 31 March 2014, from being appointed as a director in terms of clause (g) of sub-section (1) of section 274 of the Companies Act, 1956.
For B S R & Associates LLP Chartered Accountants Firm's Registration No: 116231W/W-100024 Sd/- N Sampath Ganesh Mumbai Partner 11 August 2014 Membership No: 042554
4
HSBC Asset Management (India) Private Limited Annexure to Independent Auditors’ Report - 31 March 2014 (Referred to in our report of even date)
(i) (a) The Company has maintained proper records showing full particulars, including quantitative details and situation of fixed assets.
(b) The Company has a regular programme of physical verification of its fixed assets by which all fixed assets are verified on yearly basis. In our opinion, this periodicity of physical verification is reasonable having regard to the size of the Company and the nature of its assets. No material discrepancies were noticed on such verification.
(c) Fixed assets disposed during the year do not affect the going concern assumption.
(ii) The Company is a service company primarily rendering asset management services and portfolio management services. Accordingly it does not hold any physical inventories. Thus, paragraph 4(ii) of the Order is not applicable.
(iii) The Company has neither granted nor taken any loans, secured or unsecured, to or from Companies, firms or other parties covered in the register maintained under Section 301 of the Companies Act, 1956.
(iv) In our opinion, and according to the information and explanations given to us, there is an adequate internal control system commensurate with the size of the Company and the nature of its business, with regard to purchase of fixed assets and sale of services. We have not observed continuing failure by the Company to correct major weakness in the internal control system in regard to above, during the course of the audit.
(v) (a) In our opinion and according to the information and explanation given to us, the particulars of contracts or arrangements referred to in Section 301 of the Companies Act, 1956 have been entered in the register required to be maintained under that section.
(b) In our opinion, and according to the information and explanations given to us, the transactions made in pursuance of contracts and arrangements referred to in (a) above and exceeding the value of Rs. 5 lakh with a party during the year have been made at a price which is reasonable having regard to the prevailing market prices at the relevant time.
(vi) According to the information and explanations given to us, the Company has not accepted any deposits from the public to which the directives issued by the Reserve Bank of India and the provisions of Section 58A, Section 58AA or any other relevant provisions of the Act and the rules framed there under apply.
(vii) In our opinion, the Company has an internal audit system commensurate with its size and nature of business.
(viii) The Central Government has not prescribed the maintenance of cost records under section 209(1) (d) of the Act for any of the activities conducted/services rendered by the Company. Accordingly para 4(viii) of the Order is not applicable.
5

HSBC Asset Management (India) Private Limited Annexure to Independent Auditors’ Report - 31 March 2014 (Continued) (ix) (a) According to the information and explanations given to us and on the basis of our
examination of the records of the Company, amounts deducted/accrued in the books of account in respect of undisputed statutory dues including provident fund, income tax, professional tax, service tax and other material statutory dues have been generally regularly deposited during the year except for few instances of delays in depositing dues of income taxes of an employee with the appropriate authorities. As explained to us, the Company did not have any dues on account of employees’ state insurance, sales tax, wealth tax, custom duty, excise duty, cess and investor education and protection fund.
(b) According to the information and explanations given to us, no undisputed amounts payable in respect of provident fund, income tax, professional tax, service tax, other material statutory dues were in arrears as at 31 March 2014 for a period of more than six months from the date they became payable.
(c) According to the information and explanations given to us, the following dues of Income-tax have not been deposited by the Company on account of disputes:
Name of the statute
Nature of dues
Amount (rupees in‘000)
Period to which the amount
relates
Forum where dispute is pending
Income Tax Act, 1961
Income tax 1,341 A.Y 2004-05 Appellate Tribunal
Income Tax Act, 1961 Income Tax Act, 1961
Income tax Income tax
15,042
5,034
A.Y 2007-08
AY 2008-09
Appellate Tribunal Appellate Tribunal
(x) The accumulated losses of the Company are less than fifty percent of the Company’s net worth. The Company has incurred cash losses during the current financial year and in the immediately preceding financial year of Rs. 61,660 thousand and Rs. 193,655 thousand respectively.
(xi) In our opinion and according to the information and explanations given to us, the Company did not have any outstanding dues to any financial institution, banks or debenture holders during the year.
(xii) The Company has not granted any loans and advances on the basis of security by way of pledge of shares, debentures and other securities.
(xiii) In our opinion and according to the information and explanation given to us, the Company is not a chit fund or a nidhi /mutual benefit fund/ society. Accordingly paragraph 4(xiii) of the Order is not applicable.
(xiv) According to the information and explanations given to us, the Company is not dealing or trading in shares, securities, debentures and other investments.
6

HSBC Asset Management (India) Private Limited Annexure to Independent Auditors’ Report - 31 March 2014 (Continued)
(xv) According to the information and explanations given to us, the Company has not given any guarantee for loans taken by others from banks or financial institutions.
(xvi) Based on our examination of the records of the Company and based on the information and explanation given to us, the Company has not taken any term loans during the year and accordingly paragraph 4 (xvi) of the order is not applicable to the Company.
(xvii) According to the information and explanations given to us and on an overall examination of the balance sheet of the Company, the Company has not raised any funds on short-term basis for the purpose of long-term investments.
(xviii) The Company has not made any preferential allotment of shares to companies/ firms/parties covered in the register maintained under Section 301 of the Act.
(xix) According to the information and explanations given to us, the Company has not issued any debentures during the year.
(xx) The Company has not raised any money by public issues during the year.
(xxi) According to the information and explanations given to us, no fraud on or by the Company has been noticed or reported during the year.
For B S R & Associates LLP Chartered Accountants Firm's Registration No: 116231W/W-100024 Sd/- N Sampath Ganesh Mumbai Partner 11 August 2014 Membership No: 042554
7

HSBC Asset Management (India) Private Limited
Balance Sheetas at 31 March 2014
(Currency: Indian Rupees in thousands)
Note 31 March 2014 31 March 2013EQUITY AND LIABILITIESShareholders' fundsShare capital 3 542,000 542,000Reserves and surplus 4 (10,885) 64,533
531,115 606,533
Non-current liabilitiesLong-term borrowings 5 3,824 4,096Long-term provisions 7 14,175 13,354
17,999 17,450
Current liabilitiesTrade payables 8 149,329 120,244Other current liabilities 9 79,743 61,787Short-term provisions 7 8,009 6,377
237,081 188,408
TOTAL 786,195 812,391
ASSETSNon-current assetsFixed assetsTangible assets 10.1 25,274 29,670Intangible assets 10.2 - -Long-term loans and advances 11 393,775 397,211
419,049 426,881
Current assetsCurrent investments 12 149,780 277,448Trade receivables 13 170,869 54,054Cash and bank balances 14 1,111 15,055Short-term loans and advances 11 45,386 38,953
367,146 385,510
TOTAL 786,195 812,391
Significant accounting policies 2 (0.10) 0.03
The notes referred to above form an integral part of the financial statements.As per our report of even date attached
For B S R & Associates LLP For and on behalf of the Board of Directors ofChartered Accountants HSBC Asset Management (India) Private LimitedFirm Registration No. 116231W/W-100024
Sd/- Sd/- Sd/-N Sampath Ganesh Naina Lal Kidwai Puneet ChaddhaPartner Chairperson Director &Membership No: 042554 Chief Executive OfficerMumbai
Sd/-
Denny ThomasCompany SecretaryMumbai11 August 2014
11 August 2014
8

HSBC Asset Management (India) Private Limited
Statement of Profit and Lossfor the year ended 31 March 2014
(Currency: Indian Rupees in thousands)
Note 31 March 2014 31 March 2013REVENUERevenue from operations 15 683,965 416,436Other income 16 36,731 15,374
Total revenue 720,696 431,810
EXPENSESEmployee benefits expenses 17 375,147 327,864Finance costs 18 2,036 1,994Depreciation and amortization 10 13,758 18,503Other expenses 19 303,458 295,607
Total expenses 694,399 643,968
Profit/ (Loss) before exceptional items and tax 26,297 (212,158)Exceptional items 19.3 101,715 -
Loss before tax (75,419) (212,158)Tax expense:
Deferred tax 6 - -
Loss for the year (75,419) (212,158)
Earnings per equity share [face value of share Rs 10]Basic and diluted 20.5 (1.39) (4.40)
Significant accounting policies 2
The notes referred to above form an integral part of the financial statements.As per our report of even date attached
For B S R & Associates LLP For and on behalf of the Board of Directors ofChartered Accountants HSBC Asset Management (India) Private LimitedFirm Registration No. 116231W/W-100024
Sd/- Sd/- Sd/-N Sampath Ganesh Naina Lal Kidwai Puneet ChaddhaPartner Chairperson Director &Membership No: 042554 Chief Executive OfficerMumbai11 August 2014 Sd/-
Denny ThomasCompany SecretaryMumbai11 August 2014
9

HSBC Asset Management (India) Private Limited
Cash flow statementfor the year ended 31 March 2014(Currency: Indian Rupees in thousands)
31 March 2014 31 March 2013
A Cash flow from operating activities
(Loss) before tax (75,419) (212,158)Adjustments for
Depreciation 13,758 18,503Interest expenses 1,036 933Loss on sale of fixed assets 652 1,131Unrealised foreign exchange losses 3,429 70Profit on sale of investments (30,446) (13,949)Dividend income - (587)
(11,571) 6,101
Operating (loss) before working capital changes (86,989) (206,057)
(Decrease) / increase in trade receivables (117,554) (9,216)(Decrease) / increase in loans and advances and other current assets (5,711) 23,635Increase / (decrease) in current liabilities and provisions 46,428 (748)
Cash generated from / (used in) operations (163,826) (192,387)
Income taxes paid (43,912) (39,697)Income tax refund received 46,631 -
Net cash used by operating activities ( A ) (161,107) (232,083)
B Cash flow from investing activitiesPurchase of fixed assets (10,056) (24,472)Proceeds from sale / (cost incurred for sale) of fixed assets 42 865Purchase of Mutual fund units (589,546) (1,199,419)Proceeds from sale of Mutual fund units 747,654 1,013,205Dividend income - 587
Net cash provided/ (used) by investing activities ( B ) 148,094 (209,234)
C Cash flow from financing activitiesPrincipal payment under finance leases (3,045) (3,670)Proceeds from finance leases 3,150 5,785Finance cost paid (1,036) (933)Proceeds from issue of equity shares - 452,000
Net cash provided/ (used) by financing activities ( C ) (931) 453,181
10

HSBC Asset Management (India) Private Limited
Cash flow statementfor the year ended 31 March 2014(Currency: Indian Rupees in thousands)
31 March 2014 31 March 2013
Net (decrease) / increase in cash and cash equivalents (A) + (B) + (C) (13,944) 11,864
Cash and cash equivalents at the beginning of the year 15,055 3,191Cash and cash equivalents at the end of the year 1,111 15,055
Net (decrease) / increase in cash and cash equivalents (13,944) 11,864
(0.40) (0.88)NoteCash and cash equivalents comprise of cash on hand, balances with banks in current accounts.
(Refer Note 14 of the financial statements)
The notes referred to above form an integral part of the financial statements.
As per our report of even date attached
For B S R & Associates LLP For and on behalf of the Board of Directors of
Chartered Accountants HSBC Asset Management (India) Private Limited
Firm Registration No. 116231W/W-100024
Sd/- Sd/- Sd/-
N Sampath Ganesh Naina Lal Kidwai Puneet Chaddha
Partner Chairperson Director &
Membership No: 042554 Chief Executive Officer
Mumbai
11 August 2014 Sd/-
Denny Thomas
Company Secretary
Mumbai
11 August 2014
11

HSBC Asset Management (India) Private Limited
Notes to financial statementsfor the year ended 31 March 2014(Currency: Indian Rupees in thousands)
1. Background
2. Significant Accounting Policies
2.1 Basis of preparation of financial statements
2.2 Use of estimates
2.3 Current-non-current classification
All assets and liabilities are classified into current and non-current.
AssetsAn asset is classified as current when it satisfies any of the following criteria:
(a) it is expected to be realised in, or is intended for sale of consumption in, the company's normal operating cycle;(b) it is held primarily for the purpose of being traded;(c) it is expected to be realised within 12 months after the reporting date; or(d) it is cash or cash equivalent unless it is restricted from being exchanged or used to settle a liability for at least 12 months after the reporting date.
Current assets include the current portion of non-current financial assets.All other assets are classified as non-current.
LiabilitiesA liability is classified as current when it satisfies any of the following criteria:
(a) it is expected to be settled in the company’s normal operating cycle;(b) it is held primarily f or the purpose of being traded(c) it is due to be settled within 12 months after the reporting date; or
Current liabilities include current portion of non-current financial liabilities. All other liabilities are classified as non-current.
Operating cycleOperating cycle is the time between the acquisition of assets for processing and their realisation in cash or cash equivalents.
2.4 Fixed assets and depreciation
Motor Cars As per the lease tenure or on the basis of technical evaluation of the useful life whichever is less
Computers 40.00%
Office Equipment 25.00%
Furniture and Fittings 25.00%
Assets costing less than Rs. 10,000 are fully depreciated in the year of purchase.
2.5 Impairment of assets
Depreciation on fixed assets is provided on the written-down value method. The rates of Depreciation prescribed in Schedule XIV to the Companies Act, 1956 areconsidered as the minimum rates. If the management's estimate of the useful life of a fixed asset at the time of acquisition of the asset or of the remaining useful life on thesubsequent review is shorter than that envisaged in the aforesaid schedule, depreciation is provided at a higher rate based on the management estimate of the useful life/remaining useful life. Pursuant to this policy, depreciation on assets has been provided at the following rates:
Depreciation on additions is provided on a pro rata basis from the month the asset is put to use or ready to use whichever is earlier. In respect of assets sold, depreciation isprovided up to the month of disposal.
Intangible assets (computer software) have been amortised at 100% in the year of acquisition.
The Company assesses at each balance sheet date whether there is any indication that an asset may be impaired. If any such indication exists, the Company estimates therecoverable amount of the asset. If such recoverable amount of the asset or the recoverable amount of the cash-generating unit to which the asset belongs is less than itscarrying amount, the carrying amount is reduced to its recoverable amount. The reduction is treated as an impairment loss and is recognized in the profit and loss account.If, at the balance sheet date, there is an indication that a previously assessed impairment loss no longer exists, the recoverable amount is reassessed and the asset isreflected at the recoverable amount subject to a maximum of depreciable historical cost.
HSBC Asset Management (India) Private Limited ("the Company") was incorporated on 12 December 2001. The Company is a fully owned subsidiary of HSBC Securitiesand Capital Markets (India) Private Limited. Its principal activity is to act as an Investment Manager to HSBC Mutual Fund ("the Fund"). The Company manages theMutual Fund schemes launched by HSBC Mutual Fund and provides various administrative services to the Fund as laid down in the Investment Management Agreementdated 7 February 2002. The Company is also a SEBI registered Portfolio Manager. The Company has received a certificate from SEBI to act as Portfolio Manager. Thesaid certificate is valid up to 15 September 2014 and to be renewed thereafter. It provides discretionary and advisory Portfolio Management Services (PMS) to its clients.
The accompanying financial statements are prepared and presented on the accrual basis of accounting and comply with the Accounting Standards prescribed in theCompanies (Accounting Standards) Rules, 2006 issued by the Central Government, the relevant provisions of the Companies Act, 1956 and other accounting principlesgenerally accepted in India, to the extent applicable. The financial statements are presented in Indian rupees rounded off to nearest thousand.
The preparation of financial statements in conformity with Generally Accepted Accounting Principles (GAAP) requires management to make judgments, estimates andassumptions that affect the application of accounting policies and reported amounts of assets, liabilities, income and expenses and the disclosure of contingent liabilitieson the date of the financial statements. Actual results could differ from those estimates. Estimates and underlying assumptions are reviewed on an on going basis. Anyrevision to accounting estimates is recognised prospectively in current and future periods.
Fixed assets are stated at historical cost less accumulated depreciation. Cost includes inward freight, duties, octroi, taxes and other incidental expenses related toacquisition and corresponding installation expenses.
The accounting policies set out below have been applied consistently to the periods presented in these financial statements.
(d) the company does not have an unconditional right to defer settlement of the liability for at least 12 months after the reporting date. Terms of a liability that could, atthe option of the counterparty, result in its settlement by the issue of equity instruments do not affect its classification.
12

Notes to financial statements (Continued)for the year ended 31 March 2014(Currency: Indian Rupees in thousands)
2. Significant Accounting Policies (Continued)
2.6 Investments
2.7 Revenue Recognition
Profit or loss on sale of investments is arrived at by applying weighted average cost on trade date
2.8 Transactions in foreign currency
2.9 Provisions and Contingencies
2.10 Leases
Finance Leases
Operating Leases
2.11 Taxation
Long-term investments (including current portion thereof) are carried at cost less any other-than-temporary diminution in value, determined separately for eachindividual investment.
Current investments are carried at the lower of cost and fair value. The comparison of cost and fair value is done separately in respect of each category of investment.
Investments that are readily realisable and intended to be held for not more than a year from the date of acquisition are classified as current investments. All otherinvestments are classified as long-term investments.
Lease transactions are accounted in accordance with Accounting Standard 19 'Leases' prescribed by the Companies (Accounting Standards) Rules, 2006.
Investment management fees (excluding service tax) are recognised monthly on an accrual basis, in accordance with the terms of contract between the Company and theBoard of Trustees of HSBC Mutual Fund and are in line with the Securities and Exchange Board of India ("SEBI") (Mutual Funds) Regulations, 1996 (SEBI Regulations)as amended from time to time, based on daily net asset value (excluding investments made by the Company in the schemes in accordance with SEBI Regulations).
Dividend income is recognised when the right to receive the same is established.
The group recharges are accounted monthly at the month end rate. Other foreign exchange transactions are recorded using the rates prevailing on the date of the respectivetransactions. Exchange differences arising on foreign exchange transactions settled during the period are recognised in the statement of profit and loss of the year.
Monetary assets and liabilities denominated in foreign currencies as at the balance sheet date are translated at the closing exchange rates on that date. The resultantexchange differences, if any, are recognised in the statement of profit and loss and related assets and liabilities are accordingly restated in balance sheet.
A provision is recognised if, as a result of a past event, the Company has a present obligation that can be estimated reliably, and it is probable that an outflow of economicbenefits will be required to settle the obligation. Provisions are recognised at the best estimate of the expenditure required to settle the present obligation at the balancesheet date. The provisions are measured on an undiscounted basis.
Lease payments for assets taken on operating leases are recognized as an expense in the statement of profit and loss account over the lease term on a straight-line basis.
A contingent liability exists when there is a possible but not probable obligation, or a present obligation that may, but probably will not, require an outflow of resources, ora present obligation whose amount cannot be estimated reliably. Contingent liabilities do not warrant provisions, but are disclosed unless the possibility of outflow ofresources is remote. Contingent assets are neither recognised nor disclosed in the financial statements. However, contingent assets are assessed continually and if it isvirtually certain that an inflow of economic benefits will arise, the asset and related income are recognised in the period in which the change occurs.
Income-tax expense comprises current tax (i.e. amount of tax for the period determined in accordance with the income-tax law) and deferred tax charge or credit(reflecting the tax effects of timing differences between accounting income and taxable income for the period). Income-tax expense is recognised in profit or loss exceptthat tax expense related to items recognised directly in reserves is also recognized in those reserves.
Current tax is measured at the amount expected to be paid to (recovered from) the taxation authorities, using the applicable tax rates and tax laws. Deferred tax isrecognised in respect of timing differences between taxable income and accounting income i.e. differences that originate in one period and are capable of reversal in one ormore subsequent periods. The deferred tax charge or credit and the corresponding deferred tax liabilities or assets are recognised using the tax rates and tax laws that havebeen enacted or substantively enacted by the balance sheet date. Deferred tax assets are recognised only to the extent there is reasonable certainty that the assets can berealised in future; however, where there is unabsorbed depreciation or carried forward loss under taxation laws, deferred tax assets are recognised only if there is a virtualcertainty supported by convincing evidence that sufficient future taxable income will be available against which such deferred tax assets can be realised. Deferred taxassets are reviewed as at each balance sheet date and written down or written be realised.
a. Assets taken on finance lease are recognised as a fixed asset at the fair market value of the asset or present value of the minimum lease payments as prescribed underAccounting Standard 19 'Leases'. An equivalent liability is created at the inception of the lease. Rentals paid are apportioned between finance charge and principal basedon the implicit rate of return in the contract. The finance charge is shown as interest expense and the principal amount is reduced from the liability.
b. Depreciation on such assets is provided on the basis of lease period or on the basis of technical evaluation of the useful life, whichever is earlier. This is greater thanthe corresponding rates prescribed in Schedule XIV of the Companies Act, 1956.
Any reductions in the carrying amount and any reversals of such reductions are charged or credited to the statement of profit and loss.
Interest income is accounted for on an accrual basis.
Portfolio management fees (excluding service tax) are recognised on an accrual basis, based on fee structures on a monthly basis.
Profit or loss on sale of investments is determined on the basis of weighted average carrying amount of investments disposed of.
13

Notes to financial statements (Continued)for the year ended 31 March 2014(Currency: Indian Rupees in thousands)
2. Significant Accounting Policies (Continued)
2.12 Retirement Benefits
Employee Benefits
Short term employee benefits
Post employment benefits
Defined benefit plans
Compensated absences
2.13 Restricted Share Plan
2.14 Scheme related expenses
2.15 Earnings per share
The Company reports basic and diluted earnings per share in accordance with Accounting Standard 20 - "Earnings Per Share" prescribed by the Companies (AccountingStandards) Rules, 2006. Basic earnings per share is computed by dividing the net profit after tax by the weighted average number of equity shares outstanding for the year.
Diluted earnings per share reflect the potential dilution that could occur if securities or other contracts to issue equity shares were exercised or converted during the year.Diluted earnings per share is computed using the weighted average number of equity shares and dilutive potential equity shares outstanding at year end.
The total recurring expenses relating to the schemes of HSBC Mutual Fund are as per SEBI Regulations. Expenses over and above the expense limit for each scheme orExpenses which are not permissible to be borne by HSBC Mutual Fund are required to be borne by the Company and are disclosed under the head Other expenses as'Scheme related expenses'.
The employees to whom the shares are granted will be entitled to receive the shares after the end of the vesting period. At the end of the vesting period the shares awardedwill be transferred to the employee provided the employee continues to be in employment. The shares may be retained or sold at the discretion of the employee.
If the employee leaves the service during the vesting period, the shares granted are forfeited.
The Company’s gratuity benefit scheme is defined benefit plan. The Company’s net obligation in respect of a defined benefit plan is calculated by estimating the amountof future benefit that employees have earned in return for their service in the current and prior periods; that benefit is discounted to determine its present value. Anyunrecognised past service costs and the fair value of any plan assets are deducted. The calculation of the Company’s obligation is performed annually by a qualifiedactuary using the projected unit credit method.
The Company recognises all actuarial gains and losses arising from defined benefit plans immediately in the statement of profit and loss. All expenses related to definedbenefit plans are recognised in employee benefits expense in the statement of profit and loss. When the benefits of a plan are improved, the portion of the increasedbenefit related to past service by employees is recognised in profit or loss on a straight-line basis over the average period until the benefits become vested. The Companyrecognises gains and losses on the curtailment or settlement of a defined benefit plan when the curtailment or settlement occurs.
Employee benefits payable wholly within twelve months of receiving employee services are classified as short-term employee benefits. These benefits include salaries andwages, bonus and ex-gratia payments.
The initial issue expenses with respect to all schemes launched have been borne by the Company in the year in which they are incurred.
The Company follows the leave period on a calendar year basis. Unutilised leave at the end of calendar year expires. Compensated absences are accounted as short termemployee benefits on the basis of unutilised leave as at the end of the financial year.
Restricted share plan represents restricted stock award, by way of shares of HSBC Holdings Plc. (the ultimate holding company), granted to eligible employees in lieu ofbonus. The value of share awards granted after 1 April 2005 is carried at cost and is amortised over the vesting period, in accordance with the Guidance Note onAccounting for Employee Share based payments issued by the Institute of Chartered Accountants of India.
14

Notes to financial statements (Continued)as at 31 March 2014(Currency: Indian Rupees in thousands)
31 March 2014 31 March 2013
3 Share capital
Authorised share capital62,000,000 Equity shares (previous year 62,000,000) of Rs 10 each 620,000 620,000
8,000,000 Cumulative redeemable preference shares (previous year 8,000,000) of Rs 10 each 80,000 80,000
700,000 700,000
Issued, subscribed and fully paid-up share capital54,200,000 (previous year : 54,200,000) Equity shares of Rs 10 each fully paid up 542,000 542,000
542,000 542,000
3.1 Reconciliation of shares outstanding at the beginning and at the end of reporting period
Equity shares
No of shares Amount No of shares Amount
At the beginning of the year 54,200,000 542,000 9,000,000 90,000
Issued during the year - - 45,200,000 452,000
Outstanding at the end of the year 54,200,000 542,000 54,200,000 542,000
3.2 Rights, Preferences and Restrictions attached to each class of shares
3.3 Shares held by holding company 0 1.9
Equity sharesNo of shares Amount No of shares Amount
Equity shares of Rs 10 each fully paid up held by holding company and its nominees 54,200,000 542,000 54,200,000 542,000
3.4 Shareholders holding more than 5% shares at the end of the reporting period
Name of shareholder
No of shares Amount % Holding No of shares Amount % Holding
54,200,000 542,000 100 54,200,000 542,000 100
31 March 2014 31 March 2013
4 Reserves and Surplus
Capital redemption reserve 90,000 90,000
Profit and loss balanceAt the commencement of the year (25,467) 186,691
Add: (Loss) for the year (75,419) (212,158)
Closing balance (100,885) (25,467)
Total (10,885) 64,533
(The entire paid up share capital is held by HSBC Securities and Capital Markets (India) Private Limited andits nominees)
31 March 2014 31 March 2013
31 March 201331 March 2014
31 March 2014
The company has a single class of equity shares. Accordingly, all equity shares rank equally with regard to dividends and share in the company's residual assets. Theequity shares are entitled to receive dividend as declared from time to time. On winding up of the company, the holders of equity shares will be entitled to receive theresidual assets of the company.
31 March 2013
HSBC Securities and Capital Markets (India) PrivateLimited and its nominees
15

Notes to financial statements (Continued)as at 31 March 2014(Currency: Indian Rupees in thousands)
31 March 2014 31 March 2013 31 March 2014 31 March 2013
5 Long term borrowings
Finance lease obligations (secured) 3,824 4,096 2,953 2,578
3,824 4,096 2,953 2,578
31 March 2014 31 March 2013 31 March 2014 31 March 2013
4,369 4,689 3,715 3,326
545 593 761 7483,824 4,096 2,953 2,578
The maturity profile of finance lease obligations is as follows:
31 March 2014 31 March 2013 31 March 2014 31 March 20133,715 3,326 2,953 2,5784,369 4,689 3,824 4,096
- - - -Finance lease obligations are secured against motor cars taken on lease.
6 Deferred tax (net)
31 March 2014 31 March 2013Deferred tax liabilitiesDepreciation on fixed assets (1,636) -Bonus (678) -
Total Deferred tax liability (2,314) -
Deferred tax assetsDepreciation on fixed assets - 1,058Bonus - 7,822Carry forward of losses 240,068 195,785Gratuity & compensated absence 833 5,457Lease Rentals 101 149
Total Deferred tax asset 241,002 210,271
Net Deferred Tax Asset/ (Liability) 238,688 210,271
7 Provisions
7.1 Provision for employee benefits
31-Mar-14 31-Mar-13 31-Mar-14 31-Mar-13
Gratuity 14,175 13,354 1,499 1,183
Compensated absences - - 4,438 3,122
14,175 13,354 5,937 4,305
7.2 Other provisions
Provision for current tax [net of advance tax Rs 10,265; (previous year Rs 10,625)] - - 2,072 2,072
- - 2,072 2,072
Total 14,175 13,354 8,009 6,377
8 Trade payables
Payable to vendors (including accrued expenses) 149,329 120,244
149,329 120,244For dues to micro and small suppliers refer Note 21.10
9 Other current liabilities
Current maturities of finance lease obligation (secured) * 2,953 2,578
Provision for bonus 23,319 25,313
Statutory dues payable 49,811 32,088
Other liabilities 3,660 1,808
79,743 61,787* Total current maturities of long term borrowings Rs 2,953 (previous year 2,578 ). For details refer note 5
Long term Short term
Non - current portion Current portion
Period
Particulars of timing difference
Present value
Payable later than 5 years
In view of losses in the current year and in absence of virtual certainty of generating adequate profits in the foreseeable future, net deferred tax asset has not beenrecognised.
Non - current portion Current portion
The Company has entered into finance lease agreements for motor cars for use by some of its employees. The period of lease is between 3 to 5 years in all cases. Theselease agreements are non-renewable and do not provide for escalation in rental values. The total future minimum lease payments at the balance sheet date, element ofinterest included in such payments, and present value of these minimum lease payments are as follows:
Total future minimum lease payments
Payable within 1 yearPayable between 1 - 5 years
Particulars
Future interest included abovePresent value of future minimum lease payments
Minimum lease payment
16

Notes to financial statements (Continued)as at 31 March 2014(Currency: Indian Rupees in thousands)
Non Current Assets
10 Fixed assets -
10.1 Tangible assets
Gross blockBalance as at 1 April 2013 12,193 51,261 3,829 2,058 69,341
Additions 3,150 6,104 6 - 9,260
Disposals (3,579) (925) - - (4,504)
Balance as at 31 March 2014 11,764 56,440 3,835 2,058 74,097
DepreciationBalance as at 1 April 2013 5,037 30,370 2,467 1,796 39,670
Depreciation for the year 2,659 9,891 346 66 12,962
Accumulated depreciation on disposals (3,008) (801) - - (3,809)
Balance as at 31 March 2014 4,688 39,460 2,813 1,862 48,823
Net block
As at 31 March 2014 7,076 16,980 1,022 196 25,274
* All motor cars of the Company have been taken on finance lease.
Gross blockBalance as at 1 April 2012 9,690 43,541 4,172 2,063 59,466
Additions 5,793 16,402 18 6 22,219
Disposals (3,290) (8,682) (362) (11) (12,345)
Balance as at 31 March 2013 12,193 51,261 3,828 2,058 69,340
DepreciationBalance as at 1 April 2012 4,026 25,805 2,225 1,713 33,769
Depreciation for the year 3,356 12,253 547 94 16,250
Accumulated depreciation on disposals (2,345) (7,688) (305) (11) (10,349)
Balance as at 31 March 2013 5,037 30,370 2,467 1,796 39,670
Net block
As at 31 March 2013 7,156 20,891 1,361 262 29,670
* All motor cars of the Company have been taken on finance lease.
10.2 Intangible assets
Gross blockBalance as at 1 April 2013 59,271
Additions 796
Disposals -
Balance as at 31 March 2014 60,067
DepreciationBalance as at 1 April 2013 59,271
Depreciation for the year 796
Accumulated depreciation on disposals -
Balance as at 31 March 2014 60,067
Net block
As at 31 March 2014 -
Gross blockBalance as at 1 April 2012 57,018Additions 2,253Disposals -Balance as at 31 March 2013 59,271
DepreciationBalance as at 1 April 2012 57,018Depreciation for the year 2,253Accumulated depreciation on disposals -Balance as at 31 March 2013 59,271
Net blockAs at 31 March 2013 -
Furniture and
fittings
Computer
software
Office
equipment
Computer
software
Office
equipment
Furniture and
fittingsTotal
Particulars
ComputersParticulars Motor cars *
Particulars Motor cars *
Total
Computers
Particulars
17

Notes to financial statements (Continued)as at 31 March 2014(Currency: Indian Rupees in thousands)
11 Loans and advances
31-Mar-14 31-Mar-13 31-Mar-14 31-Mar-13
11.1 To parties other than related parties
Deposit for services - - 253 91
- - 253 91
Other loans and advances(Unsecured and considered good)
Loans to employees * 1,184 1,239 302 294
CENVAT credit receivable - - 13,294 16,045
Advance taxes [net of provision for tax Rs 464,364; (previous year Rs 464,364)] 388,556 391,270 - -
Prepaid expenses 4,035 4,702 9,365 9,145
Other receivables - - 115 16
Advance recoverable in cash or kind - - 9,789 -
393,775 397,211 32,865 25,500
* These are interest free loans granted to employees and includes an amount of Rs Nil (previous year Rs Nil) advanced to directors.
11.2 To related parties
Deposit for premises - - 12,268 13,362
- - 12,268 13,362
Total 393,775 397,211 45,386 38,953
12 Current investments
No. of units Amount No. of units Amount
Investments in Mutual Fund - unquoted- - 164,151.950 184,448
121,517.81 149,780 74,482.053 86,000
A 149,780 270,448
Aggregate of unquoted investments in mutual fund unitsAt Book value 149,780 270,448At Net asset value 155,408 278,920
Mutual fund investment application- - - 7,000
B - 7,000
Total 149,780 277,448
* With effect from 29 Dec 2012, Face Value of HSBC Cash Fund has been changed from Rs 10 per unit to Rs 1,000 per unit.
** Investments of Rs 7,000 was made on the 31 March 2013, for which units were allotted on 1 April 2013 and have not been reflected above.
31-Mar-14 31-Mar-13
13 Trade receivables
- -
Other receivables
170,869 54,054
170,869 54,054
- -
170,869 54,054
14 Cash and bank balances
Cash and cash equivalents
Cash on hand 50 50
Balance with banks
- on current accounts 1,061 15,005
1,111 15,055
Non - current portion Current portion
HSBC Cash Fund - Institutional Plus - Growth Option *
31-Mar-1331-Mar-14
HSBC Cash Fund - Institutional Plus - Growth Direct
(Unsecured and considered good)
Outstanding for more than six months
Particulars
Unsecured and considered good
Less: Provision for doubtful debts
HSBC Cash Fund - Institutional Plus - Growth Direct**
18

Notes to financial statements (Continued)for the year ended 31 March 2014(Currency: Indian Rupees in thousands)
31-Mar-14 31-Mar-13
15 Revenue from operations
Investment management fees 397,329 348,985
Advisory fees 253,329 5,008
Income from PMS business 33,307 62,443
683,965 416,436
16 Other Income
Gain on sale of current investments 30,446 13,949
Dividend income on current investments - 587
Miscellaneous income 368 562
Interest on income tax refund 4,898 -
Net gain on account of foreign exchange fluctuations 1,019 276
36,731 15,374
17 Employee benefits / expenses
Salaries, wages and bonus 345,863 297,671Contribution to provident fund and other funds 14,575 14,302Restricted share plan 3,101 4,413Staff welfare expenses 8,737 4,247Gratuity 2,871 7,231
375,147 327,864
18 Finance costs
Interest expense
Finance charge on finance leases 1,036 933
Other borrowing cost
Guarantee charges 1,000 1,061
2,036 1,994
19 Other expenses
Brokerage and incentives 10,053 17,755
Legal and professional fees 6,101 9,284
Support service charges (refer note 19.1) 113,103 84,944
Rent and utilities 30,383 36,973
Payment to auditors
- as auditors 650 650
- for other services - -
- for reimbursement of expenses 20 20
Business development expenses 30,945 14,218
Repairs and maintenance 34,199 20,750
Telephone, communication and postage 25,642 24,062
Office administration expenses 5,301 4,347
Insurance 6,793 6,793
Scheme related expenses (refer note 2.14) 15,953 51,776
Compensation (refer note 19.2) 156 255
Operating lease rentals - 239
Loss on assets written off (net) - -
Membership and subscription 820 584
Loss on sale of assets (net) 652 1,131
Directors sitting fees 270 291
Donation 25 225Training expenses 4,293 2,491Rates and taxes 4,626 6,991Travelling expenses 13,473 11,828
Foreign Exchange loss (net) - -
303,458 295,607
19.1 Support service charges
19.2 Compensation
19.3 Exceptional items
Compensation paid to the investors of HSBC Gilt fund 101,715 -
Above charges represent the charges paid by the Company to other HSBC Group entities both for central as well as regional support. These Group entities providemanagement, administrative as well as technical support on various functional aspects of day-to-day business as well as the strategy for growth.
The Company incurred Rs 156 (previous year Rs 255) towards compensation paid by the Company to investors / distributors on account of routine processing errors /delays.
Pursuant to a complaint filed by certain investors, Securities and Exchange Board of India (SEBI) issued a Show Cause notice dated August 7, 2009 to the Board ofTrustees of the Fund, the Fund, HSBC Asset Management (India) Private Limited and the then CEO of the HSBC Asset Management (India) Private Limited, (together the“respondents”) pertaining to changes made in the Scheme Information Document of HSBC Gilt Fund via Addendums dated January 05, 2009 and March 02, 2009. SEBI,vide its order dated April 23, 2010 disposed off the Show Cause Notice dated August 7, 2009. Aggrieved by this, the investors filed an appeal with the Securities AppellateTribunal (SAT). SAT vide its order directed the respondent to provide exit option at the then prevailing Net Asset Value. The Company filed an appeal against theseOrders before the Supreme Court. The Supreme Court dismissed the appeal vide its order dated on January 15, 2014. Accordingly the Company has paid compensationamounting to Rs 101,715 (including interest of Rs 44,234)
19

Notes to financial statements (Continued)for the year ended 31 March 2014
(Currency: Indian Rupees in thousands)
31-Mar-14 31-Mar-13
20 Notes to the financial statements
20.1 Capital Commitments - -
The Company has no capital commitments as at 31 March 2014 (previous year Rs Nil).
20.2 Expenditure in foreign currency
Support service charges 109,524 48,510
Telephone, communication and postage 3,124 2,753
Travel and conveyance 1,979 1,979
Training Recharge 2,311 449
Membership and subscription 328 287
117,266 53,978
20.3 Earnings in foreign currency
Advisory fees 253,329 5,008
253,329 5,008
20.4 Employee Benefits
a) Defined benefit plans
The following table summarises the position of assets and obligations relating to the defined benefit plan.
31-Mar-14 31-Mar-13- -
15,674 14,53715,674 14,537
31-Mar-14 31-Mar-13 31-Mar-14 31-Mar-13Gratuity 14,175 13,353 1,499 1,183
14,175 13,353 1,499 1,183
31-Mar-14 31-Mar-13Government bonds - -Qualifying insurance policies - -
- -
31-Mar-14 31-Mar-1314,537 10,591
3,589 3,1551,411 1,141
- -(2,129) 2,935
- -(1,734) (3,285)
15,674 14,537
31-Mar-14 31-Mar-13Fair value of plan assets at 1 April 2013 - -Contributions paid into the plan - -Benefits paid by the plan - -Expected return on plan assets - -Actuarial (gain)/loss - -
- -- -Fair value of plan assets at 31 March 2014
Benefits paid by the plan
e) Movement in fair values of plan assets
Gratuity
Net actuarial (gain)/loss recognised during the yearEffect of movement in exchange rates
Defined benefit obligation at 31 March 2014
Defined benefit obligation at 1 April 2013Current service costInterest cost
Gratuity
Non current Current
Gratuity
Curtailment loss
d) Movement in present values of defined benefit obligations
b) Classification into current/ non current
The asset/ (liability) in respect of the two plans comprises of the following non current and current portions:
Fair value of plan assetsPresent value of obligationsAsset/ (Liability) recognised in Balance Sheet
c) Composition of plan assets
The Company operates post employment defined benefit plans that provide gratuity benefit. The gratuity plan entitles employees, who have at least five years ofcontinuous service, to receive one-half month’s salary for each year of completed service at the time of retirement/exit.
20

Notes to financial statements (Continued)for the year ended 31 March 2014(Currency: Indian Rupees in thousands)
20 Notes to the financial statements (Continued)
20.4 Employee Benefits (continued)
31-Mar-14 31-Mar-13Current service cost 3,589 3,155Interest cost 1,411 1,141Expected return on plan assets - -Charge for asset ceiling - -Net actuarial (gain)/loss recognised (2,129) 2,935
2,871 7,231
31-Mar-14 31-Mar-13Expected return on plan assets - -Actuarial (gain)/loss - -Actual return on plan assets - -
- -
31-Mar-14 31-Mar-13Discount rate * 9.20% 8.05%Future salary increases ** 6% 6%Attrition rate 1% - 10% 1% - 10%
* The discount rate is based on the prevailing market yields of Indian government securities as at the balance sheet date for the estimated term of the obligations.
** Salary escalation rate varies based on the salary terms and future period of employment.
31-Mar-14 31-Mar-13 31-Mar-12 31-Mar-11 31-Mar-10Defined benefit obligation 15,674 14,536 10,591 9,894 8,588Fair value of plan assets - - - - -Deficit/(surplus) (15,674) (14,536) (10,591) (9,894) (8,588)
(9,175) 2,139 (177) 1,501 (17)- - - - -
20.5 Earnings per share
Basic / Diluted earnings per share
31-Mar-14 31-Mar-13
(75,419) (212,158)
(75,419) (212,158)
54,200,000 9,000,000- 45,200,000
54,200,000 54,200,000
54,200,000 48,183,014
(1.39) (4.40)
(1.39) (4.40)
Face value per share 10 10
Experience adjustment arising on plan liabilitiesExperience adjustment arising on plan assets
i) Five year information's
The calculation of basic / diluted earnings per share for the year ended 31 March 2014 was based on the loss attributable to equity shareholders of Rs 75,417 (previousyear Rs 212,158), and weighted average number of equity shares outstanding of 54,200,000 (previous year 48,183,014)
Calculation of shareholders earnings
g) Actual return on the plan assets
Gratuity
h) Principal accrual assumptions
Gratuity
The following are the principal accrual assumptions at the reporting date (expressed as weighted average)
f) Expense recognised in statement of profit and loss
Gratuity
Total included in employee benefits
Net loss for the year
In accordance with Accounting Standard 20 on Earnings Per Share prescribed by the Companies (Accounting Standards) Rules, 2006, the following is the calculation ofthe basic and diluted earnings per share:
Shareholders earnings
Calculation of weighted average number of equity sharesNumber of shares at the beginning of the yearShares issued / (buy back) during the year
Weighted average number of equity shares outstanding
Basic earnings (in Rupees) per share
Diluted earnings (in Rupees) per share
Total number of equity shares outstanding at the year end
For the year ended
In accordance with Accounting Standard 20 on Earnings Per Share prescribed by the Companies (Accounting Standards) Rules, 2006, the following is the calculation ofthe basic and diluted earnings per share:
21

Notes to financial statements (Continued)for the year ended 31 March 2014(Currency: Indian Rupees in thousands)
20 Notes to the financial statements (Continued)
20.6 Segmental reporting
PMS Advisory Unallocable Total
Segment revenue 397,329 33,307 253,330 36,730 720,696
Segment result (287,912) (4,686) 180,450 36,730 (75,418)
Taxation - - - - -
Net (loss) / profit (287,912) (4,686) 180,450 36,730 (75,418)Segment assets 98,513 8,252 116,488 562,942 786,195Segment liabilities 18,307 1,747 12,908 222,118 255,080Assets purchased during the year 7,755 511 85 1,704 10,055Depreciation of assets 10,610 700 116 2,332 13,758
PMS Advisory Unallocable Total
Segment revenue 348,985 67,451 - 15,374 431,810
Segment result (191,195) (36,337) - 15,374 (212,158)
Taxation - - - - -
Net (loss) / profit (212,158)
Segment assets 80,703 13,118 - 718,570 812,391
Segment liabilities 8,972 2,974 - 193,912 205,858
Assets purchased during the year 18,470 1,616 - 4,386 24,472
Depreciation of assets 13,965 1,222 - 3,316 18,503
For the year ended 31 March 2013
For the year ended 31 March 2014
The Company's operations predominantly relate to providing investment management services in India to the schemes of HSBC Mutual Fund. The Company also providesportfolio management services (PMS) along with non-binding advisory services to HSBC Asset Management Hongkong (AMHK) for offshore funds. Unallocable revenueprimarily includes dividend income, profit on sale of investments and others. Common expenses are allocated on the basis of proportionate time spent and headcount. Thedisclosure with respect to this reportable segment is available below:
Mutual Fund
Mutual fund
Geographical segments : The Company does not have overseas operations and is considered to operate only in the domestic segment.
Particulars
Particulars
Geographical segments : The Company does not have overseas operations and is considered to operate only in the domestic segment.
22

Notes to financial statements (Continued)for the year ended 31 March 2014(Currency: Indian Rupees in thousands)
20 Notes to the financial statements (Continued)
20.7 Restricted Share Plan
ParticularsCurrent year
(units)
Previous year(units)
Opening balance 11,741 14,3839,944 3,292
Exercised / vested (6,056) (6,312)
Other movement * - 378
Balance 15,629 11,741
The terms and conditions related to the grant of the restricted share plan are as follows :
ParticularsNumber of
shares
Key managerial personnel 2,315
13,314
Balance 15,629
Share based payment expense
Particulars 31-Mar-14 31-Mar-13
Amount recognised in employee benefits 3,101 4,413
Total expense recognised in employee benefits 3,101 4,413
20.8 Related party disclosures
(1) Names of related parties
Related party where control exists but with which no transactions have taken place during the yearHSBC Holdings PLC (ultimate holding company)
Related parties with whom transactions have taken place during the year
Holding Company HSBC Securities and Capital Markets (India) Private Limited
Others HSBC Mutual Fund *
* HSBC Asset Management (India) Private Limited is the Investment Manager to HSBC Mutual Fund.
(2) Fellow subsidiaries with whom transactions have taken place during the year
The Hong Kong and Shanghai Banking Corporation Limited - India Branches
HSBC Global Asset Management (Hong Kong) Limited (Formerly known as HSBC Investments (Hong Kong) Limited)
HSBC Software Development (India) Private Limited
HSBC Electronic Data Processing (India) Private Limited
HSBC Global Asset Management, London (Formerly known as HSBC Group Investment Business Limited, London)
The Hong Kong and Shanghai Banking Corporation Limited, Hong Kong
HSBC InvestDirect Securities (India) Limited.
HSBC Bank Plc.
HSBC Global Asset Management (Singapore) Limited
(3)
Ms. Naina Lal Kidwai Mr. Dinesh K Mittal (wef 5 February 2014) Mr. Puneet ChaddhaMr. S P Mustafa Mr. Gannesh Bharadhwaz (upto 23 May 2013) Ms. Kishori J Udeshi
Key management personnel (as defined under AS-18 ‘Related Party disclosures’ notified pursuant to the Companies (Accounting Standards) Rules, 2006) and
their relatives with whom transactions have taken place during the year
Restricted share plan represents restricted stock award granted to select high potential employees. Shares are awarded through Restricted Shares of HSBC Holdings Plc. Atthe end of the vesting period the shares awarded will be transferred to the employee provided the employee continues to be in employment. These restricted shares havebeen awarded to the employees during the year ended March 2006, March 2007, March 2008, March 2010, March 2011, March 2012, March 2013 and March 2014.
Total number of restricted shares awarded
* Other movements refers to the net transfer-in and transfer-out of restricted share awards to the employees within group entities having no additional liability to theCompany.
Senior employees
Contractual life : The maximum life is three years with one-third vesting at the end of every twelve months and in few cases the vesting is after thirty six months from thedate of the grant.
Vesting conditions : Employees need to be in employment with the entity at the time of vesting of the shares.
23

Notes to financial statements (Continued)for the year ended 31 March 2014(Currency: Indian Rupees in thousands)
20 Notes to the financial statements (Continued)
20.9 Related party transactions (Continued)
(4) Revenue transactions with related parties
Current year Previous year Current year Previous year Current year Previous year Current year Previous year
IncomeInvestment management fees - - - - 397,329 348,985 - -PMS advisory fees - - 253,329 3,108 - - - -Profit / (Loss) on sale of investments(net) (non trade)
- - - - 30,446 13,949 - -
Dividend - - - - - 587 - -
Profit / (Loss) on sale of fixed assets(net) (non trade)/ Other revenue
- - - 246 - - - -
ExpensesRemuneration - - - - - - 21,994 17,921Brokerage / incentives - - 7,714 14,217 2,773 3,075 - -Bank and custody charges - - 1,250 1,254 - - - -Sitting fees - - - - - - 270 291Computer maintenance 6,973 7,058 2,204 - - - - -Compensation - - - - 135 255 - -Scheme related expenses - - - - 15,953 51,776 - -Training and Education - - 111 847 - - - -Legal and professional fees - - 9,141 14,205 - - - -Support service charges - - 108,857 48,510 - - - -Rent and Utilities - - 29,649 36,973 - - - -
(5) Capital transactions with related parties
Current year Previous year Current year Previous year Current year Previous year Current year Previous year
Deposit for premises - - (964) 212 - - - -
Purchase of investments - - - - 596,546 1,199,418 - -
Sale of investments - - - - 717,208 999,257 - -
Sale of fixed assets - - - 476 - - - -
(6) Balances with related parties
Particulars
Assets
Investment management fee receivable - - - - 49,224 44,816 - -
PMS advisory fees receivable - - 116,215 1,306 - - - -Deposit for premises - - 12,268 13,362 - - - -Investments - - - - 149,780 277,448Other receivables - - - 476Balances with banks-current accounts - - 985 14,363 - - - -
Liabilities
Equity share capital held by holdingcompany
542,000 90,000 - - - -
Legal and professional fees - - - 5,129 - - - -Computer maintenance 300 - 382 - - - - -Support service charges - - 79,627 21,654 - - - -
Commission/Brokerage - - 7,449 2,229 - - - -
Scheme related expenses - - - - 158,512 51,776 - -
* HSBC Asset Management (India) Private Limited is the Investment Manager to HSBC Mutual Fund
Transactions carried out with providers of finance in the normal course of business have not been disclosed in the above table in accordance with Accounting Standard 18 - Related PartyTransactions prescribed by the Companies (Accounting Standards) Rules, 2006.
with Holding Companies
with fellow Subsidiarieswith Holding Companies
with fellow Subsidiaries
with Holding CompaniesParticularsParticulars
with fellow Subsidiaries with others* with Key Management
with others*
31-Mar-14
with others*Particulars
with Key Management
31-Mar-14 31-Mar-13
with Key Management
31-Mar-1331-Mar-14 31-Mar-13 31-Mar-14 31-Mar-13
24

Notes to financial statements (Continued)for the year ended 31 March 2014(Currency: Indian Rupees in thousands)
20 Notes to the financial statements (Continued)
21.10 Dues to micro and small suppliers
21.11 Contingent Liability
31-Mar-14 31-Mar-13(a) Dues towards Income Tax 31,363 31,363
- 57,000
* Refer note 19.3
21.12 Foreign currency exposures not hedged
Foreign currency Rupees Foreign currency RupeesSundry Creditors GBP 444 41,297 135 11,139
USD 617 37,712 197 10,609HKD 229 1,831 49 344
Sundry Debtors USD 1,882 116,240 24 1,306
The outstanding in foreign currency are not hedged by derivatives instruments or otherwise.
For B S R & Associates LLP For and on behalf of the Board of Directors ofChartered Accountants HSBC Asset Management (India) Private LimitedFirm Registration No. 116231W/W-100024
Sd/- Sd/- Sd/-
N Sampath Ganesh Naina Lal Kidwai Puneet ChaddhaPartner Chairperson Director &
Membership No: 042554 Chief Executive Officer
Mumbai
11 August 2014
Sd/-
Denny ThomasCompany Secretary
Mumbai
11 August 2014
31 March 2013
(a) Income-tax in respect of certain disallowances/adjustments made by the Income Tax Authorities aggregating to INR 31.4 million upon assessment/re- assessment forthe AY 2004-05, 2006-07, 2007-08, and 2008-09. These are mainly on account of the following:> AY 2004-05 - Disallowance of certain pre-operative expenses;> AY 2006-07 - Disallowance of certain business expenses;> AY 2007-08 - Transfer pricing and prior period adjustments; and> AY 2008-09 - Transfer pricing adjustmentsThe decisions are pending at various stages of appeal before CIT(Appeals) and the ITAT. The Company is contesting the demands and the management believes that itsposition is likely to be upheld in the appellate process. No tax expense has been accrued in the financial statements for the tax demands raised on account of the aforesaid.
Particulars CurrencyParticulars31 March 2014
(b) The Company had taken a view that resource cost of Rs. 2,157 thousands recharged to it in earlier years by a group private company in which one of its directors was adirector did not require Central Government approval u/s. 297 of Companies Act. However, since the other company had obtained Central Government approval for thesame transactions, the Company has, filed a compounding application for the above which is not yet disposed. Management believes that the above would not have amaterial effect on its financial statements.
(b) Investor complaints held at Supreme Court for HSBC Gilt Fund*
Claims against the company not acknowledged as debt
Trade payables includes Rs. Nil (Previous year: Rs. Nil) payable to "Suppliers" registered under the Micro, Small and Medium Enterprises Development Act, 2006. No interest has been
paid / is payable by the Company during the year to "Suppliers" registered under this act. The aforementioned is based on the responses received by the Company to its inquiries with
suppliers with regard to applicability under the said act.
25


