237
HSBC Global Investment Funds Annual Report & Financial Statements for Year Ended 31 March 2008
HSBC Global Investment Funds
Annual Report & Financial Statements for Year Ended 31 March 2008
2
To: All unitholders
Dear Investors
Notification of Company Name Change
With effect from 2 June 2008, HSBC Investments (Singapore) Limited will change its name to HSBC Global Asset Management (Singapore) Limited.
We are changing our name to HSBC Global Asset Management because it better reflects the breadth, strength and expertise of our business. It also highlights one of our key competitive advantages, our global footprint and the benefits of being able to access resources worldwide.
This is an important development for us and we assure you that there will be no change in service level as a result of our rebranding. To reflect the name change, we will also be changing our internet website address to www.assetmanagement.hsbc.com/sg.
I would like to take this opportunity to reiterate our commitment to providing you with a world-class asset management proposition now and in future. If you have any questions regarding the changes or how we can serve you better.
Yours sincerely
Mah Yeok Fun Chief Executive Officer HSBC Global Asset Management (Singapore) Limited This is a system generated message, no signature is required.
Important Notice for Singapore Shareholders This Annual Report of HSBC Global Investment Funds (“the Company”) covers the complete range of sub-funds in the Company, which are available for distribution in various jurisdictions. Singapore shareholders are advised that the Monetary Authority of Singapore has only recognised the following sub-funds of the Company for distribution in Singapore pursuant to the Securities and Futures Act: Recognised Scheme 1) HSBC GIF Asia Freestyle 2) HSBC GIF Asia ex Japan Equity 3) HSBC GIF Asia Pacific ex Japan Equity High Dividend 4) HSBC GIF BRIC Freestyle 5) HSBC GIF Chinese Equity 6) HSBC GIF Emerging Wealth 7) HSBC GIF European Equity 8) HSBC GIF Euroland Equity 9) HSBC GIF Euroland Equity Smaller Companies 10) HSBC GIF European Equity High Dividend 11) HSBC GIF Global Emerging Markets Equity Freestyle 12) HSBC GIF Global Emerging Markets Bond 13) HSBC GIF Global Core Plus Bond 14) HSBC GIF Global Equity 15) HSBC GIF Global Emerging Markets Equity 16) HSBC GIF Indian Equity 17) HSBC GIF Japanese Equity 18) HSBC GIF Singapore Equity 19) HSBC GIF Thai Equity 20) HSBC GIF US Equity
Restricted Recognised Scheme 1) HSBC GIF Asia ex Japan Equity Smaller Companies 2) HSBC GIF Brazil Equity 3) HSBC GIF Climate Change 4) HSBC GIF Hong Kong Equity 5) HSBC GIF Korean Equity 6) HSBC GIF Russia Equity 7) HSBC GIF US Dollar Reserve 8) HSBC GIF US Dollar Core Plus Bond 9) HSBC GIF US Index 10) HSBC GIF UK Equity This document is prepared by HSBC Global Asset Management (Singapore) Limited and should not be considered to be a recommendation by HSBC Global Asset Management (Singapore) Limited to any reader of this material to buy or sell securities, commodities, currencies or other investments referred to herein. It is published for information only and does not have any regard to the specific investment objectives, financial situation and the particular needs of any specific person who may receive this document. Investors may wish to seek advice from a financial advisor before purchasing units in the fund. In the event that the investor chooses not to seek advice from a financial advisor, he should consider whether the fund in question is suitable for him. Past performance and any forecast are not necessarily indicative of any future or likely performance of the Funds. The value of investments may rise as well as fall. Investors should read the prospectus available from our website http://www.assetmanagement.hsbc.com/sg or our authorized agents before investing.
Audited report for the year from 1 April 2007 to 31 March 2008
Société d'Investissement à Capital Variable (SICAV), Luxembourg
HSBC Global Investment Funds 1
Information concerning the distribution of shares of HSBC Global Investment Funds in Switzerland or from Switzerland. HSBC Private Bank (Suisse) SA, Quai du Général Guisan 2, casepostale 3580 CH-1211 Geneva 3, is the legal representative of the Fund in Switzerland and the Fund's payingagent. The prospectus, simplified prospectuses, articles and annual and semi-annual reports of the Fund maybe obtained free of charge upon request from the HSBC Private Bank (Suisse) S.A. A breakdown of all thetransactions carried outon behalf of each sub-fund of HSBC Global Investment Funds in the period under review can be obtained, freeof charge, from the Fund's representative in Switzerland.
Information concerning the distribution of shares of HSBC Global Investment Funds in Germany or from Germany. HSBC Trinkaus & Burkhardt AG, 21-23 Königsallee, D-40212Düsseldorf, is the legal representative of the Fund in Germany and the Fund's paying agent. The prospectus,simplified prospectuses, articles and annual and semi-annual reports of the Fund may be obtained free ofcharge upon request from the HSBC Trinkaus & Burkhardt AG. A breakdown of all the transactions carried outon behalf of each sub-fund of HSBC Global Investment Funds in the period under review can be obtained,free of charge, from the Fund's representative in Germany.
No subscription can be received on the basis of financial reports. Subscriptions are only valid if made on thebasis of the current prospectus accompanied by the latest annual and the most recent semi-annual report, ifpublished thereafter.
Audited report for the year from 1 April 2007 to 31 March 2008
HSBC Global Investment Funds 2
Table of Contents
Board of Directors 4
Management and Administration 5
Directors’ Report 7
Auditor’s Report 16
Statement of Net Assets as at 31 March 2008 17
Key Figures as at 31 March 2008 28
Statement of Operations and Changes in Net Assets 39
Notes to the Financial Statements 51
Comparative Table of Net Assets 91
Portfolio of Investments and Other Net Assets 108
Currency Conversion Table 219
Dealing Days of the Fund 220
Non-Dealing Days of the Fund 221
HSBC Global Investment Funds 3
Board of Directors
Simeon Brown, Chief Operating Officer, HSBC Global Asset Management (UK) Limited,78 St James Street, London, United Kingdom (resigned on 21 September 2007)
Thies Clemenz, Chief Operating Officer, HSBC Global Asset Management Deutschland Gmbh Königsallee 21/23, 40212 Düsseldorf, Germany.
Didier Deleage , Chief Operating Officer, HSBC Global Asset Management (France), 4, Place de la Pyramide, Immeuble Ile de France, La Défense 9, 92800 Puteaux, France.
David Dibben, Chief Operating Officer - Global Funds, HSBC Global Asset Management Limited, 21st Floor, 8 Canada Square, Canary Wharf, London E14 5HQ, United Kingdom.
Deshmukh-Rao Dhondee, Assistant Manager, HSBC Offshore Banking Unit, The Hongkong and Shanghai Banking Corporation Limited, Les Cascades, 5th Floor, Edith Cavell Street, Port Louis, Mauritius. (resigned on 31 May 2007)
George Efthimiou, Global Chief Operating Officer, HSBC Global Asset Management Limited, 21st Floor , 8 Canada Square, Canary Wharf, London E14 5HQ, United Kingdom.
Jennifer Foo Chin Hau Kau Fong, Vice President, Customer Services, Global Business, The Hongkong and Shanghai Banking Corporation Limited, Les Cascades, 5th Floor, Edith Cavell Street, Port Louis, Mauritius. (since 31 May 2007)
Bryan Greener, Head of Global Product Management, HSBC Global Asset Management Limited, Level 21, 8 Canada Square, London E14 5HQ, United Kingdom. (resigned on 4 October 2007)
David Silvester, Head of Global Product Management, HSBC Global Asset Management Limited, 21st Floor , 8 Canada Square, Canary Wharf, London E14 5HQ, United Kingdom. (since 4 October 2007)
Edmund Stokes, Global Chief Operating Officer, HSBC Asia/Pacific, HSBC Investments (Hong Kong) Limited Level 22 HSBC Main Building, 1 Queen’s Road Central, Hong Kong. (since 4 October 2007)
Sylvie Vigneaux, Head of Regulatory and Wealth Engineering, HSBC Investments (France), 4, Place de la Pyramide, Immeuble Ile de France, La Défense 9, 92800 Puteaux, France.
* HSBC Investments and HSBC Group Investment Businesses Limited was renamed HSBC Global Asset Management as of 2 June 2008. This report reflects the new names.
HSBC Global Investment Funds 4
Management and Administration
� Registered Office40, avenue Monterey, L-2163 Luxembourg, Grand Duchy of Luxembourg.
� Management CompanyHSBC Investment Funds (Luxembourg) S.A., 40, avenue Monterey, L-2163 Luxembourg, Grand Duchy of Luxembourg.
� Custodian, Administration Agent, Transfer Agent and Central Paying AgentRBC Dexia Investor Services Bank S.A., 14, Porte de France, L- 4360 Esch-sur-Alzette, Grand Duchy of Luxembourg.
� Investment AdvisersHalbis Capital Management (USA) Inc. (formerly HSBC Halbis Partners (USA) Inc), 452 Fifth Avenue, 18th Floor, New York, NY 10018, USA.
Halbis Capital Management (Hong Kong) Limited (formerly HSBC Halbis Partners (Hong Kong) Limited), HSBC Main Building, 1, Queen’s Road Central, Hong Kong.
Halbis Capital Management (UK) Limited (formerly HSBC Halbis Partners (UK) Limited), 8, Canada Square, London E14 5HQ, United Kingdom.
Halbis Capital Management (France) (formerly HSBC Halbis Partners (France)), Immeuble Ile de France, 4, Place de la Pyramide, La Défense 9, 92800 Puteaux, France.
HSBC Bank Brazil SA - Banco Múltiplo, Travessa Olivera Belo, 11-B, 80020-030 Curitiba, Brazil.
HSBC Global Asset Management (Hong Kong) Limited, HSBC Main Building, 1, Queen's Road, Central, Hong Kong.
HSBC Global Asset Management (Singapore) Limited, 21 Collyer Quay, # 15-02 HSBC Building, Singapore 049320, Singapore.
HSBC Global Asset Management (USA) Inc., 452 Fifth Avenue, 18th Floor, New York, NY 10018, USA.
HSBC Global Asset Management (UK) Limited, 78 St James Street, London SW1A 1EJ, United Kingdom. (until 21 May 2007)
HSBC Global Asset Management FCP (France), (formerly HSBC FCP2 (France)), Immeuble Ile de France, 4, Place de la Pyramide, La Défense 9, 92800 Puteaux, France.
HSBC Global Asset Management Deutschland GmbH, Königsallee 21/23, D-40212 Düsseldorf, Germany.
Sinopia Asset Management (UK) Limited, 8, Canada Square, London E14 5HQ, United Kingdom (since 21 May 2007).
Sinopia Asset Management, 4, Place de la Pyramide, La Défense 9, 92800 Puteaux, France.
� Share DistributorsGlobal DistributorHSBC Investment Funds (Luxembourg) S.A., 40, avenue Monterey, L-2163 Luxembourg, Grand Duchy of Luxembourg.
Austria, Germany and Eastern Europe Share DistributorHSBC Trinkaus & Burkhardt AG, Königsallee 21/23, D-40212 Düsseldorf, Germany.
Hong Kong Representative and Share DistributorHSBC Investment Funds (Hong Kong) Limited, HSBC Main Building, 1 Queen's Road Central, Hong Kong.
HSBC Global Investment Funds 5
Management and Administration (continued)
� Share Distributors (continued)
United Kingdom Representative and Share DistributorHSBC Global Asset Management (UK) Limited, 78 St James Street, London SW1A 1EJ, United Kingdom.
Republic of Ireland RepresentativeHSBC Securities Services (Ireland) Limited, HSBC House, Harcourt Centre, Harcourt Street, Dublin 2, Ireland.
Jersey RepresentativeHSBC Funds Nominee (Jersey) Limited, HSBC House, Esplanade, St Helier, Jersey, JE1 1HS Channel Islands.
Singapore Representative and Share DistributorHSBC Global Asset Management (Singapore) Limited, 21, Collyer Quay, #15-02 HSBC Building, Singapore 049320, Singapore.
Swiss Representative and Paying Agent in SwitzerlandHSBC Private Bank (Suisse) S.A., Quai du Général Guisan 2, Case postale 3580, CH-1211 Geneva 3, Switzerland.
Korea Representative and Share DistributorHSBC Korea Ltd, HSBC Building #25, 1-Ka, Bongrae-Dong, Chung-Ku, Seoul, Korea.
Distributor for Continental EuropeHSBC Global Asset Management (France), Immeuble Ile de France, 4, Place de la Pyramide, La Défense 9, 92800 Puteaux, France.
� Central Paying AgentRBC Dexia Investor Services Bank S.A., 14, Porte de France, L-4360 Esch-sur-Alzette, Grand Duchy of Luxembourg.
� Paying Agent in Hong KongThe Hongkong and Shanghai Banking Corporation Limited, HSBC Main Building, 1, Queen’s Road Central, Hong Kong.
� AuditorKPMG Audit S. à r. l., 9, allée Scheffer, L-2520 Luxembourg, Grand Duchy of Luxembourg.
� Legal AdvisersElvinger, Hoss and Prussen, 2, place Winston Churchill, B.P.425, L – 2014 Luxembourg, Grand Duchy of Luxembourg
HSBC Global Investment Funds 6
Directors’ Report
Directors CommentsThe Directors present the Audit Annual Report and Accounts for HSBC Global Investment Funds for year ending 31 March 2008.
Reserve Sub-Funds
HGIF Euro Reserve
For the year ending 31 March 2008, the fund returned 3.74% (net of fees, share class AC), against a benchmark return of 4.05%. The major event of this year was the US sub-prime crisis, which quickly shifted into a credit crunch and a liquidity crisis during the tail end of 2007. Over the last year, monetary and financial conditions got tighter. The fund took advantage of tensions in the money market which have pushed up short term rates. Even if Euro growth remains robust after two years of sustained growth, the Euro area economy should come back down. On the inflation side, energy and food prices add strong pressure, giving little room for the European Central Bank to cut rates to support growth. In this context, the strategy of the fund is to provide liquidity for the shareholders. We mainly invest in monthly bonds for the most significant part of the fund during last months.
HGIF US Dollar Reserve
For the year ending 31 March 2008, the fund delivered a return of 3.81% (net of fees, share class AC) under performing the benchmark by 0.15% in US dollar terms. With a stronger focus on safety and liquidity over the second half of 2007, the fund was weighted more heavily in treasury bills. As the Federal Reserve initiated various means of supporting liquidity, highlighted by 3% worth of easing, the fund has gradually shifted back into the taxable market, predominantly in the Banking and Financial sector.
Bond Sub-Funds
HGIF Brazil Bond
For the year ending 31 March 2008, the fund delivered a return of 17.22% in USD terms (net of fees, share class AC), compared to the benchmark return of 31.10%. The performance of the Brazilian currency was a key factor, buoyed by positive fundamentals: attractive interest rates, high level of reserves, and an international environment that is particularly favorable to commodities exporters. While the basic rate dropped 150 bps to 11.25%, worries about above potential growth and its effects on inflation caused the long end of the curve to widen by 200 bps in the last 6 months, affecting bond returns.
HGIF Euro Core Bond
For the year ending 31 March 2008, the fund delivered a return of 1.28% (net of fees, share class AD) underperforming the benchmark by 0.63%. A prudent policy in terms of asset allocation and issuer selection minimized the impact of the financial crisis on performance: Before the outbreak of the credit crisis the fund maintained a lower exposure than the benchmark to credit risk, favouring higher-rated bonds rather than speculative ones but we added progressively more and more exposure and we finally suffered from our credit exposure. Moreover the recent strong and rapid flattening of the European government rate curve was negative for our steepening position in the first quarter 2008.
HGIF Euro Core Credit Bond
For the year ending 31 March 2008, the fund delivered a return of -4.06% (net of fees, share class AC) underperforming the benchmark by 1.51%. The massive credit sell-off since July 2007 has badly affected the fund's performance. With a high yield bucket around 8 % (10% max), compared to a pure investment grade benchmark, the challenge was hard. Despite numerous profitable operations in the primary market our overweight on financial subordinated bonds had a negative impact in this financial turmoil. However, the recent events surrounding mid-March (Bear Stern’s rescue, primary dealer credit facility, massive liquidity injections) seem to have marked a key turning point in market sentiment and last month's performance was positive vs benchmark.
HGIF Euro High Yield Bond
For the year ending 31 March 2008, the fund delivered a return of -9.73% (net of fees, share class AC) outperforming the benchmark by 0.98%. A prudent policy in terms of asset allocation and issuer selection were the main contributors to this outperformance: before the outbreak of the credit crisis the fund maintained a lower exposure than the benchmark to credit risk, favouring higher-rated bonds rather than the most speculative ones. As the credit crisis developed, the fund progressively took more and more exposure to the market as we felt adequately remunerated for doing so. Currently the fund has a high exposure to the Euro High Yield market but we keep an average credit quality higher than the benchmark because of a significant underweight position on the most speculative bonds.
HSBC Global Investment Funds 7
Directors’ Report (continued)
HGIF European Government Bond
For the year ending 31 March 2008, the fund delivered a return of 0.08% (net of fees, share class AC) underperforming the benchmark by 1.28% in Euro terms. The fund was positioned partly long credit and European Eastern countries when the financial crisis began in the early summer. As a result of this substantial reassessment of risk, the fund underperformed its benchmark which induced large redemptions in an illiquid environment. At end of March 2008, the fund was running 0.50% higher than its benchmark which should be positive if the credit sentiment turns back.
HGIF Euro Strategic Credit Bond
For the year ending 31 March 2008, the fund returned -6.39% (net of fees, AC share class) against benchmark returns of -3.36%. Global credit markets experienced considerable volatility and saw spreads rise sharply across the board, as the US housing sector crisis and large write-downs of credit exposures by major financial institutions caused concerns about a weakening macro-economy. While the fund increased its underweight in high yield issuers over the course of the year due to worsening outlook, we decreased only slightly our overweight in subordinated financial and non-financial investment grade issuers for relative value reasons. In addition to the overweight in subordinated names, our credit curve positioning (overweight in the 5-10 year part) and the long-credit duration bias over the period added to the fund’s relative underperformance. Although macro risks arise from a further uptick on the inflation side due to rising commodity prices, we expect corporate fundamentals in the Eurozone to stay benign and supportive of spreads. Overall, as market tensions ease and fears of a systematic banking crisis abate, we have a modestly positive market outlook.
HGIF Global Core Plus Bond
For the year ending 31 March 2008, the Global Investment Grade Bond Fund returned 11.94% (net of fees, share class AC), underperforming the benchmark’s return of 15.25%. While the general decline in interest rates resulted in positive returns over the period for global fixed income investors, negative excess returns in credit and securitized product detracted from performance. The sectors hit the worst were high yield corporate bonds, CMBS, investment grade corporate credit and emerging markets, which suffered excessive negative returns. In addition, yield differentials and an increasingly questionable economic environment in the US contributed to a substantial depreciation of the US Dollar. Sector and security selection within the credits and securitized markets detracted from the fund’s overall performance.
HGIF Global Emerging Markets Bond
For the year ending March 2008, the Fund returned 2.68% (net of fees, AC share class). We gradually increased the fund’s exposure to local currency over the course of the year and this strategy contributed positively to performance. We also increased the exposure to USD-denominated corporate bonds when we felt there was more value over comparable sovereign issues. Emerging market fundamentals remain strong at this point although rising inflation levels are the source of longer-term concern. Strong technical factors in emerging markets have buoyed performance and we expect capital markets to strengthen. The current portfolio has few sovereign underweights/overweights vs. the index and it maintains small overweight holdings in local currency and corporate debt.
HGIF Global Emerging Markets Local Debt
Since its inception in July 2007 through March 2008, the Fund returned 4.92% (net of fees, AC share class) compared with the benchmark return of 4.00%. Country selection was the primary driver for positive performance during the period. We expanded the exposure beyond core emerging market countries by building positions in frontier markets in Asia and Africa. Emerging market fundamentals remain strong at this point although rising inflation levels are the source of longer-term concern. Strong technical factors in emerging markets have buoyed performance and we expect capital markets to strengthen. At the end of March 2008, the Fund was fully invested through a combination of cash and forward positions with a bias towards Latin America and underweight holdings in Eastern European markets and Asia.
HGIF Global High Yield Bond
For the year ending 31 March 2008, the Global High Yield Fund returned 3.29% (net of fees, share class AC, outperforming the benchmark’s return of -3.53%. Heightened risk aversion fuelled a flight-to-quality during the period as the Treasury market rallied. This, coupled with reduced expectations for economic growth caused credit spreads to widen and the high yield sector to under-perform US Treasuries over the period. The strategy’s underweight exposure to homebuilders and related sectors as well as financials and overweight to Energy proved beneficial during the period. These gains were somewhat mitigated by an overweight exposure in B-rated quality sector which slightly underperformed the BB-rated quality sectors.
HSBC Global Investment Funds 8
Directors’ Report (continued)
HGIF US Dollar Core Plus Bond
For the year ending 31 March 2008, the US Dollar Core Plus Bond Fund returned 1.45% (net of fees, share class AC), underperforming the benchmark’s return of 7.76%. While the general decline in interest rates resulted in positive returns over the period for US fixed income investors, negative excess returns in spread sectors detracted from performance. The sectors hit the worst over the period were securitized, high yield corporate bonds, investment grade corporate credit and emerging markets. The fund’s underperformance was the result of overweight allocations to the corporate and securitized sectors. These losses were somewhat mitigated by a long duration positioning relative to the benchmark which performed well as interest rates decreased.
Equity Sub-Funds
International and Regional Equity Sub-Funds
HGIF Asia ex Japan Equity
For the year ending 31 March 2008, the fund delivered a return of 14.20% (gross of fees, share class AC), underperforming the benchmark by 1.98% in US Dollar terms. Stock selection in Korea consumers, Taiwan materials and a favourable underweight to Chinese Financials offset underperformance in South East Asia, notably Singapore. The risk to earnings and inflationary pressures present potential difficulties to markets that are not necessarily immune to financial market volatility. Our emphasis in Asia continues to focus on themes that are uncorrelated to the global business and credit cycles, and domestic focused opportunities such as consumption and infrastructure. Value and dividends are a focus, as these characteristics offer defensive benefits in times of volatility.
HGIF Asia ex Japan Equity Smaller Companies
For the year ending 31 March 2008, the fund delivered a return of 3.85% (net of fees, share class AC) in US Dollar terms, compared with the benchmark return of 17.90%. Favourable stock selection in Malaysia and Taiwan materials were offset by underperformance in South East Asia, Hong Kong and China. The risk to earnings and inflationary pressures present potential difficulties for markets that are not necessarily immune to financial market volatility. Our emphasis in Asia continues to focus on themes that are uncorrelated to the global business and credit cycles, and domestic focused opportunities such as consumption and infrastructure. Value and dividends are a focus, as these characteristics offer defensive benefits in times of volatility.
HGIF Asia Pacific ex Japan Equity High Dividend
For the year ending 31 March 2008, the fund delivered a return of 17.55% (net of fees, share class AD), outperforming the benchmark by 5.90% in US Dollar terms. Stock selection in Malaysia, Taiwan and a favourable underweight position to Australia all contributed positively to relative performance. The risk to earnings and inflationary pressures are potential headwinds to markets that are not necessarily immune to financial market volatility. Our emphasis in Asia continues to focus on themes that are uncorrelated to the global business and credit cycles, and domestic focused opportunities such as consumption and infrastructure. Value and dividends are a focus, as these characteristics offer defensive benefits in times of volatility.
HGIF BRIC Markets
For the year ending 31 March 2008, the fund returned 32.40%, outperforming the index by 1.45% Of the four markets, Brazil saw the strongest performance over the period, rising 56.9%. Country allocation has generally favoured Brazil and Russia over the review period, while the China position has varied between marginally overweight to neutral. The recommended allocation to India remains consistently underweight relative to the equally weighted country benchmark.
HGIF BRIC Markets Equity
For the year ending 31 March 2008, HGIF BRIC Markets Equity returned 30.87% (net of fees, share class AC) in US Dollar terms compared with the benchmark return of 30.95%. Within the BRIC Markets, Brazil posted the strongest performance in US dollar terms. This market benefited from the rise of Petrobras and Vale do Rio Doce, which weigh nearly 50% of the MSCI Brazil index, and from the appreciation of the Real currency. In terms of performance ranking, Brazil was followed by India and China. Russia underperformed significantly the other BRIC markets. The fund benefited from its overweight exposure to Brazil.
HGIF Climate Change
HGIF Climate Change was launched on 9 November 2007. As of 31 March 2008, the fund has delivered a -19.06% performance (net of fees, share class AC). Main contributors to the Fund’s performance were Vestas Wind, Iberdrola, Ja Solar Holdings and Q-Cells. In the coming months the fund will maintain its current investment policy which primarily consists in selecting climate-change related stocks based upon a multi-criterion strategy.
HSBC Global Investment Funds 9
Directors’ Report (continued)
HGIF Emerging Europe Equity
For the year ending March 2008, the fund delivered a return of -9.05% (net of fees, share class AC) compared with the benchmark return of -5.94%. Despite Eastern European economies benefiting from higher oil prices and suffering little directly from the subprime crisis, most equity markets in the region were not able to decouple from the weak global equity trend. Stock selection in the Russian market as well as in Poland contributed positively to performance during the period whereas stock selection in the Turkish market contributed negatively. For 2008/09 we expect strong growth for Eastern Europe to continue, with inflation trends being one of the main risk factors. The fund manager continues to look for reasonably priced growth stocks benefiting from positive trends within the region, e.g. infrastructure investments.
HGIF Emerging Wealth
For the year ended 31 March 2008 and since its launch on 7 December 2007, HGIF Emerging Wealth returned -15.88% (net of fees, share class A) in US Dollar terms. The fund seeks to benefit from the emerging countries growth. With slowing economic perspectives, the fund benefited from its underexposure during the period. The financial sector underweight was the best contributor to the fund relative return. Our stock selection model is still unfavourable to bank stocks and prefers energy stocks. Unfortunately the fund was over exposed to energy and these stocks did not benefit in the past few months from the increasing oil price.
HGIF Euroland Equity
For the year ending 31 March 2008, the fund returned 12.63% (net of fees, share class AC), while equity markets in the Eurozone fell by circa 13%. The year was dominated by the crisis in the financial sectors, which led to severe tightening in credit conditions especially for the banking sector and by the clear slowing of the US, and therefore the global economy. The fund outperformed (performance numbers and share class needed), driven by the stock selection implemented. Key contributors to the overall performance of the fund were Telefonica, Grifols, Syngenta, Mittal Steel and Numico. Key detractors were found in the financial sector (Unicredito, ING) or in the mid-cap segment of the market (C&C, Smurfit Kappa). We continued to select stocks based on the relative under-appreciation by investors of their current and future profitability which delivers a low turnover portfolio. We reduced two underweight sector holdings namely in banking (BNP, Santander) and energy (Repsol). Key sectors healthcare (Fresenius, Grifols), insurance (Allianz) and telecoms (KPN, Telefonica) were maintained or even reinforced. Similarly, the fund remained underexposed to consumer goods and utilities. We foresee a volatile time for equity markets in the short term. This said, investors have already priced in a weaker background and, as the situation improves, we can expect markets to resume their upwards trend.
HGIF Euroland Equity Smaller Companies
The Euroland Equity Smaller Companies fund posted a return of -20.00% (net of fees, share class AC) and fell in line with the benchmark. Outperformance was mainly generated in the first six months of the period, before the US sub prime crisis. The growth bias of the portfolio was subsequently a negative despite profit-taking on high valuations at the end of July and a rebalancing in favour of more defensive stocks. After a difficult January, the fund recovered in February and March. The US Federal Reserve has taken forceful actions to restore confidence: real short-term interest rates are close to zero and should be highly supportive of global growth. The fund is currently a balanced portfolio, with some non-cyclical stocks but, in the main, growth companies with high visibility of earnings chosen for valuation reasons.
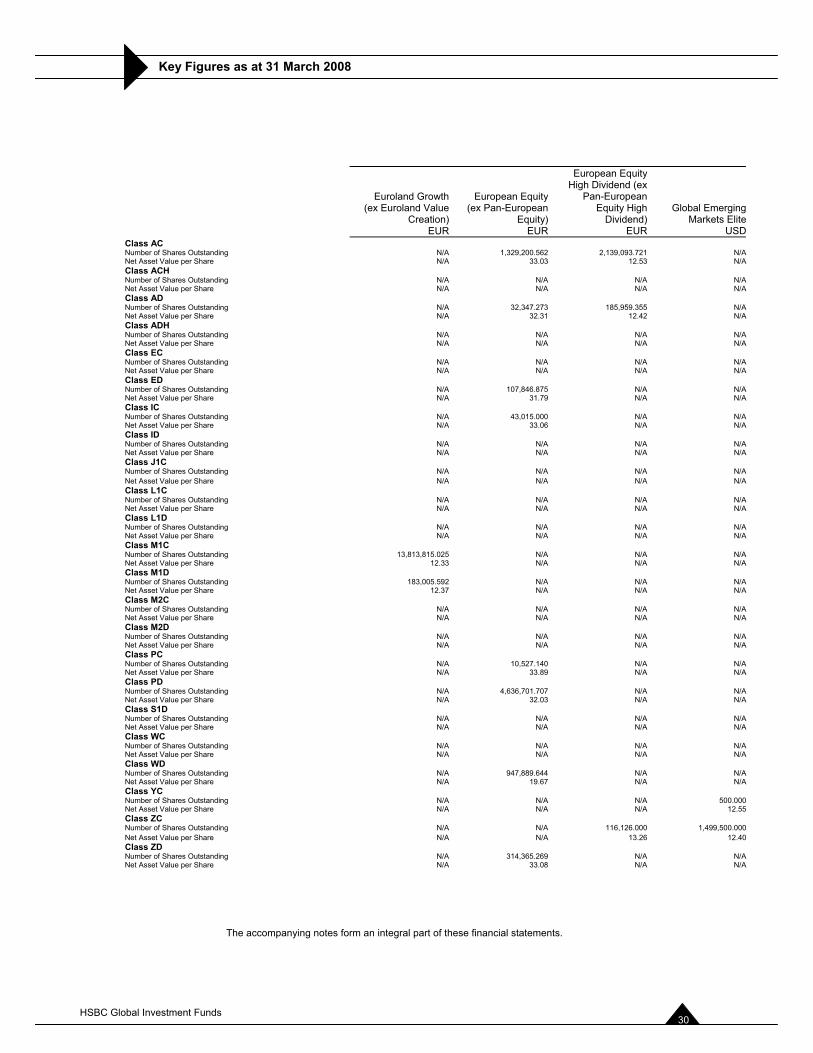
HGIF Euroland Growth (formerly Euroland Value Creation)
HSBC GIF Euroland Growth posted a return of -13.00% (net of fees, share class M1C) over 12 months ending 31 March 2008, against -12.70% for its benchmark. Performance was thus negative relative to the fund's benchmark. The fund changed strategy in late 2006 and adopted a growth bias. The fund changed its name from HSBC GIF Euroland Value Creation to HSBC GIF Euroland Growth to take into account this change in investment style. This past year is thus the first during which the fund's growth strategy has been clearly implemented. As such, the fund strongly benefited from the recent financial turmoil as investors sold overvalued leveraged companies and purchased less cyclical high-quality companies.
Because of the fund's growth orientation, the strategy focuses on a company's capital cycle; as such, all positions are held on the basis of long-term fundamentals; the approach consists in favouring rising fundamentals more than valuation opportunities arising from excess short-term volatility.
HGIF European Equity
For the year ending 31 March 2008, the fund returned -20.28% (net of fees, share class AC) underperforming the benchmark by -5.00%. The performance of the individual stocks reflected sector moves over this twelve month period which included significant global financial problems from August 2007. The weaker performances arose in financial stocks where companies faced significant write-downs from highly rated instruments linked to the US mortgage market. These included Hypo Real Estate, UniCredit and UBS. In addition, a number of investments fell because of concerns about cyclicality: Punch Taverns, Smurfit Kappa and Lanxess. The stronger performers were companies that have been able to grow cashflows in the current environment; Syngenta produces seeds and crop protection products; Acciona has grown its windfarm business; Nestle has restructured its portfolio of brands and manufacturing bases; and Casino has grown food sales through its successful value proposition.
HSBC Global Investment Funds 10
Directors’ Report (continued)
HGIF European Equity High Dividend
For the year ending 31 March 2008, the fund delivered a return of -22.30% (net of fees, share class AC) underperforming the benchmark. Over the last year, we have favoured dividend growth over high yield. In retrospect, this has been the right decision; however, mid caps both in the high yield and the high growth space contributed negatively. The relative underperformance has accentuated since last quarter as the fund took a more defensive bias with we got the timing wrong. For the coming months, we believe companies with strong dividend power, i.e. high yields that are relatively safe thanks to a low payout ratio and strong credit ratings should be more resilient in the face of an earnings recession. However, news flows and sentiment will continue to prevail in the short term and our high exposure to the financial sector could be volatile.
HGIF Global Emerging Markets Elite
For the year ending 31 March 2008, the fund delivered a return of 24.55% (net of fees, share class AC) compared with the benchmark return of 21.70%. 2007 saw global emerging markets perform strongly relative to broader global indices. The fund’s performance benefited from positive stock selection in the industrial sector in Egypt, particularly companies involved in the growth of infrastructure in the Middle East. Stock selection in the information technology sectors of Taiwan and Russia also contributed positively to performance. Over the first quarter of 2008, emerging markets corrected as global equity markets reacted to signs of a slowdown in economic growth and as investors considered the ramifications of the credit crisis in the financial system. We are inclined to think that the worst of the credit crisis is over, but remain cautious for the outlook for growth going forward, in the light of rising inflation and interest rates across the emerging world.
HGIF Global Emerging Markets Equity
For the year ending 31 March 2008, the fund delivered a return of 21.40% (net of fees, share class AC) compared with the benchmark return of 21.70%. 2007 saw global emerging markets perform strongly relative to broader global indices. The fund benefited from positive stock selection in the industrial sector in Egypt, particularly companies involved in the growth of infrastructure in the Middle East. Stock selection in the information technology sectors of Taiwan and Russia also contributed positively to performance. Over the first quarter of 2008, emerging markets corrected as global equity markets reacted to signs of a slowdown in economic growth and as investors considered the ramifications of the credit crisis in the financial system. We are inclined to think that the worst of the credit crisis is over, but remain cautious for the outlook for growth going forward, in the light of rising inflation and interest rates across the emerging world.
HGIF Global Equity
For the year ending 31 March 2008, the fund returned -2.15% (net of fees, share class AD) only slightly outperforming the benchmark by which fell 2.77%. The performance of the individual stocks reflected sector moves over this twelve month period which included significant global financial problems from August 2007. The weaker performances arose in financial stocks where companies faced significant write-downs from highly rated instruments linked to the US mortgage market. These included UniCredit, Merrill Lynch and AIG. In addition, the Japanese holdings were weak with the market underperforming the MSCI World. The stronger performers were companies that have been able to grow cashflows in the current environment: John Wood enjoyed significant growth in cashflows from supplying services to the booming oil industry; Rio Tinto was a strong beneficiary of rising commodity prices; the strong rise in the share price of Novo Nordisk reflected its strength and market dominance in supplying drugs and drug delivery systems to diabetics; and Syngenta produces seeds and crop protection products which have been in demand with food prices high.
HGIF Global Equity SRI
For the year ending 31 March 2008, the fund delivered a return of -7.61% (net of fees, share class AC), compared to a return of -2.77% for the MSCI World Index. Stock selection in the energy and materials sectors contributed negatively, offsetting positive stock selection in the automobiles and real estate sectors. An underweight in energy contributed negatively towards performance over the year, whilst an overweight in banks contributed positively. We continue to favour companies which have good valuation and momentum on our stock scoring system.
HGIF Sustainability Leaders
For the year ending 31 March 2008, the performance of the fund has lagged the benchmark significantly, against a slight outperformance, (gross of fees of 0.2%) last year to an underperformance gross of fees of –23.70% at end March 2008 (share class M1C). The strategy of the fund is to focus on the best SRI-ranked stocks in the Pan European universe with an emphasis on environmentally friendly small caps. The underperformance of the best SRI companies over the last 12 months has been unprecedented during a period that has favoured momentum factors over fundamental valuation factors. Exposure to small caps, financial companies, materials and capital goods particularly in smaller companies with innovative technologies has also been a major contributor to this underperformance.
HSBC Global Investment Funds 11
Directors’ Report (continued)
Market Specific Equity Sub-Funds
HGIF Brazil Equity
The market had a strong absolute performance during the period due to the positive local fundamentals with inflation under control, a good fiscal position and strong external accounts. In such an environment, Brazilian companies delivered earnings growth in excess of 25% in USD during the period. This fact explains a good part of the performance. Before the sub prime crisis in the US in August, the market performance was broad based with small and mid caps doing even better than large caps. After the start of the crisis, the liquid and mega caps outperformed. This fact explains part of the relative underperformance of the fund in the second part of the period. However, even after the crisis, the macro situation remains solid with GDP growing by more than 4.5%, record foreign reserves and good fiscal situation.
HGIF Chinese Equity
For the year ending 31 March 2008, the fund delivered a return of 19.10% (gross of fees, share class AC), compared with the benchmark return of 29.80%. Investors displayed appetite for investing in China, especially during the first half of the year. Stock selection was mixed with positive stock selection from financials and materials. Energy, consumers and telecommunications were negative contributors. With the market having corrected since the beginning of 2008, inflationary pressures and global volatility present potential setbacks. Consequently, our emphasis in China continues to focus on domestic themes and opportunities such as consumption and infrastructure.
HGIF Hong Kong Equity
For the year ending 31 March 2008, the fund delivered a return of 12.05% (gross of fees, share class AC), underperforming the benchmark by 497 basis points in US Dollar terms. Favourable stock selection in Financials, energy and industrials was offset by underperformance in technology, utilities and materials. With the market having corrected since the beginning of 2008, value is slowly reappearing. The risk to earnings however and inflationary pressures present potential difficulties for a market that is not necessarily immune to global financial market volatility.
HGIF Indian Equity
For the year ending 31 March 2008, the fund delivered a return of 38.54% (gross of fees, share class AC), outperforming the benchmark by 7.87% in US Dollar terms. Favourable contributions came from overweights to materials, technology and underweights to telecommunications and financials complimented strong stock selection. With the market having come down significantly in the first quarter of 2008, valuations are at a more reasonable level. While the economy is decelerating, we see little risk to at least mid-teens earnings growth over the next 3-4 years and an expansionary fiscal policy stance should boost consumption further. We continue to favour deep value sectors such as material and technology and underweight sectors with excessive valuations.
HGIF Japanese Equity
For the year ending 31 March 2008, the Japanese Equity Fund (share class AD) returned –30.43% (net of fees) in Japanese yen terms, underperforming its peer group average. The Fund’s underperformance is mainly due to the stock selection negative results, over Q4-2007 and Q1 2008. Stock selection underperformance is mainly due to the exposure to most liquid stocks that suffered at most from the flight to quality generated by sub prime mortgage crisis. The sector allocation results were nevertheless, significantly positive, mainly gains stemming from exporters’ over-weighting in Q4-2008 as well as utilities’ underweighting over the whole period. Risk was strictly monitored, which was critical as market volatility skyrocketed by July 2007. Our expectations for the Japanese market are moderate. Valuations are attractive but protracted earning downgrades currently alter our positive signal strength. We remain positive on the Japanese equities in the medium term with a preference towards capital good stocks.
HGIF Korean Equity
For the year ending 31 March 2008, the fund delivered a return of 12.42% (gross of fees, share class AC) in US Dollar terms. Favourable stock selection in consumer related industries and the materials and technology sector contributed positively to performance. The risk to earnings and inflationary pressures present potential difficulties for a market that is exposed to the global growth cycle. Positively, the Korean market appears reasonable value, trading at a discount to the region. Moreover, the global cyclical sectors (shipbuilding, machinery, refineries) which have corrected significantly in the beginning of 2008 should rebound on positive global macroeconomic data.
HGIF Russia Equity
The fund was launched on 17 December 2007. From its inception date to the end of March 2008 the fund delivered a return of -6.95% (gross of fees, share class AC) outperforming the benchmark by 0.33% in US dollar terms. Since launch, the fund was overweight coal and underweight oil, which was positive for performance. Over the first quarter of 2008, the Russian equity market corrected as global equity markets reacted to signs of a slowdown in economic growth and as investors considered the ramifications of the credit crisis in the financial system. We are inclined to think that the worst of the credit crisis is over, but remain cautious for the outlook for growth going forward, in the light of rising inflation and interest rates across the emerging world. Relatively to other global emerging markets, however, we remain positive on the long-term outlook for the Russia and continue to find excellent investment opportunities.
HSBC Global Investment Funds 12
Directors’ Report (continued)
HGIF Singapore Equity
For the year ending 31 March 2008, the fund delivered a return of -16.47% (net of fees, share class AC), underperforming the benchmark by 24.00%. Favourable allocations to materials and consumers were offset by negative contribution from several sectors, notably property and tourism and leisure. Valuations going into 2008 remain reasonably attractive; however with a strengthening Singapore dollar and rising costs, we are cautious in the shorter term with a focus on companies with a domestic focus.
HGIF Thai Equity
For the year ending 31 March 2008, the fund delivered a return of 35.56% (net of fees, share class AC), underperforming the benchmark by 4.77%. Favourable asset allocations in materials and utilities and positive stock selection in Financials and materials was offset by negative stock selection in the telecommunication and consumer sectors. Thailand remains inexpensive relative to other Asian markets and we believe that, notwithstanding the perception of lingering political risk, domestic demand could be positive in the forthcoming year as the government continues to support the domestic economy further with an expansionary fiscal policy.
HGIF UK Equity
For the year ending March 2008, the fund returned -7.76% (net of fees, share class AC) compared to the benchmark return of -7.70%. The performance of the individual stocks reflected sector moves over this twelve month period which included significant global financial problems from August 2007. The weaker performances arose in Financial stocks such as HBOS which has faced significant write-downs from highly rated instruments linked to the US mortgage market. In addition, a number of investments fell because of concerns about cyclicality: Punch Taverns, United Business Media and SIG. The stronger performers were generally in the Basic Materials and Oil & Gas sectors with Johnson Matthey enjoying high demand for platinum-group products, Petrofac benefiting from better pricing and demand for its oil services and BG Group discovering significant new gas fields in Brazil.
HGIF US Equity
For the year ending 31 March 2008, HGIF US Equity delivered a -3.57% loss (gross of fees, share AC) in US dollar terms, outperforming its peer group average, which declined by 5.10%. The US market posted its biggest drop since August after banks and brokerages wrote down holdings of debt securities and set aside more money for bad loans. The fund benefited from good sector allocation based on our quantitative valuation of the market. The main gain came from the underweighting of the financial sector. The stockpicking, based on a stock’s selection within the sectors with strong earning momentum, also generated a positive contribution to the fund performance. We anticipate a protracted slowdown of the US economy and further negative impact on US companies’ earnings. Accordingly, our valuation signals deteriorated as opportunities are now lower.
HGIF US Index
The overall performance of the fund to the 31 March 2008 was -6.94%, compared with the benchmark return of -5.10%, (gross of fees, share class AC).
From the 1 April 2007 until the end of September 2007, the fund returned +8.50% (gross of fees) in US dollar terms. Within the S&P 500 index, the best performing sectors were Energy, Information Technology and Industrials whilst Insurance, Consumer Discretionary and Financials underperformed the index. The housing crisis that started in July in the US and the extraordinary rise of the oil prices (the oil index WTI rose 17.10% over that period) during September especially, mainly explains the sector breakdown of the contribution to return over the period. The period was strongly volatile and came back to a rising trend at the end of the period only with the help of the FED cutting its interest rates by 0.50%.
Over the fourth quarter of 2007, the oil price experienced sustained gains, posting a succession of fresh record highs. US inventories declined, demand remained strong and OPEC resisted calls for production increases. Ongoing turbulence in the US-sub-prime market continued to pervade world financial markets and the credit crunch showed no signs of improvement as inter-bank lending rates returned to the levels experienced during the summer. December saw the US Federal Reserve cut interest rates by 0.25% to 4.25%. The outlook for the US economy fluctuated throughout the fourth quarter. The third quarter earnings season provided an unconvincing start, with Alcoa missing estimates and investment banks formalising their sub-prime losses. Merrill Lynch fell sharply during October, as the group dramatically increased the write down of sub-prime related assets.
Over the last three months, escalating concerns about the outlook for the global economy, further worrying headlines emanating from the financial sector and a marked downturn in corporate earnings all added to the overwhelming sense of nervousness among investors. The extent of concern was demonstrated in the US Federal Reserve’s unexpected reduction in interest rates, with a 0.75% cut being implemented just a matter of days before the scheduled January meeting, where rates were reduced by a further 0.5%. The US Federal Reserve downgraded their growth expectations, whilst simultaneously increasing their forecast for inflation, a scenario that raised worries about stagflation. The adverse market conditions also hit previous stock market favourites, including the likes of Apple, which fell 31% over January as a result of concerns about consumer spending and also following the outlook statement from the group. Microsoft was also in the headlines as the group announced a $44bn bid for Yahoo, and was fined $1.4bn later in the month by European regulators on anti-trust issues.
HSBC Global Investment Funds 13
Directors’ Report (continued)
For the period starting 1 October 2007 and ending 31 March 2008, the S&P500 returned -12.50%. Consumer Staples, Energy and Materials were the best performing sectors returning and Financials, Telecommunication Services and Consumer Discretionary underperformed the index. At the end of March 2008, the funds stood at 38.3 million USD. The ex-ante tracking error calculated with Barra remained low through the period with 0.02%.
Freestyle Sub-Funds
HGIF Asia Freestyle
For the year ending 31 March 2008, the fund delivered a return of 14.94% (gross of fees, share class AC) in US Dollar terms. Stock selection in China and Taiwan contributed positively to the portfolio, conversely selection in Singapore was less favourable. The risk to earnings and inflationary pressures present potential difficulties for to markets that are not necessarily immune to financial market volatility. Our emphasis in Asia continues to focus on themes that are uncorrelated to the global business and credit cycles, and domestic focused opportunities such as consumption and infrastructure. Value and dividends are a focus, as these characteristics that offer defensive benefits in times of volatility.
HGIF BRIC Freestyle
For the year ending March 2008, the fund delivered a return of 26.30% (gross of fees, share class M1C) . The fund benefited from its positions in Latin America. Brazil, which is a large component of the fund, delivered the highest absolute return. Brazilian energy and materials positions performed particularly well. Materials and telecoms holdings in China contributed to making China the second best contributor to the fund’s absolute return. India and Russia also had positive performances over the year. Of the four markets in the BRIC fund, the position in Russia was the largest, based upon a positive outlook of its economy and companies within it, relative to the other three. The smallest relative position was in India, where the outlook for the short term is not so positive although the long-term view remains strong. Over the first quarter of 2008, the BRIC markets corrected as global equity markets reacted to signs of a slowdown in economic growth. Investors considered the ramifications of the credit crisis in the financial system and what these issues would do to economic growth in these markets. We are inclined to think that the worst of the credit crisis is over, but remain cautious for the outlook for growth going forward, in the light of rising inflation and interest rates across the emerging world.
HGIF Global Emerging Markets Equity Freestyle
For the year ending March 2008, the fund delivered a return of 17.86% (gross of fees, share class M1C). In Asia, positions in the fund in Taiwan and Korea made strong contributions to the absolute return. The fund’s performance benefited from positions in Latin America. Brazil, which is a large component of the fund, delivered a positive contribution to the absolute return. The fund’s performance also benefited from positions in the industrial sector in Egypt, particularly companies involved in the growth of infrastructure in the Middle East. Over the first quarter of 2008, emerging markets corrected as global equity markets reacted to signs of a slowdown in economic growth and as investors considered the ramifications of the credit crisis in the financial system. We are inclined to think that the worst of the credit crisis is over, but remain cautious for the outlook for growth going forward, in the light of rising inflation and interest rates across the emerging world.
HGIF Latin American Freestyle
For the year ending 31 March 2008, the fund delivered a return of 30.20% (gross of fees, share class M1C). The Latin American markets had a good overall performance over the period performance numbers and share class needed. The region benefited not only from the stronger commodities’ prices but also from good internal fundamentals: inflation remains under control (on average around 5%), the fiscal situation has improved and there is more credit available. The best performing countries over the period were Peru and Brazil. Mexico lagged mainly in the second half of 2007 as a consequence of the slowdown in the US economy but recovered part of the underperformance in the first three months of 2008. The good situation in the region is a consequence of the set of good economic policies adopted in the recent year, namely inflation targeting, flexible exchange rates and sensible fiscal policies. With a few exceptions (Argentina, Venezuela, Colombian and Ecuador) most of the countries have adopted those policies. As a result, the region did very well despite the crisis in the US.
HSBC Global Investment Funds 14
Directors’ Report (continued)
Other Sub-Funds
HGIF Global Discount Certificates
The fund was launched on August 20th 2007 and exclusively invests in Discount Certificates. Until 31 March 2008 the fund (gross of fees, AC share class) returned -0.31 % with very low volatility (7.50% p.a.), while a lot of major equity indices lost 10% or more. The fund benefited from rising commodity markets. The financial crisis led to higher volatilities, which temporary weighed on the price of the fund but offered very good opportunities for new investments. The target yield of 6.00% per annum to 8.00% per annum is still accessible.
The fund reduced its’ proportion in commodity related Discount Certificates during rising commodity markets and used the high volatilities in equity markets to buy Discount Certificates with high safety cushions.
Due to the financial crisis and macro risks we expect equity markets to stay very volatile. This is a very beneficial environment for Discount Certificates, because new investments can be made on a very attractive volatility level. We stay overweighted in equity Discount Certificates due to rising risks in commodity markets.
HGIF Halbis Global Macro
The fund returned 0.80% since its inception in June 2007 (net of fees, share class LC). Over this period, which was marked by a severe financial crisis, the SP500 fell by 15%. The overall performance of the fund was penalised by strategies which seek to extract performance by going long assets with high risk premia and short assets with low risk premia. Indeed, the financial crisis triggered a deep flight to quality which penalised risky assets. Among these, the currency strategy was the most affected. On the other hand, performance was helped by discretionary strategies which were rightly positioned in anticipation of a significant cyclical turn-around led by the US economy. Such strategies were short equity markets on average over the period, and therefore benefited from the crisis. They were also rightly positioned to benefit from a depreciation of currencies which had been supported by high interest rates over a long period of time, but were likely to suffer in the event of a sharp reversal of the global housing boom. The performance of discretionary strategies was somewhat adversely affected by a short duration position justified by the over-valuation of bonds.
HGIF New World Income
Since its inception in June 2007 through March 2008, the Fund returned 1.46% (net of fees, M1D share class). The Fund was lightly invested through year-end as we paced the investments to capitalise on negative economic news. Performance was driven by country selection and subsequent allocation to sovereign and corporate bonds and increased exposure to local currency. Emerging market fundamentals remain strong at this point although rising inflation levels are the source of longer-term concern. Strong technical factors in emerging markets have buoyed performance and we expect capital markets to strengthen. We are positioning the portfolio to be short government bonds from countries with high current account deficits with a focus shorter duration corporate bonds and long local currency instruments.
HGIF Turkish Convergence
With the closure case of leading Ak Party at the supreme court, Turkey added political turmoil to the unfavourable liquidity and credit conditions in global markets, which led to extreme weakness in Turkish markets. Over the year to 31 March 2008, the fund fell by 15.68% (net of fees, share class AC). The fund underperformed the benchmark significantly, wiping away the outperformance that had accumulated since inception. The main reasons for the underperformance were staying underweight in equities in the term before presidential selections in 2007, as the fund manager had expected political impasse, and underweight positions in Garantibank and Eregli shares. We expect political uncertainty to weigh on market sentiment and economic activity, until closure which is unlikely before Q4 2008. Besides, the central bank has dropped its easing bias and given the signs of future rate hikes because of increasing inflationary pressures. We believe that Turkish markets possess the potential of high returns if we see a sustained recovery in global financial markets.
.
HSBC Global Investment Funds 15
Auditor’s Report
To the Shareholders of HSBC Global Investment Funds 40, avenue Monterey L-2163 Luxembourg Grand Duchy of Luxembourg
REPORT OF THE REVISEUR D'ENTREPRISES
Following our appointment by the annual general meeting of the shareholders dated 27 July 2007, we have audited the accompanying financial statements of HSBC Global Investment Funds (“the SICAV”) and each of its sub-funds, which comprise the statement of net assets and the portfolio of investments and other net assets as at 31 March 2008 and the statement of operations and the statement of changes in net assets for the year then ended, and a summary of significant accounting policies and other explanatory notes.
Board of Directors’ responsibility for the financial statements The Board of Directors of the SICAV is responsible for the preparation and fair presentation of these financial statements in accordance with Luxembourg legal and regulatory requirements relating to the preparation of financial statements. This responsibility includes: designing, implementing and maintaining internal control relevant to thepreparation and fair presentation of financial statements that are free from material misstatement, whetherdue to fraud or error; selecting and applying appropriate accounting policies; and making accounting estimates that are reasonable in the circumstances.
Responsibility of the Réviseur d'Entreprises Our responsibility is to express an opinion on these financial statements based on our audit. We conducted our audit in accordance with International Standards on Auditing as adopted by the Institut des Réviseurs d'Entreprises. Those standards require that we comply with ethical requirements and plan and perform the audit to obtain reasonable assurance whether the financial statements are free from material misstatement.
An audit involves performing procedures to obtain audit evidence about the amounts and disclosures in the financial statements. The procedures selected depend on the judgment of the Réviseur d'Entreprises, including the assessment of the risks of material misstatement of the financial statements, whether due to fraud or error. In making those risk assessments, the Réviseur d'Entreprises considers internal control relevant to the entity's preparation and fair presentation of the financial statements in order to design audit procedures that are appropriate in the circumstances, but not for the purpose of expressing an opinion on the effectiveness of the entity's internal control. An audit also includes evaluating the appropriateness of accounting policies used and the reasonableness of accounting estimates made by the Board of Directors of the SICAV, as well as evaluating the overall presentation of the financial statements. We believe that the audit evidence we have obtained is sufficient and appropriate to provide a basis for our audit opinion.
Opinion In our opinion, the financial statements give a true and fair view of the financial position of HSBC Global Investment Funds and each of its sub-funds as of 31 March 2008, and of the results of its operations and changes in its net assets for the year then ended in accordance with the Luxembourg legal and regulatory requirements relating to the preparation of the financial statements.
Other matter Supplementary information included in the annual report has been reviewed in the context of our mandate but has not been subject to specific audit procedures carried out in accordance with the standards described above. Consequently, we express no opinion on such information. However, we have no observation to make concerning such information in the context of the financial statements taken as a whole.
Luxembourg, 7 July 2008
KPMG Audit S.à r.l.Réviseurs d'Entreprises
R. Beegun
HSBC Global Investment Funds 16
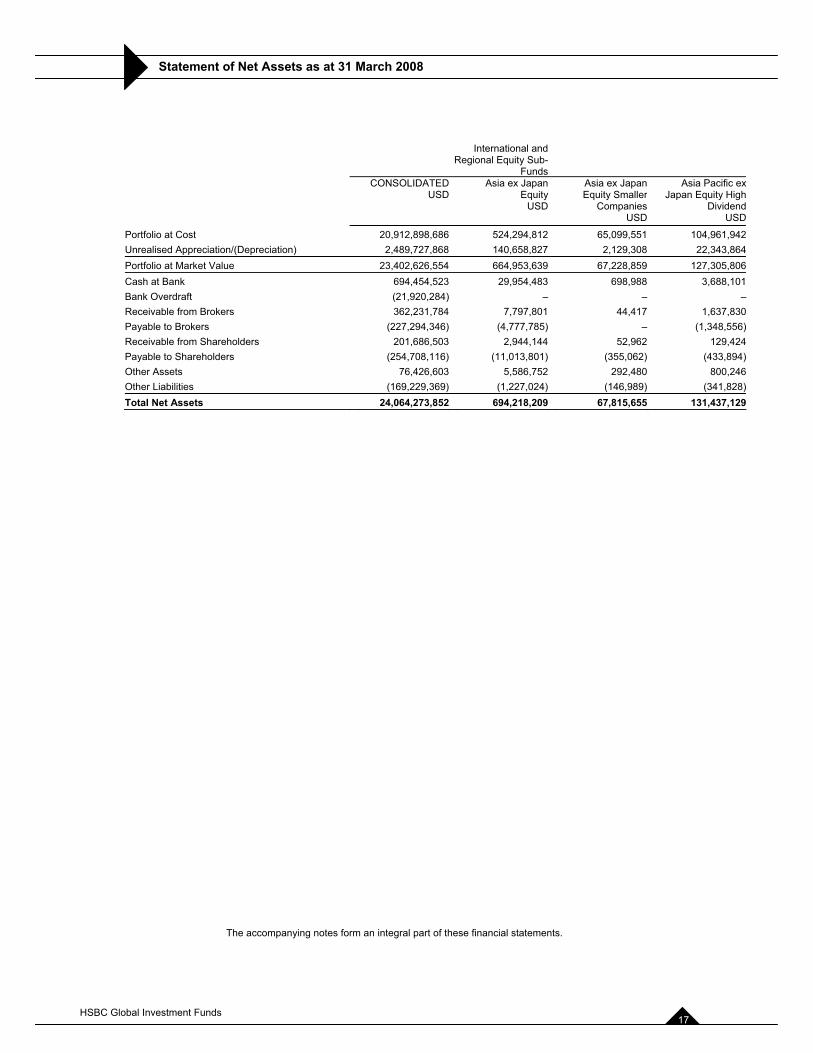
Statement of Net Assets as at 31 March 2008
The accompanying notes form an integral part of these financial statements.
International and Regional Equity Sub-
FundsCONSOLIDATED
USDAsia ex Japan
EquityUSD
Asia ex Japan Equity Smaller
CompaniesUSD
Asia Pacific ex Japan Equity High
DividendUSD
Portfolio at Cost 20,912,898,686 524,294,812 65,099,551 104,961,942Unrealised Appreciation/(Depreciation) 2,489,727,868 140,658,827 2,129,308 22,343,864Portfolio at Market Value 23,402,626,554 664,953,639 67,228,859 127,305,806Cash at Bank 694,454,523 29,954,483 698,988 3,688,101Bank Overdraft (21,920,284) – – –Receivable from Brokers 362,231,784 7,797,801 44,417 1,637,830Payable to Brokers (227,294,346) (4,777,785) – (1,348,556)Receivable from Shareholders 201,686,503 2,944,144 52,962 129,424Payable to Shareholders (254,708,116) (11,013,801) (355,062) (433,894) Other Assets 76,426,603 5,586,752 292,480 800,246Other Liabilities (169,229,369) (1,227,024) (146,989) (341,828)Total Net Assets 24,064,273,852 694,218,209 67,815,655 131,437,129
HSBC Global Investment Funds 17
Statement of Net Assets as at 31 March 2008
BRIC MarketsUSD
BRIC Markets Equity
USD
Climate ChangeUSD
Emerging Europe Equity
EUR
Emerging WealthUSD
Euroland EquityEUR
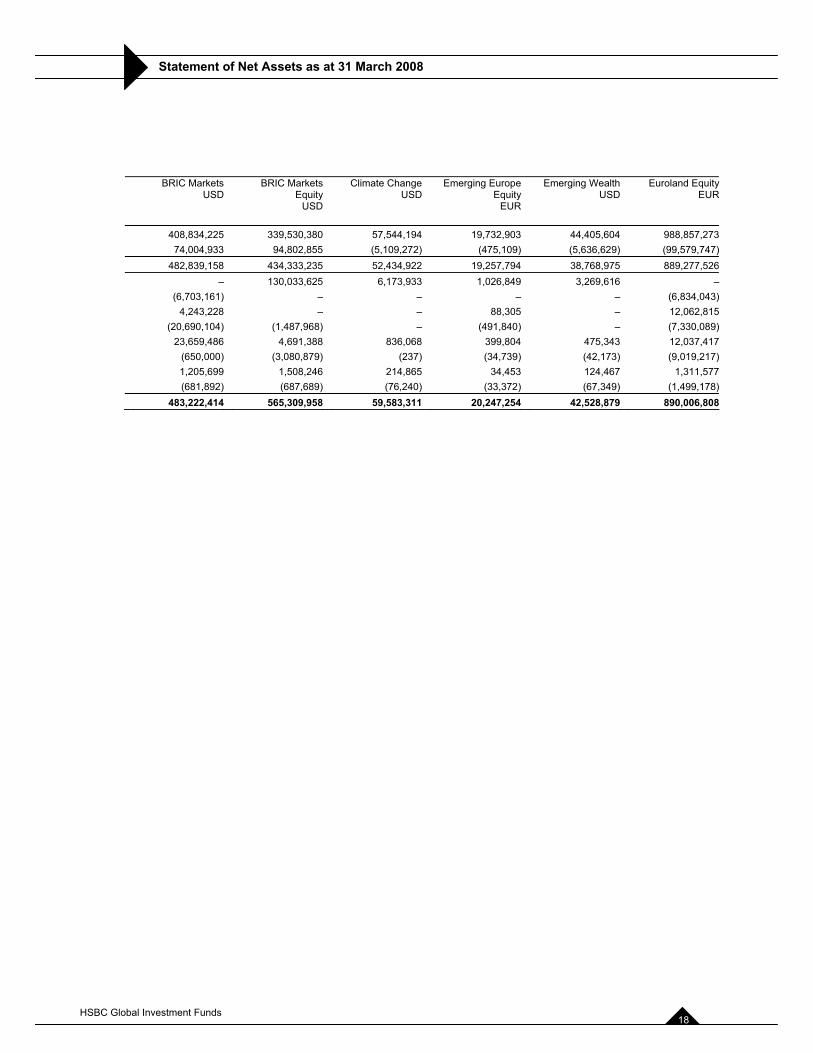
408,834,225 339,530,380 57,544,194 19,732,903 44,405,604 988,857,27374,004,933 94,802,855 (5,109,272) (475,109) (5,636,629) (99,579,747)
482,839,158 434,333,235 52,434,922 19,257,794 38,768,975 889,277,526– 130,033,625 6,173,933 1,026,849 3,269,616 –
(6,703,161) – – – – (6,834,043)4,243,228 – – 88,305 – 12,062,815
(20,690,104) (1,487,968) – (491,840) – (7,330,089)23,659,486 4,691,388 836,068 399,804 475,343 12,037,417
(650,000) (3,080,879) (237) (34,739) (42,173) (9,019,217)1,205,699 1,508,246 214,865 34,453 124,467 1,311,577(681,892) (687,689) (76,240) (33,372) (67,349) (1,499,178)
483,222,414 565,309,958 59,583,311 20,247,254 42,528,879 890,006,808
HSBC Global Investment Funds 18
Statement of Net Assets as at 31 March 2008
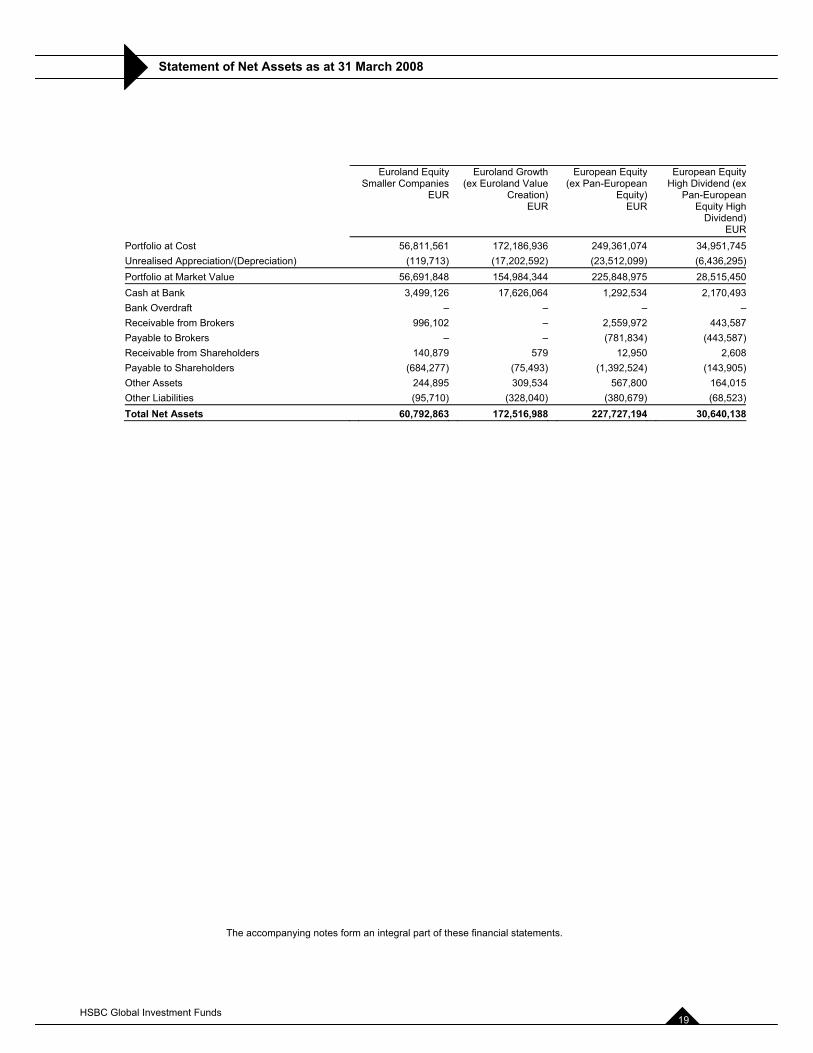
The accompanying notes form an integral part of these financial statements.
Euroland EquitySmaller Companies
EUR
Euroland Growth (ex Euroland Value
Creation)EUR
European Equity(ex Pan-European
Equity)EUR
European EquityHigh Dividend (ex
Pan-European Equity High
Dividend)EUR
Portfolio at Cost 56,811,561 172,186,936 249,361,074 34,951,745Unrealised Appreciation/(Depreciation) (119,713) (17,202,592) (23,512,099) (6,436,295)Portfolio at Market Value 56,691,848 154,984,344 225,848,975 28,515,450Cash at Bank 3,499,126 17,626,064 1,292,534 2,170,493Bank Overdraft – – – –Receivable from Brokers 996,102 – 2,559,972 443,587Payable to Brokers – – (781,834) (443,587) Receivable from Shareholders 140,879 579 12,950 2,608Payable to Shareholders (684,277) (75,493) (1,392,524) (143,905) Other Assets 244,895 309,534 567,800 164,015Other Liabilities (95,710) (328,040) (380,679) (68,523)Total Net Assets 60,792,863 172,516,988 227,727,194 30,640,138
HSBC Global Investment Funds 19
Statement of Net Assets as at 31 March 2008
Market Specific EquitySub-Funds
Global Emerging Markets Elite
USD
Global Emerging Markets Equity
USD
Global EquityUSD
Global Equity SRIUSD
SustainabilityLeaders
EUR
Brazil EquityUSD
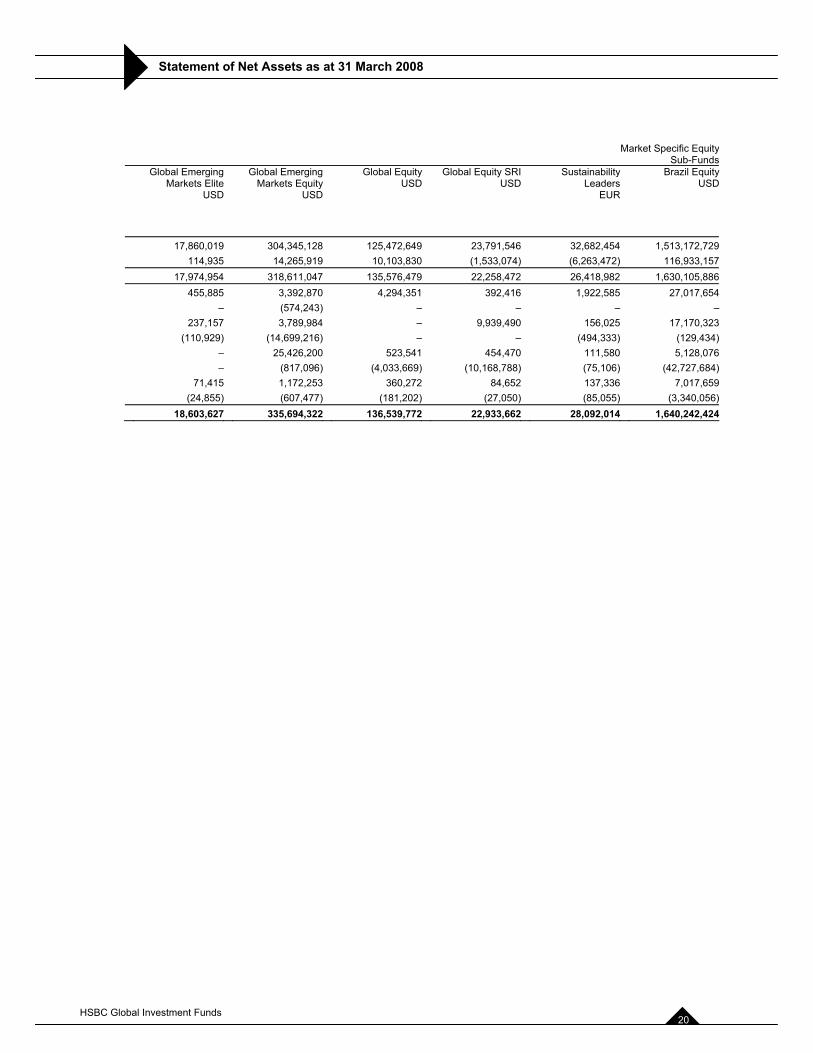
17,860,019 304,345,128 125,472,649 23,791,546 32,682,454 1,513,172,729114,935 14,265,919 10,103,830 (1,533,074) (6,263,472) 116,933,157
17,974,954 318,611,047 135,576,479 22,258,472 26,418,982 1,630,105,886455,885 3,392,870 4,294,351 392,416 1,922,585 27,017,654
– (574,243) – – – –237,157 3,789,984 – 9,939,490 156,025 17,170,323
(110,929) (14,699,216) – – (494,333) (129,434)– 25,426,200 523,541 454,470 111,580 5,128,076– (817,096) (4,033,669) (10,168,788) (75,106) (42,727,684)
71,415 1,172,253 360,272 84,652 137,336 7,017,659(24,855) (607,477) (181,202) (27,050) (85,055) (3,340,056)
18,603,627 335,694,322 136,539,772 22,933,662 28,092,014 1,640,242,424
HSBC Global Investment Funds 20
Statement of Net Assets as at 31 March 2008
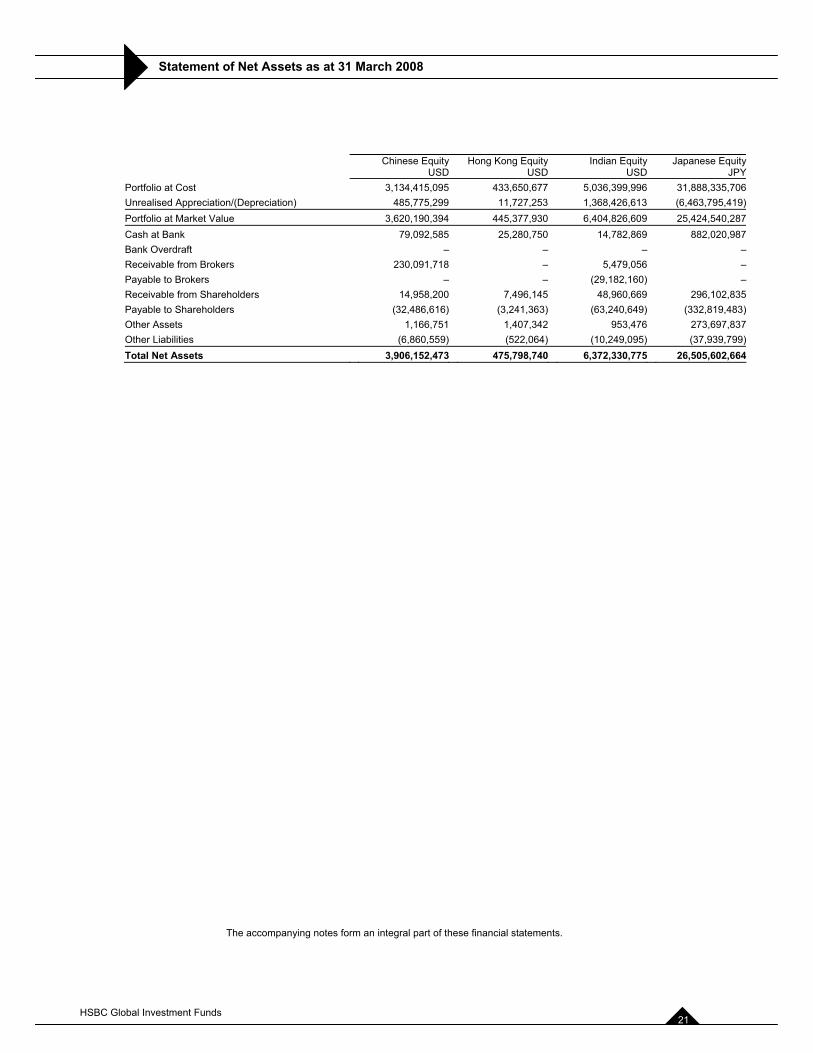
The accompanying notes form an integral part of these financial statements.
Chinese EquityUSD
Hong Kong EquityUSD
Indian EquityUSD
Japanese EquityJPY
Portfolio at Cost 3,134,415,095 433,650,677 5,036,399,996 31,888,335,706Unrealised Appreciation/(Depreciation) 485,775,299 11,727,253 1,368,426,613 (6,463,795,419)Portfolio at Market Value 3,620,190,394 445,377,930 6,404,826,609 25,424,540,287Cash at Bank 79,092,585 25,280,750 14,782,869 882,020,987Bank Overdraft – – – –Receivable from Brokers 230,091,718 – 5,479,056 –Payable to Brokers – – (29,182,160) –Receivable from Shareholders 14,958,200 7,496,145 48,960,669 296,102,835Payable to Shareholders (32,486,616) (3,241,363) (63,240,649) (332,819,483)Other Assets 1,166,751 1,407,342 953,476 273,697,837Other Liabilities (6,860,559) (522,064) (10,249,095) (37,939,799)Total Net Assets 3,906,152,473 475,798,740 6,372,330,775 26,505,602,664
HSBC Global Investment Funds 21
Statement of Net Assets as at 31 March 2008
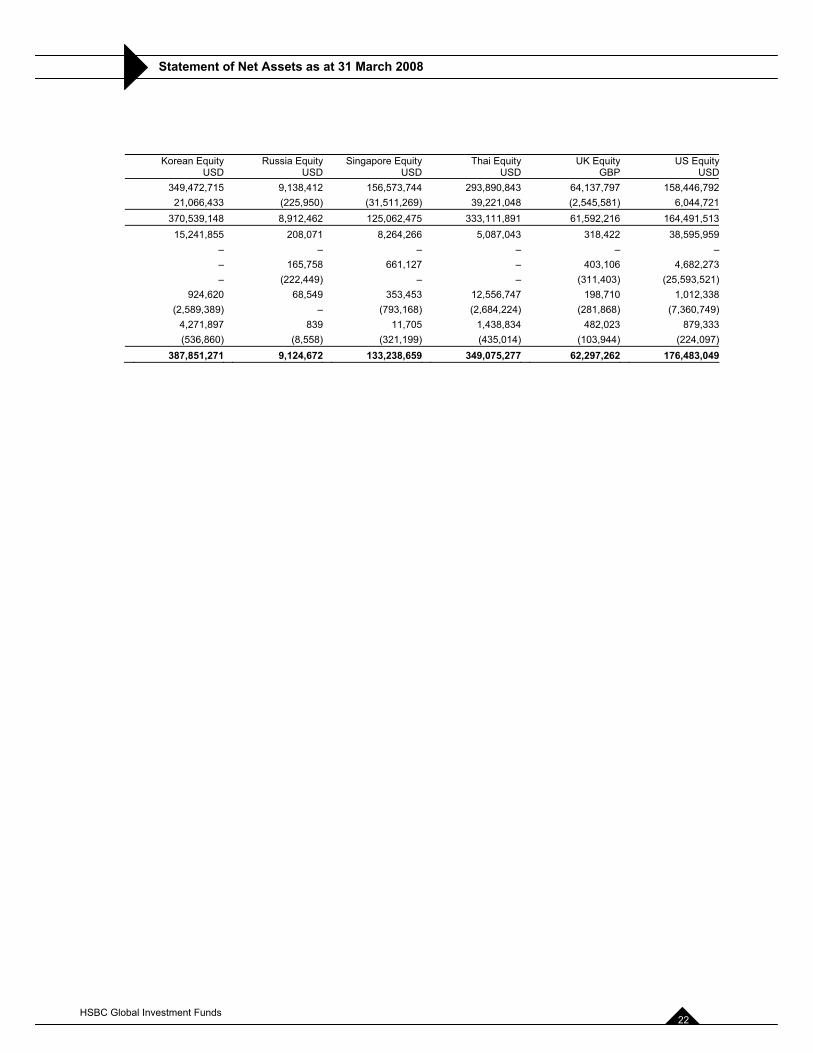
Korean EquityUSD
Russia EquityUSD
Singapore EquityUSD
Thai EquityUSD
UK EquityGBP
US EquityUSD
349,472,715 9,138,412 156,573,744 293,890,843 64,137,797 158,446,79221,066,433 (225,950) (31,511,269) 39,221,048 (2,545,581) 6,044,721
370,539,148 8,912,462 125,062,475 333,111,891 61,592,216 164,491,51315,241,855 208,071 8,264,266 5,087,043 318,422 38,595,959
– – – – – –– 165,758 661,127 – 403,106 4,682,273– (222,449) – – (311,403) (25,593,521)
924,620 68,549 353,453 12,556,747 198,710 1,012,338(2,589,389) – (793,168) (2,684,224) (281,868) (7,360,749)
4,271,897 839 11,705 1,438,834 482,023 879,333(536,860) (8,558) (321,199) (435,014) (103,944) (224,097)
387,851,271 9,124,672 133,238,659 349,075,277 62,297,262 176,483,049
HSBC Global Investment Funds 22
Statement of Net Assets as at 31 March 2008
The accompanying notes form an integral part of these financial statements.
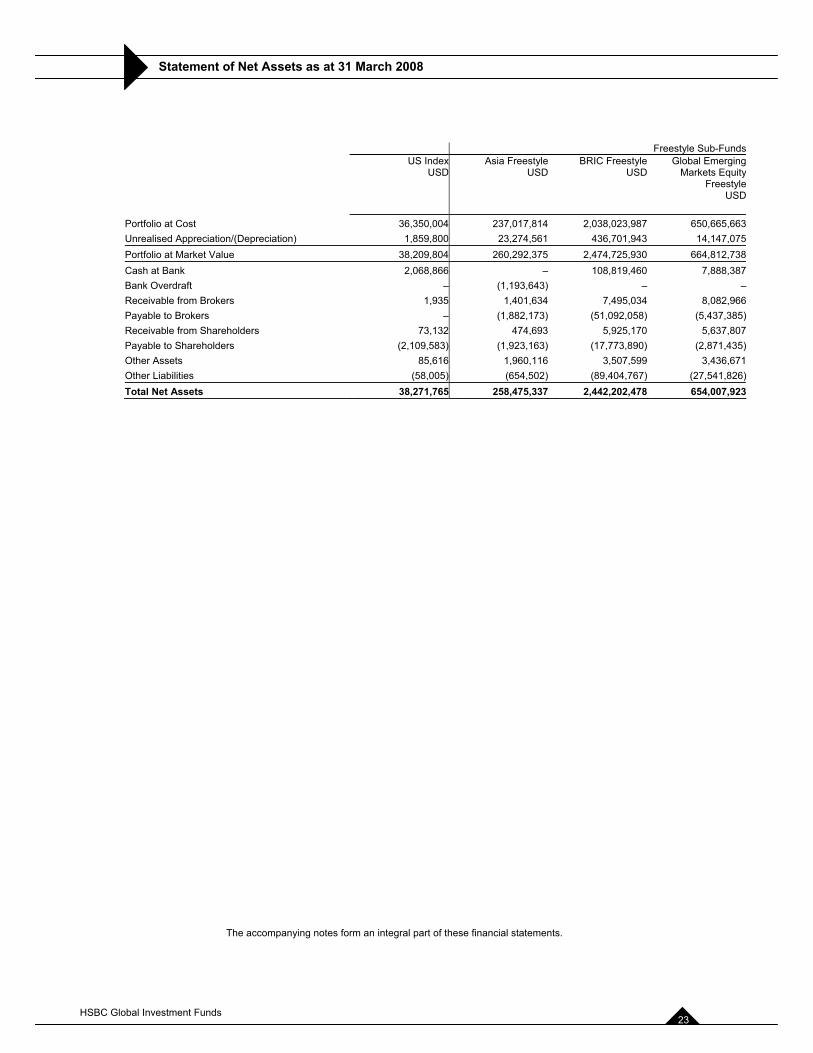
Freestyle Sub-FundsUS Index
USDAsia Freestyle
USDBRIC Freestyle
USDGlobal Emerging
Markets EquityFreestyle
USD
Portfolio at Cost 36,350,004 237,017,814 2,038,023,987 650,665,663Unrealised Appreciation/(Depreciation) 1,859,800 23,274,561 436,701,943 14,147,075Portfolio at Market Value 38,209,804 260,292,375 2,474,725,930 664,812,738Cash at Bank 2,068,866 – 108,819,460 7,888,387Bank Overdraft – (1,193,643) – –Receivable from Brokers 1,935 1,401,634 7,495,034 8,082,966Payable to Brokers – (1,882,173) (51,092,058) (5,437,385)Receivable from Shareholders 73,132 474,693 5,925,170 5,637,807Payable to Shareholders (2,109,583) (1,923,163) (17,773,890) (2,871,435)Other Assets 85,616 1,960,116 3,507,599 3,436,671Other Liabilities (58,005) (654,502) (89,404,767) (27,541,826)Total Net Assets 38,271,765 258,475,337 2,442,202,478 654,007,923
HSBC Global Investment Funds 23
Statement of Net Assets as at 31 March 2008
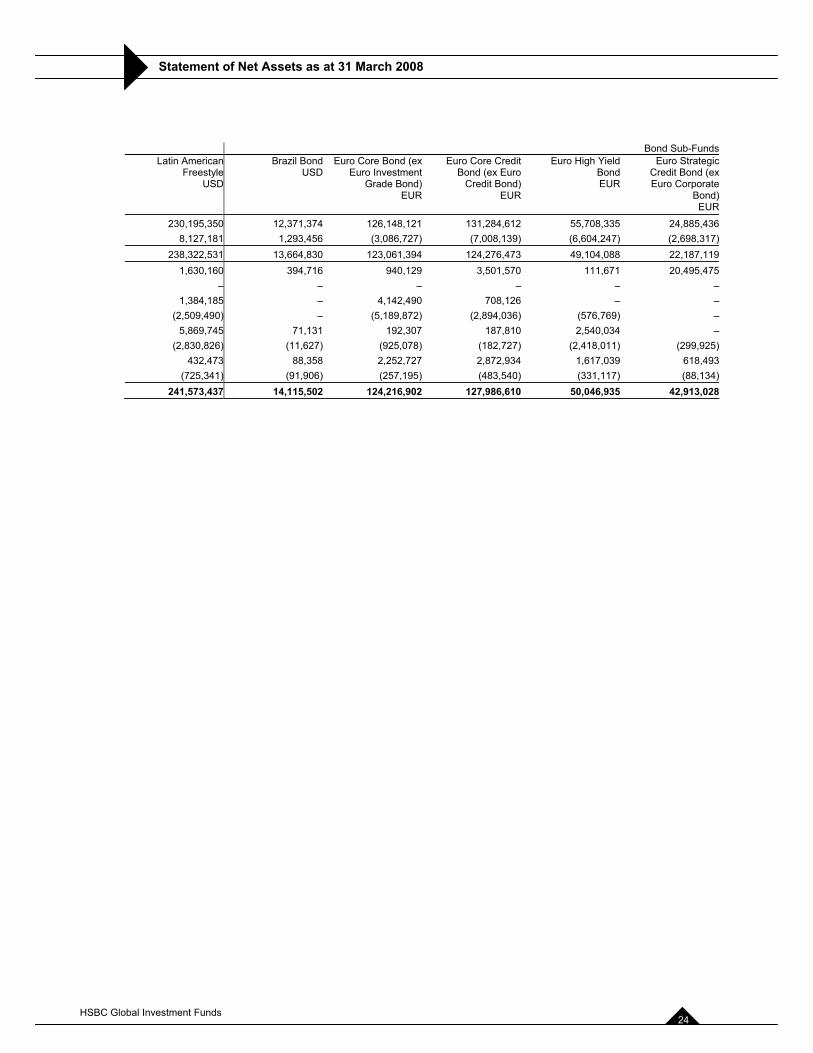
Bond Sub-FundsLatin American
FreestyleUSD
Brazil BondUSD
Euro Core Bond (exEuro Investment
Grade Bond)EUR
Euro Core Credit Bond (ex Euro
Credit Bond)EUR
Euro High Yield BondEUR
Euro Strategic Credit Bond (ex Euro Corporate
Bond)EUR
230,195,350 12,371,374 126,148,121 131,284,612 55,708,335 24,885,4368,127,181 1,293,456 (3,086,727) (7,008,139) (6,604,247) (2,698,317)
238,322,531 13,664,830 123,061,394 124,276,473 49,104,088 22,187,1191,630,160 394,716 940,129 3,501,570 111,671 20,495,475
– – – – – –1,384,185 – 4,142,490 708,126 – –
(2,509,490) – (5,189,872) (2,894,036) (576,769) –5,869,745 71,131 192,307 187,810 2,540,034 –
(2,830,826) (11,627) (925,078) (182,727) (2,418,011) (299,925)432,473 88,358 2,252,727 2,872,934 1,617,039 618,493
(725,341) (91,906) (257,195) (483,540) (331,117) (88,134)241,573,437 14,115,502 124,216,902 127,986,610 50,046,935 42,913,028
HSBC Global Investment Funds 24
Statement of Net Assets as at 31 March 2008
The accompanying notes form an integral part of these financial statements.
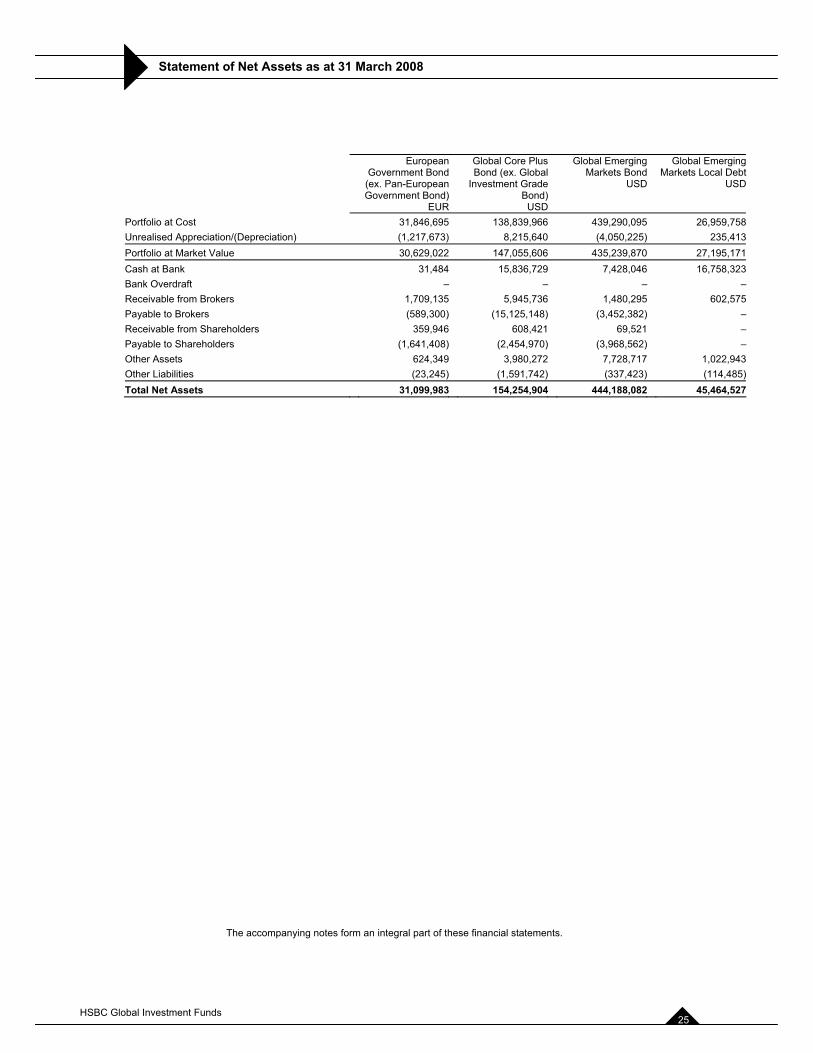
EuropeanGovernment Bond
(ex. Pan-European Government Bond)
EUR
Global Core Plus Bond (ex. Global
Investment Grade Bond)
USD
Global Emerging Markets Bond
USD
Global Emerging Markets Local Debt
USD
Portfolio at Cost 31,846,695 138,839,966 439,290,095 26,959,758Unrealised Appreciation/(Depreciation) (1,217,673) 8,215,640 (4,050,225) 235,413Portfolio at Market Value 30,629,022 147,055,606 435,239,870 27,195,171Cash at Bank 31,484 15,836,729 7,428,046 16,758,323Bank Overdraft – – – –Receivable from Brokers 1,709,135 5,945,736 1,480,295 602,575Payable to Brokers (589,300) (15,125,148) (3,452,382) –Receivable from Shareholders 359,946 608,421 69,521 –Payable to Shareholders (1,641,408) (2,454,970) (3,968,562) –Other Assets 624,349 3,980,272 7,728,717 1,022,943Other Liabilities (23,245) (1,591,742) (337,423) (114,485)Total Net Assets 31,099,983 154,254,904 444,188,082 45,464,527
HSBC Global Investment Funds 25
Statement of Net Assets as at 31 March 2008
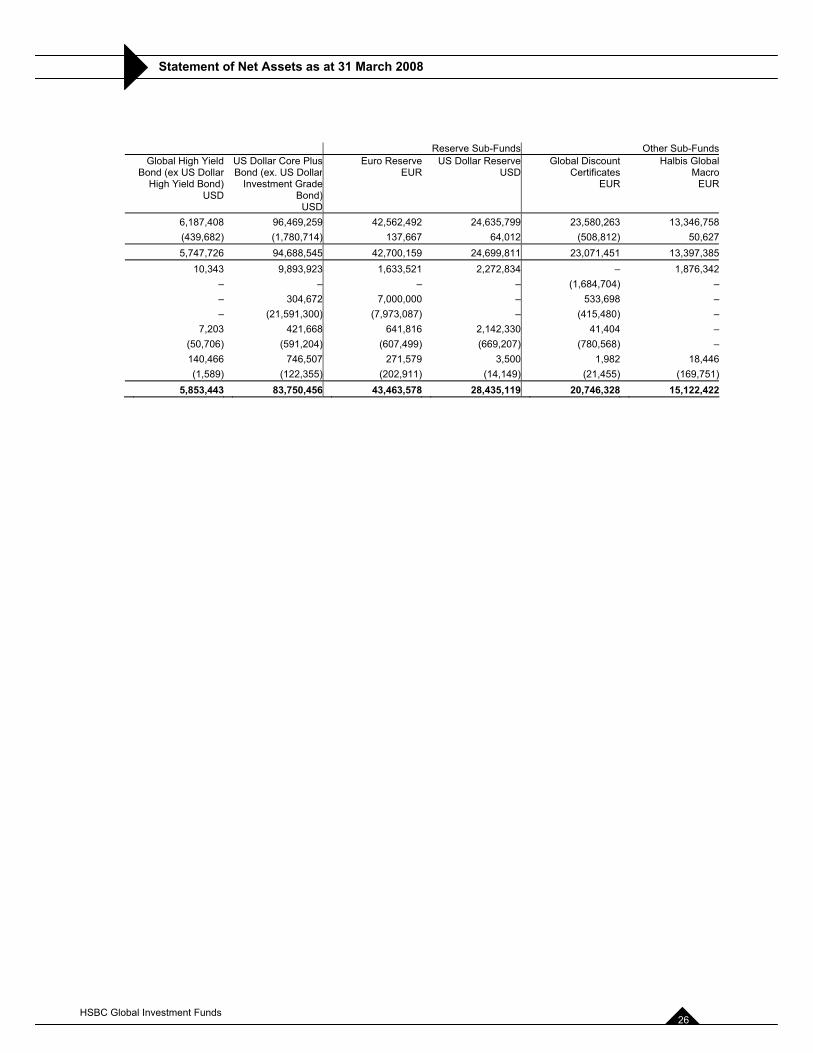
Reserve Sub-Funds Other Sub-FundsGlobal High Yield
Bond (ex US DollarHigh Yield Bond)
USD
US Dollar Core PlusBond (ex. US Dollar
Investment GradeBond)
USD
Euro ReserveEUR
US Dollar ReserveUSD
Global Discount Certificates
EUR
Halbis Global Macro
EUR
6,187,408 96,469,259 42,562,492 24,635,799 23,580,263 13,346,758(439,682) (1,780,714) 137,667 64,012 (508,812) 50,6275,747,726 94,688,545 42,700,159 24,699,811 23,071,451 13,397,385
10,343 9,893,923 1,633,521 2,272,834 – 1,876,342– – – – (1,684,704) –– 304,672 7,000,000 – 533,698 –– (21,591,300) (7,973,087) – (415,480) –
7,203 421,668 641,816 2,142,330 41,404 –(50,706) (591,204) (607,499) (669,207) (780,568) –140,466 746,507 271,579 3,500 1,982 18,446(1,589) (122,355) (202,911) (14,149) (21,455) (169,751)
5,853,443 83,750,456 43,463,578 28,435,119 20,746,328 15,122,422
HSBC Global Investment Funds 26
Statement of Net Assets as at 31 March 2008
The accompanying notes form an integral part of these financial statements.
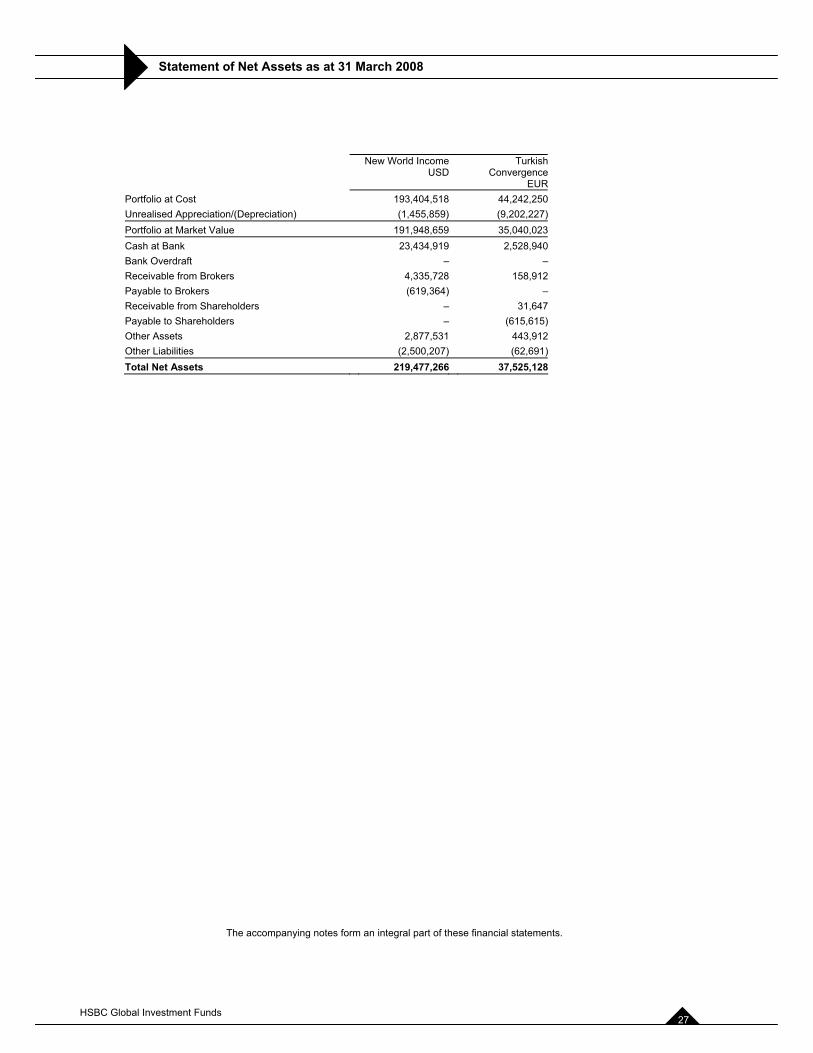
New World IncomeUSD
Turkish Convergence
EURPortfolio at Cost 193,404,518 44,242,250Unrealised Appreciation/(Depreciation) (1,455,859) (9,202,227)Portfolio at Market Value 191,948,659 35,040,023Cash at Bank 23,434,919 2,528,940Bank Overdraft – –Receivable from Brokers 4,335,728 158,912Payable to Brokers (619,364) –Receivable from Shareholders – 31,647Payable to Shareholders – (615,615)Other Assets 2,877,531 443,912Other Liabilities (2,500,207) (62,691)Total Net Assets 219,477,266 37,525,128
HSBC Global Investment Funds 27
Key Figures as at 31 March 2008
The accompanying notes form an integral part of these financial statements.
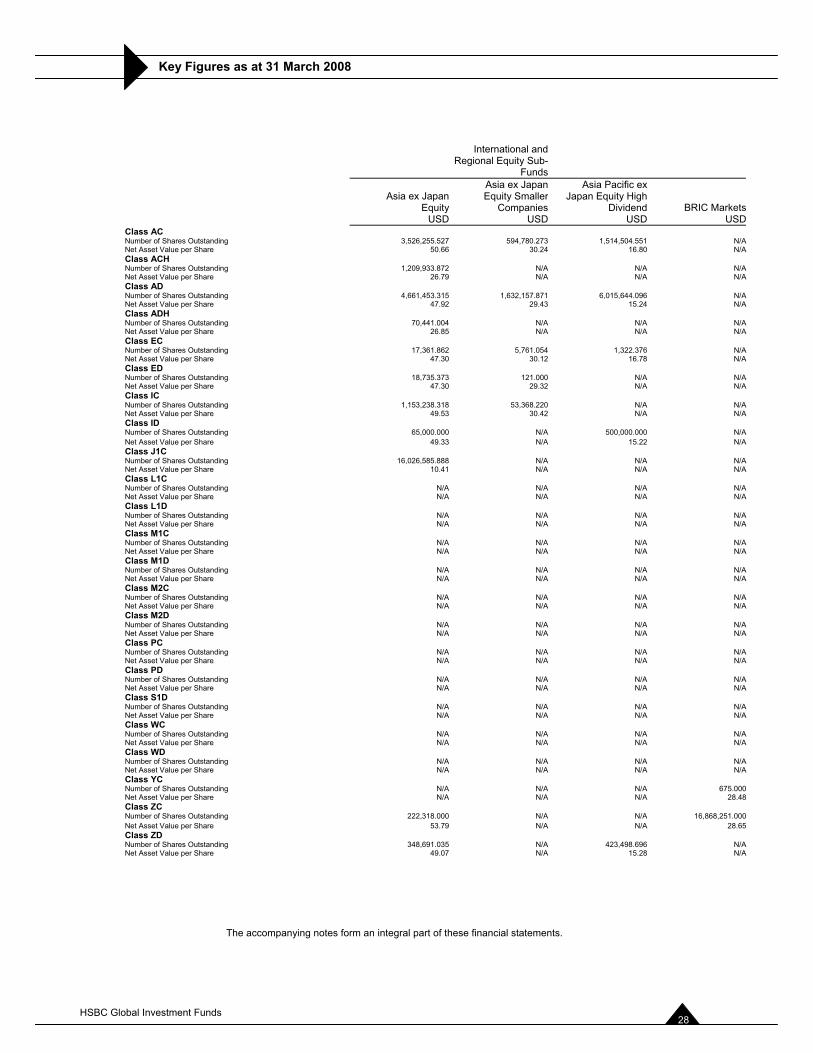
International and Regional Equity Sub-
Funds
Asia ex Japan Equity
USD
Asia ex Japan Equity Smaller
CompaniesUSD
Asia Pacific ex Japan Equity High
DividendUSD
BRIC MarketsUSD
Class AC Number of Shares Outstanding 3,526,255.527 594,780.273 1,514,504.551 N/ANet Asset Value per Share 50.66 30.24 16.80 N/AClass ACH Number of Shares Outstanding 1,209,933.872 N/A N/A N/ANet Asset Value per Share 26.79 N/A N/A N/AClass AD Number of Shares Outstanding 4,661,453.315 1,632,157.871 6,015,644.096 N/ANet Asset Value per Share 47.92 29.43 15.24 N/AClass ADH Number of Shares Outstanding 70,441.004 N/A N/A N/ANet Asset Value per Share 26.85 N/A N/A N/AClass EC Number of Shares Outstanding 17,361.862 5,761.054 1,322.376 N/ANet Asset Value per Share 47.30 30.12 16.78 N/AClass ED Number of Shares Outstanding 18,735.373 121.000 N/A N/ANet Asset Value per Share 47.30 29.32 N/A N/AClass IC Number of Shares Outstanding 1,153,238.318 53,368.220 N/A N/ANet Asset Value per Share 49.53 30.42 N/A N/AClass ID Number of Shares Outstanding 65,000.000 N/A 500,000.000 N/ANet Asset Value per Share 49.33 N/A 15.22 N/AClass J1C Number of Shares Outstanding 16,026,585.888 N/A N/A N/ANet Asset Value per Share 10.41 N/A N/A N/AClass L1C Number of Shares Outstanding N/A N/A N/A N/ANet Asset Value per Share N/A N/A N/A N/AClass L1D Number of Shares Outstanding N/A N/A N/A N/ANet Asset Value per Share N/A N/A N/A N/AClass M1C Number of Shares Outstanding N/A N/A N/A N/ANet Asset Value per Share N/A N/A N/A N/AClass M1D Number of Shares Outstanding N/A N/A N/A N/ANet Asset Value per Share N/A N/A N/A N/AClass M2C Number of Shares Outstanding N/A N/A N/A N/ANet Asset Value per Share N/A N/A N/A N/AClass M2D Number of Shares Outstanding N/A N/A N/A N/ANet Asset Value per Share N/A N/A N/A N/AClass PC Number of Shares Outstanding N/A N/A N/A N/ANet Asset Value per Share N/A N/A N/A N/AClass PD Number of Shares Outstanding N/A N/A N/A N/ANet Asset Value per Share N/A N/A N/A N/AClass S1D Number of Shares Outstanding N/A N/A N/A N/ANet Asset Value per Share N/A N/A N/A N/AClass WC Number of Shares Outstanding N/A N/A N/A N/ANet Asset Value per Share N/A N/A N/A N/AClass WD Number of Shares Outstanding N/A N/A N/A N/ANet Asset Value per Share N/A N/A N/A N/AClass YC Number of Shares Outstanding N/A N/A N/A 675.000Net Asset Value per Share N/A N/A N/A 28.48Class ZC Number of Shares Outstanding 222,318.000 N/A N/A 16,868,251.000Net Asset Value per Share 53.79 N/A N/A 28.65Class ZD Number of Shares Outstanding 348,691.035 N/A 423,498.696 N/ANet Asset Value per Share 49.07 N/A 15.28 N/A
HSBC Global Investment Funds 28
Key Figures as at 31 March 2008
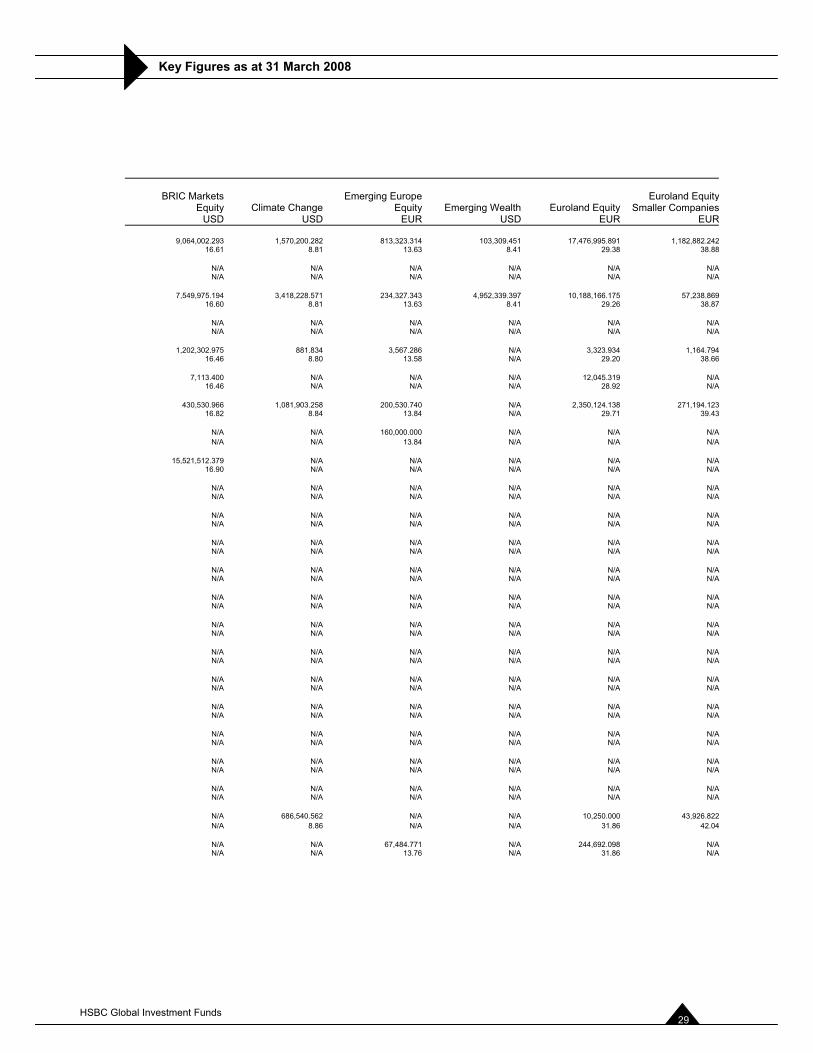
BRIC Markets Equity
USDClimate Change
USD
Emerging Europe Equity
EUREmerging Wealth
USDEuroland Equity
EUR
Euroland EquitySmaller Companies
EUR
9,064,002.293 1,570,200.282 813,323.314 103,309.451 17,476,995.891 1,182,882.24216.61 8.81 13.63 8.41 29.38 38.88
N/A N/A N/A N/A N/A N/AN/A N/A N/A N/A N/A N/A
7,549,975.194 3,418,228.571 234,327.343 4,952,339.397 10,188,166.175 57,238.86916.60 8.81 13.63 8.41 29.26 38.87
N/A N/A N/A N/A N/A N/AN/A N/A N/A N/A N/A N/A
1,202,302.975 881.834 3,567.286 N/A 3,323.934 1,164.79416.46 8.80 13.58 N/A 29.20 38.66
7,113.400 N/A N/A N/A 12,045.319 N/A16.46 N/A N/A N/A 28.92 N/A
430,530.966 1,081,903.258 200,530.740 N/A 2,350,124.138 271,194.12316.82 8.84 13.84 N/A 29.71 39.43
N/A N/A 160,000.000 N/A N/A N/AN/A N/A 13.84 N/A N/A N/A
15,521,512.379 N/A N/A N/A N/A N/A16.90 N/A N/A N/A N/A N/A
N/A N/A N/A N/A N/A N/AN/A N/A N/A N/A N/A N/A
N/A N/A N/A N/A N/A N/AN/A N/A N/A N/A N/A N/A
N/A N/A N/A N/A N/A N/AN/A N/A N/A N/A N/A N/A
N/A N/A N/A N/A N/A N/AN/A N/A N/A N/A N/A N/A
N/A N/A N/A N/A N/A N/AN/A N/A N/A N/A N/A N/A
N/A N/A N/A N/A N/A N/AN/A N/A N/A N/A N/A N/A
N/A N/A N/A N/A N/A N/AN/A N/A N/A N/A N/A N/A
N/A N/A N/A N/A N/A N/AN/A N/A N/A N/A N/A N/A
N/A N/A N/A N/A N/A N/AN/A N/A N/A N/A N/A N/A
N/A N/A N/A N/A N/A N/AN/A N/A N/A N/A N/A N/A
N/A N/A N/A N/A N/A N/AN/A N/A N/A N/A N/A N/A
N/A N/A N/A N/A N/A N/AN/A N/A N/A N/A N/A N/A
N/A 686,540.562 N/A N/A 10,250.000 43,926.822N/A 8.86 N/A N/A 31.86 42.04
N/A N/A 67,484.771 N/A 244,692.098 N/AN/A N/A 13.76 N/A 31.86 N/A
HSBC Global Investment Funds 29
Key Figures as at 31 March 2008
The accompanying notes form an integral part of these financial statements.
Euroland Growth (ex Euroland Value
Creation)EUR
European Equity(ex Pan-European
Equity)EUR
European EquityHigh Dividend (ex
Pan-European Equity High
Dividend)EUR
Global Emerging Markets Elite
USDClass AC Number of Shares Outstanding N/A 1,329,200.562 2,139,093.721 N/ANet Asset Value per Share N/A 33.03 12.53 N/AClass ACH Number of Shares Outstanding N/A N/A N/A N/ANet Asset Value per Share N/A N/A N/A N/AClass AD Number of Shares Outstanding N/A 32,347.273 185,959.355 N/ANet Asset Value per Share N/A 32.31 12.42 N/AClass ADH Number of Shares Outstanding N/A N/A N/A N/ANet Asset Value per Share N/A N/A N/A N/AClass EC Number of Shares Outstanding N/A N/A N/A N/ANet Asset Value per Share N/A N/A N/A N/AClass ED Number of Shares Outstanding N/A 107,846.875 N/A N/ANet Asset Value per Share N/A 31.79 N/A N/AClass IC Number of Shares Outstanding N/A 43,015.000 N/A N/ANet Asset Value per Share N/A 33.06 N/A N/AClass ID Number of Shares Outstanding N/A N/A N/A N/ANet Asset Value per Share N/A N/A N/A N/AClass J1C Number of Shares Outstanding N/A N/A N/A N/ANet Asset Value per Share N/A N/A N/A N/AClass L1C Number of Shares Outstanding N/A N/A N/A N/ANet Asset Value per Share N/A N/A N/A N/AClass L1D Number of Shares Outstanding N/A N/A N/A N/ANet Asset Value per Share N/A N/A N/A N/AClass M1C Number of Shares Outstanding 13,813,815.025 N/A N/A N/ANet Asset Value per Share 12.33 N/A N/A N/AClass M1D Number of Shares Outstanding 183,005.592 N/A N/A N/ANet Asset Value per Share 12.37 N/A N/A N/AClass M2C Number of Shares Outstanding N/A N/A N/A N/ANet Asset Value per Share N/A N/A N/A N/AClass M2D Number of Shares Outstanding N/A N/A N/A N/ANet Asset Value per Share N/A N/A N/A N/AClass PC Number of Shares Outstanding N/A 10,527.140 N/A N/ANet Asset Value per Share N/A 33.89 N/A N/AClass PD Number of Shares Outstanding N/A 4,636,701.707 N/A N/ANet Asset Value per Share N/A 32.03 N/A N/AClass S1D Number of Shares Outstanding N/A N/A N/A N/ANet Asset Value per Share N/A N/A N/A N/AClass WC Number of Shares Outstanding N/A N/A N/A N/ANet Asset Value per Share N/A N/A N/A N/AClass WD Number of Shares Outstanding N/A 947,889.644 N/A N/ANet Asset Value per Share N/A 19.67 N/A N/AClass YC Number of Shares Outstanding N/A N/A N/A 500.000Net Asset Value per Share N/A N/A N/A 12.55Class ZC Number of Shares Outstanding N/A N/A 116,126.000 1,499,500.000Net Asset Value per Share N/A N/A 13.26 12.40Class ZD Number of Shares Outstanding N/A 314,365.269 N/A N/ANet Asset Value per Share N/A 33.08 N/A N/A
HSBC Global Investment Funds 30
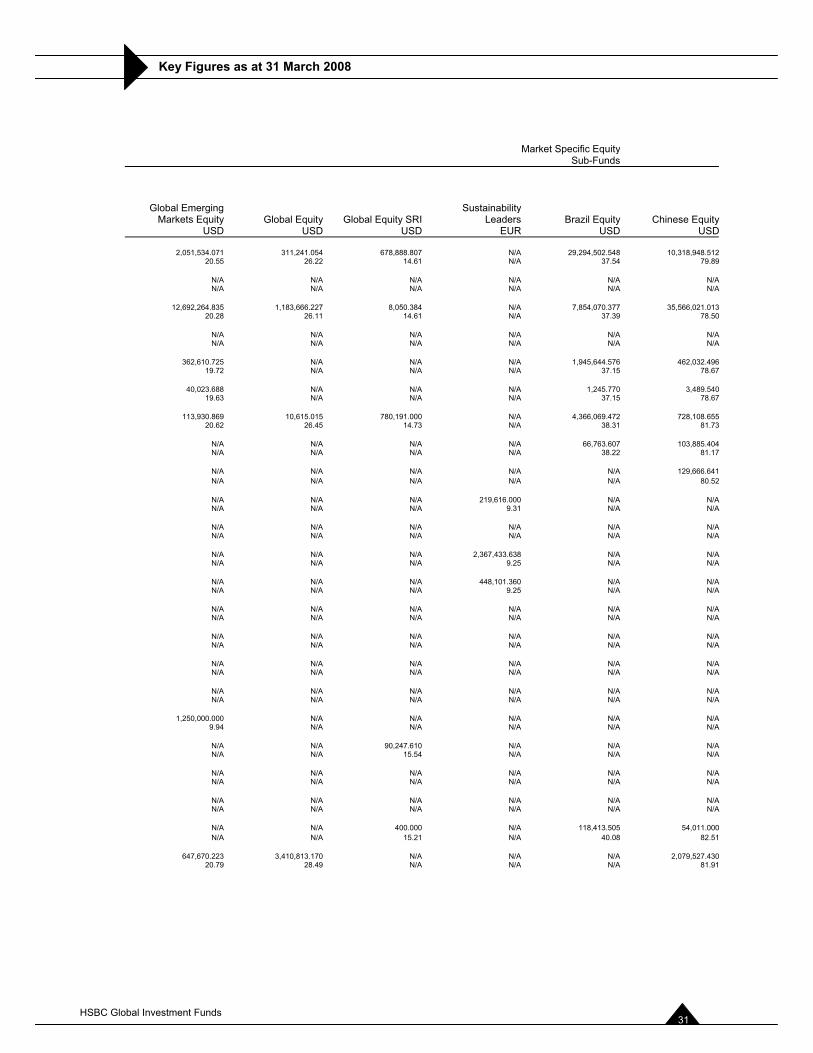
Key Figures as at 31 March 2008
Market Specific EquitySub-Funds
Global Emerging Markets Equity
USDGlobal Equity
USDGlobal Equity SRI
USD
SustainabilityLeaders
EURBrazil Equity
USDChinese Equity
USD
2,051,534.071 311,241.054 678,888.807 N/A 29,294,502.548 10,318,948.51220.55 26.22 14.61 N/A 37.54 79.89
N/A N/A N/A N/A N/A N/AN/A N/A N/A N/A N/A N/A
12,692,264.835 1,183,666.227 8,050.384 N/A 7,854,070.377 35,566,021.01320.28 26.11 14.61 N/A 37.39 78.50
N/A N/A N/A N/A N/A N/AN/A N/A N/A N/A N/A N/A
362,610.725 N/A N/A N/A 1,945,644.576 462,032.49619.72 N/A N/A N/A 37.15 78.67
40,023.688 N/A N/A N/A 1,245.770 3,489.54019.63 N/A N/A N/A 37.15 78.67
113,930.869 10,615.015 780,191.000 N/A 4,366,069.472 728,108.65520.62 26.45 14.73 N/A 38.31 81.73
N/A N/A N/A N/A 66,763.607 103,885.404N/A N/A N/A N/A 38.22 81.17
N/A N/A N/A N/A N/A 129,666.641N/A N/A N/A N/A N/A 80.52
N/A N/A N/A 219,616.000 N/A N/AN/A N/A N/A 9.31 N/A N/A
N/A N/A N/A N/A N/A N/AN/A N/A N/A N/A N/A N/A
N/A N/A N/A 2,367,433.638 N/A N/AN/A N/A N/A 9.25 N/A N/A
N/A N/A N/A 448,101.360 N/A N/AN/A N/A N/A 9.25 N/A N/A
N/A N/A N/A N/A N/A N/AN/A N/A N/A N/A N/A N/A
N/A N/A N/A N/A N/A N/AN/A N/A N/A N/A N/A N/A
N/A N/A N/A N/A N/A N/AN/A N/A N/A N/A N/A N/A
N/A N/A N/A N/A N/A N/AN/A N/A N/A N/A N/A N/A
1,250,000.000 N/A N/A N/A N/A N/A9.94 N/A N/A N/A N/A N/A
N/A N/A 90,247.610 N/A N/A N/AN/A N/A 15.54 N/A N/A N/A
N/A N/A N/A N/A N/A N/AN/A N/A N/A N/A N/A N/A
N/A N/A N/A N/A N/A N/AN/A N/A N/A N/A N/A N/A
N/A N/A 400.000 N/A 118,413.505 54,011.000N/A N/A 15.21 N/A 40.08 82.51
647,670.223 3,410,813.170 N/A N/A N/A 2,079,527.43020.79 28.49 N/A N/A N/A 81.91
HSBC Global Investment Funds 31
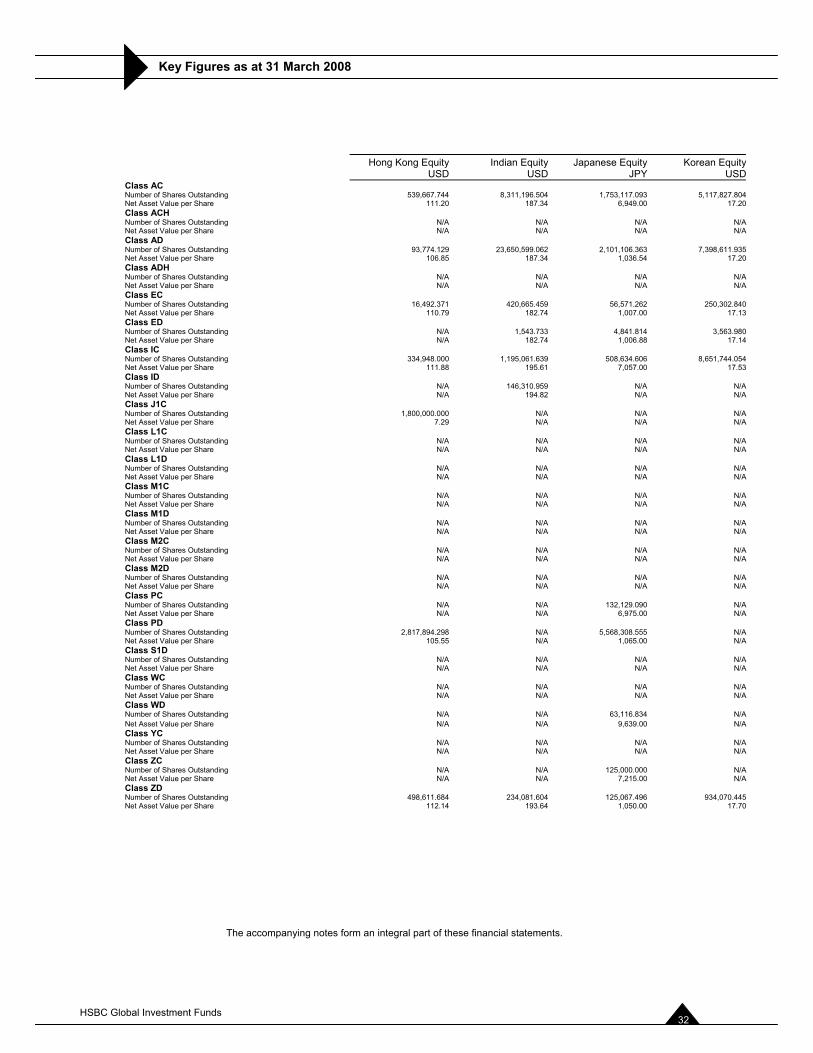
Key Figures as at 31 March 2008
The accompanying notes form an integral part of these financial statements.
Hong Kong EquityUSD
Indian EquityUSD
Japanese EquityJPY
Korean EquityUSD
Class AC Number of Shares Outstanding 539,667.744 8,311,196.504 1,753,117.093 5,117,827.804Net Asset Value per Share 111.20 187.34 6,949.00 17.20Class ACH Number of Shares Outstanding N/A N/A N/A N/ANet Asset Value per Share N/A N/A N/A N/AClass AD Number of Shares Outstanding 93,774.129 23,650,599.062 2,101,106.363 7,398,611.935Net Asset Value per Share 106.85 187.34 1,036.54 17.20Class ADH Number of Shares Outstanding N/A N/A N/A N/ANet Asset Value per Share N/A N/A N/A N/AClass EC Number of Shares Outstanding 16,492.371 420,665.459 56,571.262 250,302.840Net Asset Value per Share 110.79 182.74 1,007.00 17.13Class ED Number of Shares Outstanding N/A 1,543.733 4,841.814 3,563.980Net Asset Value per Share N/A 182.74 1,006.88 17.14Class IC Number of Shares Outstanding 334,948.000 1,195,061.639 508,634.606 8,651,744.054Net Asset Value per Share 111.88 195.61 7,057.00 17.53Class ID Number of Shares Outstanding N/A 146,310.959 N/A N/ANet Asset Value per Share N/A 194.82 N/A N/AClass J1C Number of Shares Outstanding 1,800,000.000 N/A N/A N/ANet Asset Value per Share 7.29 N/A N/A N/AClass L1C Number of Shares Outstanding N/A N/A N/A N/ANet Asset Value per Share N/A N/A N/A N/AClass L1D Number of Shares Outstanding N/A N/A N/A N/ANet Asset Value per Share N/A N/A N/A N/AClass M1C Number of Shares Outstanding N/A N/A N/A N/ANet Asset Value per Share N/A N/A N/A N/AClass M1D Number of Shares Outstanding N/A N/A N/A N/ANet Asset Value per Share N/A N/A N/A N/AClass M2C Number of Shares Outstanding N/A N/A N/A N/ANet Asset Value per Share N/A N/A N/A N/AClass M2D Number of Shares Outstanding N/A N/A N/A N/ANet Asset Value per Share N/A N/A N/A N/AClass PC Number of Shares Outstanding N/A N/A 132,129.090 N/ANet Asset Value per Share N/A N/A 6,975.00 N/AClass PD Number of Shares Outstanding 2,817,894.298 N/A 5,568,308.555 N/ANet Asset Value per Share 105.55 N/A 1,065.00 N/AClass S1D Number of Shares Outstanding N/A N/A N/A N/ANet Asset Value per Share N/A N/A N/A N/AClass WC Number of Shares Outstanding N/A N/A N/A N/ANet Asset Value per Share N/A N/A N/A N/AClass WD Number of Shares Outstanding N/A N/A 63,116.834 N/ANet Asset Value per Share N/A N/A 9,639.00 N/AClass YC Number of Shares Outstanding N/A N/A N/A N/ANet Asset Value per Share N/A N/A N/A N/AClass ZC Number of Shares Outstanding N/A N/A 125,000.000 N/ANet Asset Value per Share N/A N/A 7,215.00 N/AClass ZD Number of Shares Outstanding 498,611.684 234,081.604 125,067.496 934,070.445Net Asset Value per Share 112.14 193.64 1,050.00 17.70
HSBC Global Investment Funds 32
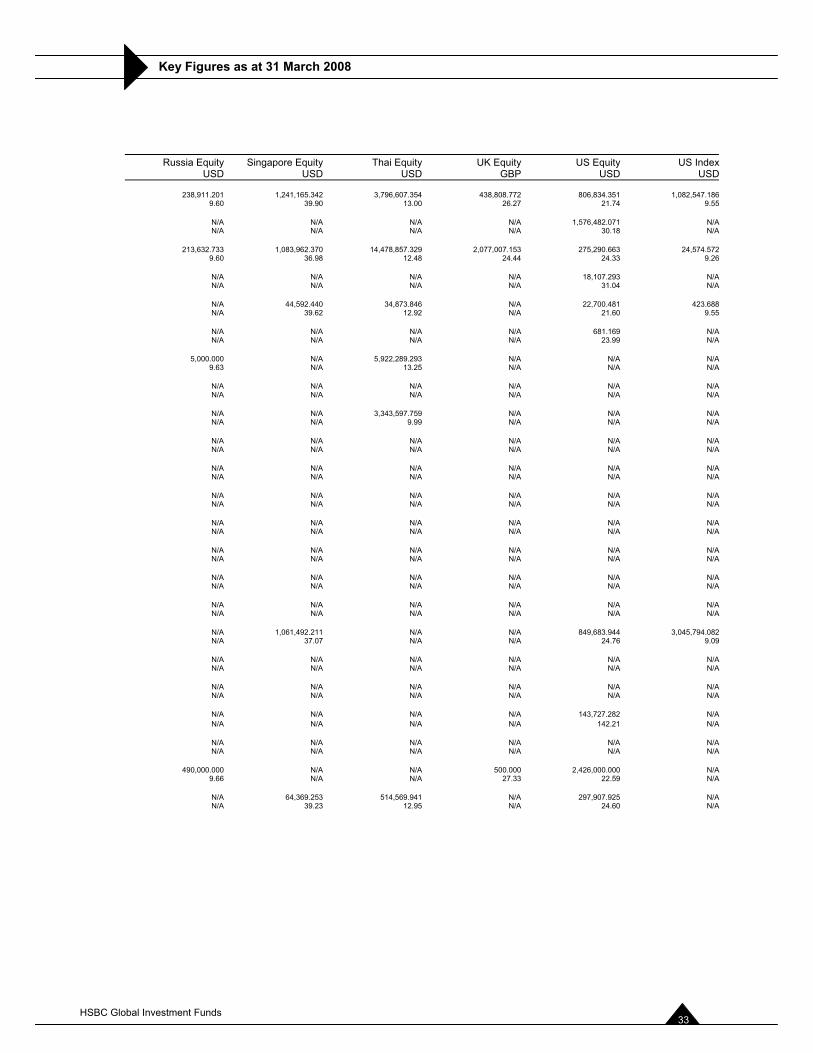
Key Figures as at 31 March 2008
Russia EquityUSD
Singapore EquityUSD
Thai EquityUSD
UK EquityGBP
US EquityUSD
US IndexUSD
238,911.201 1,241,165.342 3,796,607.354 438,808.772 806,834.351 1,082,547.1869.60 39.90 13.00 26.27 21.74 9.55
N/A N/A N/A N/A 1,576,482.071 N/AN/A N/A N/A N/A 30.18 N/A
213,632.733 1,083,962.370 14,478,857.329 2,077,007.153 275,290.663 24,574.5729.60 36.98 12.48 24.44 24.33 9.26
N/A N/A N/A N/A 18,107.293 N/AN/A N/A N/A N/A 31.04 N/A
N/A 44,592.440 34,873.846 N/A 22,700.481 423.688N/A 39.62 12.92 N/A 21.60 9.55
N/A N/A N/A N/A 681.169 N/AN/A N/A N/A N/A 23.99 N/A
5,000.000 N/A 5,922,289.293 N/A N/A N/A9.63 N/A 13.25 N/A N/A N/A
N/A N/A N/A N/A N/A N/AN/A N/A N/A N/A N/A N/A
N/A N/A 3,343,597.759 N/A N/A N/AN/A N/A 9.99 N/A N/A N/A
N/A N/A N/A N/A N/A N/AN/A N/A N/A N/A N/A N/A
N/A N/A N/A N/A N/A N/AN/A N/A N/A N/A N/A N/A
N/A N/A N/A N/A N/A N/AN/A N/A N/A N/A N/A N/A
N/A N/A N/A N/A N/A N/AN/A N/A N/A N/A N/A N/A
N/A N/A N/A N/A N/A N/AN/A N/A N/A N/A N/A N/A
N/A N/A N/A N/A N/A N/AN/A N/A N/A N/A N/A N/A
N/A N/A N/A N/A N/A N/AN/A N/A N/A N/A N/A N/A
N/A 1,061,492.211 N/A N/A 849,683.944 3,045,794.082N/A 37.07 N/A N/A 24.76 9.09
N/A N/A N/A N/A N/A N/AN/A N/A N/A N/A N/A N/A
N/A N/A N/A N/A N/A N/AN/A N/A N/A N/A N/A N/A
N/A N/A N/A N/A 143,727.282 N/AN/A N/A N/A N/A 142.21 N/A
N/A N/A N/A N/A N/A N/AN/A N/A N/A N/A N/A N/A
490,000.000 N/A N/A 500.000 2,426,000.000 N/A9.66 N/A N/A 27.33 22.59 N/A
N/A 64,369.253 514,569.941 N/A 297,907.925 N/AN/A 39.23 12.95 N/A 24.60 N/A
HSBC Global Investment Funds 33
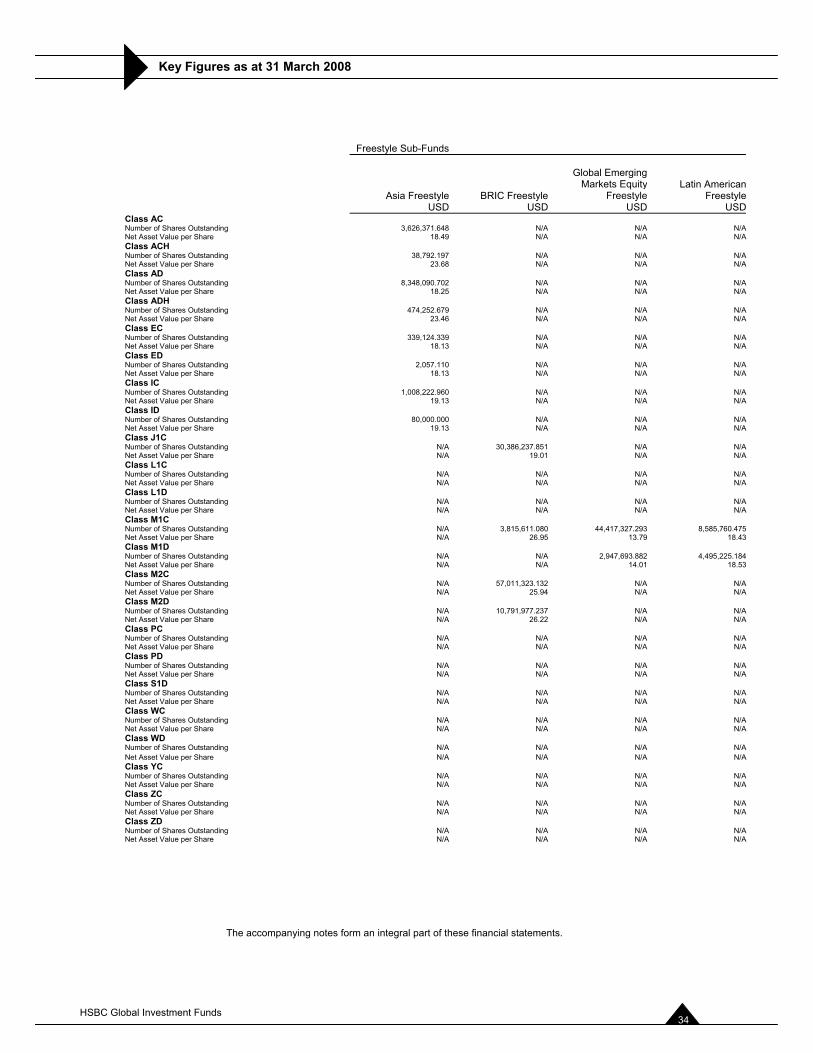
Key Figures as at 31 March 2008
The accompanying notes form an integral part of these financial statements.
Freestyle Sub-Funds
Asia FreestyleUSD
BRIC FreestyleUSD
Global Emerging Markets Equity
FreestyleUSD
Latin American Freestyle
USDClass AC Number of Shares Outstanding 3,626,371.648 N/A N/A N/ANet Asset Value per Share 18.49 N/A N/A N/AClass ACH Number of Shares Outstanding 38,792.197 N/A N/A N/ANet Asset Value per Share 23.68 N/A N/A N/AClass AD Number of Shares Outstanding 8,348,090.702 N/A N/A N/ANet Asset Value per Share 18.25 N/A N/A N/AClass ADH Number of Shares Outstanding 474,252.679 N/A N/A N/ANet Asset Value per Share 23.46 N/A N/A N/AClass EC Number of Shares Outstanding 339,124.339 N/A N/A N/ANet Asset Value per Share 18.13 N/A N/A N/AClass ED Number of Shares Outstanding 2,057.110 N/A N/A N/ANet Asset Value per Share 18.13 N/A N/A N/AClass IC Number of Shares Outstanding 1,008,222.960 N/A N/A N/ANet Asset Value per Share 19.13 N/A N/A N/AClass ID Number of Shares Outstanding 80,000.000 N/A N/A N/ANet Asset Value per Share 19.13 N/A N/A N/AClass J1C Number of Shares Outstanding N/A 30,386,237.851 N/A N/ANet Asset Value per Share N/A 19.01 N/A N/AClass L1C Number of Shares Outstanding N/A N/A N/A N/ANet Asset Value per Share N/A N/A N/A N/AClass L1D Number of Shares Outstanding N/A N/A N/A N/ANet Asset Value per Share N/A N/A N/A N/AClass M1C Number of Shares Outstanding N/A 3,815,611.080 44,417,327.293 8,585,760.475Net Asset Value per Share N/A 26.95 13.79 18.43Class M1D Number of Shares Outstanding N/A N/A 2,947,693.882 4,495,225.184Net Asset Value per Share N/A N/A 14.01 18.53Class M2C Number of Shares Outstanding N/A 57,011,323.132 N/A N/ANet Asset Value per Share N/A 25.94 N/A N/AClass M2D Number of Shares Outstanding N/A 10,791,977.237 N/A N/ANet Asset Value per Share N/A 26.22 N/A N/AClass PC Number of Shares Outstanding N/A N/A N/A N/ANet Asset Value per Share N/A N/A N/A N/AClass PD Number of Shares Outstanding N/A N/A N/A N/ANet Asset Value per Share N/A N/A N/A N/AClass S1D Number of Shares Outstanding N/A N/A N/A N/ANet Asset Value per Share N/A N/A N/A N/AClass WC Number of Shares Outstanding N/A N/A N/A N/ANet Asset Value per Share N/A N/A N/A N/AClass WD Number of Shares Outstanding N/A N/A N/A N/ANet Asset Value per Share N/A N/A N/A N/AClass YC Number of Shares Outstanding N/A N/A N/A N/ANet Asset Value per Share N/A N/A N/A N/AClass ZC Number of Shares Outstanding N/A N/A N/A N/ANet Asset Value per Share N/A N/A N/A N/AClass ZD Number of Shares Outstanding N/A N/A N/A N/ANet Asset Value per Share N/A N/A N/A N/A
HSBC Global Investment Funds 34
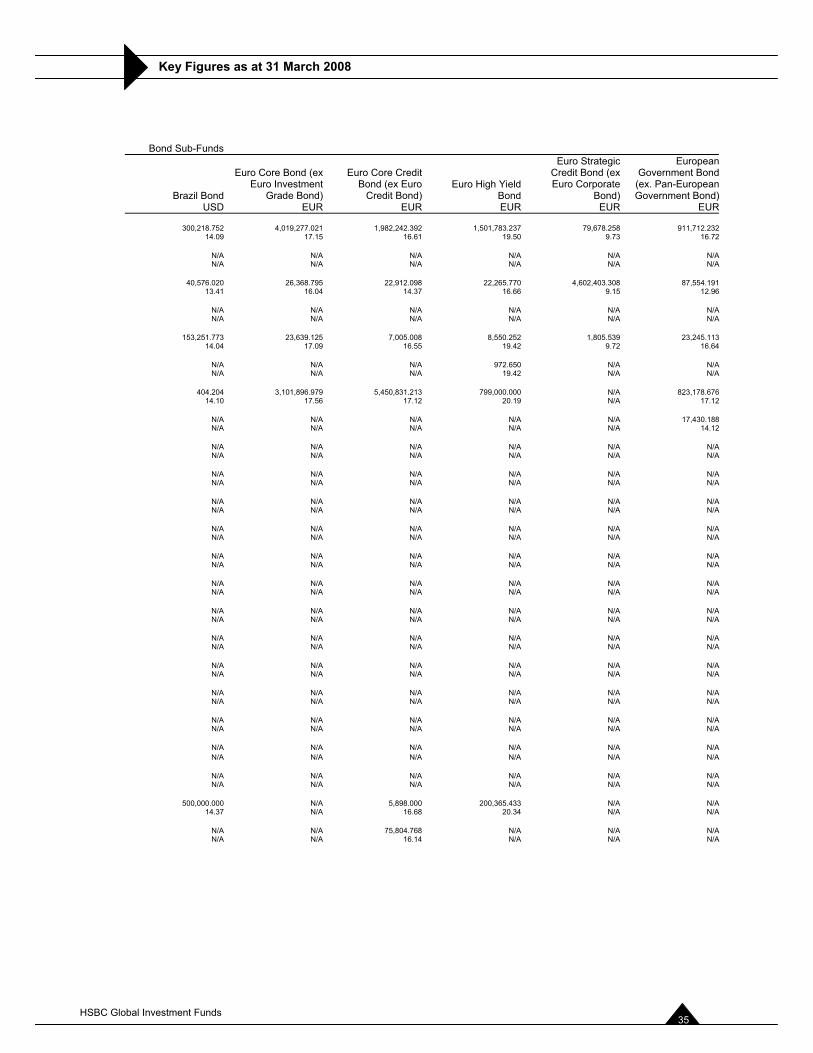
Key Figures as at 31 March 2008
Bond Sub-Funds
Brazil BondUSD
Euro Core Bond (exEuro Investment
Grade Bond)EUR
Euro Core Credit Bond (ex Euro
Credit Bond)EUR
Euro High Yield BondEUR
Euro Strategic Credit Bond (ex Euro Corporate
Bond)EUR
EuropeanGovernment Bond
(ex. Pan-European Government Bond)
EUR
300,218.752 4,019,277.021 1,982,242.392 1,501,783.237 79,678.258 911,712.23214.09 17.15 16.61 19.50 9.73 16.72
N/A N/A N/A N/A N/A N/AN/A N/A N/A N/A N/A N/A
40,576.020 26,368.795 22,912.098 22,265.770 4,602,403.308 87,554.19113.41 16.04 14.37 16.66 9.15 12.96
N/A N/A N/A N/A N/A N/AN/A N/A N/A N/A N/A N/A
153,251.773 23,639.125 7,005.008 8,550.252 1,805.539 23,245.11314.04 17.09 16.55 19.42 9.72 16.64
N/A N/A N/A 972.650 N/A N/AN/A N/A N/A 19.42 N/A N/A
404.204 3,101,896.979 5,450,831.213 799,000.000 N/A 823,178.67614.10 17.56 17.12 20.19 N/A 17.12
N/A N/A N/A N/A N/A 17,430.188N/A N/A N/A N/A N/A 14.12
N/A N/A N/A N/A N/A N/AN/A N/A N/A N/A N/A N/A
N/A N/A N/A N/A N/A N/AN/A N/A N/A N/A N/A N/A
N/A N/A N/A N/A N/A N/AN/A N/A N/A N/A N/A N/A
N/A N/A N/A N/A N/A N/AN/A N/A N/A N/A N/A N/A
N/A N/A N/A N/A N/A N/AN/A N/A N/A N/A N/A N/A
N/A N/A N/A N/A N/A N/AN/A N/A N/A N/A N/A N/A
N/A N/A N/A N/A N/A N/AN/A N/A N/A N/A N/A N/A
N/A N/A N/A N/A N/A N/AN/A N/A N/A N/A N/A N/A
N/A N/A N/A N/A N/A N/AN/A N/A N/A N/A N/A N/A
N/A N/A N/A N/A N/A N/AN/A N/A N/A N/A N/A N/A
N/A N/A N/A N/A N/A N/AN/A N/A N/A N/A N/A N/A
N/A N/A N/A N/A N/A N/AN/A N/A N/A N/A N/A N/A
N/A N/A N/A N/A N/A N/AN/A N/A N/A N/A N/A N/A
500,000.000 N/A 5,898.000 200,365.433 N/A N/A14.37 N/A 16.68 20.34 N/A N/A
N/A N/A 75,804.768 N/A N/A N/AN/A N/A 16.14 N/A N/A N/A
HSBC Global Investment Funds 35
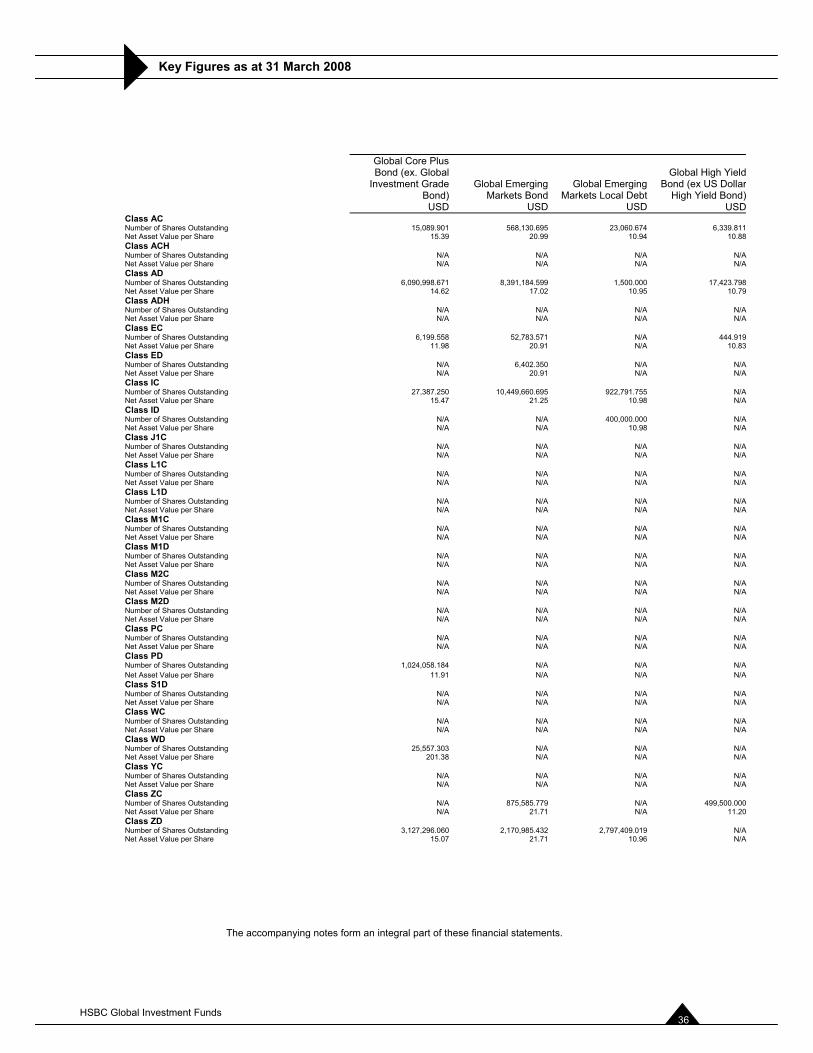
Key Figures as at 31 March 2008
The accompanying notes form an integral part of these financial statements.
Global Core Plus Bond (ex. Global
Investment Grade Bond)
USD
Global Emerging Markets Bond
USD
Global Emerging Markets Local Debt
USD
Global High Yield Bond (ex US Dollar
High Yield Bond)USD
Class AC Number of Shares Outstanding 15,089.901 568,130.695 23,060.674 6,339.811Net Asset Value per Share 15.39 20.99 10.94 10.88Class ACH Number of Shares Outstanding N/A N/A N/A N/ANet Asset Value per Share N/A N/A N/A N/AClass AD Number of Shares Outstanding 6,090,998.671 8,391,184.599 1,500.000 17,423.798Net Asset Value per Share 14.62 17.02 10.95 10.79Class ADH Number of Shares Outstanding N/A N/A N/A N/ANet Asset Value per Share N/A N/A N/A N/AClass EC Number of Shares Outstanding 6,199.558 52,783.571 N/A 444.919Net Asset Value per Share 11.98 20.91 N/A 10.83Class ED Number of Shares Outstanding N/A 6,402.350 N/A N/ANet Asset Value per Share N/A 20.91 N/A N/AClass IC Number of Shares Outstanding 27,387.250 10,449,660.695 922,791.755 N/ANet Asset Value per Share 15.47 21.25 10.98 N/AClass ID Number of Shares Outstanding N/A N/A 400,000.000 N/ANet Asset Value per Share N/A N/A 10.98 N/AClass J1C Number of Shares Outstanding N/A N/A N/A N/ANet Asset Value per Share N/A N/A N/A N/AClass L1C Number of Shares Outstanding N/A N/A N/A N/ANet Asset Value per Share N/A N/A N/A N/AClass L1D Number of Shares Outstanding N/A N/A N/A N/ANet Asset Value per Share N/A N/A N/A N/AClass M1C Number of Shares Outstanding N/A N/A N/A N/ANet Asset Value per Share N/A N/A N/A N/AClass M1D Number of Shares Outstanding N/A N/A N/A N/ANet Asset Value per Share N/A N/A N/A N/AClass M2C Number of Shares Outstanding N/A N/A N/A N/ANet Asset Value per Share N/A N/A N/A N/AClass M2D Number of Shares Outstanding N/A N/A N/A N/ANet Asset Value per Share N/A N/A N/A N/AClass PC Number of Shares Outstanding N/A N/A N/A N/ANet Asset Value per Share N/A N/A N/A N/AClass PD Number of Shares Outstanding 1,024,058.184 N/A N/A N/ANet Asset Value per Share 11.91 N/A N/A N/AClass S1D Number of Shares Outstanding N/A N/A N/A N/ANet Asset Value per Share N/A N/A N/A N/AClass WC Number of Shares Outstanding N/A N/A N/A N/ANet Asset Value per Share N/A N/A N/A N/AClass WD Number of Shares Outstanding 25,557.303 N/A N/A N/ANet Asset Value per Share 201.38 N/A N/A N/AClass YC Number of Shares Outstanding N/A N/A N/A N/ANet Asset Value per Share N/A N/A N/A N/AClass ZC Number of Shares Outstanding N/A 875,585.779 N/A 499,500.000Net Asset Value per Share N/A 21.71 N/A 11.20Class ZD Number of Shares Outstanding 3,127,296.060 2,170,985.432 2,797,409.019 N/ANet Asset Value per Share 15.07 21.71 10.96 N/A
HSBC Global Investment Funds 36
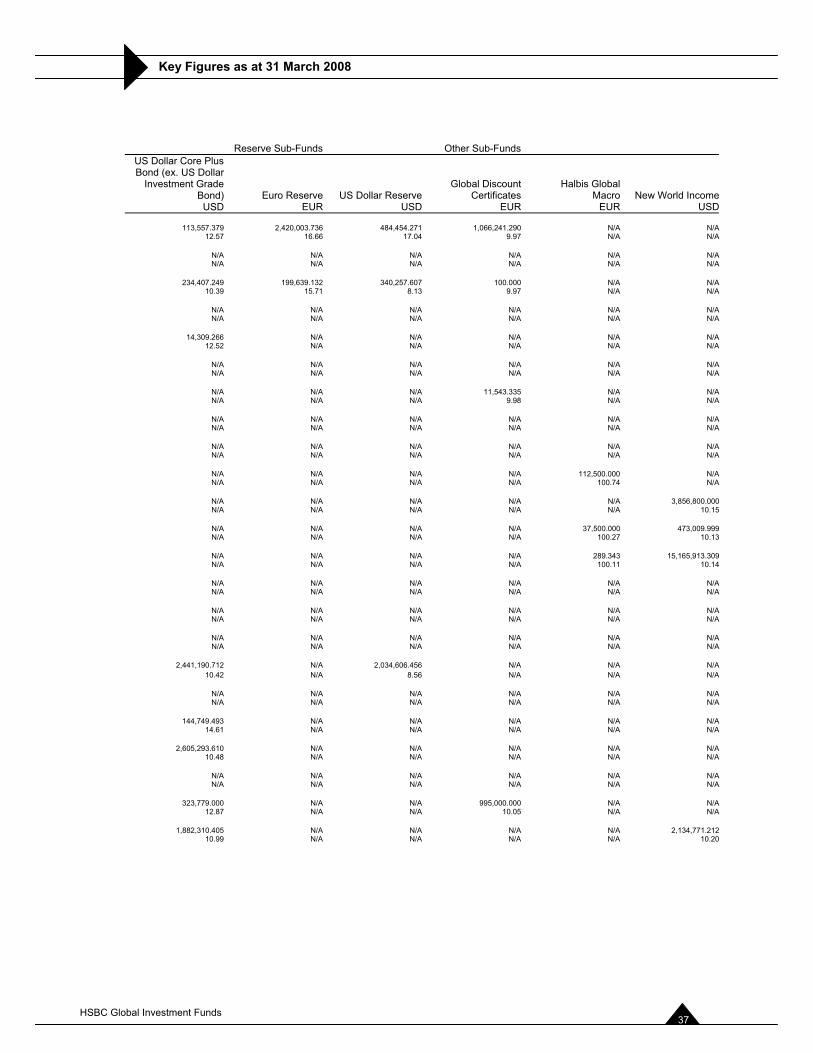
Key Figures as at 31 March 2008
Reserve Sub-Funds Other Sub-FundsUS Dollar Core Plus Bond (ex. US Dollar
Investment Grade Bond)
USDEuro Reserve
EURUS Dollar Reserve
USD
Global Discount Certificates
EUR
Halbis Global Macro
EURNew World Income
USD
113,557.379 2,420,003.736 484,454.271 1,066,241.290 N/A N/A12.57 16.66 17.04 9.97 N/A N/A
N/A N/A N/A N/A N/A N/AN/A N/A N/A N/A N/A N/A
234,407.249 199,639.132 340,257.607 100.000 N/A N/A10.39 15.71 8.13 9.97 N/A N/A
N/A N/A N/A N/A N/A N/AN/A N/A N/A N/A N/A N/A
14,309.266 N/A N/A N/A N/A N/A12.52 N/A N/A N/A N/A N/A
N/A N/A N/A N/A N/A N/AN/A N/A N/A N/A N/A N/A
N/A N/A N/A 11,543.335 N/A N/AN/A N/A N/A 9.98 N/A N/A
N/A N/A N/A N/A N/A N/AN/A N/A N/A N/A N/A N/A
N/A N/A N/A N/A N/A N/AN/A N/A N/A N/A N/A N/A
N/A N/A N/A N/A 112,500.000 N/AN/A N/A N/A N/A 100.74 N/A
N/A N/A N/A N/A N/A 3,856,800.000N/A N/A N/A N/A N/A 10.15
N/A N/A N/A N/A 37,500.000 473,009.999N/A N/A N/A N/A 100.27 10.13
N/A N/A N/A N/A 289.343 15,165,913.309N/A N/A N/A N/A 100.11 10.14
N/A N/A N/A N/A N/A N/AN/A N/A N/A N/A N/A N/A
N/A N/A N/A N/A N/A N/AN/A N/A N/A N/A N/A N/A
N/A N/A N/A N/A N/A N/AN/A N/A N/A N/A N/A N/A
2,441,190.712 N/A 2,034,606.456 N/A N/A N/A10.42 N/A 8.56 N/A N/A N/A
N/A N/A N/A N/A N/A N/AN/A N/A N/A N/A N/A N/A
144,749.493 N/A N/A N/A N/A N/A14.61 N/A N/A N/A N/A N/A
2,605,293.610 N/A N/A N/A N/A N/A10.48 N/A N/A N/A N/A N/A
N/A N/A N/A N/A N/A N/AN/A N/A N/A N/A N/A N/A
323,779.000 N/A N/A 995,000.000 N/A N/A12.87 N/A N/A 10.05 N/A N/A
1,882,310.405 N/A N/A N/A N/A 2,134,771.21210.99 N/A N/A N/A N/A 10.20
HSBC Global Investment Funds 37
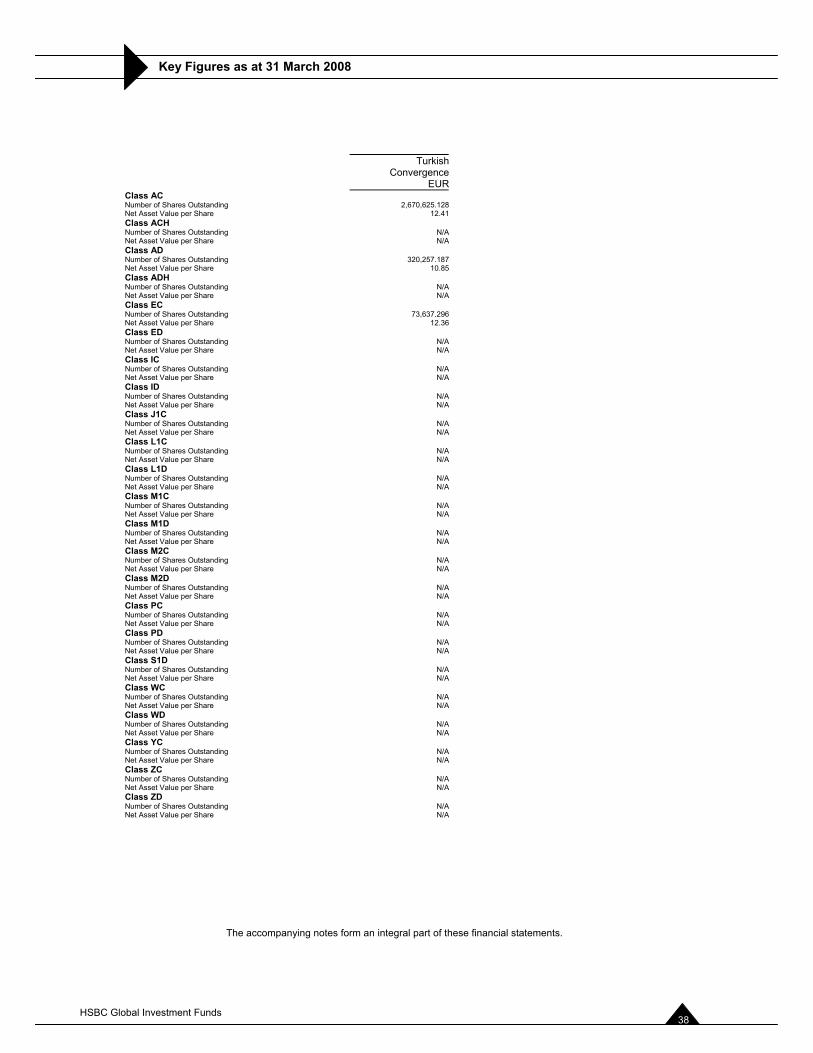
Key Figures as at 31 March 2008
The accompanying notes form an integral part of these financial statements.
Turkish Convergence
EURClass AC Number of Shares Outstanding 2,670,625.128 Net Asset Value per Share 12.41Class ACH Number of Shares Outstanding N/A Net Asset Value per Share N/A Class AD Number of Shares Outstanding 320,257.187 Net Asset Value per Share 10.85Class ADH Number of Shares Outstanding N/A Net Asset Value per Share N/A Class EC Number of Shares Outstanding 73,637.296 Net Asset Value per Share 12.36Class ED Number of Shares Outstanding N/A Net Asset Value per Share N/A Class IC Number of Shares Outstanding N/A Net Asset Value per Share N/A Class ID Number of Shares Outstanding N/A Net Asset Value per Share N/A Class J1C Number of Shares Outstanding N/A Net Asset Value per Share N/A Class L1C Number of Shares Outstanding N/A Net Asset Value per Share N/A Class L1D Number of Shares Outstanding N/A Net Asset Value per Share N/A Class M1C Number of Shares Outstanding N/A Net Asset Value per Share N/A Class M1D Number of Shares Outstanding N/A Net Asset Value per Share N/A Class M2C Number of Shares Outstanding N/A Net Asset Value per Share N/A Class M2D Number of Shares Outstanding N/A Net Asset Value per Share N/A Class PC Number of Shares Outstanding N/A Net Asset Value per Share N/A Class PD Number of Shares Outstanding N/A Net Asset Value per Share N/A Class S1D Number of Shares Outstanding N/A Net Asset Value per Share N/A Class WC Number of Shares Outstanding N/A Net Asset Value per Share N/A Class WD Number of Shares Outstanding N/A Net Asset Value per Share N/A Class YC Number of Shares Outstanding N/A Net Asset Value per Share N/A Class ZC Number of Shares Outstanding N/A Net Asset Value per Share N/A Class ZD Number of Shares Outstanding N/A Net Asset Value per Share N/A
HSBC Global Investment Funds 38
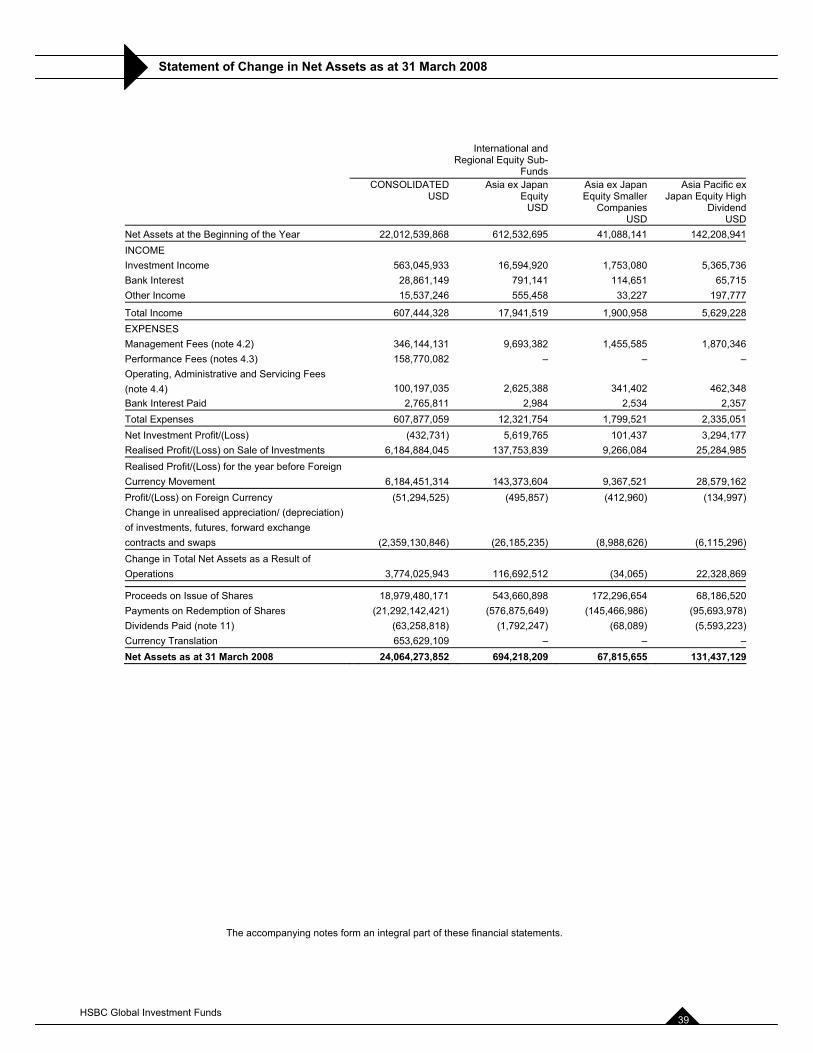
Statement of Change in Net Assets as at 31 March 2008
The accompanying notes form an integral part of these financial statements.
International and Regional Equity Sub-
FundsCONSOLIDATED
USDAsia ex Japan
EquityUSD
Asia ex Japan Equity Smaller
CompaniesUSD
Asia Pacific ex Japan Equity High
DividendUSD
Net Assets at the Beginning of the Year 22,012,539,868 612,532,695 41,088,141 142,208,941INCOMEInvestment Income 563,045,933 16,594,920 1,753,080 5,365,736Bank Interest 28,861,149 791,141 114,651 65,715Other Income 15,537,246 555,458 33,227 197,777
Total Income 607,444,328 17,941,519 1,900,958 5,629,228EXPENSESManagement Fees (note 4.2) 346,144,131 9,693,382 1,455,585 1,870,346Performance Fees (notes 4.3) 158,770,082 – – –Operating, Administrative and Servicing Fees (note 4.4) 100,197,035 2,625,388 341,402 462,348Bank Interest Paid 2,765,811 2,984 2,534 2,357Total Expenses 607,877,059 12,321,754 1,799,521 2,335,051Net Investment Profit/(Loss) (432,731) 5,619,765 101,437 3,294,177Realised Profit/(Loss) on Sale of Investments 6,184,884,045 137,753,839 9,266,084 25,284,985Realised Profit/(Loss) for the year before Foreign Currency Movement 6,184,451,314 143,373,604 9,367,521 28,579,162Profit/(Loss) on Foreign Currency (51,294,525) (495,857) (412,960) (134,997) Change in unrealised appreciation/ (depreciation) of investments, futures, forward exchange contracts and swaps (2,359,130,846) (26,185,235) (8,988,626) (6,115,296)Change in Total Net Assets as a Result of Operations 3,774,025,943 116,692,512 (34,065) 22,328,869
Proceeds on Issue of Shares 18,979,480,171 543,660,898 172,296,654 68,186,520Payments on Redemption of Shares (21,292,142,421) (576,875,649) (145,466,986) (95,693,978)Dividends Paid (note 11) (63,258,818) (1,792,247) (68,089) (5,593,223)Currency Translation 653,629,109 – – –Net Assets as at 31 March 2008 24,064,273,852 694,218,209 67,815,655 131,437,129
HSBC Global Investment Funds 39
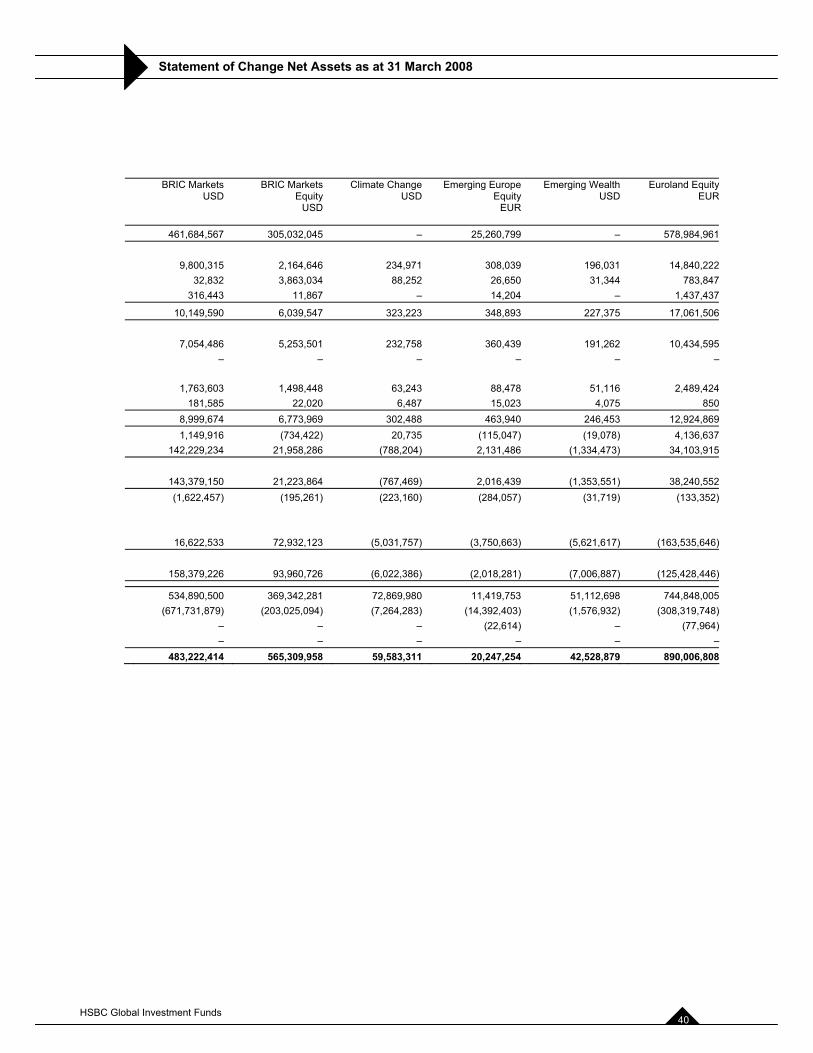
Statement of Change Net Assets as at 31 March 2008
BRIC MarketsUSD
BRIC Markets Equity
USD
Climate ChangeUSD
Emerging Europe Equity
EUR
Emerging WealthUSD
Euroland EquityEUR
461,684,567 305,032,045 – 25,260,799 – 578,984,961
9,800,315 2,164,646 234,971 308,039 196,031 14,840,22232,832 3,863,034 88,252 26,650 31,344 783,847
316,443 11,867 – 14,204 – 1,437,437
10,149,590 6,039,547 323,223 348,893 227,375 17,061,506
7,054,486 5,253,501 232,758 360,439 191,262 10,434,595– – – – – –
1,763,603 1,498,448 63,243 88,478 51,116 2,489,424181,585 22,020 6,487 15,023 4,075 850
8,999,674 6,773,969 302,488 463,940 246,453 12,924,8691,149,916 (734,422) 20,735 (115,047) (19,078) 4,136,637
142,229,234 21,958,286 (788,204) 2,131,486 (1,334,473) 34,103,915
143,379,150 21,223,864 (767,469) 2,016,439 (1,353,551) 38,240,552(1,622,457) (195,261) (223,160) (284,057) (31,719) (133,352)
16,622,533 72,932,123 (5,031,757) (3,750,663) (5,621,617) (163,535,646)
158,379,226 93,960,726 (6,022,386) (2,018,281) (7,006,887) (125,428,446)
534,890,500 369,342,281 72,869,980 11,419,753 51,112,698 744,848,005(671,731,879) (203,025,094) (7,264,283) (14,392,403) (1,576,932) (308,319,748)
– – – (22,614) – (77,964)– – – – – –
483,222,414 565,309,958 59,583,311 20,247,254 42,528,879 890,006,808
HSBC Global Investment Funds 40
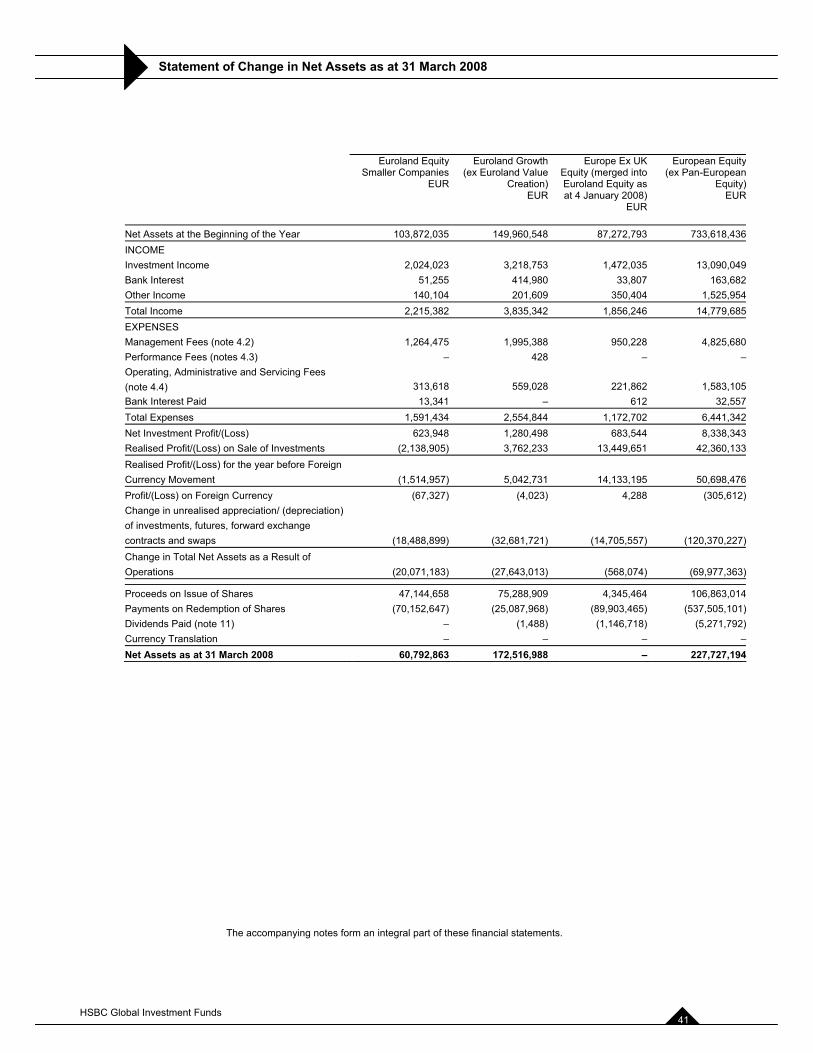
Statement of Change in Net Assets as at 31 March 2008
The accompanying notes form an integral part of these financial statements.
Euroland EquitySmaller Companies
EUR
Euroland Growth (ex Euroland Value
Creation)EUR
Europe Ex UK Equity (merged into Euroland Equity as at 4 January 2008)
EUR
European Equity(ex Pan-European
Equity)EUR
Net Assets at the Beginning of the Year 103,872,035 149,960,548 87,272,793 733,618,436INCOMEInvestment Income 2,024,023 3,218,753 1,472,035 13,090,049Bank Interest 51,255 414,980 33,807 163,682Other Income 140,104 201,609 350,404 1,525,954Total Income 2,215,382 3,835,342 1,856,246 14,779,685EXPENSESManagement Fees (note 4.2) 1,264,475 1,995,388 950,228 4,825,680Performance Fees (notes 4.3) – 428 – –Operating, Administrative and Servicing Fees (note 4.4) 313,618 559,028 221,862 1,583,105Bank Interest Paid 13,341 – 612 32,557Total Expenses 1,591,434 2,554,844 1,172,702 6,441,342Net Investment Profit/(Loss) 623,948 1,280,498 683,544 8,338,343Realised Profit/(Loss) on Sale of Investments (2,138,905) 3,762,233 13,449,651 42,360,133Realised Profit/(Loss) for the year before Foreign Currency Movement (1,514,957) 5,042,731 14,133,195 50,698,476Profit/(Loss) on Foreign Currency (67,327) (4,023) 4,288 (305,612) Change in unrealised appreciation/ (depreciation) of investments, futures, forward exchange contracts and swaps (18,488,899) (32,681,721) (14,705,557) (120,370,227)Change in Total Net Assets as a Result of Operations (20,071,183) (27,643,013) (568,074) (69,977,363)
Proceeds on Issue of Shares 47,144,658 75,288,909 4,345,464 106,863,014Payments on Redemption of Shares (70,152,647) (25,087,968) (89,903,465) (537,505,101)Dividends Paid (note 11) – (1,488) (1,146,718) (5,271,792)Currency Translation – – – –Net Assets as at 31 March 2008 60,792,863 172,516,988 – 227,727,194
HSBC Global Investment Funds 41
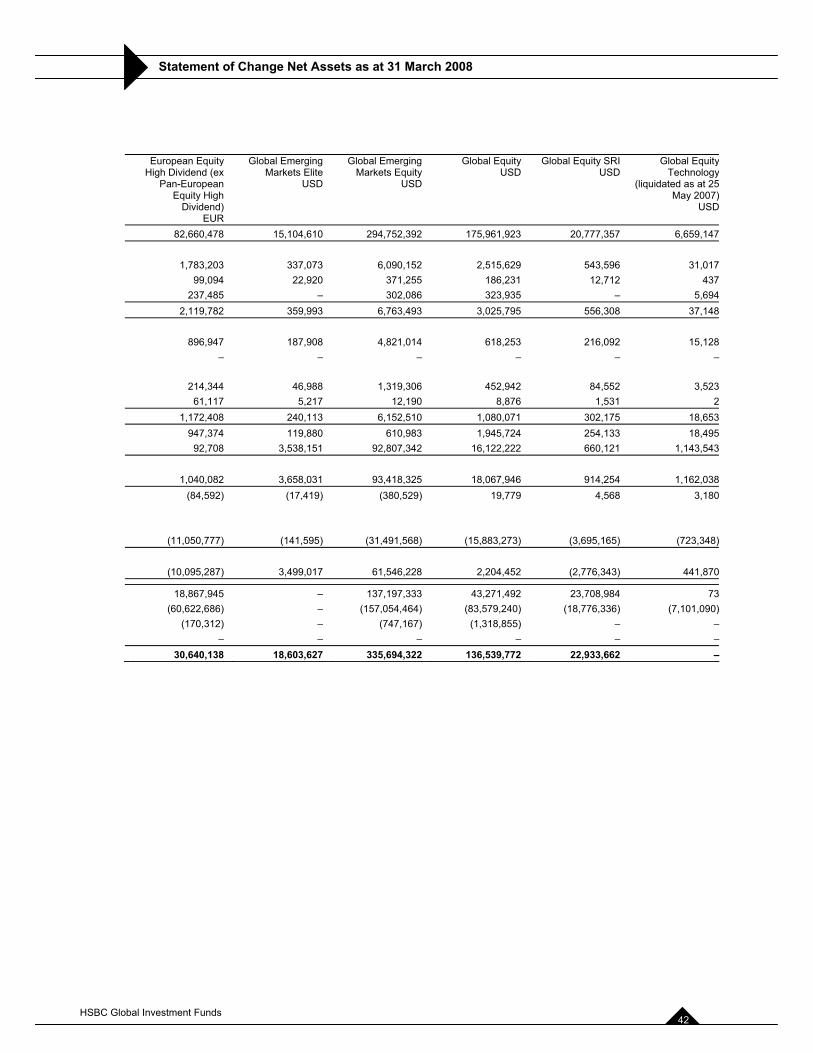
Statement of Change Net Assets as at 31 March 2008
European EquityHigh Dividend (ex
Pan-European Equity High
Dividend)EUR
Global Emerging Markets Elite
USD
Global Emerging Markets Equity
USD
Global EquityUSD
Global Equity SRIUSD
Global EquityTechnology
(liquidated as at 25 May 2007)
USD
82,660,478 15,104,610 294,752,392 175,961,923 20,777,357 6,659,147
1,783,203 337,073 6,090,152 2,515,629 543,596 31,01799,094 22,920 371,255 186,231 12,712 437
237,485 – 302,086 323,935 – 5,6942,119,782 359,993 6,763,493 3,025,795 556,308 37,148
896,947 187,908 4,821,014 618,253 216,092 15,128– – – – – –
214,344 46,988 1,319,306 452,942 84,552 3,52361,117 5,217 12,190 8,876 1,531 2
1,172,408 240,113 6,152,510 1,080,071 302,175 18,653947,374 119,880 610,983 1,945,724 254,133 18,495
92,708 3,538,151 92,807,342 16,122,222 660,121 1,143,543
1,040,082 3,658,031 93,418,325 18,067,946 914,254 1,162,038(84,592) (17,419) (380,529) 19,779 4,568 3,180
(11,050,777) (141,595) (31,491,568) (15,883,273) (3,695,165) (723,348)
(10,095,287) 3,499,017 61,546,228 2,204,452 (2,776,343) 441,870
18,867,945 – 137,197,333 43,271,492 23,708,984 73(60,622,686) – (157,054,464) (83,579,240) (18,776,336) (7,101,090)
(170,312) – (747,167) (1,318,855) – –– – – – – –
30,640,138 18,603,627 335,694,322 136,539,772 22,933,662 –
HSBC Global Investment Funds 42
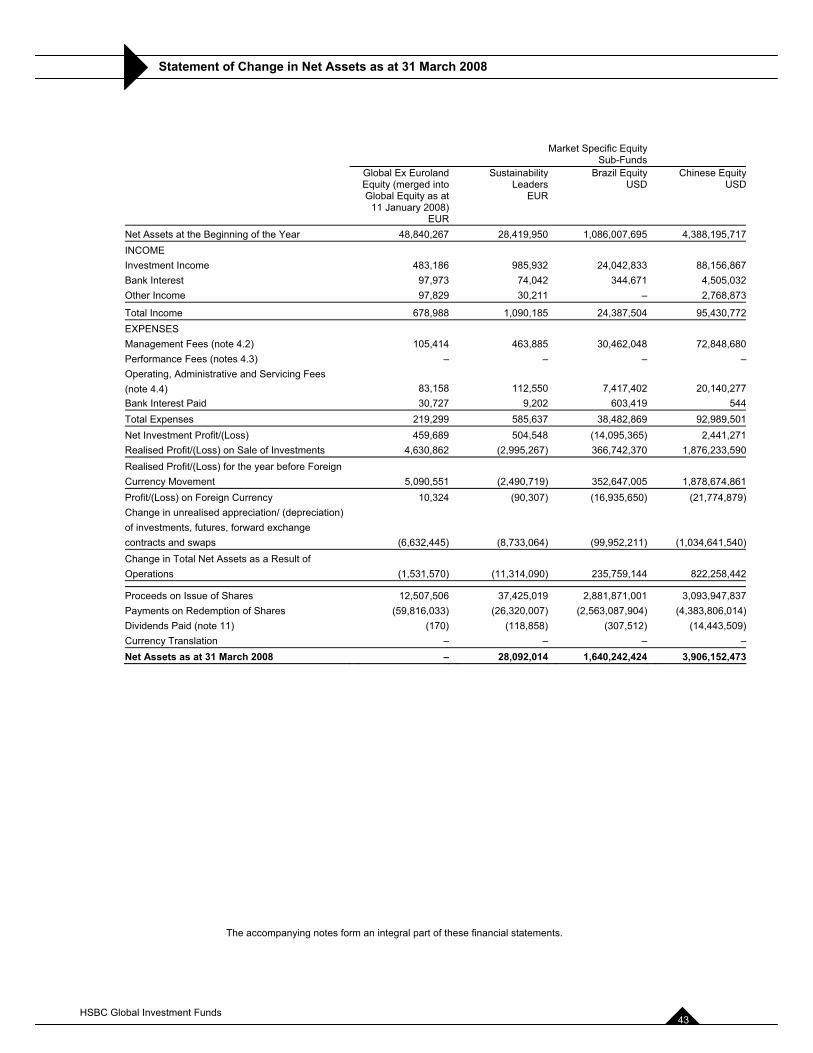
Statement of Change in Net Assets as at 31 March 2008
The accompanying notes form an integral part of these financial statements.
Market Specific EquitySub-Funds
Global Ex Euroland Equity (merged into Global Equity as at
11 January 2008)EUR
SustainabilityLeaders
EUR
Brazil EquityUSD
Chinese EquityUSD
Net Assets at the Beginning of the Year 48,840,267 28,419,950 1,086,007,695 4,388,195,717INCOMEInvestment Income 483,186 985,932 24,042,833 88,156,867Bank Interest 97,973 74,042 344,671 4,505,032Other Income 97,829 30,211 – 2,768,873
Total Income 678,988 1,090,185 24,387,504 95,430,772EXPENSESManagement Fees (note 4.2) 105,414 463,885 30,462,048 72,848,680Performance Fees (notes 4.3) – – – –Operating, Administrative and Servicing Fees (note 4.4) 83,158 112,550 7,417,402 20,140,277Bank Interest Paid 30,727 9,202 603,419 544Total Expenses 219,299 585,637 38,482,869 92,989,501Net Investment Profit/(Loss) 459,689 504,548 (14,095,365) 2,441,271Realised Profit/(Loss) on Sale of Investments 4,630,862 (2,995,267) 366,742,370 1,876,233,590Realised Profit/(Loss) for the year before Foreign Currency Movement 5,090,551 (2,490,719) 352,647,005 1,878,674,861Profit/(Loss) on Foreign Currency 10,324 (90,307) (16,935,650) (21,774,879)Change in unrealised appreciation/ (depreciation) of investments, futures, forward exchange contracts and swaps (6,632,445) (8,733,064) (99,952,211) (1,034,641,540)Change in Total Net Assets as a Result of Operations (1,531,570) (11,314,090) 235,759,144 822,258,442
Proceeds on Issue of Shares 12,507,506 37,425,019 2,881,871,001 3,093,947,837Payments on Redemption of Shares (59,816,033) (26,320,007) (2,563,087,904) (4,383,806,014)Dividends Paid (note 11) (170) (118,858) (307,512) (14,443,509)Currency Translation – – – –Net Assets as at 31 March 2008 – 28,092,014 1,640,242,424 3,906,152,473
HSBC Global Investment Funds 43
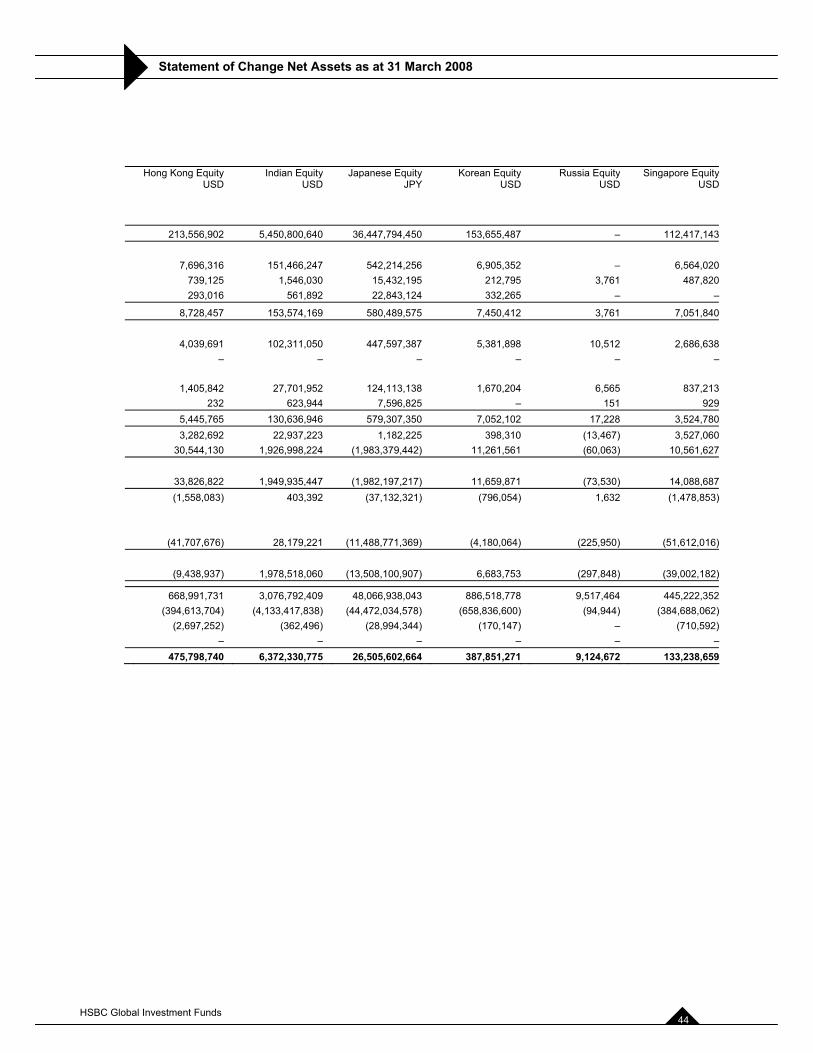
Statement of Change Net Assets as at 31 March 2008
Hong Kong EquityUSD
Indian EquityUSD
Japanese EquityJPY
Korean EquityUSD
Russia EquityUSD
Singapore EquityUSD
213,556,902 5,450,800,640 36,447,794,450 153,655,487 – 112,417,143
7,696,316 151,466,247 542,214,256 6,905,352 – 6,564,020739,125 1,546,030 15,432,195 212,795 3,761 487,820293,016 561,892 22,843,124 332,265 – –
8,728,457 153,574,169 580,489,575 7,450,412 3,761 7,051,840
4,039,691 102,311,050 447,597,387 5,381,898 10,512 2,686,638– – – – – –
1,405,842 27,701,952 124,113,138 1,670,204 6,565 837,213232 623,944 7,596,825 – 151 929
5,445,765 130,636,946 579,307,350 7,052,102 17,228 3,524,7803,282,692 22,937,223 1,182,225 398,310 (13,467) 3,527,060
30,544,130 1,926,998,224 (1,983,379,442) 11,261,561 (60,063) 10,561,627
33,826,822 1,949,935,447 (1,982,197,217) 11,659,871 (73,530) 14,088,687(1,558,083) 403,392 (37,132,321) (796,054) 1,632 (1,478,853)
(41,707,676) 28,179,221 (11,488,771,369) (4,180,064) (225,950) (51,612,016)
(9,438,937) 1,978,518,060 (13,508,100,907) 6,683,753 (297,848) (39,002,182)
668,991,731 3,076,792,409 48,066,938,043 886,518,778 9,517,464 445,222,352(394,613,704) (4,133,417,838) (44,472,034,578) (658,836,600) (94,944) (384,688,062)
(2,697,252) (362,496) (28,994,344) (170,147) – (710,592)– – – – – –
475,798,740 6,372,330,775 26,505,602,664 387,851,271 9,124,672 133,238,659
HSBC Global Investment Funds 44
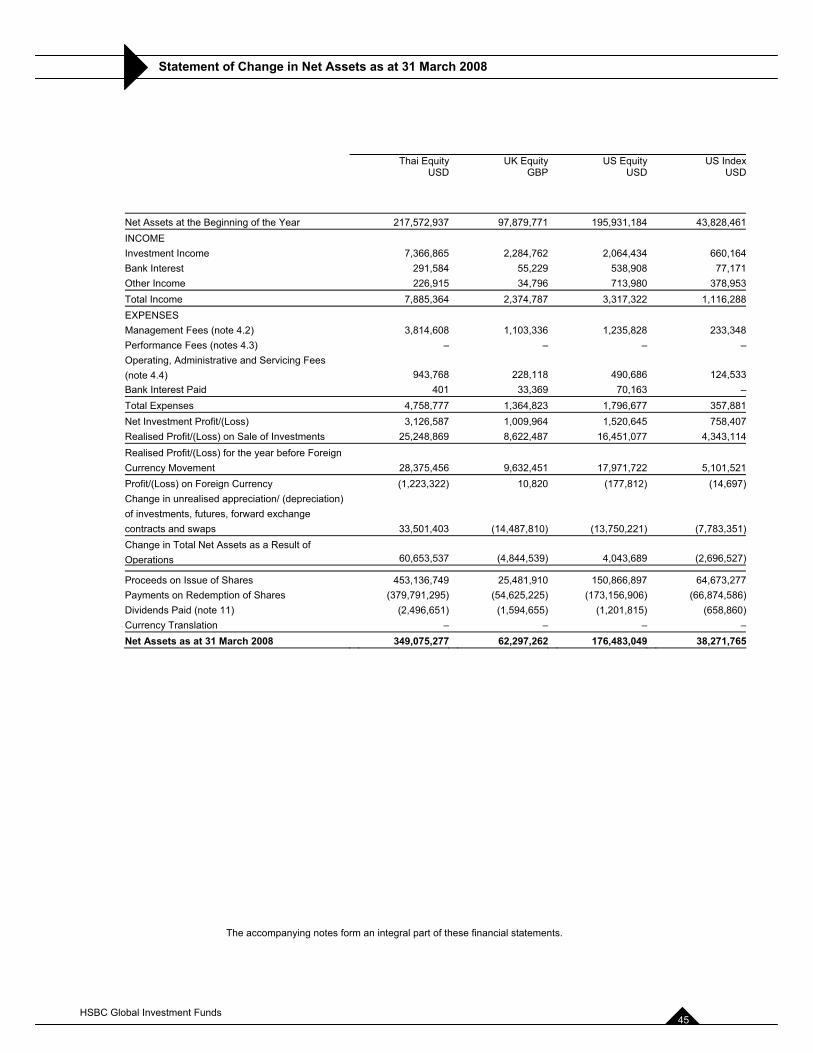
Statement of Change in Net Assets as at 31 March 2008
The accompanying notes form an integral part of these financial statements.
Thai EquityUSD
UK EquityGBP
US EquityUSD
US IndexUSD
Net Assets at the Beginning of the Year 217,572,937 97,879,771 195,931,184 43,828,461INCOMEInvestment Income 7,366,865 2,284,762 2,064,434 660,164Bank Interest 291,584 55,229 538,908 77,171Other Income 226,915 34,796 713,980 378,953Total Income 7,885,364 2,374,787 3,317,322 1,116,288EXPENSESManagement Fees (note 4.2) 3,814,608 1,103,336 1,235,828 233,348Performance Fees (notes 4.3) – – – –Operating, Administrative and Servicing Fees (note 4.4) 943,768 228,118 490,686 124,533Bank Interest Paid 401 33,369 70,163 –Total Expenses 4,758,777 1,364,823 1,796,677 357,881Net Investment Profit/(Loss) 3,126,587 1,009,964 1,520,645 758,407Realised Profit/(Loss) on Sale of Investments 25,248,869 8,622,487 16,451,077 4,343,114Realised Profit/(Loss) for the year before Foreign Currency Movement 28,375,456 9,632,451 17,971,722 5,101,521Profit/(Loss) on Foreign Currency (1,223,322) 10,820 (177,812) (14,697) Change in unrealised appreciation/ (depreciation) of investments, futures, forward exchange contracts and swaps 33,501,403 (14,487,810) (13,750,221) (7,783,351)Change in Total Net Assets as a Result of Operations 60,653,537 (4,844,539) 4,043,689 (2,696,527)
Proceeds on Issue of Shares 453,136,749 25,481,910 150,866,897 64,673,277Payments on Redemption of Shares (379,791,295) (54,625,225) (173,156,906) (66,874,586)Dividends Paid (note 11) (2,496,651) (1,594,655) (1,201,815) (658,860) Currency Translation – – – –Net Assets as at 31 March 2008 349,075,277 62,297,262 176,483,049 38,271,765
HSBC Global Investment Funds 45
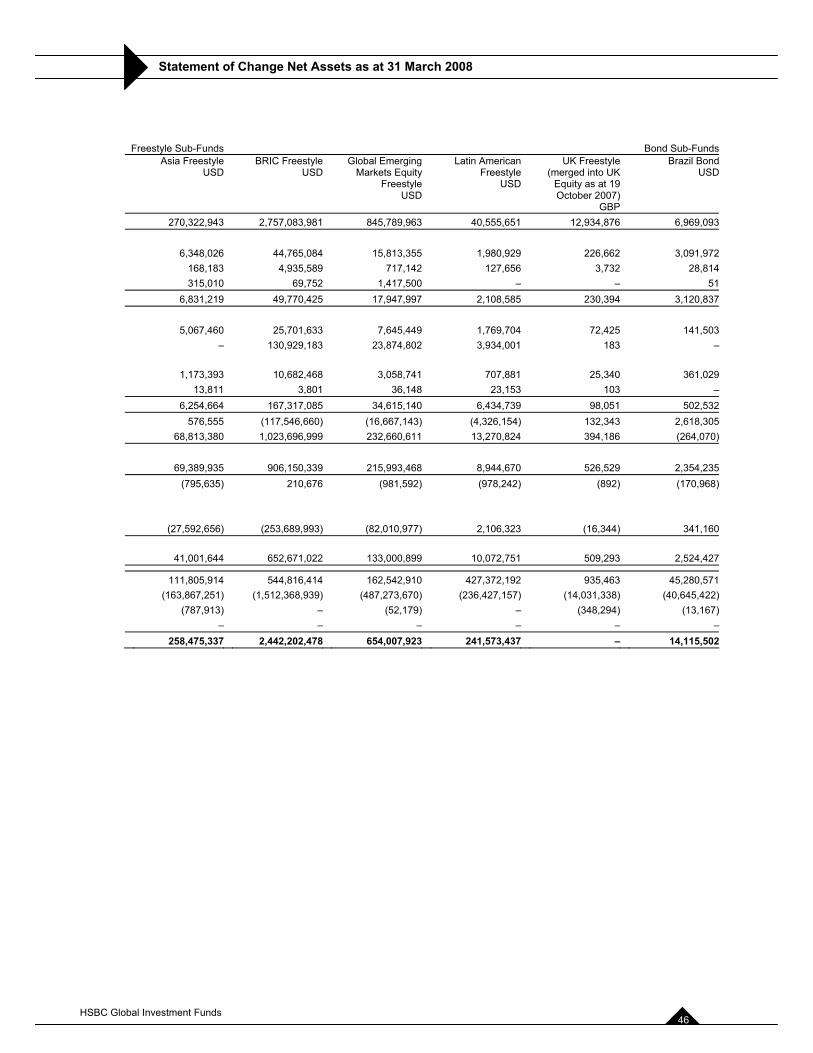
Statement of Change Net Assets as at 31 March 2008
Freestyle Sub-Funds Bond Sub-FundsAsia Freestyle
USDBRIC Freestyle
USDGlobal Emerging
Markets EquityFreestyle
USD
Latin American Freestyle
USD
UK Freestyle (merged into UK
Equity as at 19 October 2007)
GBP
Brazil BondUSD
270,322,943 2,757,083,981 845,789,963 40,555,651 12,934,876 6,969,093
6,348,026 44,765,084 15,813,355 1,980,929 226,662 3,091,972168,183 4,935,589 717,142 127,656 3,732 28,814315,010 69,752 1,417,500 – – 51
6,831,219 49,770,425 17,947,997 2,108,585 230,394 3,120,837
5,067,460 25,701,633 7,645,449 1,769,704 72,425 141,503– 130,929,183 23,874,802 3,934,001 183 –
1,173,393 10,682,468 3,058,741 707,881 25,340 361,02913,811 3,801 36,148 23,153 103 –
6,254,664 167,317,085 34,615,140 6,434,739 98,051 502,532576,555 (117,546,660) (16,667,143) (4,326,154) 132,343 2,618,305
68,813,380 1,023,696,999 232,660,611 13,270,824 394,186 (264,070)
69,389,935 906,150,339 215,993,468 8,944,670 526,529 2,354,235(795,635) 210,676 (981,592) (978,242) (892) (170,968)
(27,592,656) (253,689,993) (82,010,977) 2,106,323 (16,344) 341,160
41,001,644 652,671,022 133,000,899 10,072,751 509,293 2,524,427
111,805,914 544,816,414 162,542,910 427,372,192 935,463 45,280,571(163,867,251) (1,512,368,939) (487,273,670) (236,427,157) (14,031,338) (40,645,422)
(787,913) – (52,179) – (348,294) (13,167)– – – – – –
258,475,337 2,442,202,478 654,007,923 241,573,437 – 14,115,502
HSBC Global Investment Funds 46
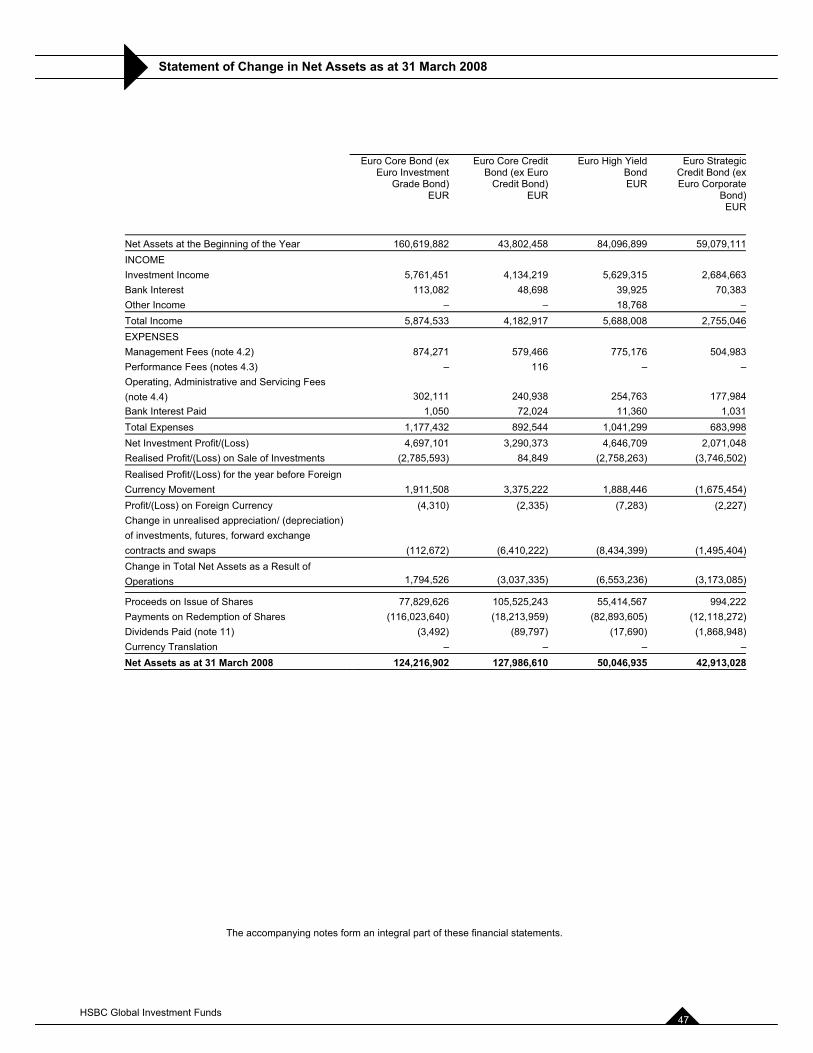
Statement of Change in Net Assets as at 31 March 2008
The accompanying notes form an integral part of these financial statements.
Euro Core Bond (ex Euro Investment
Grade Bond)EUR
Euro Core Credit Bond (ex Euro
Credit Bond)EUR
Euro High Yield BondEUR
Euro Strategic Credit Bond (ex Euro Corporate
Bond)EUR
Net Assets at the Beginning of the Year 160,619,882 43,802,458 84,096,899 59,079,111INCOMEInvestment Income 5,761,451 4,134,219 5,629,315 2,684,663Bank Interest 113,082 48,698 39,925 70,383Other Income – – 18,768 –Total Income 5,874,533 4,182,917 5,688,008 2,755,046EXPENSESManagement Fees (note 4.2) 874,271 579,466 775,176 504,983Performance Fees (notes 4.3) – 116 – –Operating, Administrative and Servicing Fees (note 4.4) 302,111 240,938 254,763 177,984Bank Interest Paid 1,050 72,024 11,360 1,031Total Expenses 1,177,432 892,544 1,041,299 683,998Net Investment Profit/(Loss) 4,697,101 3,290,373 4,646,709 2,071,048Realised Profit/(Loss) on Sale of Investments (2,785,593) 84,849 (2,758,263) (3,746,502)Realised Profit/(Loss) for the year before Foreign Currency Movement 1,911,508 3,375,222 1,888,446 (1,675,454)Profit/(Loss) on Foreign Currency (4,310) (2,335) (7,283) (2,227)Change in unrealised appreciation/ (depreciation) of investments, futures, forward exchange contracts and swaps (112,672) (6,410,222) (8,434,399) (1,495,404)Change in Total Net Assets as a Result of Operations 1,794,526 (3,037,335) (6,553,236) (3,173,085)
Proceeds on Issue of Shares 77,829,626 105,525,243 55,414,567 994,222Payments on Redemption of Shares (116,023,640) (18,213,959) (82,893,605) (12,118,272)Dividends Paid (note 11) (3,492) (89,797) (17,690) (1,868,948)Currency Translation – – – –Net Assets as at 31 March 2008 124,216,902 127,986,610 50,046,935 42,913,028
HSBC Global Investment Funds 47
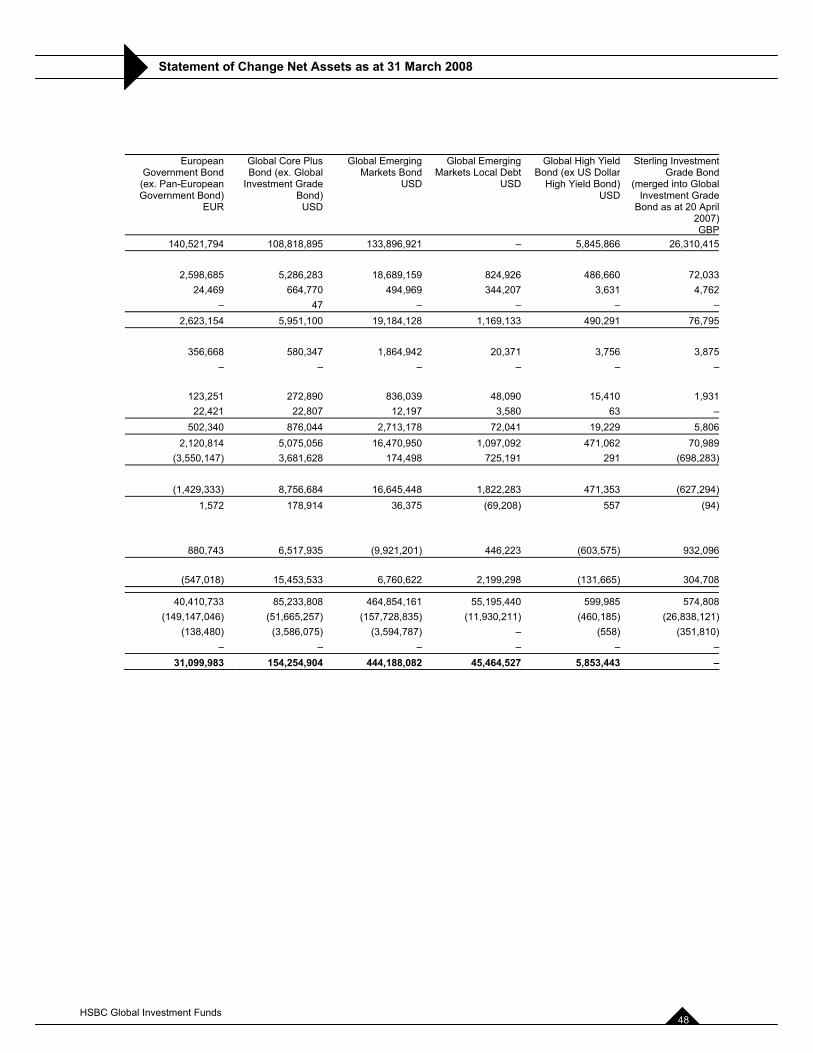
Statement of Change Net Assets as at 31 March 2008
EuropeanGovernment Bond (ex. Pan-European Government Bond)
EUR
Global Core Plus Bond (ex. Global
Investment GradeBond)
USD
Global Emerging Markets Bond
USD
Global Emerging Markets Local Debt
USD
Global High Yield Bond (ex US Dollar
High Yield Bond)USD
Sterling Investment Grade Bond
(merged into Global Investment Grade
Bond as at 20 April 2007)GBP
140,521,794 108,818,895 133,896,921 – 5,845,866 26,310,415
2,598,685 5,286,283 18,689,159 824,926 486,660 72,03324,469 664,770 494,969 344,207 3,631 4,762
– 47 – – – –2,623,154 5,951,100 19,184,128 1,169,133 490,291 76,795
356,668 580,347 1,864,942 20,371 3,756 3,875– – – – – –
123,251 272,890 836,039 48,090 15,410 1,93122,421 22,807 12,197 3,580 63 –
502,340 876,044 2,713,178 72,041 19,229 5,8062,120,814 5,075,056 16,470,950 1,097,092 471,062 70,989
(3,550,147) 3,681,628 174,498 725,191 291 (698,283)
(1,429,333) 8,756,684 16,645,448 1,822,283 471,353 (627,294)1,572 178,914 36,375 (69,208) 557 (94)
880,743 6,517,935 (9,921,201) 446,223 (603,575) 932,096
(547,018) 15,453,533 6,760,622 2,199,298 (131,665) 304,708
40,410,733 85,233,808 464,854,161 55,195,440 599,985 574,808(149,147,046) (51,665,257) (157,728,835) (11,930,211) (460,185) (26,838,121)
(138,480) (3,586,075) (3,594,787) – (558) (351,810)– – – – – –
31,099,983 154,254,904 444,188,082 45,464,527 5,853,443 –
HSBC Global Investment Funds 48
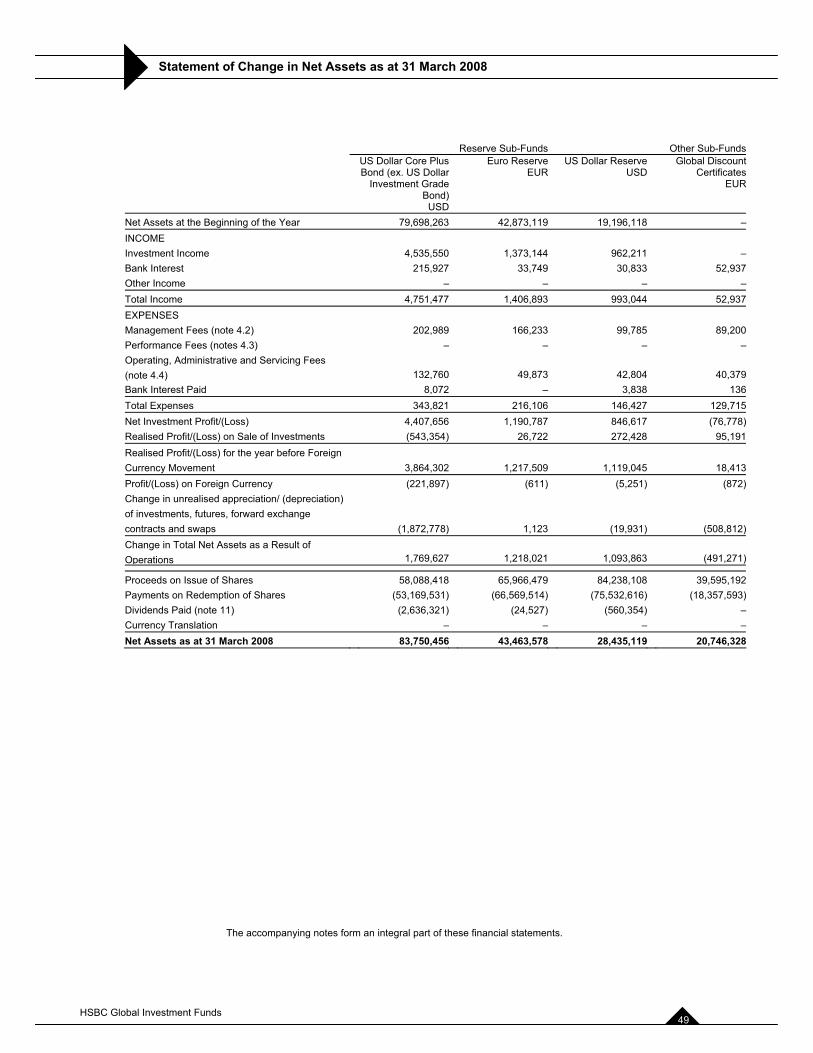
Statement of Change in Net Assets as at 31 March 2008
The accompanying notes form an integral part of these financial statements.
Reserve Sub-Funds Other Sub-FundsUS Dollar Core Plus Bond (ex. US Dollar
Investment Grade Bond)
USD
Euro ReserveEUR
US Dollar ReserveUSD
Global Discount Certificates
EUR
Net Assets at the Beginning of the Year 79,698,263 42,873,119 19,196,118 –INCOMEInvestment Income 4,535,550 1,373,144 962,211 –Bank Interest 215,927 33,749 30,833 52,937Other Income – – – –Total Income 4,751,477 1,406,893 993,044 52,937EXPENSESManagement Fees (note 4.2) 202,989 166,233 99,785 89,200Performance Fees (notes 4.3) – – – –Operating, Administrative and Servicing Fees (note 4.4) 132,760 49,873 42,804 40,379Bank Interest Paid 8,072 – 3,838 136Total Expenses 343,821 216,106 146,427 129,715Net Investment Profit/(Loss) 4,407,656 1,190,787 846,617 (76,778) Realised Profit/(Loss) on Sale of Investments (543,354) 26,722 272,428 95,191Realised Profit/(Loss) for the year before Foreign Currency Movement 3,864,302 1,217,509 1,119,045 18,413Profit/(Loss) on Foreign Currency (221,897) (611) (5,251) (872)Change in unrealised appreciation/ (depreciation) of investments, futures, forward exchange contracts and swaps (1,872,778) 1,123 (19,931) (508,812) Change in Total Net Assets as a Result of Operations 1,769,627 1,218,021 1,093,863 (491,271)
Proceeds on Issue of Shares 58,088,418 65,966,479 84,238,108 39,595,192Payments on Redemption of Shares (53,169,531) (66,569,514) (75,532,616) (18,357,593)Dividends Paid (note 11) (2,636,321) (24,527) (560,354) –Currency Translation – – – –Net Assets as at 31 March 2008 83,750,456 43,463,578 28,435,119 20,746,328
HSBC Global Investment Funds 49
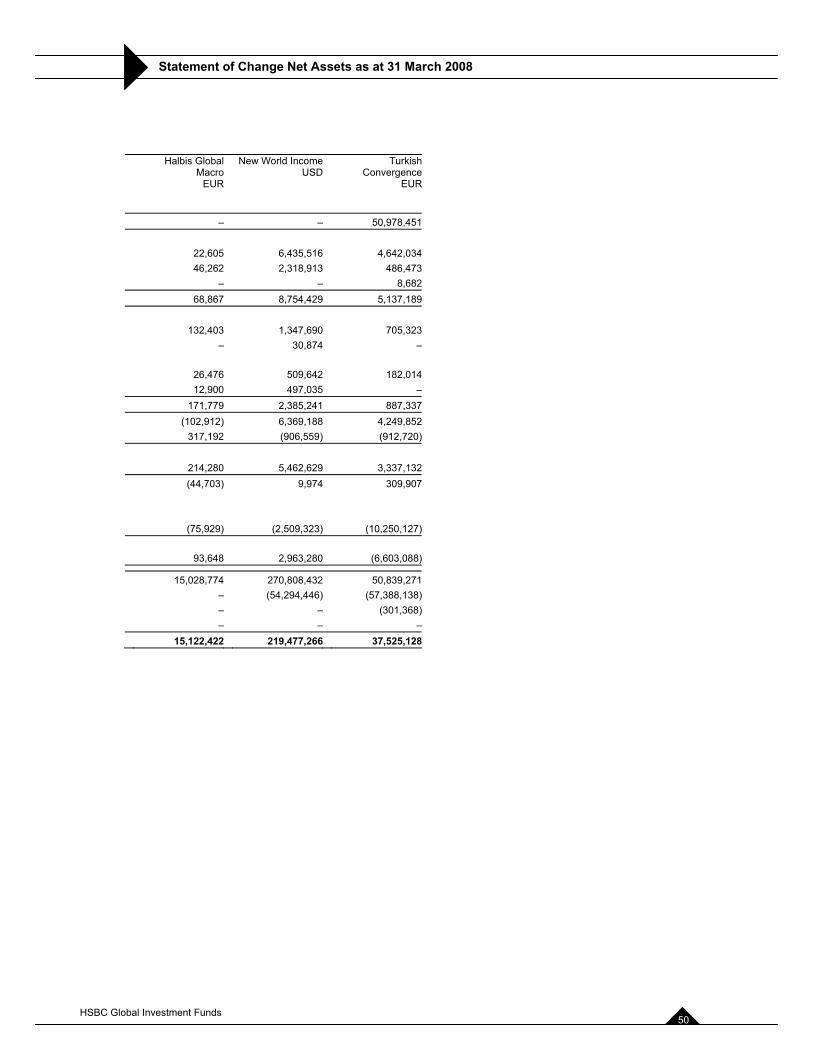
Statement of Change Net Assets as at 31 March 2008
Halbis Global Macro
EUR
New World IncomeUSD
Turkish Convergence
EUR
– – 50,978,451
22,605 6,435,516 4,642,03446,262 2,318,913 486,473
– – 8,68268,867 8,754,429 5,137,189
132,403 1,347,690 705,323– 30,874 –
26,476 509,642 182,01412,900 497,035 –
171,779 2,385,241 887,337(102,912) 6,369,188 4,249,852
317,192 (906,559) (912,720)
214,280 5,462,629 3,337,132(44,703) 9,974 309,907
(75,929) (2,509,323) (10,250,127)
93,648 2,963,280 (6,603,088)
15,028,774 270,808,432 50,839,271– (54,294,446) (57,388,138)– – (301,368)– – –
15,122,422 219,477,266 37,525,128
HSBC Global Investment Funds 50
Notes to the Financial Statements�
��
of shares each ts and liabilities. The
of the Company rrency designated in
financial statements of the Company are expressed in United at prescribed by the
2002 and has been 85/611/CEE of the Council of Europe.
Securities and Futures Commission under Ordinance”.
reports, the short names of the sub-funds are used. The complete name of each sub- short name of the sub-fund.
d to:
al Macro and New World Income, ging Markets Local Debt,
following sub-funds:
ond,
hanged its name to Global Core Plus Bond,
name to US Dollar Core Plus Bond, erging Markets Elite Fund changed its name to Global Emerging Markets Elite,
Yield Bond,
ean Equity High
.
the following sub-funds: ade Bond class WD merged into Global Investment Grade Bond
into Global ss PD merged into
� on 4 January 2008, Europe ex UK Equity class AC merged into Euroland Equity class AC (exchange ratio 0.633251), Europe ex UK Equity class AD merged into Euroland Equity class AD (exchange ratio 0.620199),
� on 11 January 2008, Global ex Euroland Equity class AC merged into Global Equity class AC (exchange ratio 1.011697). Global ex Euroland Equity class AD merged into Global Equity class AD (exchange ratio 1.011993).
5) Impact of liquidity issues in the market during the period � The Management Company has performed an assessment of the liquidity issues and provided confirmation
that the recent volatility and reduced liquidity on some asset classes that has been witnessed in the financial markets during the second half of 2007 has not had a significant or unusual impact on the Company’s financial accounts during the year. No additional disclosures or adjustments to these financial statements were required.
1. Basis of presentation
The Company is incorporated under the laws of the Grand Duchy of Luxembourg as an investment(Société d’Investissement à Capital Variable or “SICAV”). The capital comprises various classesrelating to a separate portfolio (a “sub-fund”) consisting of securities, cash and other sundry asseaccompanying financial statements present the assets and liabilities of the individual sub-funds andtaken as a whole. The financial statements of each individual sub-fund are expressed in the cuthe prospectus for that particular sub-fund and the
company
States dollars (USD). The financial statements have been prepared in accordance with the formLuxembourg authorities for Luxembourg investment companies.
The Company is an officially registered invecertified as a UCITS fund under the directive
stment fund under part I of the law of 20 December
Certain sub-funds of the Company are authorised by the Hong KongSection 104 of the “Securities and Futures
In the prospectus and in thedfun consists of “HSBC Global Investment Funds” plus the
Since 1 April 2007, the Company has proceede
1) The opening of new sub-funds: � on 18 June 2007, Halbis Glob� on 30 July 2007, Global Emer� on 20 August 2007, Global Discount Certificates, � on 9 November 2007, Climate Change, � on 7 December 2007, Emerging Wealth, � on 17 December 2007, Russia Equity.
2) Change in name for the� on 16 April 2007, Euro Investment Grade Bond changed its name to Euro
Core Bond, on 16 April 2007, Euro Credit Bond changed its name to Euro Core Credit Bond,
� on 16 April 2007, Euro Corporate Bond changed its name to Euro Strategic Credit B� on 16 April 2007, Pan-European Government Bond changed its name to European
Government Bond, on 21 May 2007, Global Investment Grade Bond c
� on 21 May 2007, US Dollar Investment Grade Bond changed its� on 2 July 2007, Global Em� on 17 September 2007, US Dollar High Yield Bond changed its name to Global High� on 20 November 2007, Pan-European Equity changed its name to European Equity, � on 20 November 2007, Pan-European Equity High Dividend changed its name to Europ
Dividend,� on 25 February 2008, Euroland Value Creation changed its name to Euroland Growth
3) The liquidation of the following sub-fund: on 25 May 2007, Global Equity Technology
The merging of 4)� on 20 April 2007, Sterling Investment Gr
class WD (exchange rate 1.057104), Sterling Investment Grade Bond class EC merged Investment Grade Bond class EC (exchange rate 1), Sterling Investment Grade Bond claGlobal Investment Grade Bond class PD (exchange rate 1),
� on 19 October 2007, UK Freestyle class M1D merged into UK Equity class AD (exchange rate 0.492746),
HSBC Global Investment Funds 51
Notes to the Financial Statements (continued)�
�
The following accounting policies have been used consistently in dealing with items which are considered material in ny’s financial statements.
nting conventionThe financial statements have been prepared under the historical cost convention modified by the revaluation of
cial stock exchange on which such securities are traded. Securities traded
from one or more of their fair value, all pected they may be
resold as determined in good faith by or under the direction of the Directors.
not listed on any official stock exchange or traded on any other ill be valued in accordance with market practice. Shares or units in underlying open-ended shall be valued at their last available net asset value reduced by any applicable charges.
The Fund uses the amortized cost method of valuation in valuing its portfolio of financial instruments (such as rs, certificate of deposit, treasury bills,…)
y basis. Dividends are accounted for on an ex-dividend basis.
currency have been recorded at the rate of exchange ruling at the time of the transaction. The market value of the investments and
ilities in currencies other than the relevant reporting currency have been converted at the rates
Realised profit/(loss) on sale of investments is the difference between the historical average cost of the investment proceeds.
fund are exclusively whose claims have
, operation and liquidation of that sub-fund.
�
The Company has issued either A, E, I, J, L, M, P, R, S1, W, X Y, YP, Z and ZP Shares to investors in one or several sub-funds as detailed below.
Within each Share Class of a sub-fund, the Company is entitled to create different sub-classes distinguished by their distribution policy (Capital-Accumulation (C) and Distribution (D) Shares), their hedging activity (H) and/or by any other criterion to be stipulated by the Directors.
All share classes are available as both Capital Accumulation and Distribution shares. Shares in existence before 2 October 2000 have been designated Class A Shares and are available to all investors. On 25 November 2002, all shares in issue in class A of the subfunds European Equity, Hong Kong Equity, Japanese Equity, Singapore Equity, US Index, US Dollar Core Plus Bond and US Dollar Reserve were renamed Class P Shares.
2. Accounting Policies
relation to the Compa
a) Accou
investments.
b) Assets and portfolio securities valuation
The assets of each Class within each sub-fund are valued as at 31 March 2008.
In addition, portfolio securities and/or financial derivative instruments which are listed on an offiare valued at the last available price on the principal marketon other organised markets are valued at the last available price or yield equivalents obtaineddealers in such organised markets at the time of valuation. If such prices are not representative such securities and all other permitted assets will be valued at their fair value at which it is ex
The financial derivative instruments which areorganised market winvestment sub-funds
commercial pape
c) Income and Expenses
Interest is accrued on a day-to-da
d) Foreign Exchange
The cost of investments, income and expenses in currencies other than the fund relevant reporting
other assets and liabof exchange ruling at 31 March 2008.
e) Realised Profit/(Loss) on Sale of Investments
and the sale
f) Segregated Liability
The Company has segregated liability between its sub-funds; meaning, the assets of a sub-available to satisfy the rights of shareholders in relation to that sub-fund and the rights of creditorsarisen in connection with the creation
3. Share capital
,
HSBC Global Investment Funds 52
Notes to the Financial Statements (continued)�
� 3. Share capital (continued)
Description MinimumInitial Minimum nves Holding
s S USD 5,000
Cla s to e rel ant USD 5,000 USD 5,000
ected y the Share ill incur annual management fees equivalent to
that of the Class A Shares plus 0.3% to 0.5% per annum of the Net le to fi
C s ugh specific distributors selected by the USD USD 1,000,000 Distributor.
Cl n s USD 100,000 USD 100,000
Class L L Shares are available through specific distributors selected by the USD USD 1,000,000 stitutio vesto
02 Law.
Cla s USD 5,000 USD 5,000
Cla s risdict ns o USD 50,000 USD 50,000 rtain distributors selected by the Distributor.
s USD 5,000 incu
al fees between 0.3% to 0.5% of the Net Asset V ue o Class R Shares, which may be payable to specific distrib ors i
Cla rough certain USD 100,000 USD 100,000
arti e 12 of
t USD 100,000 BC Group as selected by e
Distributor provided that the investors qualify as institutional investors . No Op g,
xpenses will be charged to Class W Class w p id
d entities of the HSBC Group.
Class X X Shares are available through specific distributors selected by the USD 2,000,000 USD 2,000,000 Distributor provided that the investors qualify as institutional investors within the meaning of article 129 of the 2002 Law.
Class Y Y Shares are available in certain jurisdictions through specific USD 1,000 USD 1,000
distributors appointed by the Distributor.
Class YP YP Shares are available in certain jurisdictions through specific USD 1,000 USD 1,000 distributors appointed by the Distributor.
4����
I tment
Clas A A Shares are available to all investors. U D 5,000
ts E E Shares will be available in certain countries, subjec th ev regulatory approval, through specific distributors sel b Distributor. E Shares w
Asset Value of Class E Shares, which may be payab speci c distributors in certain countries.
la s I I Shares are available thro 1,000,000
ass J J Shares are available for investment by fund of fund ra ge managed by the HSBC Group only.
1,000,000 Distributor, provided that the investors qualify as in nal in rs within the meaning of article 129 of the 20
s M M Shares are available to all investors
s P P Shares are available for subscription in certain ju io r through ce
Clas R R Shares are available in certain jurisdictions, through specific USD 5,000 distributors selected by the Distributor. R Shares will r addition al f
ut n certain countries.
ss S1 S1 Shares are available in certain jurisdictions or th distributors selected by the Distributor provided that the investors qualify as institutional investors within the meaning of cl 9 the 2002 Law.
USDClass W W Shares are available through specific distributors tha will also be 100,000 members or affiliated entities of the HS th
within the meaning of article 129 of the 2002 Law eratin Administrative and Servicing E Shares. All the fees and charges allocated to this ill be a directly by members or affiliate
HSBC Global Investment Funds 53
Notes to the Financial Statements (continued)�
� 3. Share capital (continued)
Cl s nto a USD USD 1,000,000 SBC Gro p ent
ected by the Distributor provided that such investors qualify as insitutional
02 La
Class red into a USD USD 1,000,000 HSBC Gro p ent
The Board of Directors of the Company has authority to issue different Classes of Shares in the one or several sub-funds will be Prospectus will be
The subscription proceeds of all Shares in a sub-fund are invested in one common underlying portfolio privileges. Each Share is, upon issue,
relevant Class of the sub-fund to which it relates on liquidation and lared for such sub-fund. The Shares will carry no preferential or pre-
The Share Classes issued in the different sub-funds are designated by their class name, followed by their stics and, if applicable, their specific hedging policy. This means that for example Shares
issued in Class A which are distributing income and applying a hedging policy, as defined above, would be s I Shares accumulating income would be identified as IC.
to as J1, J2,
�
, E, I, J, L, M,
mpany is entitled, in respect of each Class of Shares, to a management fee to cover all agement, investment advisory and distribution services provided in relation to the relevant class (see
2. “Management Fee” below).
istrative and tions in a sub-fund’s operating, administrative
ed with the Management Company that the fee charged to cover nses is fixed at an annual rate. The excess of such expenses
“Operating, Administrative and Servicing Expenses” below).
2. Management Fee
The Company pays to the Management Company an annual management fee calculated as a percentage of the Net Asset Value of each sub-fund or Share Class (“Management Fee”). The Management Fee is accrued daily and payable monthly in arrears at the rates specified in the table page 77.
The maximum rate for Class E, I, J, L and M Shares is 3.5%.
The maximum rate for Class A, P, R, S1, X, Y, YP, Z and ZP Shares is as stated in the Prospectus.
No Management Fee is currently charged for Class W Shares.
as Z Z Shares are available to investors having entered i 1,000,000 discretionary management agreement with an H u ity and to investors subscribing via distributors sel
investors within the meaning of article 129 of the 20 w.
ZP ZP Shares are available to investors having ente 1,000,000discretionary management agreement with an u ity and to investors subscribing via distributors selected by the Distributor provided that such investors qualify as institutional investors within the meaning of article 129 of the 2002 Law.
sub- funds. Details of the characteristics of such Share Classes offered by one or severaldetermined by the Board of Directors. In case of the creation of additional Classes of Shares, theupdated.
of investments. All Shares of the same Class have equal rights andentitled to participate equally in assets of thein dividends and other distributions as decemptive rights and each whole Share will be entitled to one vote at all meetings of Shareholders.
The minimum initial investment amount may be reduced at the discretion of the Company.
Share Class Denominations and Successive Classes :
distribution characteri
identified as ADH whereas Clas
in a given sub-fund are numbered 1,2,3… and will be referred Successive Classes J,L,M,R,YP, and ZP J3, (…), L1, L2, L3 (…) etc.
4. Charges and Expenses
1. Explanation of the Charging Structure
Investment in the Company is generally offered via charging structures, as represented by the AP, R, S1, W, X, Y, YP, Z and ZP Classes of Shares.
The Management Coinvestment man
In addition, the Company pays to the Management Company a fee to cover operating adminservicing expenses. To preserve Shareholders from fluctuaand servicing expenses, the Company has agresuch operating, administrative and servicing expeabove such annual rate will be borne directly by the Management Company (see 4.
HSBC Global Investment Funds 54
Notes to the Financial Statements (continued)�
�������� 4. Charges and Expenses (continued)
relevant sub-fund Distributors. The
arging, out of such fee, the fees of the Investment Advisers and the Share Distributors and may pay part of such fee to recognised intermediaries or such other person as
ent Company may instruct the Company to pay a portion of the Management Fee directly out of the assets of the Company to any of such service providers.
YP Shares, the s after the end of
case of Global e relevant Class of uding the effect of
demptions) and the simple daily equivalent of the percentage defined below for the relevant per Share of the
e first issue of the e relevant Class of the relevant Class
ee accruals from the beginning of the twelve months period will be included in the the relevant Class ce Fee accrual will
a minimum level of on the previous day
Net Asset Value
e Fee accrual will Asset Value per
share of the relevant Class of Shares will be reset to zero and the Net Asset Value per Share on that day will be of significant new
nt Class of Shares, followed by a period of negative performance, in the cumulative
Fee accrual. Also, if the Net Asset Value per Share is rising but is still below the Low Tide Mark, the Management
Performance Fee accruals on any relevant Class of Shares of the sub-fund,
20 November 2007 in its addendum dated 20 November 2007.
If there is a positive balance of the Performance Fee accrual, it will become payable to the Management Company.
4. Operating, Administrative and Servicing fees
The Company pays to the Management Company a fee to cover certain Operating, Administrative and Servicing Expenses. The Management Company is responsible for discharging out of this fee, the expenses described below, inter alia, payable to the Custodian, the Administration Agent, the Registrar and the Transfer Agent.
The Management Fee covers management and distribution services provided in relation to theof the Company by the Management Company, the Investment Advisers and the ShareManagement Company is responsible for disch
the Management Company may determine, at its discretion.
The Managem
3. Performance Fee
For sub-funds issuing Classes J Shares, L Shares, M Shares, R Shares, XP Shares andManagement Company is also entitled to a Performance Fee, payable annually in arreareach twelve month period.
Each Dealing Day, the Performance Fee accrual will be calculated as 20% (10% in theEquity Freestyle) of the difference between the change in the Net Asset Value per share of ththe sub- fund since the previous Dealing Day (net of all other fees and expenses and exclsubscriptions and resub-funds (hereafter the "Percentage") provided that on such Dealing Day the Net Asset Valuerelevant Class of the sub- fund is higher than the Low Tide Mark (as defined below). On threlevant Class of Shares in a sub- fund, the Low Tide Mark will equal the initial offer price of thShares of the sub-fund. The Low Tide Mark will not be set at a level below the initial offer price ofof Shares of the sub-fund.
The cumulative Performance Fcalculation of the Net Asset Value per Share. In the event of any change in the Net Asset Value ofof the sub-fund being less than the simple daily equivalent of the Percentage, the daily Performanbe negative and will reduce the cumulative Performance Fee accrual until the accrual reacheszero. If the cumulative Performance Fee accrual reaches zero, the Net Asset Value per Share will be set as the ‘Low Tide Mark’. No further daily Performance Fee accruals will be made until theper Share exceeds the Low Tide Mark.
At the end of the twelve months period the positive balance (if any) of the Performancbecome payable to the Management Company and the Performance Fee accrual in the Net
set as the Low Tide Mark. When there is a positive Performance Fee accrual during a period subscriptions into a sub-fund with the relevaall Shareholders will participate (in proportion with their Shareholding) in the reduction
ance Fee accrual, regardless of their actual contribution to the cumulative PerformancePerform
Company will not benefit from anyincluding Shares that are newly issued and which only experience positive performance.
The detailed Performance Fee information can be found in the Fund prospectus dated and
HSBC Global Investment Funds 55
Notes to the Financial Statements (continued)�
�������� 4. Charges and Expenses (continued)
relevant sub-fund in the prospectus. Such fee is accrued daily and payable monthly in arrears at the rates specified
e fees and charges
0%. However, the l of the Operating, Administrative and Servicing
es, the concerned ee months notice,
Operating, Administrative and Servicing Expenses cover the ongoing custody fees and safekeeping charges services
s for registrar and
ation of new sub-ies (see below); the Luxembourg asset-based taxe d’abonnement, at the rate
referred to under “Taxation” below; attendance fees and reasonable out-of-pocket expenses incurred by the and other expenses; ongoing registration and listing fees,
including translation expenses; the costs and expenses of preparing, printing, and distributing the Company’s e directly or
ntermediaries to its shareholders.
�
from the sale of investments.
securities and financial ions, interest or taxes payable, and other transaction related nted for on a cash basis and are paid when incurred or invoiced from
ss each sub-fund’s
s and the full amount ts assets.
� 6. Indian Equity and Global Emerging Markets Equity
al Investment Funds Mauritius Limited cated at 10, Frère nd’s investments in
s No. 2 manages the Global Emerging Markets Equity sub-fund’s investments in India.
Indian Equity sub-
HSBC Mauritius No. 2 is a company incorporated in Mauritius on 21 November 2007. The accounts of the Global Emerging Markets Equity sub- fund and the HSBC Mauritius No. 2 have been consolidated.
Both subsidiaries have appointed Multi Consult Limited, 10 Frère Félix de Valois Street, Port Louis, Mauritius, to provide administrative services to the Subsidiary in Mauritius, including maintenance of its accounts, books and records.
Both subsidiaries have appointed KPMG Mauritius located at KPMG Centre, 30 St George Street, Port Louis, Mauritius, as auditors of the Subsidiary in Mauritius to perform the auditor's duties required by Mauritius law.
This fee is seor class specified
t, for each sub-fund and/or class, at a fixed percentage of the Net Asset Value of the
in the table below.
No Operating, Administrative and Services Expenses will be charged to class W Shares. All thallocated to such Class of Share will be paid directly by a member or an affiliated entity of HSBC Group.
The maximum rate for class A, E, I, J, L, M, P, R, S1, X, Y, YP, Z and ZP Shares is: 1.Board of Directors reserves the right to amend the fixed leveExpenses applicable to each Class of Share. In the event of an increase in such expensShareholders will be given at least three months prior notice of such increase. During this thrsuch Shareholders may request the redemption of their shares, free of charge.
payable to the Custodian and its correspondent banks, fees for fund accounting and administration(including domiciliary services) payable to the Administrative Agent and transfer agency feetransfer agency services payable to the Transfer Agent.
Operating, Administrative and Servicing Expenses also cover expenses relating to the crefunds; the costs of the Subsidiar
Company’s Directors; legal, auditing fees
prospectus, simplified prospectuses, financial reports, statements and other documents made availablthrough i
5. Transaction expenses and extraordinary expenses
The transaction expenses linked to security dealing are written off against the realised profit/loss
Each sub-fund bears the costs and expenses of buying and selling portfolioinstruments, brokerage fees and commissexpenses. These transaction fees are accouthe net assets of the sub-fund to which they are attributable. Transaction fees are allocated acroShare Classes.
The Company bears any extraordinary expenses including, without limitation, litigation expenseof any tax, levy, duty or similar charge and any unforeseen charges imposed on the Company or i
The Company wholly owns subsidiaries in Mauritius, namely HSBC Glob(“HSBC Mauritius”) and HSBC GIF Mauritius No. 2 Limited (“HSBC Mauritius No. 2”), both loFélix de Valois Street, Port Louis, Mauritius. HSBC Mauritius manages the Indian Equity sub- fuIndia, and HSBC Mauritiu
HSBC Mauritius is a company incorporated in Mauritius on 3 October 1995. The accounts of thefund and the HSBC Mauritius have been consolidated.
HSBC Global Investment Funds 56
Notes to the Financial Statements (continued)�
�
practice currently in force Grand Duchy of Luxembourg and in other jurisdictions and is subject to changes therein.
e tax on foreign al tax of 0.08% is
s placed in Belgium through Belgian financial calculate the tax
are small, the Management Company has paid this tax cost on behalf of the mpany out of the Operating, Administrative and Servicing Expenses it receives. However, should the cost
to bear
vailable n treaty, which became effective on 1 July 1983. The Subsidiary
mpany iary of stocks on the
o benefit from the
cheduled banks is ase of stocks and securities is exempt from Indian sales tax.
provided that the ontrol in India. No
e given or should be assumed that the tax benefits of the treaty will continue to ble to the Indian Equity sub-fund in future periods due to, among others, changes in the regulatory
fits to companies n 7 October 2003
wever, liable in e quarterly on the arter. The tax rate s and Classes J -funds. No stamp
s 0.01% tax if they comply with the requirements of the Luxembourg law of 19 December 2003 which are the following: (i) the Shares of the Class/sub-fund must be
ed to institutional investors in the meaning of article 129 of the 2002 Law; (ii) the exclusive object of /or deposits with
st be less than 90 ed rating agency.
xembourg tax is payable on the realised or unrealised capital appreciation of the assets of the Company.
The Company paid a tax of EUR 1.239,46 on its incorporation.
Mauritius
The Subsidiary is registered with the Mauritius Offshore Business Activities Authority as an offshore company. As a result it is subject to a reduced rate of Mauritian income tax on its income. In addition, no Mauritian capital gains tax will be payable in respect of the Subsidiary investments in India and any dividends and redemption proceeds paid by the Subsidiary to the Indian Equity sub-fund will be exempt from Mauritian
7. Taxation of the company
The following summary is based on the Company's understanding of the law andin the
Belgium
The Belgian government has enacted a law which charges an annual net asset valuinvestment funds registered with the Belgian Banking and Finance Commission. An annucharged on the net outstanding amounts of sub-fundintermediaries, or where that figure is not substantially documented, the tax authorities mayon the total assets of those sub-funds.
To date as the amounts Cobecome substantial or long term the Management Company may require the sub-funds concerned that tax charge for future periods.
India
On the basis that it is a Mauritian tax resident, the Subsidiary will benefit from the tax advantages ato it under the India-Mauritius double taxatiowill file, through its Custodian, a declaration of Mauritian residency with the registrar of each Indian coin which it invests. Capital gains resulting from the purchase and sale by the SubsidIndian stock exchanges will be exempt from tax on the basis that the Subsidiary is able tprovisions of the India-Mauritius double taxation treaty.
Interest on certain notified securities and bonds and on deposits in foreign currency with sexempt from income tax. The sale and purch
The above-stated tax treatment under the India-Mauritius tax treaty will be available Subsidiary does not have a permanent establishment or its effective management and cguarantee or warranty can bbe availaenvironment in Mauritius, India or the European Union.
The Indian Central Board of Direct Taxes has confirmed the availability of the treaty beneholding a certificate of Mauritian tax residence. The Supreme Court of India confirmed othe validity of this position.
Luxembourg
The Company is not liable to any Luxembourg tax on profits or income. The Company is, hoLuxembourg to a tax of 0.05% per annum of its net asset value, such tax being payablbasis of the value of the net assets of the Company at the end of the relevant calendar quis reduced to 0.01% per annum for the US Dollar Reserve and Euro Reserve sub-fundShare, L Share, S1 Share, W Share, X Share, Z Share and ZP Share in the relevant subduty or other tax is payable in Luxembourg on the issue of Shares.
The Classes/sub-funds may be exempted from thi
reservthe Class/sub-fund's portfolio must be the investment in money market instruments andcredit institutions; (iii) the remaining average maturity of the Class/sub-fund's portfolio mudays and (iv) the Class/sub-fund must benefit from the highest possible rating of a recognis
No Lu
HSBC Global Investment Funds 57
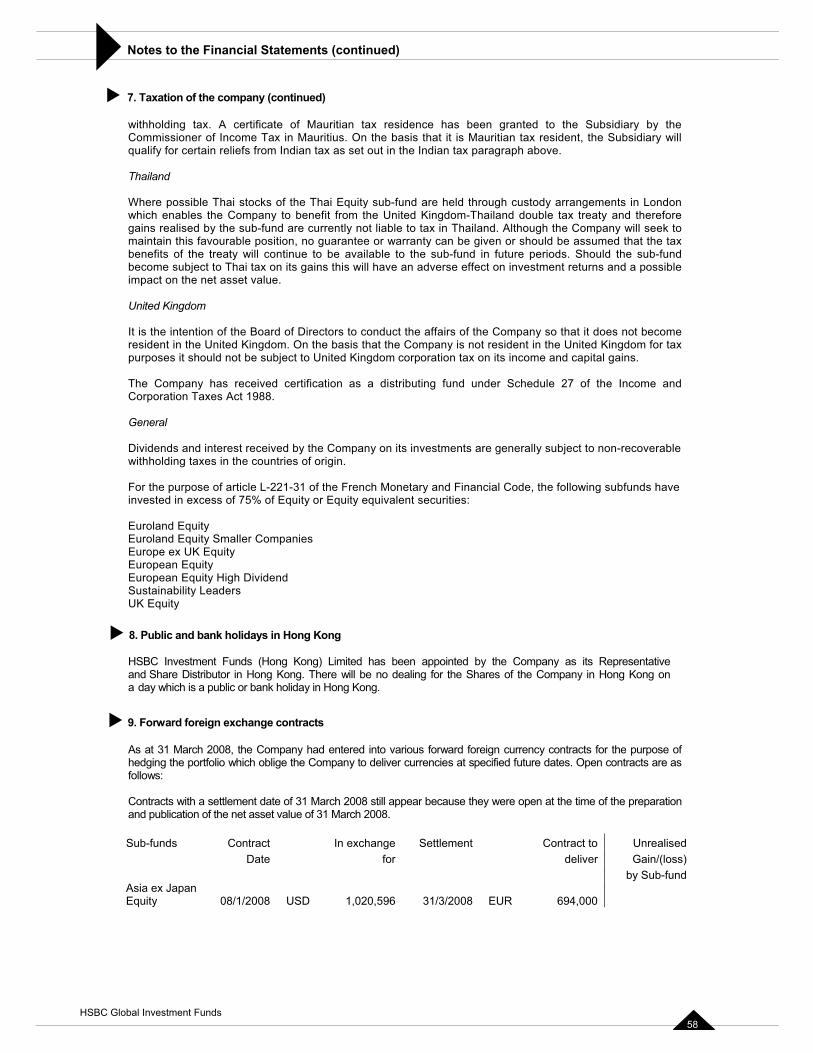
Notes to the Financial Statements (continued)�
�
y the Commissioner of Income Tax in Mauritius. On the basis that it is Mauritian tax resident, the Subsidiary will
y for certain reliefs from Indian tax as set out in the Indian tax paragraph above.
ements in London aty and therefore pany will seek to
position, no guarantee or warranty can be given or should be assumed that the tax the treaty will continue to be available to the sub-fund in future periods. Should the sub-fund
ct to Thai tax on its gains this will have an adverse effect on investment returns and a possible
t become m. On the basis that the Company is not resident in the United Kingdom for tax
oses it should not be subject to United Kingdom corporation tax on its income and capital gains.
f the Income and
the Company on its investments are generally subject to non-recoverable tries of origin.
L-221-31 of the French Monetary and Financial Code, the following subfunds have s of 75% of Equity or Equity equivalent securities:
Euroland Equity ies
Sustainability Leaders
�
C Investment Funds (Hong Kong) Limited has been appointed by the Company as its Representative n Hong Kong on
9. Forward foreig hang contracts
2008, the Company had entered into various forward foreign currency contracts for the purpose of ging the p i ge th y t s at s uture dates. Open contracts are as
follows:
Contracts with a settlement date of 31 March 2008 still appear because they were open at the time of the preparation and publication of the net asset value of 31 March 2008.
Sub-funds Contract In exchange Settlement Contract to Unrealised
7. Taxation of the company (continued)
withholding tax. A certificate of Mauritian tax residence has been granted to the Subsidiary b
qualif
Thailand
Where possible Thai stocks of the Thai Equity sub-fund are held through custody arrangwhich enables the Company to benefit from the United Kingdom-Thailand double tax tregains realised by the sub-fund are currently not liable to tax in Thailand. Although the Commaintain this favourablebenefits of become subjeimpact on the net asset value.
United Kingdom
It is the intention of the Board of Directors to conduct the affairs of the Company so that it does noresident in the United Kingdopurp
The Company has received certification as a distributing fund under Schedule 27 oCorporation Taxes Act 1988.
General
Dividends and interest received bys in the counwithholding taxe
For the purpose of articleinvested in exces
Euroland Equity Smaller CompanEurope ex UK Equity European Equity European Equity High Dividend
UK Equity
8. Public and bank holidays in Hong Kong
HSBand Share Distributor in Hong Kong. There will be no dealing for the Shares of the Company ia day which is a public or bank holiday in Hong Kong.
� n exc e
As at 31 Marchhed ortfolio wh ch obli e Compan o deliver currencie pecified f
Date for deliver Gain/(loss) by Sub-fund
Asia ex Japan Equity 08/1/2008 USD 1,020,596 31/3/2008 EUR 694,000
HSBC Global Investment Funds 58
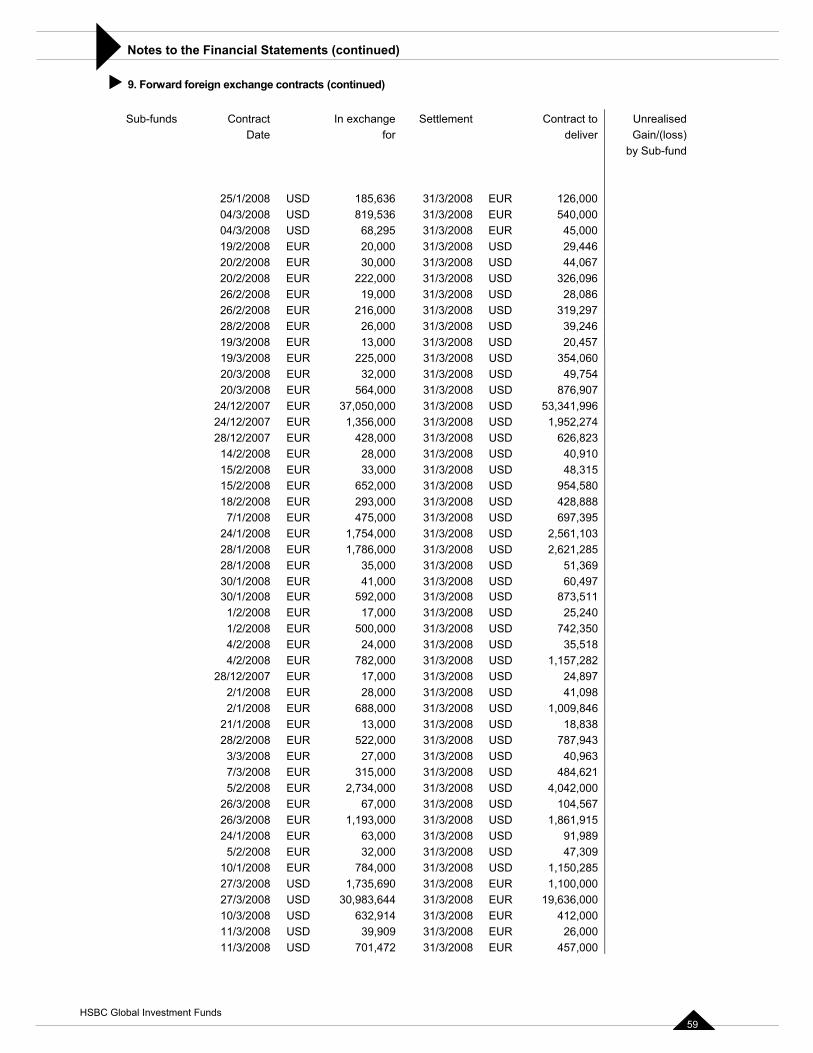
Notes to the Financial Statements (continued)�
9. Forward foreign exchange contracts (continued)
Sub-funds Contract exchange Set ment Unrealised
�
In tle Contract to Date for Gain/(loss) deliver
by Sub-fund
/ USD 1 /2008 EUR 126,0 0 25/1 2008 85,636 31/3 0 / USD 8 /2008 EUR 540,0 0 04/3 2008 19,536 31/3 0 / US /2008 EUR 45,0 0 04/3 2008 D 68,295 31/3 0 / EUR /2008 USD 29,4 6 19/2 2008 20,000 31/3 4 / EU /2008 USD 44,0 7 20/2 2008 R 30,000 31/3 6 / EUR 2 /2008 USD 326,0 6 20/2 2008 22,000 31/3 9 / EUR /2008 USD 28,0 6 26/2 2008 19,000 31/3 8 / EUR 2 /2008 USD 319,2 26/2 2008 16,000 31/3 97 / EU /2008 USD 39,228/2 2008 R 26,000 31/3 46 / E /20 20,419/3 2008 UR 13,000 31/3 08 USD 57 / E 2 /2008 USD 354,0 0 19/3 2008 UR 25,000 31/3 6 / EU /2008 USD 49,7 4 20/3 2008 R 32,000 31/3 5 / EUR 5 /2008 USD 876,9 7 20/3 2008 64,000 31/3 0 / EU 7,0 /2008 USD 53,341,9 6 24/12 2007 R 3 50,000 31/3 9 / EU 1,3 /2008 USD 1,952,2 4 24/12 2007 R 56,000 31/3 7 / EU 4 /2008 USD 626,8 3 28/12 2007 R 28,000 31/3 2 / E /2008 USD 40,9 0 14/2 2008 UR 28,000 31/3 1 / E /2008 USD 48,3 5 15/2 2008 UR 33,000 31/3 1 / EUR 6 /2008 USD 954,5 0 15/2 2008 52,000 31/3 8 / EU 2 /2008 USD 428,8 8 18/2 2008 R 93,000 31/3 8 / EUR 4 /2008 USD 697,3 5 7/1 2008 75,000 31/3 9 / EU 1,7 /2008 USD 2,561,1 3 24/1 2008 R 54,000 31/3 0 / EUR 1,7 /2008 USD 2,621,2 5 28/1 2008 86,000 31/3 8 / EUR /2008 USD 51,3 9 28/1 2008 35,000 31/3 6 / EUR /2008 USD 60,4 7 30/1 2008 41,000 31/3 9 / EU 5 /2008 USD 873,5 1 30/1 2008 R 92,000 31/3 1 / EUR /2008 USD 25,2 0 1/2 2008 17,000 31/3 4 / EU 5 /2008 USD 742,3 0 1/2 2008 R 00,000 31/3 5 / EUR /2008 USD 35,5 8 4/2 2008 24,000 31/3 1 / E 7 /2008 USD 1,157,2 2 4/2 2008 UR 82,000 31/3 8 / EU /2008 USD 24,8 7 28/12 2007 R 17,000 31/3 9 / E /2008 USD 41,0 8 2/1 2008 UR 28,000 31/3 9 / EUR 6 /2008 USD 1,009,8 6 2/1 2008 88,000 31/3 4 / EUR /2008 USD 18,8 8 21/1 2008 13,000 31/3 3 / EU 5 /2008 USD 787,9 3 28/2 2008 R 22,000 31/3 4 / E /20 40,9 3 3/3 2008 UR 27,000 31/3 08 USD 6 / EU 3 /2008 USD 484,6 1 7/3 2008 R 15,000 31/3 2 / EUR 2,7 /2008 USD 4,042,0 0 5/2 2008 34,000 31/3 0 / EU /2008 USD 104,5 7 26/3 2008 R 67,000 31/3 6 26/3/2008 EUR 1,193,000 31/3/2008 USD 1,861,915 24/1/2008 EUR 63,000 31/3/2008 USD 91,989 5/2/2008 EUR 32,000 31/3/2008 USD 47,309 10/1/2008 EUR 784,000 31/3/2008 USD 1,150,285 27/3/2008 USD 1,735,690 31/3/2008 EUR 1,100,000 27/3/2008 USD 30,983,644 31/3/2008 EUR 19,636,000 10/3/2008 USD 632,914 31/3/2008 EUR 412,000 11/3/2008 USD 39,909 31/3/2008 EUR 26,000 11/3/2008 USD 701,472 31/3/2008 EUR 457,000
HSBC Global Investment Funds 59
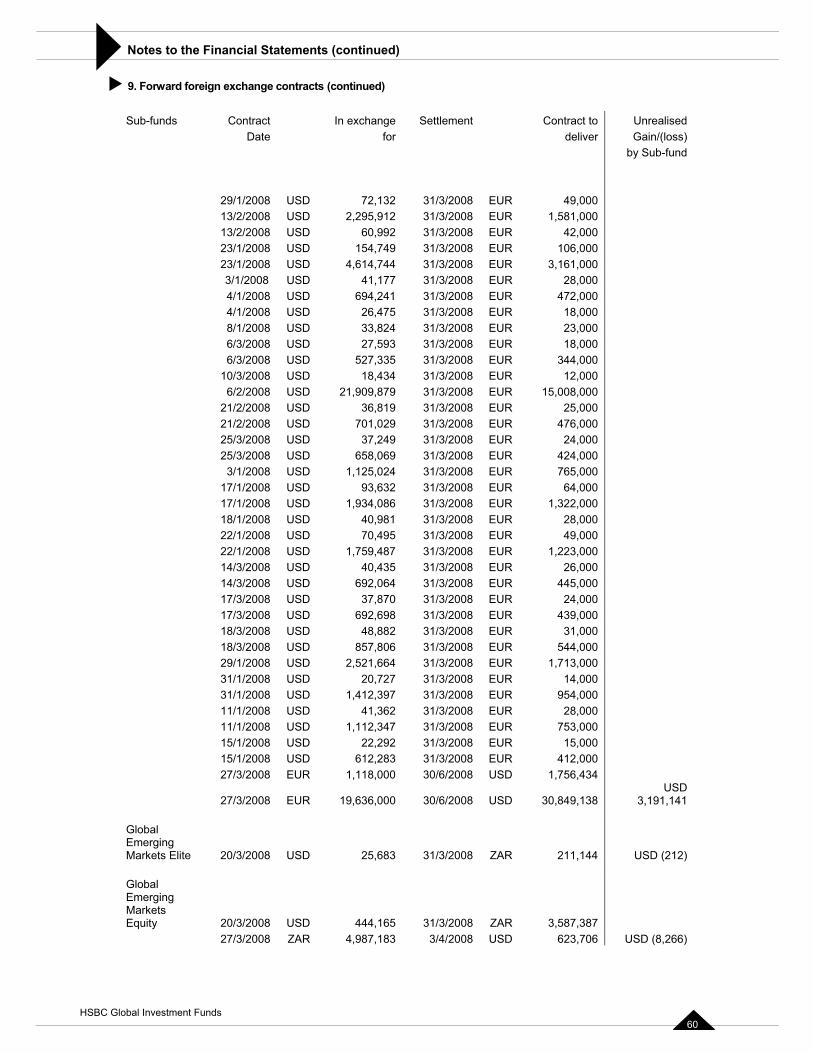
Notes to the Financial Statements (continued)�
� 9. Forward foreign exchange contracts (continued)
Sub-funds Contract exchange Set ment Unrealised In tle Contract to Date for Gain/(loss) deliver
by Sub-fund
/ USD /2008 EUR 49,0 0 29/1 2008 72,132 31/3 0 / U 2,2 /2008 EUR 1,581,0 0 13/2 2008 SD 95,912 31/3 0 / US /2008 EUR 42,0 0 13/2 2008 D 60,992 31/3 0 / US 1 /2008 EUR 106,0 0 23/1 2008 D 54,749 31/3 0 / USD 4,6 /2008 EUR 3,161,0 0 23/1 2008 14,744 31/3 0
/ USD /2008 28,0 0 3/1 2008 41,177 31/3 EUR 0 / USD 6 /2008 EUR 472,0 0 4/1 2008 94,241 31/3 0 / USD /2008 EUR 18,0 0 4/1 2008 26,475 31/3 0 / U /20 23,0 0 8/1 2008 SD 33,824 31/3 08 EUR 0 / USD /2008 EUR 18,0 0 6/3 2008 27,593 31/3 0 / US 5 /2008 EUR 344,0 0 6/3 2008 D 27,335 31/3 0 / USD /2008 EUR 12,0 0 10/3 2008 18,434 31/3 0 / US 1,9 /2008 EUR 15,008,0 0 6/2 2008 D 2 09,879 31/3 0 / US /2008 EUR 25,0 0 21/2 2008 D 36,819 31/3 0 / U 7 /2008 EUR 476,0 0 21/2 2008 SD 01,029 31/3 0 / USD /2008 EUR 24,0 0 25/3 2008 37,249 31/3 0 / USD 6 /2008 EUR 424,0 0 25/3 2008 58,069 31/3 0 / U 1,1 /2008 EUR 765,0 0 3/1 2008 SD 25,024 31/3 0 / US /2008 EUR 64,0 0 17/1 2008 D 93,632 31/3 0 / USD 1,9 /2008 EUR 1,322,0 0 17/1 2008 34,086 31/3 0 / US /2008 EUR 28,0 0 18/1 2008 D 40,981 31/3 0 / USD /2008 EUR 49,0 0 22/1 2008 70,495 31/3 0 / US 1,7 /2008 EUR 1,223,0 0 22/1 2008 D 59,487 31/3 0 / U /2008 EUR 26,0 0 14/3 2008 SD 40,435 31/3 0 / U 6 /2008 EUR 445,0 0 14/3 2008 SD 92,064 31/3 0 / USD /2008 EUR 24,0 0 17/3 2008 37,870 31/3 0 / U 6 /2008 EUR 439,0 0 17/3 2008 SD 92,698 31/3 0 / USD /2008 EUR 31,0 0 18/3 2008 48,882 31/3 0 / US 8 /2008 EUR 544,0 0 18/3 2008 D 57,806 31/3 0 29/1/20 USD 2,521,6 08 EUR 1,7 0 08 64 31/3/20 13,00 / U /2031/1 2008 SD 20,727 31/3 08 EUR 14,000
31 /2008 USD 1,412,397 31/3/2008 EUR 954,0 0 /1 011/1/2008 USD 41,362 31/3/2008 EUR 28,000 11/1/ USD 1,1 /2008 EUR 02008 12,347 31/3 753,0015 /2008 USD 22,292 31/3/2008 EUR 15,0 0 /1 015/1/2008 USD 612,283 31/3/2008 EUR 412,000 27/3/ EU 1,1 /2008 USD 1,756,4 4 2008 R 18,000 30/6 3
/ E 9,63 /2008 USD 8USD
3,191,141 27/3 2008 UR 1 6,000 30/6 30,849,13
Global Emerging Markets Elite 20/3/2008 USD 25,683 31/3/2008 ZAR 211,144 USD (212)
Global Emerging MarketsEquity 20/3/2008 USD 444,165 31/3/2008 ZAR 3,587,387 27/3/2008 ZAR 4,987,183 3/4/2008 USD 623,706 USD (8,266)
HSBC Global Investment Funds 60
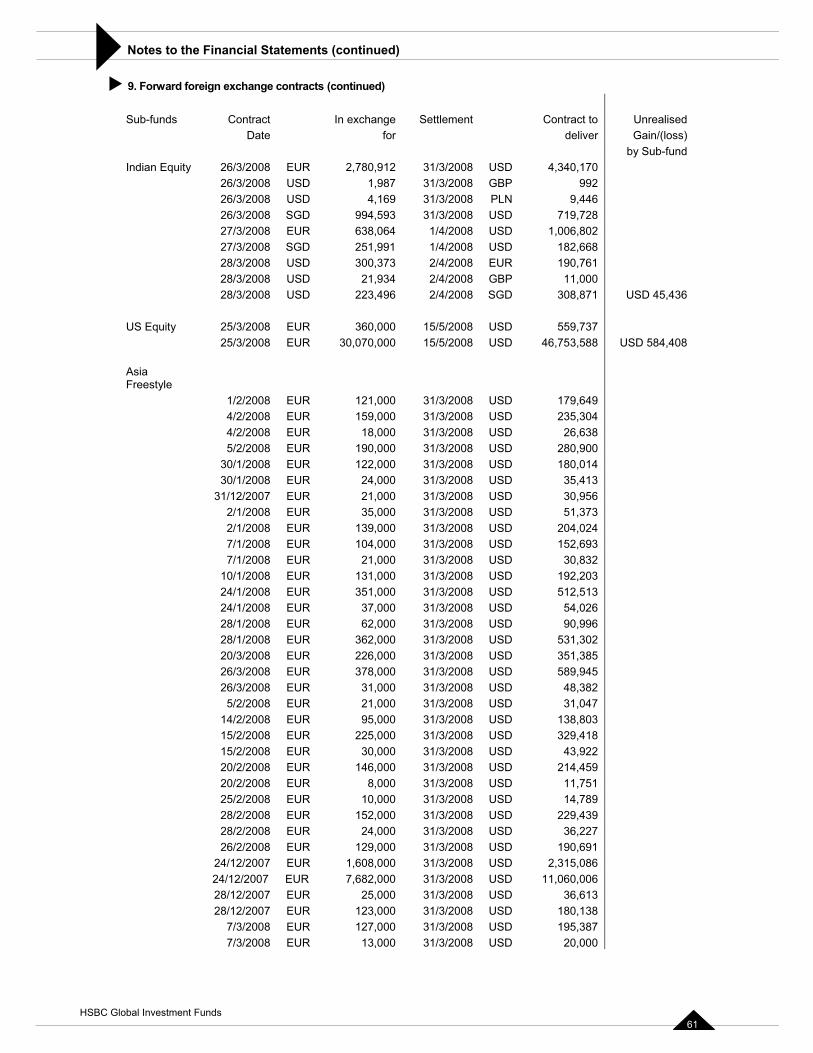
Notes to the Financial Statements (continued)�
9. Forward foreign exchang contracts (continued)� e
Sub-funds Contract exchange Set ment Unrealised In tle Contract to Date for deliver Gain/(loss)
by Sub-fund Indian Equity / EUR 2,7 /2008 4,340,1 0 26/3 2008 80,912 31/3 USD 7 / US /2008 GBP 992 26/3 2008 D 1,987 31/3 / US /2008 PLN 9,446 26/3 2008 D 4,169 31/3 / SG 99 /2008 USD 719,7 8 26/3 2008 D 4,593 31/3 2 / EUR 63 /2008 USD 1,006,8 2 27/3 2008 8,064 1/4 0 / SG 25 /2008 USD 27/3 2008 D 1,991 1/4 182,668 28/3/2008 USD 300,373 2/4/2008 EUR 190,7 1 6
28/3/ US /2008 GBP 11,0 0 2008 D 21,934 2/4 0 / U 2 /20 USD 45,436 28/3 2008 SD 23,496 2/4 08 SGD 308,871
US Equity 25/3/200 EUR 360,000 15/5/2008 USD 559,7 7 8 3 / EU 0,0 /2008 46,753,5 8 USD 584,408 25/3 2008 R 3 70,000 15/5 USD 8
AsiaFreestyle / EUR 1 /2008 USD 179,6 9 1/2 2008 21,000 31/3 4 / EUR 1 /2008 USD 235,3 4 4/2 2008 59,000 31/3 0 / EUR /2008 USD 26,6 8 4/2 2008 18,000 31/3 3 / EU 1 /2008 USD 280,9 0 5/2 2008 R 90,000 31/3 0 / EU 1 /2008 USD 180,0 4 30/1 2008 R 22,000 31/3 1 / EU /2008 USD 35,4 3 30/1 2008 R 24,000 31/3 1 / EU /2008 USD 30,9 6 31/12 2007 R 21,000 31/3 5 / EUR /2008 USD 51,3 3 2/1 2008 35,000 31/3 7 / EUR 1 /2008 USD 204,0 4 2/1 2008 39,000 31/3 2 / EU 1 /2008 USD 152,6 3 7/1 2008 R 04,000 31/3 9 / EU /2008 USD 30,8 2 7/1 2008 R 21,000 31/3 3 / EUR 1 /2008 USD 192,2 3 10/1 2008 31,000 31/3 0 / EUR 3 /2008 USD 512,5 3 24/1 2008 51,000 31/3 1 / EUR /2008 USD 54,0 6 24/1 2008 37,000 31/3 2 / EU /2008 USD 90,9 6 28/1 2008 R 62,000 31/3 9 / EUR 3 /2008 USD 531,3 2 28/1 2008 62,000 31/3 0 / EU 2 /2008 USD 351,3 5 20/3 2008 R 26,000 31/3 8 / EUR 3 /2008 USD 589,9 5 26/3 2008 78,000 31/3 4 / EU /2008 USD 48,3 2 26/3 2008 R 31,000 31/3 8 / EUR /2008 USD 31,0 7 5/2 2008 21,000 31/3 4 / EU /2008 USD 138,8 3 14/2 2008 R 95,000 31/3 0 / E 2 /2008 USD 329,4 8 15/2 2008 UR 25,000 31/3 1 / EU /2008 USD 43,9 2 15/2 2008 R 30,000 31/3 2 / EU 1 /2008 USD 214,4 9 20/2 2008 R 46,000 31/3 5 / EU /2008 USD 11,7 1 20/2 2008 R 8,000 31/3 5 / EUR /2008 USD 14,7 9 25/2 2008 10,000 31/3 8 28/2/2008 EUR 152,000 31/3/2008 USD 229,439 28/2/2008 EUR 24,000 31/3/2008 USD 36,227 26/2/2008 EUR 129,000 31/3/2008 USD 190,691 24/12/2007 EUR 1,608,000 31/3/2008 USD 2,315,086 24/12/2007 EUR 7,682,000 31/3/2008 USD 11,060,006 28/12/2007 EUR 25,000 31/3/2008 USD 36,613 28/12/2007 EUR 123,000 31/3/2008 USD 180,138 7/3/2008 EUR 127,000 31/3/2008 USD 195,387
7/3/2008 EUR 13,000 31/3/2008 USD 20,000
HSBC Global Investment Funds 61
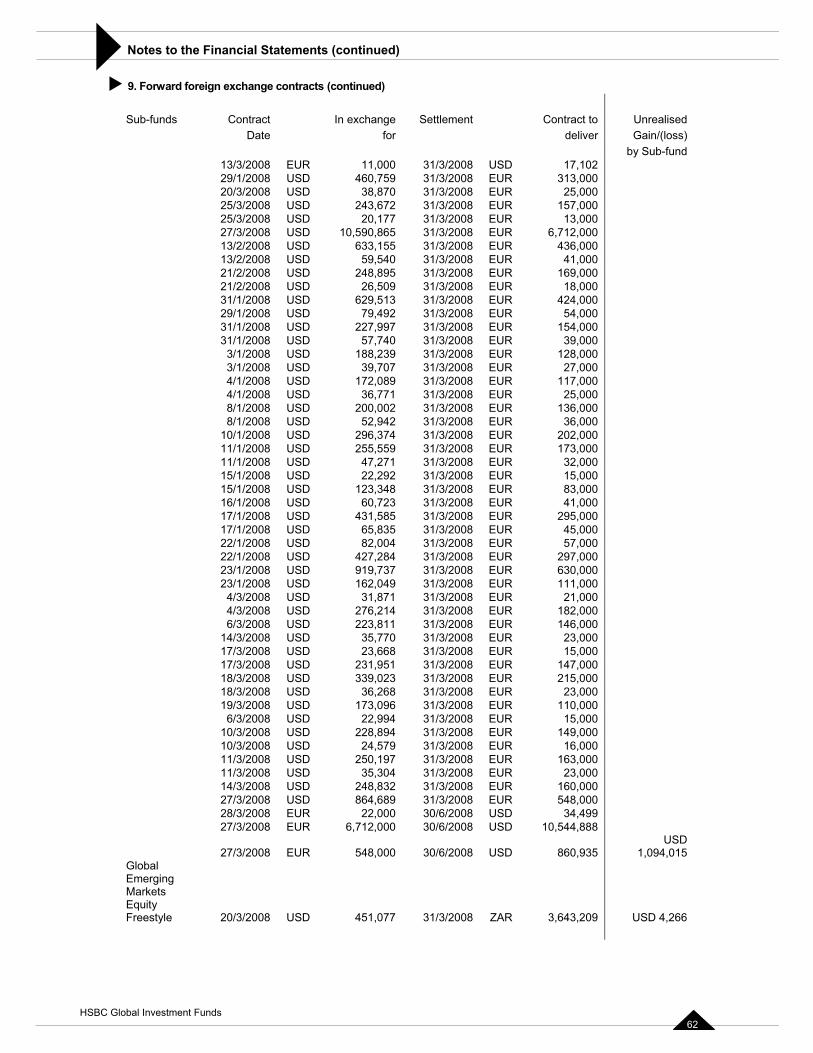
Notes to the Financial Statements (continued)�
9. Forward foreign exchang contracts (continued)� e
Sub-funds Contract exchange Set ment Unrealised In tle Contract to Gain/(loss) Date for deliver
by Sub-fund / EUR /2008 USD 17,1 2 13/3 2008 11,000 31/3 0
29/1/ US 4 /2008 EUR 313,0 0 2008 D 60,759 31/3 0 20/3/ U /2008 EUR 25,0 0 2008 SD 38,870 31/3 0 25/3/ U 2 /2008 EUR 157,0 0 2008 SD 43,672 31/3 0 25/3/ USD /2008 EUR 13,0 0 2008 20,177 31/3 0 27/3/ US 0,5 /2008 EUR 6,712,0 0 2008 D 1 90,865 31/3 0 13/2/ USD 6 /2008 EUR 436,0 0 2008 33,155 31/3 0 13/2/ US /2008 EUR 41,0 0 2008 D 59,540 31/3 0 21/2/ US 2 /2008 EUR 169,0 0 2008 D 48,895 31/3 0 21/2/ USD /2008 EUR 18,0 0 2008 26,509 31/3 0 31/1/ US 6 /2008 EUR 424,0 0 2008 D 29,513 31/3 0 29/1/ USD /2008 EUR 54,0 0 2008 79,492 31/3 0 31/1/ US 2 /2008 EUR 154,0 0 2008 D 27,997 31/3 0 31/1/ US /2008 EUR 39,0 0 2008 D 57,740 31/3 0 3/1/ USD 1 /2008 EUR 128,0 0 2008 88,239 31/3 0 3/1/ US /2008 EUR 27,0 0 2008 D 39,707 31/3 0 4/1/ US 1 /2008 EUR 117,0 0 2008 D 72,089 31/3 0 4/1/ USD /2008 EUR 25,0 0 2008 36,771 31/3 0 8/1/ US 2 /2008 EUR 136,0 0 2008 D 00,002 31/3 0 8/1/ USD /2008 EUR 36,0 0 2008 52,942 31/3 0 10/1/ US 2 /2008 EUR 202,0 0 2008 D 96,374 31/3 0 11/1/ USD 2 /2008 EUR 173,0 0 2008 55,559 31/3 0 11/1/ USD /2008 EUR 32,0 0 2008 47,271 31/3 0 15/1/ US /2008 EUR 15,0 0 2008 D 22,292 31/3 0 15/1/ US 1 /2008 EUR 83,0 0 2008 D 23,348 31/3 0 16/1/ USD /2008 EUR 41,0 0 2008 60,723 31/3 0 17/1/ US 4 /2008 EUR 295,0 0 2008 D 31,585 31/3 0 17/1/ US /2008 EUR 45,0 0 2008 D 65,835 31/3 0 22/1/ USD /2008 EUR 57,0 0 2008 82,004 31/3 0 22/1/ US 4 /2008 EUR 297,0 0 2008 D 27,284 31/3 0 23/1/ US 9 /2008 EUR 630,0 0 2008 D 19,737 31/3 0 23/1/ USD 1 /2008 EUR 111,0 0 2008 62,049 31/3 0 4/3/ US /2008 EUR 21,0 0 2008 D 31,871 31/3 0 4/3/ USD 2 /2008 EUR 182,0 0 2008 76,214 31/3 0 6/3/ US 2 /2008 EUR 146,0 0 2008 D 23,811 31/3 0 14/3/ US /2008 EUR 23,0 0 2008 D 35,770 31/3 0 17/3/ USD /2008 EUR 15,0 0 2008 23,668 31/3 0 17/3/ US 2 /2008 EUR 147,0 0 2008 D 31,951 31/3 0 18/3/ US 3 /2008 EUR 215,0 0 2008 D 39,023 31/3 0 18/3/ US /2008 EUR 23,0 0 2008 D 36,268 31/3 0 19/3/ U 1 /20 1 0 2008 SD 73,096 31/3 08 EUR 10,00 6/3/ US /2008 EUR 2008 D 22,994 31/3 15,000 10/3/2008 USD 228,894 31/3/2008 EUR 149,000 10/3/2008 USD 24,579 31/3/2008 EUR 16,000 11/3/2008 USD 250,197 31/3/2008 EUR 163,000 11/3/ US /2008 EUR 2008 D 35,304 31/3 23,000 14/3/2008 USD 248,832 31/3/2008 EUR 160,0 0 0 27/3/2008 USD 864,689 31/3/2008 EUR 548,000 28/3/2008 EUR 22,000 30/6/2008 USD 34,499 27/3/2008 EUR 6,712,000 30/6/2008 USD 10,544,888
27/3/2008 EUR 548,000 30/6/2008 USD 860,935 USD
1,094,015 Global Emerging MarketsEquity Freestyle 20/3/2008 USD 451,077 31/3/2008 ZAR 3,643,209 USD 4,266
HSBC Global Investment Funds 62
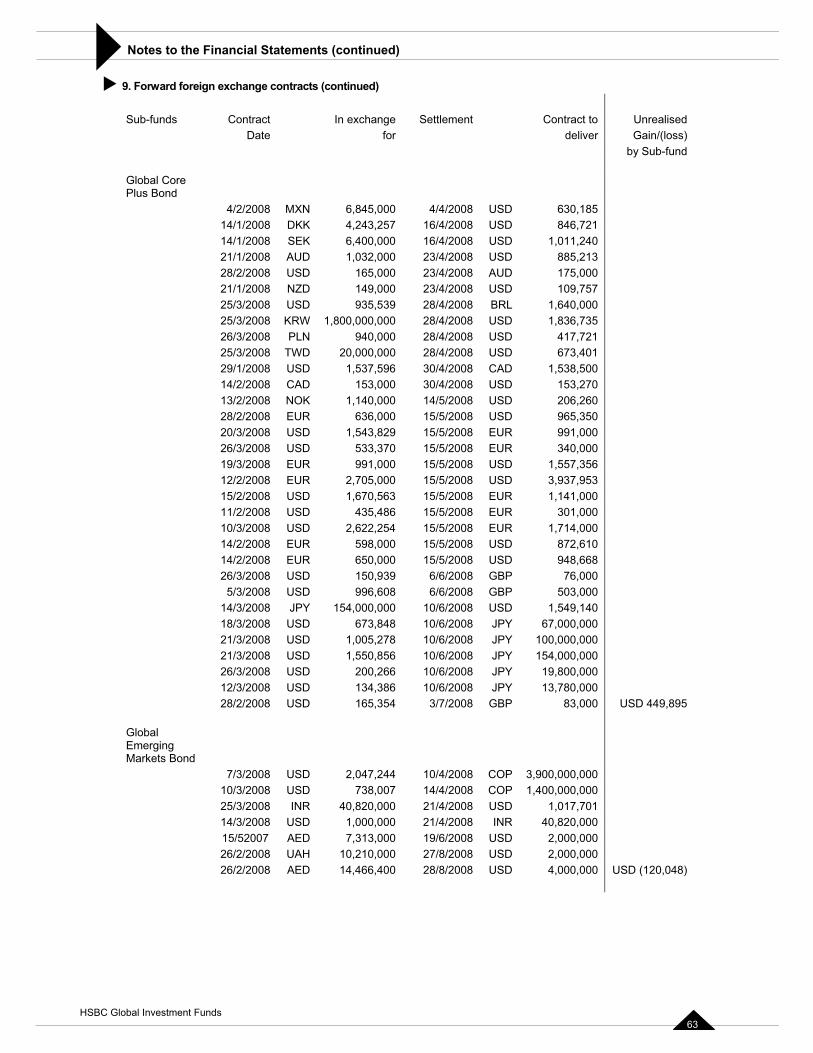
Notes to the Financial Statements (continued)�
� 9. Forward foreign exchange ntracts (co inued) co nt
Sub-funds Contract exchange Set ment Unrealised In tle Contract to Date for Gain/(loss) deliver
by Sub-fund
Global Core Plus Bond / M 6,8 /200 630,1 5 4/2 2008 XN 45,000 4/4 8 USD 8 / DK 4,2 /2008 USD 846,7 1 14/1 2008 K 43,257 16/4 2 / SE 6,4 /2008 USD 1,011,2 0 14/1 2008 K 00,000 16/4 4 / AU 1,0 /2008 USD 885,2 3 21/1 2008 D 32,000 23/4 1
1 /2008 AUD 175,0 0 28/2/2008 USD 65,000 23/4 0 / NZ 1 /2008 USD 109,7 7 21/1 2008 D 49,000 23/4 5
U 9 /2008 BRL 1,640,0 0 25/3/2008 SD 35,539 28/4 0 / KR 0,0 /2008 1,836,7 5 25/3 2008 W 1,80 00,000 28/4 USD 3 / P 9 /2008 USD 417,7 1 26/3 2008 LN 40,000 28/4 2 / TW 0,0 /2008 673,4 1 25/3 2008 D 2 00,000 28/4 USD 0 / U 1,5 /2008 CAD 1,538,5 0 29/1 2008 SD 37,596 30/4 0 / CA 1 /2008 USD 153,2 0 14/2 2008 D 53,000 30/4 7 / N 1,1 /2008 USD 206,2 0 13/2 2008 OK 40,000 14/5 6 / E 6 /2008 USD 965,3 0 28/2 2008 UR 36,000 15/5 5 / US 1,5 /2008 EUR 991,0 0 20/3 2008 D 43,829 15/5 0 / U 5 /2008 EUR 340,0 0 26/3 2008 SD 33,370 15/5 0 / EU 9 /2008 USD 1,557,3 6 19/3 2008 R 91,000 15/5 5 / EU 2,7 /2008 USD 3,937,9 3 12/2 2008 R 05,000 15/5 5 / US 1,67 /2008 EUR 1,141,0 0 15/2 2008 D 0,563 15/5 0 /2 4 /2008 EUR 301,0 0 11/2 008 USD 35,486 15/5 0 / US 2,6 /20 1,714,0 0 10/3 2008 D 22,254 15/5 08 EUR 0 / E 5 /2 872,6 0 14/2 2008 UR 98,000 15/5 008 USD 1 / E 6 /2 948,6 8 14/2 2008 UR 50,000 15/5 008 USD 6 / US 1 /20 76,0 0 26/3 2008 D 50,939 6/6 08 GBP 0 / US 99 /2008 GBP 5/3 2008 D 6,608 6/6 503,000 14/3/2008 JPY 154,000,000 10/6/2008 USD 1,549,1 0 4
18/3/2008 USD 673,848 10/6/2008 JPY 67,000,000 21 /2008 USD 1,005,278 10/ /2008 JPY 100,000,0 0 /3 6 0
/ U 1,5 / 154,000,0 0 21/3 2008 SD 50,856 10/6 2008 JPY 0 / US 2 / 19,800,0 0 26/3 2008 D 00,266 10/6 2008 JPY 0 /2 U 1 /2008 JPY 13,780,0 0 12/3 008 SD 34,386 10/6 0 / U 1 /200 83,0 0 USD 449,895 28/2 2008 SD 65,354 3/7 8 GBP 0
Global Emerging
ts Bond Marke 7/3/2008 USD 2,047,244 10/4/2008 COP 3,900,000,000 10/3/2008 USD 738,007 14/4/2008 COP 1,400,000,000 25/3/2008 INR 40,820,000 21/4/2008 USD 1,017,701 14/3/2008 USD 1,000,000 21/4/2008 INR 40,820,000
15/52007 AED 7,313,000 19/6/2008 USD 2,000,000 26/2/2008 UAH 10,210,000 27/8/2008 USD 2,000,000 26/2/2008 AED 14,466,400 28/8/2008 USD 4,000,000 USD (120,048)
HSBC Global Investment Funds 63
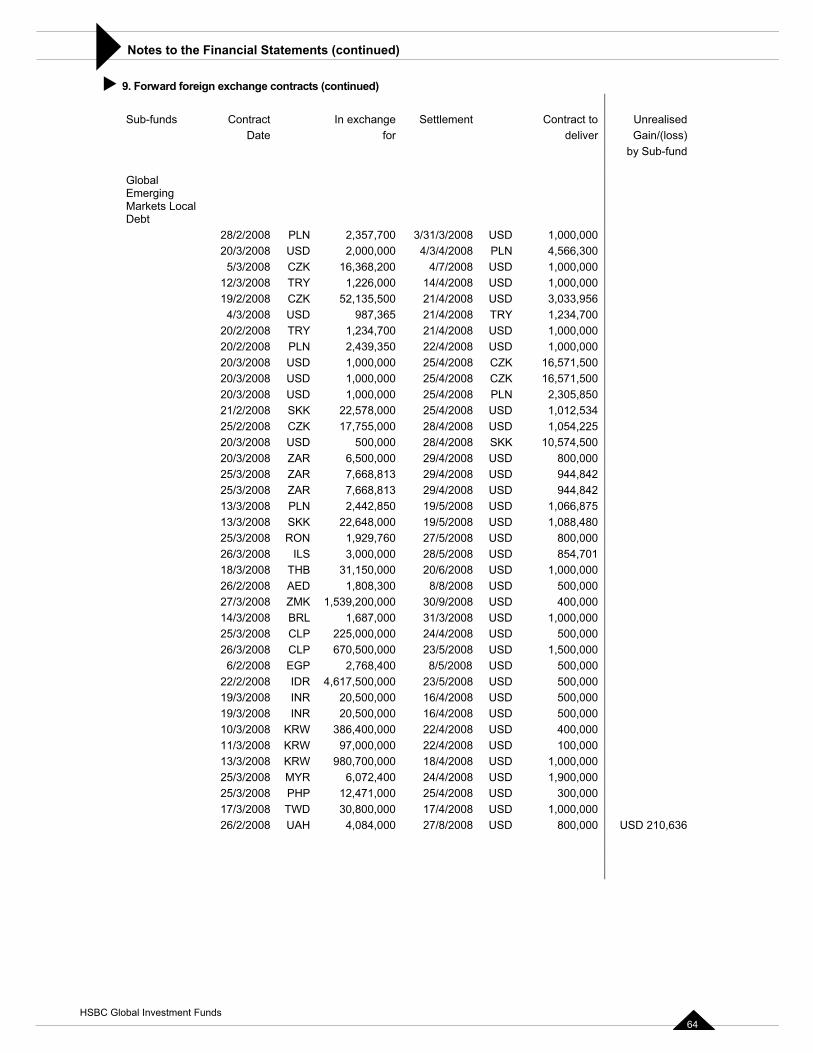
Notes to the Financial Statements (continued)�
� 9. Forward foreign exchange ntracts (co inued) co nt
Sub-funds Contract exchange Set ment Unrealised In tle Contract to Date for Gain/(loss) deliver
by Sub-fund
Global EmergingMarkets LocaDebt
l
/ P 2,3 3 /2008 USD 1,000,0 0 28/2 2008 LN 57,700 /31/3 0 / U 2,0 /2008 PLN 4,566,3 0 20/3 2008 SD 00,000 4/3/4 0 / CZ 6,3 /200 1,000,0 0 5/3 2008 K 1 68,200 4/7 8 USD 0 / T 1,2 /2008 USD 1,000,0 0 12/3 2008 RY 26,000 14/4 0 / C 2,1 /2008 USD 3,033,9 6 19/2 2008 ZK 5 35,500 21/4 5 / U 9 /20 1,234,7 0 4/3 2008 SD 87,365 21/4 08 TRY 0 / T 1,2 /2008 USD 1,000,0 0 20/2 2008 RY 34,700 21/4 0 / 2,4 /2008 USD 1,000,0 0 20/2 2008 PLN 39,350 22/4 0 / U 1,0 /200 16,571,5 0 20/3 2008 SD 00,000 25/4 8 CZK 0 / US 1,0 /20 16,571,5 0 20/3 2008 D 00,000 25/4 08 CZK 0 / U 1,0 /2008 PLN 2,305,8 0 20/3 2008 SD 00,000 25/4 5 / S 2,5 /2008 USD 1,012,5 4 21/2 2008 KK 2 78,000 25/4 3 / C 7,7 /2008 USD 1,054,2 5 25/2 2008 ZK 1 55,000 28/4 2 / U 5 /2008 SKK 10,574,5 0 20/3 2008 SD 00,000 28/4 0 / Z 6,5 /2008 USD 800,0 0 20/3 2008 AR 00,000 29/4 0 /2 Z 7,6 /2008 USD 944,8 2 25/3 008 AR 68,813 29/4 4 / Z 7,6 /2008 USD 944,8 2 25/3 2008 AR 68,813 29/4 4 / 2,4 /2008 USD 1,066,8 5 13/3 2008 PLN 42,850 19/5 7 / S 2,6 /2008 USD 1,088,4 0 13/3 2008 KK 2 48,000 19/5 8 / 1,9 /2008 USD 800,0 0 25/3 2008 RON 29,760 27/5 0 / 3 /2008 USD 854,7 1 26/3 2008 ILS ,000,000 28/5 0 / 1 /2008 USD 1,000,0 0 18/3 2008 THB 3 ,150,000 20/6 0 /2 1,8 /2008 USD 500,0 0 26/2 008 AED 08,300 8/8 0 /2 Z 9,2 /2008 400,0 0 27/3 008 MK 1,53 00,000 30/9 USD 0
1,6 /2008 USD 1,000,0 0 14/3/2008 BRL 87,000 31/3 05,0 /2008 500,0 0 25/3/2008 CLP 22 00,000 24/4 USD 00,5 /2008 USD 1,500,0 0 26/3/2008 CLP 67 00,000 23/5 0
/ E 2,7 /2008 500,0 0 6/2 2008 GP 68,400 8/5 USD 07,5 /2008 USD 500,0 0 22/2/2008 IDR 4,61 00,000 23/5 0
/ I 0,5 /200819/3 2008 NR 2 00,000 16/4 USD 500,000 19/3/2008 INR 0,500,000 16/4/2008 USD 500,0 0 2 0 10/3/2008 KRW 386,400,000 22/4/2008 USD 400,0 0 0 11/3/2008 KRW 0,000 22/4/2008 USD 100,097,00 00 13/3/2008 KRW 980,700,000 18/4/2008 USD 1,000,000 25/3/2008 MYR 6,072,400 24/4/2008 USD 1,900,000 25/3/2008 PHP 12,471,000 25/4/2008 USD 300,000 17/3/2008 TWD 30,800,000 17/4/2008 USD 1,000,000 26/2/2008 UAH 4,084,000 27/8/2008 USD 800,000 USD 210,636
HSBC Global Investment Funds 64
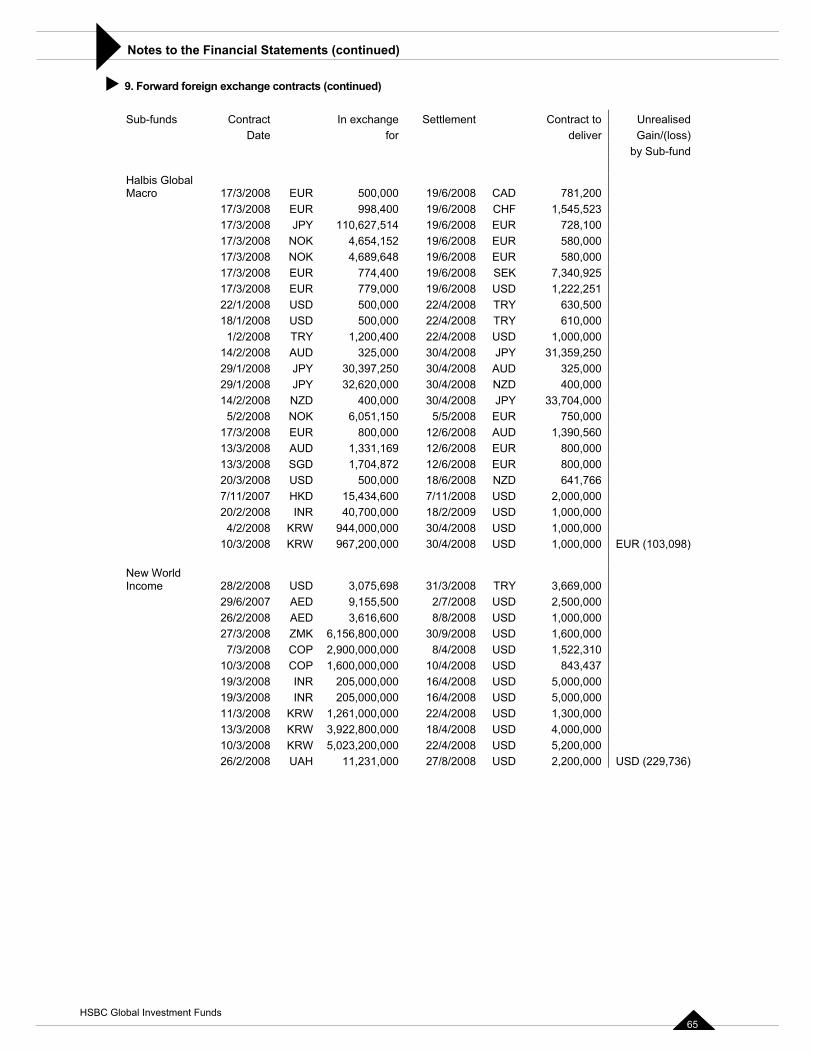
Notes to the Financial Statements (continued)�
� 9. Forward foreign exchange contracts (continued)
Sub-funds Contract In exchange ettlement ract to Unrealised S Cont Date for er Gain/(loss)deliv
by Sub-fund Halbis GlobMacro / 8 9/6/2 AD 00
al17 3/200 EUR 500,000 1 008 C 781,2
/ 8 6/2 HF 1,545,523 17 3/200 EUR 998,400 19/ 008 C /3 8 11 9/6 UR 00 17 /200 JPY 0,627,514 1 /2008 E 728,1 /3 8 N 9/6/ UR 0017 /200 OK 4,654,152 1 2008 E 580,0 /3 8 N 9/6/2 UR 0017 /200 OK 4,689,648 1 008 E 580,0 /3 8 9/6 EK 7,340,925 17 /200 EUR 774,400 1 /2008 S /3 8 6 SD 1,222,251 17 /200 EUR 779,000 19/ /2008 U /1 8 2/4/2 RY 00 22 /200 USD 500,000 2 008 T 630,5 /1 8 USD 2/4 RY 00 18 /200 500,000 2 /2008 T 610,0 / 8 1 2/4/2 SD 1,000,000 1 2/200 TRY ,200,400 2 008 U /2 8 4 PY 31,359,250 14 /200 AUD 325,000 30/ /2008 J /1 8 3 0/4/2 UD 00 29 /200 JPY 0,397,250 3 008 A 325,0 /1 8 3 0/4/2 D 00 29 /200 JPY 2,620,000 3 008 NZ 400,0 /2 8 4 PY 33,704,000 14 /200 NZD 400,000 30/ /2008 J /2 8 5/5 UR 005 /200 NOK 6,051,150 /2008 E 750,0 / 8 6 U 6017 3/200 EUR 800,000 12/ /2008 A D 1,390,5 13/3/20 8 1,331,1 000 AUD 69 12/6/2008 EUR 800,0
13/3 1,704,8 12/6/20 800,000 /2008 SGD 72 08 EUR 20/3 8 8/6 ZD 66/200 USD 500,000 1 /2008 N 641,7
1 7 15 /11 SD 2,000,000 7/1 /200 HKD ,434,600 7 /2008 U /2 8 4 8/2 SD 1,000,000 20 /200 INR 0,700,000 1 /2009 U / 8 944 0/4 SD 1,000,000 4 2/200 KRW ,000,000 3 /2008 U /3 8 96 0/4 SD 1,000,000 EUR (103,098) 10 /200 KRW 7,200,000 3 /2008 U New World Income / 8 3 RY 3,669,000 28 2/200 USD 3,075,698 31/ /2008 T / 7 2/7 SD 2,500,000 29 6/200 AED 9,155,500 /2008 U /2 8 8/8 0,000 26 /200 AED 3,616,600 /2008 USD 1,00 27/3/2008 ZMK 6,156,800,000 30/9/2008 USD 1,600,000 7/3/2008 COP 2,900,000,000 8/4/2008 USD 1,522,310 10/3/2008 COP 1,600,000,000 10/4/2008 USD 843,437 19/3/2008 INR 205,000,000 16/4/2008 USD 5,000,000 19/3/2008 INR 205,000,000 16/4/2008 USD 5,000,000 11/3/2008 KRW 1,261,000,000 22/4/2008 USD 1,300,000 13/3/2008 KRW 3,922,800,000 18/4/2008 USD 4,000,000 10/3/2008 KRW 5,023,200,000 22/4/2008 USD 5,200,000 26/2/2008 UAH 11,231,000 27/8/2008 USD 2,200,000 USD (229,736)
HSBC Global Investment Funds 65
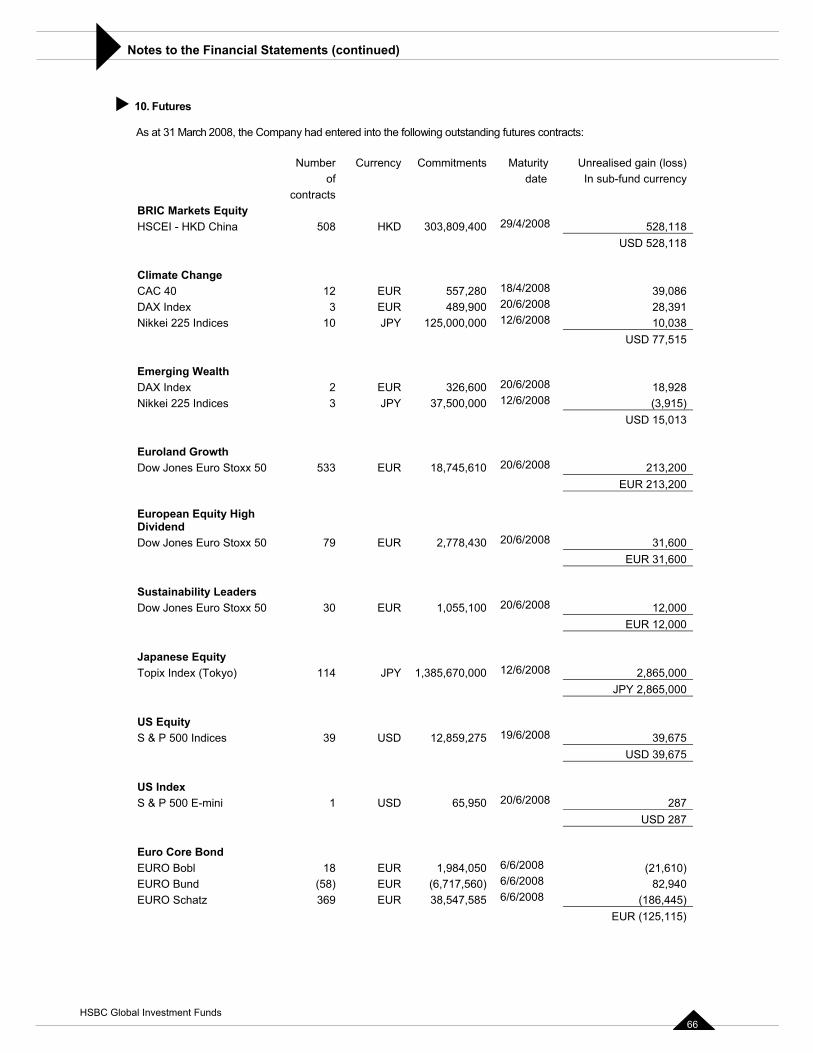
Notes to the Financial Statements (continued)�
As at 31 March 2008, th t oll tsta cts:
Currenc Maturity Unrealised gain (loss) In sub-fund currency
contracts BRIC Markets Equity
D China 00 29/4/2008 528,118 USD 528,118
� 10. Futures
e Company had en ered into the f owing ou nding futures contra
Number y Commitmentsof date
HSCEI - HK 508 HKD 303,809,4
Climate Change CAC 40 12 EUR 557,280 18/4/2008 39,086
9,900 20/6/20 28,391 dices 00 12/6/2 10,038
USD 77,515
DAX Index 3 EUR 48 08
Nikkei 225 In 10 JPY 125,000,0 008
DAX Index EUR 326,600 2 18,928 Nikkei 225 Indices JPY 37,500,000 12/6/2008 (3,915)
USD 15,013
Emerging Wealth2 0/6/2008
3
Euroland Growth Dow Jones Euro Stoxx 50 533 EUR 18,745,610 20/6/2008 213,200
EUR 213,200 European Equity High
uro Stoxx 5 8,430 20/ 31,600
EUR 31,600
Dividend Dow Jones E 0 79 EUR 2,77 6/2008
Sustainability Leaders Dow Jones Euro Stoxx 50 30 EUR 1,055,100 20 12,000 EUR 12,000
/6/2008
Japanese Equity Topix Index (Tokyo) 114 JPY 70,000 12/6/20 2,865,000
JPY 2,865,000 1,385,6 08
US Equity S & P 500 Indices 39 USD 12,859,275 39,675
USD 39,675
19/6/2008
US Index S & P 500 E-mini 1 USD 65,950 20/6/2008 287
USD 287
Euro Core Bond EURO Bobl 18 EUR 1,984,050 6/6/2008 (21,610) EURO Bund (58) EUR (6,717,560) 6/6/2008 82,940 EURO Schatz 369 EUR 38,547,585 6/6/2008 (186,445)
EUR (125,115)
HSBC Global Investment Funds 66
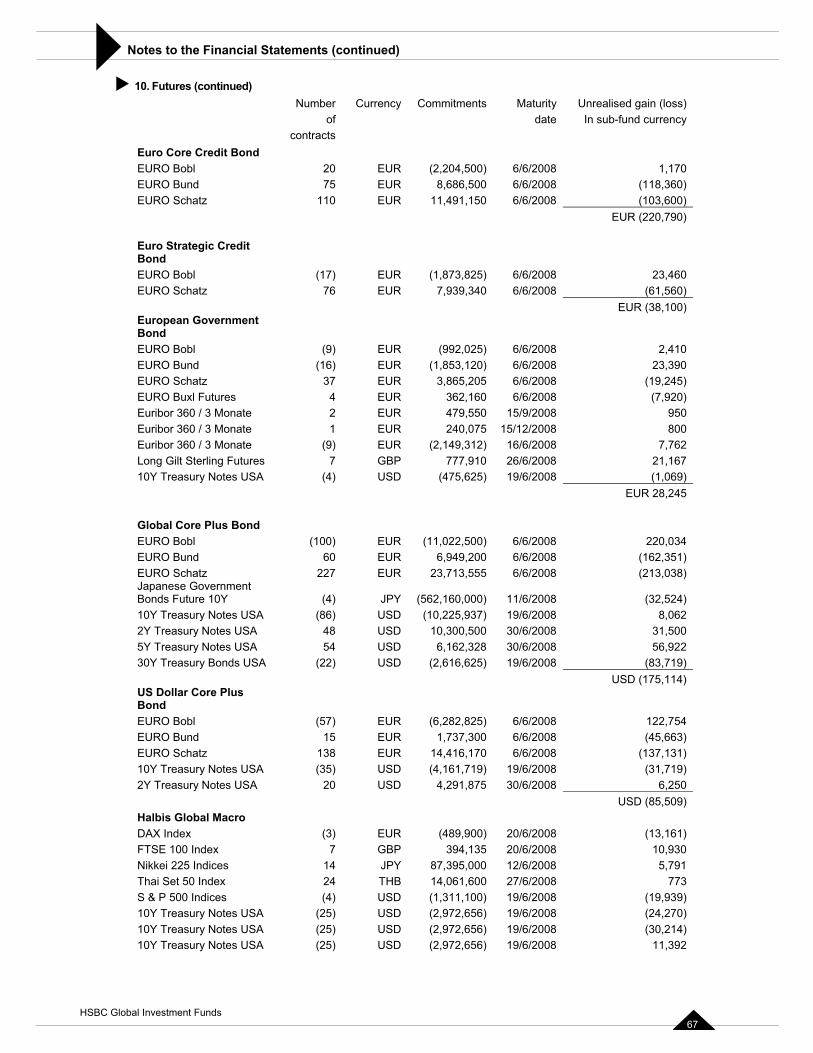
Notes to the Financial Statements (continued)�
10. Futures (continue Numbe Currenc Commitments Unrealised gain (loss)
of date In sub-fund currency con
re Credit Bond obl ,500) 6/ 1,170
EURO Bund 75 EUR 8,686,500 6/6/200 (118,360) 110 EUR 11,491,150 6/6/2008 (103,600)
EUR (220,790)
�� d)
r y Maturity
tractsEuro CoEURO B 20 EUR (2,204 6/2008
8EURO Schatz
Euro Strategic Credit
Bobl 25) 6/6/200 0Schatz ,340 6/6/ (61,560)
EUR (38,100)
BondEURO (17) EUR (1,873,8 8 23,46EURO 76 EUR 7,939 2008
European Government
,025) 6/6/20 2,410,120) 6/6/ 23,390 ,205 6/6 (19,245)
EURO Buxl Futures EUR 362,160 (7,920)Euribor 360 / 3 Monate EUR 479,550 15/9/2008 950
onate 75 15/12/2 800 Monate ,312) 16 7,762
t Sterling Future ,910 26 21,167 otes USA ,625) 19/6 (1,069)
EUR 28,245
BondEURO Bobl (9) EUR (992 08 EURO Bund (16) EUR (1,853 2008 EURO Schatz 37 EUR 3,865 /2008
4 6/6/2008 2
Euribor 360 / 3 M 1 EUR 240,0 008Euribor 360 / 3 (9) EUR (2,149 /6/2008 Long Gil s 7 GBP 777 /6/2008 10Y Treasury N (4) USD (475 /2008
s Bond
,500) 220,034 60 EUR 6,949,200 6/6/200 (162,351)
Schatz 5 6/6/200 (213,038) se Government uture 10Y ,000) 11/ (32,524)
es USA ,937) 19 8,0620 30/6/2 31,500
5Y Treasury Notes USA 54 USD 6,162,328 56,922 (22) USD (2,616,625) 19/6/2008 (83,719)
USD (175,114)
Global Core PluEURO Bobl (100) EUR (11,022 6/6
8/2008
EURO Bund EUROJapane
227 EUR 23,713,55 8
Bonds F (4) JPY (562,160 6/6
/2008 10Y Treasury Not (86) USD (10,225 /2008 2Y Treasury Notes USA 48 USD 10,300,50 008
30/6/2008 30Y Treasury Bonds USA
US Dollar Core Plus
,825) 6/6 122,754 ,300 6/6 (45,663)
0 6/6 (137,131) es USA ,719) 19/6/ (31,719)
2Y Treasury Notes USA 20 USD 4,291,875 30/6/2008 6,250 USD (85,509)
BondEURO Bobl (57) EUR (6,282 /2008 EURO Bund 15 EUR 1,737 /2008 EURO Schatz 138 EUR 14,416,17 /2008 10Y Treasury Not (35) USD (4,161 2008
Halbis Global Macro DAX Index (3) EUR (489,900) 20/6/2008 (13,161) FTSE 100 Index 7 GBP 394,135 20/6/2008 10,930 Nikkei 225 Indices 14 JPY 87,395,000 12/6/2008 5,791Thai Set 50 Index 24 THB 14,061,600 27/6/2008 773S & P 500 Indices (4) USD (1,311,100) 19/6/2008 (19,939) 10Y Treasury Notes USA (25) USD (2,972,656) 19/6/2008 (24,270) 10Y Treasury Notes USA (25) USD (2,972,656) 19/6/2008 (30,214) 10Y Treasury Notes USA (25) USD (2,972,656) 19/6/2008 11,392
HSBC Global Investment Funds 67
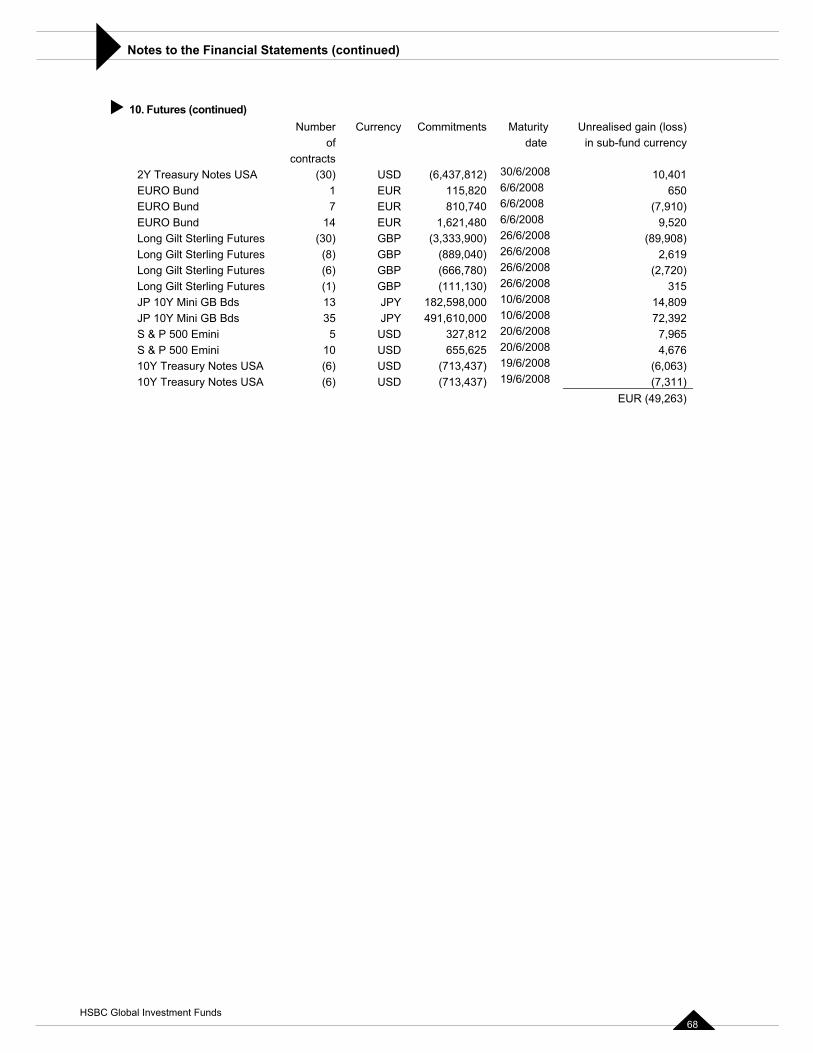
Notes to the Financial Statements (continued)�
� 10. Futures (continued) Number Currenc Commitments Maturity Unrealised gain (loss)
d in sub-fund currency con
sury Notes USA 7,812) 30/6/2 10,401 5,820 6/6/2 6500,740 6/6/200 (7,910)1,480 6/6/20 9,520
utures ,900) 26/6/20 (89,908) ing Futures ,040) 26/6/2 2,619
terling Futures ,780) 26/6/20 (2,720)utures ,130) 26/6/20 315
ds 00 10/6/2 14,809 JP 10Y Mini GB Bds 35 JPY 491,6 00 1 72,392 S & P 500 Emini 5 USD 327,812 20/6/20 7,965S & P 500 Emini 10 USD 655,625 20/6/2008 4,67610Y Treasury Notes USA (6) USD (713,437) 19/6/2008 (6,063)10Y Treasury Notes USA (6) USD (713,437) 19/6/2008 (7,311)
EUR (49,263)
y of ate
tracts2Y Trea (30) USD (6,43 008
EURO Bund 1 EUR 11 008
EURO Bund 7 EUR 81 8
EURO Bund 14 EUR 1,62 08
Long Gilt Sterling F (30) GBP (3,333 08
Long Gilt Sterl (8) GBP (889 008
Long Gilt S (6) GBP (666 08
Long Gilt Sterling F (1) GBP (111 08
JP 10Y Mini GB B 13 JPY 182,598,0 008
10,0 0/6/2008 08
HSBC Global Investment Funds 68
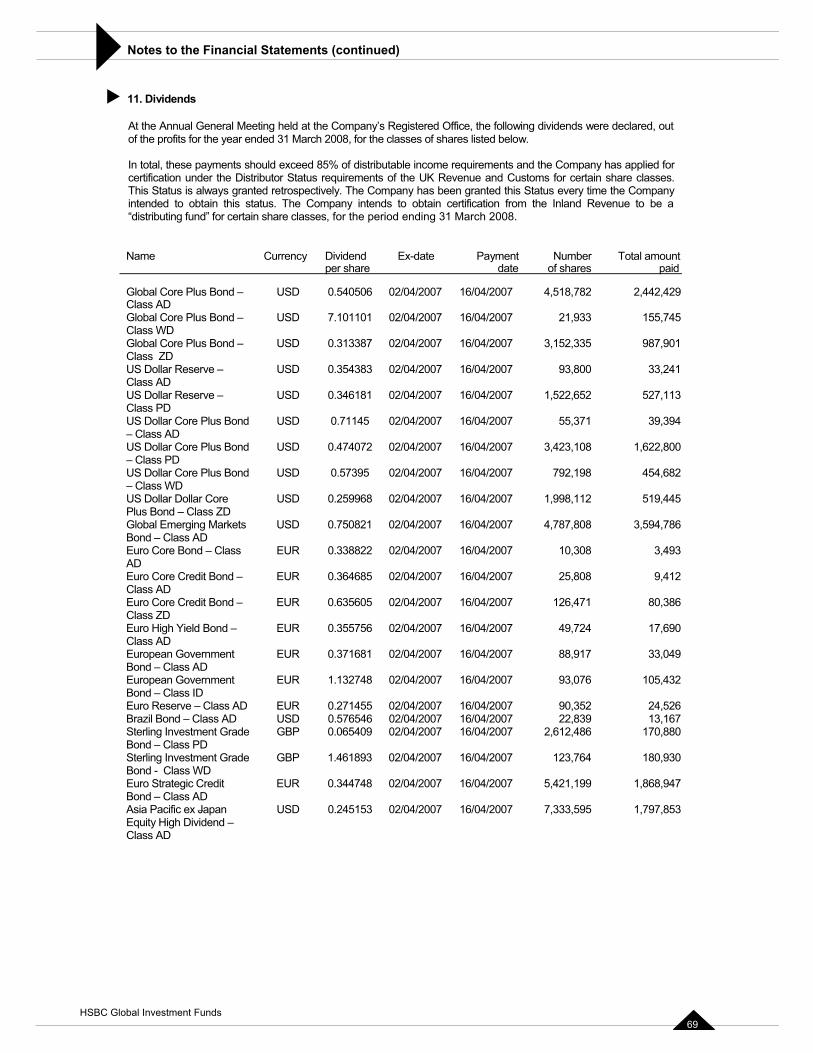
Notes to the Financial Statements (continued)�
�
At the Annual General Meeting held at the Company’s Registered Office, the following dividends were declared, out
y has applied for share classes.
This Status is always granted retrospectively. The Company has been granted this Status every time the Company intended to obtain this status. The Company intends to obtain certification from the Inland Revenue to be a
8
Dividend ent Number Total amount res paid
11. Dividends
of the profits for the year ended 31 March 2008, for the classes of shares listed below.
In total, these payments should exceed 85% of distributable income requirements and the Compancertification under the Distributor Status requirements of the UK Revenue and Customs for certain
“distributing fund” for certain sha s, fre classe ing 31 March 200or the period end .
Name Currency Ex-date Paymdate per share of sha
ond 782 2,442,429
l Core Plus Bond – USD 7.101101 02/04/2007 16/04/2007 21,933 155,745
nd 1 7 335 987,901
7 800 33,241D
1 7 652 527,113
lus B 7 371 39,394
re Plus Bond USD 0.474072 02/04/2007 16/04/2007 3,423,108 1,622,800
s B 16/04/2007 198 454,682
ore 1 7 112 519,445ond – Cla s ZD
Mark 1 7 808 3,594,786
– Class 16/04/2007 3,493
redit Bond – EUR 0.364685 02/04/2007 16/04/2007 25,808 9,412
nd 7 471 80,386
d – 16/04/2007 724 17,690
rnment 7 917 33,049D
ment 105,432 Class ID
Euro Reserve – Class AD EUR 0.271455 02/04/2007 16/04/2007 90,352 24,526Brazil Bond – Class AD USD 0.576546 02/04/2007 16/04/2007 22,839 13,167Sterling Investment Grade GBP 0.065409 02/04/2007 16/04/2007 2,612,486 170,880Bond – Class PDSterling Investment Grade GBP 1.461893 02/04/2007 16/04/2007 123,764 180,930Bond - Class WDEuro Strategic Credit EUR 0.344748 02/04/2007 16/04/2007 5,421,199 1,868,947Bond – Class ADAsia Pacific ex J
Core Plus B USD 0.540506 02/04/2007 16/04/2007 4,518,Global –Class ADGlobaClas WDsGlobal Core Plus Bo
ZD – USD 0.313387 02/04/2007 6/04/200 3,152,
Class US Dollar Reserve – USD 0.354383 02/04/2007 16/04/200 93,Class AUS Dollar Reserve – USD 0.346181 02/04/2007 6/04/200 1,522,Class PDUS Dollar Core P ond USD 0.71145 02/04/2007 16/04/200 55,– Class ADUS Dollar Co– Class PDUS Dollar Core Plu
s WDond USD 0.57395 02/04/2007 792,
– ClasUS Dollar Dollar C USD 0.259968 02/04/2007 6/04/200 1,998,Plus B sGlobal Emerging ets USD 0.750821 02/04/2007 6/04/200 4,787,Bond – Class AD
ondEuro Core B EUR 0.338822 02/04/2007 10,308ADEuro Core CClass ADEuro Core Credit Bo – EUR 0.635605 02/04/2007 16/04/200 126,Class ZDEuro High Yield Bon EUR 0.355756 02/04/2007 49,Class ADEuropean Gove EUR 0.371681 02/04/2007 16/04/200 88,Bond – Class AEuropean Govern EUR 1.132748 02/04/2007 16/04/2007 93,076Bond –
apan USD 0.245153 02/04/2007 16/04/2007 7,333,595 1,797,853Equity High Dividend –Class AD
65
HSBC Global Investment Funds 69
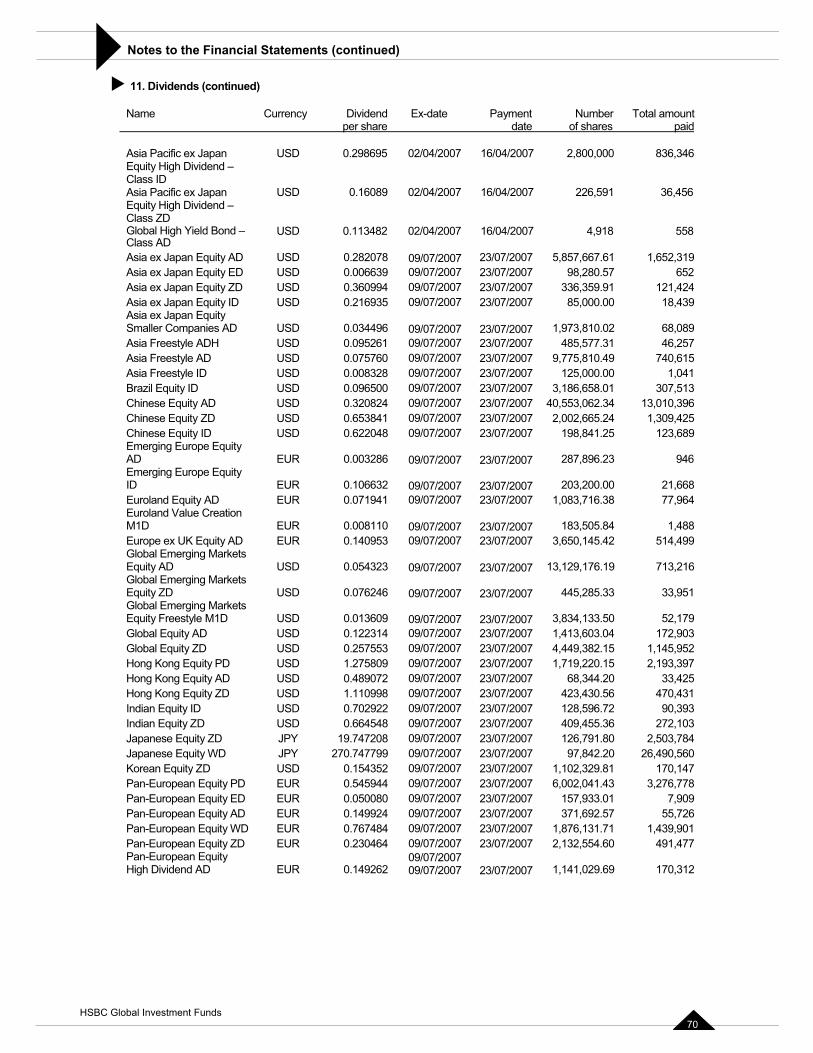
Notes to the Financial Statements (continued)�
�
Name Currency Dividend Ex-date Payment Number Total amount shares paid
� 11. Dividends (continued)
per share date of
Japan
annd
Bon
US 07 007 00,000 836,346
U 07 16/04/2007 36,456
U 07 007 4,918 558
Equity AD USD 0.282078 09/07/2007 23/07/2007 5,857,667.61 1,652,319uity U 0 007 ,280.57 652
Equity U 0 007 ,359.91 121,424n Equity U 07 007 ,000.00 18,439
pan Equitypanies A U 00 ,810.02 68,089 ADH U 0 007 ,577.31 46,257
U 07 007 ,810.49 740,615U 007 007 ,000.00 1,041USD 307,513
y AD U 0 007 ,062.34 13,010,396USD 0.653841 09/07/2007 23/07/2007 2,002,665.24 1,309,425U 0 007 ,841.25 123,689
E 0 007 ,896.23 946ty
E 007 007 ,200.00 21,668E 0 007 ,716.38 77,964
CreatiE 0 007 ,505.84 1,488
quity E 0 007 ,145.42 514,499g Mark
U 07
Asia Pacific exEquity High DividendClass
– ID
Pacific ex JapAsia Equity High Divide –Class ZD Global High Yield d –
D 0.298695 02/04/20 16/04/2 2,8
SD 0.16089 02/04/20 226,591
SD 0.113482 02/04/20 16/04/2Class ADAsia ex Japan Asia ex Japa Eqn
nED SD 0.006639 09/07/20 7 23/07/2 98
Asia ex Japaa
ZD SD 0.360994 09/07/20 7 23/07/2 336Asia ex Jap ID SD 0.216935 09/07/20 23/07/2 85Asia ex JaSmaller Com D SD 0.034496 09/07/2007 23/07/2 7 1,973Asia Freestyle SD 0.095261 09/07/20 7 23/07/2 485Asia Freestyle ADAsia Freestyle ID
SD 0.075760 09/07/20 23/07/2 9,775SD 0.008328 09/07/2 23/07/2 125
Brazil Equity ID 0.096500 09/07/2007 23/07/2007 3,186,658.01Chinese Equit SD 0.320824 09/07/20 7 23/07/2 40,553Chinese Equity ZDChinese Equity ID SD 0.622048 09/07/20 7 223/07/ 198Emerging Europe EquityAD UR 0.003286 09/07/2 07 23/07/2 287Emerging Europe EquiID UR 0.106632 09/07/2 23/07/2 203Euroland Equit
luey AD UR 0.071941 09/07/20 7 23/07/2 1,083
Euroland Va onM1D UR 0.008110 09/07/20 7 23/07/2 183Europe ex UK E AD UR 0.140953 09/07/20 7 23/07/2 3,650Global Emergin etsEquity AD SD 0.054323 09/07/20 23/07/2007 ,176.19 713,216
rging MarkU 07
13,129Global EmeEquity ZD
etsSD 0.076246 09/07/20 23/07/2007 ,285.33 33,951
g Mark M1D 0 00 ,133.50 52,179
U 0 007 ,603.04 172,903U 0 007 ,382.15 1,145,952
PD U 07 007 ,220.15 2,193,397AD U 0 007 ,344.20 33,425 ZD U 0 007 ,430.56 470,431
U 00 007 ,596.72 90,393Indian Equity ZD USD 0.664548 09/07/2007 23/07/2007 409,455.36 272,103Japanese Equity ZD JPY 19.747208 09/07/2007 23/07/2007 126,791.80 2,503,784Japanese Equity WD JPY 270.747799 09/07/2007 23/07/2007 97,842.20 26,490,560Korean Equity ZD USD 0.154352 09/07/2007 23/07/2007 1,102,329.81 170,147Pan-European Equity PD EUR 0.545944 09/07/2007 23/07/2007 6,002,041.43 3,276,778Pan-European Equity ED EUR 0.050080 09/07/2007 23/07/2007 157,933.01 7,909Pan-European Equity AD EUR 0.149924 09/07/2007 23/07/2007 371,692.57 55,726Pan-European Equity WD EUR 0.767484 09/07/2007 23/07/2007 1,876,131.71 1,439,901Pan-European Equity ZD EUR 0.230464 09/07/2007 23/07/2007 2,132,554.60 491,477Pan-European Equity 09/07/2007High Dividend AD EUR 0.149262 09/07/2007 23
445Global EmerginEquity Freestyle
etsUSD 0.013609 09/07/20 7 /223/07 7 3,834
Global Equity AD SD 0.122314 09/07/20 7 23/07/27
1,413Global Equity ZD SD 0.257553 09/07/20 23/07/2 4,449Hong Kong Equity SD 1.275809 09/07/20 23/07/2 1,719Hong Kong Equi ty
uitySD 0.489072 09/07/20 7 23/07/2
7 23/07/2 68
423Hong Kong EqID
SD 1.110998 09/07/20Indian Equity SD 0.702922 09/07/2 7 23/07/2 128
/07/2007 1,141,029.69 170,312
66
HSBC Global Investment Funds 70
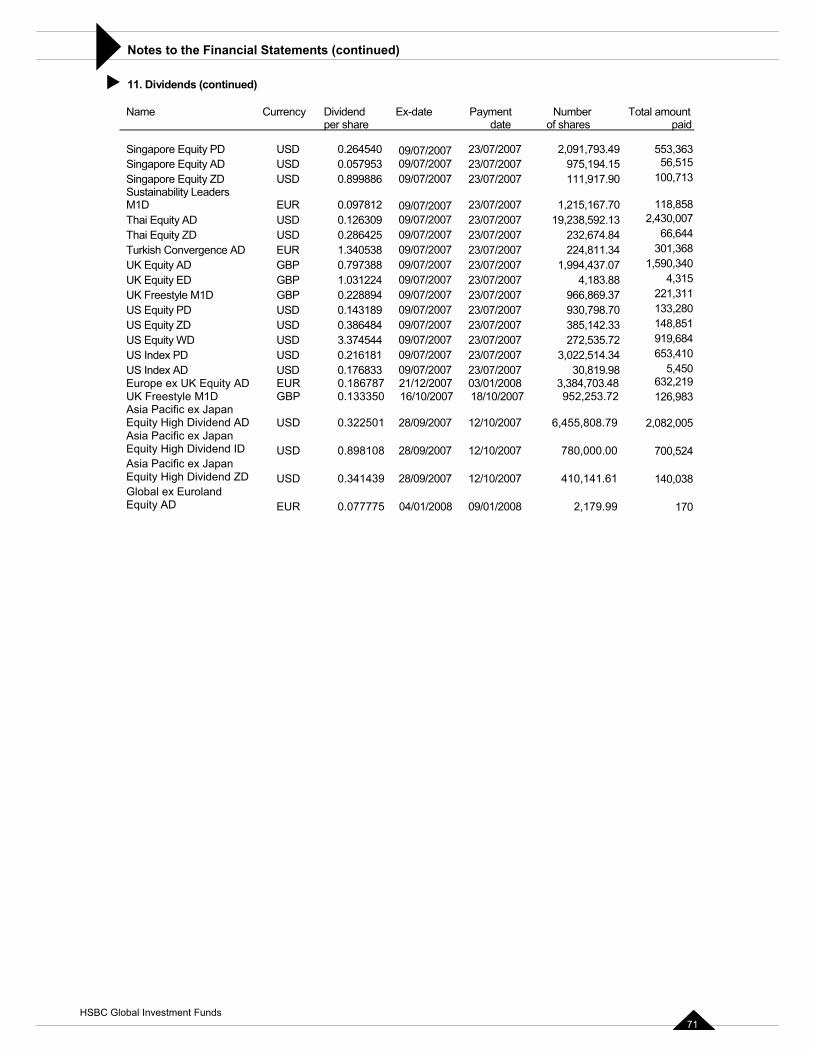
Notes to the Financial Statements (continued)�
� 11. Dividends (continued)
Name Currenc Total amount e paid
y Payment Number Dividendp
Ex-date r share date of shares
ty PD U 7 2 793.49 553,363y AD U 7 194.15 56,515
Equity ZD U 7 917.90 100,713lity Leaders
E 7 2 167.70 118,858ty AD U 7 592.13 2,430,007
D U 7 2 674.84 66,644ergence A E 7 2 811.34 301,368
AD G 7 2 437.07 1,590,340 ED G 7 2 183.88 4,315tyle M1D G 7 869.37 221,311
U 7 798.70 133,280U 7 142.33 148,851USD 3.374544 09/07/2007 23/07/2007 272,535.72 919,684U 7 514.34 653,410U 7 819.98 5,450
quity AD EUR 0.186787 21/12/2007 03/01/2008 3,384,703.48 632,219 G 7 53.72 126,983
Japan High Dividend U 7 12/10/2007 6,455,808.79 2,082,005
Asia Pacific ex Japan Equity High Dividend ID USD 0.898108 28/09/2007 12/10/2007 780,000.00 700,524Asia Pacific ex Japan Equity High Dividend ZD USD 0.341439 28/09/2007 12/10/2007 410,141.61 140,038Global ex Euroland Equity AD EUR 0.077775 04/01/2008 09/01/2008 2,179.99 170
Singapore Equi SD 0.264540 09/07/200 3/07/2007 2,091,Singapore Equit SD 0.057953 09/07/200 23/07/2007 975,Singapore SD 0.899886 09/07/200 23/07/2007 111,SustainabiM1D UR 0.097812 09/07/200 3/07/2007 1,215,Thai Equi SD 0.126309 09/07/200 23/07/2007 19,238,Thai Equity Z
onvSD 0.286425 09/07/200 3/07/2007 232,
Turkish C D UR 1.340538 09/07/200 3/07/2007 224,UK Equity BP 0.797388 09/07/200 3/07/2007 1,994,UK Equity BP 1.031224 09/07/200 3/07/2007 4,UK Frees BP 0.228894 09/07/200 23/07/2007 966,US Equity PD SD 0.143189 09/07/200 23/07/2007 930,US Equity ZD SD 0.386484 09/07/200 23/07/2007 385,US Equity WDUS Index PD SD 0.216181 09/07/200 23/07/2007 3,022,US Index AD SD 0.176833 09/07/200 23/07/2007 30,Europe ex UK EUK Freestyle M1D BP 0.133350 16/10/200 18/10/2007 952,2Asia Pacific exEquity AD SD 0.322501 28/09/200
HSBC Global Investment Funds 71
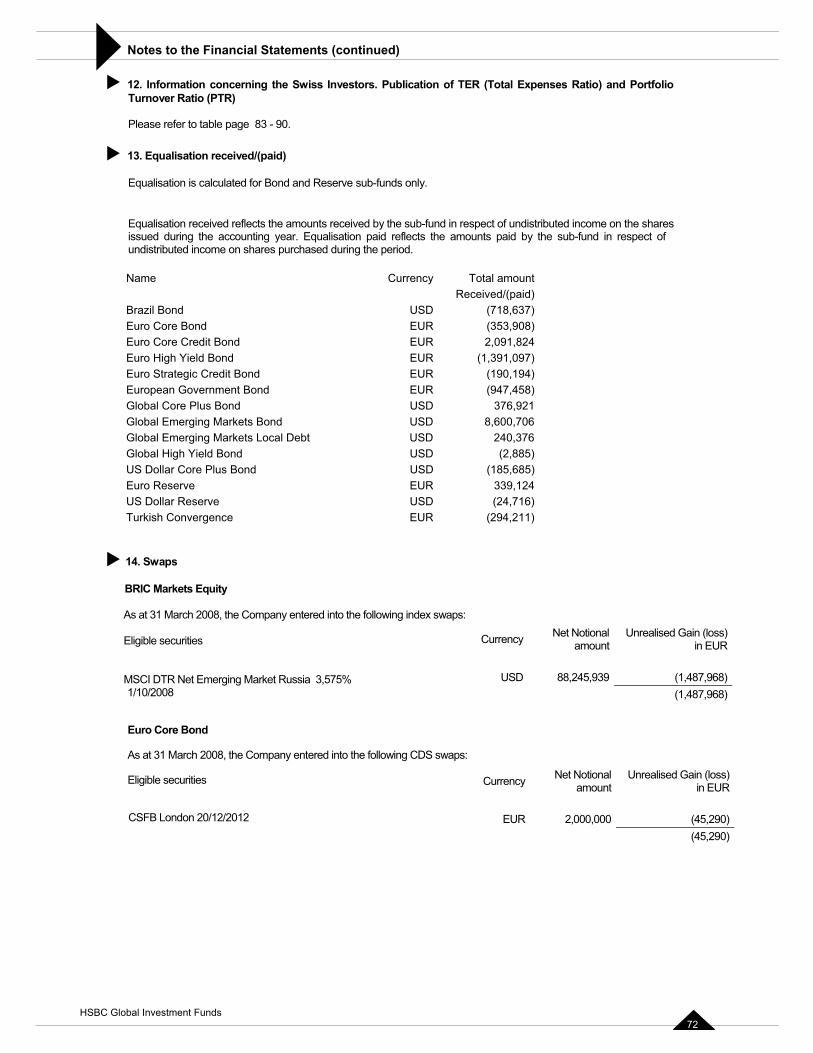
Notes to the Financial Statements (continued)�
� 12. Information concerning the Swiss Investors. Publication of TER (Total Expenses Ratio) and PortfolioTurnover Ratio (PTR)
Please refer to table page 83 - 90.
� 13. Equalisation received/(paid)
Equalisation is calculated for Bond and Reserve sub-funds only.
Equalisation received reflects the amounts received by the sub-fund in respect of undistributed income on the shares issued during the accounting year. Equalisation paid reflects the amounts paid by the sub-fund in respect of undistributed income on shares purchased during the period.
Name Currency Total amountReceived/(paid)
Brazil Bond USD (718,637) Euro Core Bond EUR (353,908) Euro Core Credit Bond EUR 2,091,824 Euro High Yield Bond EUR (1,391,097) Euro Strategic Credit Bond EUR (190,194) European Government Bond EUR (947,458) Global Core Plus Bond USD 376,921 Global Emerging Markets Bond USD 8,600,706 Global Emerging Markets Local Debt USD 240,376 Global High Yield Bond USD (2,885)US Dollar Core Plus Bond USD (185,685) Euro Reserve EUR 339,124 US Dollar Reserve USD (24,716) Turkish Convergence EUR (294,211)
� 14. Swaps
BRIC Markets Equity
As at 31 March 2008, the Company entered into the following index swaps:
Eligible securities
MSCI DTR Net Emerging Market Russia 3,575% 1/10/2008
Euro Core Bond
As at 31 March 2008, the Company entered into the following CDS swaps:
Eligible securities
CSFB London 20/12/2012
�
Currency Net Notional Unrealised Gain (loss) amount in EUR
USD 88,245,939 (1,487,968)(1,487,968)
Currency Net Notional Unrealised Gain (loss) amount in EUR
EUR 2,000,000 (45,290)(45,290)
HSBC Global Investment Funds 72
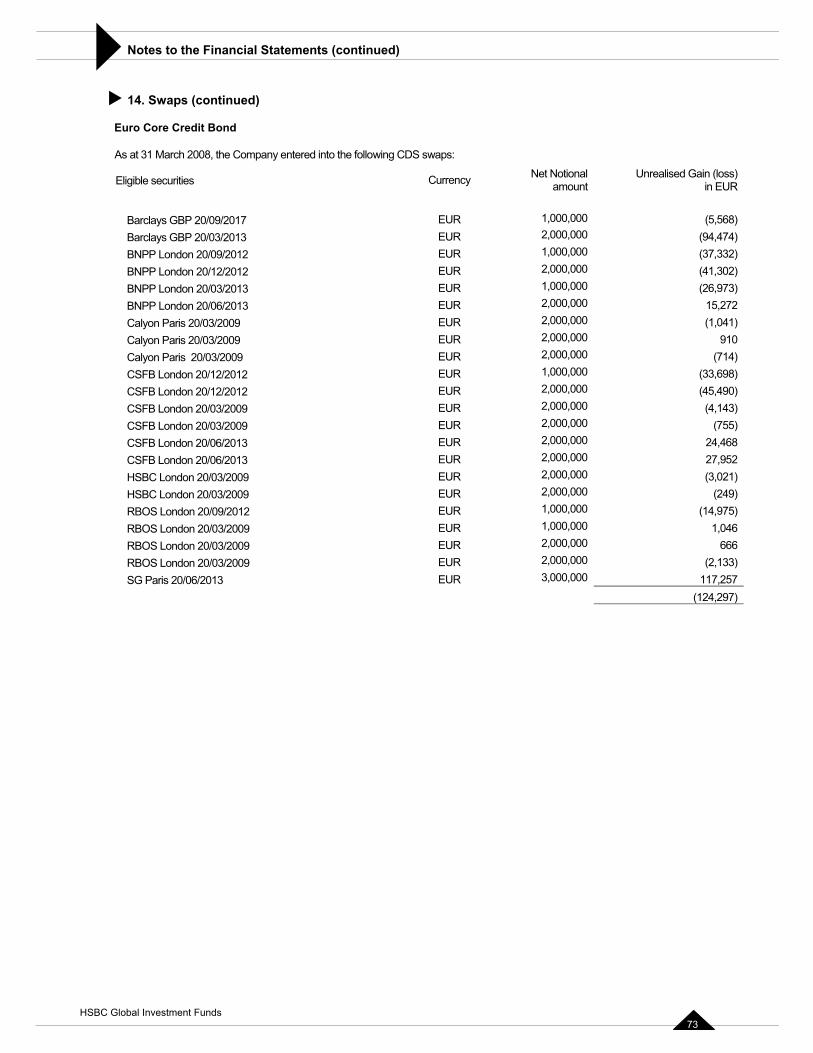
Notes to the Financial Statements (continued)�
� )
wing CDS swaps:
Eligib
14. Swaps (continued
Euro Core Credit Bond
As at 31 March 2008, the Company entered into the follo
le securities
Currency Net Notional Unrealised Gain (loss) amount in EUR
1,000,000 EUR (5,568) Barclays GBP 20/09/2017 clays GBP 20/03/2013
ndon 20/09/2012 0/12/2012
3/2013 013
/2009
12 don 20/03/2009
/03/2009 /06/2013
CSFB London 20/06/2013 ondon 20/03/2009
0/03/2009
RBOS London 20/03/2009 20/03 09
2,000,000 EUR (94,474) EUR 1,000,000 (37,332) EUR 2,000,000 (41,302) EUR 1,000,000 (26,973) EUR 2,000,000 15,272 EUR 2,000,000 (1,041) EUR 2,000,000 910 EUR 2,000,000 (714)EUR 1,000,000 (33,698) EUR 2,000,000 (45,490) EUR 2,000,000 (4,143) EUR 2,000,000 (755)EUR 2,000,000 24,468 EUR 2,000,000 27,952 EUR 2,000,000 (3,021) EUR 2,000,000 (249)EUR 1,000,000 (14,975) EUR 1,000,000 1,046 EUR 2,000,000 666 EUR 2,000,000 (2,133) EUR 3,000,000
BarBNPP LoBNPP London 2BNPP London 20/0BNPP London 20/06/2Calyon Paris 20/03/2009Calyon Paris 20/03Calyon Paris 20/03/2009 CSFB London 20/12/2012 CSFB London 20/12/20CSFB LonCSFB London 20CSFB London 20
HSBC LHSBC London 2RBOS London 20/09/2012
RBOS London /20RBOS London 20/03/2009 SG Paris 20/06/2013 117,257
(124,297)
HSBC Global Investment Funds 73
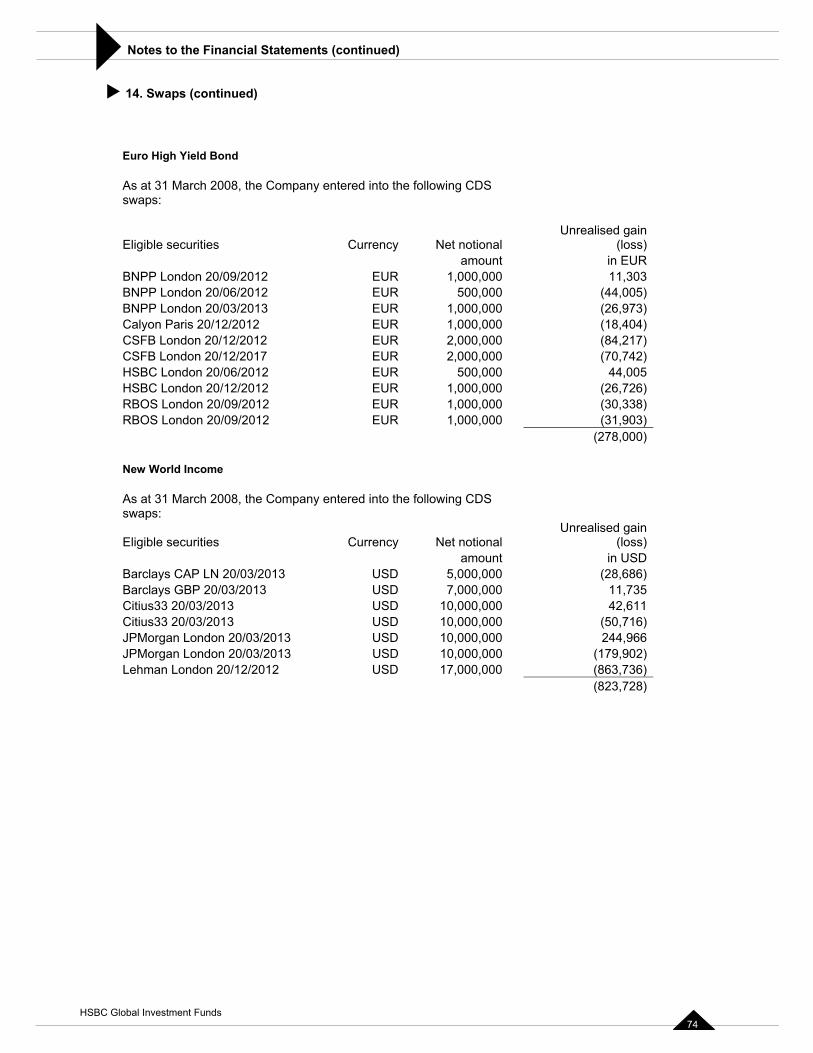
Notes to the Financial Statements (continued)�
)
08, the Company entered into the following
Curr Net notional Unrea in
ss) R
0/09/2012 1,000,00 030/06/2012 EUR ( 5)
13 1, 3)2/2012 1, 4)/12/2012 2, 7)/12/2017 2, ( 2) /06/2012 05/12/2012 1, 6)/09/2012 1, 8)/09/2012 1, 3)
0)
� 14. Swaps (continued
Euro High Yield Bond
As at 31 March 20 CDS swaps:
Eligible securities encylised ga
(loamount in EU
BNPP London 2 EUR 0 11,3BNPP London 2 500,000 44,00BNPP London 20/03/20 EUR 000,000 (26,97Calyon Paris 20/1 EUR 000,000 (18,40CSFB London 20 EUR 000,000 (84,21CSFB London 20 EUR 000,000 70,74HSBC London 20 EUR 500,000 44,0HSBC London 20 EUR 000,000 (26,72RBOS London 20 EUR 000,000 (30,33RBOS London 20 EUR 000,000 (31,90
(278,00
As at 31 March 2008, the Company entered into the following CDS swaps:
Eligible securities Currency Net notional Unrealised gain
(loss) amount in USDBarclays CAP LN 20/03/2013 USD 5,000,000 (28,686) Barclays GBP 20/03/2013 USD 7,000,000 11,735Citius33 20/03/2013 USD 10,000,000 42,611Citius33 20/03/2013 USD 10,000,000 (50,716) JPMorgan London 20/03/2013 USD 10,000,000 244,966 JPMorgan London 20/03/2013 USD 10,000,000 (179,902) Lehman London 20/12/2012 USD 17,000,000 (863,736)
(823,728)
New World Income
HSBC Global Investment Funds 74
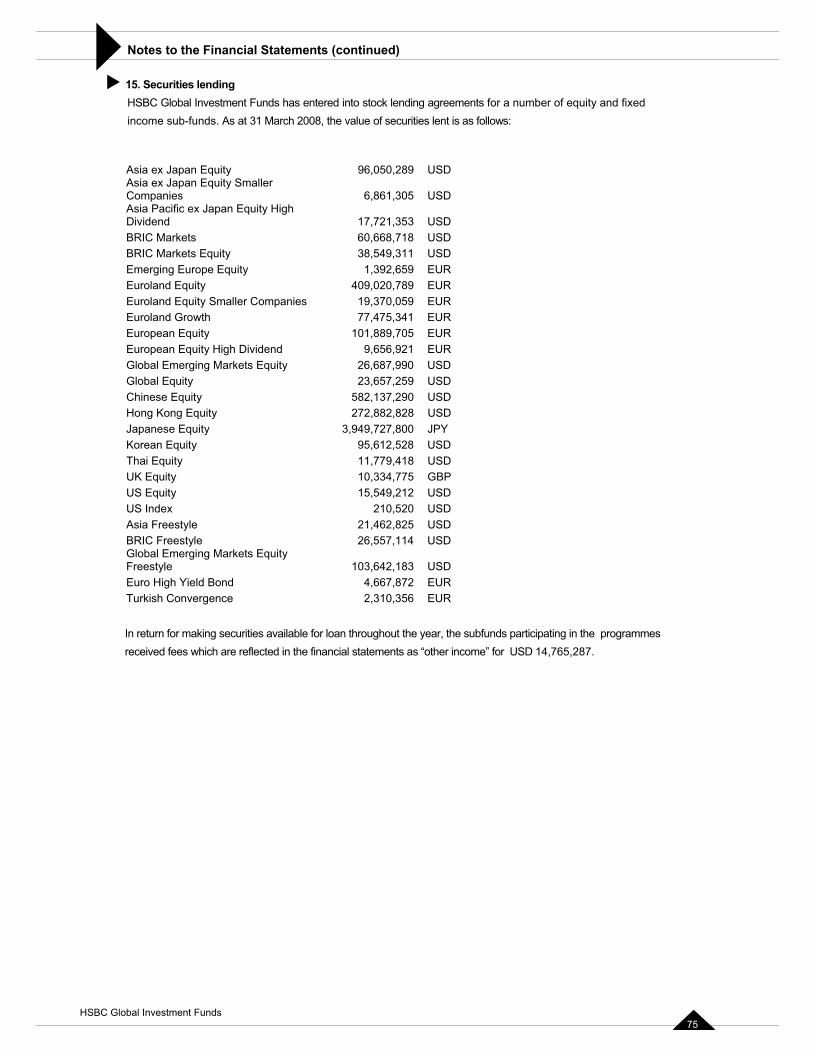
Notes to the Financial Statements (continued)�
g HSBC Global Investment Funds has entered into stock lending agreements for a number of equity and fixed income sub-funds. As at 31 March 2008, the ue of securities lent is as follows:
ex Japan Equity 96,050,289 USD Asia ex Japan Equity Smaller Companies 6,861,305 USD
Japan Equity High Dividend 17,721 SD
60,638,5
ity 1,3409,0
ompanies 19,377,47
101,8Dividend 9,6
Global Emerging Markets Equity 7,990 USD Global Equity 23,657,259 USD
582,137,290 USD USDJPY
Korean Equity 95,612,528 USD 11 SD10,3 BP15,5
21,26,
Equity 103,
Euro High Yield Bond 4,667,872 EUR Turkish Convergence 2,310,356 EUR
In return for making securities available for loan throughout the year, the subfunds participating in the programmes received fees which are reflected in the financial statements as “other income” for USD 14,765,287.
� 15. Securities lendin
val
Asia
Asia Pacific ex,353 U
BRIC Markets 68,718 USD BRIC Markets Equity
u49,311 USD
Emerging Europe Eq 92,659 EUR Euroland Equity 20,789 EUR Euroland Equity Smaller C 70,059 EUR Euroland Growth 5,341 EUR European Equity 89,705 EUR European Equity High 56,921 EUR
26,68
Chinese EquityHong Kong Equity 272,882,828 Japanese Equity 3,949,727,800
Thai Equity ,779,418 UUK Equity 34,775 GUS Equity 49,212 USD US Index 210,520 USD Asia Freestyle 462,825 USD BRIC Freestyle 557,114 USD Global Emerging Markets Freestyle 642,183 USD
HSBC Global Investment Funds 75
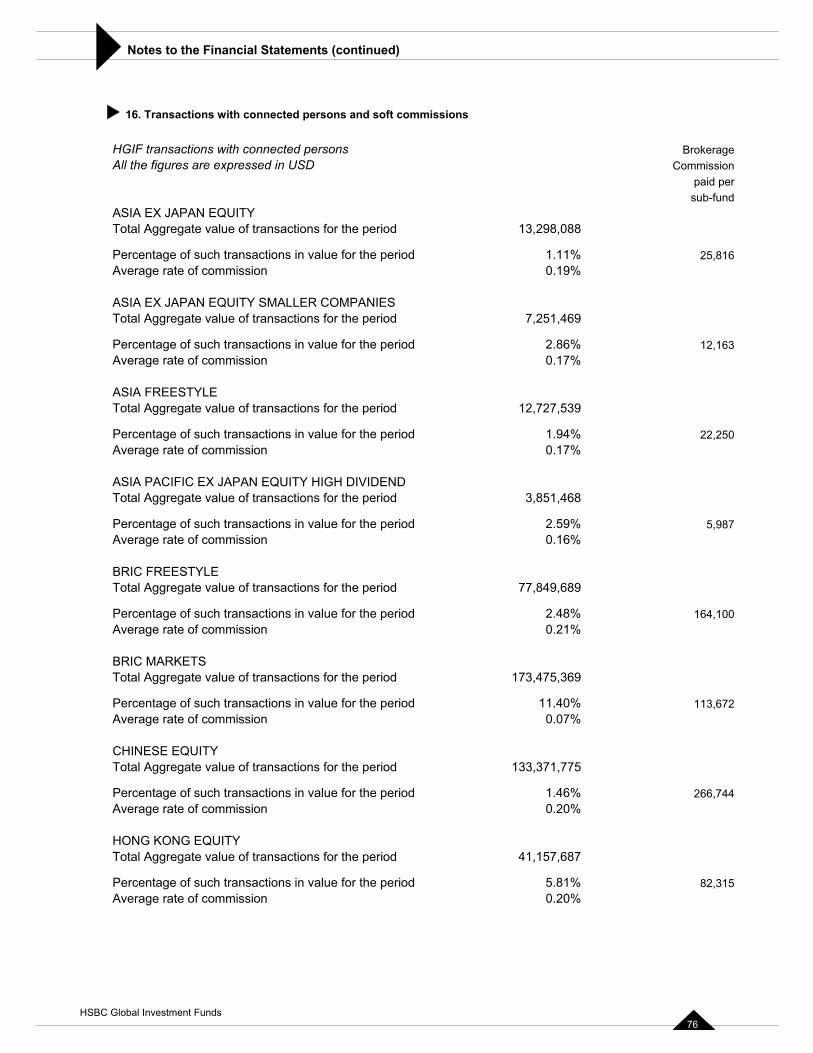
Notes to the Financial Statements (continued)�
� ransactions with connected persons and soft commissions
connected Brokerage ures are expressed in USD Commission
paid per sub-fund
EQUITY ue of transaction 13,298,088
ons in t riod 1.11% 25,816 of commission 0.19%
SMALLEgate value of transactio 7,251,469
sactions in t riod 2.86% 12,163 of commission 0.17%
ESTYLE gregate value of transactio 12,727,539
f such transactions in t riod 1.94% 22,250 of commission 0.17%
APAN EQUITY HIGH DIVIDEND alue of transaction 3,851,468
Percentage of such transactions in value for the period 2.59% 5,987%
BRIC FREESTYLE Total Aggregate value of transactions for the period 77,849,689
Percentage of such transactions in value for the period 2.48% 164,100 Average rate of commission 0.21%
BRIC MARKETS Total Aggregate value of transactions for the period 173,475,369
Percentage of such transactions in value for the period 11.40% 113,672 Average rate of commission 0.07%
CHINESE EQUITY Total Aggregate value of transactions for the period 133,371,775
Percentage of such transactions in value for the period 1.46% 266,744 Average rate of commission 0.20%
HONG KONG EQUITY Total Aggregate value of transactions for the period 41,157,687
Percentage of such transactions in value for the period 5.81% 82,315 Average rate of commission 0.20%
16. T
HGIF transactions with All the fig
persons
ASIA EX JAPANTotal Aggregate val s for the period
Percentage of such transacti value for he peAverage rate
ASIA EX JAPAN EQUITY R COMPANIESTotal Aggre ns for the period
Percentage of such tran value for he peAverage rate
ASIA FRETotal Ag ns for the period
Percentage o value for he peAverage rate
ASIA PACIFIC EX JTotal Aggregate v s for the period
Average rate of commission 0.16
HSBC Global Investment Funds 76
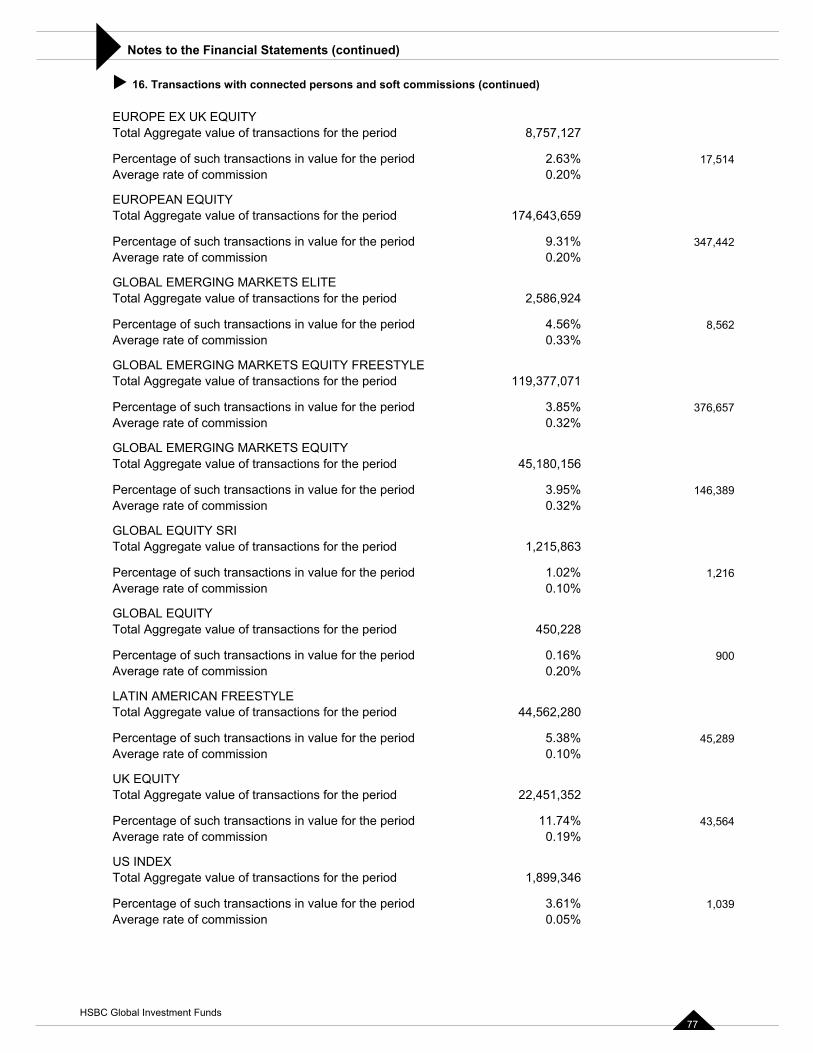
Notes to the Financial Statements (continued)�
� 16. Transactions with connected persons and soft commissions (continued)
ns for the period 8,757,12
Percentage of such transactions in value for the period 2.63% 17,514 mission 0.20%
period 174,643,659
Percentage of such transactions in value for the period 9.31% 347,442 0.20%
od 2,586,924
sactions in value for the period 4.56% 8,5620.33%
EESTYLEof transactions for the period 119,377,071
r the period 3.85% 376,657 0.32%
ns for the period 45,180,156
or the period 3.95% 146,389 Average rate of commission 0.32%
ate value of transactions for the period 1,215,863
or the period 1.02% 1,2160.10%
ns for the period 450,228
od 0.16% 9000.20%
LATIN AMERICAN FREESTYLE od 44,562,280
he period 5.38% 45,289 ission 0.10%
UK EQUITY Total Aggregate value of transactions for the period 22,451,352
Percentage of such transactions in value for the period 11.74% 43,564 Average rate of commission 0.19%
US INDEX Total Aggregate value of transactions for the period 1,899,346
Percentage of such transactions in value for the period 3.61% 1,039Average rate of commission 0.05%
EUROPE EX UK EQUITY sactioTotal Aggregate value of tran 7
Average rate of com
EUROPEAN EQUITY Total Aggregate value of transactions for the
Average rate of commission
GLOBAL EMERGING MARKETS ELITE of transactions for the periTotal Aggregate value
Percentage of such tranAverage rate of commission
GLOBAL EMERGING MARKETS EQUITY FRTotal Aggregate value
Percentage of such transactions in value foAverage rate of commission
GLOBAL EMERGINGTotal Aggregate value of transactio
MARKETS EQUITY
Percentage of such transactions in value f
GLOBAL EQUITY SRITotal Aggreg
Percentage of such transactions in value fAverage rate of commission
GLOBAL EQUITY Total Aggregate value of transactio
Percentage of such transactions in value for the periAverage rate of commission
Total Aggregate value of transactions for the peri
Percentage of such transactions in value for tAverage rate of comm
HSBC Global Investment Funds 77
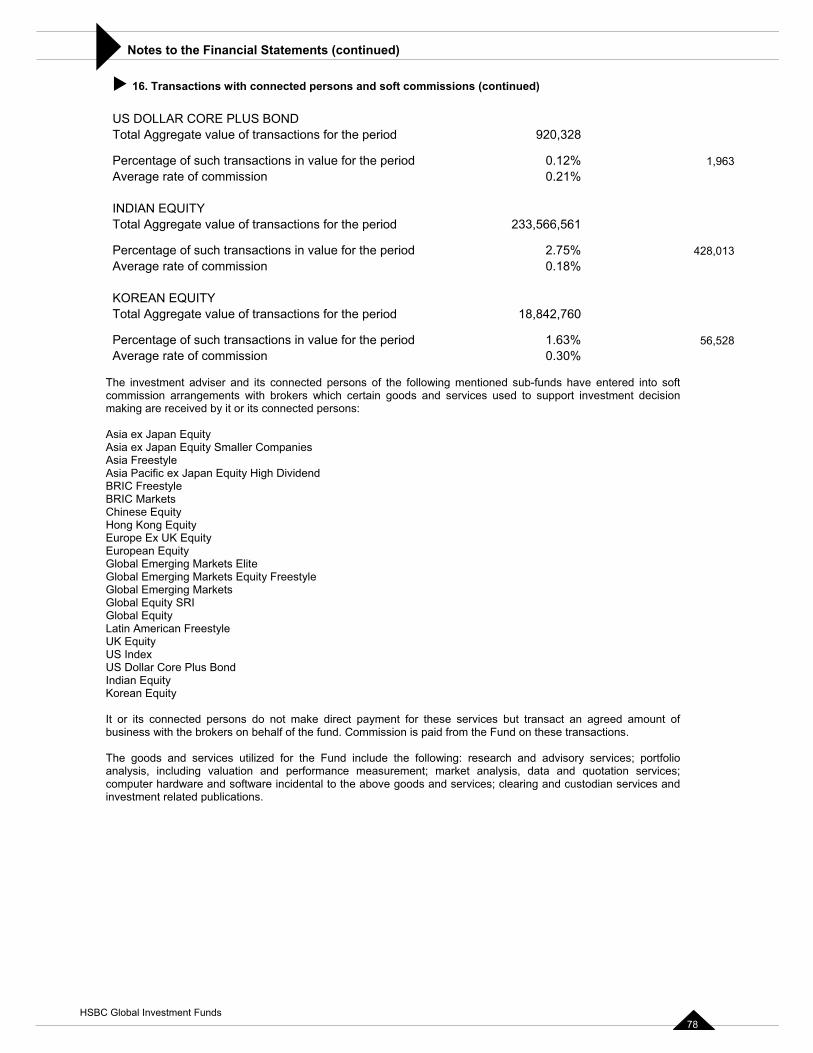
Notes to the Financial Statements (continued)�
� 16. Transactions with connected persons and soft commissions (continued)
period 920,328
ch transactions in value for the period 0.12% 1,9630.21%
ns for the period 233,566,561
or the period 2.75% 428,013 0.18%
eriod 18,842,760
he period 1.63% 56,528 ission 0.30%
of the followin d sub-funds have enter d into soft certain goods and sed to support investme ion
Smaller Companies
Elite y Freestyle
nnected persons do not make direct payment for these services but transact an agreed amount of Commission is paid und on these transaction
clude the following: ch and advisory sion and performance measurement; mark ysis, data and quotatio services; oftware incidental to the above goods and ser earing and custodian services and
investment related publications.
US DOLLAR CORE PLUS BOND Total Aggregate value of transactions for the
Percentage of suAverage rate of commission
INDIAN EQUITY Total Aggregate value of transactio
Percentage of such transactions in value fAverage rate of commission
KOREAN EQUITY he pTotal Aggregate value of transactions for t
Percentage of such transactions in value for tAverage rate of comm
The investment adviser and its connected personscommission arrangements with brokers which
g mentione services u
ent decis
making are received by it or its connected persons:
Asia ex Japan Equity Asia ex Japan EquityAsia Freestyle Asia Pacific ex Japan Equity High Dividend BRIC Freestyle BRIC Markets Chinese Equity Hong Kong Equity Europe Ex UK Equity European Equity Global Emerging Markets Global Emerging Markets EquitGlobal Emerging Markets Global Equity SRI Global Equity Latin American Freestyle UK Equity US Index US Dollar Core Plus Bond Indian Equity Korean Equity
It or its cobusiness with the brokers on behalf of the fund. from the F s.
The goods and services utilized for the Fund in resear ervices; portfolioanalysis, including valuatcomputer hardware and s
et analvices; cl
n
HSBC Global Investment Funds 78
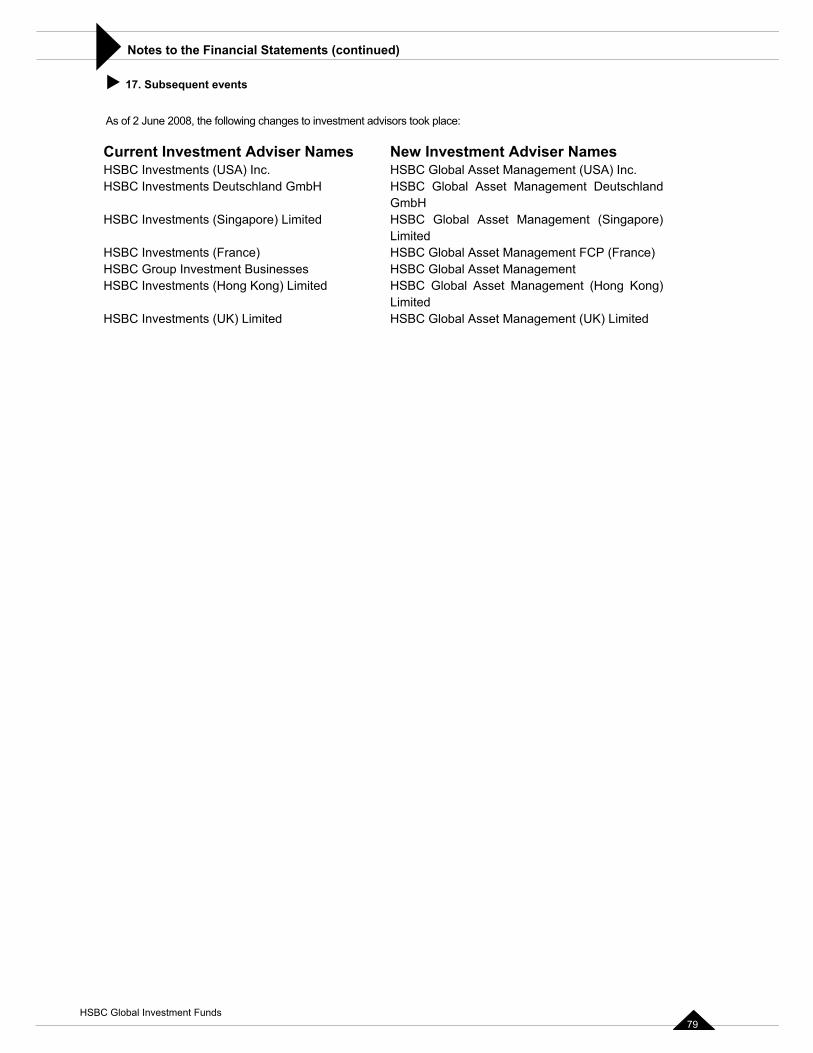
Notes to the Financial Statements (continued)�
� 17. Subsequent events
ent advisors took place
t Adviser Names New Investment Adviser Names ents (USA) Inc. HSBC Global Asset Management (USA) I .
HSBC t Management Deutschland GmbHHSBC Globa et Management (Singapore) Limited
nts (France) HSBC Global Asset Management FCP (France) HSBC G Management HSBC Globa t Management ( ong) Limited
K) Limited
70
As of 2 June 2008, the following changes to investm :
Current InvestmenHSBC Investm ncHSBC Investments Deutschland GmbH Global Asse
HSBC Investments (Singapore) Limited l Ass
HSBC InvestmeHSBC Group Investment Businesses lobal AssetHSBC Investments (Hong Kong) Limited l Asse Hong K
HSBC Investments (UK) Limited HSBC Global Asset Management (U
HSBC Global Investment Funds 79
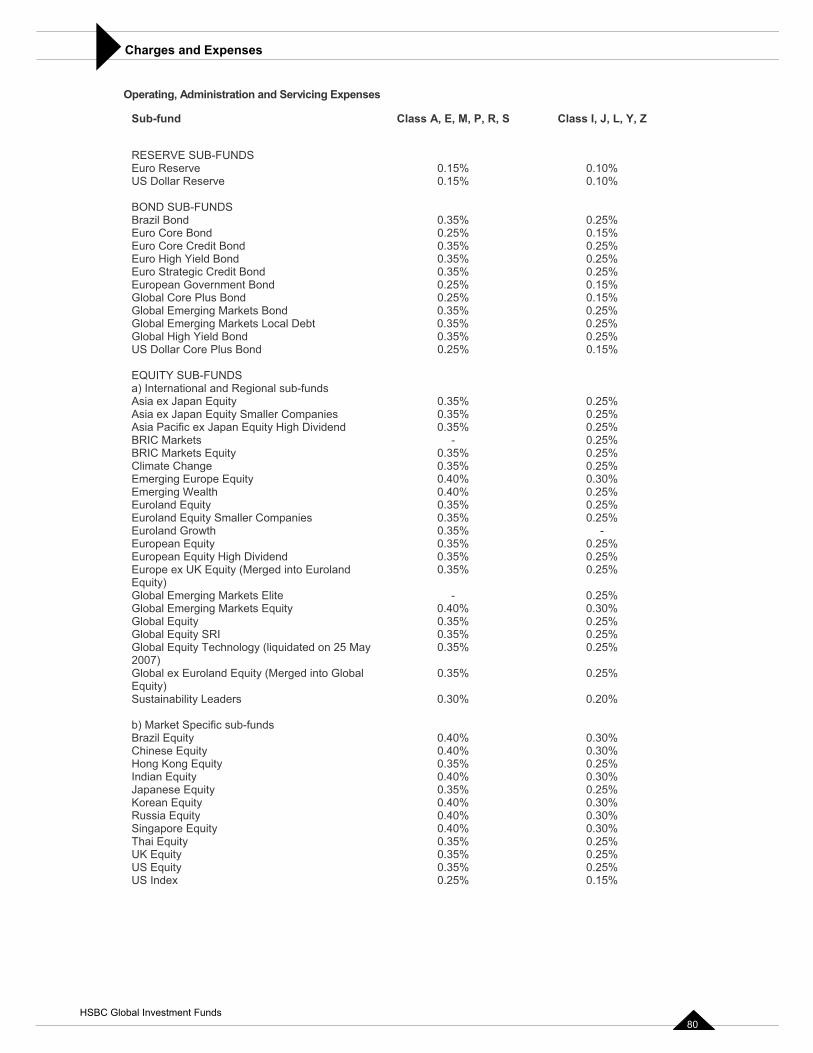
Charges and Expenses ��Class I, J, L, Y, Z
Euro Reserve 0.15% 0.10%0.10%
0.25%0.15%0.25%0.25%
nd 0.25%European Government Bond 0.25% 0.15%Global Core Plus Bond 0.25% 0.15%Global Emerging Markets Bond 0.35% 0.25%Global Emerging Markets Local Debt 0.35% 0.25%Global High Yield Bond 0.35% 0.25%US Dollar Core Plus Bond 0.25% 0.15%
EQUITY SUB-FUNDS a) International and Regional sub-funds Asia ex Japan Equity 0.35% 0.25%Asia ex Japan Equity Smaller Companies 0.35% 0.25%Asia Pacific ex Japan Equity High Dividend 0.35% 0.25%BRIC Markets - 0.25%BRIC Markets Equity 0.35% 0.25%Climate Change 0.35% 0.25%Emerging Europe Equity 0.40% 0.30%Emerging Wealth 0.40% 0.25%Euroland Equity 0.35% 0.25%Euroland Equity Smaller Companies 0.35% 0.25%Euroland Growth 0.35% -European Equity 0.35% 0.25%European Equity High Dividend 0.35% 0.25%Europe ex UK Equity (Merged into Euroland Equity)
0.35% 0.25%
Global Emerging Markets Elite - 0.25%Global Emerging Markets Equity 0.40% 0.30%Global Equity 0.35% 0.25%Global Equity SRI 0.35% 0.25%Global Equity Technology (liquidated on 25 May 2007)
0.35% 0.25%
Global ex Euroland Equity (Merged into Global Equity)
0.35% 0.25%
Sustainability Leaders 0.30% 0.20%
b) Market Specific sub-funds Brazil Equity 0.40% 0.30%Chinese Equity 0.40% 0.30%Hong Kong Equity 0.35% 0.25%Indian Equity 0.40% 0.30%Japanese Equity 0.35% 0.25%Korean Equity 0.40% 0.30%Russia Equity 0.40% 0.30%Singapore Equity 0.40% 0.30%Thai Equity 0.35% 0.25%UK Equity 0.35% 0.25%US Equity 0.35% 0.25%US Index 0.25% 0.15%
Operating, Administration and Servicing Expenses
Sub-fund Class A, E, M, P, R, S
RESERVE SUB-FUNDS
US Dollar Reserve 0.15%
BOND SUB-FUNDSBrazil Bond 0.35%Euro Core Bond Euro Core Credit Bond
0.25%0.35%
Euro High Yield Bond Euro Strategic Credit Bo
0.35%0.35%
HSBC Global Investment Funds 80
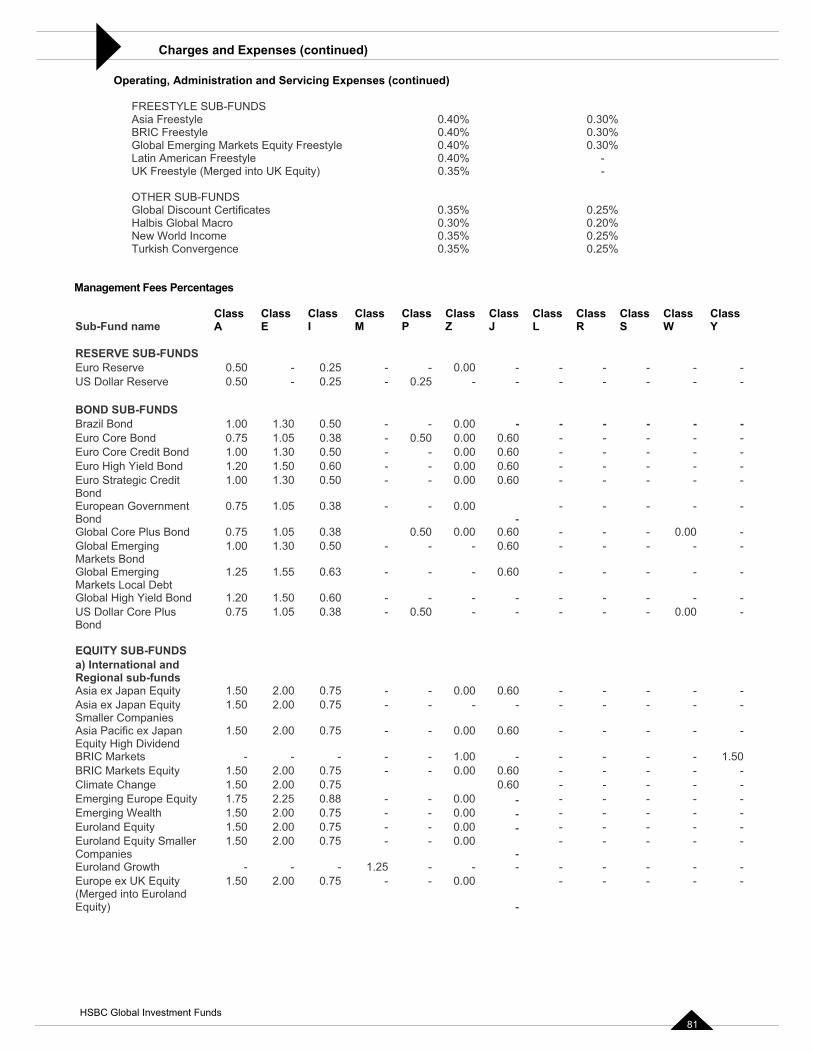
Charges and Expenses (continued)�
enses (continued)
TYLE SUB-FUNDS Asia Freestyle 0.40% 0.30%
0.40% 0.30%ing Markets Equity Freestyle 0.40% 0.30%n Freestyle 0.40% -
erged into UK Equity) 0.35% -
-FUNDSertificates 0.35% 0.25%
0.30% 0.20%0.35% 0.25%0.35% 0.25%
Manage
Sub-FuClass Class
IClassM
ClassP
ClassZ
ClassJ
ClassL
ClassR
ClassS
ClassW
ClassY
RESER Euro Re 0.25 - 0.00 - - - - - - US Doll 0.50 - 0.25 0.25 - - - - - - -
BOND S Brazil B 1.00 1.30 0.50 - 0.00 - - - - - Euro Co 0.38 0.50 0.00 0 - - - - - Euro Co 1.00 1.30 0.50 - 0.00 0.60 - - - - - Euro Hi 1.50 0.60 - 0.00 0.60 - - - - - Euro StBond
0.50 - 0.00 0.60 - - - - -
EuropeaBond
1.05 0.38 - 0.00 - - - - -
Global C 0.75 1.05 0.38 0.50 0.00 0.60 - - - 0.00 - Global EMarkets Bond
.50 - - 0.60 - - - - -
Global EMarkets
0.63 - - 0.60 - - - - -
Global H 1.20 1.50 0.60 - - - - - - - US DollBond
1.05 0.38 - 0.50 - - - - - 0.00 -
EQUITY a) InterRegion
Asia ex 1.50 2.00 0.75 - 0.00 0.60 - - - - - Asia ex Smaller
1.50 2.00 0.75 - - - - - - -
Asia Pa an Equity H nd
1.50 2.00 0.75 - 0.00 0.60 - - - - -
BRIC Markets - - - - - 1.00 - - - - - 1.50 BRIC Markets Equity 1.50 2.00 0.75 - - 0.00 0.60 - - - - - Climate Change 1.50 2.00 0.75 0.60 - - - - - Emerging Europe Equity 1.75 2.25 0.88 - - 0.00 - - - - - - Emerging Wealth 1.50 2.00 0.75 - - 0.00 - - - - - - Euroland Equity 1.50 2.00 0.75 - - 0.00 - - - - - - Euroland Equity Smaller Companies
1.50 2.00 0.75 - - 0.00 -
- - - - -
Euroland Growth - - - 1.25 - - - - - - - - Europe ex UK Equity (Merged into Euroland Equity)
1.50 2.00 0.75 - - 0.00
-
- - - - -
Operating, Administration and Servicing Exp
FREES
BRIC Freestyle Global EmergLatin AmericaUK Freestyle (M
OTHER SUBGlobal Discount CHalbis Global MacroNew World Income
nce Turkish Converge
ment Fees Percentages
nd name A EClass
VE SUB-FUNDS serve 0.50 - -
ar Reserve -
UB-FUNDS ond - -re Bond 0.75 1.05 - .60re Credit Bond -
gh Yield Bond 1.20 -rategic Credit 1.00 1.30 -
n Government 0.75 --
ore Plus Bond merging 1.00 1.30 0 -
merging Local D
1.25 1.55 ebt
gh Yield Bond
-
i - -ar Core Plus 0.75
SUB-FUNDSnational and al sub-funds Japan Equity -Japan Equity Companies
- -
cific ex Japeigh Divid
-
HSBC Global Investment Funds 81
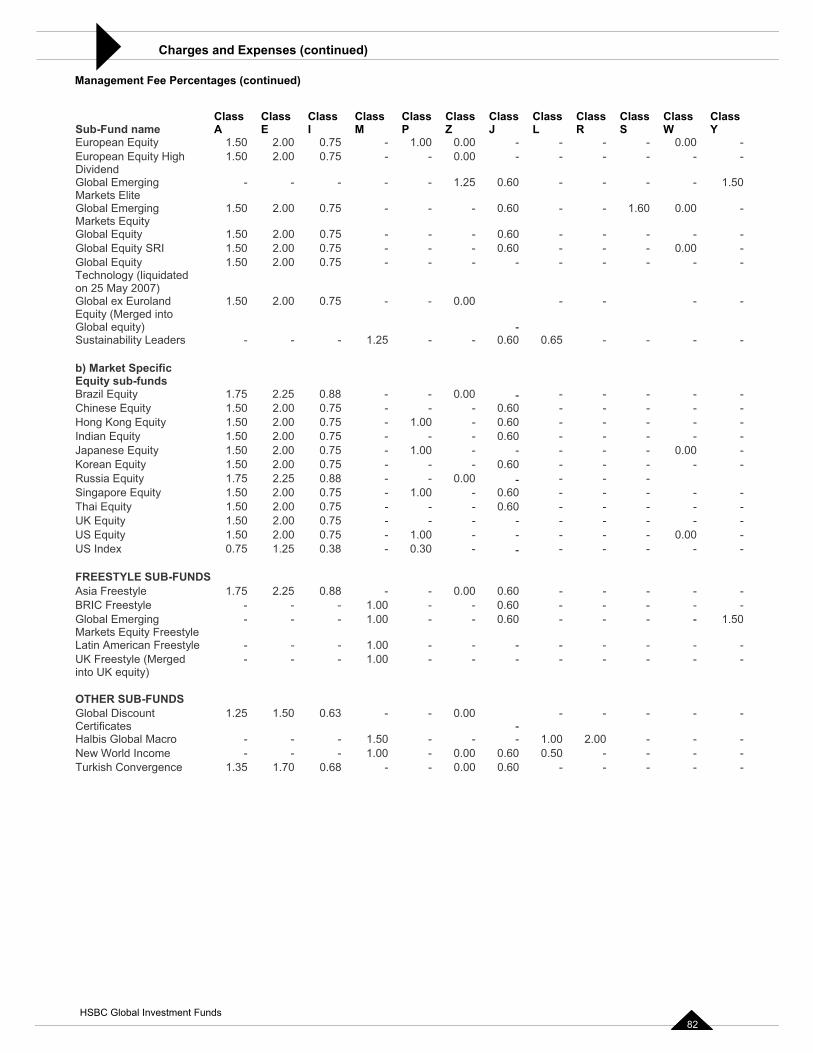
Charges and Expenses (continued)�
Manag s (continued)
Sub-Fu EClassI
CM
ClassP
ClassZ J
ClassL
ClassR
ClassS
ClassW
ClassY
Europe 2.00 0.75 1.00 0.00 - - - - 0.00 - EuropeDividen
1.50 2.00 0.75 - - 0.00 - - - - - -
Global Markets
- - - - 1.25 - - - - 1.50
Global Markets Equity
1.50 2.00 0.75 - - - - 1.60 0.00 -
1.50 2.00 0.75 - - - 0.60 - - - - - SRI 0.00 -
iquid0 .7 - - - -
uroland into
1.50 2.00 0.75 0
-
- - - -
aders - - 1.25 - - - -
cs
0 - - - - - - 75 - - 60 - - - - -
1.50 1.00 - - - 75 - 60 - - - -
ity 75 - 0.00 - 75 - - - 60 - - - - -
1.75 2.25 0.88 - - 0.00 - - - - 75 - 1.00 - 60 - - - -
1.50 - - - - - UK Equity 1.50 2.00 - - - - - - - - -
1.50 2.00 - 1.00 - - - - - 0.00 - 0.75 1. - 0.30 - - - - - - -
-FU
88 0.00 60 - - - - - - - 1.00 - - - -
rging reesty
- - 1.00 - - 60 - - - 1.50
y - - 1.00 - - - - - - - ed
) - - 1.00 - - - - - - - -
-FUNDS
0 -
- - - - -
- - - 1.50 - - - 1.00 2.00 - - - New World Income - - - 1.00 - 0.00 0.60 0.50 - - - - Turkish Convergence 1.35 1.70 0.68 - - 0.00 0.60 - - - - -
ement Fee Percentage
nd name AClass Class lass Class
an Equity 1.50 -an Equity High dEmerging Elite
- 0.60
Emerging - 0.60
Global Equity Global Equity 1.50
1.502.002.0
0.75 0
- - - -
0.60 - - - Global Equity Technology (l ated on 25 May 2007)
5 - - - -
Global ex E -Equity (MergedGlobal equity) Sustainability Le
- .00
- 0.60 0.65 - -
b) Market SpecifiEquity sub-fundBrazil Equity 1.75 2.25 0.88 - - .00Chinese Equity Hong Kong Equity
1.50 2.002.00
0.0.75
--
0.0.60 - - -
Indian Equity 1.50 2.00 0. - - 0. -Japanese Equ 1.50 2.00 0. 1.00 - - - - - Korean EquityRussia Equity
1.50 2.00 0. 0.
Singapore Equity 1.50 2.00 0. 0. -Thai Equity 2.00 0.75 0.60 - - -
0.75US Equity 0.75US Index 25 0.38
FREESTYLE SUB NDSAsia Freestyle BRIC Freestyle
1.75-
2.25 0. - - 0.0.60 - - -
Global EmeMarkets Equity F le
- 0. -
Latin American Freest(Merg
le - -UK Freestyle
yinto UK equit-
OTHER SUBGlobal Discount CertificatesHalbis Global Macro
1.25 1.50 0.63 - - .00
HSBC Global Investment Funds 82
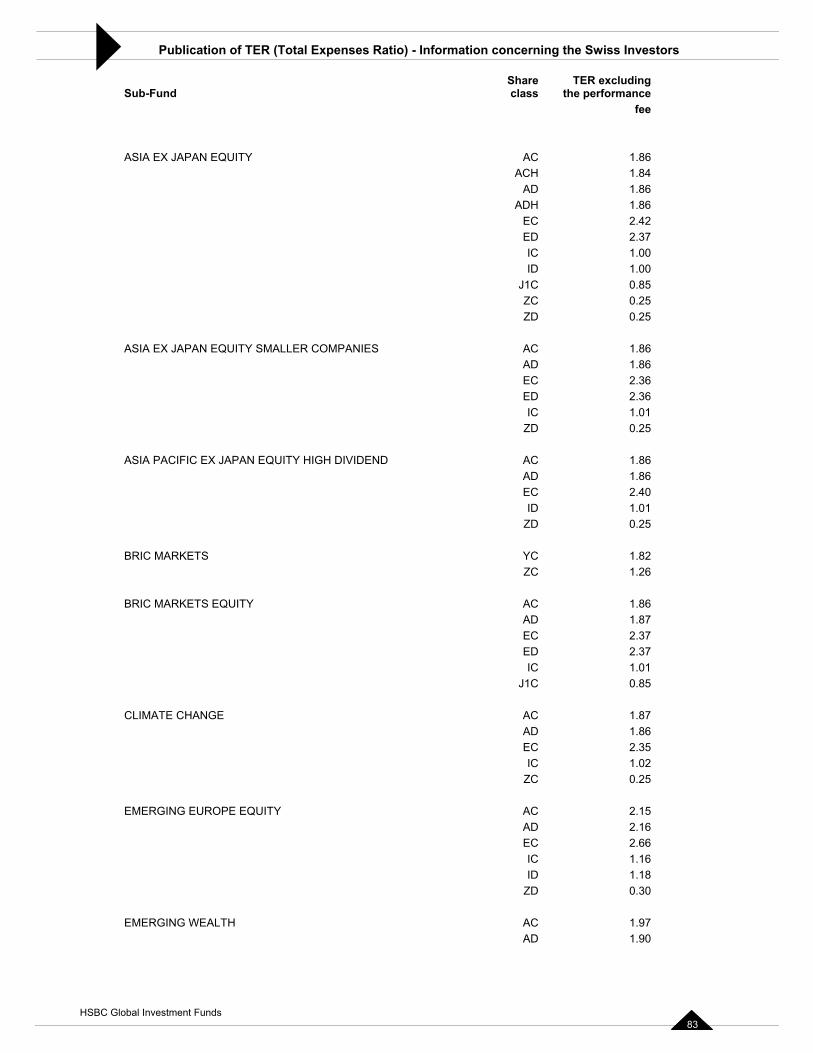
Publication of TER (Total Expenses Ratio) - Information concerning the Swiss Investors
Sub-Fund Share TER excluding
mance
JAPAN EQUIT AC 1.86ACH 1.84
AD 1.86 ADH 1.86
EC 2.42 ED 2.37 IC 1.00 ID 1.00
J1C 0.85 ZCZ
EX JAP Q SM ER C MP S A 1.86AD 1.86 EC 2.36 ED 2.36 IC 1.01
Z
ASIA PACIFIC EX JAPAN EQUITY HIGH DIVIDEND AC 1.86AD 1.86 EC 2.40 ID 1.01
Z
IC MARKETS YC 1.82ZC
ARKETS QUIT A 1.86AD 1.87 EC 2.37 ED 2.37 IC 1.01
J1C 0.85
CLIMATE CHANGE AC 1.87AD 1.86 EC 2.35 IC 1.02
ZC 0.25
EMERGING EUROPE EQUITY AC 2.15AD 2.16 EC 2.66 IC 1.16 ID 1.18
ZD 0.30
EMERGING WEALTH AC 1.97AD 1.90
class the perfor fee
ASIA EX Y
0.25 D 0.25
ASIA AN E UITY ALL O ANIE C
D 0.25
D 0.25
BR 1.26
BRIC M E Y C
HSBC Global Investment Funds 83
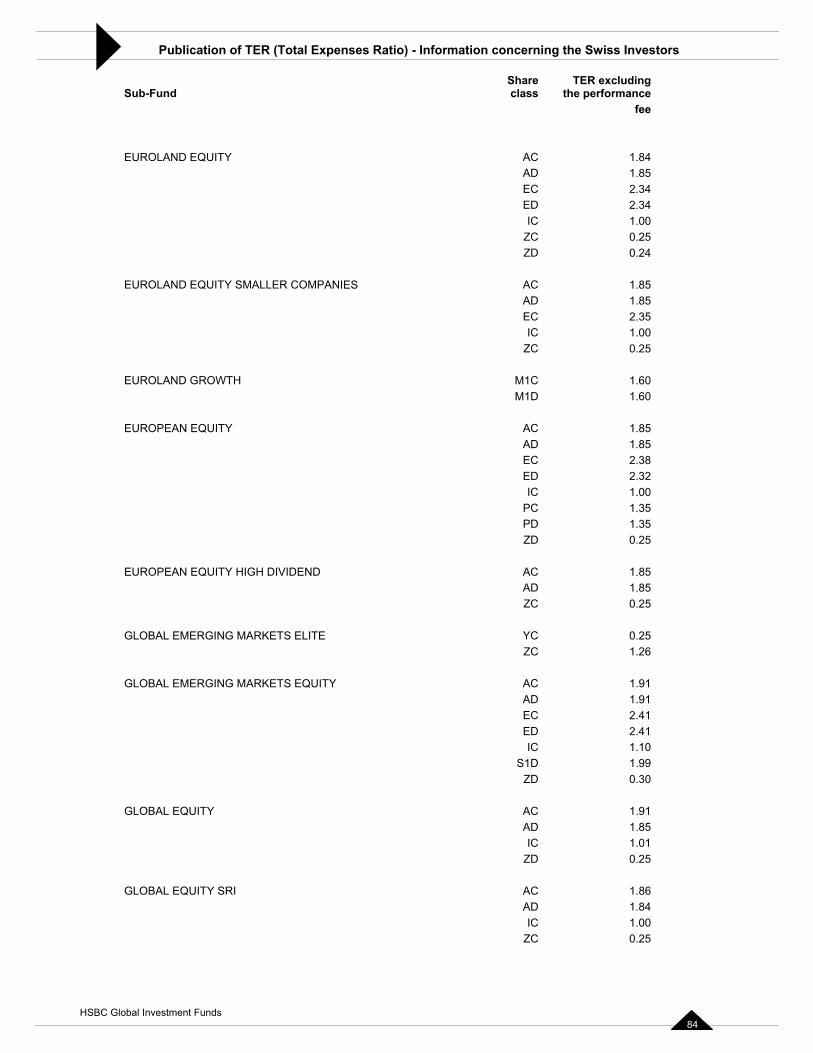
Publication of TER (Total Expenses Ratio) - Information concerning the Swiss Investors
Sub-Fund claTER excluding
the performance fee
EUROLAND EQUITY 1.841.852.342.341.000.250.24
ANIES 1.851.852.351.000.25
M 1.60M1D 1.60
EUROPEAN EQUITY 1.85AD 1.85
2.38
1.001.351.350.25
EUROPEAN EQUITY HIGH DIVIDEND AC 1.851.850.25
GLOBAL EMERGING MARKETS ELITE 0.25ZC 1.26
GLOBAL EMERGING MARKETS EQUITY 1.911.912.412.41
ZD 0.30
GLOBAL EQUITY AC 1.91AD 1.85 IC 1.01
ZD 0.25
GLOBAL EQUITY SRI AC 1.86AD 1.84 IC 1.00
ZC 0.25
Share ss
ACADECEDIC
ZC ZD
EUROLAND EQUITY SMALLER COMP ACADECIC
ZC
EUROLAND GROWTH 1C
AC
ECED 2.32 IC
PCPDZD
ADZC
YC
ACADECEDIC 1.10
S1D 1.99
HSBC Global Investment Funds 84
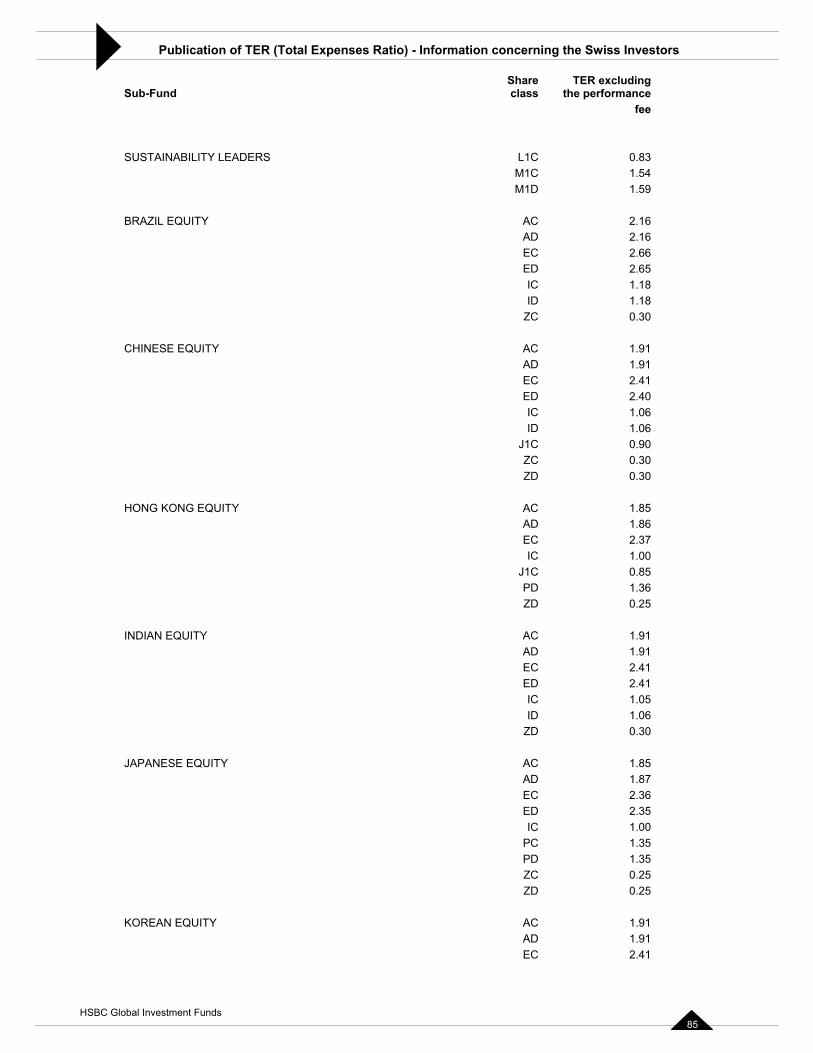
Publication of TER (Total Expenses Ratio) - Information concerning the Swiss Investors
Sub-Fund claTER excluding
the performance fee
SUSTAINABILITY LEADERS 0.83M1C 1.54 M1D 1.59
BRAZIL EQUITY AC 2.162.162.662.651.18
ID 1.18 0.30
ITY 1.911.912.412.401.061.060.900.300.30
HONG KONG EQUITY AC 1.851.86
1.000.851.360.25
INDIAN EQUITY 1.91AD 1.91
2.412.411.05
ID 1.06 0.30
JAPANESE EQUITY 1.85AD 1.87 EC 2.36 ED 2.35 IC 1.00
PC 1.35 PD 1.35 ZC 0.25 ZD 0.25
KOREAN EQUITY AC 1.91AD 1.91 EC 2.41
Share ss
L1C
ADECEDIC
ZC
CHINESE EQU ACADECEDICID
J1CZCZD
ADEC 2.37 IC
J1CPDZD
AC
ECEDIC
ZD
AC
HSBC Global Investment Funds 85
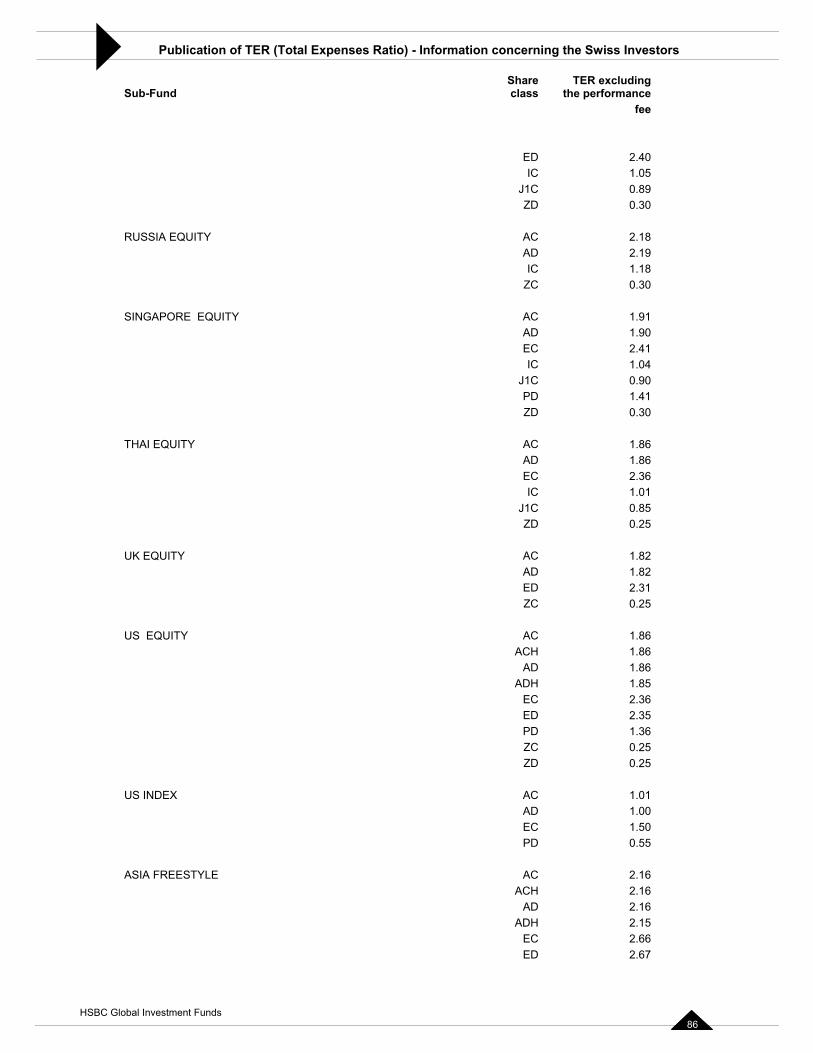
Publication of TER (Total Expenses Ratio) - Information concerning the Swiss Investors
Sub-Fund claTER excluding
the performance fee
2.40
0.890.30
RUSSIA EQUITY 2.182.19
IC 1.18 0.30
SINGAPORE EQUITY 1.911.902.411.040.90
0.30
THAI EQUITY 1.861.862.361.01
J1C 0.85 0.25
UK EQUITY 1.821.822.310.25
US EQUITY 1.86ACH 1.86
1.86ADH 1.85
2.362.351.360.250.25
US INDEX AC 1.01AD 1.00 EC 1.50 PD 0.55
ASIA FREESTYLE AC 2.16ACH 2.16
AD 2.16 ADH 2.15
EC 2.66 ED 2.67
Share ss
EDIC 1.05
J1CZD
ACAD
ZC
ACADECIC
J1CPD 1.41 ZD
ACADECIC
ZD
ACADEDZC
AC
AD
ECEDPDZCZD
HSBC Global Investment Funds 86
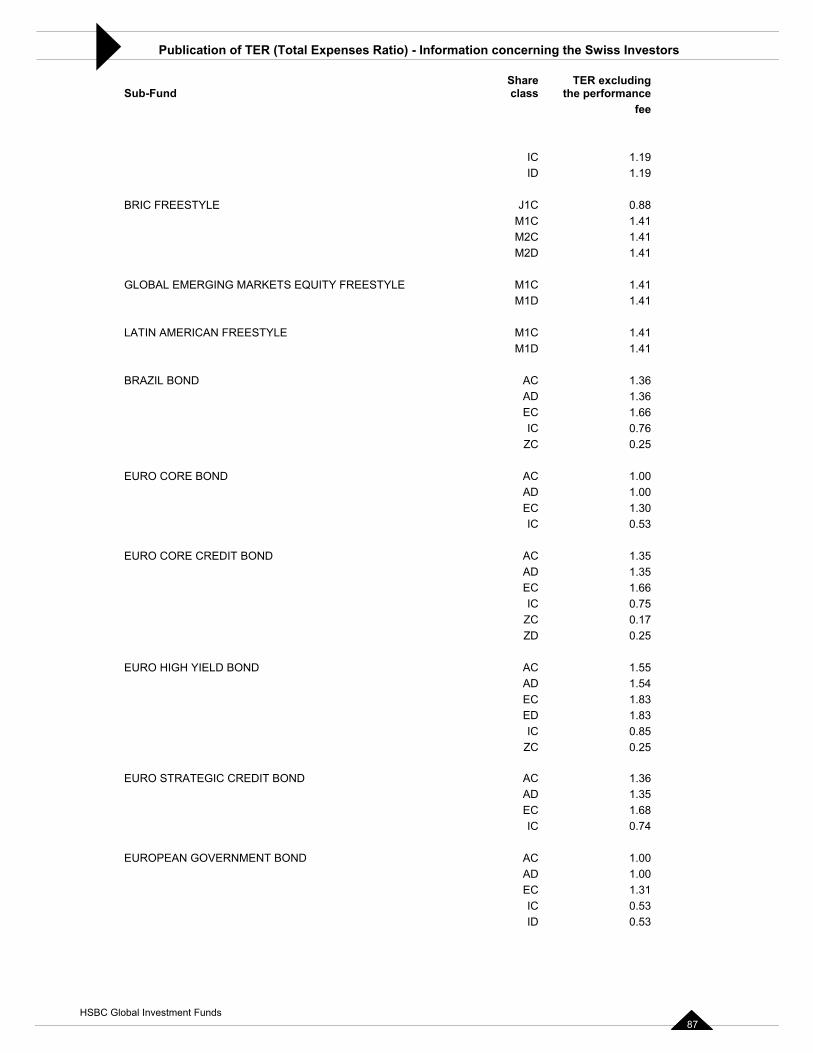
Publication of TER (Total Expenses Ratio) - Information concerning the Swiss Investors
Sub-Fund claTER excluding
the performance fee
1.191.19
BRIC FREESTYLE 0.88M1C 1.41 M2C 1.41 M2D 1.41
GLOBAL EMERGING MARKETS EQUITY FREESTYLE M 1.41M1D 1.41
LATIN AMERICAN FREESTYLE M 1.41M1D 1.41
BRAZIL BOND 1.361.361.660.76
ZC 0.25
EURO CORE BOND 1.001.00
EC 1.30 0.53
EURO CORE CREDIT BOND 1.351.351.660.750.17
ZD 0.25
EURO HIGH YIELD BOND 1.551.54
EC 1.83 1.830.850.25
EURO STRATEGIC CREDIT BOND 1.36AD 1.35 EC 1.68 IC 0.74
EUROPEAN GOVERNMENT BOND AC 1.00AD 1.00 EC 1.31 IC 0.53 ID 0.53
Share ss
ICID
J1C
1C
1C
ACADECIC
ACAD
IC
ACADECIC
ZC
ACAD
EDIC
ZC
AC
HSBC Global Investment Funds 87
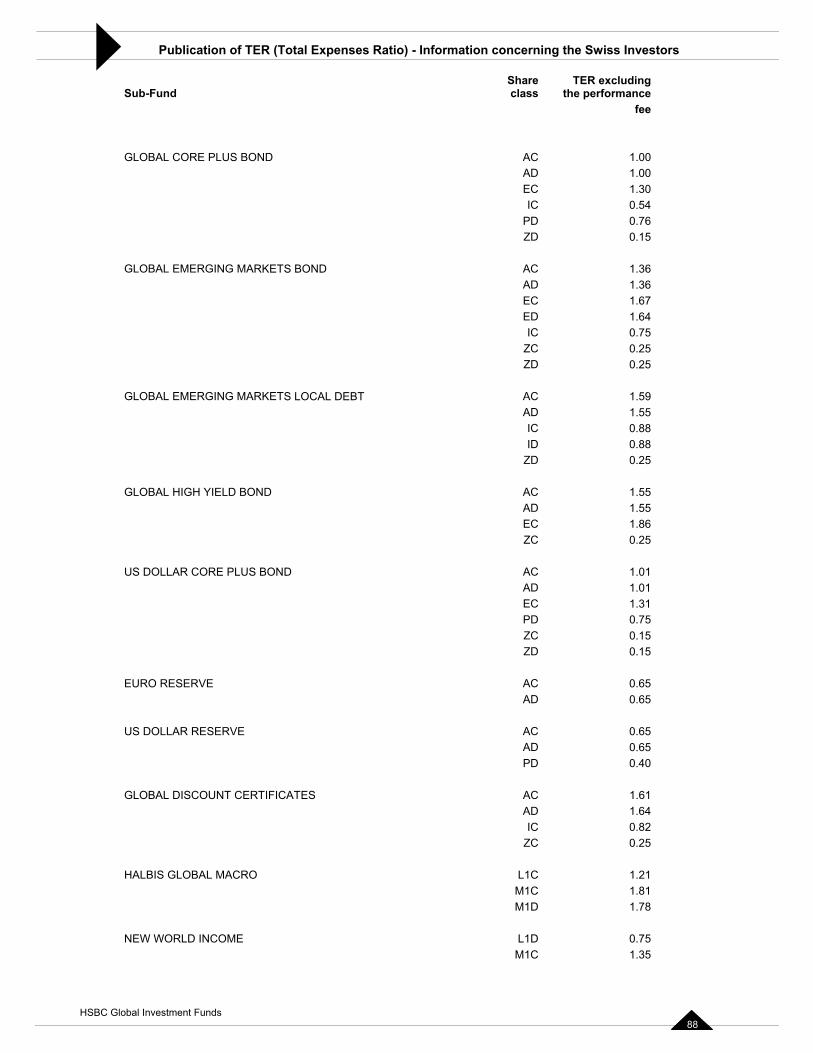
Publication of TER (Total Expenses Ratio) - Information concerning the Swiss Investors
Sub-Fund claTER excluding
the performance fee
GLOBAL CORE PLUS BOND AC 1.001.001.300.54
PD 0.76 0.15
RKETS BOND 1.361.36
EC 1.67 1.640.750.250.25
S LOCAL DEBT 1.591.550.88
ID 0.88 0.25
GLOBAL HIGH YIELD BOND 1.551.551.860.25
US DOLLAR CORE PLUS BOND 1.011.011.31
0.150.15
EURO RESERVE 0.650.65
US DOLLAR RESERVE 0.650.65
PD 0.40
GLOBAL DISCOUNT CERTIFICATES AC 1.61AD 1.64 IC 0.82
ZC 0.25
HALBIS GLOBAL MACRO L1C 1.21M1C 1.81 M1D 1.78
NEW WORLD INCOME L1D 0.75M1C 1.35
Share ss
ADECIC
ZD
GLOBAL EMERGING MA ACAD
EDIC
ZC ZD
GLOBAL EMERGING MARKET ACADIC
ZD
ACADECZC
ACADECPD 0.75 ZC ZD
ACAD
ACAD
HSBC Global Investment Funds 88
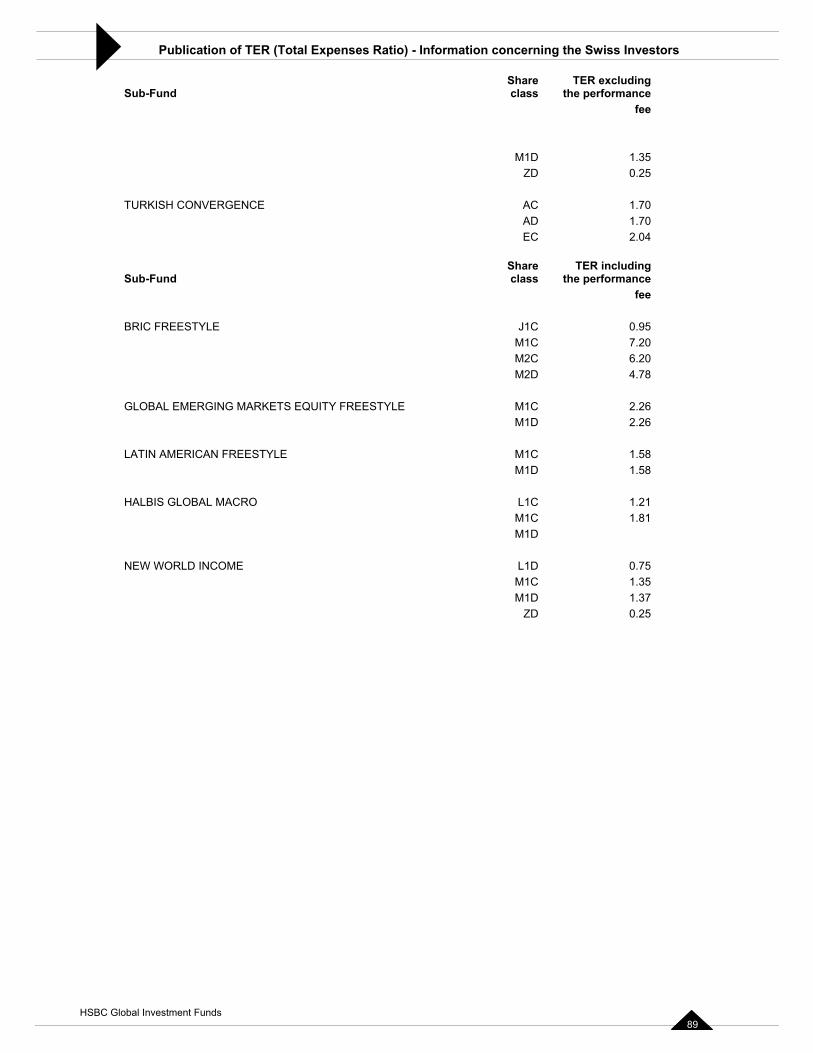
Publication of TER (Total Expenses Ratio) - Information concerning the Swiss Investors
Sub-Fund claTER excluding
the performance fee
M1D 1.35 0.25
TURKISH CONVERGENCE AC 1.701.702.04
Sub-FundShc
TER including the performance
fee
0.95M1C 7.20 M2C 6.20 M2D 4.78
MARKETS EQUITY FREESTYLE M 2.26M1D 2.26
LATIN AMERICAN FREESTYLE M1C 1.58M1D 1.58
HALBIS GLOBAL MACRO 1.21M1C 1.81 M1D
0.75M1C 1.35 M1D 1.37
0.25
Share ss
ZD
ADEC
arelass
BRIC FREESTYLE J1C
GLOBAL EMERGING 1C
L1C
NEW WORLD INCOME L1D
ZD
HSBC Global Investment Funds 89
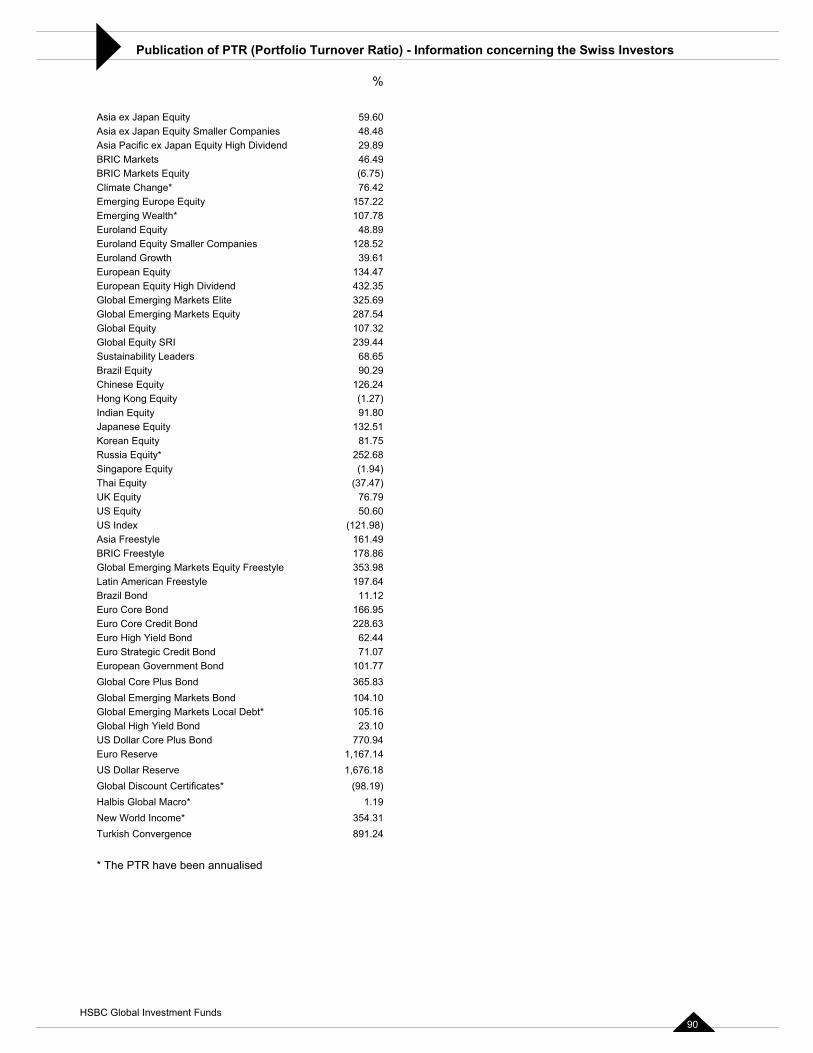
Publication of PTR (Portfolio Turnover Ratio) - Information concerning the Swiss Investors�
%
Asia ex Japan Equity 59.60Asia ex Japan Equity Smaller Companies 48.48Asia Pacific ex Japan Equity High Dividend 29.89BRIC Markets 46.49BR (6.75)Climate Change* 76.42Emerging Europe Equity 157.22Emerging Wealth* 107.78Euroland Equity 48.89Euroland Equity Smaller Companies 128.52Euroland Gro 39.61Eu 134.47European Equity High Dividend 432.35Global Emerging Markets Elite 325.69Global Emerging Markets Equity 287.54Gl 107.32Global Equity SRI 239.44Sustainability Leaders 68.65Br 90.29Chinese Equity 126.24Hong Kong Equity (1.27)In 91.80Japanese Equity 132.51Korean Equity 81.75Russia Equity 252.68Singapore Equit (1.94)Thai Equity (37.47)UK Equity 76.79US Equit 50.60US Index (121.98) Asia Freestyle 161.49BRIC Freestyle 178.86Global Emerging Markets Equity Freestyle 353.98Latin American Freestyle 197.64Brazil Bond 11.12Euro Core Bond 166.95Euro Core Credit Bond 228.63Euro High Yield Bond 62.44Euro Strategic Credit Bond 71.07European Government Bond 101.77Global Core Plus Bond 365.83Global Emerging Markets Bond 104.10Global Emerging Markets Local Debt* 105.16Global High Yield Bond 23.10US Dollar Core Plus Bond 770.94Euro Reserve 1,167.14US Dollar Reserve 1,676.18Global Discount Certificates* (98.19)Halbis Global Macro* 1.19New World Income* 354.31Turkish Convergence 891.24
* The PTR have been annualised
IC Markets Equity
wth ropean Equity
obal Equity
azil Equity
dian Equity
*y
y
HSBC Global Investment Funds 90
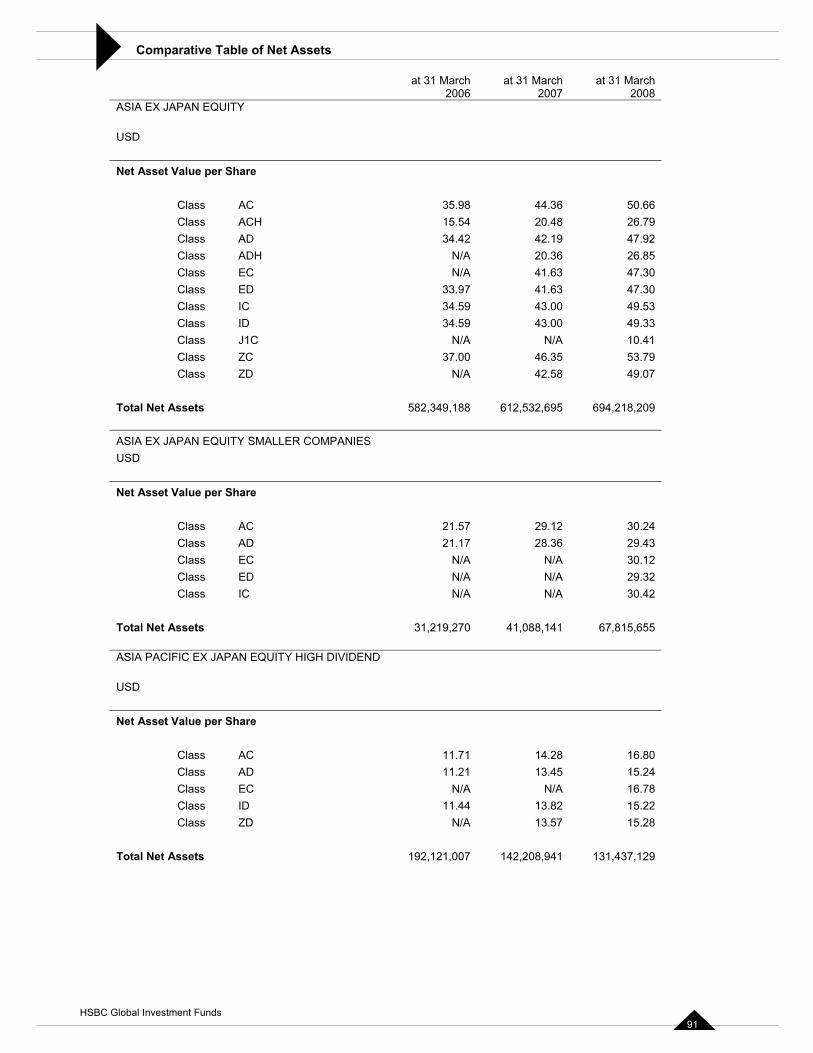
Comparative Table of Net Assets
at 31 March 2006
at 31 March 2007
at 31 March 2008
ASIA EX JAPAN EQUITY
USD
Net Asset Value per Share
Class AC 35.98 44.36 50.66Class ACH 15.54 20.48 26.79Class AD 34.42 42.19 47.92Class ADH N/A 20.36 26.85Class EC N/A 41.63 47.30Class ED 33.97 41.63 47.30Class IC 34.59 43.00 49.53Class ID 34.59 43.00 49.33Class J1C N/A N/A 10.41Class ZC 37.00 46.35 53.79Class ZD N/A 42.58 49.07
Total Net Assets 582,349,188 612,532,695 694,218,209
ASIA EX JAPAN EQUITY SMALLER COMPANIES USD
Net Asset Value per Share
Class AC 21.57 29.12 30.24Class AD 21.17 28.36 29.43Class EC N/A N/A 30.12Class ED N/A N/A 29.32Class IC N/A N/A 30.42
Total Net Assets 31,219,270 41,088,141 67,815,655
ASIA PACIFIC EX JAPAN EQUITY HIGH DIVIDEND
USD
Net Asset Value per Share
Class AC 11.71 14.28 16.80Class AD 11.21 13.45 15.24Class EC N/A N/A 16.78Class ID 11.44 13.82 15.22Class ZD N/A 13.57 15.28
Total Net Assets 192,121,007 142,208,941 131,437,129
HSBC Global Investment Funds 91
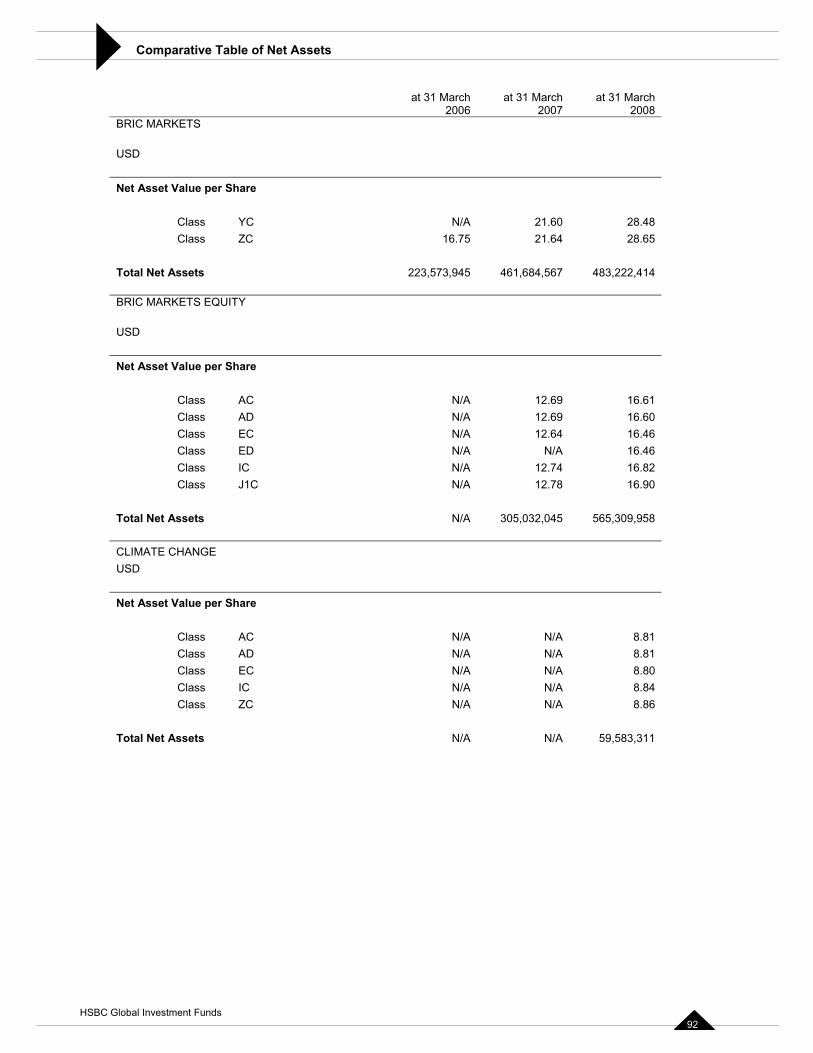
Comparative Table of Net Assets
at 31 March 2006
at 31 March 2007
at 31 March 2008
BRIC MARKETS
USD
Net Asset Value per Share
Class YC N/A 21.60 28.48Class ZC 16.75 21.64 28.65
Total Net Assets 223,573,945 461,684,567 483,222,414
BRIC MARKETS EQUITY
USD
Net Asset Value per Share
Class AC N/A 12.69 16.61Class AD N/A 12.69 16.60Class EC N/A 12.64 16.46Class ED N/A N/A 16.46Class IC N/A 12.74 16.82Class J1C N/A 12.78 16.90
Total Net Assets N/A 305,032,045 565,309,958
CLIMATE CHANGE USD
Net Asset Value per Share
Class AC N/A N/A 8.81Class AD N/A N/A 8.81Class EC N/A N/A 8.80Class IC N/A N/A 8.84Class ZC N/A N/A 8.86
Total Net Assets N/A N/A 59,583,311
HSBC Global Investment Funds 92
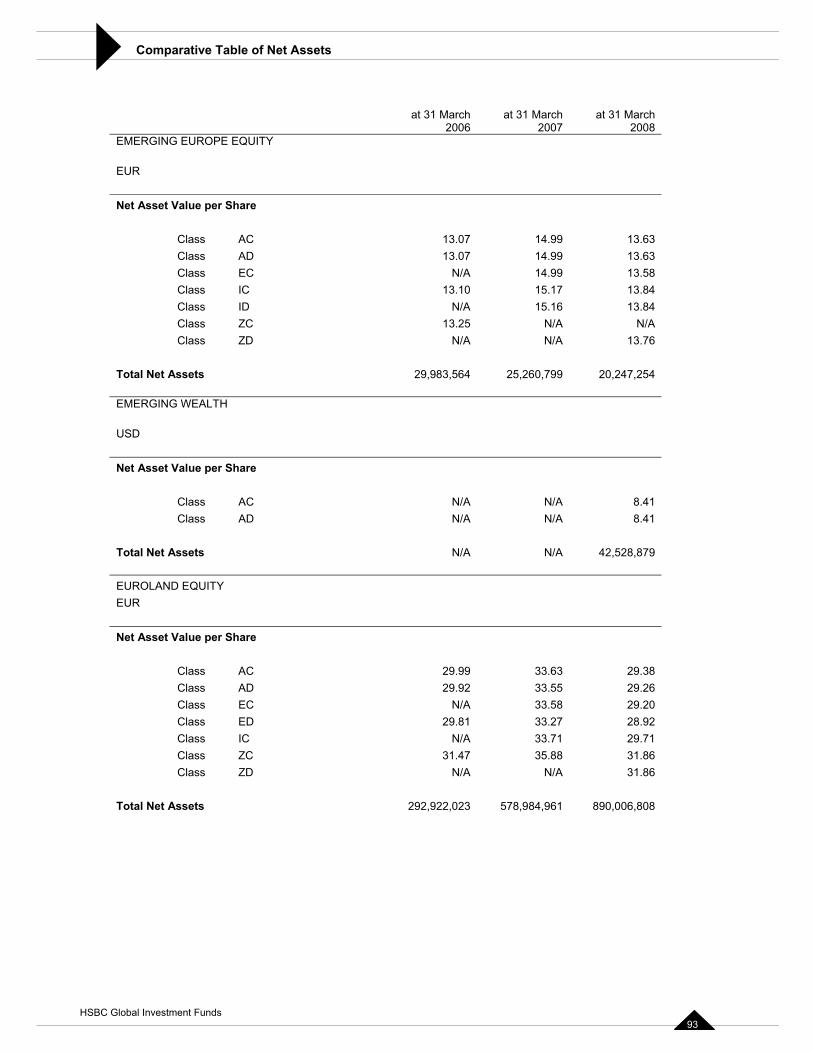
Comparative Table of Net Assets
at 31 March 2006
at 31 March 2007
at 31 March 2008
EMERGING EUROPE EQUITY
EUR
Net Asset Value per Share
Class AC 13.07 14.99 13.63Class AD 13.07 14.99 13.63Class EC N/A 14.99 13.58Class IC 13.10 15.17 13.84Class ID N/A 15.16 13.84Class ZC 13.25 N/A N/AClass ZD N/A N/A 13.76
Total Net Assets 29,983,564 25,260,799 20,247,254
EMERGING WEALTH
USD
Net Asset Value per Share
Class AC N/A N/A 8.41Class AD N/A N/A 8.41
Total Net Assets N/A N/A 42,528,879
EUROLAND EQUITY EUR
Net Asset Value per Share
Class AC 29.99 33.63 29.38Class AD 29.92 33.55 29.26Class EC N/A 33.58 29.20Class ED 29.81 33.27 28.92Class IC N/A 33.71 29.71Class ZC 31.47 35.88 31.86Class ZD N/A N/A 31.86
Total Net Assets 292,922,023 578,984,961 890,006,808
HSBC Global Investment Funds 93
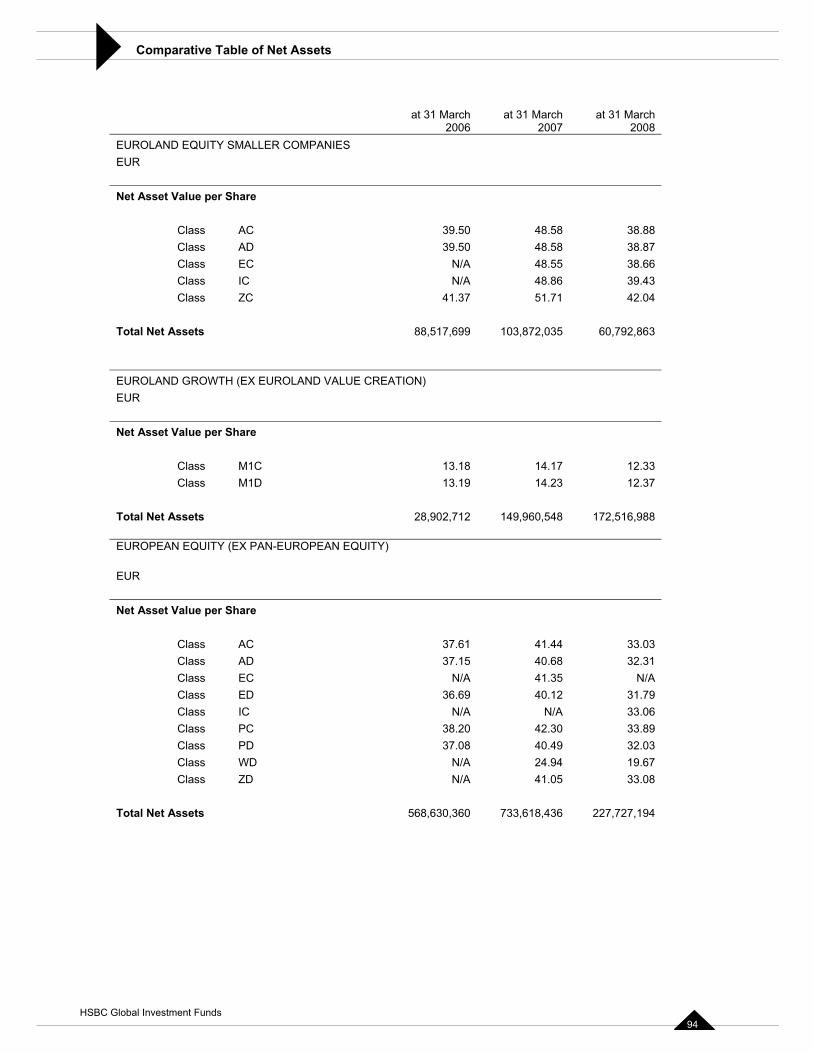
Comparative Table of Net Assets
at 31 March 2006
at 31 March 2007
at 31 March 2008
EUROLAND EQUITY SMALLER COMPANIES EUR
Net Asset Value per Share
Class AC 39.50 48.58 38.88Class AD 39.50 48.58 38.87Class EC N/A 48.55 38.66Class IC N/A 48.86 39.43Class ZC 41.37 51.71 42.04
Total Net Assets 88,517,699 103,872,035 60,792,863
EUROLAND GROWTH (EX EUROLAND VALUE CREATION) EUR
Net Asset Value per Share
Class M1C 13.18 14.17 12.33Class M1D 13.19 14.23 12.37
Total Net Assets 28,902,712 149,960,548 172,516,988
EUROPEAN EQUITY (EX PAN-EUROPEAN EQUITY)
EUR
Net Asset Value per Share
Class AC 37.61 41.44 33.03Class AD 37.15 40.68 32.31Class EC N/A 41.35 N/AClass ED 36.69 40.12 31.79Class IC N/A N/A 33.06Class PC 38.20 42.30 33.89Class PD 37.08 40.49 32.03Class WD N/A 24.94 19.67Class ZD N/A 41.05 33.08
Total Net Assets 568,630,360 733,618,436 227,727,194
HSBC Global Investment Funds 94
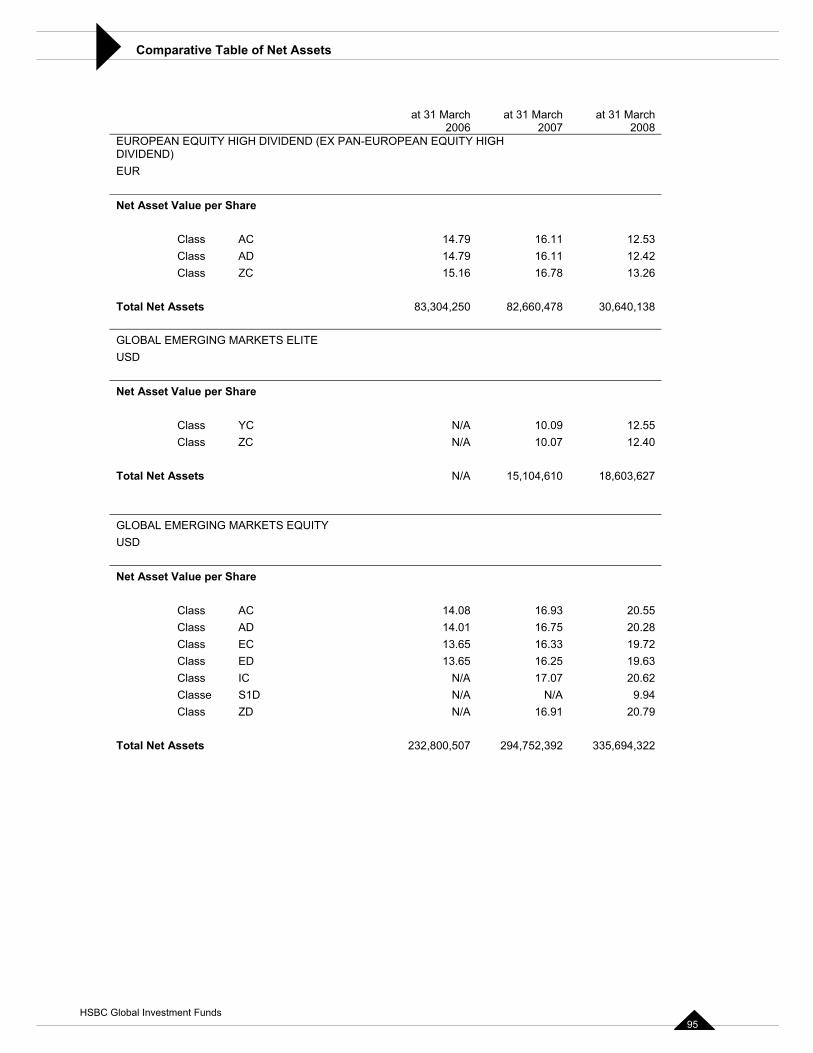
Comparative Table of Net Assets
at 31 March 2006
at 31 March 2007
at 31 March 2008
EUROPEAN EQUITY HIGH DIVIDEND (EX PAN-EUROPEAN EQUITY HIGH DIVIDEND)EUR
Net Asset Value per Share
Class AC 14.79 16.11 12.53Class AD 14.79 16.11 12.42Class ZC 15.16 16.78 13.26
Total Net Assets 83,304,250 82,660,478 30,640,138
GLOBAL EMERGING MARKETS ELITE USD
Net Asset Value per Share
Class YC N/A 10.09 12.55Class ZC N/A 10.07 12.40
Total Net Assets N/A 15,104,610 18,603,627
GLOBAL EMERGING MARKETS EQUITY USD
Net Asset Value per Share
Class AC 14.08 16.93 20.55Class AD 14.01 16.75 20.28Class EC 13.65 16.33 19.72Class ED 13.65 16.25 19.63Class IC N/A 17.07 20.62Classe S1D N/A N/A 9.94Class ZD N/A 16.91 20.79
Total Net Assets 232,800,507 294,752,392 335,694,322
HSBC Global Investment Funds 95
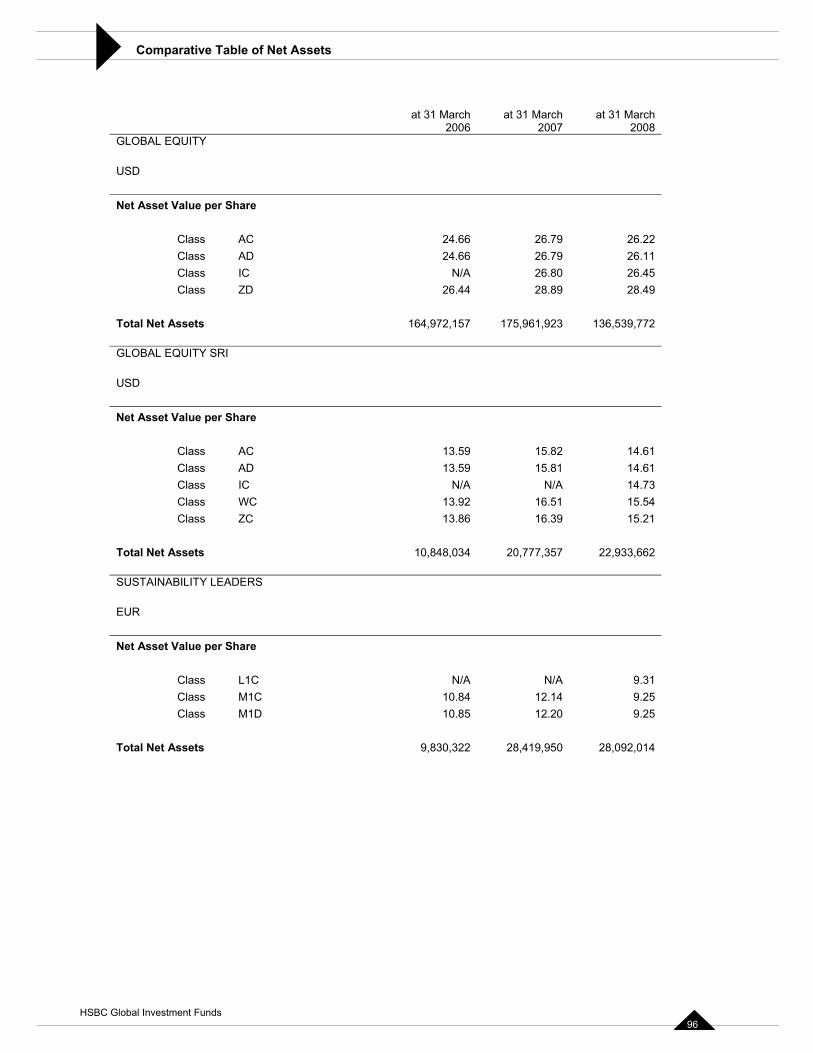
Comparative Table of Net Assets
at 31 March 2006
at 31 March 2007
at 31 March 2008
GLOBAL EQUITY
USD
Net Asset Value per Share
Class AC 24.66 26.79 26.22Class AD 24.66 26.79 26.11Class IC N/A 26.80 26.45Class ZD 26.44 28.89 28.49
Total Net Assets 164,972,157 175,961,923 136,539,772
GLOBAL EQUITY SRI
USD
Net Asset Value per Share
Class AC 13.59 15.82 14.61Class AD 13.59 15.81 14.61Class IC N/A N/A 14.73Class WC 13.92 16.51 15.54Class ZC 13.86 16.39 15.21
Total Net Assets 10,848,034 20,777,357 22,933,662
SUSTAINABILITY LEADERS
EUR
Net Asset Value per Share
Class L1C N/A N/A 9.31Class M1C 10.84 12.14 9.25Class M1D 10.85 12.20 9.25
Total Net Assets 9,830,322 28,419,950 28,092,014
HSBC Global Investment Funds 96
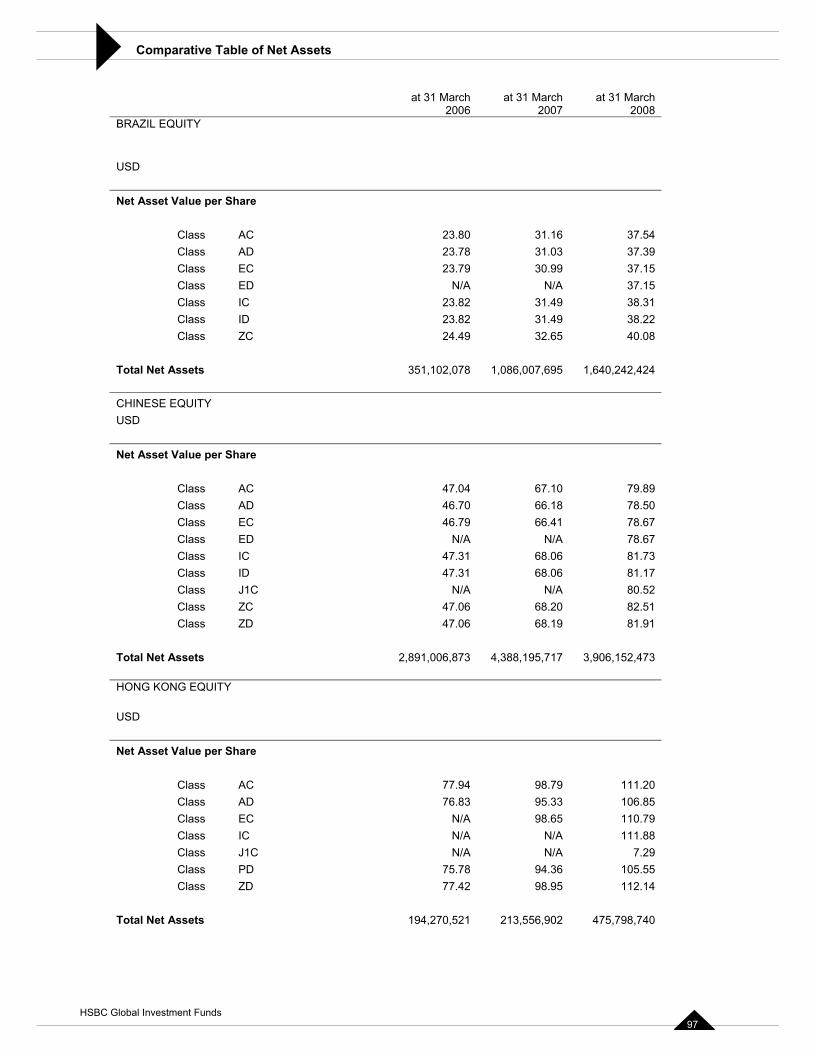
Comparative Table of Net Assets
at 31 March 2006
at 31 March 2007
at 31 March 2008
BRAZIL EQUITY
USD
Net Asset Value per Share
Class AC 23.80 31.16 37.54Class AD 23.78 31.03 37.39Class EC 23.79 30.99 37.15Class ED N/A N/A 37.15Class IC 23.82 31.49 38.31Class ID 23.82 31.49 38.22Class ZC 24.49 32.65 40.08
Total Net Assets 351,102,078 1,086,007,695 1,640,242,424
CHINESE EQUITY USD
Net Asset Value per Share
Class AC 47.04 67.10 79.89Class AD 46.70 66.18 78.50Class EC 46.79 66.41 78.67Class ED N/A N/A 78.67Class IC 47.31 68.06 81.73Class ID 47.31 68.06 81.17Class J1C N/A N/A 80.52Class ZC 47.06 68.20 82.51Class ZD 47.06 68.19 81.91
Total Net Assets 2,891,006,873 4,388,195,717 3,906,152,473
HONG KONG EQUITY
USD
Net Asset Value per Share
Class AC 77.94 98.79 111.20 Class AD 76.83 95.33 106.85 Class EC N/A 98.65 110.79 Class IC N/A N/A 111.88 Class J1C N/A N/A 7.29Class PD 75.78 94.36 105.55 Class ZD 77.42 98.95 112.14
Total Net Assets 194,270,521 213,556,902 475,798,740
HSBC Global Investment Funds 97
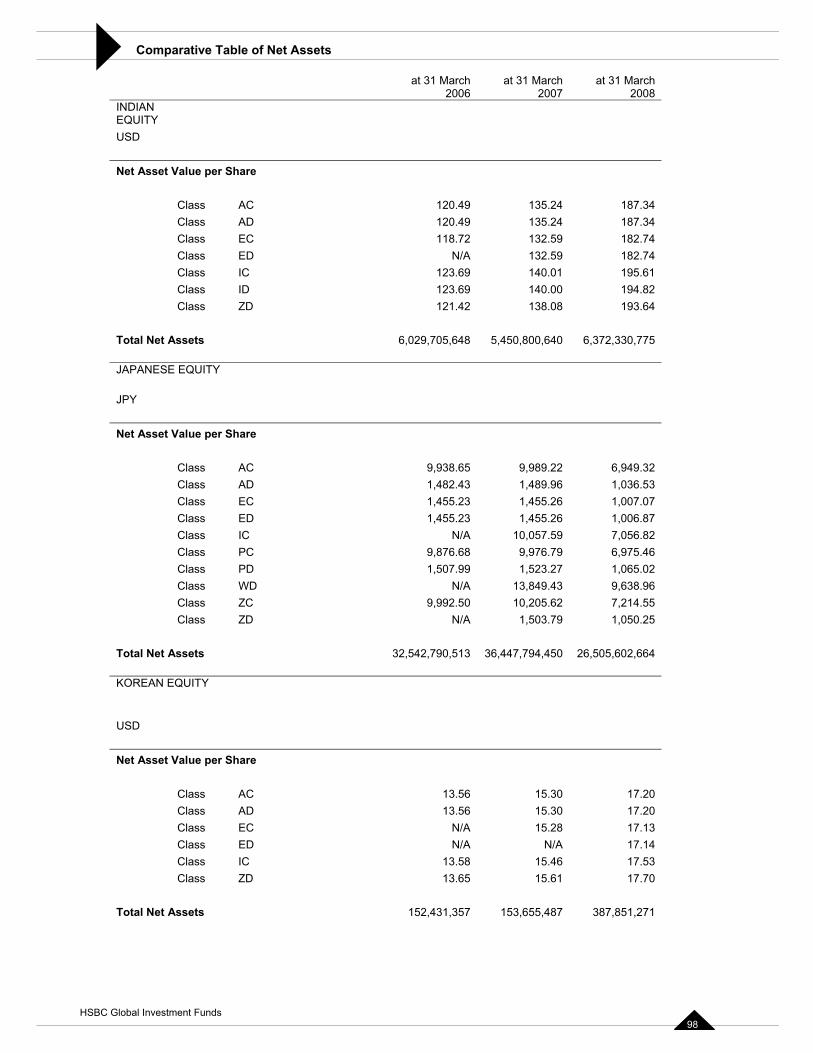
Comparative Table of Net Assets
at 31 March 2006
at 31 March 2007
at 31 March 2008
INDIANEQUITY USD
Net Asset Value per Share
Class AC 120.49 135.24 187.34 Class AD 120.49 135.24 187.34 Class EC 118.72 132.59 182.74 Class ED N/A 132.59 182.74 Class IC 123.69 140.01 195.61 Class ID 123.69 140.00 194.82 Class ZD 121.42 138.08 193.64
Total Net Assets 6,029,705,648 5,450,800,640 6,372,330,775
JAPANESE EQUITY
JPY
Net Asset Value per Share
Class AC 9,938.65 9,989.22 6,949.32 Class AD 1,482.43 1,489.96 1,036.53 Class EC 1,455.23 1,455.26 1,007.07 Class ED 1,455.23 1,455.26 1,006.87 Class IC N/A 10,057.59 7,056.82 Class PC 9,876.68 9,976.79 6,975.46 Class PD 1,507.99 1,523.27 1,065.02 Class WD N/A 13,849.43 9,638.96 Class ZC 9,992.50 10,205.62 7,214.55 Class ZD N/A 1,503.79 1,050.25
Total Net Assets 32,542,790,513 36,447,794,450 26,505,602,664
KOREAN EQUITY
USD
Net Asset Value per Share
Class AC 13.56 15.30 17.20Class AD 13.56 15.30 17.20Class EC N/A 15.28 17.13Class ED N/A N/A 17.14Class IC 13.58 15.46 17.53Class ZD 13.65 15.61 17.70
Total Net Assets 152,431,357 153,655,487 387,851,271
HSBC Global Investment Funds 98
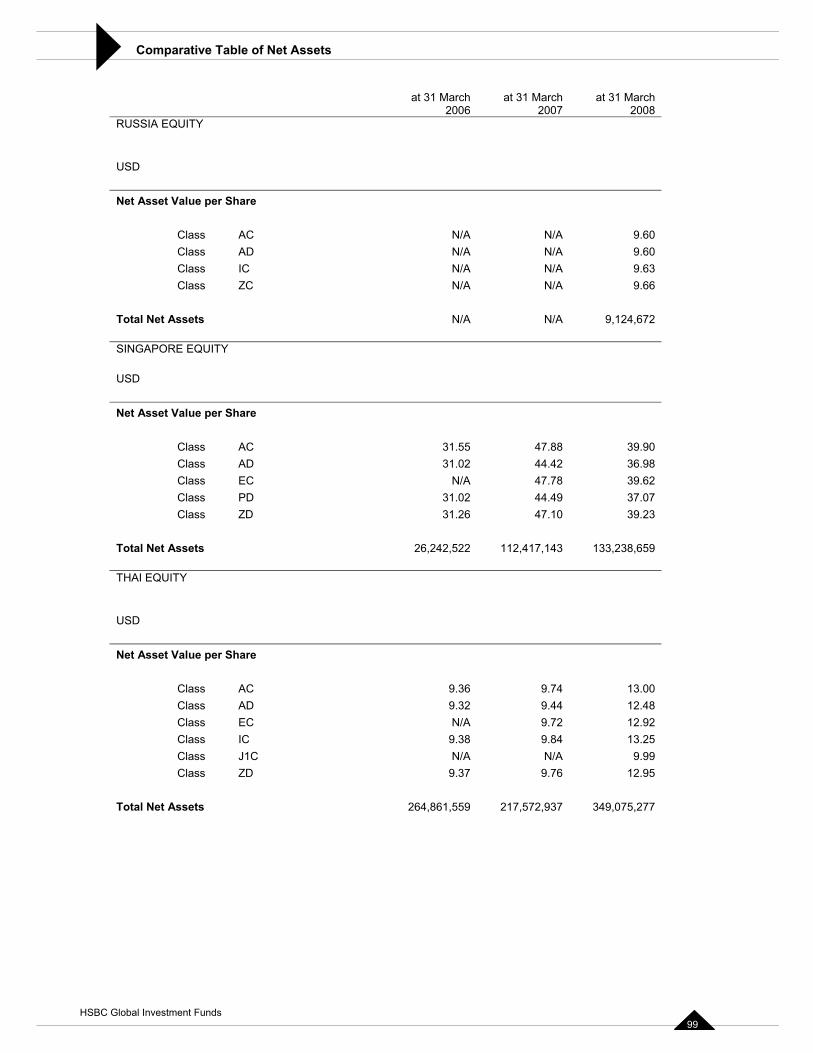
Comparative Table of Net Assets
at 31 March 2006
at 31 March 2007
at 31 March 2008
RUSSIA EQUITY
USD
Net Asset Value per Share
Class AC N/A N/A 9.60Class AD N/A N/A 9.60Class IC N/A N/A 9.63Class ZC N/A N/A 9.66
Total Net Assets N/A N/A 9,124,672
SINGAPORE EQUITY
USD
Net Asset Value per Share
Class AC 31.55 47.88 39.90Class AD 31.02 44.42 36.98Class EC N/A 47.78 39.62Class PD 31.02 44.49 37.07Class ZD 31.26 47.10 39.23
Total Net Assets 26,242,522 112,417,143 133,238,659
THAI EQUITY
USD
Net Asset Value per Share
Class AC 9.36 9.74 13.00Class AD 9.32 9.44 12.48Class EC N/A 9.72 12.92Class IC 9.38 9.84 13.25Class J1C N/A N/A 9.99Class ZD 9.37 9.76 12.95
Total Net Assets 264,861,559 217,572,937 349,075,277
HSBC Global Investment Funds 99
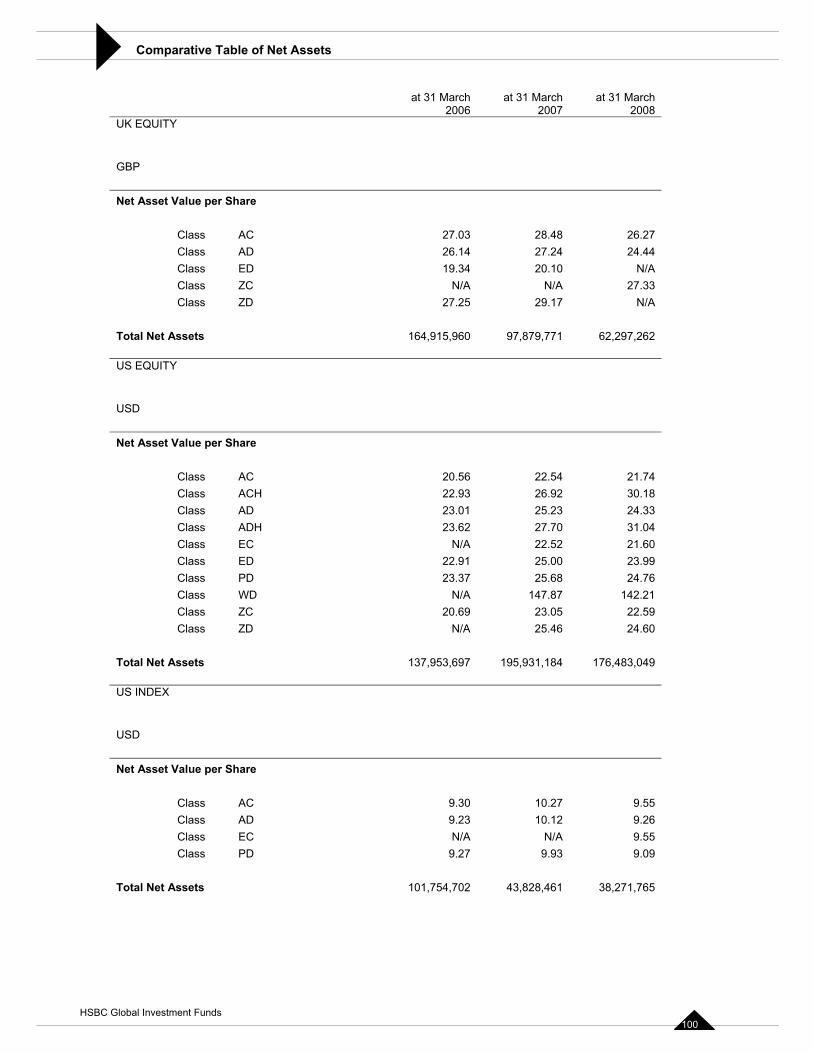
Comparative Table of Net Assets
at 31 March 2006
at 31 March 2007
at 31 March 2008
UK EQUITY
GBP
Net Asset Value per Share
Class AC 27.03 28.48 26.27Class AD 26.14 27.24 24.44Class ED 19.34 20.10 N/AClass ZC N/A N/A 27.33Class ZD 27.25 29.17 N/A
Total Net Assets 164,915,960 97,879,771 62,297,262
US EQUITY
USD
Net Asset Value per Share
Class AC 20.56 22.54 21.74Class ACH 22.93 26.92 30.18Class AD 23.01 25.23 24.33Class ADH 23.62 27.70 31.04Class EC N/A 22.52 21.60Class ED 22.91 25.00 23.99Class PD 23.37 25.68 24.76Class WD N/A 147.87 142.21 Class ZC 20.69 23.05 22.59Class ZD N/A 25.46 24.60
Total Net Assets 137,953,697 195,931,184 176,483,049
US INDEX
USD
Net Asset Value per Share
Class AC 9.30 10.27 9.55Class AD 9.23 10.12 9.26Class EC N/A N/A 9.55Class PD 9.27 9.93 9.09
Total Net Assets 101,754,702 43,828,461 38,271,765
HSBC Global Investment Funds 100
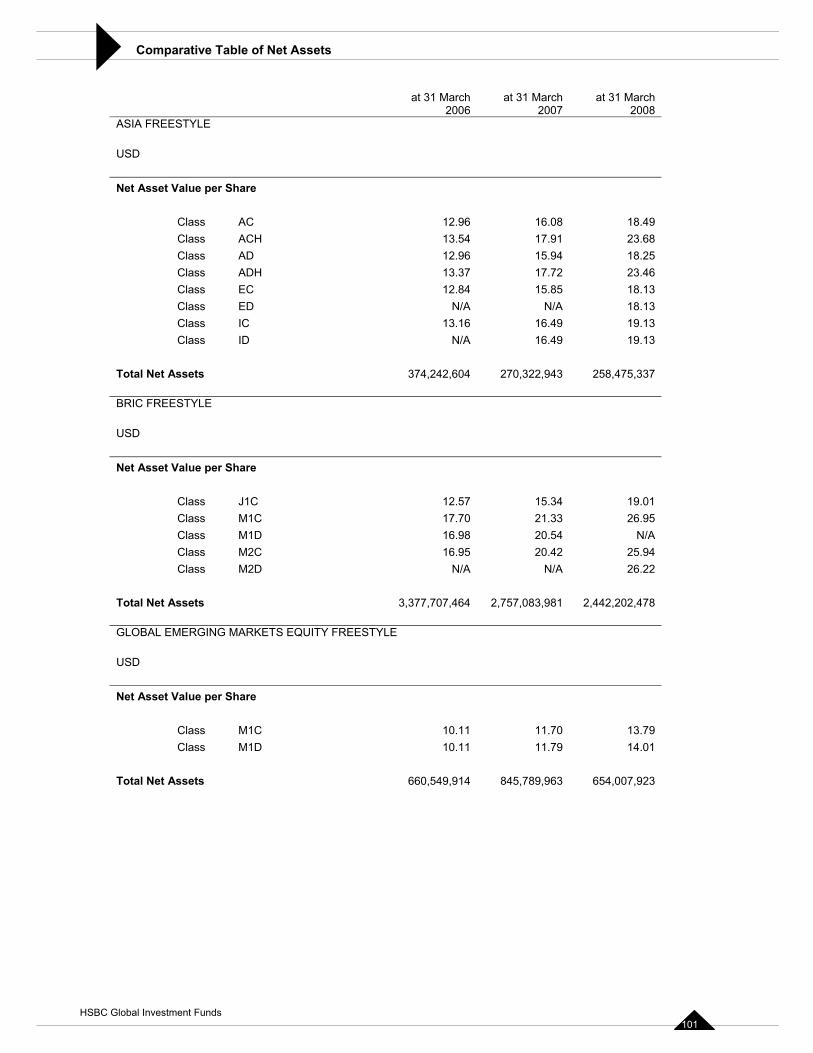
Comparative Table of Net Assets
at 31 March 2006
at 31 March 2007
at 31 March 2008
ASIA FREESTYLE
USD
Net Asset Value per Share
Class AC 12.96 16.08 18.49Class ACH 13.54 17.91 23.68Class AD 12.96 15.94 18.25Class ADH 13.37 17.72 23.46Class EC 12.84 15.85 18.13Class ED N/A N/A 18.13Class IC 13.16 16.49 19.13Class ID N/A 16.49 19.13
Total Net Assets 374,242,604 270,322,943 258,475,337
BRIC FREESTYLE
USD
Net Asset Value per Share
Class J1C 12.57 15.34 19.01Class M1C 17.70 21.33 26.95Class M1D 16.98 20.54 N/AClass M2C 16.95 20.42 25.94Class M2D N/A N/A 26.22
Total Net Assets 3,377,707,464 2,757,083,981 2,442,202,478
GLOBAL EMERGING MARKETS EQUITY FREESTYLE
USD
Net Asset Value per Share
Class M1C 10.11 11.70 13.79Class M1D 10.11 11.79 14.01
Total Net Assets 660,549,914 845,789,963 654,007,923
HSBC Global Investment Funds 101
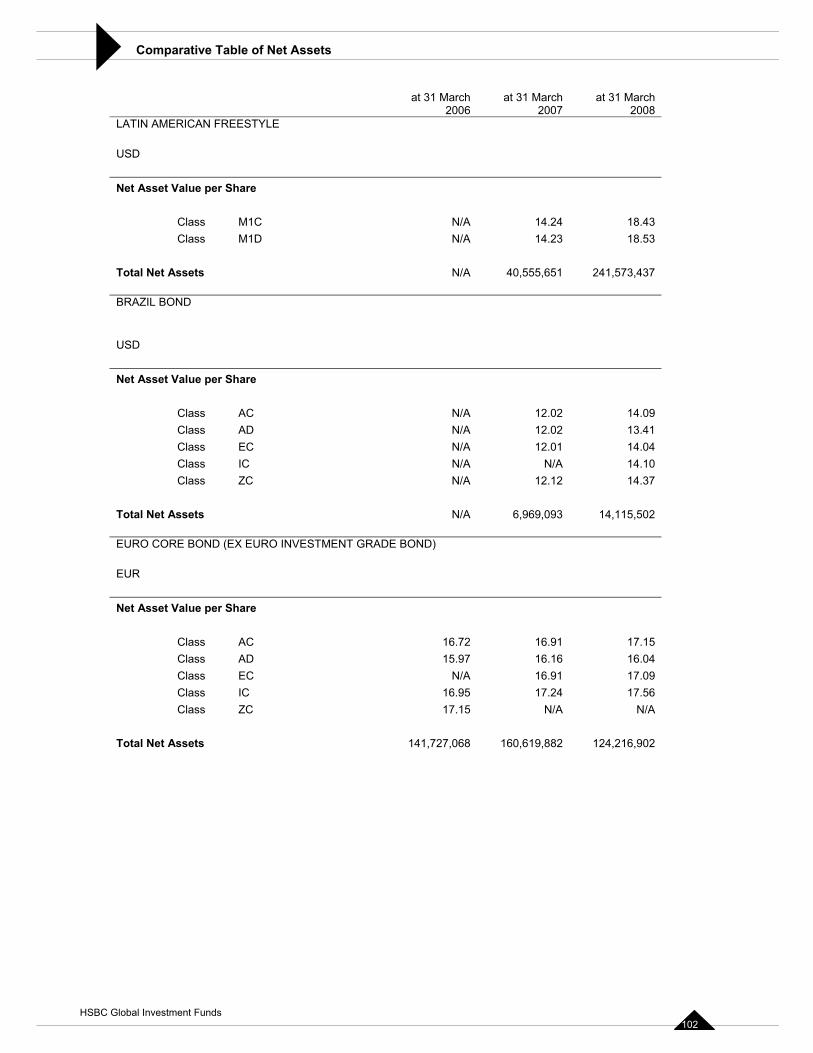
Comparative Table of Net Assets
at 31 March 2006
at 31 March 2007
at 31 March 2008
LATIN AMERICAN FREESTYLE
USD
Net Asset Value per Share
Class M1C N/A 14.24 18.43Class M1D N/A 14.23 18.53
Total Net Assets N/A 40,555,651 241,573,437
BRAZIL BOND
USD
Net Asset Value per Share
Class AC N/A 12.02 14.09Class AD N/A 12.02 13.41Class EC N/A 12.01 14.04Class IC N/A N/A 14.10Class ZC N/A 12.12 14.37
Total Net Assets N/A 6,969,093 14,115,502
EURO CORE BOND (EX EURO INVESTMENT GRADE BOND)
EUR
Net Asset Value per Share
Class AC 16.72 16.91 17.15Class AD 15.97 16.16 16.04Class EC N/A 16.91 17.09Class IC 16.95 17.24 17.56Class ZC 17.15 N/A N/A
Total Net Assets 141,727,068 160,619,882 124,216,902
HSBC Global Investment Funds 102
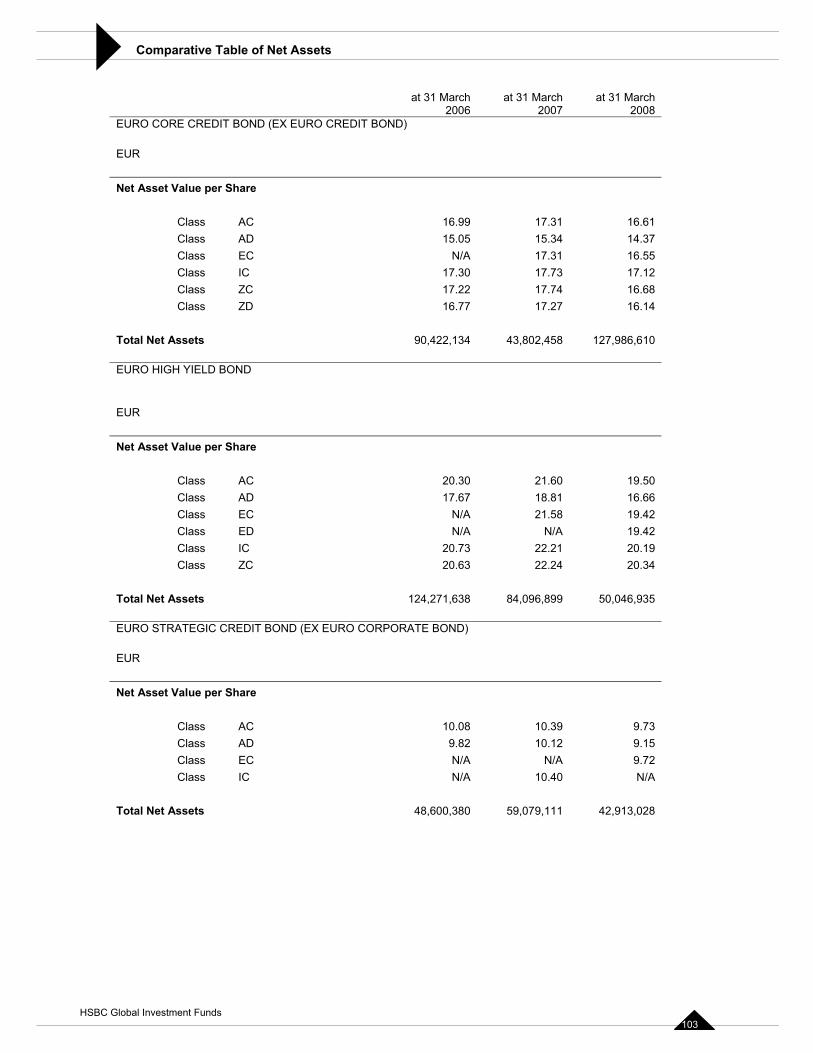
Comparative Table of Net Assets
at 31 March 2006
at 31 March 2007
at 31 March 2008
EURO CORE CREDIT BOND (EX EURO CREDIT BOND)
EUR
Net Asset Value per Share
Class AC 16.99 17.31 16.61Class AD 15.05 15.34 14.37Class EC N/A 17.31 16.55Class IC 17.30 17.73 17.12Class ZC 17.22 17.74 16.68Class ZD 16.77 17.27 16.14
Total Net Assets 90,422,134 43,802,458 127,986,610
EURO HIGH YIELD BOND
EUR
Net Asset Value per Share
Class AC 20.30 21.60 19.50Class AD 17.67 18.81 16.66Class EC N/A 21.58 19.42Class ED N/A N/A 19.42Class IC 20.73 22.21 20.19Class ZC 20.63 22.24 20.34
Total Net Assets 124,271,638 84,096,899 50,046,935
EURO STRATEGIC CREDIT BOND (EX EURO CORPORATE BOND)
EUR
Net Asset Value per Share
Class AC 10.08 10.39 9.73Class AD 9.82 10.12 9.15Class EC N/A N/A 9.72Class IC N/A 10.40 N/A
Total Net Assets 48,600,380 59,079,111 42,913,028
HSBC Global Investment Funds 103
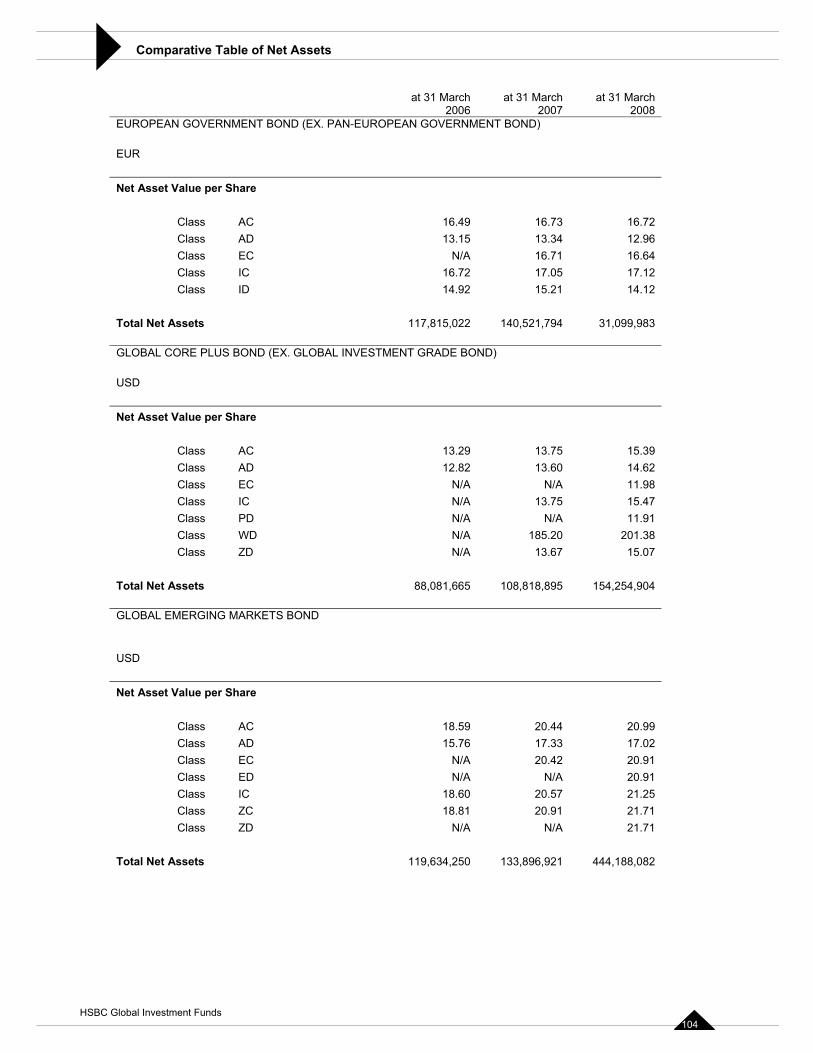
Comparative Table of Net Assets
at 31 March 2006
at 31 March 2007
at 31 March 2008
EUROPEAN GOVERNMENT BOND (EX. PAN-EUROPEAN GOVERNMENT BOND)
EUR
Net Asset Value per Share
Class AC 16.49 16.73 16.72Class AD 13.15 13.34 12.96Class EC N/A 16.71 16.64Class IC 16.72 17.05 17.12Class ID 14.92 15.21 14.12
Total Net Assets 117,815,022 140,521,794 31,099,983
GLOBAL CORE PLUS BOND (EX. GLOBAL INVESTMENT GRADE BOND)
USD
Net Asset Value per Share
Class AC 13.29 13.75 15.39Class AD 12.82 13.60 14.62Class EC N/A N/A 11.98Class IC N/A 13.75 15.47Class PD N/A N/A 11.91Class WD N/A 185.20 201.38 Class ZD N/A 13.67 15.07
Total Net Assets 88,081,665 108,818,895 154,254,904
GLOBAL EMERGING MARKETS BOND
USD
Net Asset Value per Share
Class AC 18.59 20.44 20.99Class AD 15.76 17.33 17.02Class EC N/A 20.42 20.91Class ED N/A N/A 20.91Class IC 18.60 20.57 21.25Class ZC 18.81 20.91 21.71Class ZD N/A N/A 21.71
Total Net Assets 119,634,250 133,896,921 444,188,082
HSBC Global Investment Funds 104
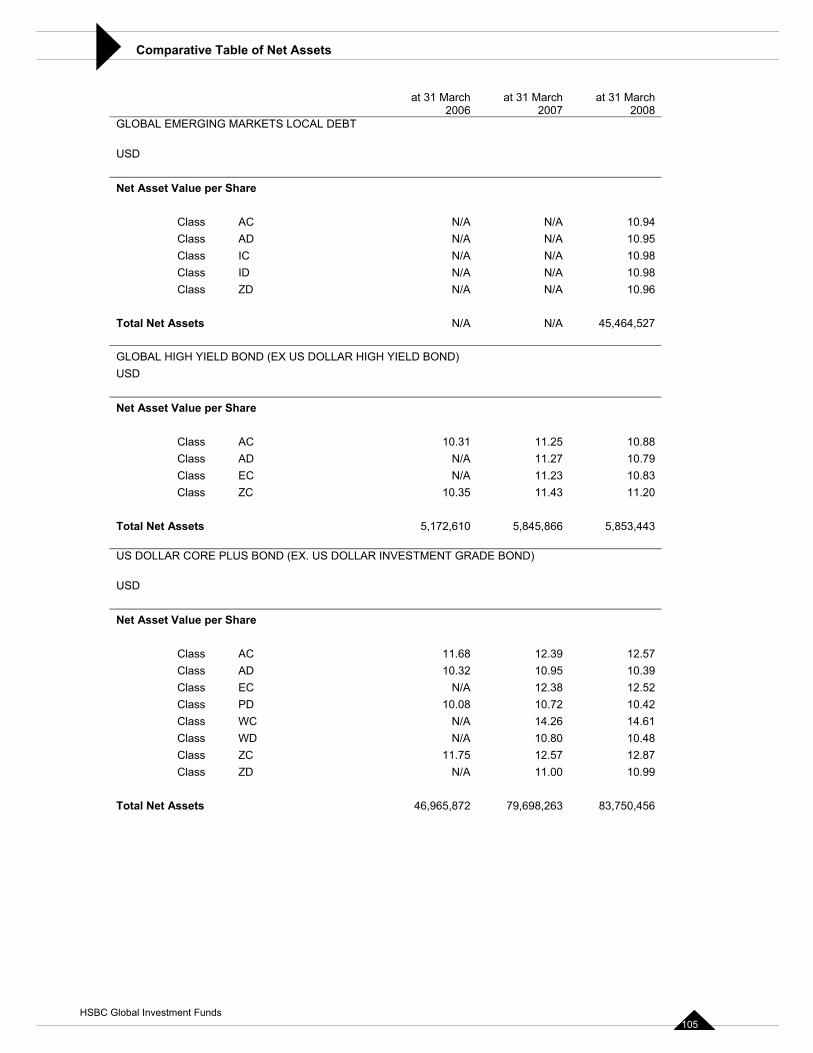
Comparative Table of Net Assets
at 31 March 2006
at 31 March 2007
at 31 March 2008
GLOBAL EMERGING MARKETS LOCAL DEBT
USD
Net Asset Value per Share
Class AC N/A N/A 10.94Class AD N/A N/A 10.95Class IC N/A N/A 10.98Class ID N/A N/A 10.98Class ZD N/A N/A 10.96
Total Net Assets N/A N/A 45,464,527
GLOBAL HIGH YIELD BOND (EX US DOLLAR HIGH YIELD BOND) USD
Net Asset Value per Share
Class AC 10.31 11.25 10.88Class AD N/A 11.27 10.79Class EC N/A 11.23 10.83Class ZC 10.35 11.43 11.20
Total Net Assets 5,172,610 5,845,866 5,853,443
US DOLLAR CORE PLUS BOND (EX. US DOLLAR INVESTMENT GRADE BOND)
USD
Net Asset Value per Share
Class AC 11.68 12.39 12.57Class AD 10.32 10.95 10.39Class EC N/A 12.38 12.52Class PD 10.08 10.72 10.42Class WC N/A 14.26 14.61Class WD N/A 10.80 10.48Class ZC 11.75 12.57 12.87Class ZD N/A 11.00 10.99
Total Net Assets 46,965,872 79,698,263 83,750,456
HSBC Global Investment Funds 105
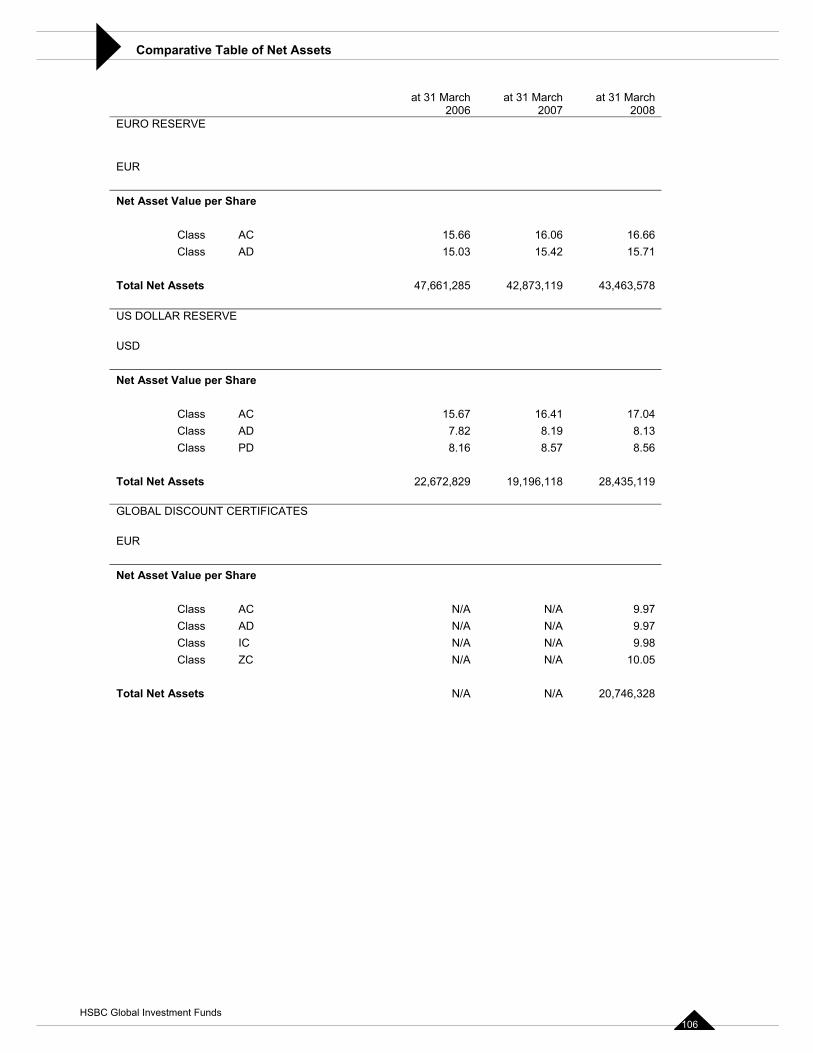
Comparative Table of Net Assets
at 31 March 2006
at 31 March 2007
at 31 March 2008
EURO RESERVE
EUR
Net Asset Value per Share
Class AC 15.66 16.06 16.66Class AD 15.03 15.42 15.71
Total Net Assets 47,661,285 42,873,119 43,463,578
US DOLLAR RESERVE
USD
Net Asset Value per Share
Class AC 15.67 16.41 17.04Class AD 7.82 8.19 8.13Class PD 8.16 8.57 8.56
Total Net Assets 22,672,829 19,196,118 28,435,119
GLOBAL DISCOUNT CERTIFICATES
EUR
Net Asset Value per Share
Class AC N/A N/A 9.97Class AD N/A N/A 9.97Class IC N/A N/A 9.98Class ZC N/A N/A 10.05
Total Net Assets N/A N/A 20,746,328
HSBC Global Investment Funds 106
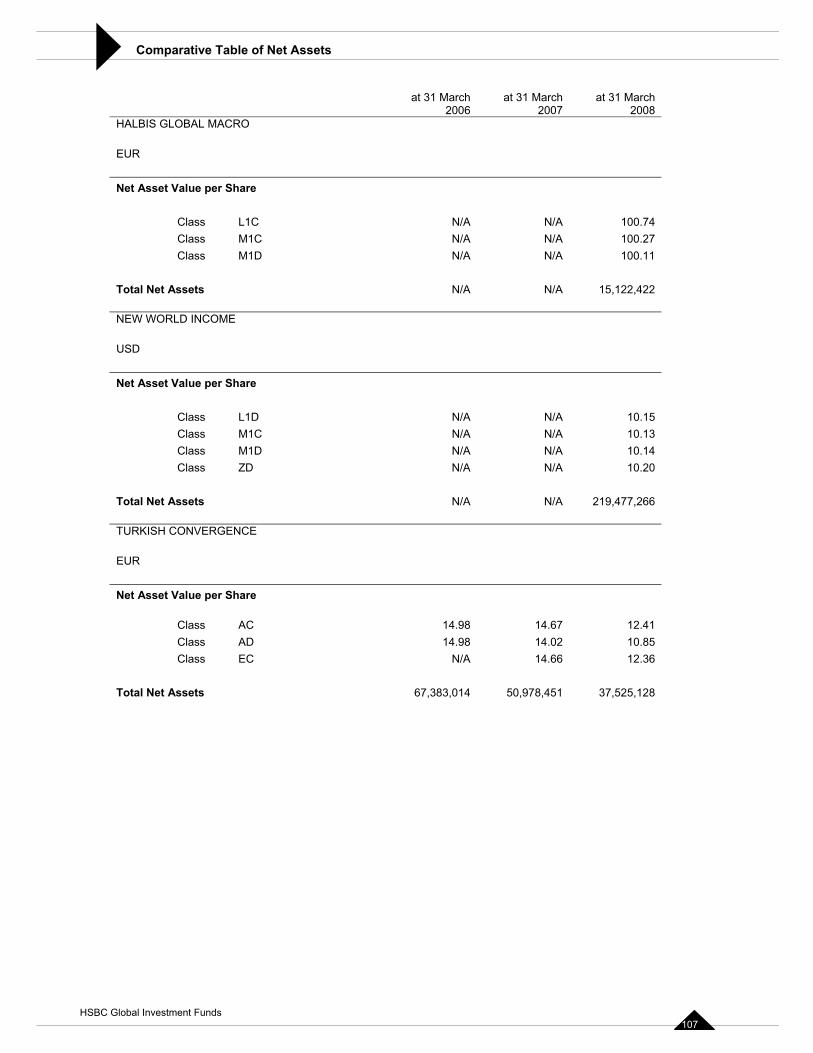
Comparative Table of Net Assets
at 31 March 2006
at 31 March 2007
at 31 March 2008
HALBIS GLOBAL MACRO
EUR
Net Asset Value per Share
Class L1C N/A N/A 100.74 Class M1C N/A N/A 100.27 Class M1D N/A N/A 100.11
Total Net Assets N/A N/A 15,122,422
NEW WORLD INCOME
USD
Net Asset Value per Share
Class L1D N/A N/A 10.15Class M1C N/A N/A 10.13Class M1D N/A N/A 10.14Class ZD N/A N/A 10.20
Total Net Assets N/A N/A 219,477,266
TURKISH CONVERGENCE
EUR
Net Asset Value per Share
Class AC 14.98 14.67 12.41Class AD 14.98 14.02 10.85Class EC N/A 14.66 12.36
Total Net Assets 67,383,014 50,978,451 37,525,128
HSBC Global Investment Funds 107
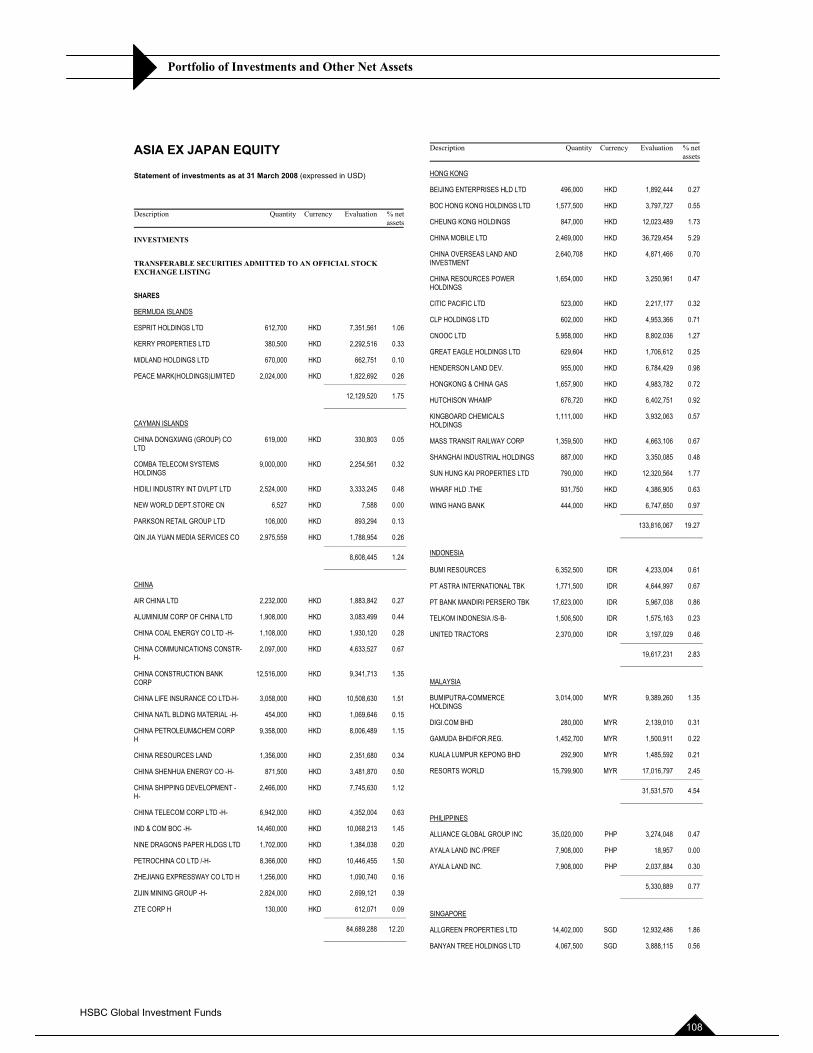
Portfolio of Investments and Other Net Assets
ASIA EX JAPAN EQUITY
Statement of investments as at 31 March 2008 (expressed in USD)
Description Quantity Currency Evaluation % netassets
INVESTMENTS
TRANSFERABLE SECURITIES ADMITTED TO AN OFFICIAL STOCK EXCHANGE LISTING
SHARES
BERMUDA ISLANDS
ESPRIT HOLDINGS LTD 612,700 HKD 7,351,561 1.06
KERRY PROPERTIES LTD 380,500 HKD 2,292,516 0.33
MIDLAND HOLDINGS LTD 670,000 HKD 662,751 0.10
PEACE MARK(HOLDINGS)LIMITED 2,024,000 HKD 1,822,692 0.26 ______________________
12,129,520 1.75 ______________________
CAYMAN ISLANDS
CHINA DONGXIANG (GROUP) CO LTD
619,000 HKD 330,803 0.05
COMBA TELECOM SYSTEMS HOLDINGS
9,000,000 HKD 2,254,561 0.32
HIDILI INDUSTRY INT DVLPT LTD 2,524,000 HKD 3,333,245 0.48
NEW WORLD DEPT.STORE CN 6,527 HKD 7,588 0.00
PARKSON RETAIL GROUP LTD 106,000 HKD 893,294 0.13
QIN JIA YUAN MEDIA SERVICES CO 2,975,559 HKD 1,788,954 0.26 ______________________
8,608,445 1.24 ______________________
CHINA
AIR CHINA LTD 2,232,000 HKD 1,883,842 0.27
ALUMINIUM CORP OF CHINA LTD 1,908,000 HKD 3,083,499 0.44
CHINA COAL ENERGY CO LTD -H- 1,108,000 HKD 1,930,120 0.28
CHINA COMMUNICATIONS CONSTR-H-
2,097,000 HKD 4,633,527 0.67
CHINA CONSTRUCTION BANK CORP
12,516,000 HKD 9,341,713 1.35
CHINA LIFE INSURANCE CO LTD-H- 3,058,000 HKD 10,508,630 1.51
CHINA NATL BLDING MATERIAL -H- 454,000 HKD 1,069,646 0.15
CHINA PETROLEUM&CHEM CORP H
9,358,000 HKD 8,006,489 1.15
CHINA RESOURCES LAND 1,356,000 HKD 2,351,680 0.34
CHINA SHENHUA ENERGY CO -H- 871,500 HKD 3,481,870 0.50
CHINA SHIPPING DEVELOPMENT -H-
2,466,000 HKD 7,745,630 1.12
CHINA TELECOM CORP LTD -H- 6,942,000 HKD 4,352,004 0.63
IND & COM BOC -H- 14,460,000 HKD 10,068,213 1.45
NINE DRAGONS PAPER HLDGS LTD 1,702,000 HKD 1,384,038 0.20
PETROCHINA CO LTD /-H- 8,366,000 HKD 10,446,455 1.50
ZHEJIANG EXPRESSWAY CO LTD H 1,256,000 HKD 1,090,740 0.16
ZIJIN MINING GROUP -H- 2,824,000 HKD 2,699,121 0.39
ZTE CORP H 130,000 HKD 612,071 0.09 ______________________
84,689,288 12.20 ______________________
Description Quantity Currency Evaluation % netassets
HONG KONG
BEIJING ENTERPRISES HLD LTD 496,000 HKD 1,892,444 0.27
BOC HONG KONG HOLDINGS LTD 1,577,500 HKD 3,797,727 0.55
CHEUNG KONG HOLDINGS 847,000 HKD 12,023,489 1.73
CHINA MOBILE LTD 2,469,000 HKD 36,729,454 5.29
CHINA OVERSEAS LAND AND INVESTMENT
2,640,708 HKD 4,871,466 0.70
CHINA RESOURCES POWER HOLDINGS
1,654,000 HKD 3,250,961 0.47
CITIC PACIFIC LTD 523,000 HKD 2,217,177 0.32
CLP HOLDINGS LTD 602,000 HKD 4,953,366 0.71
CNOOC LTD 5,958,000 HKD 8,802,036 1.27
GREAT EAGLE HOLDINGS LTD 629,604 HKD 1,706,612 0.25
HENDERSON LAND DEV. 955,000 HKD 6,784,429 0.98
HONGKONG & CHINA GAS 1,657,900 HKD 4,983,782 0.72
HUTCHISON WHAMP 676,720 HKD 6,402,751 0.92
KINGBOARD CHEMICALS HOLDINGS
1,111,000 HKD 3,932,063 0.57
MASS TRANSIT RAILWAY CORP 1,359,500 HKD 4,663,106 0.67
SHANGHAI INDUSTRIAL HOLDINGS 887,000 HKD 3,350,085 0.48
SUN HUNG KAI PROPERTIES LTD 790,000 HKD 12,320,564 1.77
WHARF HLD .THE 931,750 HKD 4,386,905 0.63
WING HANG BANK 444,000 HKD 6,747,650 0.97 ______________________
133,816,067 19.27 ______________________
INDONESIA
BUMI RESOURCES 6,352,500 IDR 4,233,004 0.61
PT ASTRA INTERNATIONAL TBK 1,771,500 IDR 4,644,997 0.67
PT BANK MANDIRI PERSERO TBK 17,623,000 IDR 5,967,038 0.86
TELKOM INDONESIA /S-B- 1,506,500 IDR 1,575,163 0.23
UNITED TRACTORS 2,370,000 IDR 3,197,029 0.46 ______________________
19,617,231 2.83 ______________________
MALAYSIA
BUMIPUTRA-COMMERCE HOLDINGS
3,014,000 MYR 9,389,260 1.35
DIGI.COM BHD 280,000 MYR 2,139,010 0.31
GAMUDA BHD/FOR.REG. 1,452,700 MYR 1,500,911 0.22
KUALA LUMPUR KEPONG BHD 292,900 MYR 1,485,592 0.21
RESORTS WORLD 15,799,900 MYR 17,016,797 2.45 ______________________
31,531,570 4.54 ______________________
PHILIPPINES
ALLIANCE GLOBAL GROUP INC 35,020,000 PHP 3,274,048 0.47
AYALA LAND INC /PREF 7,908,000 PHP 18,957 0.00
AYALA LAND INC. 7,908,000 PHP 2,037,884 0.30 ______________________
5,330,889 0.77 ______________________
SINGAPORE
ALLGREEN PROPERTIES LTD 14,402,000 SGD 12,932,486 1.86
BANYAN TREE HOLDINGS LTD 4,067,500 SGD 3,888,115 0.56
HSBC Global Investment Funds 108
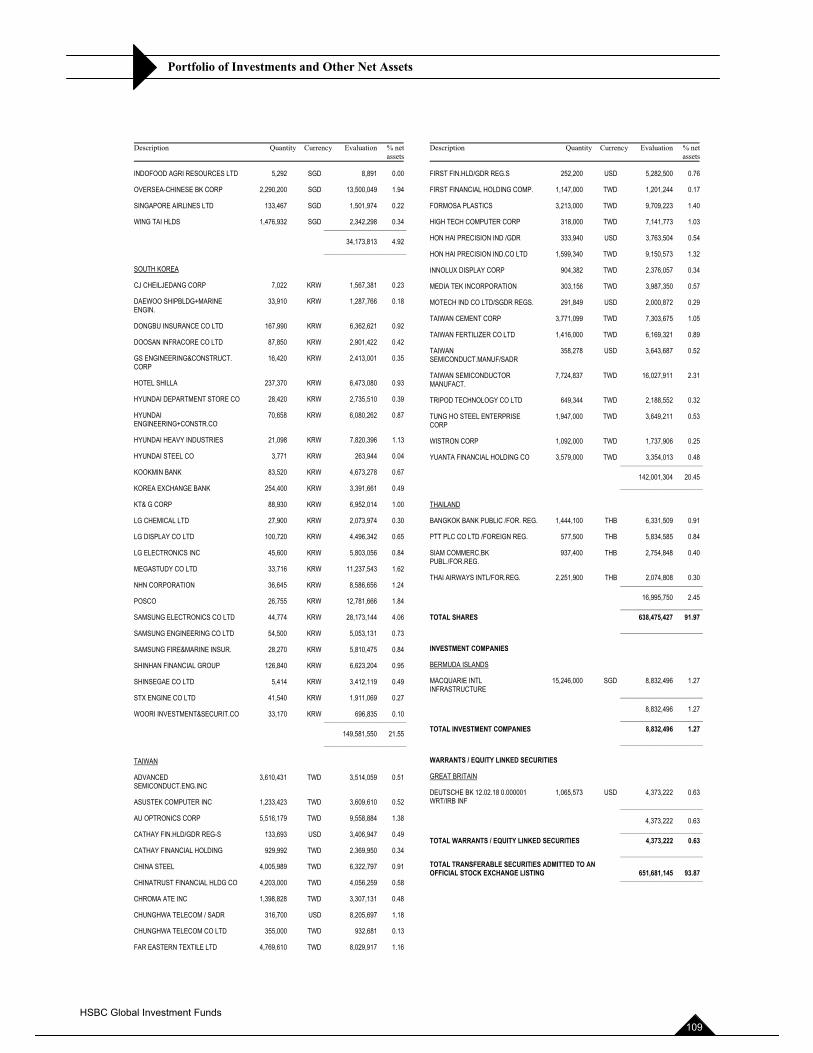
Portfolio of Investments and Other Net Assets
Description Quantity Currency Evaluation % netassets
INDOFOOD AGRI RESOURCES LTD 5,292 SGD 8,891 0.00
OVERSEA-CHINESE BK CORP 2,290,200 SGD 13,500,049 1.94
SINGAPORE AIRLINES LTD 133,467 SGD 1,501,974 0.22
WING TAI HLDS 1,476,932 SGD 2,342,298 0.34 ______________________
34,173,813 4.92 ______________________
SOUTH KOREA
CJ CHEILJEDANG CORP 7,022 KRW 1,567,381 0.23
DAEWOO SHIPBLDG+MARINE ENGIN.
33,910 KRW 1,287,766 0.18
DONGBU INSURANCE CO LTD 167,990 KRW 6,362,621 0.92
DOOSAN INFRACORE CO LTD 87,850 KRW 2,901,422 0.42
GS ENGINEERING&CONSTRUCT. CORP
16,420 KRW 2,413,001 0.35
HOTEL SHILLA 237,370 KRW 6,473,080 0.93
HYUNDAI DEPARTMENT STORE CO 28,420 KRW 2,735,510 0.39
HYUNDAIENGINEERING+CONSTR.CO
70,658 KRW 6,080,262 0.87
HYUNDAI HEAVY INDUSTRIES 21,098 KRW 7,820,396 1.13
HYUNDAI STEEL CO 3,771 KRW 263,944 0.04
KOOKMIN BANK 83,520 KRW 4,673,278 0.67
KOREA EXCHANGE BANK 254,400 KRW 3,391,661 0.49
KT& G CORP 88,930 KRW 6,952,014 1.00
LG CHEMICAL LTD 27,900 KRW 2,073,974 0.30
LG DISPLAY CO LTD 100,720 KRW 4,496,342 0.65
LG ELECTRONICS INC 45,600 KRW 5,803,056 0.84
MEGASTUDY CO LTD 33,716 KRW 11,237,543 1.62
NHN CORPORATION 36,645 KRW 8,586,656 1.24
POSCO 26,755 KRW 12,781,666 1.84
SAMSUNG ELECTRONICS CO LTD 44,774 KRW 28,173,144 4.06
SAMSUNG ENGINEERING CO LTD 54,500 KRW 5,053,131 0.73
SAMSUNG FIRE&MARINE INSUR. 28,270 KRW 5,810,475 0.84
SHINHAN FINANCIAL GROUP 126,840 KRW 6,623,204 0.95
SHINSEGAE CO LTD 5,414 KRW 3,412,119 0.49
STX ENGINE CO LTD 41,540 KRW 1,911,069 0.27
WOORI INVESTMENT&SECURIT.CO 33,170 KRW 696,835 0.10 ______________________
149,581,550 21.55 ______________________
TAIWAN
ADVANCEDSEMICONDUCT.ENG.INC
3,610,431 TWD 3,514,059 0.51
ASUSTEK COMPUTER INC 1,233,423 TWD 3,609,610 0.52
AU OPTRONICS CORP 5,516,179 TWD 9,558,884 1.38
CATHAY FIN.HLD/GDR REG-S 133,693 USD 3,406,947 0.49
CATHAY FINANCIAL HOLDING 929,992 TWD 2,369,950 0.34
CHINA STEEL 4,005,989 TWD 6,322,797 0.91
CHINATRUST FINANCIAL HLDG CO 4,203,000 TWD 4,056,259 0.58
CHROMA ATE INC 1,398,828 TWD 3,307,131 0.48
CHUNGHWA TELECOM / SADR 316,700 USD 8,205,697 1.18
CHUNGHWA TELECOM CO LTD 355,000 TWD 932,681 0.13
FAR EASTERN TEXTILE LTD 4,769,610 TWD 8,029,917 1.16
Description Quantity Currency Evaluation % netassets
FIRST FIN.HLD/GDR REG.S 252,200 USD 5,282,500 0.76
FIRST FINANCIAL HOLDING COMP. 1,147,000 TWD 1,201,244 0.17
FORMOSA PLASTICS 3,213,000 TWD 9,709,223 1.40
HIGH TECH COMPUTER CORP 318,000 TWD 7,141,773 1.03
HON HAI PRECISION IND /GDR 333,940 USD 3,763,504 0.54
HON HAI PRECISION IND.CO LTD 1,599,340 TWD 9,150,573 1.32
INNOLUX DISPLAY CORP 904,382 TWD 2,376,057 0.34
MEDIA TEK INCORPORATION 303,156 TWD 3,987,350 0.57
MOTECH IND CO LTD/SGDR REGS. 291,849 USD 2,000,872 0.29
TAIWAN CEMENT CORP 3,771,099 TWD 7,303,675 1.05
TAIWAN FERTILIZER CO LTD 1,416,000 TWD 6,169,321 0.89
TAIWANSEMICONDUCT.MANUF/SADR
358,278 USD 3,643,687 0.52
TAIWAN SEMICONDUCTOR MANUFACT.
7,724,837 TWD 16,027,911 2.31
TRIPOD TECHNOLOGY CO LTD 649,344 TWD 2,188,552 0.32
TUNG HO STEEL ENTERPRISE CORP
1,947,000 TWD 3,649,211 0.53
WISTRON CORP 1,092,000 TWD 1,737,906 0.25
YUANTA FINANCIAL HOLDING CO 3,579,000 TWD 3,354,013 0.48 ______________________
142,001,304 20.45 ______________________
THAILAND
BANGKOK BANK PUBLIC /FOR. REG. 1,444,100 THB 6,331,509 0.91
PTT PLC CO LTD /FOREIGN REG. 577,500 THB 5,834,585 0.84
SIAM COMMERC.BK PUBL./FOR.REG.
937,400 THB 2,754,848 0.40
THAI AIRWAYS INTL/FOR.REG. 2,251,900 THB 2,074,808 0.30 ______________________
16,995,750 2.45 ______________________ TOTAL SHARES 638,475,427 91.97 ______________________
INVESTMENT COMPANIES
BERMUDA ISLANDS
MACQUARIE INTL INFRASTRUCTURE
15,246,000 SGD 8,832,496 1.27
______________________
8,832,496 1.27 ______________________ TOTAL INVESTMENT COMPANIES 8,832,496 1.27 ______________________
WARRANTS / EQUITY LINKED SECURITIES
GREAT BRITAIN
DEUTSCHE BK 12.02.18 0.000001 WRT/IRB INF ______________________
1,065,573 USD 4,373,222 0.63
4,373,222 0.63 ______________________ TOTAL WARRANTS / EQUITY LINKED SECURITIES 4,373,222 0.63 ______________________ TOTAL TRANSFERABLE SECURITIES ADMITTED TO AN OFFICIAL STOCK EXCHANGE LISTING 651,681,145 93.87 ______________________
HSBC Global Investment Funds 109
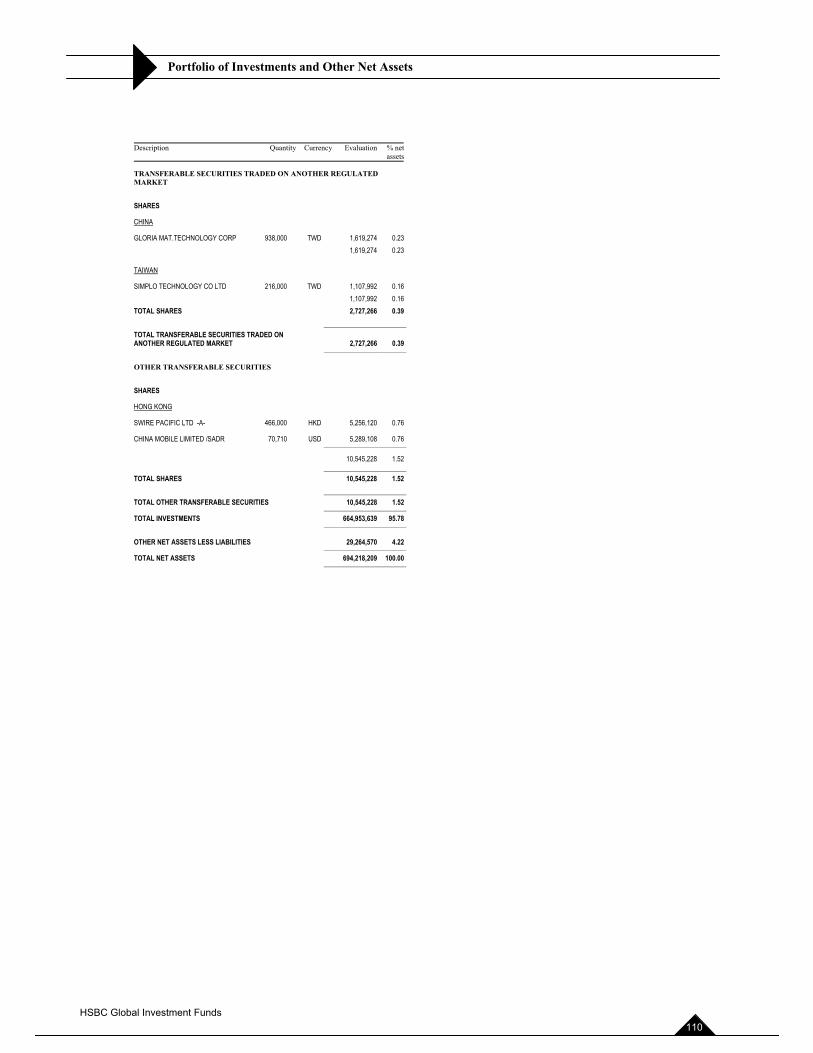
Portfolio of Investments and Other Net Assets
Description Quantity Currency Evaluation % netassets
TRANSFERABLE SECURITIES TRADED ON ANOTHER REGULATED MARKET
SHARES
CHINA
GLORIA MAT.TECHNOLOGY CORP 938,000 TWD 1,619,274 0.231,619,274 0.23
TAIWAN
SIMPLO TECHNOLOGY CO LTD 216,000 TWD 1,107,992 0.161,107,992 0.16
TOTAL SHARES 2,727,266 0.39 ______________________ TOTAL TRANSFERABLE SECURITIES TRADED ON ANOTHER REGULATED MARKET 2,727,266 0.39 ______________________
OTHER TRANSFERABLE SECURITIES
SHARES
HONG KONG
SWIRE PACIFIC LTD -A- 466,000 HKD 5,256,120 0.76
CHINA MOBILE LIMITED /SADR 70,710 USD 5,289,108 0.76 ______________________
10,545,228 1.52 ______________________ TOTAL SHARES 10,545,228 1.52 ______________________ TOTAL OTHER TRANSFERABLE SECURITIES 10,545,228 1.52 ______________________ TOTAL INVESTMENTS 664,953,639 95.78 ______________________
OTHER NET ASSETS LESS LIABILITIES 29,264,570 4.22 ______________________ TOTAL NET ASSETS 694,218,209 100.00 ______________________
HSBC Global Investment Funds 110
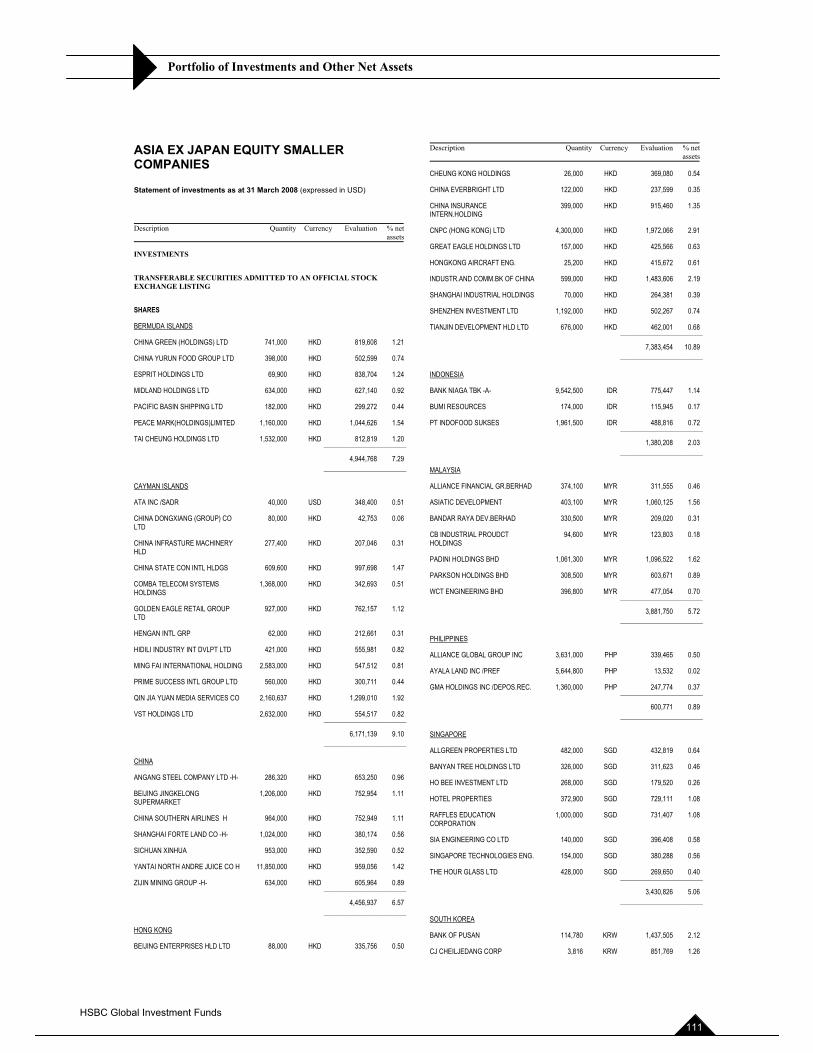
Portfolio of Investments and Other Net Assets
ASIA EX JAPAN EQUITY SMALLER COMPANIES
Statement of investments as at 31 March 2008 (expressed in USD)
Description Quantity Currency Evaluation % netassets
INVESTMENTS
TRANSFERABLE SECURITIES ADMITTED TO AN OFFICIAL STOCK EXCHANGE LISTING
SHARES
BERMUDA ISLANDS
CHINA GREEN (HOLDINGS) LTD 741,000 HKD 819,608 1.21
CHINA YURUN FOOD GROUP LTD 398,000 HKD 502,599 0.74
ESPRIT HOLDINGS LTD 69,900 HKD 838,704 1.24
MIDLAND HOLDINGS LTD 634,000 HKD 627,140 0.92
PACIFIC BASIN SHIPPING LTD 182,000 HKD 299,272 0.44
PEACE MARK(HOLDINGS)LIMITED 1,160,000 HKD 1,044,626 1.54
TAI CHEUNG HOLDINGS LTD 1,532,000 HKD 812,819 1.20 ______________________
4,944,768 7.29 ______________________
CAYMAN ISLANDS
ATA INC /SADR 40,000 USD 348,400 0.51
CHINA DONGXIANG (GROUP) CO LTD
80,000 HKD 42,753 0.06
CHINA INFRASTURE MACHINERY HLD
277,400 HKD 207,046 0.31
CHINA STATE CON INTL HLDGS 609,600 HKD 997,698 1.47
COMBA TELECOM SYSTEMS HOLDINGS
1,368,000 HKD 342,693 0.51
GOLDEN EAGLE RETAIL GROUP LTD
927,000 HKD 762,157 1.12
HENGAN INTL GRP 62,000 HKD 212,661 0.31
HIDILI INDUSTRY INT DVLPT LTD 421,000 HKD 555,981 0.82
MING FAI INTERNATIONAL HOLDING 2,583,000 HKD 547,512 0.81
PRIME SUCCESS INTL GROUP LTD 560,000 HKD 300,711 0.44
QIN JIA YUAN MEDIA SERVICES CO 2,160,637 HKD 1,299,010 1.92
VST HOLDINGS LTD 2,632,000 HKD 554,517 0.82 ______________________
6,171,139 9.10 ______________________
CHINA
ANGANG STEEL COMPANY LTD -H- 286,320 HKD 653,250 0.96
BEIJING JINGKELONG SUPERMARKET
1,206,000 HKD 752,954 1.11
CHINA SOUTHERN AIRLINES H 964,000 HKD 752,949 1.11
SHANGHAI FORTE LAND CO -H- 1,024,000 HKD 380,174 0.56
SICHUAN XINHUA 953,000 HKD 352,590 0.52
YANTAI NORTH ANDRE JUICE CO H 11,850,000 HKD 959,056 1.42
ZIJIN MINING GROUP -H- 634,000 HKD 605,964 0.89 ______________________
4,456,937 6.57 ______________________
HONG KONG
BEIJING ENTERPRISES HLD LTD 88,000 HKD 335,756 0.50
Description Quantity Currency Evaluation % netassets
CHEUNG KONG HOLDINGS 26,000 HKD 369,080 0.54
CHINA EVERBRIGHT LTD 122,000 HKD 237,599 0.35
CHINA INSURANCE INTERN.HOLDING
399,000 HKD 915,460 1.35
CNPC (HONG KONG) LTD 4,300,000 HKD 1,972,066 2.91
GREAT EAGLE HOLDINGS LTD 157,000 HKD 425,566 0.63
HONGKONG AIRCRAFT ENG. 25,200 HKD 415,672 0.61
INDUSTR.AND COMM.BK OF CHINA 599,000 HKD 1,483,606 2.19
SHANGHAI INDUSTRIAL HOLDINGS 70,000 HKD 264,381 0.39
SHENZHEN INVESTMENT LTD 1,192,000 HKD 502,267 0.74
TIANJIN DEVELOPMENT HLD LTD 676,000 HKD 462,001 0.68 ______________________
7,383,454 10.89 ______________________
INDONESIA
BANK NIAGA TBK -A- 9,542,500 IDR 775,447 1.14
BUMI RESOURCES 174,000 IDR 115,945 0.17
PT INDOFOOD SUKSES 1,961,500 IDR 488,816 0.72 ______________________
1,380,208 2.03 ______________________
MALAYSIA
ALLIANCE FINANCIAL GR.BERHAD 374,100 MYR 311,555 0.46
ASIATIC DEVELOPMENT 403,100 MYR 1,060,125 1.56
BANDAR RAYA DEV.BERHAD 330,500 MYR 209,020 0.31
CB INDUSTRIAL PROUDCT HOLDINGS
94,600 MYR 123,803 0.18
PADINI HOLDINGS BHD 1,061,300 MYR 1,096,522 1.62
PARKSON HOLDINGS BHD 308,500 MYR 603,671 0.89
WCT ENGINEERING BHD 396,800 MYR 477,054 0.70 ______________________
3,881,750 5.72 ______________________
PHILIPPINES
ALLIANCE GLOBAL GROUP INC 3,631,000 PHP 339,465 0.50
AYALA LAND INC /PREF 5,644,800 PHP 13,532 0.02
GMA HOLDINGS INC /DEPOS.REC. 1,360,000 PHP 247,774 0.37 ______________________
600,771 0.89 ______________________
SINGAPORE
ALLGREEN PROPERTIES LTD 482,000 SGD 432,819 0.64
BANYAN TREE HOLDINGS LTD 326,000 SGD 311,623 0.46
HO BEE INVESTMENT LTD 268,000 SGD 179,520 0.26
HOTEL PROPERTIES 372,900 SGD 729,111 1.08
RAFFLES EDUCATION CORPORATION
1,000,000 SGD 731,407 1.08
SIA ENGINEERING CO LTD 140,000 SGD 396,408 0.58
SINGAPORE TECHNOLOGIES ENG. 154,000 SGD 380,288 0.56
THE HOUR GLASS LTD 428,000 SGD 269,650 0.40 ______________________
3,430,826 5.06 ______________________
SOUTH KOREA
BANK OF PUSAN 114,780 KRW 1,437,505 2.12
CJ CHEILJEDANG CORP 3,816 KRW 851,769 1.26
HSBC Global Investment Funds 111
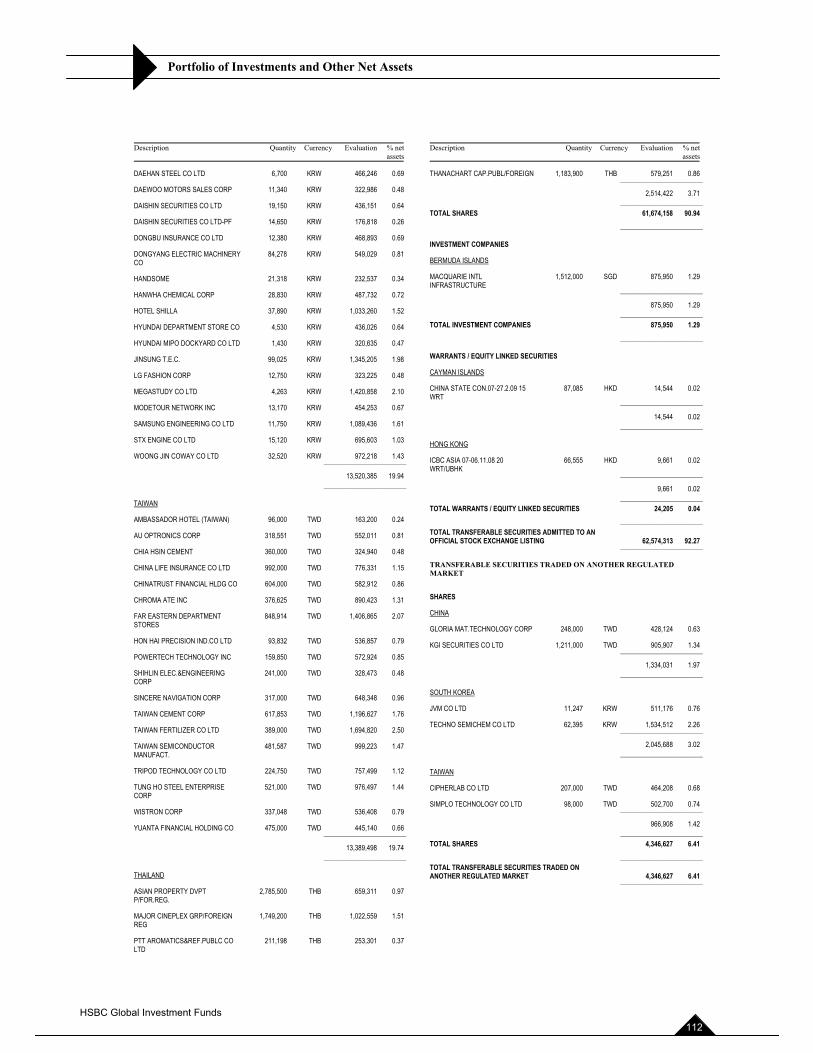
Portfolio of Investments and Other Net Assets
Description Quantity Currency Evaluation % netassets
DAEHAN STEEL CO LTD 6,700 KRW 466,246 0.69
DAEWOO MOTORS SALES CORP 11,340 KRW 322,986 0.48
DAISHIN SECURITIES CO LTD 19,150 KRW 436,151 0.64
DAISHIN SECURITIES CO LTD-PF 14,650 KRW 176,818 0.26
DONGBU INSURANCE CO LTD 12,380 KRW 468,893 0.69
DONGYANG ELECTRIC MACHINERY CO
84,278 KRW 549,029 0.81
HANDSOME 21,318 KRW 232,537 0.34
HANWHA CHEMICAL CORP 28,830 KRW 487,732 0.72
HOTEL SHILLA 37,890 KRW 1,033,260 1.52
HYUNDAI DEPARTMENT STORE CO 4,530 KRW 436,026 0.64
HYUNDAI MIPO DOCKYARD CO LTD 1,430 KRW 320,635 0.47
JINSUNG T.E.C. 99,025 KRW 1,345,205 1.98
LG FASHION CORP 12,750 KRW 323,225 0.48
MEGASTUDY CO LTD 4,263 KRW 1,420,858 2.10
MODETOUR NETWORK INC 13,170 KRW 454,253 0.67
SAMSUNG ENGINEERING CO LTD 11,750 KRW 1,089,436 1.61
STX ENGINE CO LTD 15,120 KRW 695,603 1.03
WOONG JIN COWAY CO LTD 32,520 KRW 972,218 1.43 ______________________
13,520,385 19.94 ______________________
TAIWAN
AMBASSADOR HOTEL (TAIWAN) 96,000 TWD 163,200 0.24
AU OPTRONICS CORP 318,551 TWD 552,011 0.81
CHIA HSIN CEMENT 360,000 TWD 324,940 0.48
CHINA LIFE INSURANCE CO LTD 992,000 TWD 776,331 1.15
CHINATRUST FINANCIAL HLDG CO 604,000 TWD 582,912 0.86
CHROMA ATE INC 376,625 TWD 890,423 1.31
FAR EASTERN DEPARTMENT STORES
848,914 TWD 1,406,865 2.07
HON HAI PRECISION IND.CO LTD 93,832 TWD 536,857 0.79
POWERTECH TECHNOLOGY INC 159,850 TWD 572,924 0.85
SHIHLIN ELEC.&ENGINEERING CORP
241,000 TWD 328,473 0.48
SINCERE NAVIGATION CORP 317,000 TWD 648,348 0.96
TAIWAN CEMENT CORP 617,853 TWD 1,196,627 1.76
TAIWAN FERTILIZER CO LTD 389,000 TWD 1,694,820 2.50
TAIWAN SEMICONDUCTOR MANUFACT.
481,587 TWD 999,223 1.47
TRIPOD TECHNOLOGY CO LTD 224,750 TWD 757,499 1.12
TUNG HO STEEL ENTERPRISE CORP
521,000 TWD 976,497 1.44
WISTRON CORP 337,048 TWD 536,408 0.79
YUANTA FINANCIAL HOLDING CO 475,000 TWD 445,140 0.66 ______________________
13,389,498 19.74 ______________________
THAILAND
ASIAN PROPERTY DVPT P/FOR.REG.
2,785,500 THB 659,311 0.97
MAJOR CINEPLEX GRP/FOREIGN REG
1,749,200 THB 1,022,559 1.51
PTT AROMATICS&REF.PUBLC CO LTD
211,198 THB 253,301 0.37
Description Quantity Currency Evaluation % netassets
THANACHART CAP.PUBL/FOREIGN 1,183,900 THB 579,251 0.86 ______________________
2,514,422 3.71 ______________________ TOTAL SHARES 61,674,158 90.94 ______________________
INVESTMENT COMPANIES
BERMUDA ISLANDS
MACQUARIE INTL INFRASTRUCTURE
1,512,000 SGD 875,950 1.29
______________________
875,950 1.29 ______________________ TOTAL INVESTMENT COMPANIES 875,950 1.29 ______________________
WARRANTS / EQUITY LINKED SECURITIES
CAYMAN ISLANDS
CHINA STATE CON.07-27.2.09 15 WRT ______________________
87,085 HKD 14,544 0.02
14,544 0.02 ______________________
HONG KONG
ICBC ASIA 07-06.11.08 20 WRT/UBHK ______________________
66,555 HKD 9,661 0.02
9,661 0.02 ______________________ TOTAL WARRANTS / EQUITY LINKED SECURITIES 24,205 0.04 ______________________ TOTAL TRANSFERABLE SECURITIES ADMITTED TO AN OFFICIAL STOCK EXCHANGE LISTING 62,574,313 92.27 ______________________
TRANSFERABLE SECURITIES TRADED ON ANOTHER REGULATED MARKET
SHARES
CHINA
GLORIA MAT.TECHNOLOGY CORP 248,000 TWD 428,124 0.63
KGI SECURITIES CO LTD 1,211,000 TWD 905,907 1.34 ______________________
1,334,031 1.97 ______________________
SOUTH KOREA
JVM CO LTD 11,247 KRW 511,176 0.76
TECHNO SEMICHEM CO LTD 62,395 KRW 1,534,512 2.26 ______________________
2,045,688 3.02 ______________________
TAIWAN
CIPHERLAB CO LTD 207,000 TWD 464,208 0.68
SIMPLO TECHNOLOGY CO LTD 98,000 TWD 502,700 0.74 ______________________
966,908 1.42 ______________________ TOTAL SHARES 4,346,627 6.41 ______________________ TOTAL TRANSFERABLE SECURITIES TRADED ON ANOTHER REGULATED MARKET 4,346,627 6.41 ______________________
HSBC Global Investment Funds 112
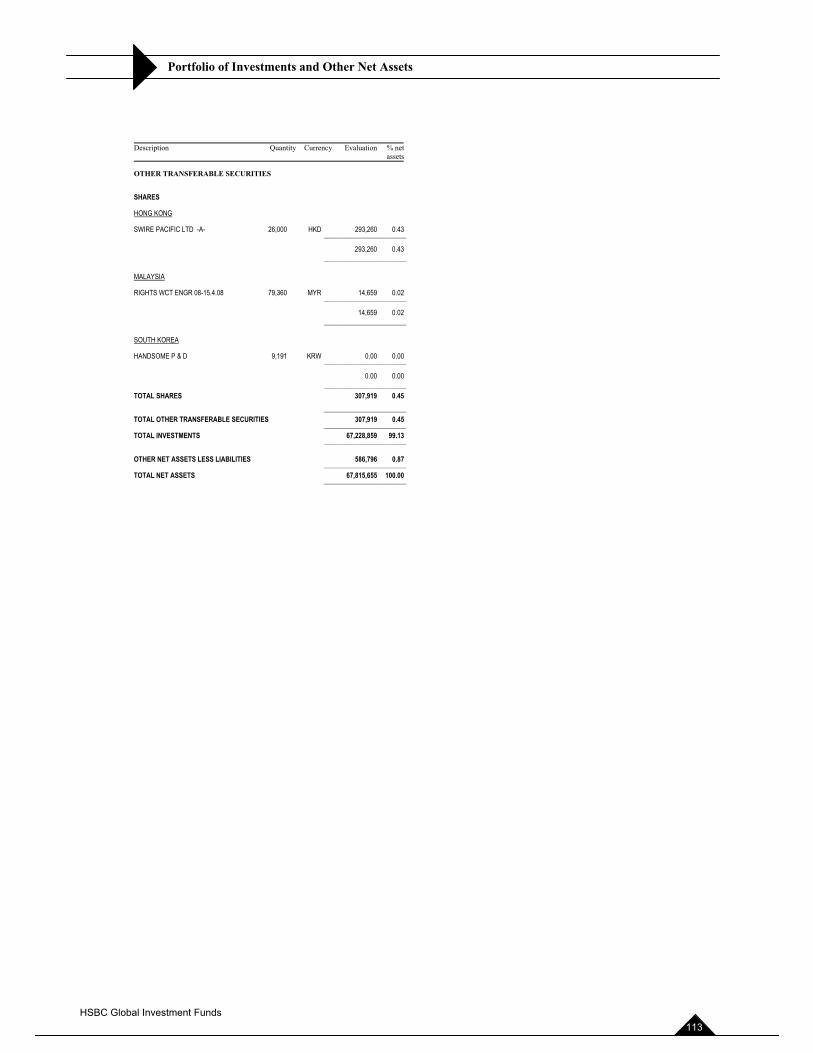
Portfolio of Investments and Other Net Assets
Description Quantity Currency Evaluation % netassets
OTHER TRANSFERABLE SECURITIES
SHARES
HONG KONG
SWIRE PACIFIC LTD -A- 26,000 HKD 293,260 0.43 ______________________
293,260 0.43 ______________________
MALAYSIA
RIGHTS WCT ENGR 08-15.4.08 79,360 MYR 14,659 0.02 ______________________
14,659 0.02 ______________________
SOUTH KOREA
HANDSOME P & D 9,191 KRW 0.00 0.00 ______________________
0.00 0.00 ______________________ TOTAL SHARES 307,919 0.45 ______________________ TOTAL OTHER TRANSFERABLE SECURITIES 307,919 0.45 ______________________ TOTAL INVESTMENTS 67,228,859 99.13 ______________________
OTHER NET ASSETS LESS LIABILITIES 586,796 0.87 ______________________ TOTAL NET ASSETS 67,815,655 100.00 ______________________
HSBC Global Investment Funds 113
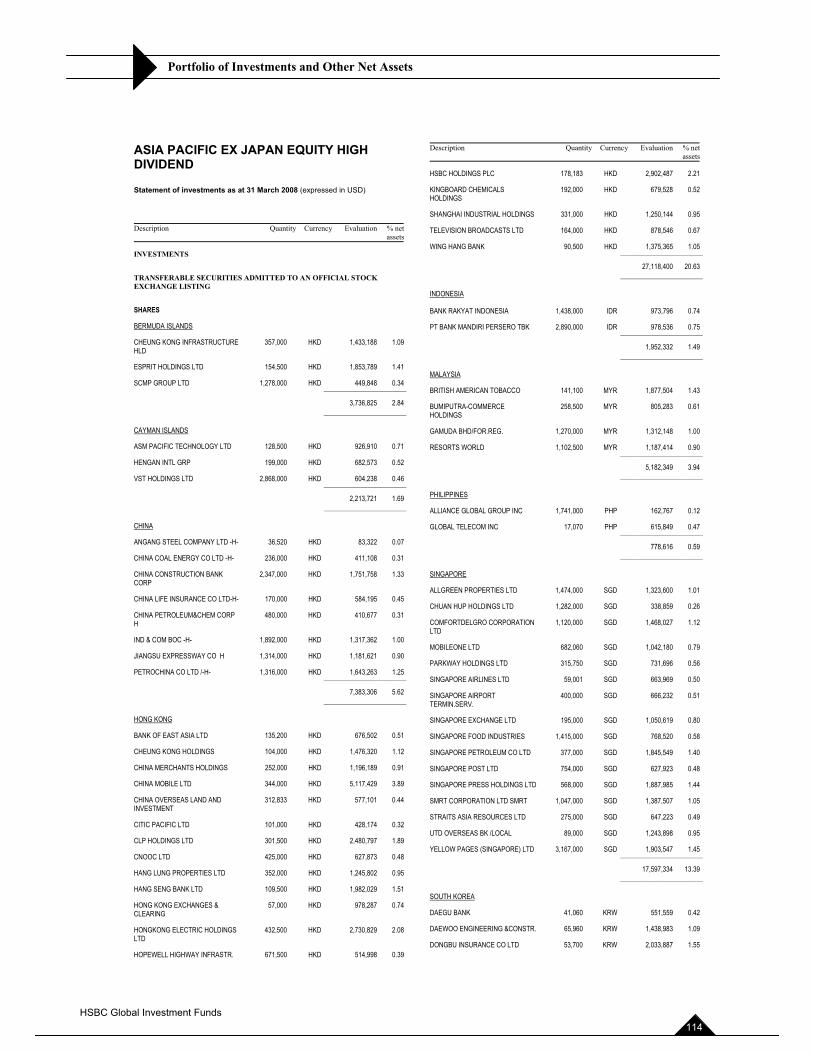
Portfolio of Investments and Other Net Assets
ASIA PACIFIC EX JAPAN EQUITY HIGH DIVIDEND
Statement of investments as at 31 March 2008 (expressed in USD)
Description Quantity Currency Evaluation % netassets
INVESTMENTS
TRANSFERABLE SECURITIES ADMITTED TO AN OFFICIAL STOCK EXCHANGE LISTING
SHARES
BERMUDA ISLANDS
CHEUNG KONG INFRASTRUCTURE HLD
357,000 HKD 1,433,188 1.09
ESPRIT HOLDINGS LTD 154,500 HKD 1,853,789 1.41
SCMP GROUP LTD 1,278,000 HKD 449,848 0.34 ______________________
3,736,825 2.84 ______________________
CAYMAN ISLANDS
ASM PACIFIC TECHNOLOGY LTD 128,500 HKD 926,910 0.71
HENGAN INTL GRP 199,000 HKD 682,573 0.52
VST HOLDINGS LTD 2,868,000 HKD 604,238 0.46 ______________________
2,213,721 1.69 ______________________
CHINA
ANGANG STEEL COMPANY LTD -H- 36,520 HKD 83,322 0.07
CHINA COAL ENERGY CO LTD -H- 236,000 HKD 411,108 0.31
CHINA CONSTRUCTION BANK CORP
2,347,000 HKD 1,751,758 1.33
CHINA LIFE INSURANCE CO LTD-H- 170,000 HKD 584,195 0.45
CHINA PETROLEUM&CHEM CORP H
480,000 HKD 410,677 0.31
IND & COM BOC -H- 1,892,000 HKD 1,317,362 1.00
JIANGSU EXPRESSWAY CO H 1,314,000 HKD 1,181,621 0.90
PETROCHINA CO LTD /-H- 1,316,000 HKD 1,643,263 1.25 ______________________
7,383,306 5.62 ______________________
HONG KONG
BANK OF EAST ASIA LTD 135,200 HKD 676,502 0.51
CHEUNG KONG HOLDINGS 104,000 HKD 1,476,320 1.12
CHINA MERCHANTS HOLDINGS 252,000 HKD 1,196,189 0.91
CHINA MOBILE LTD 344,000 HKD 5,117,429 3.89
CHINA OVERSEAS LAND AND INVESTMENT
312,833 HKD 577,101 0.44
CITIC PACIFIC LTD 101,000 HKD 428,174 0.32
CLP HOLDINGS LTD 301,500 HKD 2,480,797 1.89
CNOOC LTD 425,000 HKD 627,873 0.48
HANG LUNG PROPERTIES LTD 352,000 HKD 1,245,802 0.95
HANG SENG BANK LTD 109,500 HKD 1,982,029 1.51
HONG KONG EXCHANGES & CLEARING
57,000 HKD 978,287 0.74
HONGKONG ELECTRIC HOLDINGS LTD
432,500 HKD 2,730,829 2.08
HOPEWELL HIGHWAY INFRASTR. 671,500 HKD 514,998 0.39
Description Quantity Currency Evaluation % netassets
HSBC HOLDINGS PLC 178,183 HKD 2,902,487 2.21
KINGBOARD CHEMICALS HOLDINGS
192,000 HKD 679,528 0.52
SHANGHAI INDUSTRIAL HOLDINGS 331,000 HKD 1,250,144 0.95
TELEVISION BROADCASTS LTD 164,000 HKD 878,546 0.67
WING HANG BANK 90,500 HKD 1,375,365 1.05 ______________________
27,118,400 20.63 ______________________
INDONESIA
BANK RAKYAT INDONESIA 1,438,000 IDR 973,796 0.74
PT BANK MANDIRI PERSERO TBK 2,890,000 IDR 978,536 0.75 ______________________
1,952,332 1.49 ______________________
MALAYSIA
BRITISH AMERICAN TOBACCO 141,100 MYR 1,877,504 1.43
BUMIPUTRA-COMMERCE HOLDINGS
258,500 MYR 805,283 0.61
GAMUDA BHD/FOR.REG. 1,270,000 MYR 1,312,148 1.00
RESORTS WORLD 1,102,500 MYR 1,187,414 0.90 ______________________
5,182,349 3.94 ______________________
PHILIPPINES
ALLIANCE GLOBAL GROUP INC 1,741,000 PHP 162,767 0.12
GLOBAL TELECOM INC 17,070 PHP 615,849 0.47 ______________________
778,616 0.59 ______________________
SINGAPORE
ALLGREEN PROPERTIES LTD 1,474,000 SGD 1,323,600 1.01
CHUAN HUP HOLDINGS LTD 1,282,000 SGD 338,859 0.26
COMFORTDELGRO CORPORATION LTD
1,120,000 SGD 1,468,027 1.12
MOBILEONE LTD 682,060 SGD 1,042,180 0.79
PARKWAY HOLDINGS LTD 315,750 SGD 731,696 0.56
SINGAPORE AIRLINES LTD 59,001 SGD 663,969 0.50
SINGAPORE AIRPORT TERMIN.SERV.
400,000 SGD 666,232 0.51
SINGAPORE EXCHANGE LTD 195,000 SGD 1,050,619 0.80
SINGAPORE FOOD INDUSTRIES 1,415,000 SGD 768,520 0.58
SINGAPORE PETROLEUM CO LTD 377,000 SGD 1,845,549 1.40
SINGAPORE POST LTD 754,000 SGD 627,923 0.48
SINGAPORE PRESS HOLDINGS LTD 568,000 SGD 1,887,985 1.44
SMRT CORPORATION LTD SMRT 1,047,000 SGD 1,387,507 1.05
STRAITS ASIA RESOURCES LTD 275,000 SGD 647,223 0.49
UTD OVERSEAS BK /LOCAL 89,000 SGD 1,243,898 0.95
YELLOW PAGES (SINGAPORE) LTD 3,167,000 SGD 1,903,547 1.45 ______________________
17,597,334 13.39 ______________________
SOUTH KOREA
DAEGU BANK 41,060 KRW 551,559 0.42
DAEWOO ENGINEERING &CONSTR. 65,960 KRW 1,438,983 1.09
DONGBU INSURANCE CO LTD 53,700 KRW 2,033,887 1.55
HSBC Global Investment Funds 114
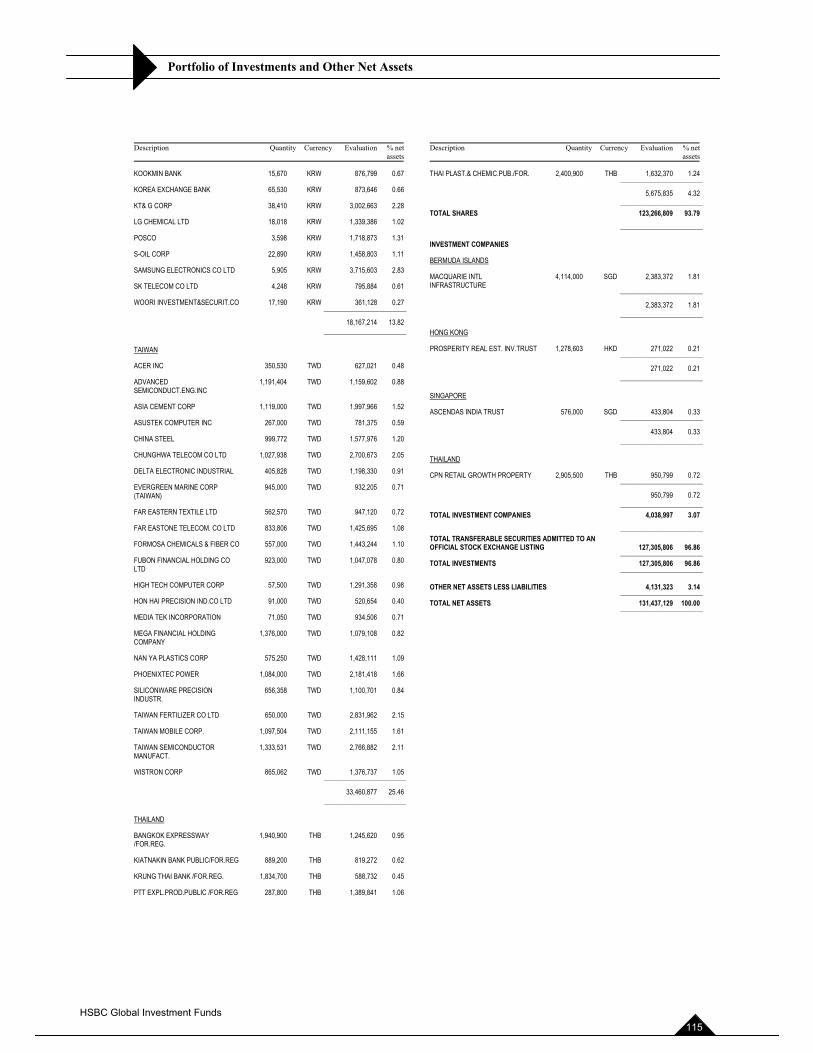
Portfolio of Investments and Other Net Assets
Description Quantity Currency Evaluation % netassets
KOOKMIN BANK 15,670 KRW 876,799 0.67
KOREA EXCHANGE BANK 65,530 KRW 873,646 0.66
KT& G CORP 38,410 KRW 3,002,663 2.28
LG CHEMICAL LTD 18,018 KRW 1,339,386 1.02
POSCO 3,598 KRW 1,718,873 1.31
S-OIL CORP 22,890 KRW 1,458,803 1.11
SAMSUNG ELECTRONICS CO LTD 5,905 KRW 3,715,603 2.83
SK TELECOM CO LTD 4,248 KRW 795,884 0.61
WOORI INVESTMENT&SECURIT.CO 17,190 KRW 361,128 0.27 ______________________
18,167,214 13.82 ______________________
TAIWAN
ACER INC 350,530 TWD 627,021 0.48
ADVANCEDSEMICONDUCT.ENG.INC
1,191,404 TWD 1,159,602 0.88
ASIA CEMENT CORP 1,119,000 TWD 1,997,966 1.52
ASUSTEK COMPUTER INC 267,000 TWD 781,375 0.59
CHINA STEEL 999,772 TWD 1,577,976 1.20
CHUNGHWA TELECOM CO LTD 1,027,938 TWD 2,700,673 2.05
DELTA ELECTRONIC INDUSTRIAL 405,828 TWD 1,198,330 0.91
EVERGREEN MARINE CORP (TAIWAN)
945,000 TWD 932,205 0.71
FAR EASTERN TEXTILE LTD 562,570 TWD 947,120 0.72
FAR EASTONE TELECOM. CO LTD 833,806 TWD 1,425,695 1.08
FORMOSA CHEMICALS & FIBER CO 557,000 TWD 1,443,244 1.10
FUBON FINANCIAL HOLDING CO LTD
923,000 TWD 1,047,078 0.80
HIGH TECH COMPUTER CORP 57,500 TWD 1,291,358 0.98
HON HAI PRECISION IND.CO LTD 91,000 TWD 520,654 0.40
MEDIA TEK INCORPORATION 71,050 TWD 934,506 0.71
MEGA FINANCIAL HOLDING COMPANY
1,376,000 TWD 1,079,108 0.82
NAN YA PLASTICS CORP 575,250 TWD 1,428,111 1.09
PHOENIXTEC POWER 1,084,000 TWD 2,181,418 1.66
SILICONWARE PRECISION INDUSTR.
656,358 TWD 1,100,701 0.84
TAIWAN FERTILIZER CO LTD 650,000 TWD 2,831,962 2.15
TAIWAN MOBILE CORP. 1,097,504 TWD 2,111,155 1.61
TAIWAN SEMICONDUCTOR MANUFACT.
1,333,531 TWD 2,766,882 2.11
WISTRON CORP 865,062 TWD 1,376,737 1.05 ______________________
33,460,877 25.46 ______________________
THAILAND
BANGKOK EXPRESSWAY /FOR.REG.
1,940,900 THB 1,245,620 0.95
KIATNAKIN BANK PUBLIC/FOR.REG 889,200 THB 819,272 0.62
KRUNG THAI BANK /FOR.REG. 1,834,700 THB 588,732 0.45
PTT EXPL.PROD.PUBLIC /FOR.REG 287,800 THB 1,389,841 1.06
Description Quantity Currency Evaluation % netassets
THAI PLAST.& CHEMIC.PUB./FOR. 2,400,900 THB 1,632,370 1.24 ______________________
5,675,835 4.32 ______________________ TOTAL SHARES 123,266,809 93.79 ______________________
INVESTMENT COMPANIES
BERMUDA ISLANDS
MACQUARIE INTL INFRASTRUCTURE
4,114,000 SGD 2,383,372 1.81
______________________
2,383,372 1.81 ______________________
HONG KONG
PROSPERITY REAL EST. INV.TRUST 1,278,603 HKD 271,022 0.21 ______________________
271,022 0.21 ______________________
SINGAPORE
ASCENDAS INDIA TRUST 576,000 SGD 433,804 0.33 ______________________
433,804 0.33 ______________________
THAILAND
CPN RETAIL GROWTH PROPERTY 2,905,500 THB 950,799 0.72 ______________________
950,799 0.72 ______________________ TOTAL INVESTMENT COMPANIES 4,038,997 3.07 ______________________ TOTAL TRANSFERABLE SECURITIES ADMITTED TO AN OFFICIAL STOCK EXCHANGE LISTING 127,305,806 96.86 ______________________ TOTAL INVESTMENTS 127,305,806 96.86 ______________________
OTHER NET ASSETS LESS LIABILITIES 4,131,323 3.14 ______________________ TOTAL NET ASSETS 131,437,129 100.00 ______________________
HSBC Global Investment Funds 115
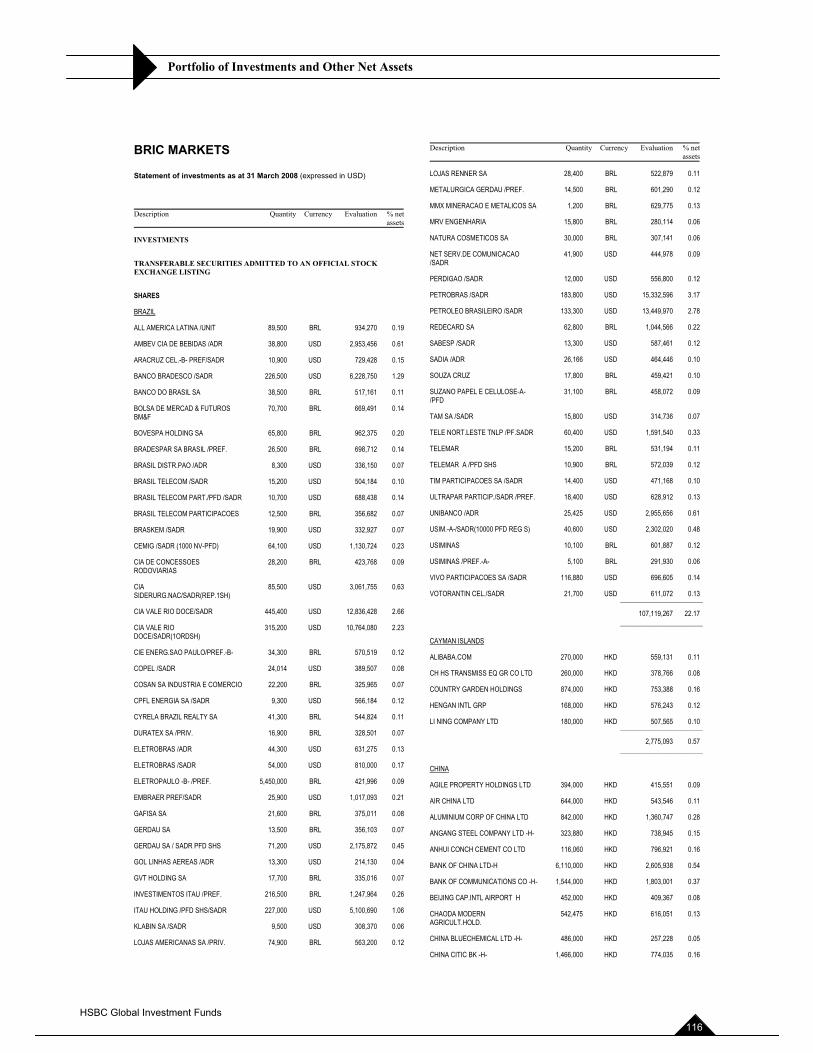
Portfolio of Investments and Other Net Assets
BRIC MARKETS
Statement of investments as at 31 March 2008 (expressed in USD)
Description Quantity Currency Evaluation % netassets
INVESTMENTS
TRANSFERABLE SECURITIES ADMITTED TO AN OFFICIAL STOCK EXCHANGE LISTING
SHARES
BRAZIL
ALL AMERICA LATINA /UNIT 89,500 BRL 934,270 0.19
AMBEV CIA DE BEBIDAS /ADR 38,800 USD 2,953,456 0.61
ARACRUZ CEL.-B- PREF/SADR 10,900 USD 729,428 0.15
BANCO BRADESCO /SADR 226,500 USD 6,228,750 1.29
BANCO DO BRASIL SA 38,500 BRL 517,161 0.11
BOLSA DE MERCAD & FUTUROS BM&F
70,700 BRL 669,491 0.14
BOVESPA HOLDING SA 65,800 BRL 962,375 0.20
BRADESPAR SA BRASIL /PREF. 26,500 BRL 698,712 0.14
BRASIL DISTR.PAO /ADR 8,300 USD 336,150 0.07
BRASIL TELECOM /SADR 15,200 USD 504,184 0.10
BRASIL TELECOM PART./PFD /SADR 10,700 USD 688,438 0.14
BRASIL TELECOM PARTICIPACOES 12,500 BRL 356,682 0.07
BRASKEM /SADR 19,900 USD 332,927 0.07
CEMIG /SADR (1000 NV-PFD) 64,100 USD 1,130,724 0.23
CIA DE CONCESSOES RODOVIARIAS
28,200 BRL 423,768 0.09
CIASIDERURG.NAC/SADR(REP.1SH)
85,500 USD 3,061,755 0.63
CIA VALE RIO DOCE/SADR 445,400 USD 12,836,428 2.66
CIA VALE RIO DOCE/SADR(1ORDSH)
315,200 USD 10,764,080 2.23
CIE ENERG.SAO PAULO/PREF.-B- 34,300 BRL 570,519 0.12
COPEL /SADR 24,014 USD 389,507 0.08
COSAN SA INDUSTRIA E COMERCIO 22,200 BRL 325,965 0.07
CPFL ENERGIA SA /SADR 9,300 USD 566,184 0.12
CYRELA BRAZIL REALTY SA 41,300 BRL 544,824 0.11
DURATEX SA /PRIV. 16,900 BRL 328,501 0.07
ELETROBRAS /ADR 44,300 USD 631,275 0.13
ELETROBRAS /SADR 54,000 USD 810,000 0.17
ELETROPAULO -B- /PREF. 5,450,000 BRL 421,996 0.09
EMBRAER PREF/SADR 25,900 USD 1,017,093 0.21
GAFISA SA 21,600 BRL 375,011 0.08
GERDAU SA 13,500 BRL 356,103 0.07
GERDAU SA / SADR PFD SHS 71,200 USD 2,175,872 0.45
GOL LINHAS AEREAS /ADR 13,300 USD 214,130 0.04
GVT HOLDING SA 17,700 BRL 335,016 0.07
INVESTIMENTOS ITAU /PREF. 216,500 BRL 1,247,964 0.26
ITAU HOLDING /PFD SHS/SADR 227,000 USD 5,100,690 1.06
KLABIN SA /SADR 9,500 USD 308,370 0.06
LOJAS AMERICANAS SA /PRIV. 74,900 BRL 563,200 0.12
Description Quantity Currency Evaluation % netassets
LOJAS RENNER SA 28,400 BRL 522,879 0.11
METALURGICA GERDAU /PREF. 14,500 BRL 601,290 0.12
MMX MINERACAO E METALICOS SA 1,200 BRL 629,775 0.13
MRV ENGENHARIA 15,800 BRL 280,114 0.06
NATURA COSMETICOS SA 30,000 BRL 307,141 0.06
NET SERV.DE COMUNICACAO /SADR
41,900 USD 444,978 0.09
PERDIGAO /SADR 12,000 USD 556,800 0.12
PETROBRAS /SADR 183,800 USD 15,332,596 3.17
PETROLEO BRASILEIRO /SADR 133,300 USD 13,449,970 2.78
REDECARD SA 62,800 BRL 1,044,566 0.22
SABESP /SADR 13,300 USD 587,461 0.12
SADIA /ADR 26,166 USD 464,446 0.10
SOUZA CRUZ 17,800 BRL 459,421 0.10
SUZANO PAPEL E CELULOSE-A-/PFD
31,100 BRL 458,072 0.09
TAM SA /SADR 15,800 USD 314,736 0.07
TELE NORT.LESTE TNLP /PF.SADR 60,400 USD 1,591,540 0.33
TELEMAR 15,200 BRL 531,194 0.11
TELEMAR A /PFD SHS 10,900 BRL 572,039 0.12
TIM PARTICIPACOES SA /SADR 14,400 USD 471,168 0.10
ULTRAPAR PARTICIP./SADR /PREF. 18,400 USD 628,912 0.13
UNIBANCO /ADR 25,425 USD 2,955,656 0.61
USIM.-A-/SADR(10000 PFD REG S) 40,600 USD 2,302,020 0.48
USIMINAS 10,100 BRL 601,887 0.12
USIMINAS /PREF.-A- 5,100 BRL 291,930 0.06
VIVO PARTICIPACOES SA /SADR 116,880 USD 696,605 0.14
VOTORANTIN CEL./SADR 21,700 USD 611,072 0.13 ______________________
107,119,267 22.17 ______________________
CAYMAN ISLANDS
ALIBABA.COM 270,000 HKD 559,131 0.11
CH HS TRANSMISS EQ GR CO LTD 260,000 HKD 378,766 0.08
COUNTRY GARDEN HOLDINGS 874,000 HKD 753,388 0.16
HENGAN INTL GRP 168,000 HKD 576,243 0.12
LI NING COMPANY LTD 180,000 HKD 507,565 0.10 ______________________
2,775,093 0.57 ______________________
CHINA
AGILE PROPERTY HOLDINGS LTD 394,000 HKD 415,551 0.09
AIR CHINA LTD 644,000 HKD 543,546 0.11
ALUMINIUM CORP OF CHINA LTD 842,000 HKD 1,360,747 0.28
ANGANG STEEL COMPANY LTD -H- 323,880 HKD 738,945 0.15
ANHUI CONCH CEMENT CO LTD 116,060 HKD 796,921 0.16
BANK OF CHINA LTD-H 6,110,000 HKD 2,605,938 0.54
BANK OF COMMUNICATIONS CO -H- 1,544,000 HKD 1,803,001 0.37
BEIJING CAP.INTL AIRPORT H 452,000 HKD 409,367 0.08
CHAODA MODERN AGRICULT.HOLD.
542,475 HKD 616,051 0.13
CHINA BLUECHEMICAL LTD -H- 486,000 HKD 257,228 0.05
CHINA CITIC BK -H- 1,466,000 HKD 774,035 0.16
HSBC Global Investment Funds 116
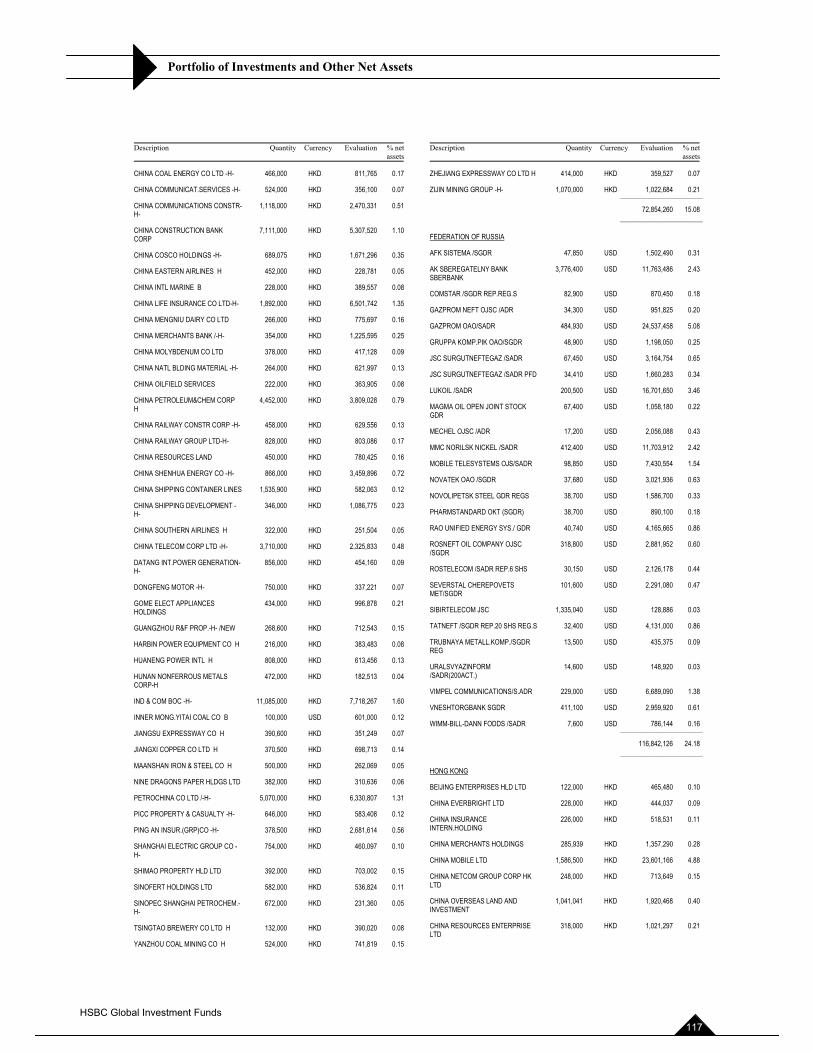
Portfolio of Investments and Other Net Assets
Description Quantity Currency Evaluation % netassets
CHINA COAL ENERGY CO LTD -H- 466,000 HKD 811,765 0.17
CHINA COMMUNICAT.SERVICES -H- 524,000 HKD 356,100 0.07
CHINA COMMUNICATIONS CONSTR-H-
1,118,000 HKD 2,470,331 0.51
CHINA CONSTRUCTION BANK CORP
7,111,000 HKD 5,307,520 1.10
CHINA COSCO HOLDINGS -H- 689,075 HKD 1,671,296 0.35
CHINA EASTERN AIRLINES H 452,000 HKD 228,781 0.05
CHINA INTL MARINE B 228,000 HKD 389,557 0.08
CHINA LIFE INSURANCE CO LTD-H- 1,892,000 HKD 6,501,742 1.35
CHINA MENGNIU DAIRY CO LTD 266,000 HKD 775,697 0.16
CHINA MERCHANTS BANK /-H- 354,000 HKD 1,225,595 0.25
CHINA MOLYBDENUM CO LTD 378,000 HKD 417,128 0.09
CHINA NATL BLDING MATERIAL -H- 264,000 HKD 621,997 0.13
CHINA OILFIELD SERVICES 222,000 HKD 363,905 0.08
CHINA PETROLEUM&CHEM CORP H
4,452,000 HKD 3,809,028 0.79
CHINA RAILWAY CONSTR CORP -H- 458,000 HKD 629,556 0.13
CHINA RAILWAY GROUP LTD-H- 828,000 HKD 803,086 0.17
CHINA RESOURCES LAND 450,000 HKD 780,425 0.16
CHINA SHENHUA ENERGY CO -H- 866,000 HKD 3,459,896 0.72
CHINA SHIPPING CONTAINER LINES 1,535,900 HKD 582,063 0.12
CHINA SHIPPING DEVELOPMENT -H-
346,000 HKD 1,086,775 0.23
CHINA SOUTHERN AIRLINES H 322,000 HKD 251,504 0.05
CHINA TELECOM CORP LTD -H- 3,710,000 HKD 2,325,833 0.48
DATANG INT.POWER GENERATION-H-
856,000 HKD 454,160 0.09
DONGFENG MOTOR -H- 750,000 HKD 337,221 0.07
GOME ELECT APPLIANCES HOLDINGS
434,000 HKD 996,878 0.21
GUANGZHOU R&F PROP.-H- /NEW 268,600 HKD 712,543 0.15
HARBIN POWER EQUIPMENT CO H 216,000 HKD 383,483 0.08
HUANENG POWER INTL H 808,000 HKD 613,456 0.13
HUNAN NONFERROUS METALS CORP-H
472,000 HKD 182,513 0.04
IND & COM BOC -H- 11,085,000 HKD 7,718,267 1.60
INNER MONG.YITAI COAL CO B 100,000 USD 601,000 0.12
JIANGSU EXPRESSWAY CO H 390,600 HKD 351,249 0.07
JIANGXI COPPER CO LTD H 370,500 HKD 698,713 0.14
MAANSHAN IRON & STEEL CO H 500,000 HKD 262,069 0.05
NINE DRAGONS PAPER HLDGS LTD 382,000 HKD 310,636 0.06
PETROCHINA CO LTD /-H- 5,070,000 HKD 6,330,807 1.31
PICC PROPERTY & CASUALTY -H- 646,000 HKD 583,408 0.12
PING AN INSUR.(GRP)CO -H- 378,500 HKD 2,681,614 0.56
SHANGHAI ELECTRIC GROUP CO -H-
754,000 HKD 460,097 0.10
SHIMAO PROPERTY HLD LTD 392,000 HKD 703,002 0.15
SINOFERT HOLDINGS LTD 582,000 HKD 536,824 0.11
SINOPEC SHANGHAI PETROCHEM.-H-
672,000 HKD 231,360 0.05
TSINGTAO BREWERY CO LTD H 132,000 HKD 390,020 0.08
YANZHOU COAL MINING CO H 524,000 HKD 741,819 0.15
Description Quantity Currency Evaluation % netassets
ZHEJIANG EXPRESSWAY CO LTD H 414,000 HKD 359,527 0.07
ZIJIN MINING GROUP -H- 1,070,000 HKD 1,022,684 0.21 ______________________
72,854,260 15.08 ______________________
FEDERATION OF RUSSIA
AFK SISTEMA /SGDR 47,850 USD 1,502,490 0.31
AK SBEREGATELNY BANK SBERBANK
3,776,400 USD 11,763,486 2.43
COMSTAR /SGDR REP.REG.S 82,900 USD 870,450 0.18
GAZPROM NEFT OJSC /ADR 34,300 USD 951,825 0.20
GAZPROM OAO/SADR 484,930 USD 24,537,458 5.08
GRUPPA KOMP.PIK OAO/SGDR 48,900 USD 1,198,050 0.25
JSC SURGUTNEFTEGAZ /SADR 67,450 USD 3,164,754 0.65
JSC SURGUTNEFTEGAZ /SADR PFD 34,410 USD 1,660,283 0.34
LUKOIL /SADR 200,500 USD 16,701,650 3.46
MAGMA OIL OPEN JOINT STOCK GDR
67,400 USD 1,058,180 0.22
MECHEL OJSC /ADR 17,200 USD 2,056,088 0.43
MMC NORILSK NICKEL /SADR 412,400 USD 11,703,912 2.42
MOBILE TELESYSTEMS OJS/SADR 98,850 USD 7,430,554 1.54
NOVATEK OAO /SGDR 37,680 USD 3,021,936 0.63
NOVOLIPETSK STEEL GDR REGS 38,700 USD 1,586,700 0.33
PHARMSTANDARD OKT (SGDR) 38,700 USD 890,100 0.18
RAO UNIFIED ENERGY SYS./ GDR 40,740 USD 4,165,665 0.86
ROSNEFT OIL COMPANY OJSC /SGDR
318,800 USD 2,881,952 0.60
ROSTELECOM /SADR REP.6 SHS 30,150 USD 2,126,178 0.44
SEVERSTAL CHEREPOVETS MET/SGDR
101,600 USD 2,291,080 0.47
SIBIRTELECOM JSC 1,335,040 USD 128,886 0.03
TATNEFT /SGDR REP.20 SHS REG.S 32,400 USD 4,131,000 0.86
TRUBNAYA METALL.KOMP./SGDR REG
13,500 USD 435,375 0.09
URALSVYAZINFORM /SADR(200ACT.)
14,600 USD 148,920 0.03
VIMPEL COMMUNICATIONS/S.ADR 229,000 USD 6,689,090 1.38
VNESHTORGBANK SGDR 411,100 USD 2,959,920 0.61
WIMM-BILL-DANN FODDS /SADR 7,600 USD 786,144 0.16 ______________________
116,842,126 24.18 ______________________
HONG KONG
BEIJING ENTERPRISES HLD LTD 122,000 HKD 465,480 0.10
CHINA EVERBRIGHT LTD 228,000 HKD 444,037 0.09
CHINA INSURANCE INTERN.HOLDING
226,000 HKD 518,531 0.11
CHINA MERCHANTS HOLDINGS 285,939 HKD 1,357,290 0.28
CHINA MOBILE LTD 1,586,500 HKD 23,601,166 4.88
CHINA NETCOM GROUP CORP HK LTD
248,000 HKD 713,649 0.15
CHINA OVERSEAS LAND AND INVESTMENT
1,041,041 HKD 1,920,468 0.40
CHINA RESOURCES ENTERPRISE LTD
318,000 HKD 1,021,297 0.21
HSBC Global Investment Funds 117
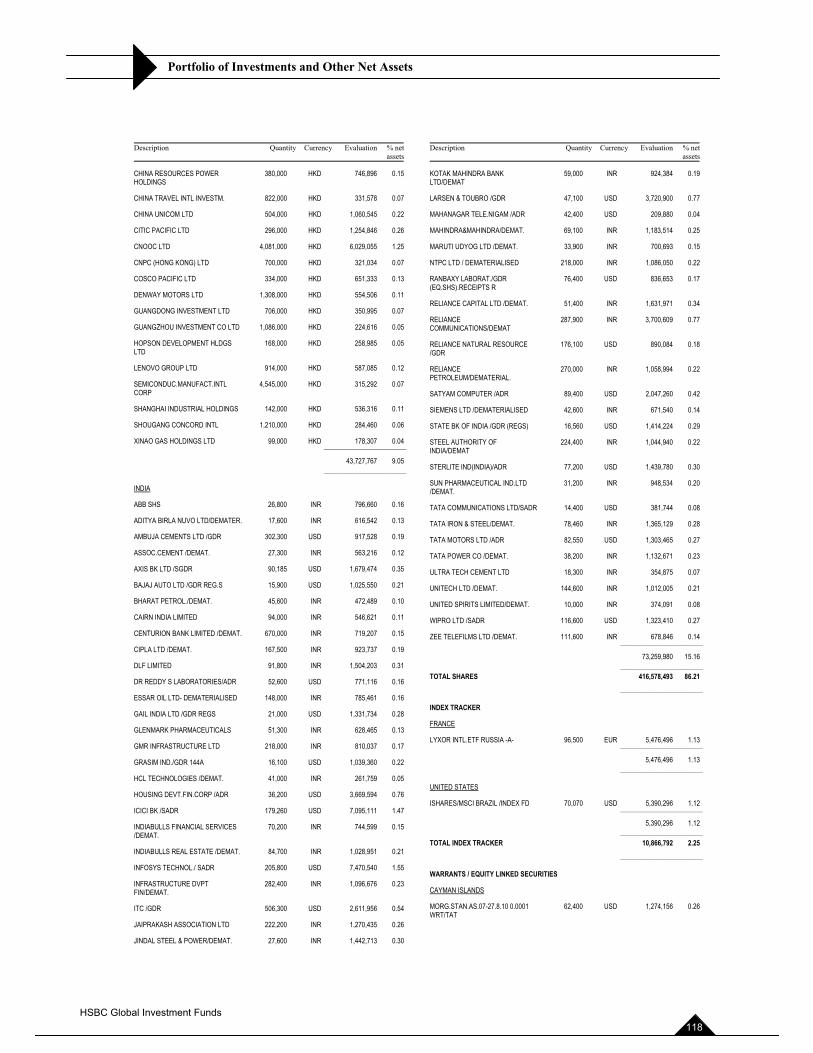
Portfolio of Investments and Other Net Assets
Description Quantity Currency Evaluation % netassets
CHINA RESOURCES POWER HOLDINGS
380,000 HKD 746,896 0.15
CHINA TRAVEL INTL INVESTM. 822,000 HKD 331,578 0.07
CHINA UNICOM LTD 504,000 HKD 1,060,545 0.22
CITIC PACIFIC LTD 296,000 HKD 1,254,846 0.26
CNOOC LTD 4,081,000 HKD 6,029,055 1.25
CNPC (HONG KONG) LTD 700,000 HKD 321,034 0.07
COSCO PACIFIC LTD 334,000 HKD 651,333 0.13
DENWAY MOTORS LTD 1,308,000 HKD 554,506 0.11
GUANGDONG INVESTMENT LTD 706,000 HKD 350,995 0.07
GUANGZHOU INVESTMENT CO LTD 1,086,000 HKD 224,616 0.05
HOPSON DEVELOPMENT HLDGS LTD
168,000 HKD 258,985 0.05
LENOVO GROUP LTD 914,000 HKD 587,085 0.12
SEMICONDUC.MANUFACT.INTL CORP
4,545,000 HKD 315,292 0.07
SHANGHAI INDUSTRIAL HOLDINGS 142,000 HKD 536,316 0.11
SHOUGANG CONCORD INTL 1,210,000 HKD 284,460 0.06
XINAO GAS HOLDINGS LTD 99,000 HKD 178,307 0.04 ______________________
43,727,767 9.05 ______________________
INDIA
ABB SHS 26,800 INR 796,660 0.16
ADITYA BIRLA NUVO LTD/DEMATER. 17,600 INR 616,542 0.13
AMBUJA CEMENTS LTD /GDR 302,300 USD 917,528 0.19
ASSOC.CEMENT /DEMAT. 27,300 INR 563,216 0.12
AXIS BK LTD /SGDR 90,185 USD 1,679,474 0.35
BAJAJ AUTO LTD /GDR REG.S 15,900 USD 1,025,550 0.21
BHARAT PETROL./DEMAT. 45,600 INR 472,489 0.10
CAIRN INDIA LIMITED 94,000 INR 546,621 0.11
CENTURION BANK LIMITED /DEMAT. 670,000 INR 719,207 0.15
CIPLA LTD /DEMAT. 167,500 INR 923,737 0.19
DLF LIMITED 91,800 INR 1,504,203 0.31
DR REDDY S LABORATORIES/ADR 52,600 USD 771,116 0.16
ESSAR OIL LTD- DEMATERIALISED 148,000 INR 785,461 0.16
GAIL INDIA LTD /GDR REGS 21,000 USD 1,331,734 0.28
GLENMARK PHARMACEUTICALS 51,300 INR 628,465 0.13
GMR INFRASTRUCTURE LTD 218,000 INR 810,037 0.17
GRASIM IND./GDR 144A 16,100 USD 1,039,360 0.22
HCL TECHNOLOGIES /DEMAT. 41,000 INR 261,759 0.05
HOUSING DEVT.FIN.CORP /ADR 36,200 USD 3,669,594 0.76
ICICI BK /SADR 179,260 USD 7,095,111 1.47
INDIABULLS FINANCIAL SERVICES /DEMAT.
70,200 INR 744,599 0.15
INDIABULLS REAL ESTATE /DEMAT. 84,700 INR 1,028,951 0.21
INFOSYS TECHNOL./ SADR 205,800 USD 7,470,540 1.55
INFRASTRUCTURE DVPT FIN/DEMAT.
282,400 INR 1,096,676 0.23
ITC /GDR 506,300 USD 2,611,956 0.54
JAIPRAKASH ASSOCIATION LTD 222,200 INR 1,270,435 0.26
JINDAL STEEL & POWER/DEMAT. 27,600 INR 1,442,713 0.30
Description Quantity Currency Evaluation % netassets
KOTAK MAHINDRA BANK LTD/DEMAT
59,000 INR 924,384 0.19
LARSEN & TOUBRO /GDR 47,100 USD 3,720,900 0.77
MAHANAGAR TELE.NIGAM /ADR 42,400 USD 209,880 0.04
MAHINDRA&MAHINDRA/DEMAT. 69,100 INR 1,183,514 0.25
MARUTI UDYOG LTD /DEMAT. 33,900 INR 700,693 0.15
NTPC LTD / DEMATERIALISED 218,000 INR 1,086,050 0.22
RANBAXY LABORAT./GDR (EQ.SHS).RECEIPTS R
76,400 USD 836,653 0.17
RELIANCE CAPITAL LTD /DEMAT. 51,400 INR 1,631,971 0.34
RELIANCE COMMUNICATIONS/DEMAT
287,900 INR 3,700,609 0.77
RELIANCE NATURAL RESOURCE /GDR
176,100 USD 890,084 0.18
RELIANCE PETROLEUM/DEMATERIAL.
270,000 INR 1,058,994 0.22
SATYAM COMPUTER /ADR 89,400 USD 2,047,260 0.42
SIEMENS LTD /DEMATERIALISED 42,600 INR 671,540 0.14
STATE BK OF INDIA /GDR (REGS) 16,560 USD 1,414,224 0.29
STEEL AUTHORITY OF INDIA/DEMAT
224,400 INR 1,044,940 0.22
STERLITE IND(INDIA)/ADR 77,200 USD 1,439,780 0.30
SUN PHARMACEUTICAL IND.LTD /DEMAT.
31,200 INR 948,534 0.20
TATA COMMUNICATIONS LTD/SADR 14,400 USD 381,744 0.08
TATA IRON & STEEL/DEMAT. 78,460 INR 1,365,129 0.28
TATA MOTORS LTD /ADR 82,550 USD 1,303,465 0.27
TATA POWER CO /DEMAT. 38,200 INR 1,132,671 0.23
ULTRA TECH CEMENT LTD 18,300 INR 354,875 0.07
UNITECH LTD /DEMAT. 144,600 INR 1,012,005 0.21
UNITED SPIRITS LIMITED/DEMAT. 10,000 INR 374,091 0.08
WIPRO LTD /SADR 116,600 USD 1,323,410 0.27
ZEE TELEFILMS LTD /DEMAT. 111,600 INR 678,846 0.14 ______________________
73,259,980 15.16 ______________________ TOTAL SHARES 416,578,493 86.21 ______________________
INDEX TRACKER
FRANCE
LYXOR INTL.ETF RUSSIA -A- 96,500 EUR 5,476,496 1.13 ______________________
5,476,496 1.13 ______________________
UNITED STATES
ISHARES/MSCI BRAZIL /INDEX FD 70,070 USD 5,390,296 1.12 ______________________
5,390,296 1.12 ______________________ TOTAL INDEX TRACKER 10,866,792 2.25 ______________________
WARRANTS / EQUITY LINKED SECURITIES
CAYMAN ISLANDS
MORG.STAN.AS.07-27.8.10 0.0001 WRT/TAT
62,400 USD 1,274,156 0.26
HSBC Global Investment Funds 118
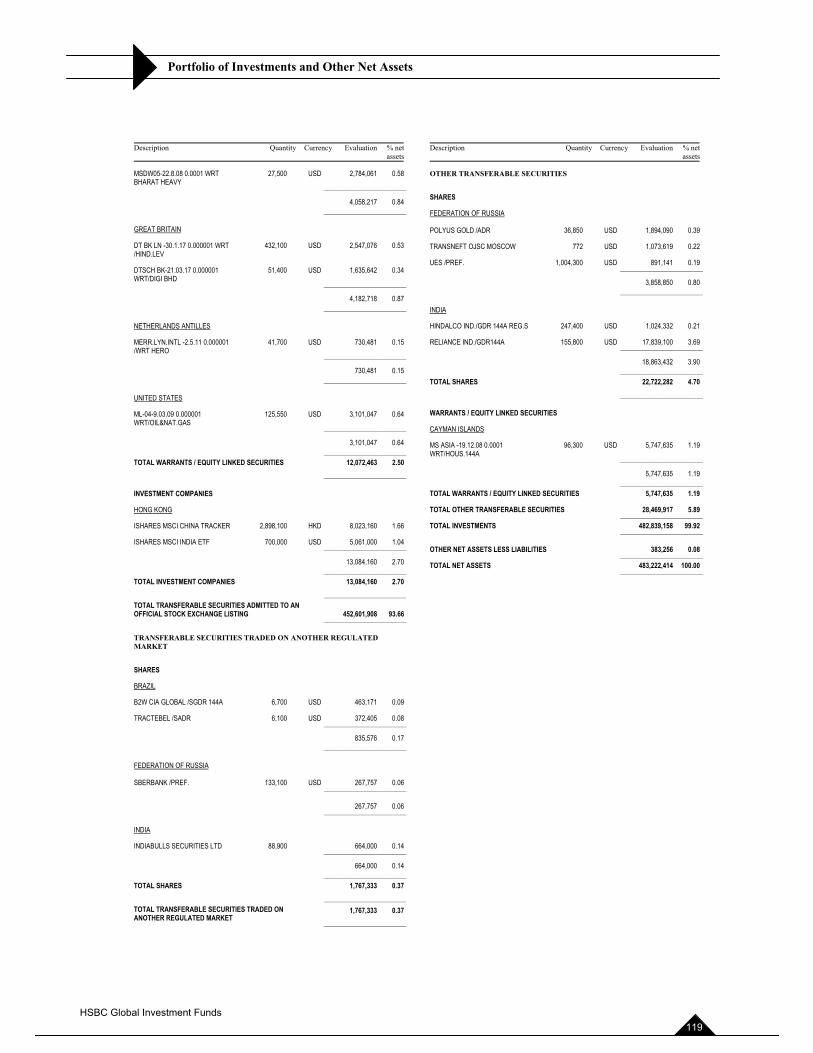
Portfolio of Investments and Other Net Assets
Description Quantity Currency Evaluation % netassets
MSDW05-22.8.08 0.0001 WRT BHARAT HEAVY
27,500 USD 2,784,061 0.58
______________________
4,058,217 0.84 ______________________
GREAT BRITAIN
DT BK LN -30.1.17 0.000001 WRT /HIND.LEV
432,100 USD 2,547,076 0.53
DTSCH BK-21.03.17 0.000001 WRT/DIGI BHD ______________________
51,400 USD 1,635,642 0.34
4,182,718 0.87 ______________________
NETHERLANDS ANTILLES
MERR.LYN.INTL -2.5.11 0.000001 /WRT HERO ______________________
41,700 USD 730,481 0.15
730,481 0.15 ______________________
UNITED STATES
ML-04-9.03.09 0.000001 WRT/OIL&NAT.GAS ______________________
125,550 USD 3,101,047 0.64
3,101,047 0.64 ______________________ TOTAL WARRANTS / EQUITY LINKED SECURITIES 12,072,463 2.50 ______________________
INVESTMENT COMPANIES
HONG KONG
ISHARES MSCI CHINA TRACKER 2,898,100 HKD 8,023,160 1.66
ISHARES MSCI INDIA ETF 700,000 USD 5,061,000 1.04 ______________________
13,084,160 2.70 ______________________ TOTAL INVESTMENT COMPANIES 13,084,160 2.70 ______________________ TOTAL TRANSFERABLE SECURITIES ADMITTED TO AN OFFICIAL STOCK EXCHANGE LISTING 452,601,908 93.66 ______________________
TRANSFERABLE SECURITIES TRADED ON ANOTHER REGULATED MARKET
SHARES
BRAZIL
B2W CIA GLOBAL /SGDR 144A 6,700 USD 463,171 0.09
TRACTEBEL /SADR 6,100 USD 372,405 0.08 ______________________
835,576 0.17 ______________________
FEDERATION OF RUSSIA
SBERBANK /PREF. 133,100 USD 267,757 0.06 ______________________
267,757 0.06 ______________________
INDIA
INDIABULLS SECURITIES LTD 88,900 664,000 0.14 ______________________
664,000 0.14 ______________________ TOTAL SHARES 1,767,333 0.37 ______________________ TOTAL TRANSFERABLE SECURITIES TRADED ON ANOTHER REGULATED MARKET ______________________
1,767,333 0.37
Description Quantity Currency Evaluation % netassets
OTHER TRANSFERABLE SECURITIES
SHARES
FEDERATION OF RUSSIA
POLYUS GOLD /ADR 36,850 USD 1,894,090 0.39
TRANSNEFT OJSC MOSCOW 772 USD 1,073,619 0.22
UES /PREF. 1,004,300 USD 891,141 0.19 ______________________
3,858,850 0.80 ______________________
INDIA
HINDALCO IND./GDR 144A REG.S 247,400 USD 1,024,332 0.21
RELIANCE IND./GDR144A 155,800 USD 17,839,100 3.69 ______________________
18,863,432 3.90 ______________________ TOTAL SHARES 22,722,282 4.70 ______________________
WARRANTS / EQUITY LINKED SECURITIES
CAYMAN ISLANDS
MS ASIA -19.12.08 0.0001 WRT/HOUS.144A ______________________
96,300 USD 5,747,635 1.19
5,747,635 1.19 ______________________ TOTAL WARRANTS / EQUITY LINKED SECURITIES 5,747,635 1.19
TOTAL OTHER TRANSFERABLE SECURITIES 28,469,917 5.89 ______________________ TOTAL INVESTMENTS 482,839,158 99.92 ______________________
OTHER NET ASSETS LESS LIABILITIES 383,256 0.08 ______________________ TOTAL NET ASSETS 483,222,414 100.00 ______________________
HSBC Global Investment Funds 119
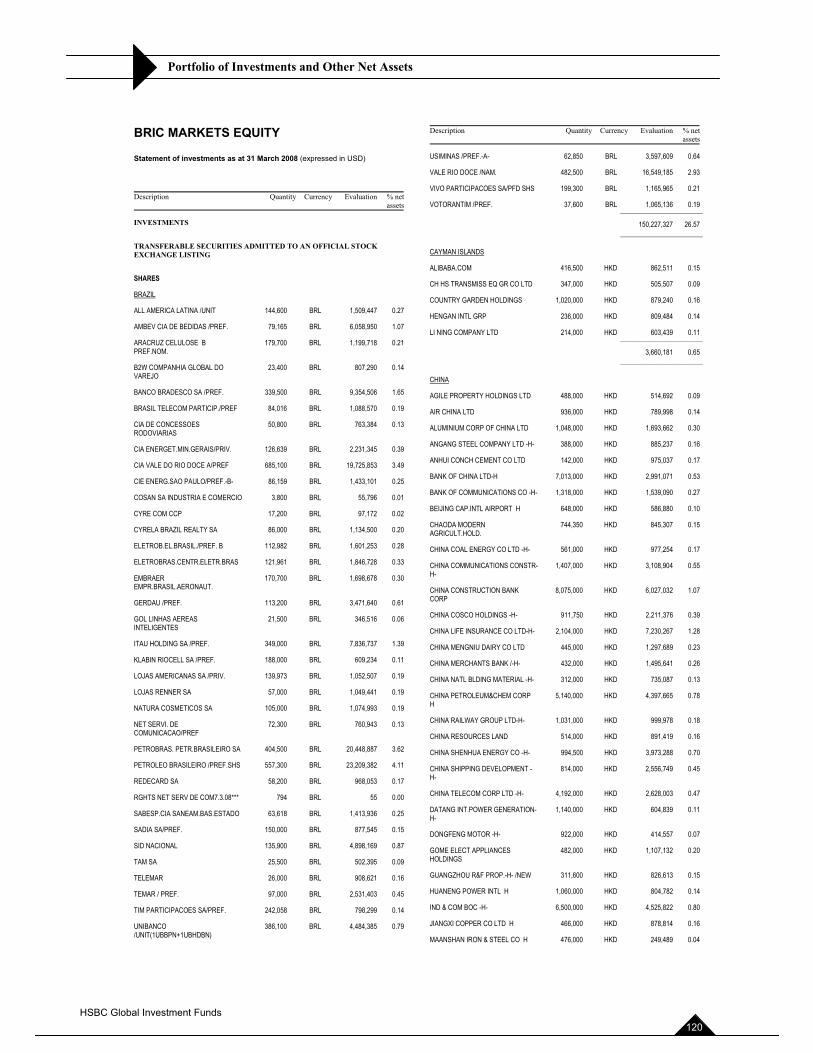
Portfolio of Investments and Other Net Assets
BRIC MARKETS EQUITY
Statement of investments as at 31 March 2008 (expressed in USD)
Description Quantity Currency Evaluation % netassets
INVESTMENTS
TRANSFERABLE SECURITIES ADMITTED TO AN OFFICIAL STOCK EXCHANGE LISTING
SHARES
BRAZIL
ALL AMERICA LATINA /UNIT 144,600 BRL 1,509,447 0.27
AMBEV CIA DE BEDIDAS /PREF. 79,165 BRL 6,058,950 1.07
ARACRUZ CELULOSE B PREF.NOM.
179,700 BRL 1,199,718 0.21
B2W COMPANHIA GLOBAL DO VAREJO
23,400 BRL 807,290 0.14
BANCO BRADESCO SA /PREF. 339,500 BRL 9,354,506 1.65
BRASIL TELECOM PARTICIP./PREF 84,016 BRL 1,088,570 0.19
CIA DE CONCESSOES RODOVIARIAS
50,800 BRL 763,384 0.13
CIA ENERGET.MIN.GERAIS/PRIV. 126,639 BRL 2,231,345 0.39
CIA VALE DO RIO DOCE A/PREF 685,100 BRL 19,725,853 3.49
CIE ENERG.SAO PAULO/PREF.-B- 86,159 BRL 1,433,101 0.25
COSAN SA INDUSTRIA E COMERCIO 3,800 BRL 55,796 0.01
CYRE COM CCP 17,200 BRL 97,172 0.02
CYRELA BRAZIL REALTY SA 86,000 BRL 1,134,500 0.20
ELETROB.EL.BRASIL./PREF. B 112,982 BRL 1,601,253 0.28
ELETROBRAS.CENTR.ELETR.BRAS 121,961 BRL 1,846,728 0.33
EMBRAER EMPR.BRASIL.AERONAUT.
170,700 BRL 1,698,678 0.30
GERDAU /PREF. 113,200 BRL 3,471,640 0.61
GOL LINHAS AEREAS INTELIGENTES
21,500 BRL 346,516 0.06
ITAU HOLDING SA /PREF. 349,000 BRL 7,836,737 1.39
KLABIN RIOCELL SA /PREF. 188,000 BRL 609,234 0.11
LOJAS AMERICANAS SA /PRIV. 139,973 BRL 1,052,507 0.19
LOJAS RENNER SA 57,000 BRL 1,049,441 0.19
NATURA COSMETICOS SA 105,000 BRL 1,074,993 0.19
NET SERVI. DE COMUNICACAO/PREF
72,300 BRL 760,943 0.13
PETROBRAS. PETR.BRASILEIRO SA 404,500 BRL 20,448,887 3.62
PETROLEO BRASILEIRO /PREF.SHS 557,300 BRL 23,209,382 4.11
REDECARD SA 58,200 BRL 968,053 0.17
RGHTS NET SERV DE COM7.3.08*** 794 BRL 55 0.00
SABESP.CIA SANEAM.BAS.ESTADO 63,618 BRL 1,413,936 0.25
SADIA SA/PREF. 150,000 BRL 877,545 0.15
SID NACIONAL 135,900 BRL 4,898,169 0.87
TAM SA 25,500 BRL 502,395 0.09
TELEMAR 26,000 BRL 908,621 0.16
TEMAR / PREF. 97,000 BRL 2,531,403 0.45
TIM PARTICIPACOES SA/PREF. 242,058 BRL 798,299 0.14
UNIBANCO/UNIT(1UBBPN+1UBHDBN)
386,100 BRL 4,484,385 0.79
Description Quantity Currency Evaluation % netassets
USIMINAS /PREF.-A- 62,850 BRL 3,597,609 0.64
VALE RIO DOCE /NAM. 482,500 BRL 16,549,185 2.93
VIVO PARTICIPACOES SA/PFD SHS 199,300 BRL 1,165,965 0.21
VOTORANTIM /PREF. 37,600 BRL 1,065,136 0.19 ______________________
150,227,327 26.57 ______________________
CAYMAN ISLANDS
ALIBABA.COM 416,500 HKD 862,511 0.15
CH HS TRANSMISS EQ GR CO LTD 347,000 HKD 505,507 0.09
COUNTRY GARDEN HOLDINGS 1,020,000 HKD 879,240 0.16
HENGAN INTL GRP 236,000 HKD 809,484 0.14
LI NING COMPANY LTD 214,000 HKD 603,439 0.11 ______________________
3,660,181 0.65 ______________________
CHINA
AGILE PROPERTY HOLDINGS LTD 488,000 HKD 514,692 0.09
AIR CHINA LTD 936,000 HKD 789,998 0.14
ALUMINIUM CORP OF CHINA LTD 1,048,000 HKD 1,693,662 0.30
ANGANG STEEL COMPANY LTD -H- 388,000 HKD 885,237 0.16
ANHUI CONCH CEMENT CO LTD 142,000 HKD 975,037 0.17
BANK OF CHINA LTD-H 7,013,000 HKD 2,991,071 0.53
BANK OF COMMUNICATIONS CO -H- 1,318,000 HKD 1,539,090 0.27
BEIJING CAP.INTL AIRPORT H 648,000 HKD 586,880 0.10
CHAODA MODERN AGRICULT.HOLD.
744,350 HKD 845,307 0.15
CHINA COAL ENERGY CO LTD -H- 561,000 HKD 977,254 0.17
CHINA COMMUNICATIONS CONSTR-H-
1,407,000 HKD 3,108,904 0.55
CHINA CONSTRUCTION BANK CORP
8,075,000 HKD 6,027,032 1.07
CHINA COSCO HOLDINGS -H- 911,750 HKD 2,211,376 0.39
CHINA LIFE INSURANCE CO LTD-H- 2,104,000 HKD 7,230,267 1.28
CHINA MENGNIU DAIRY CO LTD 445,000 HKD 1,297,689 0.23
CHINA MERCHANTS BANK /-H- 432,000 HKD 1,495,641 0.26
CHINA NATL BLDING MATERIAL -H- 312,000 HKD 735,087 0.13
CHINA PETROLEUM&CHEM CORP H
5,140,000 HKD 4,397,665 0.78
CHINA RAILWAY GROUP LTD-H- 1,031,000 HKD 999,978 0.18
CHINA RESOURCES LAND 514,000 HKD 891,419 0.16
CHINA SHENHUA ENERGY CO -H- 994,500 HKD 3,973,288 0.70
CHINA SHIPPING DEVELOPMENT -H-
814,000 HKD 2,556,749 0.45
CHINA TELECOM CORP LTD -H- 4,192,000 HKD 2,628,003 0.47
DATANG INT.POWER GENERATION-H-
1,140,000 HKD 604,839 0.11
DONGFENG MOTOR -H- 922,000 HKD 414,557 0.07
GOME ELECT APPLIANCES HOLDINGS
482,000 HKD 1,107,132 0.20
GUANGZHOU R&F PROP.-H- /NEW 311,600 HKD 826,613 0.15
HUANENG POWER INTL H 1,060,000 HKD 804,782 0.14
IND & COM BOC -H- 6,500,000 HKD 4,525,822 0.80
JIANGXI COPPER CO LTD H 466,000 HKD 878,814 0.16
MAANSHAN IRON & STEEL CO H 476,000 HKD 249,489 0.04
HSBC Global Investment Funds 120
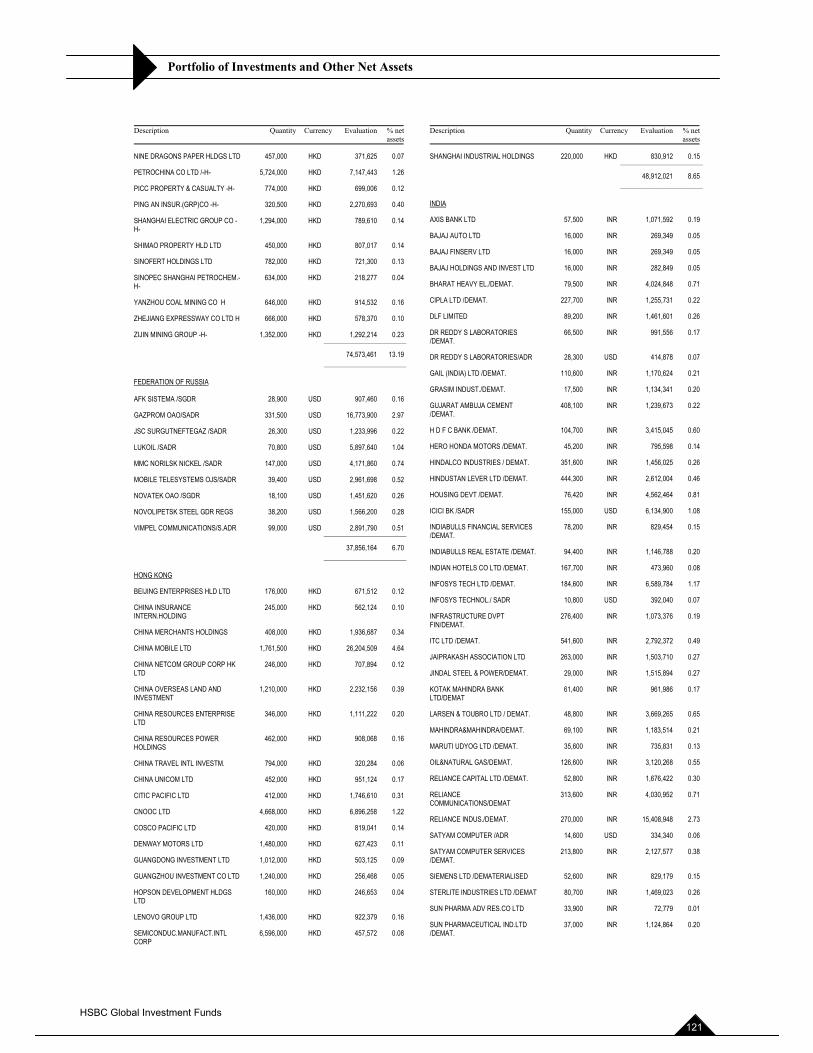
Portfolio of Investments and Other Net Assets
Description Quantity Currency Evaluation % netassets
NINE DRAGONS PAPER HLDGS LTD 457,000 HKD 371,625 0.07
PETROCHINA CO LTD /-H- 5,724,000 HKD 7,147,443 1.26
PICC PROPERTY & CASUALTY -H- 774,000 HKD 699,006 0.12
PING AN INSUR.(GRP)CO -H- 320,500 HKD 2,270,693 0.40
SHANGHAI ELECTRIC GROUP CO -H-
1,294,000 HKD 789,610 0.14
SHIMAO PROPERTY HLD LTD 450,000 HKD 807,017 0.14
SINOFERT HOLDINGS LTD 782,000 HKD 721,300 0.13
SINOPEC SHANGHAI PETROCHEM.-H-
634,000 HKD 218,277 0.04
YANZHOU COAL MINING CO H 646,000 HKD 914,532 0.16
ZHEJIANG EXPRESSWAY CO LTD H 666,000 HKD 578,370 0.10
ZIJIN MINING GROUP -H- 1,352,000 HKD 1,292,214 0.23 ______________________
74,573,461 13.19 ______________________
FEDERATION OF RUSSIA
AFK SISTEMA /SGDR 28,900 USD 907,460 0.16
GAZPROM OAO/SADR 331,500 USD 16,773,900 2.97
JSC SURGUTNEFTEGAZ /SADR 26,300 USD 1,233,996 0.22
LUKOIL /SADR 70,800 USD 5,897,640 1.04
MMC NORILSK NICKEL /SADR 147,000 USD 4,171,860 0.74
MOBILE TELESYSTEMS OJS/SADR 39,400 USD 2,961,698 0.52
NOVATEK OAO /SGDR 18,100 USD 1,451,620 0.26
NOVOLIPETSK STEEL GDR REGS 38,200 USD 1,566,200 0.28
VIMPEL COMMUNICATIONS/S.ADR 99,000 USD 2,891,790 0.51 ______________________
37,856,164 6.70 ______________________
HONG KONG
BEIJING ENTERPRISES HLD LTD 176,000 HKD 671,512 0.12
CHINA INSURANCE INTERN.HOLDING
245,000 HKD 562,124 0.10
CHINA MERCHANTS HOLDINGS 408,000 HKD 1,936,687 0.34
CHINA MOBILE LTD 1,761,500 HKD 26,204,509 4.64
CHINA NETCOM GROUP CORP HK LTD
246,000 HKD 707,894 0.12
CHINA OVERSEAS LAND AND INVESTMENT
1,210,000 HKD 2,232,156 0.39
CHINA RESOURCES ENTERPRISE LTD
346,000 HKD 1,111,222 0.20
CHINA RESOURCES POWER HOLDINGS
462,000 HKD 908,068 0.16
CHINA TRAVEL INTL INVESTM. 794,000 HKD 320,284 0.06
CHINA UNICOM LTD 452,000 HKD 951,124 0.17
CITIC PACIFIC LTD 412,000 HKD 1,746,610 0.31
CNOOC LTD 4,668,000 HKD 6,896,258 1.22
COSCO PACIFIC LTD 420,000 HKD 819,041 0.14
DENWAY MOTORS LTD 1,480,000 HKD 627,423 0.11
GUANGDONG INVESTMENT LTD 1,012,000 HKD 503,125 0.09
GUANGZHOU INVESTMENT CO LTD 1,240,000 HKD 256,468 0.05
HOPSON DEVELOPMENT HLDGS LTD
160,000 HKD 246,653 0.04
LENOVO GROUP LTD 1,436,000 HKD 922,379 0.16
SEMICONDUC.MANUFACT.INTL CORP
6,596,000 HKD 457,572 0.08
Description Quantity Currency Evaluation % netassets
SHANGHAI INDUSTRIAL HOLDINGS 220,000 HKD 830,912 0.15 ______________________
48,912,021 8.65 ______________________
INDIA
AXIS BANK LTD 57,500 INR 1,071,592 0.19
BAJAJ AUTO LTD 16,000 INR 269,349 0.05
BAJAJ FINSERV LTD 16,000 INR 269,349 0.05
BAJAJ HOLDINGS AND INVEST LTD 16,000 INR 282,849 0.05
BHARAT HEAVY EL./DEMAT. 79,500 INR 4,024,848 0.71
CIPLA LTD /DEMAT. 227,700 INR 1,255,731 0.22
DLF LIMITED 89,200 INR 1,461,601 0.26
DR REDDY S LABORATORIES /DEMAT.
66,500 INR 991,556 0.17
DR REDDY S LABORATORIES/ADR 28,300 USD 414,878 0.07
GAIL (INDIA) LTD /DEMAT. 110,600 INR 1,170,624 0.21
GRASIM INDUST./DEMAT. 17,500 INR 1,134,341 0.20
GUJARAT AMBUJA CEMENT /DEMAT.
408,100 INR 1,239,673 0.22
H D F C BANK /DEMAT. 104,700 INR 3,415,045 0.60
HERO HONDA MOTORS /DEMAT. 45,200 INR 795,598 0.14
HINDALCO INDUSTRIES / DEMAT. 351,600 INR 1,456,025 0.26
HINDUSTAN LEVER LTD /DEMAT. 444,300 INR 2,612,004 0.46
HOUSING DEVT /DEMAT. 76,420 INR 4,562,464 0.81
ICICI BK /SADR 155,000 USD 6,134,900 1.08
INDIABULLS FINANCIAL SERVICES /DEMAT.
78,200 INR 829,454 0.15
INDIABULLS REAL ESTATE /DEMAT. 94,400 INR 1,146,788 0.20
INDIAN HOTELS CO LTD /DEMAT. 167,700 INR 473,960 0.08
INFOSYS TECH LTD /DEMAT. 184,600 INR 6,589,784 1.17
INFOSYS TECHNOL./ SADR 10,800 USD 392,040 0.07
INFRASTRUCTURE DVPT FIN/DEMAT.
276,400 INR 1,073,376 0.19
ITC LTD /DEMAT. 541,600 INR 2,792,372 0.49
JAIPRAKASH ASSOCIATION LTD 263,000 INR 1,503,710 0.27
JINDAL STEEL & POWER/DEMAT. 29,000 INR 1,515,894 0.27
KOTAK MAHINDRA BANK LTD/DEMAT
61,400 INR 961,986 0.17
LARSEN & TOUBRO LTD / DEMAT. 48,800 INR 3,669,265 0.65
MAHINDRA&MAHINDRA/DEMAT. 69,100 INR 1,183,514 0.21
MARUTI UDYOG LTD /DEMAT. 35,600 INR 735,831 0.13
OIL&NATURAL GAS/DEMAT. 126,600 INR 3,120,268 0.55
RELIANCE CAPITAL LTD /DEMAT. 52,800 INR 1,676,422 0.30
RELIANCE COMMUNICATIONS/DEMAT
313,600 INR 4,030,952 0.71
RELIANCE INDUS./DEMAT. 270,000 INR 15,408,948 2.73
SATYAM COMPUTER /ADR 14,600 USD 334,340 0.06
SATYAM COMPUTER SERVICES /DEMAT.
213,800 INR 2,127,577 0.38
SIEMENS LTD /DEMATERIALISED 52,600 INR 829,179 0.15
STERLITE INDUSTRIES LTD /DEMAT 80,700 INR 1,469,023 0.26
SUN PHARMA ADV RES.CO LTD 33,900 INR 72,779 0.01
SUN PHARMACEUTICAL IND.LTD /DEMAT.
37,000 INR 1,124,864 0.20
HSBC Global Investment Funds 121
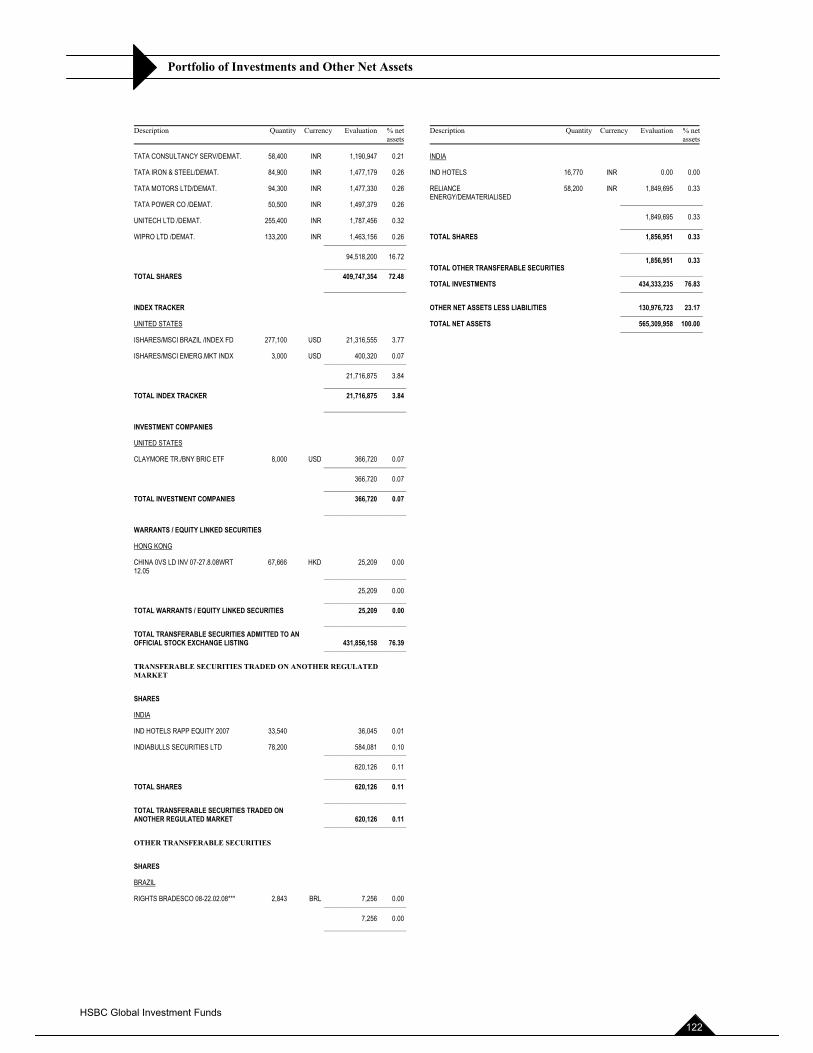
Portfolio of Investments and Other Net Assets
Description Quantity Currency Evaluation % netassets
TATA CONSULTANCY SERV/DEMAT. 58,400 INR 1,190,947 0.21
TATA IRON & STEEL/DEMAT. 84,900 INR 1,477,179 0.26
TATA MOTORS LTD/DEMAT. 94,300 INR 1,477,330 0.26
TATA POWER CO /DEMAT. 50,500 INR 1,497,379 0.26
UNITECH LTD /DEMAT. 255,400 INR 1,787,456 0.32
WIPRO LTD /DEMAT. 133,200 INR 1,463,156 0.26 ______________________
94,518,200 16.72 ______________________ TOTAL SHARES 409,747,354 72.48 ______________________
INDEX TRACKER
UNITED STATES
ISHARES/MSCI BRAZIL /INDEX FD 277,100 USD 21,316,555 3.77
ISHARES/MSCI EMERG.MKT INDX 3,000 USD 400,320 0.07 ______________________
21,716,875 3.84 ______________________ TOTAL INDEX TRACKER 21,716,875 3.84 ______________________
INVESTMENT COMPANIES
UNITED STATES
CLAYMORE TR./BNY BRIC ETF 8,000 USD 366,720 0.07 ______________________
366,720 0.07 ______________________ TOTAL INVESTMENT COMPANIES 366,720 0.07 ______________________
WARRANTS / EQUITY LINKED SECURITIES
HONG KONG
CHINA 0VS LD INV 07-27.8.08WRT 12.05 ______________________
67,666 HKD 25,209 0.00
25,209 0.00 ______________________ TOTAL WARRANTS / EQUITY LINKED SECURITIES 25,209 0.00 ______________________ TOTAL TRANSFERABLE SECURITIES ADMITTED TO AN OFFICIAL STOCK EXCHANGE LISTING 431,856,158 76.39 ______________________
TRANSFERABLE SECURITIES TRADED ON ANOTHER REGULATED MARKET
SHARES
INDIA
IND HOTELS RAPP EQUITY 2007 33,540 36,045 0.01
INDIABULLS SECURITIES LTD 78,200 584,081 0.10 ______________________
620,126 0.11 ______________________ TOTAL SHARES 620,126 0.11 ______________________ TOTAL TRANSFERABLE SECURITIES TRADED ON ANOTHER REGULATED MARKET 620,126 0.11 ______________________
OTHER TRANSFERABLE SECURITIES
SHARES
BRAZIL
RIGHTS BRADESCO 08-22.02.08*** 2,843 BRL 7,256 0.00 ______________________
7,256 0.00 ______________________
Description Quantity Currency Evaluation % netassets
INDIA
IND HOTELS 16,770 INR 0.00 0.00
RELIANCE ENERGY/DEMATERIALISED ______________________
58,200 INR 1,849,695 0.33
1,849,695 0.33 ______________________ TOTAL SHARES 1,856,951 0.33 ______________________
TOTAL OTHER TRANSFERABLE SECURITIES ______________________ 1,856,951 0.33
TOTAL INVESTMENTS 434,333,235 76.83 ______________________
OTHER NET ASSETS LESS LIABILITIES 130,976,723 23.17 ______________________ TOTAL NET ASSETS 565,309,958 100.00 ______________________
HSBC Global Investment Funds 122
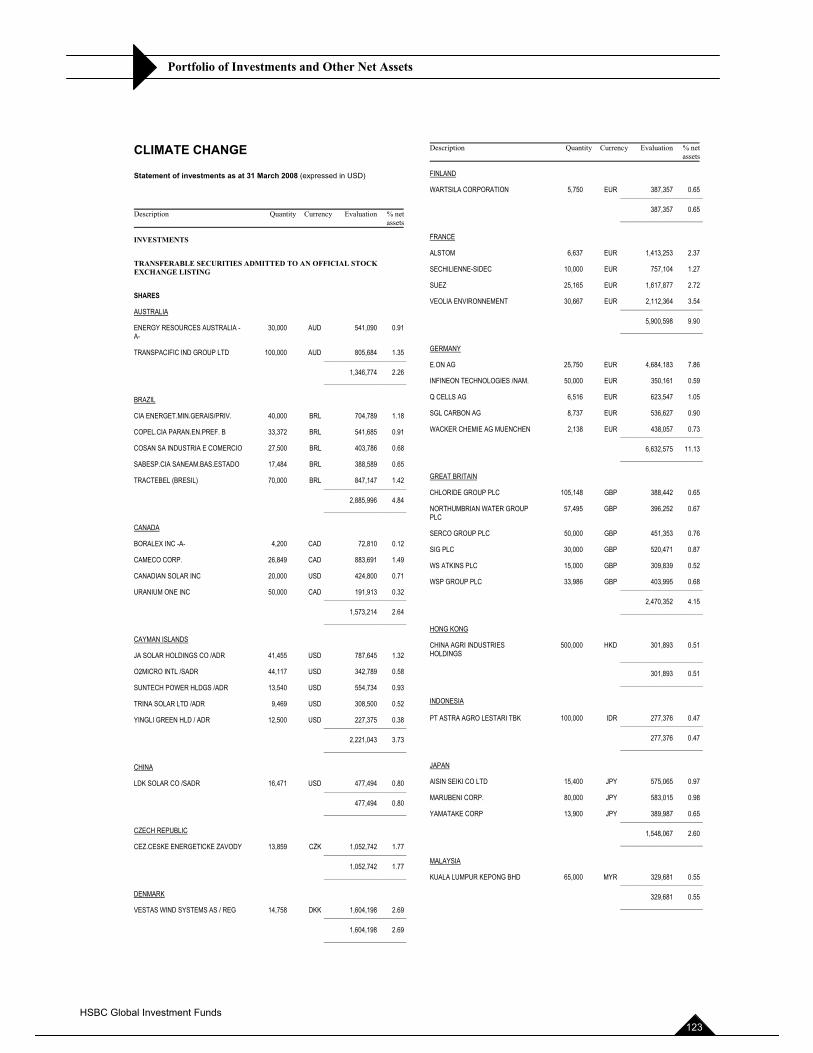
Portfolio of Investments and Other Net Assets
CLIMATE CHANGE
Statement of investments as at 31 March 2008 (expressed in USD)
Description Quantity Currency Evaluation % netassets
INVESTMENTS
TRANSFERABLE SECURITIES ADMITTED TO AN OFFICIAL STOCK EXCHANGE LISTING
SHARES
AUSTRALIA
ENERGY RESOURCES AUSTRALIA -A-
30,000 AUD 541,090 0.91
TRANSPACIFIC IND GROUP LTD 100,000 AUD 805,684 1.35 ______________________
1,346,774 2.26 ______________________
BRAZIL
CIA ENERGET.MIN.GERAIS/PRIV. 40,000 BRL 704,789 1.18
COPEL.CIA PARAN.EN.PREF. B 33,372 BRL 541,685 0.91
COSAN SA INDUSTRIA E COMERCIO 27,500 BRL 403,786 0.68
SABESP.CIA SANEAM.BAS.ESTADO 17,484 BRL 388,589 0.65
TRACTEBEL (BRESIL) 70,000 BRL 847,147 1.42 ______________________
2,885,996 4.84 ______________________
CANADA
BORALEX INC -A- 4,200 CAD 72,810 0.12
CAMECO CORP. 26,849 CAD 883,691 1.49
CANADIAN SOLAR INC 20,000 USD 424,800 0.71
URANIUM ONE INC 50,000 CAD 191,913 0.32 ______________________
1,573,214 2.64 ______________________
CAYMAN ISLANDS
JA SOLAR HOLDINGS CO /ADR 41,455 USD 787,645 1.32
O2MICRO INTL /SADR 44,117 USD 342,789 0.58
SUNTECH POWER HLDGS /ADR 13,540 USD 554,734 0.93
TRINA SOLAR LTD /ADR 9,469 USD 308,500 0.52
YINGLI GREEN HLD / ADR 12,500 USD 227,375 0.38 ______________________
2,221,043 3.73 ______________________
CHINA
LDK SOLAR CO /SADR 16,471 USD 477,494 0.80 ______________________
477,494 0.80 ______________________
CZECH REPUBLIC
CEZ.CESKE ENERGETICKE ZAVODY 13,859 CZK 1,052,742 1.77 ______________________
1,052,742 1.77 ______________________
DENMARK
VESTAS WIND SYSTEMS AS / REG 14,758 DKK 1,604,198 2.69 ______________________
1,604,198 2.69 ______________________
Description Quantity Currency Evaluation % netassets
FINLAND
WARTSILA CORPORATION 5,750 EUR 387,357 0.65 ______________________
387,357 0.65 ______________________
FRANCE
ALSTOM 6,637 EUR 1,413,253 2.37
SECHILIENNE-SIDEC 10,000 EUR 757,104 1.27
SUEZ 25,165 EUR 1,617,877 2.72
VEOLIA ENVIRONNEMENT 30,667 EUR 2,112,364 3.54 ______________________
5,900,598 9.90 ______________________
GERMANY
E.ON AG 25,750 EUR 4,684,183 7.86
INFINEON TECHNOLOGIES /NAM. 50,000 EUR 350,161 0.59
Q CELLS AG 6,516 EUR 623,547 1.05
SGL CARBON AG 8,737 EUR 536,627 0.90
WACKER CHEMIE AG MUENCHEN 2,138 EUR 438,057 0.73 ______________________
6,632,575 11.13 ______________________
GREAT BRITAIN
CHLORIDE GROUP PLC 105,148 GBP 388,442 0.65
NORTHUMBRIAN WATER GROUP PLC
57,495 GBP 396,252 0.67
SERCO GROUP PLC 50,000 GBP 451,353 0.76
SIG PLC 30,000 GBP 520,471 0.87
WS ATKINS PLC 15,000 GBP 309,839 0.52
WSP GROUP PLC 33,986 GBP 403,995 0.68 ______________________
2,470,352 4.15 ______________________
HONG KONG
CHINA AGRI INDUSTRIES HOLDINGS ______________________
500,000 HKD 301,893 0.51
301,893 0.51 ______________________
INDONESIA
PT ASTRA AGRO LESTARI TBK 100,000 IDR 277,376 0.47 ______________________
277,376 0.47 ______________________
JAPAN
AISIN SEIKI CO LTD 15,400 JPY 575,065 0.97
MARUBENI CORP. 80,000 JPY 583,015 0.98
YAMATAKE CORP 13,900 JPY 389,987 0.65 ______________________
1,548,067 2.60 ______________________
MALAYSIA
KUALA LUMPUR KEPONG BHD 65,000 MYR 329,681 0.55 ______________________
329,681 0.55 ______________________
HSBC Global Investment Funds 123
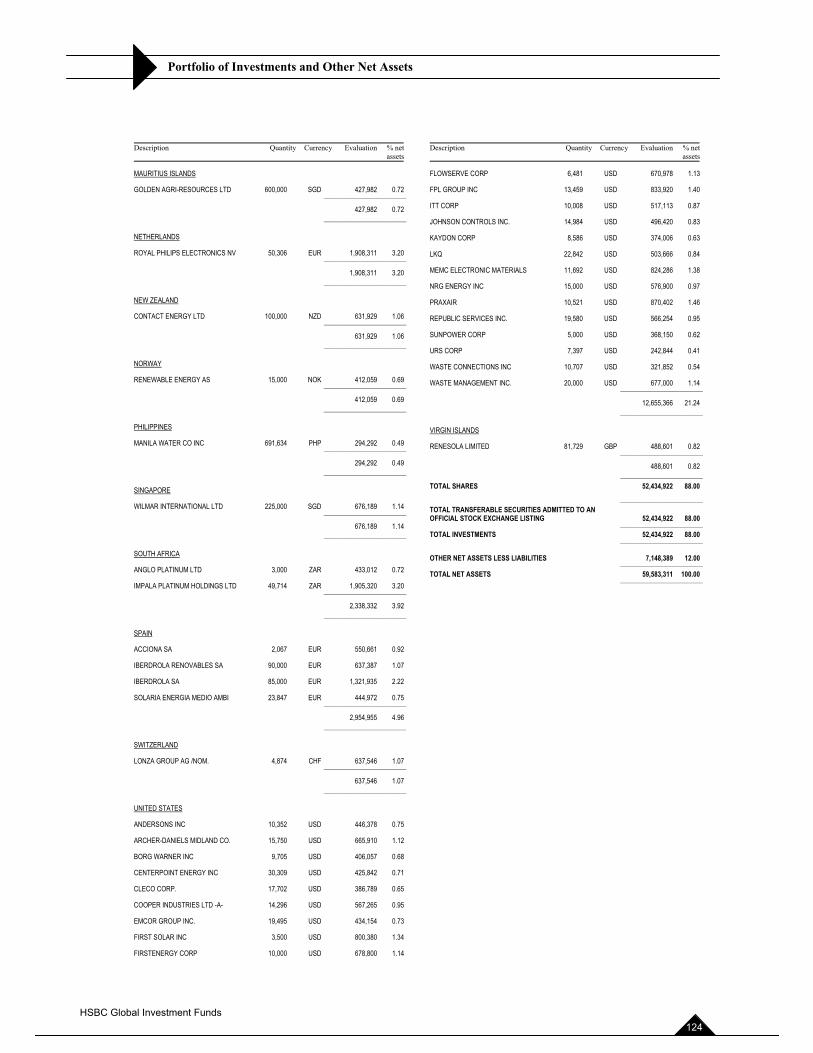
Portfolio of Investments and Other Net Assets
Description Quantity Currency Evaluation % netassets
MAURITIUS ISLANDS
GOLDEN AGRI-RESOURCES LTD 600,000 SGD 427,982 0.72 ______________________
427,982 0.72 ______________________
NETHERLANDS
ROYAL PHILIPS ELECTRONICS NV 50,306 EUR 1,908,311 3.20 ______________________
1,908,311 3.20 ______________________
NEW ZEALAND
CONTACT ENERGY LTD 100,000 NZD 631,929 1.06 ______________________
631,929 1.06 ______________________
NORWAY
RENEWABLE ENERGY AS 15,000 NOK 412,059 0.69 ______________________
412,059 0.69 ______________________
PHILIPPINES
MANILA WATER CO INC 691,634 PHP 294,292 0.49 ______________________
294,292 0.49 ______________________
SINGAPORE
WILMAR INTERNATIONAL LTD 225,000 SGD 676,189 1.14 ______________________
676,189 1.14 ______________________
SOUTH AFRICA
ANGLO PLATINUM LTD 3,000 ZAR 433,012 0.72
IMPALA PLATINUM HOLDINGS LTD 49,714 ZAR 1,905,320 3.20 ______________________
2,338,332 3.92 ______________________
SPAIN
ACCIONA SA 2,067 EUR 550,661 0.92
IBERDROLA RENOVABLES SA 90,000 EUR 637,387 1.07
IBERDROLA SA 85,000 EUR 1,321,935 2.22
SOLARIA ENERGIA MEDIO AMBI 23,847 EUR 444,972 0.75 ______________________
2,954,955 4.96 ______________________
SWITZERLAND
LONZA GROUP AG /NOM. 4,874 CHF 637,546 1.07 ______________________
637,546 1.07 ______________________
UNITED STATES
ANDERSONS INC 10,352 USD 446,378 0.75
ARCHER-DANIELS MIDLAND CO. 15,750 USD 665,910 1.12
BORG WARNER INC 9,705 USD 406,057 0.68
CENTERPOINT ENERGY INC 30,309 USD 425,842 0.71
CLECO CORP. 17,702 USD 386,789 0.65
COOPER INDUSTRIES LTD -A- 14,296 USD 567,265 0.95
EMCOR GROUP INC. 19,495 USD 434,154 0.73
FIRST SOLAR INC 3,500 USD 800,380 1.34
FIRSTENERGY CORP 10,000 USD 678,800 1.14
Description Quantity Currency Evaluation % netassets
FLOWSERVE CORP 6,481 USD 670,978 1.13
FPL GROUP INC 13,459 USD 833,920 1.40
ITT CORP 10,008 USD 517,113 0.87
JOHNSON CONTROLS INC. 14,984 USD 496,420 0.83
KAYDON CORP 8,586 USD 374,006 0.63
LKQ 22,842 USD 503,666 0.84
MEMC ELECTRONIC MATERIALS 11,692 USD 824,286 1.38
NRG ENERGY INC 15,000 USD 576,900 0.97
PRAXAIR 10,521 USD 870,402 1.46
REPUBLIC SERVICES INC. 19,580 USD 566,254 0.95
SUNPOWER CORP 5,000 USD 368,150 0.62
URS CORP 7,397 USD 242,844 0.41
WASTE CONNECTIONS INC 10,707 USD 321,852 0.54
WASTE MANAGEMENT INC. 20,000 USD 677,000 1.14 ______________________
12,655,366 21.24 ______________________
VIRGIN ISLANDS
RENESOLA LIMITED 81,729 GBP 488,601 0.82 ______________________
488,601 0.82 ______________________ TOTAL SHARES 52,434,922 88.00 ______________________ TOTAL TRANSFERABLE SECURITIES ADMITTED TO AN OFFICIAL STOCK EXCHANGE LISTING 52,434,922 88.00 ______________________ TOTAL INVESTMENTS 52,434,922 88.00 ______________________
OTHER NET ASSETS LESS LIABILITIES 7,148,389 12.00 ______________________ TOTAL NET ASSETS 59,583,311 100.00 ______________________
HSBC Global Investment Funds 124
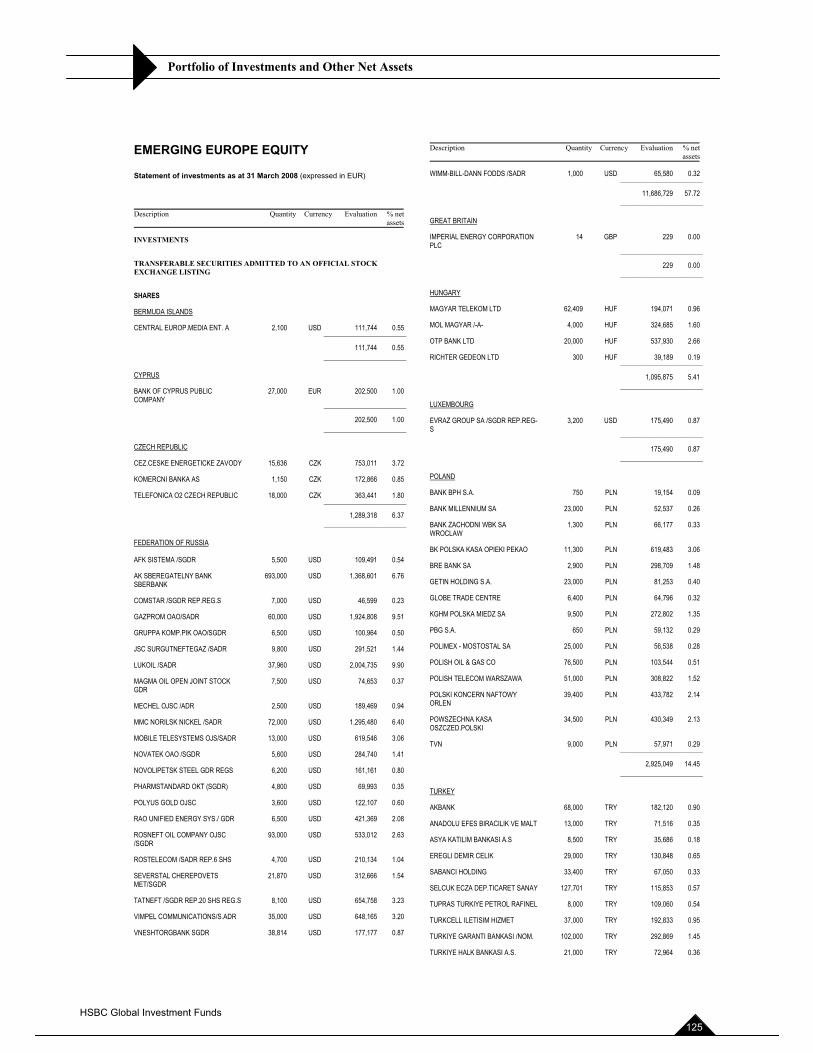
Portfolio of Investments and Other Net Assets
EMERGING EUROPE EQUITY
Statement of investments as at 31 March 2008 (expressed in EUR)
Description Quantity Currency Evaluation % netassets
INVESTMENTS
TRANSFERABLE SECURITIES ADMITTED TO AN OFFICIAL STOCK EXCHANGE LISTING
SHARES
BERMUDA ISLANDS
CENTRAL EUROP.MEDIA ENT. A 2,100 USD 111,744 0.55 ______________________
111,744 0.55 ______________________
CYPRUS
BANK OF CYPRUS PUBLIC COMPANY ______________________
27,000 EUR 202,500 1.00
202,500 1.00 ______________________
CZECH REPUBLIC
CEZ.CESKE ENERGETICKE ZAVODY 15,636 CZK 753,011 3.72
KOMERCNI BANKA AS 1,150 CZK 172,866 0.85
TELEFONICA O2 CZECH REPUBLIC 18,000 CZK 363,441 1.80 ______________________
1,289,318 6.37 ______________________
FEDERATION OF RUSSIA
AFK SISTEMA /SGDR 5,500 USD 109,491 0.54
AK SBEREGATELNY BANK SBERBANK
693,000 USD 1,368,601 6.76
COMSTAR /SGDR REP.REG.S 7,000 USD 46,599 0.23
GAZPROM OAO/SADR 60,000 USD 1,924,808 9.51
GRUPPA KOMP.PIK OAO/SGDR 6,500 USD 100,964 0.50
JSC SURGUTNEFTEGAZ /SADR 9,800 USD 291,521 1.44
LUKOIL /SADR 37,960 USD 2,004,735 9.90
MAGMA OIL OPEN JOINT STOCK GDR
7,500 USD 74,653 0.37
MECHEL OJSC /ADR 2,500 USD 189,469 0.94
MMC NORILSK NICKEL /SADR 72,000 USD 1,295,480 6.40
MOBILE TELESYSTEMS OJS/SADR 13,000 USD 619,546 3.06
NOVATEK OAO /SGDR 5,600 USD 284,740 1.41
NOVOLIPETSK STEEL GDR REGS 6,200 USD 161,161 0.80
PHARMSTANDARD OKT (SGDR) 4,800 USD 69,993 0.35
POLYUS GOLD OJSC 3,600 USD 122,107 0.60
RAO UNIFIED ENERGY SYS./ GDR 6,500 USD 421,369 2.08
ROSNEFT OIL COMPANY OJSC /SGDR
93,000 USD 533,012 2.63
ROSTELECOM /SADR REP.6 SHS 4,700 USD 210,134 1.04
SEVERSTAL CHEREPOVETS MET/SGDR
21,870 USD 312,666 1.54
TATNEFT /SGDR REP.20 SHS REG.S 8,100 USD 654,758 3.23
VIMPEL COMMUNICATIONS/S.ADR 35,000 USD 648,165 3.20
VNESHTORGBANK SGDR 38,814 USD 177,177 0.87
Description Quantity Currency Evaluation % netassets
WIMM-BILL-DANN FODDS /SADR 1,000 USD 65,580 0.32 ______________________
11,686,729 57.72 ______________________
GREAT BRITAIN
IMPERIAL ENERGY CORPORATION PLC ______________________
14 GBP 229 0.00
229 0.00 ______________________
HUNGARY
MAGYAR TELEKOM LTD 62,409 HUF 194,071 0.96
MOL MAGYAR /-A- 4,000 HUF 324,685 1.60
OTP BANK LTD 20,000 HUF 537,930 2.66
RICHTER GEDEON LTD 300 HUF 39,189 0.19 ______________________
1,095,875 5.41 ______________________
LUXEMBOURG
EVRAZ GROUP SA /SGDR REP.REG-S ______________________
3,200 USD 175,490 0.87
175,490 0.87 ______________________
POLAND
BANK BPH S.A. 750 PLN 19,154 0.09
BANK MILLENNIUM SA 23,000 PLN 52,537 0.26
BANK ZACHODNI WBK SA WROCLAW
1,300 PLN 66,177 0.33
BK POLSKA KASA OPIEKI PEKAO 11,300 PLN 619,483 3.06
BRE BANK SA 2,900 PLN 298,709 1.48
GETIN HOLDING S.A. 23,000 PLN 81,253 0.40
GLOBE TRADE CENTRE 6,400 PLN 64,796 0.32
KGHM POLSKA MIEDZ SA 9,500 PLN 272,802 1.35
PBG S.A. 650 PLN 59,132 0.29
POLIMEX - MOSTOSTAL SA 25,000 PLN 56,538 0.28
POLISH OIL & GAS CO 76,500 PLN 103,544 0.51
POLISH TELECOM WARSZAWA 51,000 PLN 308,822 1.52
POLSKI KONCERN NAFTOWY ORLEN
39,400 PLN 433,782 2.14
POWSZECHNA KASA OSZCZED.POLSKI
34,500 PLN 430,349 2.13
TVN 9,000 PLN 57,971 0.29 ______________________
2,925,049 14.45 ______________________
TURKEY
AKBANK 68,000 TRY 182,120 0.90
ANADOLU EFES BIRACILIK VE MALT 13,000 TRY 71,516 0.35
ASYA KATILIM BANKASI A.S 8,500 TRY 35,686 0.18
EREGLI DEMIR CELIK 29,000 TRY 130,848 0.65
SABANCI HOLDING 33,400 TRY 67,050 0.33
SELCUK ECZA DEP.TICARET SANAY 127,701 TRY 115,853 0.57
TUPRAS TURKIYE PETROL RAFINEL 8,000 TRY 109,060 0.54
TURKCELL ILETISIM HIZMET 37,000 TRY 192,833 0.95
TURKIYE GARANTI BANKASI /NOM. 102,000 TRY 292,869 1.45
TURKIYE HALK BANKASI A.S. 21,000 TRY 72,964 0.36
HSBC Global Investment Funds 125
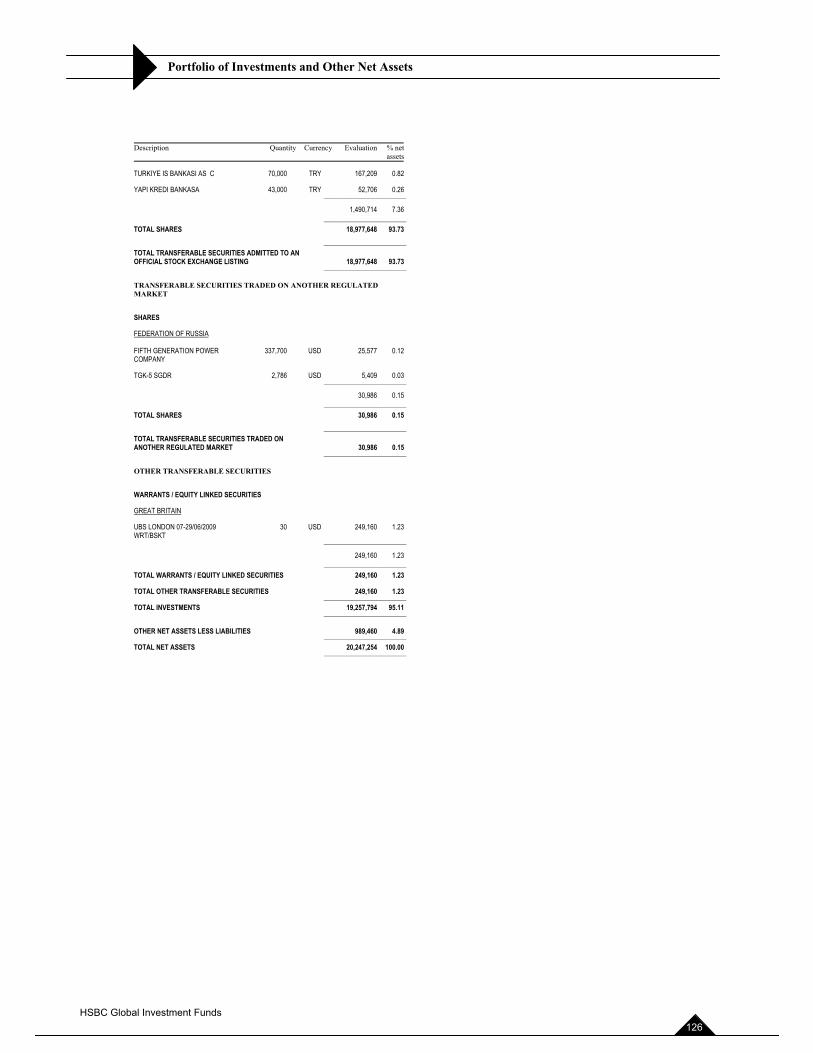
Portfolio of Investments and Other Net Assets
Description Quantity Currency Evaluation % netassets
TURKIYE IS BANKASI AS C 70,000 TRY 167,209 0.82
YAPI KREDI BANKASA 43,000 TRY 52,706 0.26 ______________________
1,490,714 7.36 ______________________ TOTAL SHARES 18,977,648 93.73 ______________________ TOTAL TRANSFERABLE SECURITIES ADMITTED TO AN OFFICIAL STOCK EXCHANGE LISTING 18,977,648 93.73 ______________________
TRANSFERABLE SECURITIES TRADED ON ANOTHER REGULATED MARKET
SHARES
FEDERATION OF RUSSIA
FIFTH GENERATION POWER COMPANY
337,700 USD 25,577 0.12
TGK-5 SGDR 2,786 USD 5,409 0.03 ______________________
30,986 0.15 ______________________ TOTAL SHARES 30,986 0.15 ______________________ TOTAL TRANSFERABLE SECURITIES TRADED ON ANOTHER REGULATED MARKET 30,986 0.15 ______________________
OTHER TRANSFERABLE SECURITIES
WARRANTS / EQUITY LINKED SECURITIES
GREAT BRITAIN
UBS LONDON 07-29/06/2009 WRT/BSKT ______________________
30 USD 249,160 1.23
249,160 1.23 ______________________ TOTAL WARRANTS / EQUITY LINKED SECURITIES 249,160 1.23
TOTAL OTHER TRANSFERABLE SECURITIES 249,160 1.23 ______________________ TOTAL INVESTMENTS 19,257,794 95.11 ______________________
OTHER NET ASSETS LESS LIABILITIES 989,460 4.89 ______________________ TOTAL NET ASSETS 20,247,254 100.00 ______________________
HSBC Global Investment Funds 126
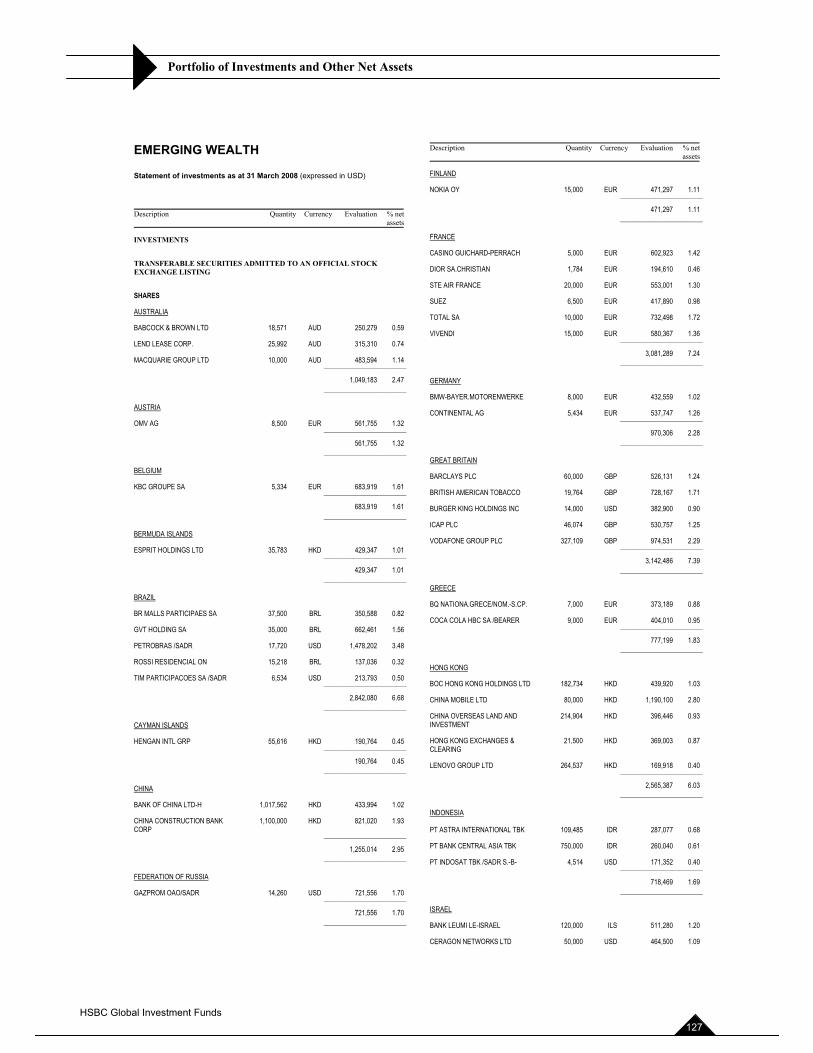
Portfolio of Investments and Other Net Assets
EMERGING WEALTH
Statement of investments as at 31 March 2008 (expressed in USD)
Description Quantity Currency Evaluation % netassets
INVESTMENTS
TRANSFERABLE SECURITIES ADMITTED TO AN OFFICIAL STOCK EXCHANGE LISTING
SHARES
AUSTRALIA
BABCOCK & BROWN LTD 18,571 AUD 250,279 0.59
LEND LEASE CORP. 25,992 AUD 315,310 0.74
MACQUARIE GROUP LTD 10,000 AUD 483,594 1.14 ______________________
1,049,183 2.47 ______________________
AUSTRIA
OMV AG 8,500 EUR 561,755 1.32 ______________________
561,755 1.32 ______________________
BELGIUM
KBC GROUPE SA 5,334 EUR 683,919 1.61 ______________________
683,919 1.61 ______________________
BERMUDA ISLANDS
ESPRIT HOLDINGS LTD 35,783 HKD 429,347 1.01 ______________________
429,347 1.01 ______________________
BRAZIL
BR MALLS PARTICIPAES SA 37,500 BRL 350,588 0.82
GVT HOLDING SA 35,000 BRL 662,461 1.56
PETROBRAS /SADR 17,720 USD 1,478,202 3.48
ROSSI RESIDENCIAL ON 15,218 BRL 137,036 0.32
TIM PARTICIPACOES SA /SADR 6,534 USD 213,793 0.50 ______________________
2,842,080 6.68 ______________________
CAYMAN ISLANDS
HENGAN INTL GRP 55,616 HKD 190,764 0.45 ______________________
190,764 0.45 ______________________
CHINA
BANK OF CHINA LTD-H 1,017,562 HKD 433,994 1.02
CHINA CONSTRUCTION BANK CORP ______________________
1,100,000 HKD 821,020 1.93
1,255,014 2.95 ______________________
FEDERATION OF RUSSIA
GAZPROM OAO/SADR 14,260 USD 721,556 1.70 ______________________
721,556 1.70 ______________________
Description Quantity Currency Evaluation % netassets
FINLAND
NOKIA OY 15,000 EUR 471,297 1.11 ______________________
471,297 1.11 ______________________
FRANCE
CASINO GUICHARD-PERRACH 5,000 EUR 602,923 1.42
DIOR SA.CHRISTIAN 1,784 EUR 194,610 0.46
STE AIR FRANCE 20,000 EUR 553,001 1.30
SUEZ 6,500 EUR 417,890 0.98
TOTAL SA 10,000 EUR 732,498 1.72
VIVENDI 15,000 EUR 580,367 1.36 ______________________
3,081,289 7.24 ______________________
GERMANY
BMW-BAYER.MOTORENWERKE 8,000 EUR 432,559 1.02
CONTINENTAL AG 5,434 EUR 537,747 1.26 ______________________
970,306 2.28 ______________________
GREAT BRITAIN
BARCLAYS PLC 60,000 GBP 526,131 1.24
BRITISH AMERICAN TOBACCO 19,764 GBP 728,167 1.71
BURGER KING HOLDINGS INC 14,000 USD 382,900 0.90
ICAP PLC 46,074 GBP 530,757 1.25
VODAFONE GROUP PLC 327,109 GBP 974,531 2.29 ______________________
3,142,486 7.39 ______________________
GREECE
BQ NATIONA.GRECE/NOM.-S.CP. 7,000 EUR 373,189 0.88
COCA COLA HBC SA /BEARER 9,000 EUR 404,010 0.95 ______________________
777,199 1.83 ______________________
HONG KONG
BOC HONG KONG HOLDINGS LTD 182,734 HKD 439,920 1.03
CHINA MOBILE LTD 80,000 HKD 1,190,100 2.80
CHINA OVERSEAS LAND AND INVESTMENT
214,904 HKD 396,446 0.93
HONG KONG EXCHANGES & CLEARING
21,500 HKD 369,003 0.87
LENOVO GROUP LTD 264,537 HKD 169,918 0.40 ______________________
2,565,387 6.03 ______________________
INDONESIA
PT ASTRA INTERNATIONAL TBK 109,485 IDR 287,077 0.68
PT BANK CENTRAL ASIA TBK 750,000 IDR 260,040 0.61
PT INDOSAT TBK /SADR S.-B- 4,514 USD 171,352 0.40 ______________________
718,469 1.69 ______________________
ISRAEL
BANK LEUMI LE-ISRAEL 120,000 ILS 511,280 1.20
CERAGON NETWORKS LTD 50,000 USD 464,500 1.09
HSBC Global Investment Funds 127
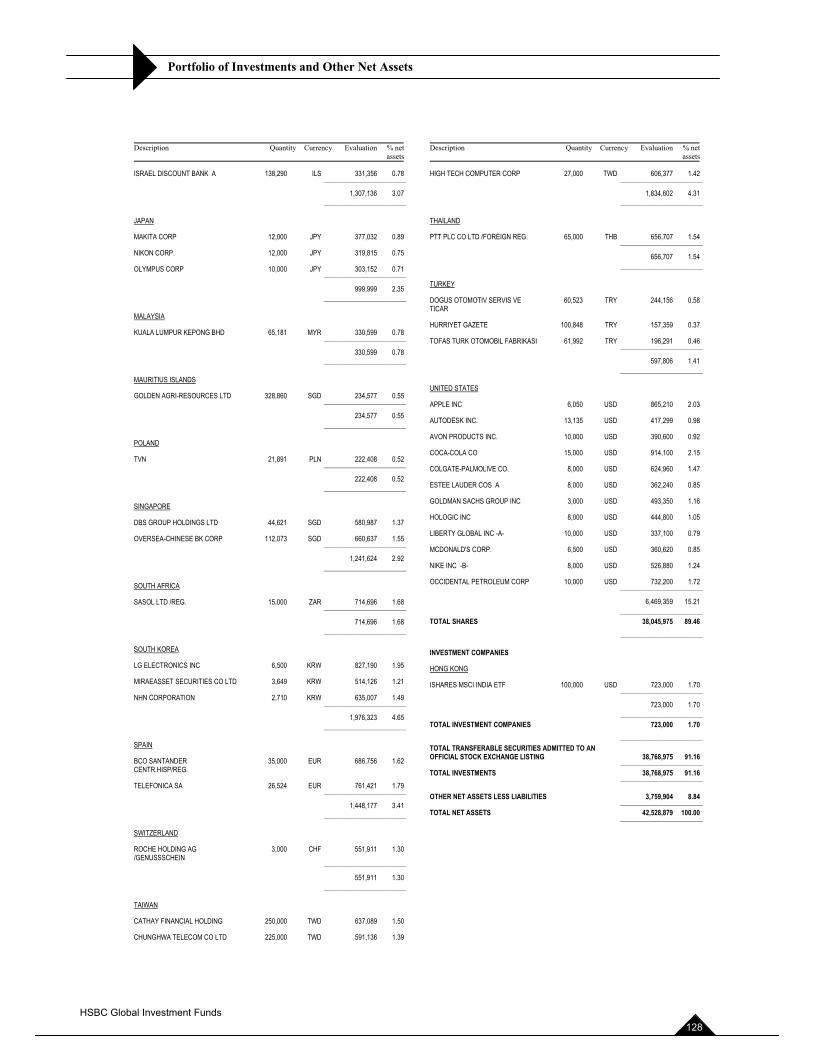
Portfolio of Investments and Other Net Assets
Description Quantity Currency Evaluation % netassets
ISRAEL DISCOUNT BANK A 138,290 ILS 331,356 0.78 ______________________
1,307,136 3.07 ______________________
JAPAN
MAKITA CORP 12,000 JPY 377,032 0.89
NIKON CORP. 12,000 JPY 319,815 0.75
OLYMPUS CORP 10,000 JPY 303,152 0.71 ______________________
999,999 2.35 ______________________
MALAYSIA
KUALA LUMPUR KEPONG BHD 65,181 MYR 330,599 0.78 ______________________
330,599 0.78 ______________________
MAURITIUS ISLANDS
GOLDEN AGRI-RESOURCES LTD 328,860 SGD 234,577 0.55 ______________________
234,577 0.55 ______________________
POLAND
TVN 21,891 PLN 222,408 0.52 ______________________
222,408 0.52 ______________________
SINGAPORE
DBS GROUP HOLDINGS LTD 44,621 SGD 580,987 1.37
OVERSEA-CHINESE BK CORP 112,073 SGD 660,637 1.55 ______________________
1,241,624 2.92 ______________________
SOUTH AFRICA
SASOL LTD /REG. 15,000 ZAR 714,696 1.68 ______________________
714,696 1.68 ______________________
SOUTH KOREA
LG ELECTRONICS INC 6,500 KRW 827,190 1.95
MIRAEASSET SECURITIES CO LTD 3,649 KRW 514,126 1.21
NHN CORPORATION 2,710 KRW 635,007 1.49 ______________________
1,976,323 4.65 ______________________
SPAIN
BCO SANTANDER CENTR.HISP/REG.
35,000 EUR 686,756 1.62
TELEFONICA SA 26,524 EUR 761,421 1.79 ______________________
1,448,177 3.41 ______________________
SWITZERLAND
ROCHE HOLDING AG /GENUSSSCHEIN ______________________
3,000 CHF 551,911 1.30
551,911 1.30 ______________________
TAIWAN
CATHAY FINANCIAL HOLDING 250,000 TWD 637,089 1.50
CHUNGHWA TELECOM CO LTD 225,000 TWD 591,136 1.39
Description Quantity Currency Evaluation % netassets
HIGH TECH COMPUTER CORP 27,000 TWD 606,377 1.42 ______________________
1,834,602 4.31 ______________________
THAILAND
PTT PLC CO LTD /FOREIGN REG. 65,000 THB 656,707 1.54 ______________________
656,707 1.54 ______________________
TURKEY
DOGUS OTOMOTIV SERVIS VE TICAR
60,523 TRY 244,156 0.58
HURRIYET GAZETE 100,848 TRY 157,359 0.37
TOFAS TURK OTOMOBIL FABRIKASI 61,992 TRY 196,291 0.46 ______________________
597,806 1.41 ______________________
UNITED STATES
APPLE INC 6,050 USD 865,210 2.03
AUTODESK INC. 13,135 USD 417,299 0.98
AVON PRODUCTS INC. 10,000 USD 390,600 0.92
COCA-COLA CO 15,000 USD 914,100 2.15
COLGATE-PALMOLIVE CO. 8,000 USD 624,960 1.47
ESTEE LAUDER COS A 8,000 USD 362,240 0.85
GOLDMAN SACHS GROUP INC 3,000 USD 493,350 1.16
HOLOGIC INC 8,000 USD 444,800 1.05
LIBERTY GLOBAL INC -A- 10,000 USD 337,100 0.79
MCDONALD'S CORP. 6,500 USD 360,620 0.85
NIKE INC -B- 8,000 USD 526,880 1.24
OCCIDENTAL PETROLEUM CORP 10,000 USD 732,200 1.72 ______________________
6,469,359 15.21 ______________________ TOTAL SHARES 38,045,975 89.46 ______________________
INVESTMENT COMPANIES
HONG KONG
ISHARES MSCI INDIA ETF 100,000 USD 723,000 1.70 ______________________
723,000 1.70 ______________________ TOTAL INVESTMENT COMPANIES 723,000 1.70 ______________________ TOTAL TRANSFERABLE SECURITIES ADMITTED TO AN OFFICIAL STOCK EXCHANGE LISTING 38,768,975 91.16 ______________________ TOTAL INVESTMENTS 38,768,975 91.16 ______________________
OTHER NET ASSETS LESS LIABILITIES 3,759,904 8.84 ______________________ TOTAL NET ASSETS 42,528,879 100.00 ______________________
HSBC Global Investment Funds 128
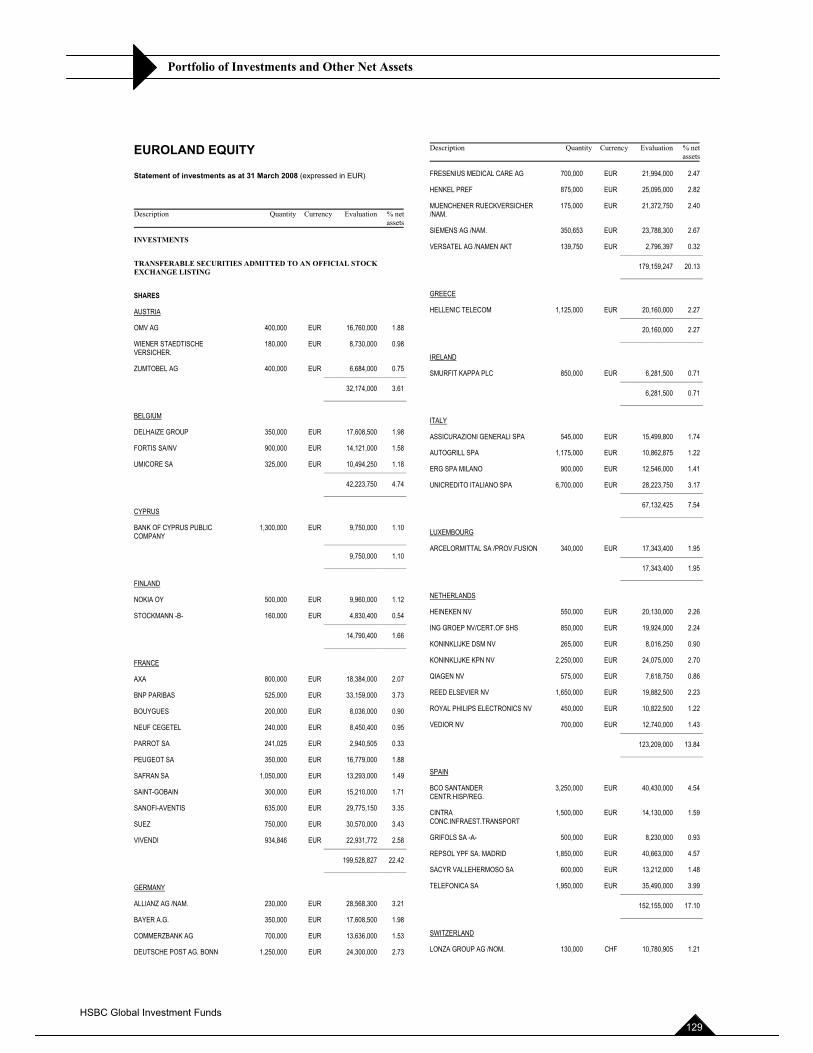
Portfolio of Investments and Other Net Assets
EUROLAND EQUITY
Statement of investments as at 31 March 2008 (expressed in EUR)
Description Quantity Currency Evaluation % netassets
INVESTMENTS
TRANSFERABLE SECURITIES ADMITTED TO AN OFFICIAL STOCK EXCHANGE LISTING
SHARES
AUSTRIA
OMV AG 400,000 EUR 16,760,000 1.88
WIENER STAEDTISCHE VERSICHER.
180,000 EUR 8,730,000 0.98
ZUMTOBEL AG 400,000 EUR 6,684,000 0.75 ______________________
32,174,000 3.61 ______________________
BELGIUM
DELHAIZE GROUP 350,000 EUR 17,608,500 1.98
FORTIS SA/NV 900,000 EUR 14,121,000 1.58
UMICORE SA 325,000 EUR 10,494,250 1.18 ______________________
42,223,750 4.74 ______________________
CYPRUS
BANK OF CYPRUS PUBLIC COMPANY ______________________
1,300,000 EUR 9,750,000 1.10
9,750,000 1.10 ______________________
FINLAND
NOKIA OY 500,000 EUR 9,960,000 1.12
STOCKMANN -B- 160,000 EUR 4,830,400 0.54 ______________________
14,790,400 1.66 ______________________
FRANCE
AXA 800,000 EUR 18,384,000 2.07
BNP PARIBAS 525,000 EUR 33,159,000 3.73
BOUYGUES 200,000 EUR 8,036,000 0.90
NEUF CEGETEL 240,000 EUR 8,450,400 0.95
PARROT SA 241,025 EUR 2,940,505 0.33
PEUGEOT SA 350,000 EUR 16,779,000 1.88
SAFRAN SA 1,050,000 EUR 13,293,000 1.49
SAINT-GOBAIN 300,000 EUR 15,210,000 1.71
SANOFI-AVENTIS 635,000 EUR 29,775,150 3.35
SUEZ 750,000 EUR 30,570,000 3.43
VIVENDI 934,846 EUR 22,931,772 2.58 ______________________
199,528,827 22.42 ______________________
GERMANY
ALLIANZ AG /NAM. 230,000 EUR 28,568,300 3.21
BAYER A.G. 350,000 EUR 17,608,500 1.98
COMMERZBANK AG 700,000 EUR 13,636,000 1.53
DEUTSCHE POST AG. BONN 1,250,000 EUR 24,300,000 2.73
Description Quantity Currency Evaluation % netassets
FRESENIUS MEDICAL CARE AG 700,000 EUR 21,994,000 2.47
HENKEL PREF 875,000 EUR 25,095,000 2.82
MUENCHENER RUECKVERSICHER /NAM.
175,000 EUR 21,372,750 2.40
SIEMENS AG /NAM. 350,653 EUR 23,788,300 2.67
VERSATEL AG /NAMEN AKT 139,750 EUR 2,796,397 0.32 ______________________
179,159,247 20.13 ______________________
GREECE
HELLENIC TELECOM 1,125,000 EUR 20,160,000 2.27 ______________________
20,160,000 2.27 ______________________
IRELAND
SMURFIT KAPPA PLC 850,000 EUR 6,281,500 0.71 ______________________
6,281,500 0.71 ______________________
ITALY
ASSICURAZIONI GENERALI SPA 545,000 EUR 15,499,800 1.74
AUTOGRILL SPA 1,175,000 EUR 10,862,875 1.22
ERG SPA MILANO 900,000 EUR 12,546,000 1.41
UNICREDITO ITALIANO SPA 6,700,000 EUR 28,223,750 3.17 ______________________
67,132,425 7.54 ______________________
LUXEMBOURG
ARCELORMITTAL SA /PROV.FUSION 340,000 EUR 17,343,400 1.95 ______________________
17,343,400 1.95 ______________________
NETHERLANDS
HEINEKEN NV 550,000 EUR 20,130,000 2.26
ING GROEP NV/CERT.OF SHS 850,000 EUR 19,924,000 2.24
KONINKLIJKE DSM NV 265,000 EUR 8,016,250 0.90
KONINKLIJKE KPN NV 2,250,000 EUR 24,075,000 2.70
QIAGEN NV 575,000 EUR 7,618,750 0.86
REED ELSEVIER NV 1,650,000 EUR 19,882,500 2.23
ROYAL PHILIPS ELECTRONICS NV 450,000 EUR 10,822,500 1.22
VEDIOR NV 700,000 EUR 12,740,000 1.43 ______________________
123,209,000 13.84 ______________________
SPAIN
BCO SANTANDER CENTR.HISP/REG.
3,250,000 EUR 40,430,000 4.54
CINTRACONC.INFRAEST.TRANSPORT
1,500,000 EUR 14,130,000 1.59
GRIFOLS SA -A- 500,000 EUR 8,230,000 0.93
REPSOL YPF SA. MADRID 1,850,000 EUR 40,663,000 4.57
SACYR VALLEHERMOSO SA 600,000 EUR 13,212,000 1.48
TELEFONICA SA 1,950,000 EUR 35,490,000 3.99 ______________________
152,155,000 17.10 ______________________
SWITZERLAND
LONZA GROUP AG /NOM. 130,000 CHF 10,780,905 1.21
HSBC Global Investment Funds 129
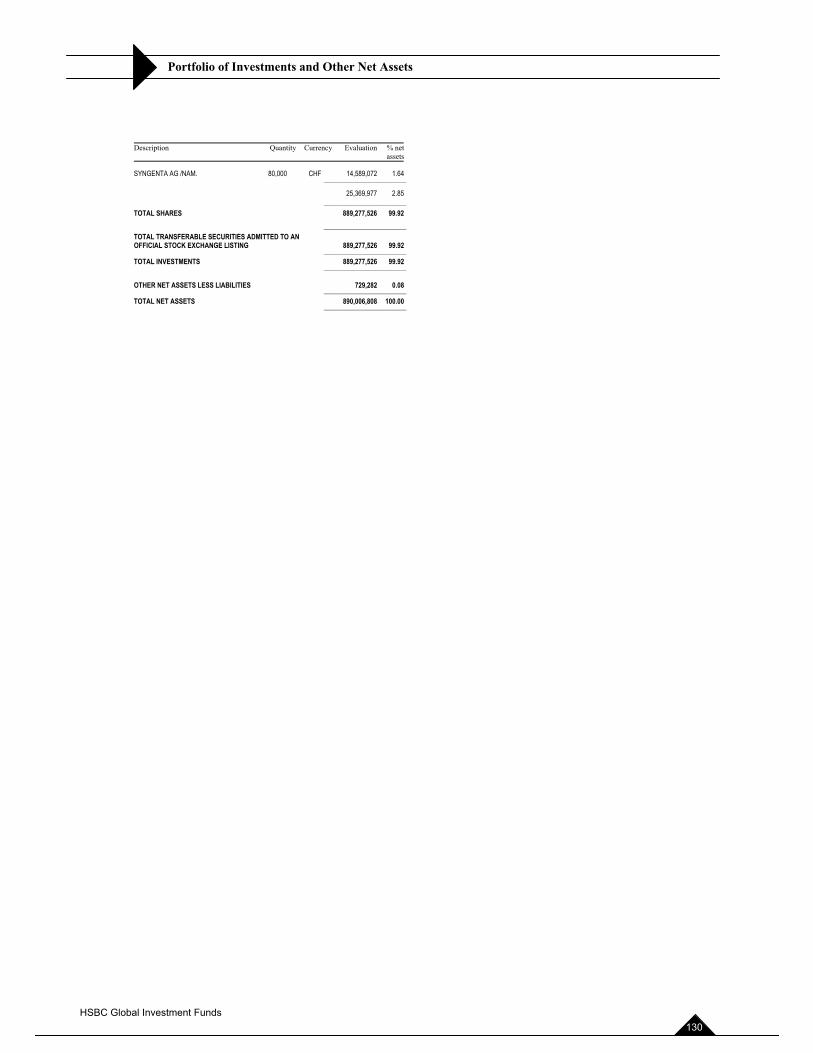
Portfolio of Investments and Other Net Assets
Description Quantity Currency Evaluation % netassets
SYNGENTA AG /NAM. 80,000 CHF 14,589,072 1.64 ______________________
25,369,977 2.85 ______________________ TOTAL SHARES 889,277,526 99.92 ______________________ TOTAL TRANSFERABLE SECURITIES ADMITTED TO AN OFFICIAL STOCK EXCHANGE LISTING 889,277,526 99.92 ______________________ TOTAL INVESTMENTS 889,277,526 99.92 ______________________
OTHER NET ASSETS LESS LIABILITIES 729,282 0.08 ______________________ TOTAL NET ASSETS 890,006,808 100.00 ______________________
HSBC Global Investment Funds 130
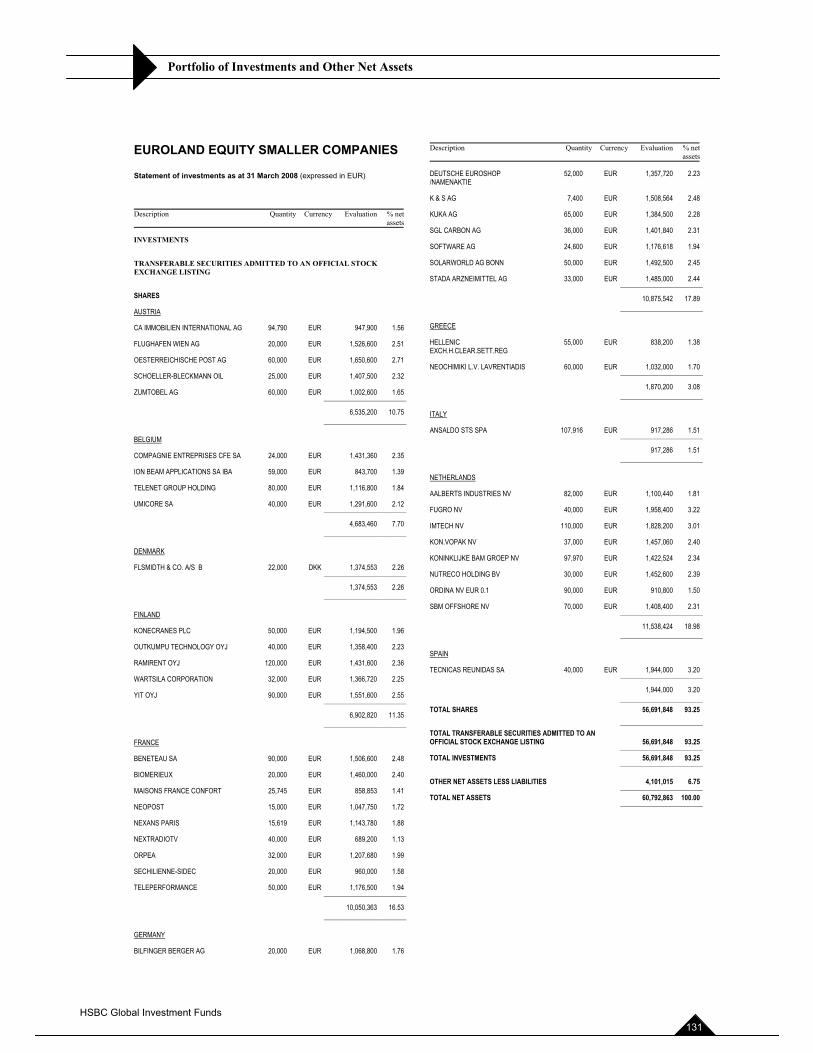
Portfolio of Investments and Other Net Assets
EUROLAND EQUITY SMALLER COMPANIES
Statement of investments as at 31 March 2008 (expressed in EUR)
Description Quantity Currency Evaluation % netassets
INVESTMENTS
TRANSFERABLE SECURITIES ADMITTED TO AN OFFICIAL STOCK EXCHANGE LISTING
SHARES
AUSTRIA
CA IMMOBILIEN INTERNATIONAL AG 94,790 EUR 947,900 1.56
FLUGHAFEN WIEN AG 20,000 EUR 1,526,600 2.51
OESTERREICHISCHE POST AG 60,000 EUR 1,650,600 2.71
SCHOELLER-BLECKMANN OIL 25,000 EUR 1,407,500 2.32
ZUMTOBEL AG 60,000 EUR 1,002,600 1.65 ______________________
6,535,200 10.75 ______________________
BELGIUM
COMPAGNIE ENTREPRISES CFE SA 24,000 EUR 1,431,360 2.35
ION BEAM APPLICATIONS SA IBA 59,000 EUR 843,700 1.39
TELENET GROUP HOLDING 80,000 EUR 1,116,800 1.84
UMICORE SA 40,000 EUR 1,291,600 2.12 ______________________
4,683,460 7.70 ______________________
DENMARK
FLSMIDTH & CO. A/S B 22,000 DKK 1,374,553 2.26 ______________________
1,374,553 2.26 ______________________
FINLAND
KONECRANES PLC 50,000 EUR 1,194,500 1.96
OUTKUMPU TECHNOLOGY OYJ 40,000 EUR 1,358,400 2.23
RAMIRENT OYJ 120,000 EUR 1,431,600 2.36
WARTSILA CORPORATION 32,000 EUR 1,366,720 2.25
YIT OYJ 90,000 EUR 1,551,600 2.55 ______________________
6,902,820 11.35 ______________________
FRANCE
BENETEAU SA 90,000 EUR 1,506,600 2.48
BIOMERIEUX 20,000 EUR 1,460,000 2.40
MAISONS FRANCE CONFORT 25,745 EUR 858,853 1.41
NEOPOST 15,000 EUR 1,047,750 1.72
NEXANS PARIS 15,619 EUR 1,143,780 1.88
NEXTRADIOTV 40,000 EUR 689,200 1.13
ORPEA 32,000 EUR 1,207,680 1.99
SECHILIENNE-SIDEC 20,000 EUR 960,000 1.58
TELEPERFORMANCE 50,000 EUR 1,176,500 1.94 ______________________
10,050,363 16.53 ______________________
GERMANY
BILFINGER BERGER AG 20,000 EUR 1,068,800 1.76
Description Quantity Currency Evaluation % netassets
DEUTSCHE EUROSHOP /NAMENAKTIE
52,000 EUR 1,357,720 2.23
K & S AG 7,400 EUR 1,508,564 2.48
KUKA AG 65,000 EUR 1,384,500 2.28
SGL CARBON AG 36,000 EUR 1,401,840 2.31
SOFTWARE AG 24,600 EUR 1,176,618 1.94
SOLARWORLD AG BONN 50,000 EUR 1,492,500 2.45
STADA ARZNEIMITTEL AG 33,000 EUR 1,485,000 2.44 ______________________
10,875,542 17.89 ______________________
GREECE
HELLENIC EXCH.H.CLEAR.SETT.REG
55,000 EUR 838,200 1.38
NEOCHIMIKI L.V. LAVRENTIADIS 60,000 EUR 1,032,000 1.70 ______________________
1,870,200 3.08 ______________________
ITALY
ANSALDO STS SPA 107,916 EUR 917,286 1.51 ______________________
917,286 1.51 ______________________
NETHERLANDS
AALBERTS INDUSTRIES NV 82,000 EUR 1,100,440 1.81
FUGRO NV 40,000 EUR 1,958,400 3.22
IMTECH NV 110,000 EUR 1,828,200 3.01
KON.VOPAK NV 37,000 EUR 1,457,060 2.40
KONINKLIJKE BAM GROEP NV 97,970 EUR 1,422,524 2.34
NUTRECO HOLDING BV 30,000 EUR 1,452,600 2.39
ORDINA NV EUR 0.1 90,000 EUR 910,800 1.50
SBM OFFSHORE NV 70,000 EUR 1,408,400 2.31 ______________________
11,538,424 18.98 ______________________
SPAIN
TECNICAS REUNIDAS SA 40,000 EUR 1,944,000 3.20 ______________________
1,944,000 3.20 ______________________ TOTAL SHARES 56,691,848 93.25 ______________________ TOTAL TRANSFERABLE SECURITIES ADMITTED TO AN OFFICIAL STOCK EXCHANGE LISTING 56,691,848 93.25 ______________________ TOTAL INVESTMENTS 56,691,848 93.25 ______________________
OTHER NET ASSETS LESS LIABILITIES 4,101,015 6.75 ______________________ TOTAL NET ASSETS 60,792,863 100.00 ______________________
HSBC Global Investment Funds 131
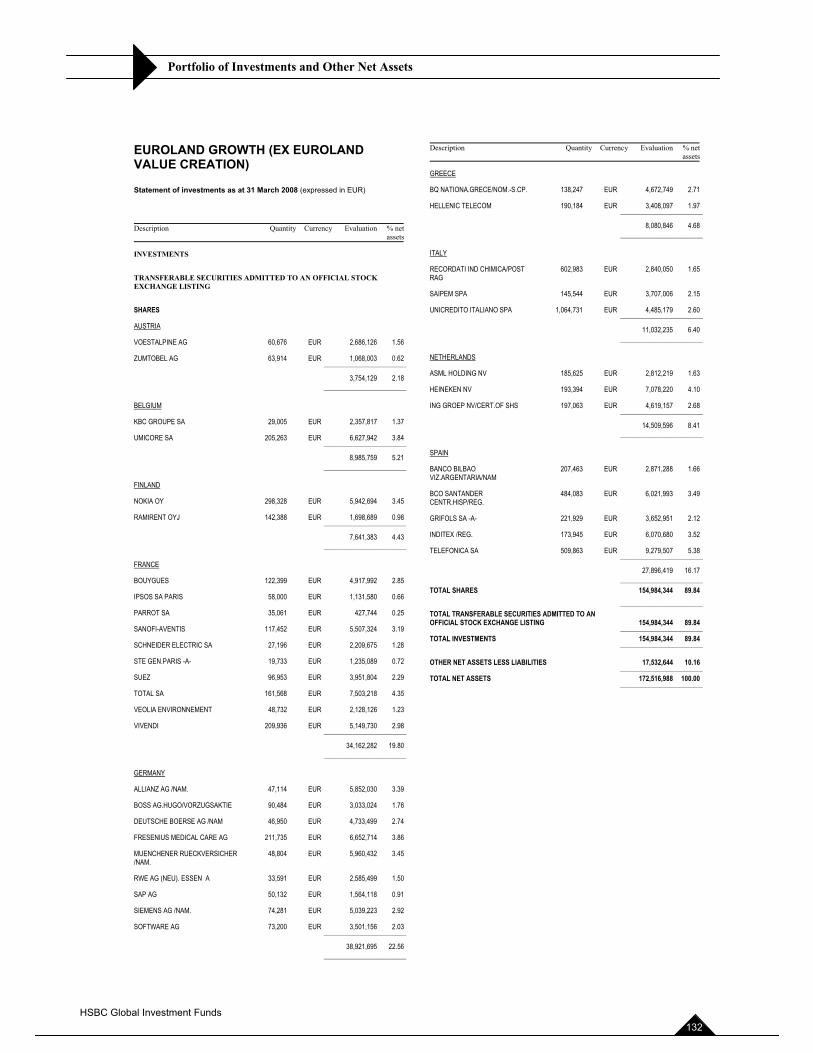
Portfolio of Investments and Other Net Assets
EUROLAND GROWTH (EX EUROLAND VALUE CREATION)
Statement of investments as at 31 March 2008 (expressed in EUR)
Description Quantity Currency Evaluation % netassets
INVESTMENTS
TRANSFERABLE SECURITIES ADMITTED TO AN OFFICIAL STOCK EXCHANGE LISTING
SHARES
AUSTRIA
VOESTALPINE AG 60,676 EUR 2,686,126 1.56
ZUMTOBEL AG 63,914 EUR 1,068,003 0.62 ______________________
3,754,129 2.18 ______________________
BELGIUM
KBC GROUPE SA 29,005 EUR 2,357,817 1.37
UMICORE SA 205,263 EUR 6,627,942 3.84 ______________________
8,985,759 5.21 ______________________
FINLAND
NOKIA OY 298,328 EUR 5,942,694 3.45
RAMIRENT OYJ 142,388 EUR 1,698,689 0.98 ______________________
7,641,383 4.43 ______________________
FRANCE
BOUYGUES 122,399 EUR 4,917,992 2.85
IPSOS SA PARIS 58,000 EUR 1,131,580 0.66
PARROT SA 35,061 EUR 427,744 0.25
SANOFI-AVENTIS 117,452 EUR 5,507,324 3.19
SCHNEIDER ELECTRIC SA 27,196 EUR 2,209,675 1.28
STE GEN.PARIS -A- 19,733 EUR 1,235,089 0.72
SUEZ 96,953 EUR 3,951,804 2.29
TOTAL SA 161,568 EUR 7,503,218 4.35
VEOLIA ENVIRONNEMENT 48,732 EUR 2,128,126 1.23
VIVENDI 209,936 EUR 5,149,730 2.98 ______________________
34,162,282 19.80 ______________________
GERMANY
ALLIANZ AG /NAM. 47,114 EUR 5,852,030 3.39
BOSS AG.HUGO/VORZUGSAKTIE 90,484 EUR 3,033,024 1.76
DEUTSCHE BOERSE AG /NAM 46,950 EUR 4,733,499 2.74
FRESENIUS MEDICAL CARE AG 211,735 EUR 6,652,714 3.86
MUENCHENER RUECKVERSICHER /NAM.
48,804 EUR 5,960,432 3.45
RWE AG (NEU). ESSEN A 33,591 EUR 2,585,499 1.50
SAP AG 50,132 EUR 1,564,118 0.91
SIEMENS AG /NAM. 74,281 EUR 5,039,223 2.92
SOFTWARE AG 73,200 EUR 3,501,156 2.03 ______________________
38,921,695 22.56 ______________________
Description Quantity Currency Evaluation % netassets
GREECE
BQ NATIONA.GRECE/NOM.-S.CP. 138,247 EUR 4,672,749 2.71
HELLENIC TELECOM 190,184 EUR 3,408,097 1.97 ______________________
8,080,846 4.68 ______________________
ITALY
RECORDATI IND CHIMICA/POSTRAG
602,983 EUR 2,840,050 1.65
SAIPEM SPA 145,544 EUR 3,707,006 2.15
UNICREDITO ITALIANO SPA 1,064,731 EUR 4,485,179 2.60 ______________________
11,032,235 6.40 ______________________
NETHERLANDS
ASML HOLDING NV 185,625 EUR 2,812,219 1.63
HEINEKEN NV 193,394 EUR 7,078,220 4.10
ING GROEP NV/CERT.OF SHS 197,063 EUR 4,619,157 2.68 ______________________
14,509,596 8.41 ______________________
SPAIN
BANCO BILBAO VIZ.ARGENTARIA/NAM
207,463 EUR 2,871,288 1.66
BCO SANTANDER CENTR.HISP/REG.
484,083 EUR 6,021,993 3.49
GRIFOLS SA -A- 221,929 EUR 3,652,951 2.12
INDITEX /REG. 173,945 EUR 6,070,680 3.52
TELEFONICA SA 509,863 EUR 9,279,507 5.38 ______________________
27,896,419 16.17 ______________________ TOTAL SHARES 154,984,344 89.84 ______________________ TOTAL TRANSFERABLE SECURITIES ADMITTED TO AN OFFICIAL STOCK EXCHANGE LISTING 154,984,344 89.84 ______________________ TOTAL INVESTMENTS 154,984,344 89.84 ______________________
OTHER NET ASSETS LESS LIABILITIES 17,532,644 10.16 ______________________ TOTAL NET ASSETS 172,516,988 100.00 ______________________
HSBC Global Investment Funds 132
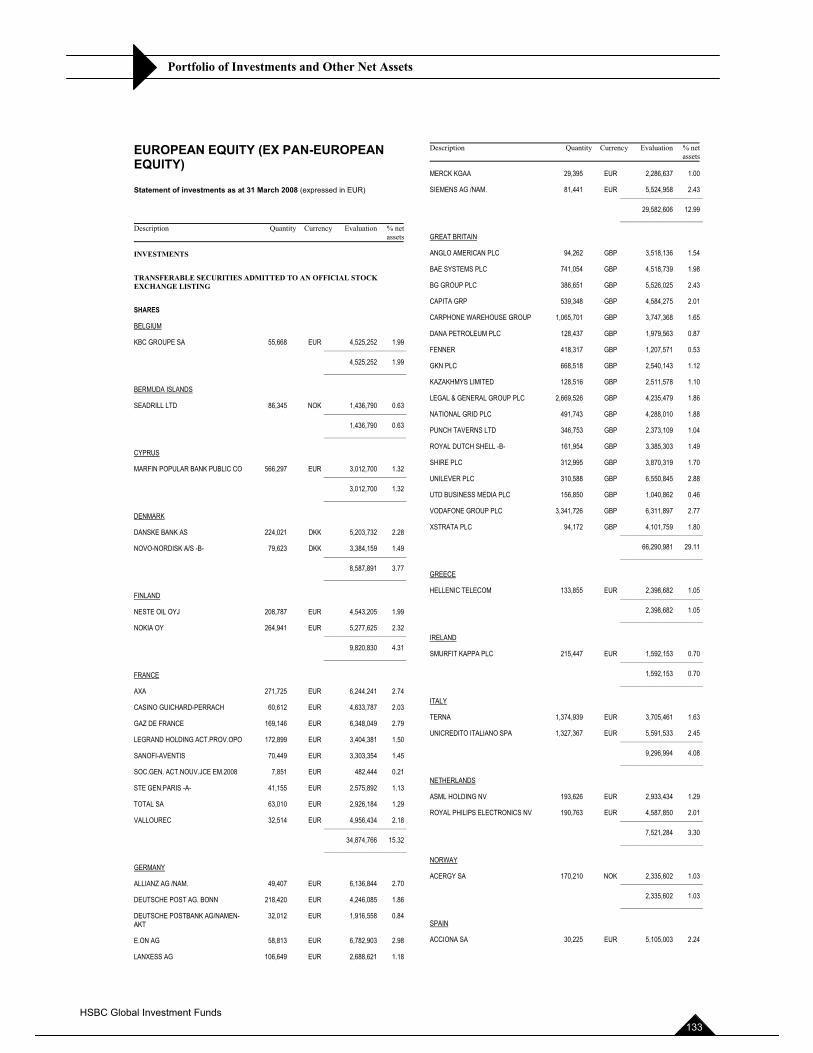
Portfolio of Investments and Other Net Assets
EUROPEAN EQUITY (EX PAN-EUROPEAN EQUITY)
Statement of investments as at 31 March 2008 (expressed in EUR)
Description Quantity Currency Evaluation % netassets
INVESTMENTS
TRANSFERABLE SECURITIES ADMITTED TO AN OFFICIAL STOCK EXCHANGE LISTING
SHARES
BELGIUM
KBC GROUPE SA 55,668 EUR 4,525,252 1.99 ______________________
4,525,252 1.99 ______________________
BERMUDA ISLANDS
SEADRILL LTD 86,345 NOK 1,436,790 0.63 ______________________
1,436,790 0.63 ______________________
CYPRUS
MARFIN POPULAR BANK PUBLIC CO 566,297 EUR 3,012,700 1.32 ______________________
3,012,700 1.32 ______________________
DENMARK
DANSKE BANK AS 224,021 DKK 5,203,732 2.28
NOVO-NORDISK A/S -B- 79,623 DKK 3,384,159 1.49 ______________________
8,587,891 3.77 ______________________
FINLAND
NESTE OIL OYJ 208,787 EUR 4,543,205 1.99
NOKIA OY 264,941 EUR 5,277,625 2.32 ______________________
9,820,830 4.31 ______________________
FRANCE
AXA 271,725 EUR 6,244,241 2.74
CASINO GUICHARD-PERRACH 60,612 EUR 4,633,787 2.03
GAZ DE FRANCE 169,146 EUR 6,348,049 2.79
LEGRAND HOLDING ACT.PROV.OPO 172,899 EUR 3,404,381 1.50
SANOFI-AVENTIS 70,449 EUR 3,303,354 1.45
SOC.GEN. ACT.NOUV.JCE EM.2008 7,851 EUR 482,444 0.21
STE GEN.PARIS -A- 41,155 EUR 2,575,892 1.13
TOTAL SA 63,010 EUR 2,926,184 1.29
VALLOUREC 32,514 EUR 4,956,434 2.18 ______________________
34,874,766 15.32 ______________________
GERMANY
ALLIANZ AG /NAM. 49,407 EUR 6,136,844 2.70
DEUTSCHE POST AG. BONN 218,420 EUR 4,246,085 1.86
DEUTSCHE POSTBANK AG/NAMEN-AKT
32,012 EUR 1,916,558 0.84
E.ON AG 58,813 EUR 6,782,903 2.98
LANXESS AG 106,649 EUR 2,688,621 1.18
Description Quantity Currency Evaluation % netassets
MERCK KGAA 29,395 EUR 2,286,637 1.00
SIEMENS AG /NAM. 81,441 EUR 5,524,958 2.43 ______________________
29,582,606 12.99 ______________________
GREAT BRITAIN
ANGLO AMERICAN PLC 94,262 GBP 3,518,136 1.54
BAE SYSTEMS PLC 741,054 GBP 4,518,739 1.98
BG GROUP PLC 386,651 GBP 5,526,025 2.43
CAPITA GRP 539,348 GBP 4,584,275 2.01
CARPHONE WAREHOUSE GROUP 1,065,701 GBP 3,747,368 1.65
DANA PETROLEUM PLC 128,437 GBP 1,979,563 0.87
FENNER 418,317 GBP 1,207,571 0.53
GKN PLC 668,518 GBP 2,540,143 1.12
KAZAKHMYS LIMITED 128,516 GBP 2,511,578 1.10
LEGAL & GENERAL GROUP PLC 2,669,526 GBP 4,235,479 1.86
NATIONAL GRID PLC 491,743 GBP 4,288,010 1.88
PUNCH TAVERNS LTD 346,753 GBP 2,373,109 1.04
ROYAL DUTCH SHELL -B- 161,954 GBP 3,385,303 1.49
SHIRE PLC 312,995 GBP 3,870,319 1.70
UNILEVER PLC 310,588 GBP 6,550,845 2.88
UTD BUSINESS MEDIA PLC 156,850 GBP 1,040,862 0.46
VODAFONE GROUP PLC 3,341,726 GBP 6,311,897 2.77
XSTRATA PLC 94,172 GBP 4,101,759 1.80 ______________________
66,290,981 29.11 ______________________
GREECE
HELLENIC TELECOM 133,855 EUR 2,398,682 1.05 ______________________
2,398,682 1.05 ______________________
IRELAND
SMURFIT KAPPA PLC 215,447 EUR 1,592,153 0.70 ______________________
1,592,153 0.70 ______________________
ITALY
TERNA 1,374,939 EUR 3,705,461 1.63
UNICREDITO ITALIANO SPA 1,327,367 EUR 5,591,533 2.45 ______________________
9,296,994 4.08 ______________________
NETHERLANDS
ASML HOLDING NV 193,626 EUR 2,933,434 1.29
ROYAL PHILIPS ELECTRONICS NV 190,763 EUR 4,587,850 2.01 ______________________
7,521,284 3.30 ______________________
NORWAY
ACERGY SA 170,210 NOK 2,335,602 1.03 ______________________
2,335,602 1.03 ______________________
SPAIN
ACCIONA SA 30,225 EUR 5,105,003 2.24
HSBC Global Investment Funds 133
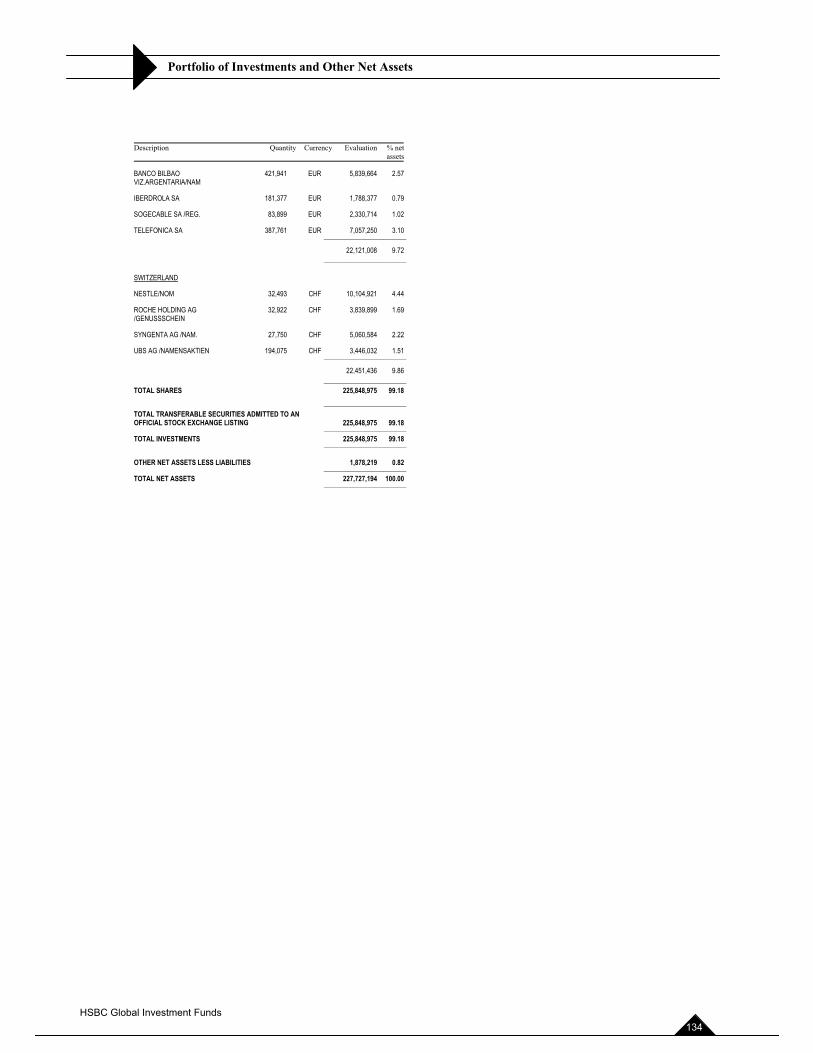
Portfolio of Investments and Other Net Assets
Description Quantity Currency Evaluation % netassets
BANCO BILBAO VIZ.ARGENTARIA/NAM
421,941 EUR 5,839,664 2.57
IBERDROLA SA 181,377 EUR 1,788,377 0.79
SOGECABLE SA /REG. 83,899 EUR 2,330,714 1.02
TELEFONICA SA 387,761 EUR 7,057,250 3.10 ______________________
22,121,008 9.72 ______________________
SWITZERLAND
NESTLE/NOM 32,493 CHF 10,104,921 4.44
ROCHE HOLDING AG /GENUSSSCHEIN
32,922 CHF 3,839,899 1.69
SYNGENTA AG /NAM. 27,750 CHF 5,060,584 2.22
UBS AG /NAMENSAKTIEN 194,075 CHF 3,446,032 1.51 ______________________
22,451,436 9.86 ______________________ TOTAL SHARES 225,848,975 99.18 ______________________ TOTAL TRANSFERABLE SECURITIES ADMITTED TO AN OFFICIAL STOCK EXCHANGE LISTING 225,848,975 99.18 ______________________ TOTAL INVESTMENTS 225,848,975 99.18 ______________________
OTHER NET ASSETS LESS LIABILITIES 1,878,219 0.82 ______________________ TOTAL NET ASSETS 227,727,194 100.00 ______________________
HSBC Global Investment Funds 134
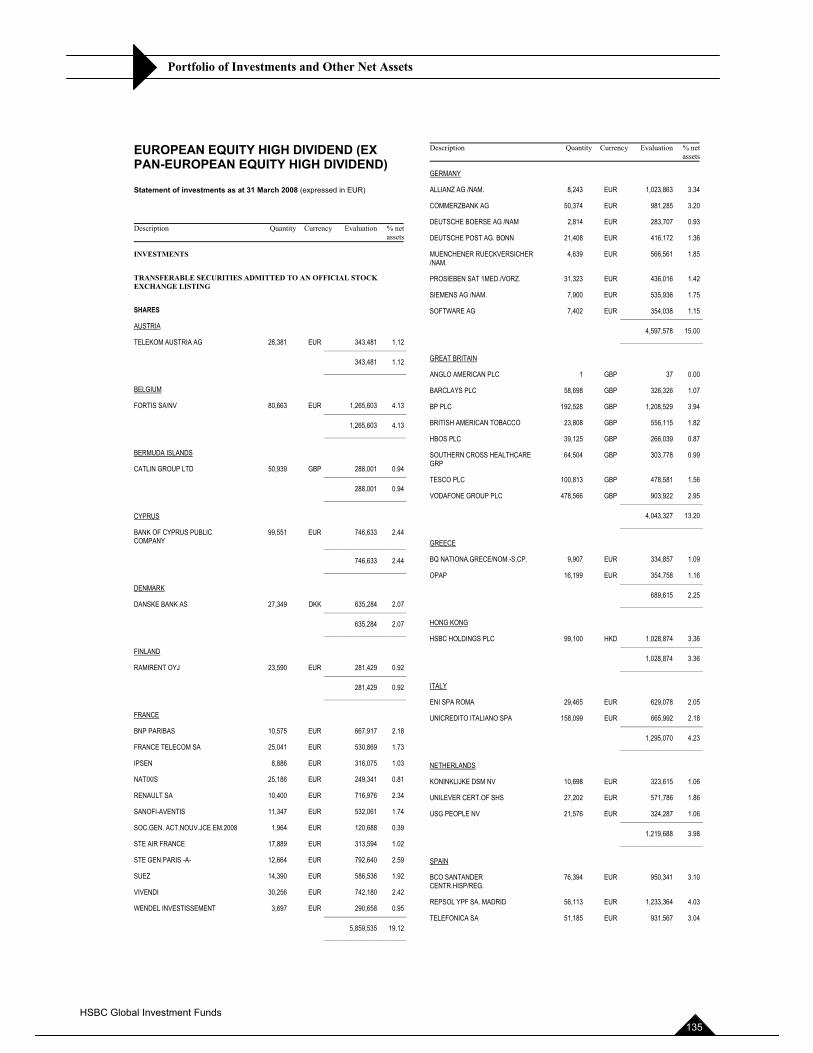
Portfolio of Investments and Other Net Assets
EUROPEAN EQUITY HIGH DIVIDEND (EX PAN-EUROPEAN EQUITY HIGH DIVIDEND)
Statement of investments as at 31 March 2008 (expressed in EUR)
Description Quantity Currency Evaluation % netassets
INVESTMENTS
TRANSFERABLE SECURITIES ADMITTED TO AN OFFICIAL STOCK EXCHANGE LISTING
SHARES
AUSTRIA
TELEKOM AUSTRIA AG 26,381 EUR 343,481 1.12 ______________________
343,481 1.12 ______________________
BELGIUM
FORTIS SA/NV 80,663 EUR 1,265,603 4.13 ______________________
1,265,603 4.13 ______________________
BERMUDA ISLANDS
CATLIN GROUP LTD 50,939 GBP 288,001 0.94 ______________________
288,001 0.94 ______________________
CYPRUS
BANK OF CYPRUS PUBLIC COMPANY ______________________
99,551 EUR 746,633 2.44
746,633 2.44 ______________________
DENMARK
DANSKE BANK AS 27,349 DKK 635,284 2.07 ______________________
635,284 2.07 ______________________
FINLAND
RAMIRENT OYJ 23,590 EUR 281,429 0.92 ______________________
281,429 0.92 ______________________
FRANCE
BNP PARIBAS 10,575 EUR 667,917 2.18
FRANCE TELECOM SA 25,041 EUR 530,869 1.73
IPSEN 8,886 EUR 316,075 1.03
NATIXIS 25,186 EUR 249,341 0.81
RENAULT SA 10,400 EUR 716,976 2.34
SANOFI-AVENTIS 11,347 EUR 532,061 1.74
SOC.GEN. ACT.NOUV.JCE EM.2008 1,964 EUR 120,688 0.39
STE AIR FRANCE 17,889 EUR 313,594 1.02
STE GEN.PARIS -A- 12,664 EUR 792,640 2.59
SUEZ 14,390 EUR 586,536 1.92
VIVENDI 30,256 EUR 742,180 2.42
WENDEL INVESTISSEMENT 3,697 EUR 290,658 0.95 ______________________
5,859,535 19.12 ______________________
Description Quantity Currency Evaluation % netassets
GERMANY
ALLIANZ AG /NAM. 8,243 EUR 1,023,863 3.34
COMMERZBANK AG 50,374 EUR 981,285 3.20
DEUTSCHE BOERSE AG /NAM 2,814 EUR 283,707 0.93
DEUTSCHE POST AG. BONN 21,408 EUR 416,172 1.36
MUENCHENER RUECKVERSICHER /NAM.
4,639 EUR 566,561 1.85
PROSIEBEN SAT 1MED./VORZ. 31,323 EUR 436,016 1.42
SIEMENS AG /NAM. 7,900 EUR 535,936 1.75
SOFTWARE AG 7,402 EUR 354,038 1.15 ______________________
4,597,578 15.00 ______________________
GREAT BRITAIN
ANGLO AMERICAN PLC 1 GBP 37 0.00
BARCLAYS PLC 58,698 GBP 326,326 1.07
BP PLC 192,528 GBP 1,208,529 3.94
BRITISH AMERICAN TOBACCO 23,808 GBP 556,115 1.82
HBOS PLC 39,125 GBP 266,039 0.87
SOUTHERN CROSS HEALTHCARE GRP
64,504 GBP 303,778 0.99
TESCO PLC 100,813 GBP 478,581 1.56
VODAFONE GROUP PLC 478,566 GBP 903,922 2.95 ______________________
4,043,327 13.20 ______________________
GREECE
BQ NATIONA.GRECE/NOM.-S.CP. 9,907 EUR 334,857 1.09
OPAP 16,199 EUR 354,758 1.16 ______________________
689,615 2.25 ______________________
HONG KONG
HSBC HOLDINGS PLC 99,100 HKD 1,028,874 3.36 ______________________
1,028,874 3.36 ______________________
ITALY
ENI SPA ROMA 29,465 EUR 629,078 2.05
UNICREDITO ITALIANO SPA 158,099 EUR 665,992 2.18 ______________________
1,295,070 4.23 ______________________
NETHERLANDS
KONINKLIJKE DSM NV 10,698 EUR 323,615 1.06
UNILEVER CERT.OF SHS 27,202 EUR 571,786 1.86
USG PEOPLE NV 21,576 EUR 324,287 1.06 ______________________
1,219,688 3.98 ______________________
SPAIN
BCO SANTANDER CENTR.HISP/REG.
76,394 EUR 950,341 3.10
REPSOL YPF SA. MADRID 56,113 EUR 1,233,364 4.03
TELEFONICA SA 51,185 EUR 931,567 3.04
HSBC Global Investment Funds 135
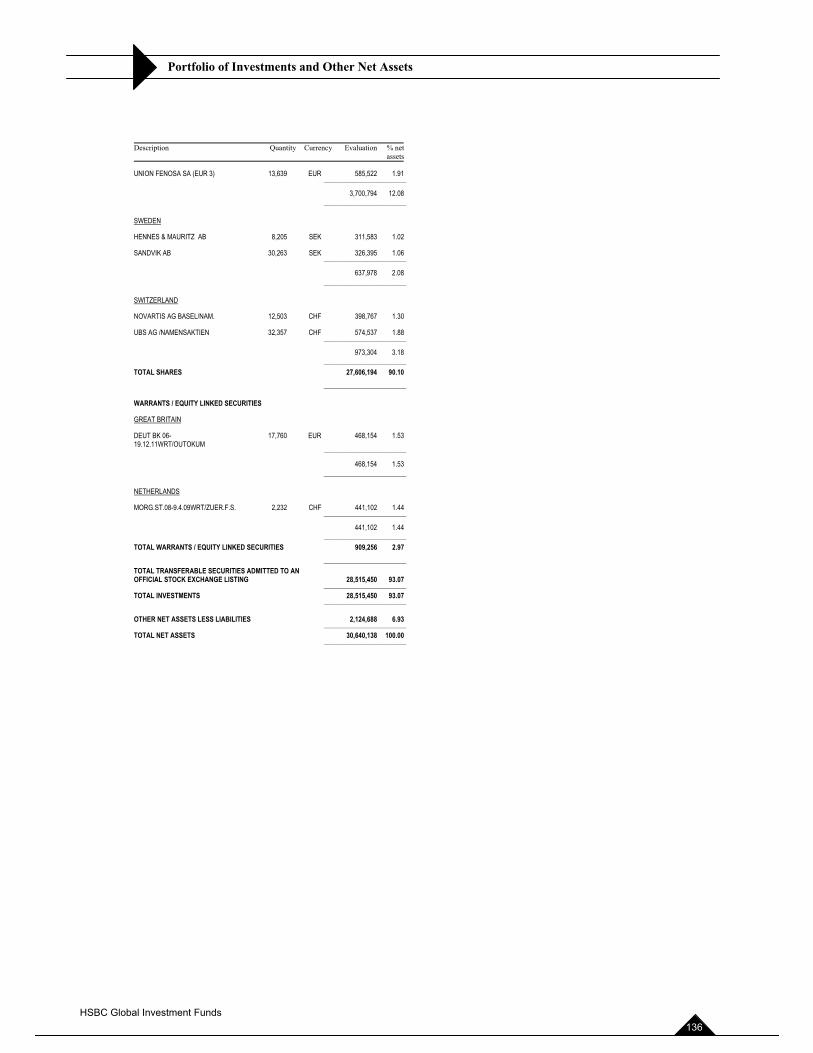
Portfolio of Investments and Other Net Assets
Description Quantity Currency Evaluation % netassets
UNION FENOSA SA (EUR 3) 13,639 EUR 585,522 1.91 ______________________
3,700,794 12.08 ______________________
SWEDEN
HENNES & MAURITZ AB 8,205 SEK 311,583 1.02
SANDVIK AB 30,263 SEK 326,395 1.06 ______________________
637,978 2.08 ______________________
SWITZERLAND
NOVARTIS AG BASEL/NAM. 12,503 CHF 398,767 1.30
UBS AG /NAMENSAKTIEN 32,357 CHF 574,537 1.88 ______________________
973,304 3.18 ______________________ TOTAL SHARES 27,606,194 90.10 ______________________
WARRANTS / EQUITY LINKED SECURITIES
GREAT BRITAIN
DEUT BK 06-19.12.11WRT/OUTOKUM ______________________
17,760 EUR 468,154 1.53
468,154 1.53 ______________________
NETHERLANDS
MORG.ST.08-9.4.09WRT/ZUER.F.S. 2,232 CHF 441,102 1.44 ______________________
441,102 1.44 ______________________ TOTAL WARRANTS / EQUITY LINKED SECURITIES 909,256 2.97 ______________________ TOTAL TRANSFERABLE SECURITIES ADMITTED TO AN OFFICIAL STOCK EXCHANGE LISTING 28,515,450 93.07 ______________________ TOTAL INVESTMENTS 28,515,450 93.07 ______________________
OTHER NET ASSETS LESS LIABILITIES 2,124,688 6.93 ______________________ TOTAL NET ASSETS 30,640,138 100.00 ______________________
HSBC Global Investment Funds 136
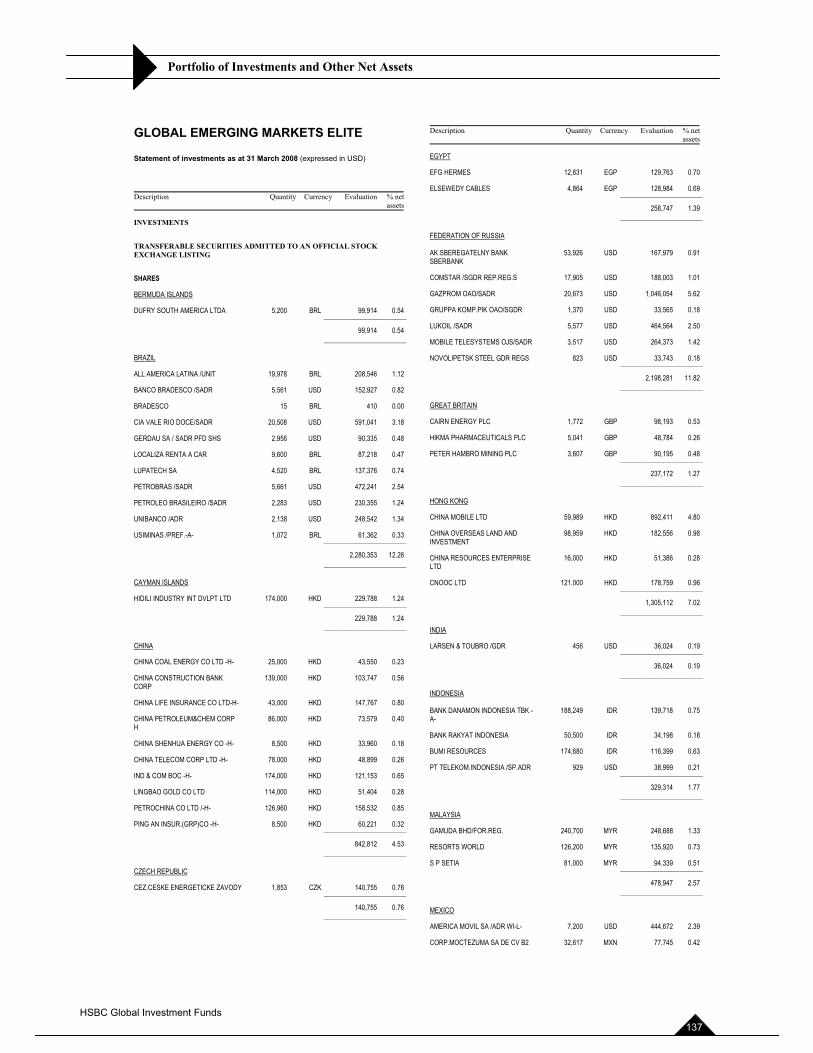
Portfolio of Investments and Other Net Assets
GLOBAL EMERGING MARKETS ELITE
Statement of investments as at 31 March 2008 (expressed in USD)
Description Quantity Currency Evaluation % netassets
INVESTMENTS
TRANSFERABLE SECURITIES ADMITTED TO AN OFFICIAL STOCK EXCHANGE LISTING
SHARES
BERMUDA ISLANDS
DUFRY SOUTH AMERICA LTDA 5,200 BRL 99,914 0.54 ______________________
99,914 0.54 ______________________
BRAZIL
ALL AMERICA LATINA /UNIT 19,978 BRL 208,546 1.12
BANCO BRADESCO /SADR 5,561 USD 152,927 0.82
BRADESCO 15 BRL 410 0.00
CIA VALE RIO DOCE/SADR 20,508 USD 591,041 3.18
GERDAU SA / SADR PFD SHS 2,956 USD 90,335 0.48
LOCALIZA RENTA A CAR 9,600 BRL 87,218 0.47
LUPATECH SA 4,520 BRL 137,376 0.74
PETROBRAS /SADR 5,661 USD 472,241 2.54
PETROLEO BRASILEIRO /SADR 2,283 USD 230,355 1.24
UNIBANCO /ADR 2,138 USD 248,542 1.34
USIMINAS /PREF.-A- 1,072 BRL 61,362 0.33 ______________________
2,280,353 12.26 ______________________
CAYMAN ISLANDS
HIDILI INDUSTRY INT DVLPT LTD 174,000 HKD 229,788 1.24 ______________________
229,788 1.24 ______________________
CHINA
CHINA COAL ENERGY CO LTD -H- 25,000 HKD 43,550 0.23
CHINA CONSTRUCTION BANK CORP
139,000 HKD 103,747 0.56
CHINA LIFE INSURANCE CO LTD-H- 43,000 HKD 147,767 0.80
CHINA PETROLEUM&CHEM CORP H
86,000 HKD 73,579 0.40
CHINA SHENHUA ENERGY CO -H- 8,500 HKD 33,960 0.18
CHINA TELECOM CORP LTD -H- 78,000 HKD 48,899 0.26
IND & COM BOC -H- 174,000 HKD 121,153 0.65
LINGBAO GOLD CO LTD 114,000 HKD 51,404 0.28
PETROCHINA CO LTD /-H- 126,960 HKD 158,532 0.85
PING AN INSUR.(GRP)CO -H- 8,500 HKD 60,221 0.32 ______________________
842,812 4.53 ______________________
CZECH REPUBLIC
CEZ.CESKE ENERGETICKE ZAVODY 1,853 CZK 140,755 0.76 ______________________
140,755 0.76 ______________________
Description Quantity Currency Evaluation % netassets
EGYPT
EFG HERMES 12,631 EGP 129,763 0.70
ELSEWEDY CABLES 4,864 EGP 128,984 0.69 ______________________
258,747 1.39 ______________________
FEDERATION OF RUSSIA
AK SBEREGATELNY BANK SBERBANK
53,926 USD 167,979 0.91
COMSTAR /SGDR REP.REG.S 17,905 USD 188,003 1.01
GAZPROM OAO/SADR 20,673 USD 1,046,054 5.62
GRUPPA KOMP.PIK OAO/SGDR 1,370 USD 33,565 0.18
LUKOIL /SADR 5,577 USD 464,564 2.50
MOBILE TELESYSTEMS OJS/SADR 3,517 USD 264,373 1.42
NOVOLIPETSK STEEL GDR REGS 823 USD 33,743 0.18 ______________________
2,198,281 11.82 ______________________
GREAT BRITAIN
CAIRN ENERGY PLC 1,772 GBP 98,193 0.53
HIKMA PHARMACEUTICALS PLC 5,041 GBP 48,784 0.26
PETER HAMBRO MINING PLC 3,607 GBP 90,195 0.48 ______________________
237,172 1.27 ______________________
HONG KONG
CHINA MOBILE LTD 59,989 HKD 892,411 4.80
CHINA OVERSEAS LAND AND INVESTMENT
98,959 HKD 182,556 0.98
CHINA RESOURCES ENTERPRISE LTD
16,000 HKD 51,386 0.28
CNOOC LTD 121,000 HKD 178,759 0.96 ______________________
1,305,112 7.02 ______________________
INDIA
LARSEN & TOUBRO /GDR 456 USD 36,024 0.19 ______________________
36,024 0.19 ______________________
INDONESIA
BANK DANAMON INDONESIA TBK -A-
188,249 IDR 139,718 0.75
BANK RAKYAT INDONESIA 50,500 IDR 34,198 0.18
BUMI RESOURCES 174,680 IDR 116,399 0.63
PT TELEKOM.INDONESIA /SP.ADR 929 USD 38,999 0.21 ______________________
329,314 1.77 ______________________
MALAYSIA
GAMUDA BHD/FOR.REG. 240,700 MYR 248,688 1.33
RESORTS WORLD 126,200 MYR 135,920 0.73
S P SETIA 81,000 MYR 94,339 0.51 ______________________
478,947 2.57 ______________________
MEXICO
AMERICA MOVIL SA /ADR WI-L- 7,200 USD 444,672 2.39
CORP.MOCTEZUMA SA DE CV B2 32,617 MXN 77,745 0.42
HSBC Global Investment Funds 137
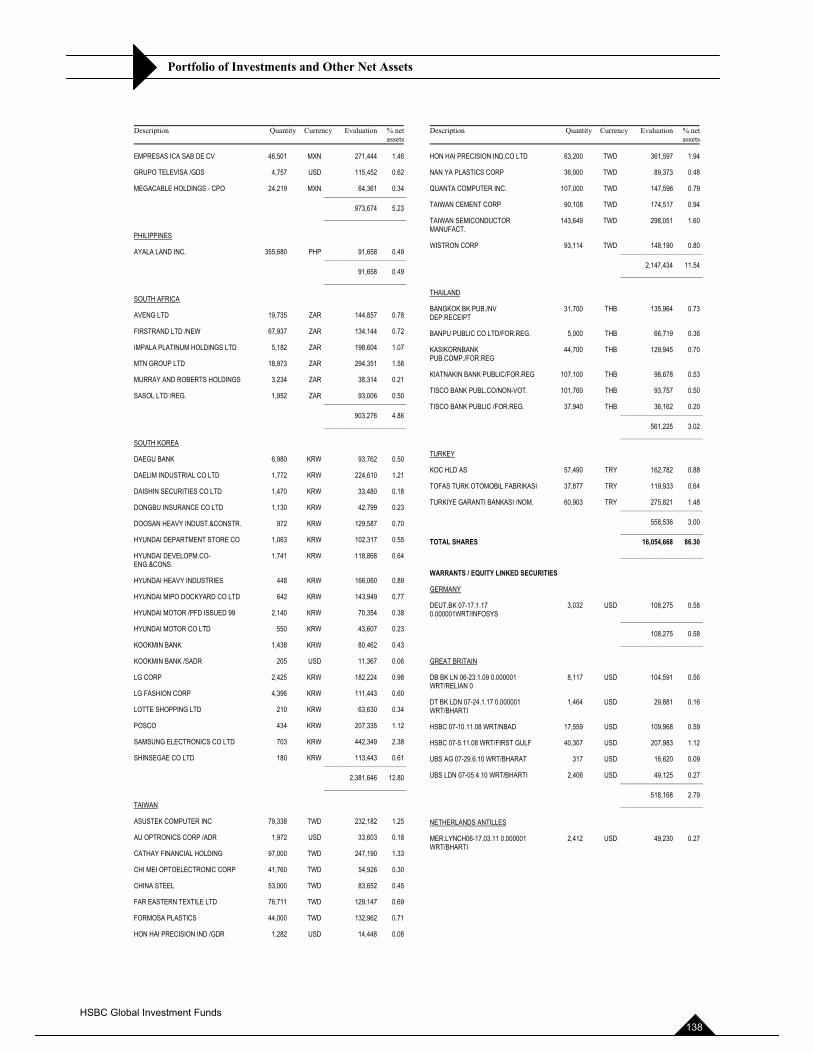
Portfolio of Investments and Other Net Assets
Description Quantity Currency Evaluation % netassets
EMPRESAS ICA SAB DE CV 46,501 MXN 271,444 1.46
GRUPO TELEVISA /GDS 4,757 USD 115,452 0.62
MEGACABLE HOLDINGS - CPO 24,219 MXN 64,361 0.34 ______________________
973,674 5.23 ______________________
PHILIPPINES
AYALA LAND INC. 355,680 PHP 91,658 0.49 ______________________
91,658 0.49 ______________________
SOUTH AFRICA
AVENG LTD 19,735 ZAR 144,857 0.78
FIRSTRAND LTD /NEW 67,937 ZAR 134,144 0.72
IMPALA PLATINUM HOLDINGS LTD 5,182 ZAR 198,604 1.07
MTN GROUP LTD 18,973 ZAR 294,351 1.58
MURRAY AND ROBERTS HOLDINGS 3,234 ZAR 38,314 0.21
SASOL LTD /REG. 1,952 ZAR 93,006 0.50 ______________________
903,276 4.86 ______________________
SOUTH KOREA
DAEGU BANK 6,980 KRW 93,762 0.50
DAELIM INDUSTRIAL CO LTD 1,772 KRW 224,610 1.21
DAISHIN SECURITIES CO LTD 1,470 KRW 33,480 0.18
DONGBU INSURANCE CO LTD 1,130 KRW 42,799 0.23
DOOSAN HEAVY INDUST.&CONSTR. 972 KRW 129,587 0.70
HYUNDAI DEPARTMENT STORE CO 1,063 KRW 102,317 0.55
HYUNDAI DEVELOPM.CO-ENG.&CONS.
1,741 KRW 118,868 0.64
HYUNDAI HEAVY INDUSTRIES 448 KRW 166,060 0.89
HYUNDAI MIPO DOCKYARD CO LTD 642 KRW 143,949 0.77
HYUNDAI MOTOR /PFD ISSUED 99 2,140 KRW 70,354 0.38
HYUNDAI MOTOR CO LTD 550 KRW 43,607 0.23
KOOKMIN BANK 1,438 KRW 80,462 0.43
KOOKMIN BANK /SADR 205 USD 11,367 0.06
LG CORP 2,425 KRW 182,224 0.98
LG FASHION CORP 4,396 KRW 111,443 0.60
LOTTE SHOPPING LTD 210 KRW 63,630 0.34
POSCO 434 KRW 207,335 1.12
SAMSUNG ELECTRONICS CO LTD 703 KRW 442,349 2.38
SHINSEGAE CO LTD 180 KRW 113,443 0.61 ______________________
2,381,646 12.80 ______________________
TAIWAN
ASUSTEK COMPUTER INC 79,338 TWD 232,182 1.25
AU OPTRONICS CORP /ADR 1,972 USD 33,603 0.18
CATHAY FINANCIAL HOLDING 97,000 TWD 247,190 1.33
CHI MEI OPTOELECTRONIC CORP 41,760 TWD 54,926 0.30
CHINA STEEL 53,000 TWD 83,652 0.45
FAR EASTERN TEXTILE LTD 76,711 TWD 129,147 0.69
FORMOSA PLASTICS 44,000 TWD 132,962 0.71
HON HAI PRECISION IND /GDR 1,282 USD 14,448 0.08
Description Quantity Currency Evaluation % netassets
HON HAI PRECISION IND.CO LTD 63,200 TWD 361,597 1.94
NAN YA PLASTICS CORP 36,000 TWD 89,373 0.48
QUANTA COMPUTER INC. 107,000 TWD 147,596 0.79
TAIWAN CEMENT CORP 90,108 TWD 174,517 0.94
TAIWAN SEMICONDUCTOR MANUFACT.
143,649 TWD 298,051 1.60
WISTRON CORP 93,114 TWD 148,190 0.80 ______________________
2,147,434 11.54 ______________________
THAILAND
BANGKOK BK PUB./NV DEP.RECEIPT
31,700 THB 135,964 0.73
BANPU PUBLIC CO LTD/FOR.REG. 5,000 THB 66,719 0.36
KASIKORNBANK PUB.COMP./FOR.REG
44,700 THB 129,945 0.70
KIATNAKIN BANK PUBLIC/FOR.REG 107,100 THB 98,678 0.53
TISCO BANK PUBL.CO/NON-VOT. 101,760 THB 93,757 0.50
TISCO BANK PUBLIC /FOR.REG. 37,940 THB 36,162 0.20 ______________________
561,225 3.02 ______________________
TURKEY
KOC HLD AS 57,490 TRY 162,782 0.88
TOFAS TURK OTOMOBIL FABRIKASI 37,877 TRY 119,933 0.64
TURKIYE GARANTI BANKASI /NOM. 60,903 TRY 275,821 1.48 ______________________
558,536 3.00 ______________________ TOTAL SHARES 16,054,668 86.30 ______________________
WARRANTS / EQUITY LINKED SECURITIES
GERMANY
DEUT.BK 07-17.1.17 0.000001WRT/INFOSYS ______________________
3,032 USD 108,275 0.58
108,275 0.58 ______________________
GREAT BRITAIN
DB BK LN 06-23.1.09 0.000001 WRT/RELIAN 0
8,117 USD 104,591 0.56
DT BK LDN 07-24.1.17 0.000001 WRT/BHARTI
1,464 USD 29,881 0.16
HSBC 07-10.11.08 WRT/NBAD 17,559 USD 109,968 0.59
HSBC 07-5.11.08 WRT/FIRST GULF 40,307 USD 207,983 1.12
UBS AG 07-29.6.10 WRT/BHARAT 317 USD 16,620 0.09
UBS LDN 07-05.4.10 WRT/BHARTI 2,406 USD 49,125 0.27 ______________________
518,168 2.79 ______________________
NETHERLANDS ANTILLES
MER.LYNCH06-17.03.11 0.000001 WRT/BHARTI
2,412 USD 49,230 0.27
HSBC Global Investment Funds 138
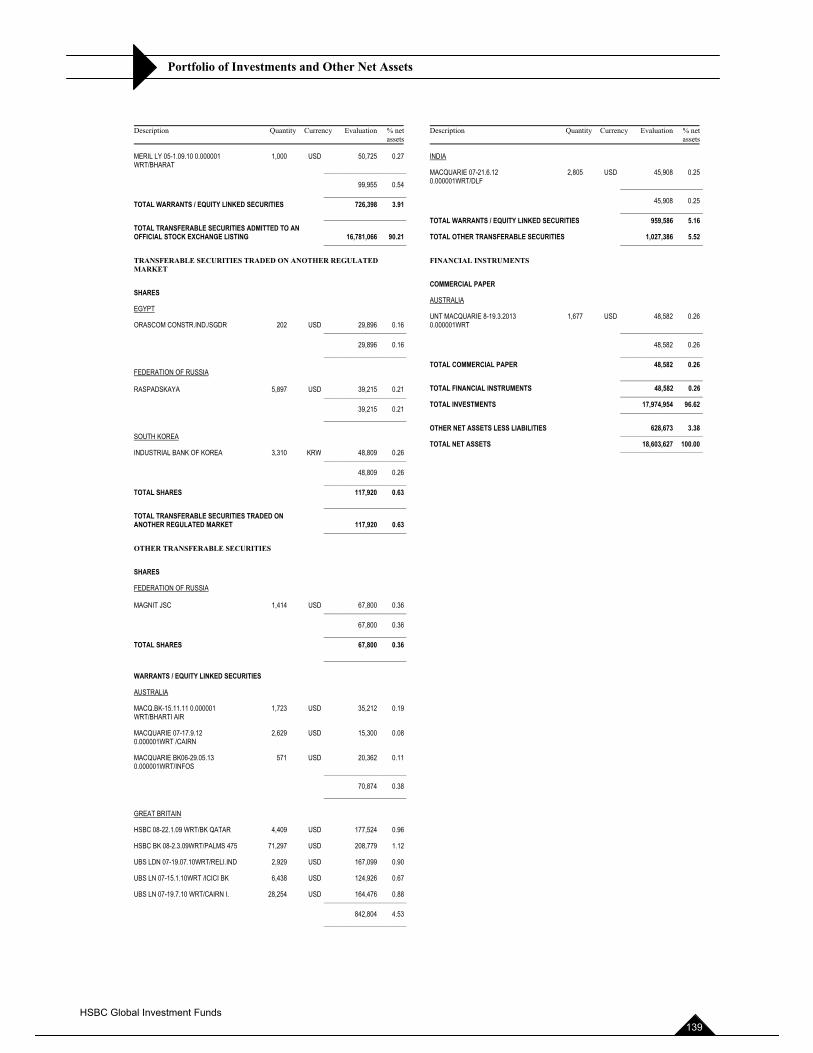
Portfolio of Investments and Other Net Assets
Description Quantity Currency Evaluation % netassets
MERIL LY 05-1.09.10 0.000001 WRT/BHARAT
1,000 USD 50,725 0.27
______________________
99,955 0.54 ______________________ TOTAL WARRANTS / EQUITY LINKED SECURITIES 726,398 3.91 ______________________ TOTAL TRANSFERABLE SECURITIES ADMITTED TO AN OFFICIAL STOCK EXCHANGE LISTING 16,781,066 90.21 ______________________
TRANSFERABLE SECURITIES TRADED ON ANOTHER REGULATED MARKET
SHARES
EGYPT
ORASCOM CONSTR.IND./SGDR 202 USD 29,896 0.16 ______________________
29,896 0.16 ______________________
FEDERATION OF RUSSIA
RASPADSKAYA 5,897 USD 39,215 0.21 ______________________
39,215 0.21 ______________________
SOUTH KOREA
INDUSTRIAL BANK OF KOREA 3,310 KRW 48,809 0.26 ______________________
48,809 0.26 ______________________ TOTAL SHARES 117,920 0.63 ______________________ TOTAL TRANSFERABLE SECURITIES TRADED ON ANOTHER REGULATED MARKET 117,920 0.63 ______________________
OTHER TRANSFERABLE SECURITIES
SHARES
FEDERATION OF RUSSIA
MAGNIT JSC 1,414 USD 67,800 0.36 ______________________
67,800 0.36 ______________________ TOTAL SHARES 67,800 0.36 ______________________
WARRANTS / EQUITY LINKED SECURITIES
AUSTRALIA
MACQ.BK-15.11.11 0.000001 WRT/BHARTI AIR
1,723 USD 35,212 0.19
MACQUARIE 07-17.9.12 0.000001WRT /CAIRN
2,629 USD 15,300 0.08
MACQUARIE BK06-29.05.13 0.000001WRT/INFOS ______________________
571 USD 20,362 0.11
70,874 0.38 ______________________
GREAT BRITAIN
HSBC 08-22.1.09 WRT/BK QATAR 4,409 USD 177,524 0.96
HSBC BK 08-2.3.09WRT/PALMS 475 71,297 USD 208,779 1.12
UBS LDN 07-19.07.10WRT/RELI.IND 2,929 USD 167,099 0.90
UBS LN 07-15.1.10WRT /ICICI BK 6,438 USD 124,926 0.67
UBS LN 07-19.7.10 WRT/CAIRN I. 28,254 USD 164,476 0.88 ______________________
842,804 4.53 ______________________
Description Quantity Currency Evaluation % netassets
INDIA
MACQUARIE 07-21.6.12 0.000001WRT/DLF ______________________
2,805 USD 45,908 0.25
45,908 0.25 ______________________ TOTAL WARRANTS / EQUITY LINKED SECURITIES 959,586 5.16
TOTAL OTHER TRANSFERABLE SECURITIES 1,027,386 5.52 ______________________
FINANCIAL INSTRUMENTS
COMMERCIAL PAPER
AUSTRALIA
UNT MACQUARIE 8-19.3.2013 0.000001WRT ______________________
1,677 USD 48,582 0.26
48,582 0.26 ______________________ TOTAL COMMERCIAL PAPER 48,582 0.26 ______________________ TOTAL FINANCIAL INSTRUMENTS 48,582 0.26 ______________________ TOTAL INVESTMENTS 17,974,954 96.62 ______________________
OTHER NET ASSETS LESS LIABILITIES 628,673 3.38 ______________________ TOTAL NET ASSETS 18,603,627 100.00 ______________________
HSBC Global Investment Funds 139
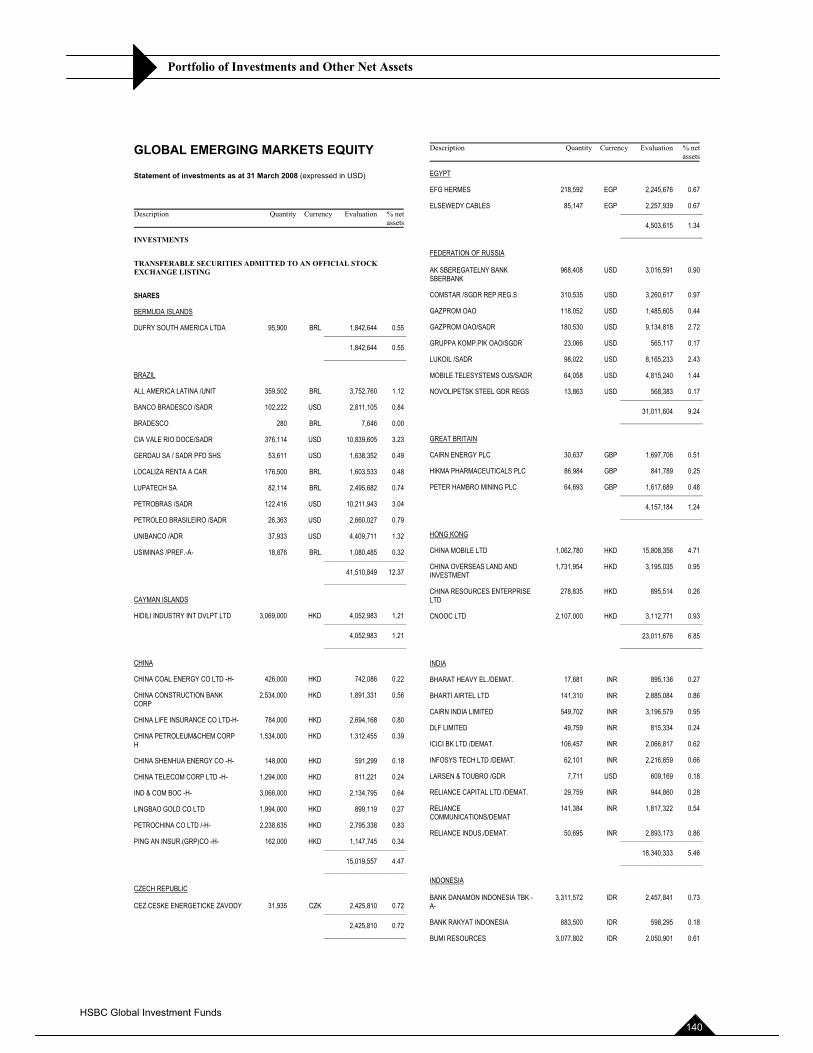
Portfolio of Investments and Other Net Assets
GLOBAL EMERGING MARKETS EQUITY
Statement of investments as at 31 March 2008 (expressed in USD)
Description Quantity Currency Evaluation % netassets
INVESTMENTS
TRANSFERABLE SECURITIES ADMITTED TO AN OFFICIAL STOCK EXCHANGE LISTING
SHARES
BERMUDA ISLANDS
DUFRY SOUTH AMERICA LTDA 95,900 BRL 1,842,644 0.55 ______________________
1,842,644 0.55 ______________________
BRAZIL
ALL AMERICA LATINA /UNIT 359,502 BRL 3,752,760 1.12
BANCO BRADESCO /SADR 102,222 USD 2,811,105 0.84
BRADESCO 280 BRL 7,646 0.00
CIA VALE RIO DOCE/SADR 376,114 USD 10,839,605 3.23
GERDAU SA / SADR PFD SHS 53,611 USD 1,638,352 0.49
LOCALIZA RENTA A CAR 176,500 BRL 1,603,533 0.48
LUPATECH SA 82,114 BRL 2,495,682 0.74
PETROBRAS /SADR 122,416 USD 10,211,943 3.04
PETROLEO BRASILEIRO /SADR 26,363 USD 2,660,027 0.79
UNIBANCO /ADR 37,933 USD 4,409,711 1.32
USIMINAS /PREF.-A- 18,876 BRL 1,080,485 0.32 ______________________
41,510,849 12.37 ______________________
CAYMAN ISLANDS
HIDILI INDUSTRY INT DVLPT LTD 3,069,000 HKD 4,052,983 1.21 ______________________
4,052,983 1.21 ______________________
CHINA
CHINA COAL ENERGY CO LTD -H- 426,000 HKD 742,086 0.22
CHINA CONSTRUCTION BANK CORP
2,534,000 HKD 1,891,331 0.56
CHINA LIFE INSURANCE CO LTD-H- 784,000 HKD 2,694,168 0.80
CHINA PETROLEUM&CHEM CORP H
1,534,000 HKD 1,312,455 0.39
CHINA SHENHUA ENERGY CO -H- 148,000 HKD 591,299 0.18
CHINA TELECOM CORP LTD -H- 1,294,000 HKD 811,221 0.24
IND & COM BOC -H- 3,066,000 HKD 2,134,795 0.64
LINGBAO GOLD CO LTD 1,994,000 HKD 899,119 0.27
PETROCHINA CO LTD /-H- 2,238,635 HKD 2,795,338 0.83
PING AN INSUR.(GRP)CO -H- 162,000 HKD 1,147,745 0.34 ______________________
15,019,557 4.47 ______________________
CZECH REPUBLIC
CEZ.CESKE ENERGETICKE ZAVODY 31,935 CZK 2,425,810 0.72 ______________________
2,425,810 0.72 ______________________
Description Quantity Currency Evaluation % netassets
EGYPT
EFG HERMES 218,592 EGP 2,245,676 0.67
ELSEWEDY CABLES 85,147 EGP 2,257,939 0.67 ______________________
4,503,615 1.34 ______________________
FEDERATION OF RUSSIA
AK SBEREGATELNY BANK SBERBANK
968,408 USD 3,016,591 0.90
COMSTAR /SGDR REP.REG.S 310,535 USD 3,260,617 0.97
GAZPROM OAO 118,052 USD 1,485,605 0.44
GAZPROM OAO/SADR 180,530 USD 9,134,818 2.72
GRUPPA KOMP.PIK OAO/SGDR 23,066 USD 565,117 0.17
LUKOIL /SADR 98,022 USD 8,165,233 2.43
MOBILE TELESYSTEMS OJS/SADR 64,058 USD 4,815,240 1.44
NOVOLIPETSK STEEL GDR REGS 13,863 USD 568,383 0.17 ______________________
31,011,604 9.24 ______________________
GREAT BRITAIN
CAIRN ENERGY PLC 30,637 GBP 1,697,706 0.51
HIKMA PHARMACEUTICALS PLC 86,984 GBP 841,789 0.25
PETER HAMBRO MINING PLC 64,693 GBP 1,617,689 0.48 ______________________
4,157,184 1.24 ______________________
HONG KONG
CHINA MOBILE LTD 1,062,780 HKD 15,808,356 4.71
CHINA OVERSEAS LAND AND INVESTMENT
1,731,954 HKD 3,195,035 0.95
CHINA RESOURCES ENTERPRISE LTD
278,835 HKD 895,514 0.26
CNOOC LTD 2,107,000 HKD 3,112,771 0.93 ______________________
23,011,676 6.85 ______________________
INDIA
BHARAT HEAVY EL./DEMAT. 17,681 INR 895,136 0.27
BHARTI AIRTEL LTD 141,310 INR 2,885,084 0.86
CAIRN INDIA LIMITED 549,702 INR 3,196,579 0.95
DLF LIMITED 49,759 INR 815,334 0.24
ICICI BK LTD /DEMAT. 106,457 INR 2,066,817 0.62
INFOSYS TECH LTD /DEMAT. 62,101 INR 2,216,859 0.66
LARSEN & TOUBRO /GDR 7,711 USD 609,169 0.18
RELIANCE CAPITAL LTD /DEMAT. 29,759 INR 944,860 0.28
RELIANCE COMMUNICATIONS/DEMAT
141,384 INR 1,817,322 0.54
RELIANCE INDUS./DEMAT. 50,695 INR 2,893,173 0.86 ______________________
18,340,333 5.46 ______________________
INDONESIA
BANK DANAMON INDONESIA TBK -A-
3,311,572 IDR 2,457,841 0.73
BANK RAKYAT INDONESIA 883,500 IDR 598,295 0.18
BUMI RESOURCES 3,077,802 IDR 2,050,901 0.61
HSBC Global Investment Funds 140
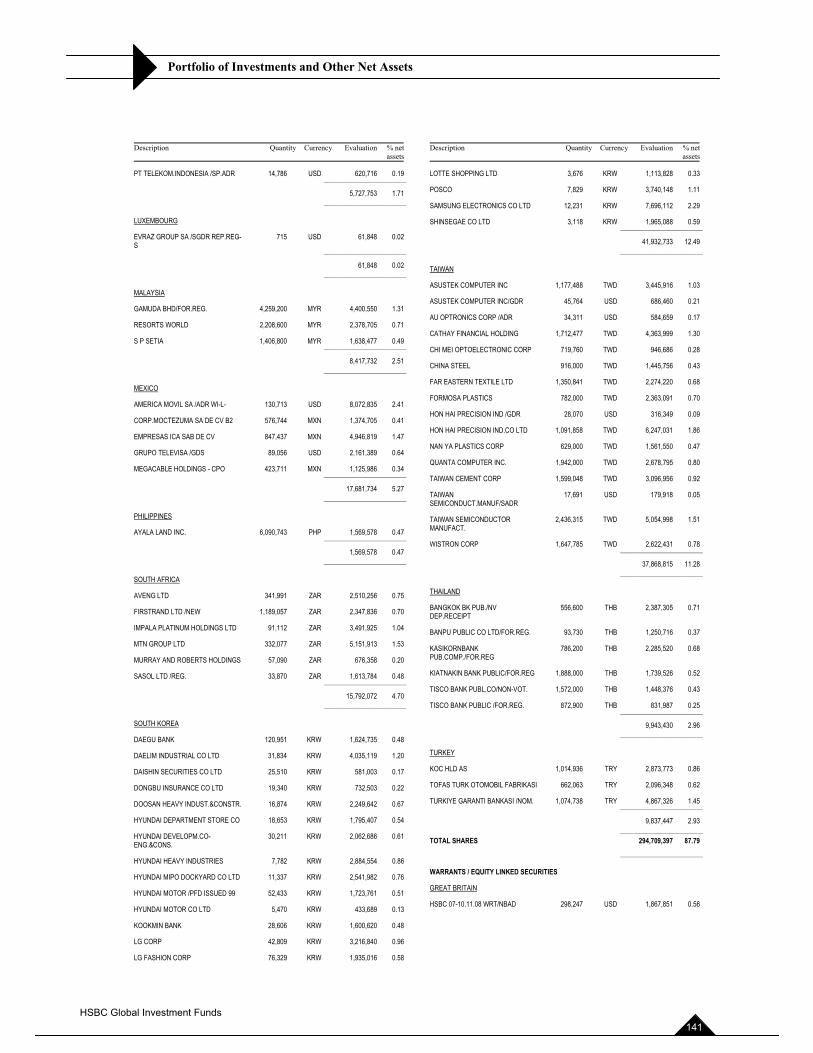
Portfolio of Investments and Other Net Assets
Description Quantity Currency Evaluation % netassets
PT TELEKOM.INDONESIA /SP.ADR 14,786 USD 620,716 0.19 ______________________
5,727,753 1.71 ______________________
LUXEMBOURG
EVRAZ GROUP SA /SGDR REP.REG-S ______________________
715 USD 61,848 0.02
61,848 0.02 ______________________
MALAYSIA
GAMUDA BHD/FOR.REG. 4,259,200 MYR 4,400,550 1.31
RESORTS WORLD 2,208,600 MYR 2,378,705 0.71
S P SETIA 1,406,800 MYR 1,638,477 0.49 ______________________
8,417,732 2.51 ______________________
MEXICO
AMERICA MOVIL SA /ADR WI-L- 130,713 USD 8,072,835 2.41
CORP.MOCTEZUMA SA DE CV B2 576,744 MXN 1,374,705 0.41
EMPRESAS ICA SAB DE CV 847,437 MXN 4,946,819 1.47
GRUPO TELEVISA /GDS 89,056 USD 2,161,389 0.64
MEGACABLE HOLDINGS - CPO 423,711 MXN 1,125,986 0.34 ______________________
17,681,734 5.27 ______________________
PHILIPPINES
AYALA LAND INC. 6,090,743 PHP 1,569,578 0.47 ______________________
1,569,578 0.47 ______________________
SOUTH AFRICA
AVENG LTD 341,991 ZAR 2,510,256 0.75
FIRSTRAND LTD /NEW 1,189,057 ZAR 2,347,836 0.70
IMPALA PLATINUM HOLDINGS LTD 91,112 ZAR 3,491,925 1.04
MTN GROUP LTD 332,077 ZAR 5,151,913 1.53
MURRAY AND ROBERTS HOLDINGS 57,090 ZAR 676,358 0.20
SASOL LTD /REG. 33,870 ZAR 1,613,784 0.48 ______________________
15,792,072 4.70 ______________________
SOUTH KOREA
DAEGU BANK 120,951 KRW 1,624,735 0.48
DAELIM INDUSTRIAL CO LTD 31,834 KRW 4,035,119 1.20
DAISHIN SECURITIES CO LTD 25,510 KRW 581,003 0.17
DONGBU INSURANCE CO LTD 19,340 KRW 732,503 0.22
DOOSAN HEAVY INDUST.&CONSTR. 16,874 KRW 2,249,642 0.67
HYUNDAI DEPARTMENT STORE CO 18,653 KRW 1,795,407 0.54
HYUNDAI DEVELOPM.CO-ENG.&CONS.
30,211 KRW 2,062,686 0.61
HYUNDAI HEAVY INDUSTRIES 7,782 KRW 2,884,554 0.86
HYUNDAI MIPO DOCKYARD CO LTD 11,337 KRW 2,541,982 0.76
HYUNDAI MOTOR /PFD ISSUED 99 52,433 KRW 1,723,761 0.51
HYUNDAI MOTOR CO LTD 5,470 KRW 433,689 0.13
KOOKMIN BANK 28,606 KRW 1,600,620 0.48
LG CORP 42,809 KRW 3,216,840 0.96
LG FASHION CORP 76,329 KRW 1,935,016 0.58
Description Quantity Currency Evaluation % netassets
LOTTE SHOPPING LTD 3,676 KRW 1,113,828 0.33
POSCO 7,829 KRW 3,740,148 1.11
SAMSUNG ELECTRONICS CO LTD 12,231 KRW 7,696,112 2.29
SHINSEGAE CO LTD 3,118 KRW 1,965,088 0.59 ______________________
41,932,733 12.49 ______________________
TAIWAN
ASUSTEK COMPUTER INC 1,177,488 TWD 3,445,916 1.03
ASUSTEK COMPUTER INC/GDR 45,764 USD 686,460 0.21
AU OPTRONICS CORP /ADR 34,311 USD 584,659 0.17
CATHAY FINANCIAL HOLDING 1,712,477 TWD 4,363,999 1.30
CHI MEI OPTOELECTRONIC CORP 719,760 TWD 946,686 0.28
CHINA STEEL 916,000 TWD 1,445,756 0.43
FAR EASTERN TEXTILE LTD 1,350,841 TWD 2,274,220 0.68
FORMOSA PLASTICS 782,000 TWD 2,363,091 0.70
HON HAI PRECISION IND /GDR 28,070 USD 316,349 0.09
HON HAI PRECISION IND.CO LTD 1,091,858 TWD 6,247,031 1.86
NAN YA PLASTICS CORP 629,000 TWD 1,561,550 0.47
QUANTA COMPUTER INC. 1,942,000 TWD 2,678,795 0.80
TAIWAN CEMENT CORP 1,599,048 TWD 3,096,956 0.92
TAIWANSEMICONDUCT.MANUF/SADR
17,691 USD 179,918 0.05
TAIWAN SEMICONDUCTOR MANUFACT.
2,436,315 TWD 5,054,998 1.51
WISTRON CORP 1,647,785 TWD 2,622,431 0.78 ______________________
37,868,815 11.28 ______________________
THAILAND
BANGKOK BK PUB./NV DEP.RECEIPT
556,600 THB 2,387,305 0.71
BANPU PUBLIC CO LTD/FOR.REG. 93,730 THB 1,250,716 0.37
KASIKORNBANK PUB.COMP./FOR.REG
786,200 THB 2,285,520 0.68
KIATNAKIN BANK PUBLIC/FOR.REG 1,888,000 THB 1,739,526 0.52
TISCO BANK PUBL.CO/NON-VOT. 1,572,000 THB 1,448,376 0.43
TISCO BANK PUBLIC /FOR.REG. 872,900 THB 831,987 0.25 ______________________
9,943,430 2.96 ______________________
TURKEY
KOC HLD AS 1,014,936 TRY 2,873,773 0.86
TOFAS TURK OTOMOBIL FABRIKASI 662,063 TRY 2,096,348 0.62
TURKIYE GARANTI BANKASI /NOM. 1,074,738 TRY 4,867,326 1.45 ______________________
9,837,447 2.93 ______________________ TOTAL SHARES 294,709,397 87.79 ______________________
WARRANTS / EQUITY LINKED SECURITIES
GREAT BRITAIN
HSBC 07-10.11.08 WRT/NBAD 298,247 USD 1,867,851 0.56
HSBC Global Investment Funds 141
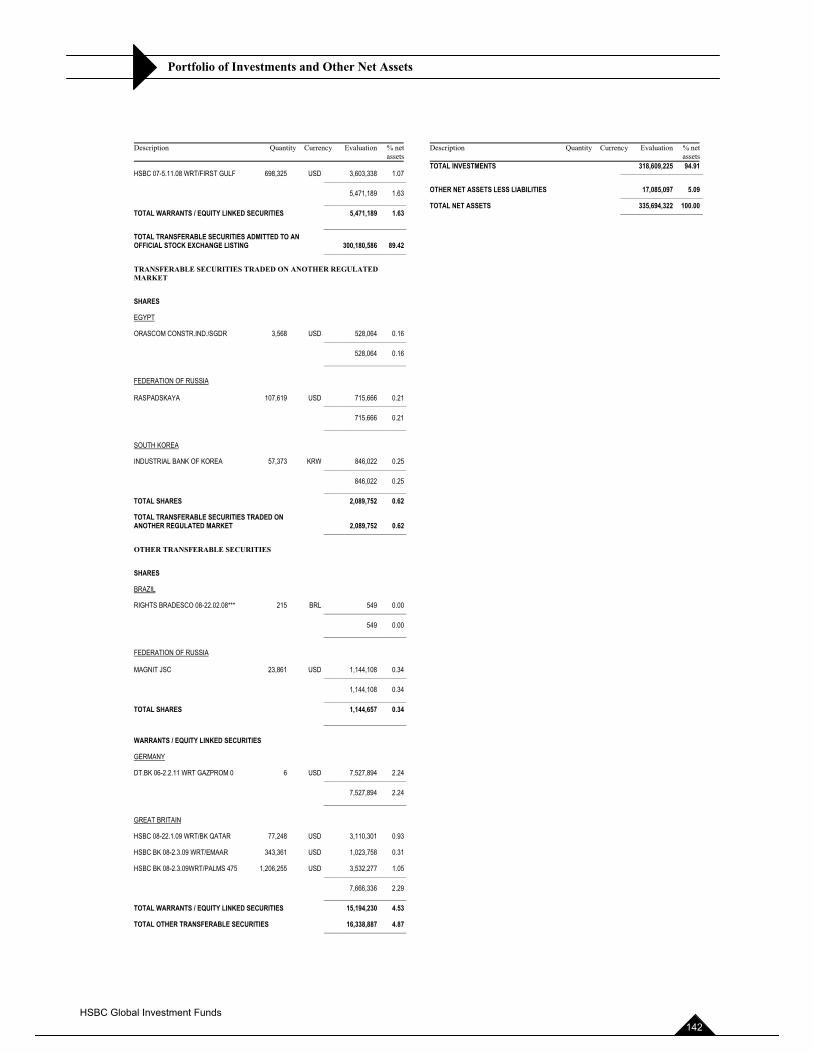
Portfolio of Investments and Other Net Assets
Description Quantity Currency Evaluation % netassets
HSBC 07-5.11.08 WRT/FIRST GULF 698,325 USD 3,603,338 1.07 ______________________
5,471,189 1.63 ______________________ TOTAL WARRANTS / EQUITY LINKED SECURITIES 5,471,189 1.63 ______________________ TOTAL TRANSFERABLE SECURITIES ADMITTED TO AN OFFICIAL STOCK EXCHANGE LISTING 300,180,586 89.42 ______________________
TRANSFERABLE SECURITIES TRADED ON ANOTHER REGULATED MARKET
SHARES
EGYPT
ORASCOM CONSTR.IND./SGDR 3,568 USD 528,064 0.16 ______________________
528,064 0.16 ______________________
FEDERATION OF RUSSIA
RASPADSKAYA 107,619 USD 715,666 0.21 ______________________
715,666 0.21 ______________________
SOUTH KOREA
INDUSTRIAL BANK OF KOREA 57,373 KRW 846,022 0.25 ______________________
846,022 0.25 ______________________ TOTAL SHARES 2,089,752 0.62
TOTAL TRANSFERABLE SECURITIES TRADED ON ANOTHER REGULATED MARKET 2,089,752 0.62 ______________________
OTHER TRANSFERABLE SECURITIES
SHARES
BRAZIL
RIGHTS BRADESCO 08-22.02.08*** 215 BRL 549 0.00 ______________________
549 0.00 ______________________
FEDERATION OF RUSSIA
MAGNIT JSC 23,861 USD 1,144,108 0.34 ______________________
1,144,108 0.34 ______________________ TOTAL SHARES 1,144,657 0.34 ______________________
WARRANTS / EQUITY LINKED SECURITIES
GERMANY
DT.BK 06-2.2.11 WRT GAZPROM 0 6 USD 7,527,894 2.24 ______________________
7,527,894 2.24 ______________________
GREAT BRITAIN
HSBC 08-22.1.09 WRT/BK QATAR 77,248 USD 3,110,301 0.93
HSBC BK 08-2.3.09 WRT/EMAAR 343,361 USD 1,023,758 0.31
HSBC BK 08-2.3.09WRT/PALMS 475 1,206,255 USD 3,532,277 1.05 ______________________
7,666,336 2.29 ______________________ TOTAL WARRANTS / EQUITY LINKED SECURITIES 15,194,230 4.53
TOTAL OTHER TRANSFERABLE SECURITIES 16,338,887 4.87 ______________________
Description Quantity Currency Evaluation % netassets
TOTAL INVESTMENTS 318,609,225 94.91 ______________________
OTHER NET ASSETS LESS LIABILITIES 17,085,097 5.09 ______________________ TOTAL NET ASSETS 335,694,322 100.00 ______________________
HSBC Global Investment Funds 142
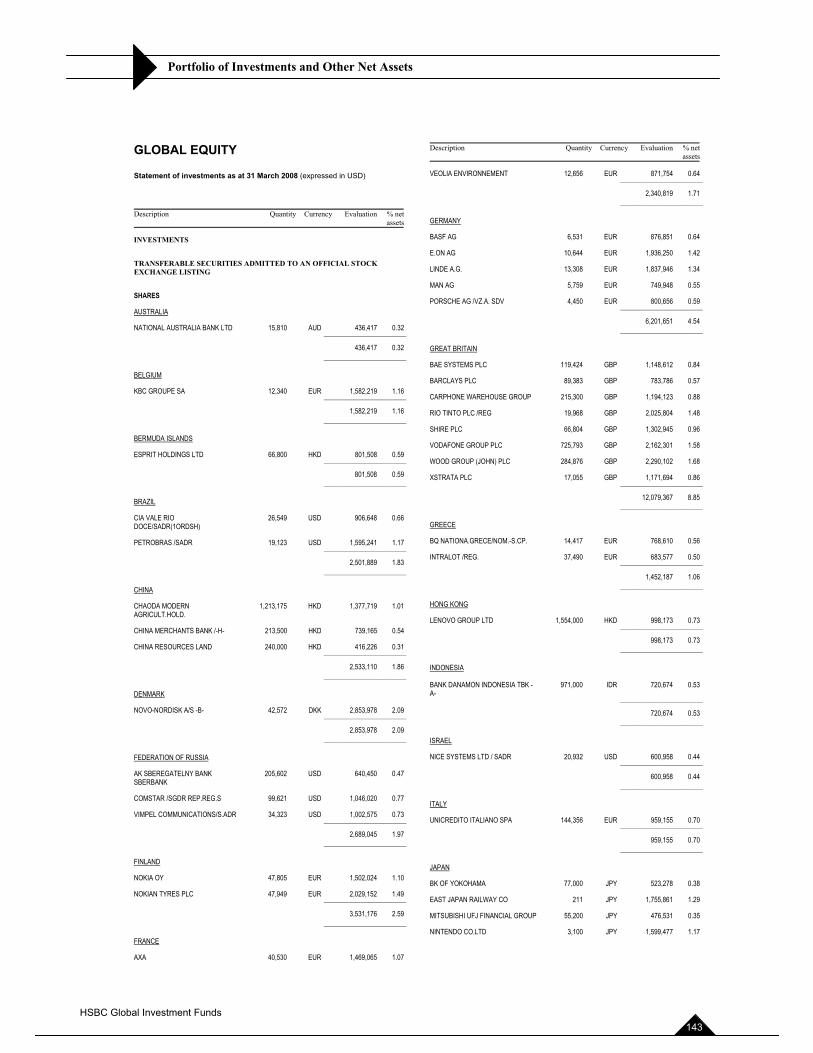
Portfolio of Investments and Other Net Assets
GLOBAL EQUITY
Statement of investments as at 31 March 2008 (expressed in USD)
Description Quantity Currency Evaluation % netassets
INVESTMENTS
TRANSFERABLE SECURITIES ADMITTED TO AN OFFICIAL STOCK EXCHANGE LISTING
SHARES
AUSTRALIA
NATIONAL AUSTRALIA BANK LTD 15,810 AUD 436,417 0.32 ______________________
436,417 0.32 ______________________
BELGIUM
KBC GROUPE SA 12,340 EUR 1,582,219 1.16 ______________________
1,582,219 1.16 ______________________
BERMUDA ISLANDS
ESPRIT HOLDINGS LTD 66,800 HKD 801,508 0.59 ______________________
801,508 0.59 ______________________
BRAZIL
CIA VALE RIO DOCE/SADR(1ORDSH)
26,549 USD 906,648 0.66
PETROBRAS /SADR 19,123 USD 1,595,241 1.17 ______________________
2,501,889 1.83 ______________________
CHINA
CHAODA MODERN AGRICULT.HOLD.
1,213,175 HKD 1,377,719 1.01
CHINA MERCHANTS BANK /-H- 213,500 HKD 739,165 0.54
CHINA RESOURCES LAND 240,000 HKD 416,226 0.31 ______________________
2,533,110 1.86 ______________________
DENMARK
NOVO-NORDISK A/S -B- 42,572 DKK 2,853,978 2.09 ______________________
2,853,978 2.09 ______________________
FEDERATION OF RUSSIA
AK SBEREGATELNY BANK SBERBANK
205,602 USD 640,450 0.47
COMSTAR /SGDR REP.REG.S 99,621 USD 1,046,020 0.77
VIMPEL COMMUNICATIONS/S.ADR 34,323 USD 1,002,575 0.73 ______________________
2,689,045 1.97 ______________________
FINLAND
NOKIA OY 47,805 EUR 1,502,024 1.10
NOKIAN TYRES PLC 47,949 EUR 2,029,152 1.49 ______________________
3,531,176 2.59 ______________________
FRANCE
AXA 40,530 EUR 1,469,065 1.07
Description Quantity Currency Evaluation % netassets
VEOLIA ENVIRONNEMENT 12,656 EUR 871,754 0.64 ______________________
2,340,819 1.71 ______________________
GERMANY
BASF AG 6,531 EUR 876,851 0.64
E.ON AG 10,644 EUR 1,936,250 1.42
LINDE A.G. 13,308 EUR 1,837,946 1.34
MAN AG 5,759 EUR 749,948 0.55
PORSCHE AG /VZ.A. SDV 4,450 EUR 800,656 0.59 ______________________
6,201,651 4.54 ______________________
GREAT BRITAIN
BAE SYSTEMS PLC 119,424 GBP 1,148,612 0.84
BARCLAYS PLC 89,383 GBP 783,786 0.57
CARPHONE WAREHOUSE GROUP 215,300 GBP 1,194,123 0.88
RIO TINTO PLC /REG 19,968 GBP 2,025,804 1.48
SHIRE PLC 66,804 GBP 1,302,945 0.96
VODAFONE GROUP PLC 725,793 GBP 2,162,301 1.58
WOOD GROUP (JOHN) PLC 284,876 GBP 2,290,102 1.68
XSTRATA PLC 17,055 GBP 1,171,694 0.86 ______________________
12,079,367 8.85 ______________________
GREECE
BQ NATIONA.GRECE/NOM.-S.CP. 14,417 EUR 768,610 0.56
INTRALOT /REG. 37,490 EUR 683,577 0.50 ______________________
1,452,187 1.06 ______________________
HONG KONG
LENOVO GROUP LTD 1,554,000 HKD 998,173 0.73 ______________________
998,173 0.73 ______________________
INDONESIA
BANK DANAMON INDONESIA TBK -A- ______________________
971,000 IDR 720,674 0.53
720,674 0.53 ______________________
ISRAEL
NICE SYSTEMS LTD / SADR 20,932 USD 600,958 0.44 ______________________
600,958 0.44 ______________________
ITALY
UNICREDITO ITALIANO SPA 144,356 EUR 959,155 0.70 ______________________
959,155 0.70 ______________________
JAPAN
BK OF YOKOHAMA 77,000 JPY 523,278 0.38
EAST JAPAN RAILWAY CO 211 JPY 1,755,861 1.29
MITSUBISHI UFJ FINANCIAL GROUP 55,200 JPY 476,531 0.35
NINTENDO CO.LTD 3,100 JPY 1,599,477 1.17
HSBC Global Investment Funds 143
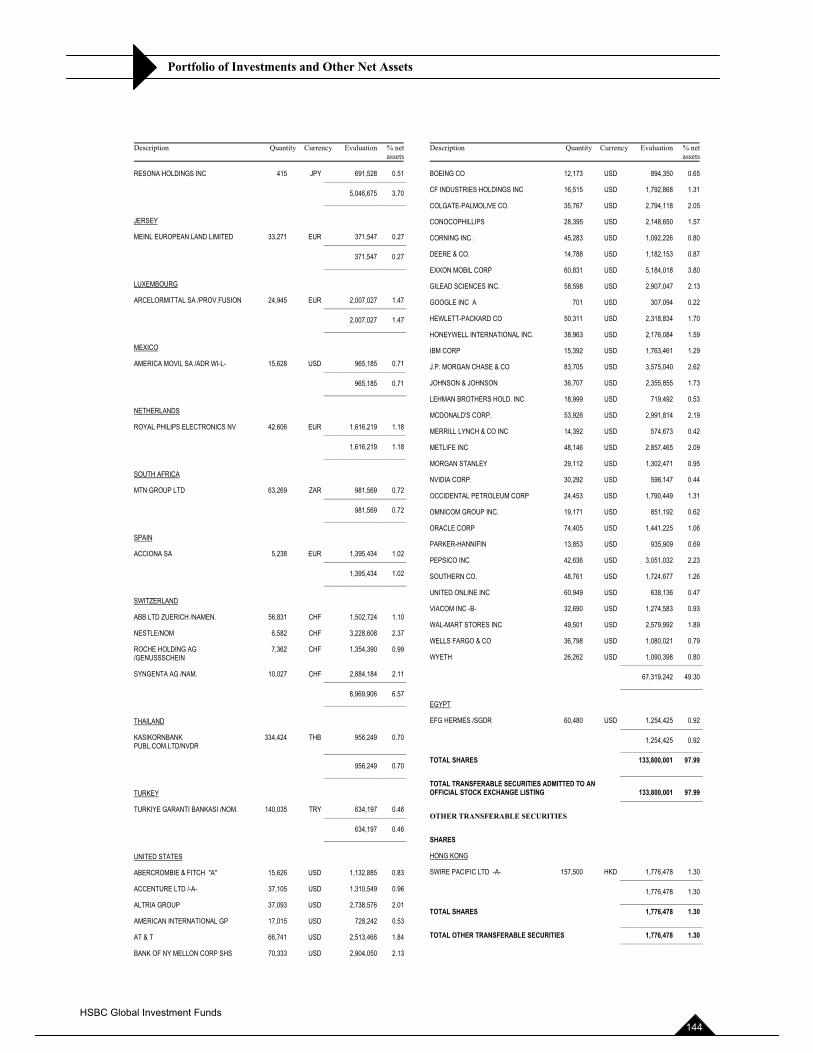
Portfolio of Investments and Other Net Assets
Description Quantity Currency Evaluation % netassets
RESONA HOLDINGS INC 415 JPY 691,528 0.51 ______________________
5,046,675 3.70 ______________________
JERSEY
MEINL EUROPEAN LAND LIMITED 33,271 EUR 371,547 0.27 ______________________
371,547 0.27 ______________________
LUXEMBOURG
ARCELORMITTAL SA /PROV.FUSION 24,945 EUR 2,007,027 1.47 ______________________
2,007,027 1.47 ______________________
MEXICO
AMERICA MOVIL SA /ADR WI-L- 15,628 USD 965,185 0.71 ______________________
965,185 0.71 ______________________
NETHERLANDS
ROYAL PHILIPS ELECTRONICS NV 42,606 EUR 1,616,219 1.18 ______________________
1,616,219 1.18 ______________________
SOUTH AFRICA
MTN GROUP LTD 63,269 ZAR 981,569 0.72 ______________________
981,569 0.72 ______________________
SPAIN
ACCIONA SA 5,238 EUR 1,395,434 1.02 ______________________
1,395,434 1.02 ______________________
SWITZERLAND
ABB LTD ZUERICH /NAMEN. 56,831 CHF 1,502,724 1.10
NESTLE/NOM 6,582 CHF 3,228,608 2.37
ROCHE HOLDING AG /GENUSSSCHEIN
7,362 CHF 1,354,390 0.99
SYNGENTA AG /NAM. 10,027 CHF 2,884,184 2.11 ______________________
8,969,906 6.57 ______________________
THAILAND
KASIKORNBANK PUBL.COM.LTD/NVDR ______________________
334,424 THB 956,249 0.70
956,249 0.70 ______________________
TURKEY
TURKIYE GARANTI BANKASI /NOM. 140,035 TRY 634,197 0.46 ______________________
634,197 0.46 ______________________
UNITED STATES
ABERCROMBIE & FITCH "A" 15,626 USD 1,132,885 0.83
ACCENTURE LTD /-A- 37,105 USD 1,310,549 0.96
ALTRIA GROUP 37,093 USD 2,738,576 2.01
AMERICAN INTERNATIONAL GP 17,015 USD 728,242 0.53
AT & T 66,741 USD 2,513,466 1.84
BANK OF NY MELLON CORP SHS 70,333 USD 2,904,050 2.13
Description Quantity Currency Evaluation % netassets
BOEING CO 12,173 USD 894,350 0.65
CF INDUSTRIES HOLDINGS INC 16,515 USD 1,792,868 1.31
COLGATE-PALMOLIVE CO. 35,767 USD 2,794,118 2.05
CONOCOPHILLIPS 28,395 USD 2,148,650 1.57
CORNING INC. 45,283 USD 1,092,226 0.80
DEERE & CO. 14,788 USD 1,182,153 0.87
EXXON MOBIL CORP 60,831 USD 5,184,018 3.80
GILEAD SCIENCES INC. 58,598 USD 2,907,047 2.13
GOOGLE INC A 701 USD 307,094 0.22
HEWLETT-PACKARD CO 50,311 USD 2,318,834 1.70
HONEYWELL INTERNATIONAL INC. 38,963 USD 2,176,084 1.59
IBM CORP 15,392 USD 1,763,461 1.29
J.P. MORGAN CHASE & CO 83,705 USD 3,575,040 2.62
JOHNSON & JOHNSON 36,707 USD 2,355,855 1.73
LEHMAN BROTHERS HOLD. INC 18,999 USD 719,492 0.53
MCDONALD'S CORP. 53,926 USD 2,991,814 2.19
MERRILL LYNCH & CO INC 14,392 USD 574,673 0.42
METLIFE INC 48,146 USD 2,857,465 2.09
MORGAN STANLEY 29,112 USD 1,302,471 0.95
NVIDIA CORP. 30,292 USD 596,147 0.44
OCCIDENTAL PETROLEUM CORP 24,453 USD 1,790,449 1.31
OMNICOM GROUP INC. 19,171 USD 851,192 0.62
ORACLE CORP 74,405 USD 1,441,225 1.06
PARKER-HANNIFIN 13,853 USD 935,909 0.69
PEPSICO INC 42,636 USD 3,051,032 2.23
SOUTHERN CO. 48,761 USD 1,724,677 1.26
UNITED ONLINE INC 60,949 USD 638,136 0.47
VIACOM INC -B- 32,690 USD 1,274,583 0.93
WAL-MART STORES INC 49,501 USD 2,579,992 1.89
WELLS FARGO & CO 36,798 USD 1,080,021 0.79
WYETH 26,262 USD 1,090,398 0.80 ______________________
67,319,242 49.30 ______________________
EGYPT
EFG HERMES /SGDR 60,480 USD 1,254,425 0.92 ______________________
1,254,425 0.92 ______________________ TOTAL SHARES 133,800,001 97.99 ______________________ TOTAL TRANSFERABLE SECURITIES ADMITTED TO AN OFFICIAL STOCK EXCHANGE LISTING 133,800,001 97.99 ______________________
OTHER TRANSFERABLE SECURITIES
SHARES
HONG KONG
SWIRE PACIFIC LTD -A- 157,500 HKD 1,776,478 1.30 ______________________
1,776,478 1.30 ______________________ TOTAL SHARES 1,776,478 1.30 ______________________ TOTAL OTHER TRANSFERABLE SECURITIES 1,776,478 1.30 ______________________
HSBC Global Investment Funds 144

Portfolio of Investments and Other Net Assets
Description Quantity Currency Evaluation % netassets
TOTAL INVESTMENTS 135,576,479 99.29 ______________________
OTHER NET ASSETS LESS LIABILITIES 963,293 0.71 ______________________ TOTAL NET ASSETS 136,539,772 100.00 ______________________
HSBC Global Investment Funds 145
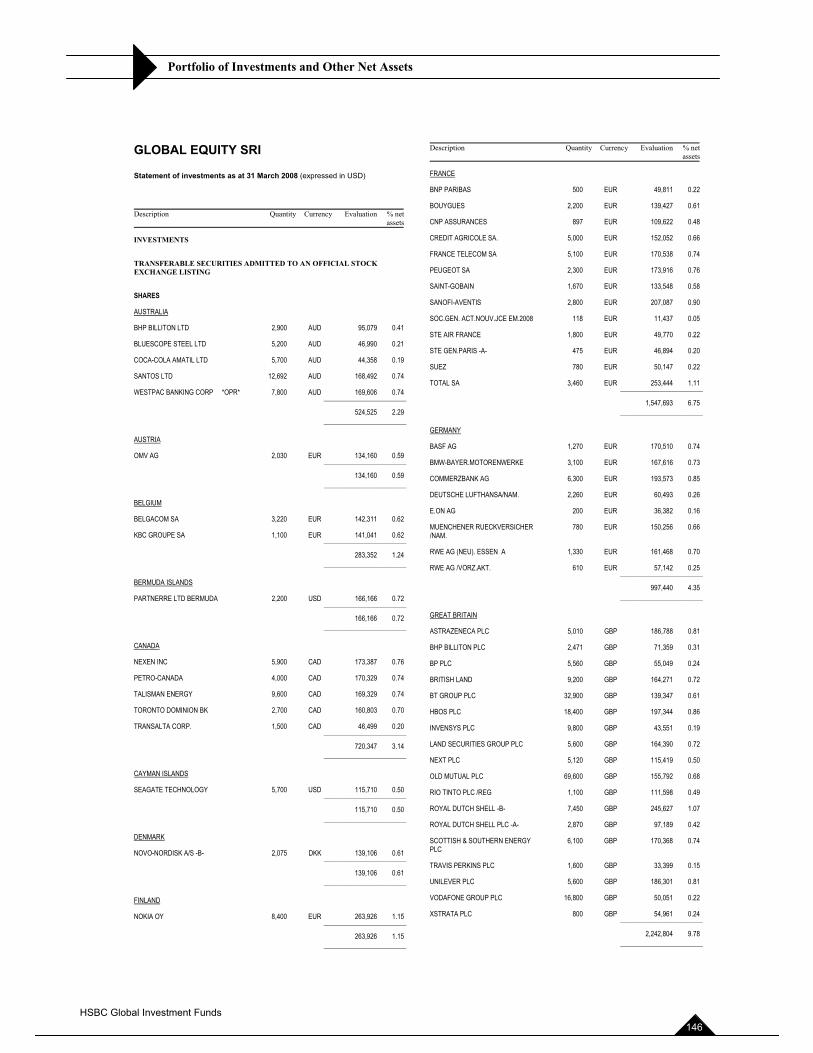
Portfolio of Investments and Other Net Assets
GLOBAL EQUITY SRI
Statement of investments as at 31 March 2008 (expressed in USD)
Description Quantity Currency Evaluation % netassets
INVESTMENTS
TRANSFERABLE SECURITIES ADMITTED TO AN OFFICIAL STOCK EXCHANGE LISTING
SHARES
AUSTRALIA
BHP BILLITON LTD 2,900 AUD 95,079 0.41
BLUESCOPE STEEL LTD 5,200 AUD 46,990 0.21
COCA-COLA AMATIL LTD 5,700 AUD 44,358 0.19
SANTOS LTD 12,692 AUD 168,492 0.74
WESTPAC BANKING CORP *OPR* 7,800 AUD 169,606 0.74 ______________________
524,525 2.29 ______________________
AUSTRIA
OMV AG 2,030 EUR 134,160 0.59 ______________________
134,160 0.59 ______________________
BELGIUM
BELGACOM SA 3,220 EUR 142,311 0.62
KBC GROUPE SA 1,100 EUR 141,041 0.62 ______________________
283,352 1.24 ______________________
BERMUDA ISLANDS
PARTNERRE LTD BERMUDA 2,200 USD 166,166 0.72 ______________________
166,166 0.72 ______________________
CANADA
NEXEN INC 5,900 CAD 173,387 0.76
PETRO-CANADA 4,000 CAD 170,329 0.74
TALISMAN ENERGY 9,600 CAD 169,329 0.74
TORONTO DOMINION BK 2,700 CAD 160,803 0.70
TRANSALTA CORP. 1,500 CAD 46,499 0.20 ______________________
720,347 3.14 ______________________
CAYMAN ISLANDS
SEAGATE TECHNOLOGY 5,700 USD 115,710 0.50 ______________________
115,710 0.50 ______________________
DENMARK
NOVO-NORDISK A/S -B- 2,075 DKK 139,106 0.61 ______________________
139,106 0.61 ______________________
FINLAND
NOKIA OY 8,400 EUR 263,926 1.15 ______________________
263,926 1.15 ______________________
Description Quantity Currency Evaluation % netassets
FRANCE
BNP PARIBAS 500 EUR 49,811 0.22
BOUYGUES 2,200 EUR 139,427 0.61
CNP ASSURANCES 897 EUR 109,622 0.48
CREDIT AGRICOLE SA. 5,000 EUR 152,052 0.66
FRANCE TELECOM SA 5,100 EUR 170,538 0.74
PEUGEOT SA 2,300 EUR 173,916 0.76
SAINT-GOBAIN 1,670 EUR 133,548 0.58
SANOFI-AVENTIS 2,800 EUR 207,087 0.90
SOC.GEN. ACT.NOUV.JCE EM.2008 118 EUR 11,437 0.05
STE AIR FRANCE 1,800 EUR 49,770 0.22
STE GEN.PARIS -A- 475 EUR 46,894 0.20
SUEZ 780 EUR 50,147 0.22
TOTAL SA 3,460 EUR 253,444 1.11 ______________________
1,547,693 6.75 ______________________
GERMANY
BASF AG 1,270 EUR 170,510 0.74
BMW-BAYER.MOTORENWERKE 3,100 EUR 167,616 0.73
COMMERZBANK AG 6,300 EUR 193,573 0.85
DEUTSCHE LUFTHANSA/NAM. 2,260 EUR 60,493 0.26
E.ON AG 200 EUR 36,382 0.16
MUENCHENER RUECKVERSICHER /NAM.
780 EUR 150,256 0.66
RWE AG (NEU). ESSEN A 1,330 EUR 161,468 0.70
RWE AG /VORZ.AKT. 610 EUR 57,142 0.25 ______________________
997,440 4.35 ______________________
GREAT BRITAIN
ASTRAZENECA PLC 5,010 GBP 186,788 0.81
BHP BILLITON PLC 2,471 GBP 71,359 0.31
BP PLC 5,560 GBP 55,049 0.24
BRITISH LAND 9,200 GBP 164,271 0.72
BT GROUP PLC 32,900 GBP 139,347 0.61
HBOS PLC 18,400 GBP 197,344 0.86
INVENSYS PLC 9,800 GBP 43,551 0.19
LAND SECURITIES GROUP PLC 5,600 GBP 164,390 0.72
NEXT PLC 5,120 GBP 115,419 0.50
OLD MUTUAL PLC 69,600 GBP 155,792 0.68
RIO TINTO PLC /REG 1,100 GBP 111,598 0.49
ROYAL DUTCH SHELL -B- 7,450 GBP 245,627 1.07
ROYAL DUTCH SHELL PLC -A- 2,870 GBP 97,189 0.42
SCOTTISH & SOUTHERN ENERGY PLC
6,100 GBP 170,368 0.74
TRAVIS PERKINS PLC 1,600 GBP 33,399 0.15
UNILEVER PLC 5,600 GBP 186,301 0.81
VODAFONE GROUP PLC 16,800 GBP 50,051 0.22
XSTRATA PLC 800 GBP 54,961 0.24 ______________________
2,242,804 9.78 ______________________
HSBC Global Investment Funds 146
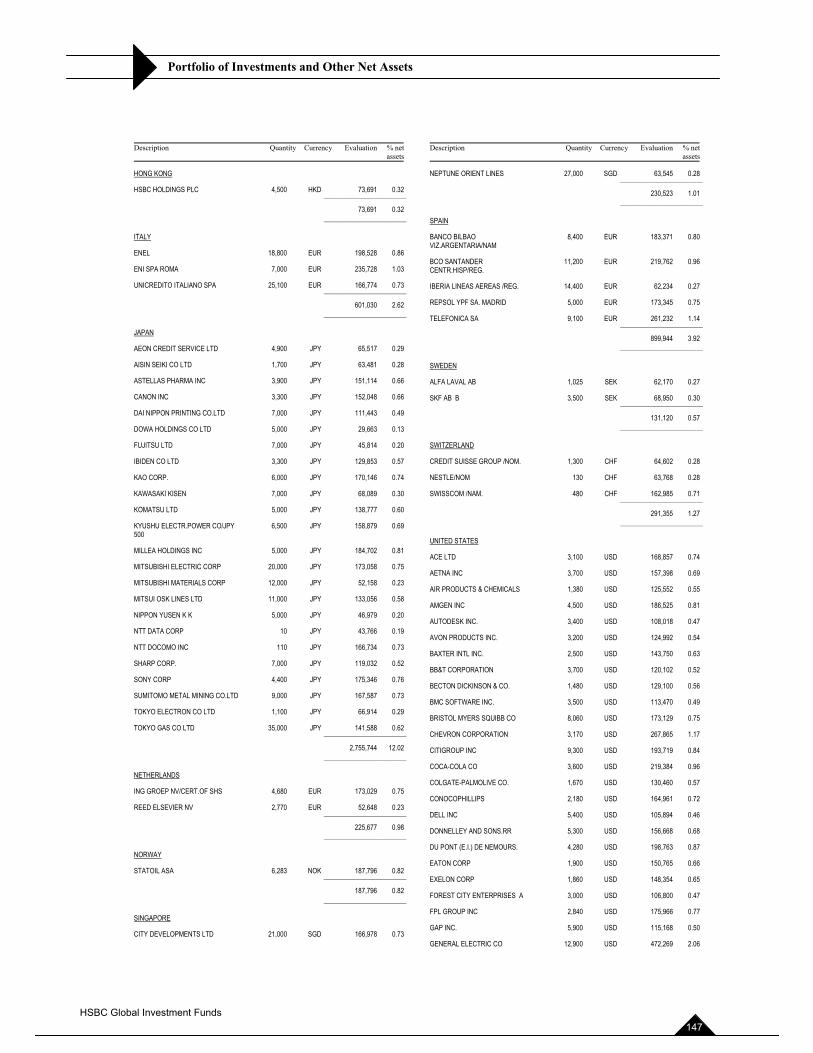
Portfolio of Investments and Other Net Assets
Description Quantity Currency Evaluation % netassets
HONG KONG
HSBC HOLDINGS PLC 4,500 HKD 73,691 0.32 ______________________
73,691 0.32 ______________________
ITALY
ENEL 18,800 EUR 198,528 0.86
ENI SPA ROMA 7,000 EUR 235,728 1.03
UNICREDITO ITALIANO SPA 25,100 EUR 166,774 0.73 ______________________
601,030 2.62 ______________________
JAPAN
AEON CREDIT SERVICE LTD 4,900 JPY 65,517 0.29
AISIN SEIKI CO LTD 1,700 JPY 63,481 0.28
ASTELLAS PHARMA INC 3,900 JPY 151,114 0.66
CANON INC 3,300 JPY 152,048 0.66
DAI NIPPON PRINTING CO.LTD 7,000 JPY 111,443 0.49
DOWA HOLDINGS CO LTD 5,000 JPY 29,663 0.13
FUJITSU LTD 7,000 JPY 45,814 0.20
IBIDEN CO LTD 3,300 JPY 129,853 0.57
KAO CORP. 6,000 JPY 170,146 0.74
KAWASAKI KISEN 7,000 JPY 68,089 0.30
KOMATSU LTD 5,000 JPY 138,777 0.60
KYUSHU ELECTR.POWER CO/JPY 500
6,500 JPY 158,879 0.69
MILLEA HOLDINGS INC 5,000 JPY 184,702 0.81
MITSUBISHI ELECTRIC CORP 20,000 JPY 173,058 0.75
MITSUBISHI MATERIALS CORP 12,000 JPY 52,158 0.23
MITSUI OSK LINES LTD 11,000 JPY 133,056 0.58
NIPPON YUSEN K K 5,000 JPY 46,979 0.20
NTT DATA CORP 10 JPY 43,766 0.19
NTT DOCOMO INC 110 JPY 166,734 0.73
SHARP CORP. 7,000 JPY 119,032 0.52
SONY CORP 4,400 JPY 175,346 0.76
SUMITOMO METAL MINING CO.LTD 9,000 JPY 167,587 0.73
TOKYO ELECTRON CO LTD 1,100 JPY 66,914 0.29
TOKYO GAS CO LTD 35,000 JPY 141,588 0.62 ______________________
2,755,744 12.02 ______________________
NETHERLANDS
ING GROEP NV/CERT.OF SHS 4,680 EUR 173,029 0.75
REED ELSEVIER NV 2,770 EUR 52,648 0.23 ______________________
225,677 0.98 ______________________
NORWAY
STATOIL ASA 6,283 NOK 187,796 0.82 ______________________
187,796 0.82 ______________________
SINGAPORE
CITY DEVELOPMENTS LTD 21,000 SGD 166,978 0.73
Description Quantity Currency Evaluation % netassets
NEPTUNE ORIENT LINES 27,000 SGD 63,545 0.28 ______________________
230,523 1.01 ______________________
SPAIN
BANCO BILBAO VIZ.ARGENTARIA/NAM
8,400 EUR 183,371 0.80
BCO SANTANDER CENTR.HISP/REG.
11,200 EUR 219,762 0.96
IBERIA LINEAS AEREAS /REG. 14,400 EUR 62,234 0.27
REPSOL YPF SA. MADRID 5,000 EUR 173,345 0.75
TELEFONICA SA 9,100 EUR 261,232 1.14 ______________________
899,944 3.92 ______________________
SWEDEN
ALFA LAVAL AB 1,025 SEK 62,170 0.27
SKF AB B 3,500 SEK 68,950 0.30 ______________________
131,120 0.57 ______________________
SWITZERLAND
CREDIT SUISSE GROUP /NOM. 1,300 CHF 64,602 0.28
NESTLE/NOM 130 CHF 63,768 0.28
SWISSCOM /NAM. 480 CHF 162,985 0.71 ______________________
291,355 1.27 ______________________
UNITED STATES
ACE LTD 3,100 USD 168,857 0.74
AETNA INC 3,700 USD 157,398 0.69
AIR PRODUCTS & CHEMICALS 1,380 USD 125,552 0.55
AMGEN INC 4,500 USD 186,525 0.81
AUTODESK INC. 3,400 USD 108,018 0.47
AVON PRODUCTS INC. 3,200 USD 124,992 0.54
BAXTER INTL INC. 2,500 USD 143,750 0.63
BB&T CORPORATION 3,700 USD 120,102 0.52
BECTON DICKINSON & CO. 1,480 USD 129,100 0.56
BMC SOFTWARE INC. 3,500 USD 113,470 0.49
BRISTOL MYERS SQUIBB CO 8,060 USD 173,129 0.75
CHEVRON CORPORATION 3,170 USD 267,865 1.17
CITIGROUP INC 9,300 USD 193,719 0.84
COCA-COLA CO 3,600 USD 219,384 0.96
COLGATE-PALMOLIVE CO. 1,670 USD 130,460 0.57
CONOCOPHILLIPS 2,180 USD 164,961 0.72
DELL INC 5,400 USD 105,894 0.46
DONNELLEY AND SONS.RR 5,300 USD 156,668 0.68
DU PONT (E.I.) DE NEMOURS. 4,280 USD 198,763 0.87
EATON CORP 1,900 USD 150,765 0.66
EXELON CORP 1,860 USD 148,354 0.65
FOREST CITY ENTERPRISES A 3,000 USD 106,800 0.47
FPL GROUP INC 2,840 USD 175,966 0.77
GAP INC. 5,900 USD 115,168 0.50
GENERAL ELECTRIC CO 12,900 USD 472,269 2.06
HSBC Global Investment Funds 147
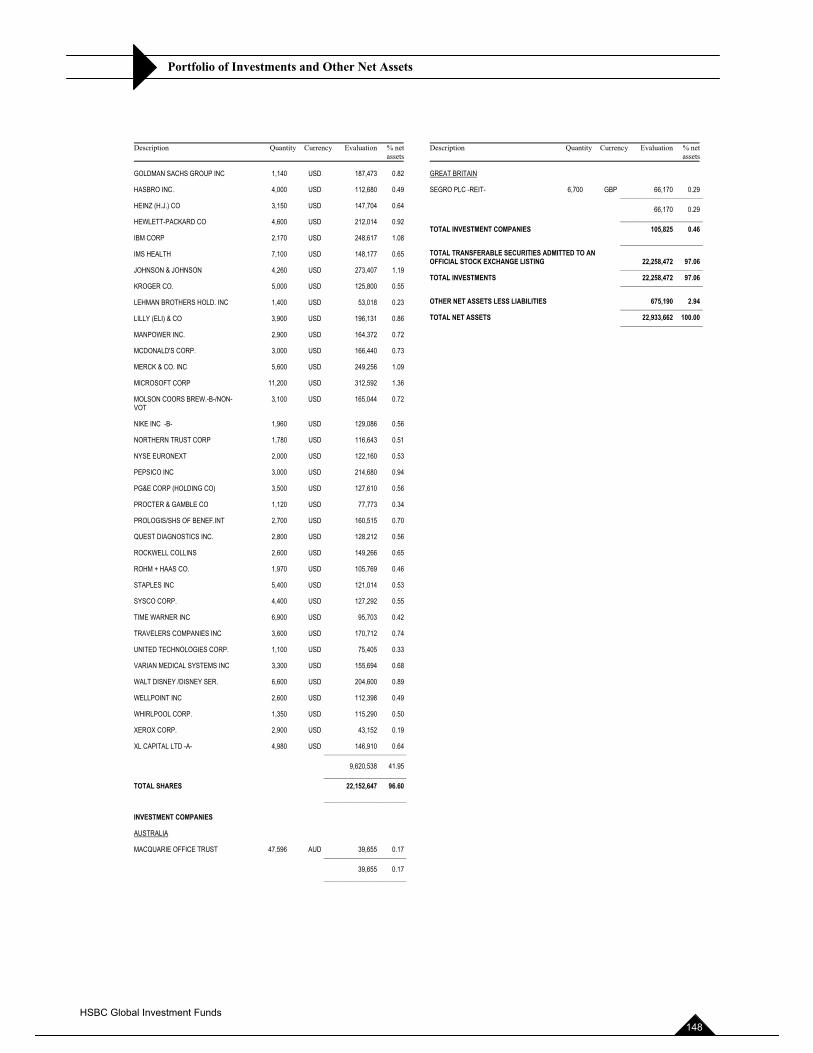
Portfolio of Investments and Other Net Assets
Description Quantity Currency Evaluation % netassets
GOLDMAN SACHS GROUP INC 1,140 USD 187,473 0.82
HASBRO INC. 4,000 USD 112,680 0.49
HEINZ (H.J.) CO 3,150 USD 147,704 0.64
HEWLETT-PACKARD CO 4,600 USD 212,014 0.92
IBM CORP 2,170 USD 248,617 1.08
IMS HEALTH 7,100 USD 148,177 0.65
JOHNSON & JOHNSON 4,260 USD 273,407 1.19
KROGER CO. 5,000 USD 125,800 0.55
LEHMAN BROTHERS HOLD. INC 1,400 USD 53,018 0.23
LILLY (ELI) & CO 3,900 USD 196,131 0.86
MANPOWER INC. 2,900 USD 164,372 0.72
MCDONALD'S CORP. 3,000 USD 166,440 0.73
MERCK & CO. INC 5,600 USD 249,256 1.09
MICROSOFT CORP 11,200 USD 312,592 1.36
MOLSON COORS BREW.-B-/NON-VOT
3,100 USD 165,044 0.72
NIKE INC -B- 1,960 USD 129,086 0.56
NORTHERN TRUST CORP 1,780 USD 116,643 0.51
NYSE EURONEXT 2,000 USD 122,160 0.53
PEPSICO INC 3,000 USD 214,680 0.94
PG&E CORP (HOLDING CO) 3,500 USD 127,610 0.56
PROCTER & GAMBLE CO 1,120 USD 77,773 0.34
PROLOGIS/SHS OF BENEF.INT 2,700 USD 160,515 0.70
QUEST DIAGNOSTICS INC. 2,800 USD 128,212 0.56
ROCKWELL COLLINS 2,600 USD 149,266 0.65
ROHM + HAAS CO. 1,970 USD 105,769 0.46
STAPLES INC 5,400 USD 121,014 0.53
SYSCO CORP. 4,400 USD 127,292 0.55
TIME WARNER INC 6,900 USD 95,703 0.42
TRAVELERS COMPANIES INC 3,600 USD 170,712 0.74
UNITED TECHNOLOGIES CORP. 1,100 USD 75,405 0.33
VARIAN MEDICAL SYSTEMS INC 3,300 USD 155,694 0.68
WALT DISNEY /DISNEY SER. 6,600 USD 204,600 0.89
WELLPOINT INC 2,600 USD 112,398 0.49
WHIRLPOOL CORP. 1,350 USD 115,290 0.50
XEROX CORP. 2,900 USD 43,152 0.19
XL CAPITAL LTD -A- 4,980 USD 146,910 0.64 ______________________
9,620,538 41.95 ______________________ TOTAL SHARES 22,152,647 96.60 ______________________
INVESTMENT COMPANIES
AUSTRALIA
MACQUARIE OFFICE TRUST 47,596 AUD 39,655 0.17 ______________________
39,655 0.17 ______________________
Description Quantity Currency Evaluation % netassets
GREAT BRITAIN
SEGRO PLC -REIT- 6,700 GBP 66,170 0.29 ______________________
66,170 0.29 ______________________ TOTAL INVESTMENT COMPANIES 105,825 0.46 ______________________ TOTAL TRANSFERABLE SECURITIES ADMITTED TO AN OFFICIAL STOCK EXCHANGE LISTING 22,258,472 97.06 ______________________ TOTAL INVESTMENTS 22,258,472 97.06 ______________________
OTHER NET ASSETS LESS LIABILITIES 675,190 2.94 ______________________ TOTAL NET ASSETS 22,933,662 100.00 ______________________
HSBC Global Investment Funds 148
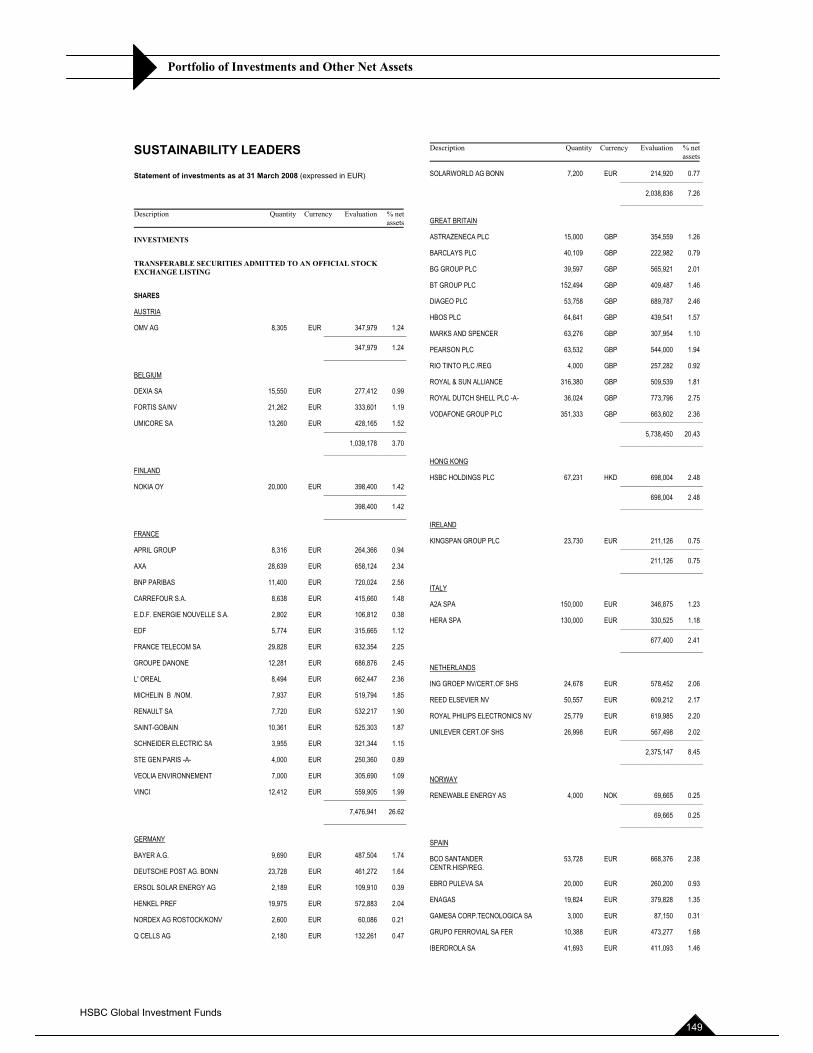
Portfolio of Investments and Other Net Assets
SUSTAINABILITY LEADERS
Statement of investments as at 31 March 2008 (expressed in EUR)
Description Quantity Currency Evaluation % netassets
INVESTMENTS
TRANSFERABLE SECURITIES ADMITTED TO AN OFFICIAL STOCK EXCHANGE LISTING
SHARES
AUSTRIA
OMV AG 8,305 EUR 347,979 1.24 ______________________
347,979 1.24 ______________________
BELGIUM
DEXIA SA 15,550 EUR 277,412 0.99
FORTIS SA/NV 21,262 EUR 333,601 1.19
UMICORE SA 13,260 EUR 428,165 1.52 ______________________
1,039,178 3.70 ______________________
FINLAND
NOKIA OY 20,000 EUR 398,400 1.42 ______________________
398,400 1.42 ______________________
FRANCE
APRIL GROUP 8,316 EUR 264,366 0.94
AXA 28,639 EUR 658,124 2.34
BNP PARIBAS 11,400 EUR 720,024 2.56
CARREFOUR S.A. 8,638 EUR 415,660 1.48
E.D.F. ENERGIE NOUVELLE S.A. 2,802 EUR 106,812 0.38
EDF 5,774 EUR 315,665 1.12
FRANCE TELECOM SA 29,828 EUR 632,354 2.25
GROUPE DANONE 12,281 EUR 686,876 2.45
L' OREAL 8,494 EUR 662,447 2.36
MICHELIN B /NOM. 7,937 EUR 519,794 1.85
RENAULT SA 7,720 EUR 532,217 1.90
SAINT-GOBAIN 10,361 EUR 525,303 1.87
SCHNEIDER ELECTRIC SA 3,955 EUR 321,344 1.15
STE GEN.PARIS -A- 4,000 EUR 250,360 0.89
VEOLIA ENVIRONNEMENT 7,000 EUR 305,690 1.09
VINCI 12,412 EUR 559,905 1.99 ______________________
7,476,941 26.62 ______________________
GERMANY
BAYER A.G. 9,690 EUR 487,504 1.74
DEUTSCHE POST AG. BONN 23,728 EUR 461,272 1.64
ERSOL SOLAR ENERGY AG 2,189 EUR 109,910 0.39
HENKEL PREF 19,975 EUR 572,883 2.04
NORDEX AG ROSTOCK/KONV 2,600 EUR 60,086 0.21
Q CELLS AG 2,180 EUR 132,261 0.47
Description Quantity Currency Evaluation % netassets
SOLARWORLD AG BONN 7,200 EUR 214,920 0.77 ______________________
2,038,836 7.26 ______________________
GREAT BRITAIN
ASTRAZENECA PLC 15,000 GBP 354,559 1.26
BARCLAYS PLC 40,109 GBP 222,982 0.79
BG GROUP PLC 39,597 GBP 565,921 2.01
BT GROUP PLC 152,494 GBP 409,487 1.46
DIAGEO PLC 53,758 GBP 689,787 2.46
HBOS PLC 64,641 GBP 439,541 1.57
MARKS AND SPENCER 63,276 GBP 307,954 1.10
PEARSON PLC 63,532 GBP 544,000 1.94
RIO TINTO PLC /REG 4,000 GBP 257,282 0.92
ROYAL & SUN ALLIANCE 316,380 GBP 509,539 1.81
ROYAL DUTCH SHELL PLC -A- 36,024 GBP 773,796 2.75
VODAFONE GROUP PLC 351,333 GBP 663,602 2.36 ______________________
5,738,450 20.43 ______________________
HONG KONG
HSBC HOLDINGS PLC 67,231 HKD 698,004 2.48 ______________________
698,004 2.48 ______________________
IRELAND
KINGSPAN GROUP PLC 23,730 EUR 211,126 0.75 ______________________
211,126 0.75 ______________________
ITALY
A2A SPA 150,000 EUR 346,875 1.23
HERA SPA 130,000 EUR 330,525 1.18 ______________________
677,400 2.41 ______________________
NETHERLANDS
ING GROEP NV/CERT.OF SHS 24,678 EUR 578,452 2.06
REED ELSEVIER NV 50,557 EUR 609,212 2.17
ROYAL PHILIPS ELECTRONICS NV 25,779 EUR 619,985 2.20
UNILEVER CERT.OF SHS 26,998 EUR 567,498 2.02 ______________________
2,375,147 8.45 ______________________
NORWAY
RENEWABLE ENERGY AS 4,000 NOK 69,665 0.25 ______________________
69,665 0.25 ______________________
SPAIN
BCO SANTANDER CENTR.HISP/REG.
53,728 EUR 668,376 2.38
EBRO PULEVA SA 20,000 EUR 260,200 0.93
ENAGAS 19,824 EUR 379,828 1.35
GAMESA CORP.TECNOLOGICA SA 3,000 EUR 87,150 0.31
GRUPO FERROVIAL SA FER 10,388 EUR 473,277 1.68
IBERDROLA SA 41,693 EUR 411,093 1.46
HSBC Global Investment Funds 149
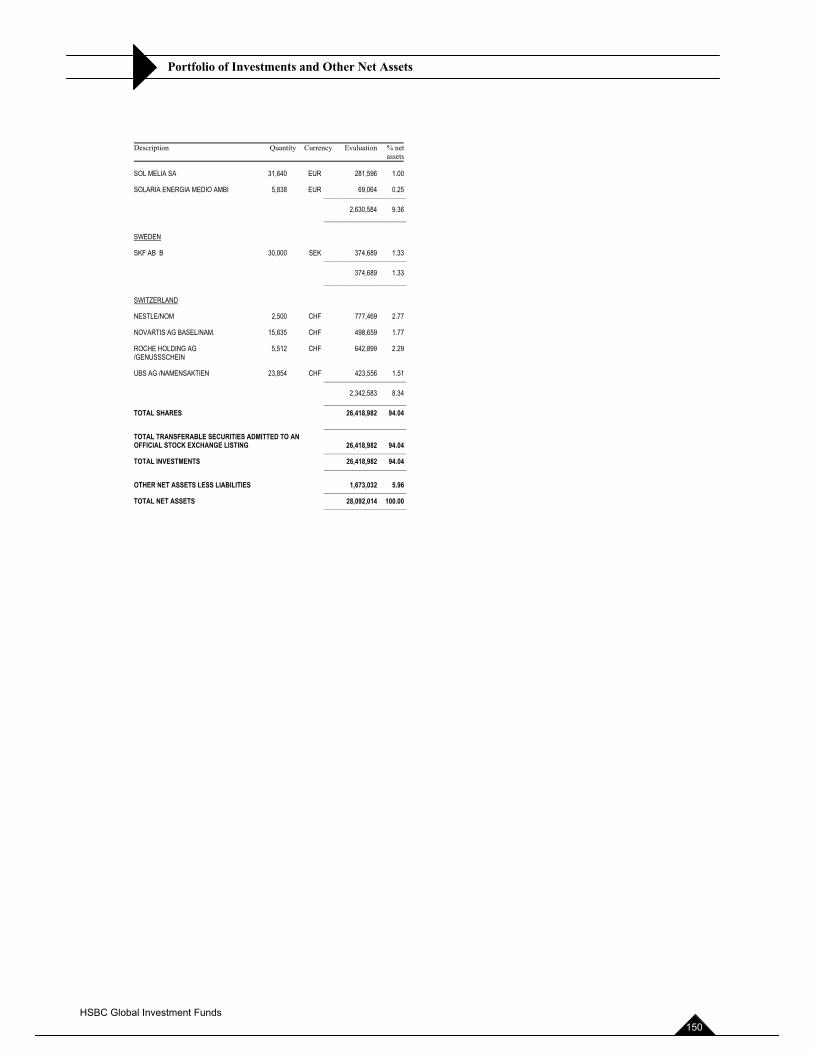
Portfolio of Investments and Other Net Assets
Description Quantity Currency Evaluation % netassets
SOL MELIA SA 31,640 EUR 281,596 1.00
SOLARIA ENERGIA MEDIO AMBI 5,838 EUR 69,064 0.25 ______________________
2,630,584 9.36 ______________________
SWEDEN
SKF AB B 30,000 SEK 374,689 1.33 ______________________
374,689 1.33 ______________________
SWITZERLAND
NESTLE/NOM 2,500 CHF 777,469 2.77
NOVARTIS AG BASEL/NAM. 15,635 CHF 498,659 1.77
ROCHE HOLDING AG /GENUSSSCHEIN
5,512 CHF 642,899 2.29
UBS AG /NAMENSAKTIEN 23,854 CHF 423,556 1.51 ______________________
2,342,583 8.34 ______________________ TOTAL SHARES 26,418,982 94.04 ______________________ TOTAL TRANSFERABLE SECURITIES ADMITTED TO AN OFFICIAL STOCK EXCHANGE LISTING 26,418,982 94.04 ______________________ TOTAL INVESTMENTS 26,418,982 94.04 ______________________
OTHER NET ASSETS LESS LIABILITIES 1,673,032 5.96 ______________________ TOTAL NET ASSETS 28,092,014 100.00 ______________________
HSBC Global Investment Funds 150
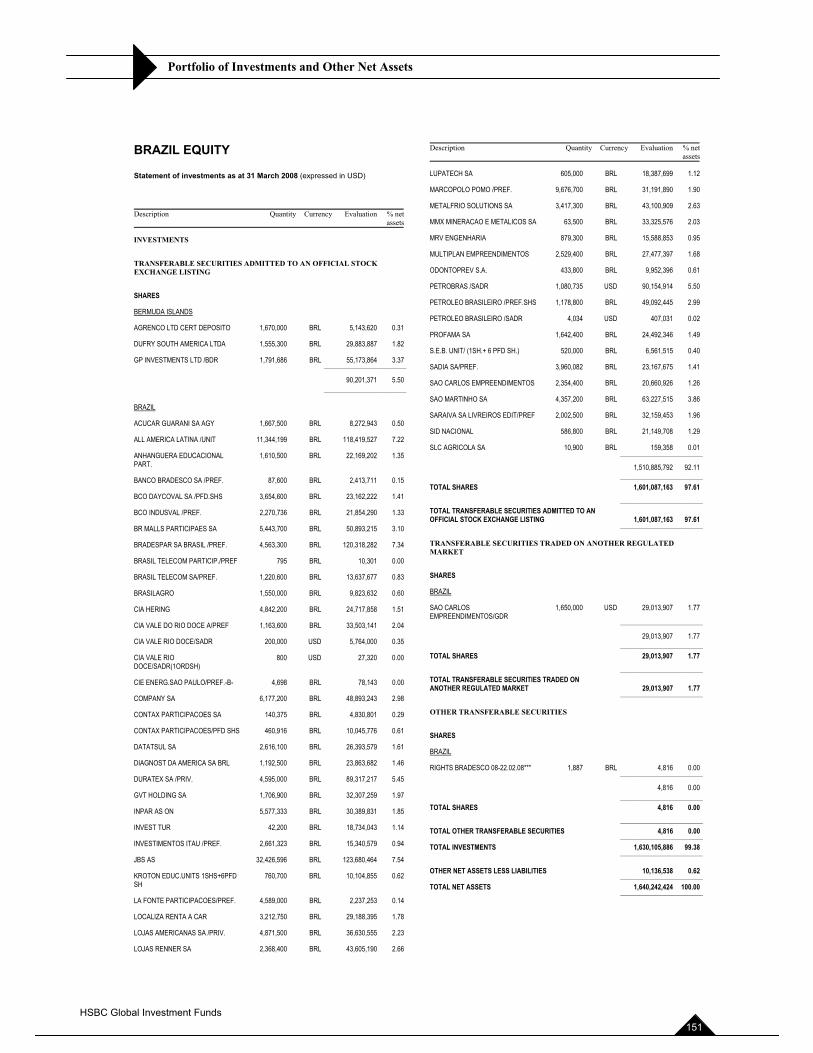
Portfolio of Investments and Other Net Assets
BRAZIL EQUITY
Statement of investments as at 31 March 2008 (expressed in USD)
Description Quantity Currency Evaluation % netassets
INVESTMENTS
TRANSFERABLE SECURITIES ADMITTED TO AN OFFICIAL STOCK EXCHANGE LISTING
SHARES
BERMUDA ISLANDS
AGRENCO LTD CERT DEPOSITO 1,670,000 BRL 5,143,620 0.31
DUFRY SOUTH AMERICA LTDA 1,555,300 BRL 29,883,887 1.82
GP INVESTMENTS LTD /BDR 1,791,686 BRL 55,173,864 3.37 ______________________
90,201,371 5.50 ______________________
BRAZIL
ACUCAR GUARANI SA AGY 1,667,500 BRL 8,272,943 0.50
ALL AMERICA LATINA /UNIT 11,344,199 BRL 118,419,527 7.22
ANHANGUERA EDUCACIONAL PART.
1,610,500 BRL 22,169,202 1.35
BANCO BRADESCO SA /PREF. 87,600 BRL 2,413,711 0.15
BCO DAYCOVAL SA /PFD.SHS 3,654,600 BRL 23,162,222 1.41
BCO INDUSVAL /PREF. 2,270,736 BRL 21,854,290 1.33
BR MALLS PARTICIPAES SA 5,443,700 BRL 50,893,215 3.10
BRADESPAR SA BRASIL /PREF. 4,563,300 BRL 120,318,282 7.34
BRASIL TELECOM PARTICIP./PREF 795 BRL 10,301 0.00
BRASIL TELECOM SA/PREF. 1,220,600 BRL 13,637,677 0.83
BRASILAGRO 1,550,000 BRL 9,823,632 0.60
CIA HERING 4,842,200 BRL 24,717,858 1.51
CIA VALE DO RIO DOCE A/PREF 1,163,600 BRL 33,503,141 2.04
CIA VALE RIO DOCE/SADR 200,000 USD 5,764,000 0.35
CIA VALE RIO DOCE/SADR(1ORDSH)
800 USD 27,320 0.00
CIE ENERG.SAO PAULO/PREF.-B- 4,698 BRL 78,143 0.00
COMPANY SA 6,177,200 BRL 48,893,243 2.98
CONTAX PARTICIPACOES SA 140,375 BRL 4,830,801 0.29
CONTAX PARTICIPACOES/PFD SHS 460,916 BRL 10,045,776 0.61
DATATSUL SA 2,616,100 BRL 26,393,579 1.61
DIAGNOST DA AMERICA SA BRL 1,192,500 BRL 23,863,682 1.46
DURATEX SA /PRIV. 4,595,000 BRL 89,317,217 5.45
GVT HOLDING SA 1,706,900 BRL 32,307,259 1.97
INPAR AS ON 5,577,333 BRL 30,389,831 1.85
INVEST TUR 42,200 BRL 18,734,043 1.14
INVESTIMENTOS ITAU /PREF. 2,661,323 BRL 15,340,579 0.94
JBS AS 32,426,596 BRL 123,680,464 7.54
KROTON EDUC.UNITS 1SHS+6PFD SH
760,700 BRL 10,104,855 0.62
LA FONTE PARTICIPACOES/PREF. 4,589,000 BRL 2,237,253 0.14
LOCALIZA RENTA A CAR 3,212,750 BRL 29,188,395 1.78
LOJAS AMERICANAS SA /PRIV. 4,871,500 BRL 36,630,555 2.23
LOJAS RENNER SA 2,368,400 BRL 43,605,190 2.66
Description Quantity Currency Evaluation % netassets
LUPATECH SA 605,000 BRL 18,387,699 1.12
MARCOPOLO POMO /PREF. 9,676,700 BRL 31,191,890 1.90
METALFRIO SOLUTIONS SA 3,417,300 BRL 43,100,909 2.63
MMX MINERACAO E METALICOS SA 63,500 BRL 33,325,576 2.03
MRV ENGENHARIA 879,300 BRL 15,588,853 0.95
MULTIPLAN EMPREENDIMENTOS 2,529,400 BRL 27,477,397 1.68
ODONTOPREV S.A. 433,800 BRL 9,952,396 0.61
PETROBRAS /SADR 1,080,735 USD 90,154,914 5.50
PETROLEO BRASILEIRO /PREF.SHS 1,178,800 BRL 49,092,445 2.99
PETROLEO BRASILEIRO /SADR 4,034 USD 407,031 0.02
PROFAMA SA 1,642,400 BRL 24,492,346 1.49
S.E.B. UNIT/ (1SH.+ 6 PFD SH.) 520,000 BRL 6,561,515 0.40
SADIA SA/PREF. 3,960,082 BRL 23,167,675 1.41
SAO CARLOS EMPREENDIMENTOS 2,354,400 BRL 20,660,926 1.26
SAO MARTINHO SA 4,357,200 BRL 63,227,515 3.86
SARAIVA SA LIVREIROS EDIT/PREF 2,002,500 BRL 32,159,453 1.96
SID NACIONAL 586,800 BRL 21,149,708 1.29
SLC AGRICOLA SA 10,900 BRL 159,358 0.01 ______________________
1,510,885,792 92.11 ______________________ TOTAL SHARES 1,601,087,163 97.61 ______________________ TOTAL TRANSFERABLE SECURITIES ADMITTED TO AN OFFICIAL STOCK EXCHANGE LISTING 1,601,087,163 97.61 ______________________
TRANSFERABLE SECURITIES TRADED ON ANOTHER REGULATED MARKET
SHARES
BRAZIL
SAO CARLOS EMPREENDIMENTOS/GDR ______________________
1,650,000 USD 29,013,907 1.77
29,013,907 1.77 ______________________ TOTAL SHARES 29,013,907 1.77 ______________________ TOTAL TRANSFERABLE SECURITIES TRADED ON ANOTHER REGULATED MARKET 29,013,907 1.77 ______________________
OTHER TRANSFERABLE SECURITIES
SHARES
BRAZIL
RIGHTS BRADESCO 08-22.02.08*** 1,887 BRL 4,816 0.00 ______________________
4,816 0.00 ______________________ TOTAL SHARES 4,816 0.00 ______________________ TOTAL OTHER TRANSFERABLE SECURITIES 4,816 0.00 ______________________ TOTAL INVESTMENTS 1,630,105,886 99.38 ______________________
OTHER NET ASSETS LESS LIABILITIES 10,136,538 0.62 ______________________ TOTAL NET ASSETS 1,640,242,424 100.00 ______________________
HSBC Global Investment Funds 151
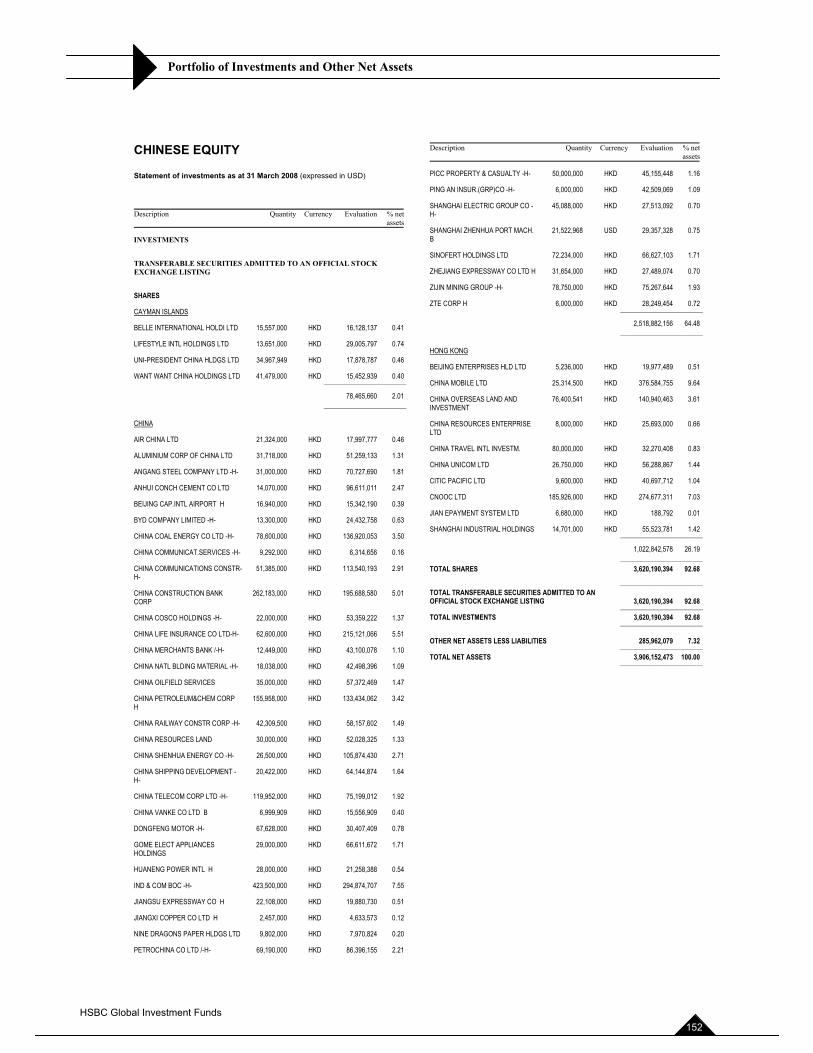
Portfolio of Investments and Other Net Assets
CHINESE EQUITY
Statement of investments as at 31 March 2008 (expressed in USD)
Description Quantity Currency Evaluation % netassets
INVESTMENTS
TRANSFERABLE SECURITIES ADMITTED TO AN OFFICIAL STOCK EXCHANGE LISTING
SHARES
CAYMAN ISLANDS
BELLE INTERNATIONAL HOLDI LTD 15,557,000 HKD 16,128,137 0.41
LIFESTYLE INTL HOLDINGS LTD 13,651,000 HKD 29,005,797 0.74
UNI-PRESIDENT CHINA HLDGS LTD 34,967,949 HKD 17,878,787 0.46
WANT WANT CHINA HOLDINGS LTD 41,479,000 HKD 15,452,939 0.40 ______________________
78,465,660 2.01 ______________________
CHINA
AIR CHINA LTD 21,324,000 HKD 17,997,777 0.46
ALUMINIUM CORP OF CHINA LTD 31,718,000 HKD 51,259,133 1.31
ANGANG STEEL COMPANY LTD -H- 31,000,000 HKD 70,727,690 1.81
ANHUI CONCH CEMENT CO LTD 14,070,000 HKD 96,611,011 2.47
BEIJING CAP.INTL AIRPORT H 16,940,000 HKD 15,342,190 0.39
BYD COMPANY LIMITED -H- 13,300,000 HKD 24,432,758 0.63
CHINA COAL ENERGY CO LTD -H- 78,600,000 HKD 136,920,053 3.50
CHINA COMMUNICAT.SERVICES -H- 9,292,000 HKD 6,314,656 0.16
CHINA COMMUNICATIONS CONSTR-H-
51,385,000 HKD 113,540,193 2.91
CHINA CONSTRUCTION BANK CORP
262,183,000 HKD 195,688,580 5.01
CHINA COSCO HOLDINGS -H- 22,000,000 HKD 53,359,222 1.37
CHINA LIFE INSURANCE CO LTD-H- 62,600,000 HKD 215,121,066 5.51
CHINA MERCHANTS BANK /-H- 12,449,000 HKD 43,100,078 1.10
CHINA NATL BLDING MATERIAL -H- 18,038,000 HKD 42,498,396 1.09
CHINA OILFIELD SERVICES 35,000,000 HKD 57,372,469 1.47
CHINA PETROLEUM&CHEM CORP H
155,958,000 HKD 133,434,062 3.42
CHINA RAILWAY CONSTR CORP -H- 42,309,500 HKD 58,157,602 1.49
CHINA RESOURCES LAND 30,000,000 HKD 52,028,325 1.33
CHINA SHENHUA ENERGY CO -H- 26,500,000 HKD 105,874,430 2.71
CHINA SHIPPING DEVELOPMENT -H-
20,422,000 HKD 64,144,874 1.64
CHINA TELECOM CORP LTD -H- 119,952,000 HKD 75,199,012 1.92
CHINA VANKE CO LTD B 6,999,909 HKD 15,556,909 0.40
DONGFENG MOTOR -H- 67,628,000 HKD 30,407,409 0.78
GOME ELECT APPLIANCES HOLDINGS
29,000,000 HKD 66,611,672 1.71
HUANENG POWER INTL H 28,000,000 HKD 21,258,388 0.54
IND & COM BOC -H- 423,500,000 HKD 294,874,707 7.55
JIANGSU EXPRESSWAY CO H 22,108,000 HKD 19,880,730 0.51
JIANGXI COPPER CO LTD H 2,457,000 HKD 4,633,573 0.12
NINE DRAGONS PAPER HLDGS LTD 9,802,000 HKD 7,970,824 0.20
PETROCHINA CO LTD /-H- 69,190,000 HKD 86,396,155 2.21
Description Quantity Currency Evaluation % netassets
PICC PROPERTY & CASUALTY -H- 50,000,000 HKD 45,155,448 1.16
PING AN INSUR.(GRP)CO -H- 6,000,000 HKD 42,509,069 1.09
SHANGHAI ELECTRIC GROUP CO -H-
45,088,000 HKD 27,513,092 0.70
SHANGHAI ZHENHUA PORT MACH. B
21,522,968 USD 29,357,328 0.75
SINOFERT HOLDINGS LTD 72,234,000 HKD 66,627,103 1.71
ZHEJIANG EXPRESSWAY CO LTD H 31,654,000 HKD 27,489,074 0.70
ZIJIN MINING GROUP -H- 78,750,000 HKD 75,267,644 1.93
ZTE CORP H 6,000,000 HKD 28,249,454 0.72 ______________________
2,518,882,156 64.48 ______________________
HONG KONG
BEIJING ENTERPRISES HLD LTD 5,236,000 HKD 19,977,489 0.51
CHINA MOBILE LTD 25,314,500 HKD 376,584,755 9.64
CHINA OVERSEAS LAND AND INVESTMENT
76,400,541 HKD 140,940,463 3.61
CHINA RESOURCES ENTERPRISE LTD
8,000,000 HKD 25,693,000 0.66
CHINA TRAVEL INTL INVESTM. 80,000,000 HKD 32,270,408 0.83
CHINA UNICOM LTD 26,750,000 HKD 56,288,867 1.44
CITIC PACIFIC LTD 9,600,000 HKD 40,697,712 1.04
CNOOC LTD 185,926,000 HKD 274,677,311 7.03
JIAN EPAYMENT SYSTEM LTD 6,680,000 HKD 188,792 0.01
SHANGHAI INDUSTRIAL HOLDINGS 14,701,000 HKD 55,523,781 1.42 ______________________
1,022,842,578 26.19 ______________________ TOTAL SHARES 3,620,190,394 92.68 ______________________ TOTAL TRANSFERABLE SECURITIES ADMITTED TO AN OFFICIAL STOCK EXCHANGE LISTING 3,620,190,394 92.68 ______________________ TOTAL INVESTMENTS 3,620,190,394 92.68 ______________________
OTHER NET ASSETS LESS LIABILITIES 285,962,079 7.32 ______________________ TOTAL NET ASSETS 3,906,152,473 100.00 ______________________
HSBC Global Investment Funds 152
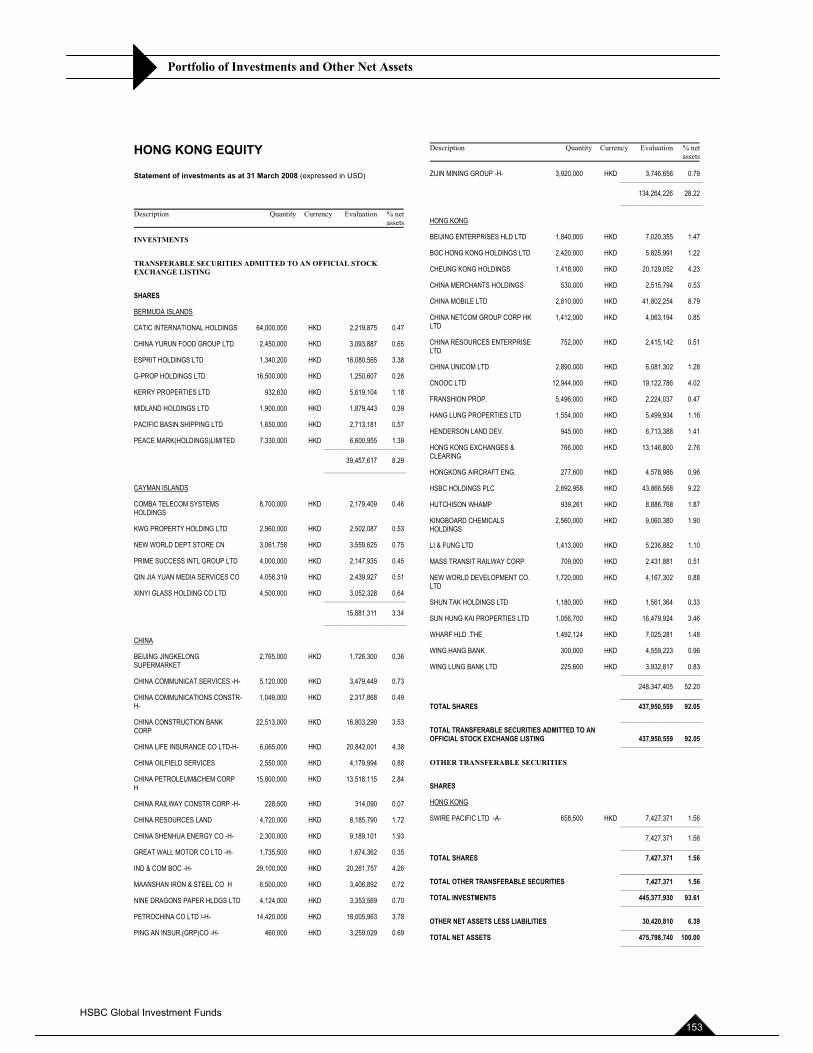
Portfolio of Investments and Other Net Assets
HONG KONG EQUITY
Statement of investments as at 31 March 2008 (expressed in USD)
Description Quantity Currency Evaluation % netassets
INVESTMENTS
TRANSFERABLE SECURITIES ADMITTED TO AN OFFICIAL STOCK EXCHANGE LISTING
SHARES
BERMUDA ISLANDS
CATIC INTERNATIONAL HOLDINGS 64,000,000 HKD 2,219,875 0.47
CHINA YURUN FOOD GROUP LTD 2,450,000 HKD 3,093,887 0.65
ESPRIT HOLDINGS LTD 1,340,200 HKD 16,080,565 3.38
G-PROP HOLDINGS LTD 16,500,000 HKD 1,250,607 0.26
KERRY PROPERTIES LTD 932,630 HKD 5,619,104 1.18
MIDLAND HOLDINGS LTD 1,900,000 HKD 1,879,443 0.39
PACIFIC BASIN SHIPPING LTD 1,650,000 HKD 2,713,181 0.57
PEACE MARK(HOLDINGS)LIMITED 7,330,000 HKD 6,600,955 1.39 ______________________
39,457,617 8.29 ______________________
CAYMAN ISLANDS
COMBA TELECOM SYSTEMS HOLDINGS
8,700,000 HKD 2,179,409 0.46
KWG PROPERTY HOLDING LTD 2,960,000 HKD 2,502,087 0.53
NEW WORLD DEPT.STORE CN 3,061,758 HKD 3,559,625 0.75
PRIME SUCCESS INTL GROUP LTD 4,000,000 HKD 2,147,935 0.45
QIN JIA YUAN MEDIA SERVICES CO 4,058,319 HKD 2,439,927 0.51
XINYI GLASS HOLDING CO LTD 4,500,000 HKD 3,052,328 0.64 ______________________
15,881,311 3.34 ______________________
CHINA
BEIJING JINGKELONG SUPERMARKET
2,765,000 HKD 1,726,300 0.36
CHINA COMMUNICAT.SERVICES -H- 5,120,000 HKD 3,479,449 0.73
CHINA COMMUNICATIONS CONSTR-H-
1,049,000 HKD 2,317,868 0.49
CHINA CONSTRUCTION BANK CORP
22,513,000 HKD 16,803,290 3.53
CHINA LIFE INSURANCE CO LTD-H- 6,065,000 HKD 20,842,001 4.38
CHINA OILFIELD SERVICES 2,550,000 HKD 4,179,994 0.88
CHINA PETROLEUM&CHEM CORP H
15,800,000 HKD 13,518,115 2.84
CHINA RAILWAY CONSTR CORP -H- 228,500 HKD 314,090 0.07
CHINA RESOURCES LAND 4,720,000 HKD 8,185,790 1.72
CHINA SHENHUA ENERGY CO -H- 2,300,000 HKD 9,189,101 1.93
GREAT WALL MOTOR CO LTD -H- 1,735,500 HKD 1,674,362 0.35
IND & COM BOC -H- 29,100,000 HKD 20,261,757 4.26
MAANSHAN IRON & STEEL CO H 6,500,000 HKD 3,406,892 0.72
NINE DRAGONS PAPER HLDGS LTD 4,124,000 HKD 3,353,569 0.70
PETROCHINA CO LTD /-H- 14,420,000 HKD 18,005,963 3.78
PING AN INSUR.(GRP)CO -H- 460,000 HKD 3,259,029 0.69
Description Quantity Currency Evaluation % netassets
ZIJIN MINING GROUP -H- 3,920,000 HKD 3,746,656 0.79 ______________________
134,264,226 28.22 ______________________
HONG KONG
BEIJING ENTERPRISES HLD LTD 1,840,000 HKD 7,020,355 1.47
BOC HONG KONG HOLDINGS LTD 2,420,000 HKD 5,825,991 1.22
CHEUNG KONG HOLDINGS 1,418,000 HKD 20,129,052 4.23
CHINA MERCHANTS HOLDINGS 530,000 HKD 2,515,794 0.53
CHINA MOBILE LTD 2,810,000 HKD 41,802,254 8.79
CHINA NETCOM GROUP CORP HK LTD
1,412,000 HKD 4,063,194 0.85
CHINA RESOURCES ENTERPRISE LTD
752,000 HKD 2,415,142 0.51
CHINA UNICOM LTD 2,890,000 HKD 6,081,302 1.28
CNOOC LTD 12,944,000 HKD 19,122,786 4.02
FRANSHION PROP. 5,496,000 HKD 2,224,037 0.47
HANG LUNG PROPERTIES LTD 1,554,000 HKD 5,499,934 1.16
HENDERSON LAND DEV. 945,000 HKD 6,713,388 1.41
HONG KONG EXCHANGES & CLEARING
766,000 HKD 13,146,800 2.76
HONGKONG AIRCRAFT ENG. 277,600 HKD 4,578,986 0.96
HSBC HOLDINGS PLC 2,692,958 HKD 43,866,568 9.22
HUTCHISON WHAMP 939,261 HKD 8,886,768 1.87
KINGBOARD CHEMICALS HOLDINGS
2,560,000 HKD 9,060,380 1.90
LI & FUNG LTD 1,413,000 HKD 5,236,882 1.10
MASS TRANSIT RAILWAY CORP 709,000 HKD 2,431,881 0.51
NEW WORLD DEVELOPMENT CO. LTD
1,720,000 HKD 4,167,302 0.88
SHUN TAK HOLDINGS LTD 1,180,000 HKD 1,561,364 0.33
SUN HUNG KAI PROPERTIES LTD 1,056,700 HKD 16,479,924 3.46
WHARF HLD .THE 1,492,124 HKD 7,025,281 1.48
WING HANG BANK 300,000 HKD 4,559,223 0.96
WING LUNG BANK LTD 225,600 HKD 3,932,817 0.83 ______________________
248,347,405 52.20 ______________________ TOTAL SHARES 437,950,559 92.05 ______________________ TOTAL TRANSFERABLE SECURITIES ADMITTED TO AN OFFICIAL STOCK EXCHANGE LISTING 437,950,559 92.05 ______________________
OTHER TRANSFERABLE SECURITIES
SHARES
HONG KONG
SWIRE PACIFIC LTD -A- 658,500 HKD 7,427,371 1.56 ______________________
7,427,371 1.56 ______________________ TOTAL SHARES 7,427,371 1.56 ______________________ TOTAL OTHER TRANSFERABLE SECURITIES 7,427,371 1.56 ______________________ TOTAL INVESTMENTS 445,377,930 93.61 ______________________
OTHER NET ASSETS LESS LIABILITIES 30,420,810 6.39 ______________________ TOTAL NET ASSETS 475,798,740 100.00 ______________________
HSBC Global Investment Funds 153
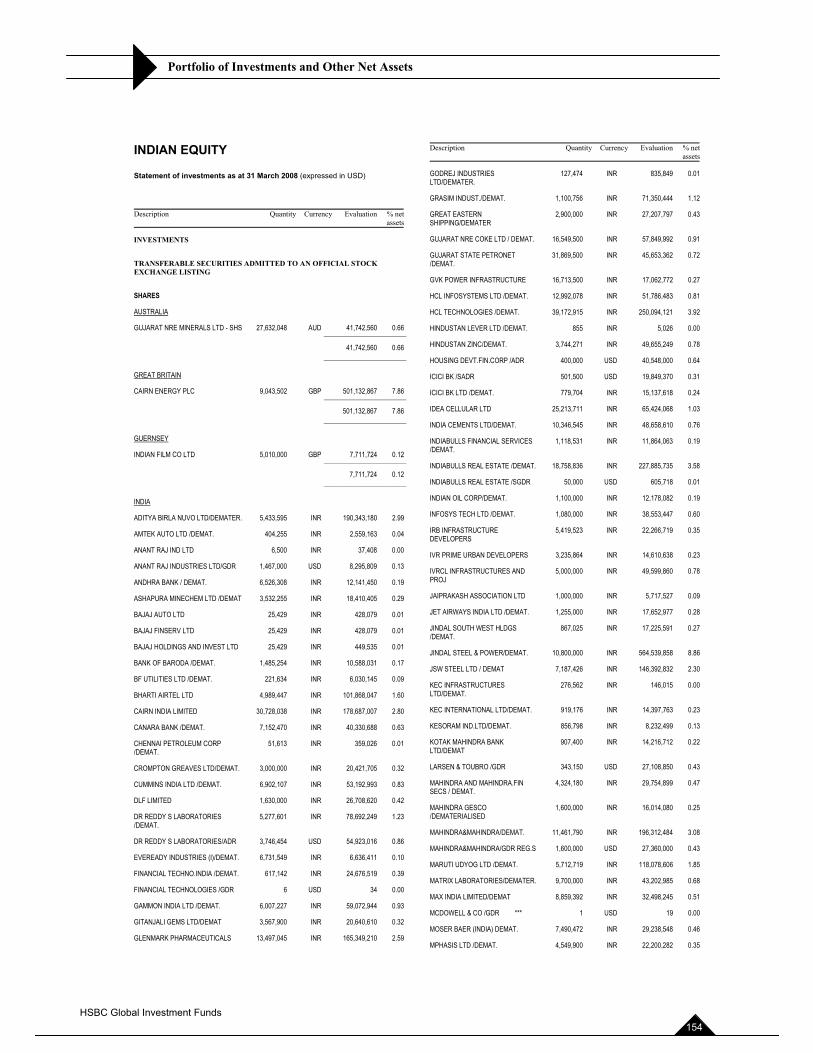
Portfolio of Investments and Other Net Assets
INDIAN EQUITY
Statement of investments as at 31 March 2008 (expressed in USD)
Description Quantity Currency Evaluation % netassets
INVESTMENTS
TRANSFERABLE SECURITIES ADMITTED TO AN OFFICIAL STOCK EXCHANGE LISTING
SHARES
AUSTRALIA
GUJARAT NRE MINERALS LTD - SHS 27,632,048 AUD 41,742,560 0.66 ______________________
41,742,560 0.66 ______________________
GREAT BRITAIN
CAIRN ENERGY PLC 9,043,502 GBP 501,132,867 7.86 ______________________
501,132,867 7.86 ______________________
GUERNSEY
INDIAN FILM CO LTD 5,010,000 GBP 7,711,724 0.12 ______________________
7,711,724 0.12 ______________________
INDIA
ADITYA BIRLA NUVO LTD/DEMATER. 5,433,595 INR 190,343,180 2.99
AMTEK AUTO LTD /DEMAT. 404,255 INR 2,559,163 0.04
ANANT RAJ IND LTD 6,500 INR 37,408 0.00
ANANT RAJ INDUSTRIES LTD/GDR 1,467,000 USD 8,295,809 0.13
ANDHRA BANK / DEMAT. 6,526,308 INR 12,141,450 0.19
ASHAPURA MINECHEM LTD /DEMAT 3,532,255 INR 18,410,405 0.29
BAJAJ AUTO LTD 25,429 INR 428,079 0.01
BAJAJ FINSERV LTD 25,429 INR 428,079 0.01
BAJAJ HOLDINGS AND INVEST LTD 25,429 INR 449,535 0.01
BANK OF BARODA /DEMAT. 1,485,254 INR 10,588,031 0.17
BF UTILITIES LTD /DEMAT. 221,634 INR 6,030,145 0.09
BHARTI AIRTEL LTD 4,989,447 INR 101,868,047 1.60
CAIRN INDIA LIMITED 30,728,038 INR 178,687,007 2.80
CANARA BANK /DEMAT. 7,152,470 INR 40,330,688 0.63
CHENNAI PETROLEUM CORP /DEMAT.
51,613 INR 359,026 0.01
CROMPTON GREAVES LTD/DEMAT. 3,000,000 INR 20,421,705 0.32
CUMMINS INDIA LTD /DEMAT. 6,902,107 INR 53,192,993 0.83
DLF LIMITED 1,630,000 INR 26,708,620 0.42
DR REDDY S LABORATORIES /DEMAT.
5,277,601 INR 78,692,249 1.23
DR REDDY S LABORATORIES/ADR 3,746,454 USD 54,923,016 0.86
EVEREADY INDUSTRIES (I)/DEMAT. 6,731,549 INR 6,636,411 0.10
FINANCIAL TECHNO.INDIA /DEMAT. 617,142 INR 24,676,519 0.39
FINANCIAL TECHNOLOGIES /GDR 6 USD 34 0.00
GAMMON INDIA LTD /DEMAT. 6,007,227 INR 59,072,944 0.93
GITANJALI GEMS LTD/DEMAT 3,567,900 INR 20,640,610 0.32
GLENMARK PHARMACEUTICALS 13,497,045 INR 165,349,210 2.59
Description Quantity Currency Evaluation % netassets
GODREJ INDUSTRIES LTD/DEMATER.
127,474 INR 835,849 0.01
GRASIM INDUST./DEMAT. 1,100,756 INR 71,350,444 1.12
GREAT EASTERN SHIPPING/DEMATER
2,900,000 INR 27,207,797 0.43
GUJARAT NRE COKE LTD / DEMAT. 16,549,500 INR 57,849,992 0.91
GUJARAT STATE PETRONET /DEMAT.
31,869,500 INR 45,653,362 0.72
GVK POWER INFRASTRUCTURE 16,713,500 INR 17,062,772 0.27
HCL INFOSYSTEMS LTD /DEMAT. 12,992,078 INR 51,786,483 0.81
HCL TECHNOLOGIES /DEMAT. 39,172,915 INR 250,094,121 3.92
HINDUSTAN LEVER LTD /DEMAT. 855 INR 5,026 0.00
HINDUSTAN ZINC/DEMAT. 3,744,271 INR 49,655,249 0.78
HOUSING DEVT.FIN.CORP /ADR 400,000 USD 40,548,000 0.64
ICICI BK /SADR 501,500 USD 19,849,370 0.31
ICICI BK LTD /DEMAT. 779,704 INR 15,137,618 0.24
IDEA CELLULAR LTD 25,213,711 INR 65,424,068 1.03
INDIA CEMENTS LTD/DEMAT. 10,346,545 INR 48,658,610 0.76
INDIABULLS FINANCIAL SERVICES /DEMAT.
1,118,531 INR 11,864,063 0.19
INDIABULLS REAL ESTATE /DEMAT. 18,758,836 INR 227,885,735 3.58
INDIABULLS REAL ESTATE /SGDR 50,000 USD 605,718 0.01
INDIAN OIL CORP/DEMAT. 1,100,000 INR 12,178,082 0.19
INFOSYS TECH LTD /DEMAT. 1,080,000 INR 38,553,447 0.60
IRB INFRASTRUCTURE DEVELOPERS
5,419,523 INR 22,266,719 0.35
IVR PRIME URBAN DEVELOPERS 3,235,864 INR 14,610,638 0.23
IVRCL INFRASTRUCTURES AND PROJ
5,000,000 INR 49,599,860 0.78
JAIPRAKASH ASSOCIATION LTD 1,000,000 INR 5,717,527 0.09
JET AIRWAYS INDIA LTD /DEMAT. 1,255,000 INR 17,652,977 0.28
JINDAL SOUTH WEST HLDGS /DEMAT.
867,025 INR 17,225,591 0.27
JINDAL STEEL & POWER/DEMAT. 10,800,000 INR 564,539,858 8.86
JSW STEEL LTD / DEMAT 7,187,426 INR 146,392,832 2.30
KEC INFRASTRUCTURES LTD/DEMAT.
276,562 INR 146,015 0.00
KEC INTERNATIONAL LTD/DEMAT. 919,176 INR 14,397,763 0.23
KESORAM IND.LTD/DEMAT. 856,798 INR 8,232,499 0.13
KOTAK MAHINDRA BANK LTD/DEMAT
907,400 INR 14,216,712 0.22
LARSEN & TOUBRO /GDR 343,150 USD 27,108,850 0.43
MAHINDRA AND MAHINDRA.FINSECS / DEMAT.
4,324,180 INR 29,754,899 0.47
MAHINDRA GESCO /DEMATERIALISED
1,600,000 INR 16,014,080 0.25
MAHINDRA&MAHINDRA/DEMAT. 11,461,790 INR 196,312,484 3.08
MAHINDRA&MAHINDRA/GDR REG.S 1,600,000 USD 27,360,000 0.43
MARUTI UDYOG LTD /DEMAT. 5,712,719 INR 118,078,606 1.85
MATRIX LABORATORIES/DEMATER. 9,700,000 INR 43,202,985 0.68
MAX INDIA LIMITED/DEMAT 8,859,392 INR 32,498,245 0.51
MCDOWELL & CO /GDR *** 1 USD 19 0.00
MOSER BAER (INDIA) DEMAT. 7,490,472 INR 29,238,548 0.46
MPHASIS LTD /DEMAT. 4,549,900 INR 22,200,282 0.35
HSBC Global Investment Funds 154
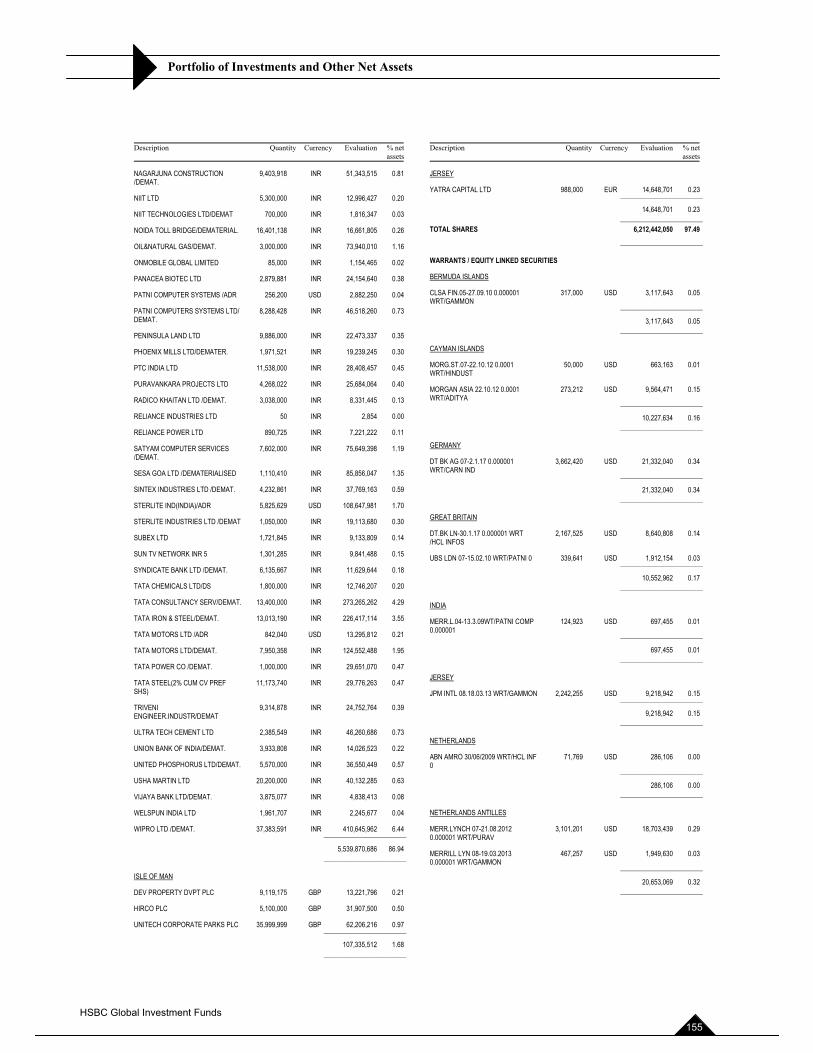
Portfolio of Investments and Other Net Assets
Description Quantity Currency Evaluation % netassets
NAGARJUNA CONSTRUCTION /DEMAT.
9,403,918 INR 51,343,515 0.81
NIIT LTD 5,300,000 INR 12,996,427 0.20
NIIT TECHNOLOGIES LTD/DEMAT 700,000 INR 1,816,347 0.03
NOIDA TOLL BRIDGE/DEMATERIAL. 16,401,138 INR 16,661,805 0.26
OIL&NATURAL GAS/DEMAT. 3,000,000 INR 73,940,010 1.16
ONMOBILE GLOBAL LIMITED 85,000 INR 1,154,465 0.02
PANACEA BIOTEC LTD 2,879,881 INR 24,154,640 0.38
PATNI COMPUTER SYSTEMS /ADR 256,200 USD 2,882,250 0.04
PATNI COMPUTERS SYSTEMS LTD/ DEMAT.
8,288,428 INR 46,518,260 0.73
PENINSULA LAND LTD 9,886,000 INR 22,473,337 0.35
PHOENIX MILLS LTD/DEMATER. 1,971,521 INR 19,239,245 0.30
PTC INDIA LTD 11,538,000 INR 28,408,457 0.45
PURAVANKARA PROJECTS LTD 4,268,022 INR 25,684,064 0.40
RADICO KHAITAN LTD /DEMAT. 3,038,000 INR 8,331,445 0.13
RELIANCE INDUSTRIES LTD 50 INR 2,854 0.00
RELIANCE POWER LTD 890,725 INR 7,221,222 0.11
SATYAM COMPUTER SERVICES /DEMAT.
7,602,000 INR 75,649,398 1.19
SESA GOA LTD /DEMATERIALISED 1,110,410 INR 85,856,047 1.35
SINTEX INDUSTRIES LTD /DEMAT. 4,232,861 INR 37,769,163 0.59
STERLITE IND(INDIA)/ADR 5,825,629 USD 108,647,981 1.70
STERLITE INDUSTRIES LTD /DEMAT 1,050,000 INR 19,113,680 0.30
SUBEX LTD 1,721,845 INR 9,133,809 0.14
SUN TV NETWORK INR 5 1,301,285 INR 9,841,488 0.15
SYNDICATE BANK LTD /DEMAT. 6,135,667 INR 11,629,644 0.18
TATA CHEMICALS LTD/DS 1,800,000 INR 12,746,207 0.20
TATA CONSULTANCY SERV/DEMAT. 13,400,000 INR 273,265,262 4.29
TATA IRON & STEEL/DEMAT. 13,013,190 INR 226,417,114 3.55
TATA MOTORS LTD /ADR 842,040 USD 13,295,812 0.21
TATA MOTORS LTD/DEMAT. 7,950,358 INR 124,552,488 1.95
TATA POWER CO /DEMAT. 1,000,000 INR 29,651,070 0.47
TATA STEEL(2% CUM CV PREF SHS)
11,173,740 INR 29,776,263 0.47
TRIVENIENGINEER.INDUSTR/DEMAT
9,314,878 INR 24,752,764 0.39
ULTRA TECH CEMENT LTD 2,385,549 INR 46,260,686 0.73
UNION BANK OF INDIA/DEMAT. 3,933,808 INR 14,026,523 0.22
UNITED PHOSPHORUS LTD/DEMAT. 5,570,000 INR 36,550,449 0.57
USHA MARTIN LTD 20,200,000 INR 40,132,285 0.63
VIJAYA BANK LTD/DEMAT. 3,875,077 INR 4,838,413 0.08
WELSPUN INDIA LTD 1,961,707 INR 2,245,677 0.04
WIPRO LTD /DEMAT. 37,383,591 INR 410,645,962 6.44 ______________________
5,539,870,686 86.94 ______________________
ISLE OF MAN
DEV PROPERTY DVPT PLC 9,119,175 GBP 13,221,796 0.21
HIRCO PLC 5,100,000 GBP 31,907,500 0.50
UNITECH CORPORATE PARKS PLC 35,999,999 GBP 62,206,216 0.97 ______________________
107,335,512 1.68 ______________________
Description Quantity Currency Evaluation % netassets
JERSEY
YATRA CAPITAL LTD 988,000 EUR 14,648,701 0.23 ______________________
14,648,701 0.23 ______________________ TOTAL SHARES 6,212,442,050 97.49 ______________________
WARRANTS / EQUITY LINKED SECURITIES
BERMUDA ISLANDS
CLSA FIN.05-27.09.10 0.000001 WRT/GAMMON ______________________
317,000 USD 3,117,643 0.05
3,117,643 0.05 ______________________
CAYMAN ISLANDS
MORG.ST.07-22.10.12 0.0001 WRT/HINDUST
50,000 USD 663,163 0.01
MORGAN ASIA 22.10.12 0.0001 WRT/ADITYA ______________________
273,212 USD 9,564,471 0.15
10,227,634 0.16 ______________________
GERMANY
DT BK AG 07-2.1.17 0.000001 WRT/CARN IND ______________________
3,662,420 USD 21,332,040 0.34
21,332,040 0.34 ______________________
GREAT BRITAIN
DT.BK LN-30.1.17 0.000001 WRT /HCL INFOS
2,167,525 USD 8,640,808 0.14
UBS LDN 07-15.02.10 WRT/PATNI 0 339,641 USD 1,912,154 0.03 ______________________
10,552,962 0.17 ______________________
INDIA
MERR.L.04-13.3.09WT/PATNI COMP 0.000001 ______________________
124,923 USD 697,455 0.01
697,455 0.01 ______________________
JERSEY
JPM INTL 08.18.03.13 WRT/GAMMON 2,242,255 USD 9,218,942 0.15 ______________________
9,218,942 0.15 ______________________
NETHERLANDS
ABN AMRO 30/06/2009 WRT/HCL INF 0 ______________________
71,769 USD 286,106 0.00
286,106 0.00 ______________________
NETHERLANDS ANTILLES
MERR.LYNCH 07-21.08.2012 0.000001 WRT/PURAV
3,101,201 USD 18,703,439 0.29
MERRILL LYN 08-19.03.2013 0.000001 WRT/GAMMON ______________________
467,257 USD 1,949,630 0.03
20,653,069 0.32 ______________________
HSBC Global Investment Funds 155
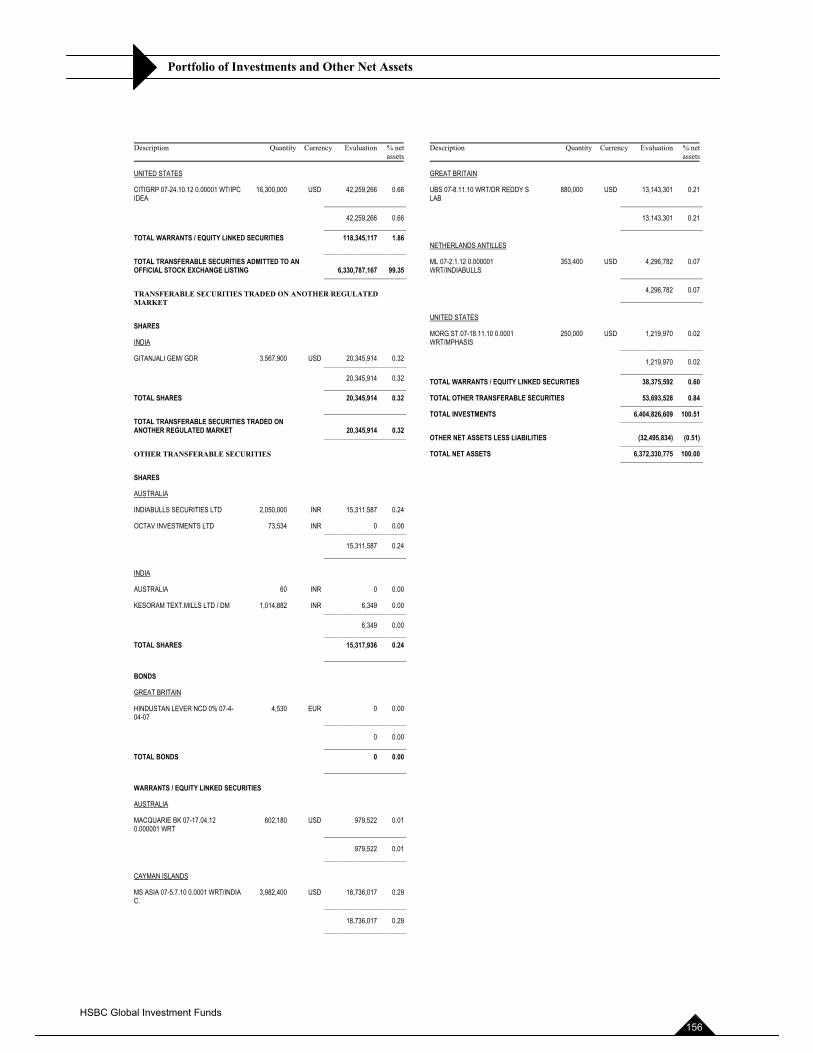
Portfolio of Investments and Other Net Assets
Description Quantity Currency Evaluation % netassets
UNITED STATES
CITIGRP 07-24.10.12 0.00001 WT/IPC IDEA ______________________
16,300,000 USD 42,259,266 0.66
42,259,266 0.66 ______________________ TOTAL WARRANTS / EQUITY LINKED SECURITIES 118,345,117 1.86 ______________________ TOTAL TRANSFERABLE SECURITIES ADMITTED TO AN OFFICIAL STOCK EXCHANGE LISTING 6,330,787,167 99.35 ______________________
TRANSFERABLE SECURITIES TRADED ON ANOTHER REGULATED MARKET
SHARES
INDIA
GITANJALI GEM/ GDR 3,567,900 USD 20,345,914 0.32 ______________________
20,345,914 0.32 ______________________ TOTAL SHARES 20,345,914 0.32 ______________________ TOTAL TRANSFERABLE SECURITIES TRADED ON ANOTHER REGULATED MARKET 20,345,914 0.32 ______________________
OTHER TRANSFERABLE SECURITIES
SHARES
AUSTRALIA
INDIABULLS SECURITIES LTD 2,050,000 INR 15,311,587 0.24
OCTAV INVESTMENTS LTD 73,534 INR 0 0.00 ______________________
15,311,587 0.24 ______________________
INDIA
AUSTRALIA 60 INR 0 0.00
KESORAM TEXT.MILLS LTD / DM 1,014,882 INR 6,349 0.00 ______________________
6,349 0.00 ______________________ TOTAL SHARES 15,317,936 0.24 ______________________
BONDS
GREAT BRITAIN
HINDUSTAN LEVER NCD 0% 07-4-04-07 ______________________
4,530 EUR 0 0.00
0 0.00 ______________________ TOTAL BONDS 0 0.00 ______________________
WARRANTS / EQUITY LINKED SECURITIES
AUSTRALIA
MACQUARIE BK 07-17.04.12 0.000001 WRT ______________________
602,180 USD 979,522 0.01
979,522 0.01 ______________________
CAYMAN ISLANDS
MS ASIA 07-5.7.10 0.0001 WRT/INDIAC. ______________________
3,982,400 USD 18,736,017 0.29
18,736,017 0.29 ______________________
Description Quantity Currency Evaluation % netassets
GREAT BRITAIN
UBS 07-8.11.10 WRT/DR REDDY S LAB ______________________
880,000 USD 13,143,301 0.21
13,143,301 0.21 ______________________
NETHERLANDS ANTILLES
ML 07-2.1.12 0.000001 WRT/INDIABULLS
353,400 USD 4,296,782 0.07
______________________
4,296,782 0.07 ______________________
UNITED STATES
MORG.ST.07-18.11.10 0.0001 WRT/MPHASIS ______________________
250,000 USD 1,219,970 0.02
1,219,970 0.02 ______________________ TOTAL WARRANTS / EQUITY LINKED SECURITIES 38,375,592 0.60
TOTAL OTHER TRANSFERABLE SECURITIES 53,693,528 0.84 ______________________ TOTAL INVESTMENTS 6,404,826,609 100.51 ______________________
OTHER NET ASSETS LESS LIABILITIES (32,495,834) (0.51) ______________________ TOTAL NET ASSETS 6,372,330,775 100.00 ______________________
HSBC Global Investment Funds 156
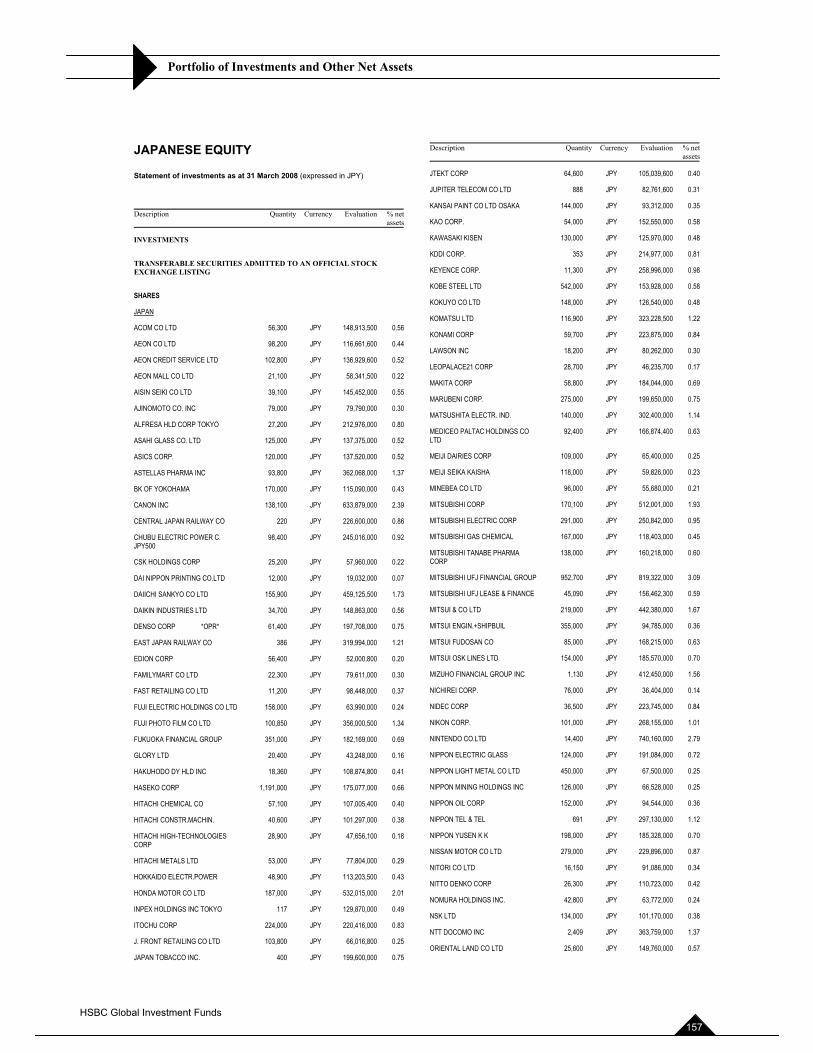
Portfolio of Investments and Other Net Assets
JAPANESE EQUITY
Statement of investments as at 31 March 2008 (expressed in JPY)
Description Quantity Currency Evaluation % netassets
INVESTMENTS
TRANSFERABLE SECURITIES ADMITTED TO AN OFFICIAL STOCK EXCHANGE LISTING
SHARES
JAPAN
ACOM CO LTD 56,300 JPY 148,913,500 0.56
AEON CO LTD 98,200 JPY 116,661,600 0.44
AEON CREDIT SERVICE LTD 102,800 JPY 136,929,600 0.52
AEON MALL CO LTD 21,100 JPY 58,341,500 0.22
AISIN SEIKI CO LTD 39,100 JPY 145,452,000 0.55
AJINOMOTO CO. INC 79,000 JPY 79,790,000 0.30
ALFRESA HLD CORP TOKYO 27,200 JPY 212,976,000 0.80
ASAHI GLASS CO. LTD 125,000 JPY 137,375,000 0.52
ASICS CORP. 120,000 JPY 137,520,000 0.52
ASTELLAS PHARMA INC 93,800 JPY 362,068,000 1.37
BK OF YOKOHAMA 170,000 JPY 115,090,000 0.43
CANON INC 138,100 JPY 633,879,000 2.39
CENTRAL JAPAN RAILWAY CO 220 JPY 226,600,000 0.86
CHUBU ELECTRIC POWER C. JPY500
98,400 JPY 245,016,000 0.92
CSK HOLDINGS CORP 25,200 JPY 57,960,000 0.22
DAI NIPPON PRINTING CO.LTD 12,000 JPY 19,032,000 0.07
DAIICHI SANKYO CO LTD 155,900 JPY 459,125,500 1.73
DAIKIN INDUSTRIES LTD 34,700 JPY 148,863,000 0.56
DENSO CORP *OPR* 61,400 JPY 197,708,000 0.75
EAST JAPAN RAILWAY CO 386 JPY 319,994,000 1.21
EDION CORP 56,400 JPY 52,000,800 0.20
FAMILYMART CO LTD 22,300 JPY 79,611,000 0.30
FAST RETAILING CO LTD 11,200 JPY 98,448,000 0.37
FUJI ELECTRIC HOLDINGS CO LTD 158,000 JPY 63,990,000 0.24
FUJI PHOTO FILM CO LTD 100,850 JPY 356,000,500 1.34
FUKUOKA FINANCIAL GROUP 351,000 JPY 182,169,000 0.69
GLORY LTD 20,400 JPY 43,248,000 0.16
HAKUHODO DY HLD INC 18,360 JPY 108,874,800 0.41
HASEKO CORP 1,191,000 JPY 175,077,000 0.66
HITACHI CHEMICAL CO 57,100 JPY 107,005,400 0.40
HITACHI CONSTR.MACHIN. 40,600 JPY 101,297,000 0.38
HITACHI HIGH-TECHNOLOGIES CORP
28,900 JPY 47,656,100 0.18
HITACHI METALS LTD 53,000 JPY 77,804,000 0.29
HOKKAIDO ELECTR.POWER 48,900 JPY 113,203,500 0.43
HONDA MOTOR CO LTD 187,000 JPY 532,015,000 2.01
INPEX HOLDINGS INC TOKYO 117 JPY 129,870,000 0.49
ITOCHU CORP 224,000 JPY 220,416,000 0.83
J. FRONT RETAILING CO LTD 103,800 JPY 66,016,800 0.25
JAPAN TOBACCO INC. 400 JPY 199,600,000 0.75
Description Quantity Currency Evaluation % netassets
JTEKT CORP 64,600 JPY 105,039,600 0.40
JUPITER TELECOM CO LTD 888 JPY 82,761,600 0.31
KANSAI PAINT CO LTD OSAKA 144,000 JPY 93,312,000 0.35
KAO CORP. 54,000 JPY 152,550,000 0.58
KAWASAKI KISEN 130,000 JPY 125,970,000 0.48
KDDI CORP. 353 JPY 214,977,000 0.81
KEYENCE CORP. 11,300 JPY 258,996,000 0.98
KOBE STEEL LTD 542,000 JPY 153,928,000 0.58
KOKUYO CO LTD 148,000 JPY 126,540,000 0.48
KOMATSU LTD 116,900 JPY 323,228,500 1.22
KONAMI CORP 59,700 JPY 223,875,000 0.84
LAWSON INC 18,200 JPY 80,262,000 0.30
LEOPALACE21 CORP 28,700 JPY 46,235,700 0.17
MAKITA CORP 58,800 JPY 184,044,000 0.69
MARUBENI CORP. 275,000 JPY 199,650,000 0.75
MATSUSHITA ELECTR. IND. 140,000 JPY 302,400,000 1.14
MEDICEO PALTAC HOLDINGS CO LTD
92,400 JPY 166,874,400 0.63
MEIJI DAIRIES CORP 109,000 JPY 65,400,000 0.25
MEIJI SEIKA KAISHA 118,000 JPY 59,826,000 0.23
MINEBEA CO LTD 96,000 JPY 55,680,000 0.21
MITSUBISHI CORP 170,100 JPY 512,001,000 1.93
MITSUBISHI ELECTRIC CORP 291,000 JPY 250,842,000 0.95
MITSUBISHI GAS CHEMICAL 167,000 JPY 118,403,000 0.45
MITSUBISHI TANABE PHARMA CORP
138,000 JPY 160,218,000 0.60
MITSUBISHI UFJ FINANCIAL GROUP 952,700 JPY 819,322,000 3.09
MITSUBISHI UFJ LEASE & FINANCE 45,090 JPY 156,462,300 0.59
MITSUI & CO LTD 219,000 JPY 442,380,000 1.67
MITSUI ENGIN.+SHIPBUIL 355,000 JPY 94,785,000 0.36
MITSUI FUDOSAN CO 85,000 JPY 168,215,000 0.63
MITSUI OSK LINES LTD 154,000 JPY 185,570,000 0.70
MIZUHO FINANCIAL GROUP INC 1,130 JPY 412,450,000 1.56
NICHIREI CORP. 76,000 JPY 36,404,000 0.14
NIDEC CORP 36,500 JPY 223,745,000 0.84
NIKON CORP. 101,000 JPY 268,155,000 1.01
NINTENDO CO.LTD 14,400 JPY 740,160,000 2.79
NIPPON ELECTRIC GLASS 124,000 JPY 191,084,000 0.72
NIPPON LIGHT METAL CO LTD 450,000 JPY 67,500,000 0.25
NIPPON MINING HOLDINGS INC 126,000 JPY 66,528,000 0.25
NIPPON OIL CORP 152,000 JPY 94,544,000 0.36
NIPPON TEL & TEL 691 JPY 297,130,000 1.12
NIPPON YUSEN K K 198,000 JPY 185,328,000 0.70
NISSAN MOTOR CO LTD 279,000 JPY 229,896,000 0.87
NITORI CO LTD 16,150 JPY 91,086,000 0.34
NITTO DENKO CORP 26,300 JPY 110,723,000 0.42
NOMURA HOLDINGS INC. 42,800 JPY 63,772,000 0.24
NSK LTD 134,000 JPY 101,170,000 0.38
NTT DOCOMO INC 2,409 JPY 363,759,000 1.37
ORIENTAL LAND CO LTD 25,600 JPY 149,760,000 0.57
HSBC Global Investment Funds 157
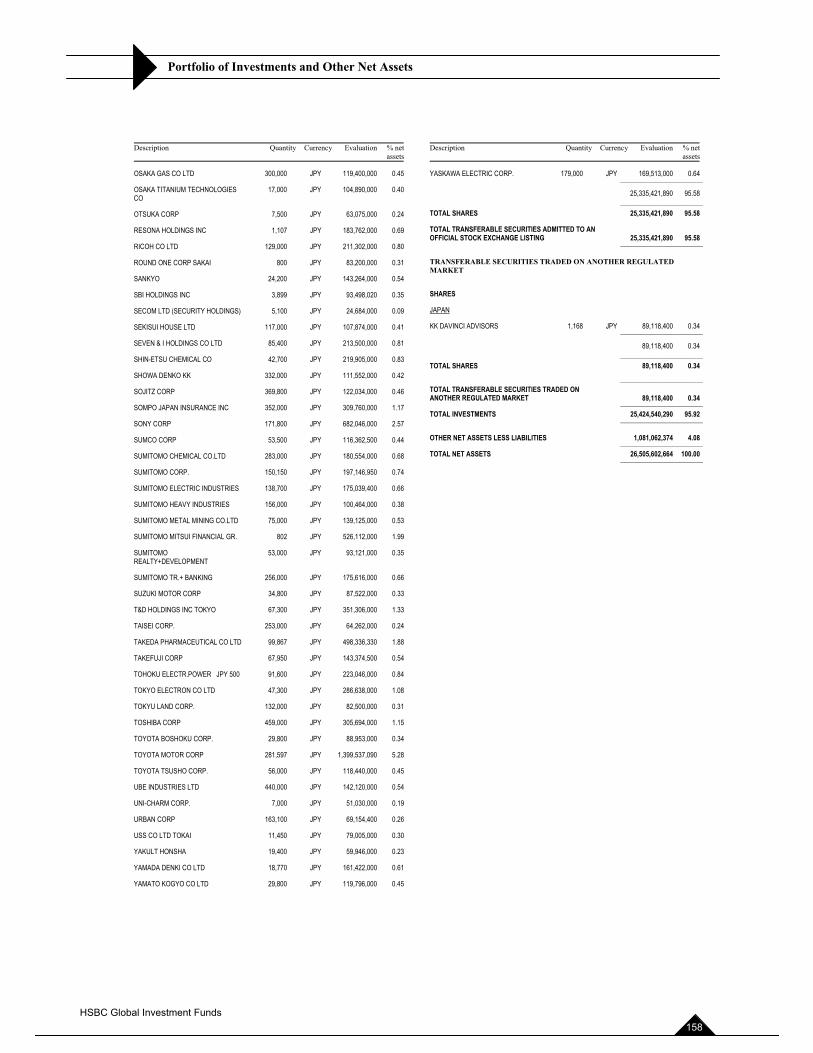
Portfolio of Investments and Other Net Assets
Description Quantity Currency Evaluation % netassets
OSAKA GAS CO LTD 300,000 JPY 119,400,000 0.45
OSAKA TITANIUM TECHNOLOGIES CO
17,000 JPY 104,890,000 0.40
OTSUKA CORP 7,500 JPY 63,075,000 0.24
RESONA HOLDINGS INC 1,107 JPY 183,762,000 0.69
RICOH CO LTD 129,000 JPY 211,302,000 0.80
ROUND ONE CORP SAKAI 800 JPY 83,200,000 0.31
SANKYO 24,200 JPY 143,264,000 0.54
SBI HOLDINGS INC 3,899 JPY 93,498,020 0.35
SECOM LTD (SECURITY HOLDINGS) 5,100 JPY 24,684,000 0.09
SEKISUI HOUSE LTD 117,000 JPY 107,874,000 0.41
SEVEN & I HOLDINGS CO LTD 85,400 JPY 213,500,000 0.81
SHIN-ETSU CHEMICAL CO 42,700 JPY 219,905,000 0.83
SHOWA DENKO KK 332,000 JPY 111,552,000 0.42
SOJITZ CORP 369,800 JPY 122,034,000 0.46
SOMPO JAPAN INSURANCE INC 352,000 JPY 309,760,000 1.17
SONY CORP 171,800 JPY 682,046,000 2.57
SUMCO CORP 53,500 JPY 116,362,500 0.44
SUMITOMO CHEMICAL CO.LTD 283,000 JPY 180,554,000 0.68
SUMITOMO CORP. 150,150 JPY 197,146,950 0.74
SUMITOMO ELECTRIC INDUSTRIES 138,700 JPY 175,039,400 0.66
SUMITOMO HEAVY INDUSTRIES 156,000 JPY 100,464,000 0.38
SUMITOMO METAL MINING CO.LTD 75,000 JPY 139,125,000 0.53
SUMITOMO MITSUI FINANCIAL GR. 802 JPY 526,112,000 1.99
SUMITOMO REALTY+DEVELOPMENT
53,000 JPY 93,121,000 0.35
SUMITOMO TR.+ BANKING 256,000 JPY 175,616,000 0.66
SUZUKI MOTOR CORP 34,800 JPY 87,522,000 0.33
T&D HOLDINGS INC TOKYO 67,300 JPY 351,306,000 1.33
TAISEI CORP. 253,000 JPY 64,262,000 0.24
TAKEDA PHARMACEUTICAL CO LTD 99,867 JPY 498,336,330 1.88
TAKEFUJI CORP 67,950 JPY 143,374,500 0.54
TOHOKU ELECTR.POWER JPY 500 91,600 JPY 223,046,000 0.84
TOKYO ELECTRON CO LTD 47,300 JPY 286,638,000 1.08
TOKYU LAND CORP. 132,000 JPY 82,500,000 0.31
TOSHIBA CORP 459,000 JPY 305,694,000 1.15
TOYOTA BOSHOKU CORP. 29,800 JPY 88,953,000 0.34
TOYOTA MOTOR CORP 281,597 JPY 1,399,537,090 5.28
TOYOTA TSUSHO CORP. 56,000 JPY 118,440,000 0.45
UBE INDUSTRIES LTD 440,000 JPY 142,120,000 0.54
UNI-CHARM CORP. 7,000 JPY 51,030,000 0.19
URBAN CORP 163,100 JPY 69,154,400 0.26
USS CO LTD TOKAI 11,450 JPY 79,005,000 0.30
YAKULT HONSHA 19,400 JPY 59,946,000 0.23
YAMADA DENKI CO LTD 18,770 JPY 161,422,000 0.61
YAMATO KOGYO CO LTD 29,800 JPY 119,796,000 0.45
Description Quantity Currency Evaluation % netassets
YASKAWA ELECTRIC CORP. 179,000 JPY 169,513,000 0.64 ______________________
25,335,421,890 95.58 ______________________ TOTAL SHARES 25,335,421,890 95.58
TOTAL TRANSFERABLE SECURITIES ADMITTED TO AN OFFICIAL STOCK EXCHANGE LISTING 25,335,421,890 95.58 ______________________
TRANSFERABLE SECURITIES TRADED ON ANOTHER REGULATED MARKET
SHARES
JAPAN
KK DAVINCI ADVISORS 1,168 JPY 89,118,400 0.34 ______________________
89,118,400 0.34 ______________________ TOTAL SHARES 89,118,400 0.34 ______________________ TOTAL TRANSFERABLE SECURITIES TRADED ON ANOTHER REGULATED MARKET 89,118,400 0.34 ______________________ TOTAL INVESTMENTS 25,424,540,290 95.92 ______________________
OTHER NET ASSETS LESS LIABILITIES 1,081,062,374 4.08 ______________________ TOTAL NET ASSETS 26,505,602,664 100.00 ______________________
HSBC Global Investment Funds 158
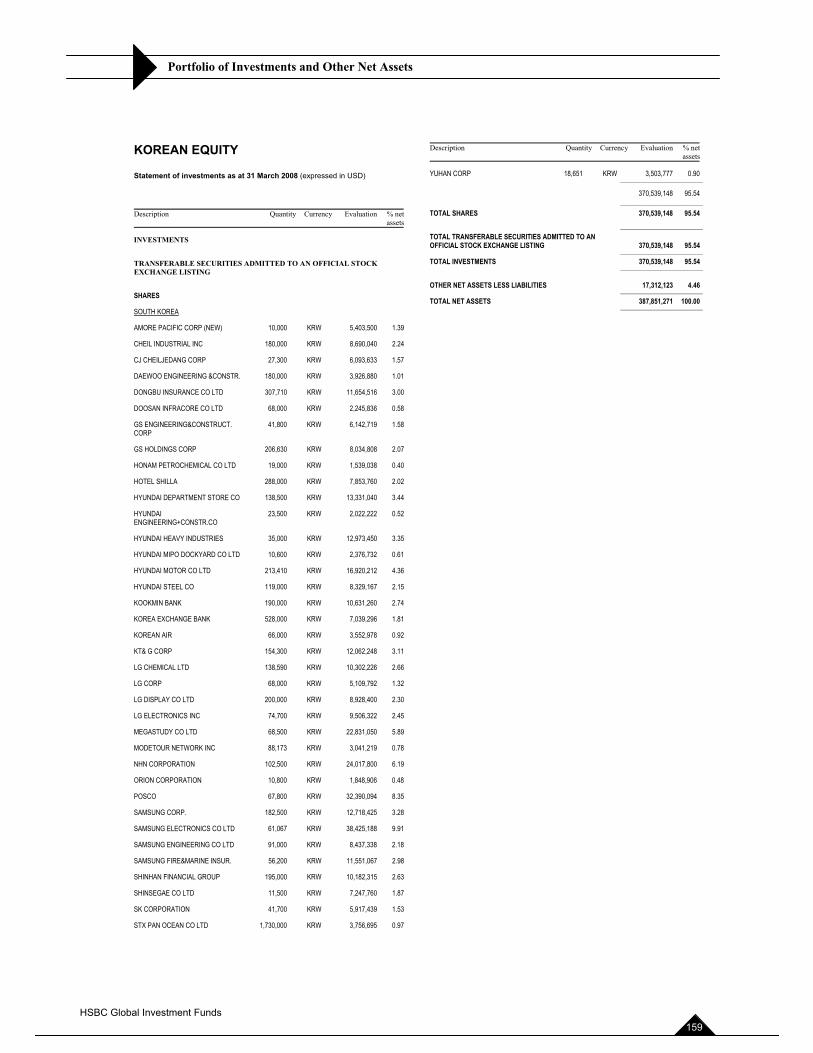
Portfolio of Investments and Other Net Assets
KOREAN EQUITY
Statement of investments as at 31 March 2008 (expressed in USD)
Description Quantity Currency Evaluation % netassets
INVESTMENTS
TRANSFERABLE SECURITIES ADMITTED TO AN OFFICIAL STOCK EXCHANGE LISTING
SHARES
SOUTH KOREA
AMORE PACIFIC CORP (NEW) 10,000 KRW 5,403,500 1.39
CHEIL INDUSTRIAL INC 180,000 KRW 8,690,040 2.24
CJ CHEILJEDANG CORP 27,300 KRW 6,093,633 1.57
DAEWOO ENGINEERING &CONSTR. 180,000 KRW 3,926,880 1.01
DONGBU INSURANCE CO LTD 307,710 KRW 11,654,516 3.00
DOOSAN INFRACORE CO LTD 68,000 KRW 2,245,836 0.58
GS ENGINEERING&CONSTRUCT. CORP
41,800 KRW 6,142,719 1.58
GS HOLDINGS CORP 206,630 KRW 8,034,808 2.07
HONAM PETROCHEMICAL CO LTD 19,000 KRW 1,539,038 0.40
HOTEL SHILLA 288,000 KRW 7,853,760 2.02
HYUNDAI DEPARTMENT STORE CO 138,500 KRW 13,331,040 3.44
HYUNDAIENGINEERING+CONSTR.CO
23,500 KRW 2,022,222 0.52
HYUNDAI HEAVY INDUSTRIES 35,000 KRW 12,973,450 3.35
HYUNDAI MIPO DOCKYARD CO LTD 10,600 KRW 2,376,732 0.61
HYUNDAI MOTOR CO LTD 213,410 KRW 16,920,212 4.36
HYUNDAI STEEL CO 119,000 KRW 8,329,167 2.15
KOOKMIN BANK 190,000 KRW 10,631,260 2.74
KOREA EXCHANGE BANK 528,000 KRW 7,039,296 1.81
KOREAN AIR 66,000 KRW 3,552,978 0.92
KT& G CORP 154,300 KRW 12,062,248 3.11
LG CHEMICAL LTD 138,590 KRW 10,302,226 2.66
LG CORP 68,000 KRW 5,109,792 1.32
LG DISPLAY CO LTD 200,000 KRW 8,928,400 2.30
LG ELECTRONICS INC 74,700 KRW 9,506,322 2.45
MEGASTUDY CO LTD 68,500 KRW 22,831,050 5.89
MODETOUR NETWORK INC 88,173 KRW 3,041,219 0.78
NHN CORPORATION 102,500 KRW 24,017,800 6.19
ORION CORPORATION 10,800 KRW 1,848,906 0.48
POSCO 67,800 KRW 32,390,094 8.35
SAMSUNG CORP. 182,500 KRW 12,718,425 3.28
SAMSUNG ELECTRONICS CO LTD 61,067 KRW 38,425,188 9.91
SAMSUNG ENGINEERING CO LTD 91,000 KRW 8,437,338 2.18
SAMSUNG FIRE&MARINE INSUR. 56,200 KRW 11,551,067 2.98
SHINHAN FINANCIAL GROUP 195,000 KRW 10,182,315 2.63
SHINSEGAE CO LTD 11,500 KRW 7,247,760 1.87
SK CORPORATION 41,700 KRW 5,917,439 1.53
STX PAN OCEAN CO LTD 1,730,000 KRW 3,756,695 0.97
Description Quantity Currency Evaluation % netassets
YUHAN CORP 18,651 KRW 3,503,777 0.90 ______________________
370,539,148 95.54 ______________________ TOTAL SHARES 370,539,148 95.54 ______________________ TOTAL TRANSFERABLE SECURITIES ADMITTED TO AN OFFICIAL STOCK EXCHANGE LISTING 370,539,148 95.54 ______________________ TOTAL INVESTMENTS 370,539,148 95.54 ______________________
OTHER NET ASSETS LESS LIABILITIES 17,312,123 4.46 ______________________ TOTAL NET ASSETS 387,851,271 100.00 ______________________
HSBC Global Investment Funds 159
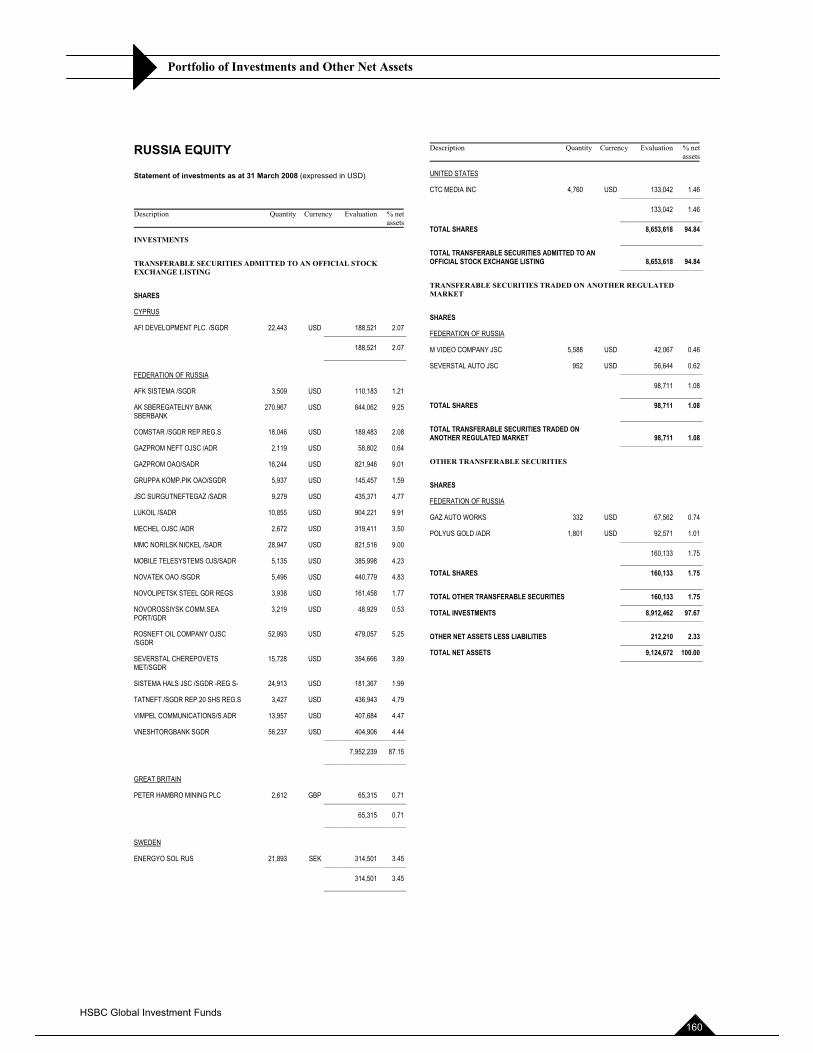
Portfolio of Investments and Other Net Assets
RUSSIA EQUITY
Statement of investments as at 31 March 2008 (expressed in USD)
Description Quantity Currency Evaluation % netassets
INVESTMENTS
TRANSFERABLE SECURITIES ADMITTED TO AN OFFICIAL STOCK EXCHANGE LISTING
SHARES
CYPRUS
AFI DEVELOPMENT PLC /SGDR 22,443 USD 188,521 2.07 ______________________
188,521 2.07 ______________________
FEDERATION OF RUSSIA
AFK SISTEMA /SGDR 3,509 USD 110,183 1.21
AK SBEREGATELNY BANK SBERBANK
270,967 USD 844,062 9.25
COMSTAR /SGDR REP.REG.S 18,046 USD 189,483 2.08
GAZPROM NEFT OJSC /ADR 2,119 USD 58,802 0.64
GAZPROM OAO/SADR 16,244 USD 821,946 9.01
GRUPPA KOMP.PIK OAO/SGDR 5,937 USD 145,457 1.59
JSC SURGUTNEFTEGAZ /SADR 9,279 USD 435,371 4.77
LUKOIL /SADR 10,855 USD 904,221 9.91
MECHEL OJSC /ADR 2,672 USD 319,411 3.50
MMC NORILSK NICKEL /SADR 28,947 USD 821,516 9.00
MOBILE TELESYSTEMS OJS/SADR 5,135 USD 385,998 4.23
NOVATEK OAO /SGDR 5,496 USD 440,779 4.83
NOVOLIPETSK STEEL GDR REGS 3,938 USD 161,458 1.77
NOVOROSSIYSK COMM.SEA PORT/GDR
3,219 USD 48,929 0.53
ROSNEFT OIL COMPANY OJSC /SGDR
52,993 USD 479,057 5.25
SEVERSTAL CHEREPOVETS MET/SGDR
15,728 USD 354,666 3.89
SISTEMA HALS JSC /SGDR -REG S- 24,913 USD 181,367 1.99
TATNEFT /SGDR REP.20 SHS REG.S 3,427 USD 436,943 4.79
VIMPEL COMMUNICATIONS/S.ADR 13,957 USD 407,684 4.47
VNESHTORGBANK SGDR 56,237 USD 404,906 4.44 ______________________
7,952,239 87.15 ______________________
GREAT BRITAIN
PETER HAMBRO MINING PLC 2,612 GBP 65,315 0.71 ______________________
65,315 0.71 ______________________
SWEDEN
ENERGYO SOL RUS 21,893 SEK 314,501 3.45 ______________________
314,501 3.45 ______________________
Description Quantity Currency Evaluation % netassets
UNITED STATES
CTC MEDIA INC 4,760 USD 133,042 1.46 ______________________
133,042 1.46 ______________________ TOTAL SHARES 8,653,618 94.84 ______________________ TOTAL TRANSFERABLE SECURITIES ADMITTED TO AN OFFICIAL STOCK EXCHANGE LISTING 8,653,618 94.84 ______________________
TRANSFERABLE SECURITIES TRADED ON ANOTHER REGULATED MARKET
SHARES
FEDERATION OF RUSSIA
M VIDEO COMPANY JSC 5,588 USD 42,067 0.46
SEVERSTAL AUTO JSC 952 USD 56,644 0.62 ______________________
98,711 1.08 ______________________ TOTAL SHARES 98,711 1.08 ______________________ TOTAL TRANSFERABLE SECURITIES TRADED ON ANOTHER REGULATED MARKET 98,711 1.08 ______________________
OTHER TRANSFERABLE SECURITIES
SHARES
FEDERATION OF RUSSIA
GAZ AUTO WORKS 332 USD 67,562 0.74
POLYUS GOLD /ADR 1,801 USD 92,571 1.01 ______________________
160,133 1.75 ______________________ TOTAL SHARES 160,133 1.75 ______________________ TOTAL OTHER TRANSFERABLE SECURITIES 160,133 1.75 ______________________ TOTAL INVESTMENTS 8,912,462 97.67 ______________________
OTHER NET ASSETS LESS LIABILITIES 212,210 2.33 ______________________ TOTAL NET ASSETS 9,124,672 100.00 ______________________
HSBC Global Investment Funds 160
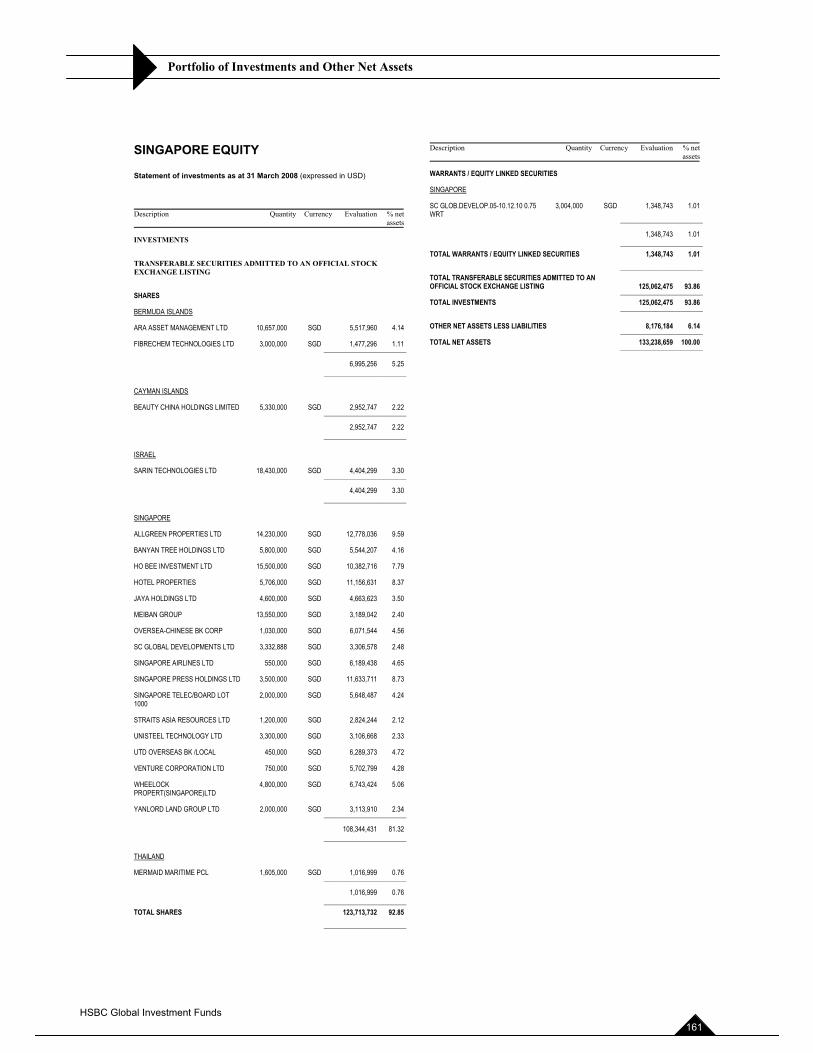
Portfolio of Investments and Other Net Assets
SINGAPORE EQUITY
Statement of investments as at 31 March 2008 (expressed in USD)
Description Quantity Currency Evaluation % netassets
INVESTMENTS
TRANSFERABLE SECURITIES ADMITTED TO AN OFFICIAL STOCK EXCHANGE LISTING
SHARES
BERMUDA ISLANDS
ARA ASSET MANAGEMENT LTD 10,657,000 SGD 5,517,960 4.14
FIBRECHEM TECHNOLOGIES LTD 3,000,000 SGD 1,477,296 1.11 ______________________
6,995,256 5.25 ______________________
CAYMAN ISLANDS
BEAUTY CHINA HOLDINGS LIMITED 5,330,000 SGD 2,952,747 2.22 ______________________
2,952,747 2.22 ______________________
ISRAEL
SARIN TECHNOLOGIES LTD 18,430,000 SGD 4,404,299 3.30 ______________________
4,404,299 3.30 ______________________
SINGAPORE
ALLGREEN PROPERTIES LTD 14,230,000 SGD 12,778,036 9.59
BANYAN TREE HOLDINGS LTD 5,800,000 SGD 5,544,207 4.16
HO BEE INVESTMENT LTD 15,500,000 SGD 10,382,716 7.79
HOTEL PROPERTIES 5,706,000 SGD 11,156,631 8.37
JAYA HOLDINGS LTD 4,600,000 SGD 4,663,623 3.50
MEIBAN GROUP 13,550,000 SGD 3,189,042 2.40
OVERSEA-CHINESE BK CORP 1,030,000 SGD 6,071,544 4.56
SC GLOBAL DEVELOPMENTS LTD 3,332,888 SGD 3,306,578 2.48
SINGAPORE AIRLINES LTD 550,000 SGD 6,189,438 4.65
SINGAPORE PRESS HOLDINGS LTD 3,500,000 SGD 11,633,711 8.73
SINGAPORE TELEC/BOARD LOT 1000
2,000,000 SGD 5,648,487 4.24
STRAITS ASIA RESOURCES LTD 1,200,000 SGD 2,824,244 2.12
UNISTEEL TECHNOLOGY LTD 3,300,000 SGD 3,106,668 2.33
UTD OVERSEAS BK /LOCAL 450,000 SGD 6,289,373 4.72
VENTURE CORPORATION LTD 750,000 SGD 5,702,799 4.28
WHEELOCK PROPERT(SINGAPORE)LTD
4,800,000 SGD 6,743,424 5.06
YANLORD LAND GROUP LTD 2,000,000 SGD 3,113,910 2.34 ______________________
108,344,431 81.32 ______________________
THAILAND
MERMAID MARITIME PCL 1,605,000 SGD 1,016,999 0.76 ______________________
1,016,999 0.76 ______________________ TOTAL SHARES 123,713,732 92.85 ______________________
Description Quantity Currency Evaluation % netassets
WARRANTS / EQUITY LINKED SECURITIES
SINGAPORE
SC GLOB.DEVELOP.05-10.12.10 0.75 WRT ______________________
3,004,000 SGD 1,348,743 1.01
1,348,743 1.01 ______________________ TOTAL WARRANTS / EQUITY LINKED SECURITIES 1,348,743 1.01 ______________________ TOTAL TRANSFERABLE SECURITIES ADMITTED TO AN OFFICIAL STOCK EXCHANGE LISTING 125,062,475 93.86 ______________________ TOTAL INVESTMENTS 125,062,475 93.86 ______________________
OTHER NET ASSETS LESS LIABILITIES 8,176,184 6.14 ______________________ TOTAL NET ASSETS 133,238,659 100.00 ______________________
HSBC Global Investment Funds 161
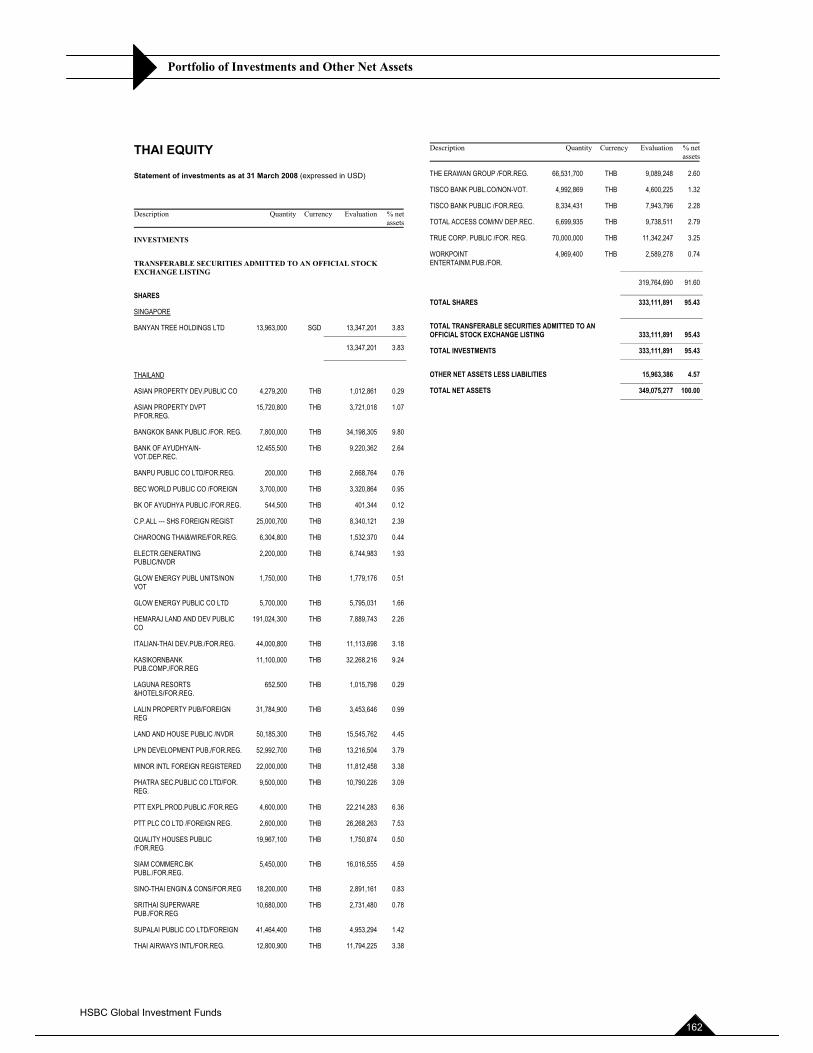
Portfolio of Investments and Other Net Assets
THAI EQUITY
Statement of investments as at 31 March 2008 (expressed in USD)
Description Quantity Currency Evaluation % netassets
INVESTMENTS
TRANSFERABLE SECURITIES ADMITTED TO AN OFFICIAL STOCK EXCHANGE LISTING
SHARES
SINGAPORE
BANYAN TREE HOLDINGS LTD 13,963,000 SGD 13,347,201 3.83 ______________________
13,347,201 3.83 ______________________
THAILAND
ASIAN PROPERTY DEV.PUBLIC CO 4,279,200 THB 1,012,861 0.29
ASIAN PROPERTY DVPT P/FOR.REG.
15,720,800 THB 3,721,018 1.07
BANGKOK BANK PUBLIC /FOR. REG. 7,800,000 THB 34,198,305 9.80
BANK OF AYUDHYA/N-VOT.DEP.REC.
12,455,500 THB 9,220,362 2.64
BANPU PUBLIC CO LTD/FOR.REG. 200,000 THB 2,668,764 0.76
BEC WORLD PUBLIC CO /FOREIGN 3,700,000 THB 3,320,864 0.95
BK OF AYUDHYA PUBLIC /FOR.REG. 544,500 THB 401,344 0.12
C.P.ALL --- SHS FOREIGN REGIST 25,000,700 THB 8,340,121 2.39
CHAROONG THAI&WIRE/FOR.REG. 6,304,800 THB 1,532,370 0.44
ELECTR.GENERATING PUBLIC/NVDR
2,200,000 THB 6,744,983 1.93
GLOW ENERGY PUBL UNITS/NON VOT
1,750,000 THB 1,779,176 0.51
GLOW ENERGY PUBLIC CO LTD 5,700,000 THB 5,795,031 1.66
HEMARAJ LAND AND DEV PUBLIC CO
191,024,300 THB 7,889,743 2.26
ITALIAN-THAI DEV.PUB./FOR.REG. 44,000,800 THB 11,113,698 3.18
KASIKORNBANK PUB.COMP./FOR.REG
11,100,000 THB 32,268,216 9.24
LAGUNA RESORTS &HOTELS/FOR.REG.
652,500 THB 1,015,798 0.29
LALIN PROPERTY PUB/FOREIGN REG
31,784,900 THB 3,453,646 0.99
LAND AND HOUSE PUBLIC /NVDR 50,185,300 THB 15,545,762 4.45
LPN DEVELOPMENT PUB./FOR.REG. 52,992,700 THB 13,216,504 3.79
MINOR INTL FOREIGN REGISTERED 22,000,000 THB 11,812,458 3.38
PHATRA SEC.PUBLIC CO LTD/FOR. REG.
9,500,000 THB 10,790,226 3.09
PTT EXPL.PROD.PUBLIC /FOR.REG 4,600,000 THB 22,214,283 6.36
PTT PLC CO LTD /FOREIGN REG. 2,600,000 THB 26,268,263 7.53
QUALITY HOUSES PUBLIC /FOR.REG
19,967,100 THB 1,750,874 0.50
SIAM COMMERC.BK PUBL./FOR.REG.
5,450,000 THB 16,016,555 4.59
SINO-THAI ENGIN.& CONS/FOR.REG 18,200,000 THB 2,891,161 0.83
SRITHAI SUPERWARE PUB./FOR.REG
10,680,000 THB 2,731,480 0.78
SUPALAI PUBLIC CO LTD/FOREIGN 41,464,400 THB 4,953,294 1.42
THAI AIRWAYS INTL/FOR.REG. 12,800,900 THB 11,794,225 3.38
Description Quantity Currency Evaluation % netassets
THE ERAWAN GROUP /FOR.REG. 66,531,700 THB 9,089,248 2.60
TISCO BANK PUBL.CO/NON-VOT. 4,992,869 THB 4,600,225 1.32
TISCO BANK PUBLIC /FOR.REG. 8,334,431 THB 7,943,796 2.28
TOTAL ACCESS COM/NV DEP.REC. 6,699,935 THB 9,738,511 2.79
TRUE CORP. PUBLIC /FOR. REG. 70,000,000 THB 11,342,247 3.25
WORKPOINT ENTERTAINM.PUB./FOR.
4,969,400 THB 2,589,278 0.74
______________________
319,764,690 91.60 ______________________ TOTAL SHARES 333,111,891 95.43 ______________________ TOTAL TRANSFERABLE SECURITIES ADMITTED TO AN OFFICIAL STOCK EXCHANGE LISTING 333,111,891 95.43 ______________________ TOTAL INVESTMENTS 333,111,891 95.43 ______________________
OTHER NET ASSETS LESS LIABILITIES 15,963,386 4.57 ______________________ TOTAL NET ASSETS 349,075,277 100.00 ______________________
HSBC Global Investment Funds 162
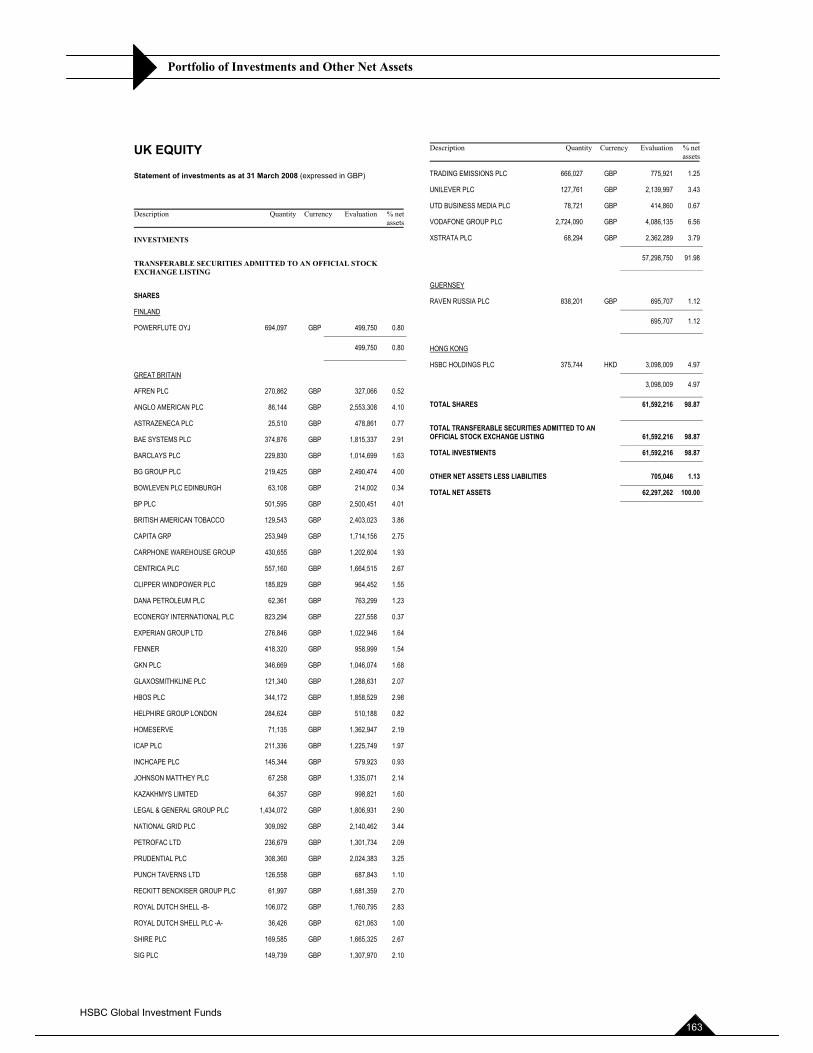
Portfolio of Investments and Other Net Assets
UK EQUITY
Statement of investments as at 31 March 2008 (expressed in GBP)
Description Quantity Currency Evaluation % netassets
INVESTMENTS
TRANSFERABLE SECURITIES ADMITTED TO AN OFFICIAL STOCK EXCHANGE LISTING
SHARES
FINLAND
POWERFLUTE OYJ 694,097 GBP 499,750 0.80 ______________________
499,750 0.80 ______________________
GREAT BRITAIN
AFREN PLC 270,862 GBP 327,066 0.52
ANGLO AMERICAN PLC 86,144 GBP 2,553,308 4.10
ASTRAZENECA PLC 25,510 GBP 478,861 0.77
BAE SYSTEMS PLC 374,876 GBP 1,815,337 2.91
BARCLAYS PLC 229,830 GBP 1,014,699 1.63
BG GROUP PLC 219,425 GBP 2,490,474 4.00
BOWLEVEN PLC EDINBURGH 63,108 GBP 214,002 0.34
BP PLC 501,595 GBP 2,500,451 4.01
BRITISH AMERICAN TOBACCO 129,543 GBP 2,403,023 3.86
CAPITA GRP 253,949 GBP 1,714,156 2.75
CARPHONE WAREHOUSE GROUP 430,655 GBP 1,202,604 1.93
CENTRICA PLC 557,160 GBP 1,664,515 2.67
CLIPPER WINDPOWER PLC 185,829 GBP 964,452 1.55
DANA PETROLEUM PLC 62,361 GBP 763,299 1.23
ECONERGY INTERNATIONAL PLC 823,294 GBP 227,558 0.37
EXPERIAN GROUP LTD 276,846 GBP 1,022,946 1.64
FENNER 418,320 GBP 958,999 1.54
GKN PLC 346,669 GBP 1,046,074 1.68
GLAXOSMITHKLINE PLC 121,340 GBP 1,288,631 2.07
HBOS PLC 344,172 GBP 1,858,529 2.98
HELPHIRE GROUP LONDON 284,624 GBP 510,188 0.82
HOMESERVE 71,135 GBP 1,362,947 2.19
ICAP PLC 211,336 GBP 1,225,749 1.97
INCHCAPE PLC 145,344 GBP 579,923 0.93
JOHNSON MATTHEY PLC 67,258 GBP 1,335,071 2.14
KAZAKHMYS LIMITED 64,357 GBP 998,821 1.60
LEGAL & GENERAL GROUP PLC 1,434,072 GBP 1,806,931 2.90
NATIONAL GRID PLC 309,092 GBP 2,140,462 3.44
PETROFAC LTD 236,679 GBP 1,301,734 2.09
PRUDENTIAL PLC 308,360 GBP 2,024,383 3.25
PUNCH TAVERNS LTD 126,558 GBP 687,843 1.10
RECKITT BENCKISER GROUP PLC 61,997 GBP 1,681,359 2.70
ROYAL DUTCH SHELL -B- 106,072 GBP 1,760,795 2.83
ROYAL DUTCH SHELL PLC -A- 36,426 GBP 621,063 1.00
SHIRE PLC 169,585 GBP 1,665,325 2.67
SIG PLC 149,739 GBP 1,307,970 2.10
Description Quantity Currency Evaluation % netassets
TRADING EMISSIONS PLC 666,027 GBP 775,921 1.25
UNILEVER PLC 127,761 GBP 2,139,997 3.43
UTD BUSINESS MEDIA PLC 78,721 GBP 414,860 0.67
VODAFONE GROUP PLC 2,724,090 GBP 4,086,135 6.56
XSTRATA PLC 68,294 GBP 2,362,289 3.79 ______________________
57,298,750 91.98 ______________________
GUERNSEY
RAVEN RUSSIA PLC 838,201 GBP 695,707 1.12 ______________________
695,707 1.12 ______________________
HONG KONG
HSBC HOLDINGS PLC 375,744 HKD 3,098,009 4.97 ______________________
3,098,009 4.97 ______________________ TOTAL SHARES 61,592,216 98.87 ______________________ TOTAL TRANSFERABLE SECURITIES ADMITTED TO AN OFFICIAL STOCK EXCHANGE LISTING 61,592,216 98.87 ______________________ TOTAL INVESTMENTS 61,592,216 98.87 ______________________
OTHER NET ASSETS LESS LIABILITIES 705,046 1.13 ______________________ TOTAL NET ASSETS 62,297,262 100.00 ______________________
HSBC Global Investment Funds 163
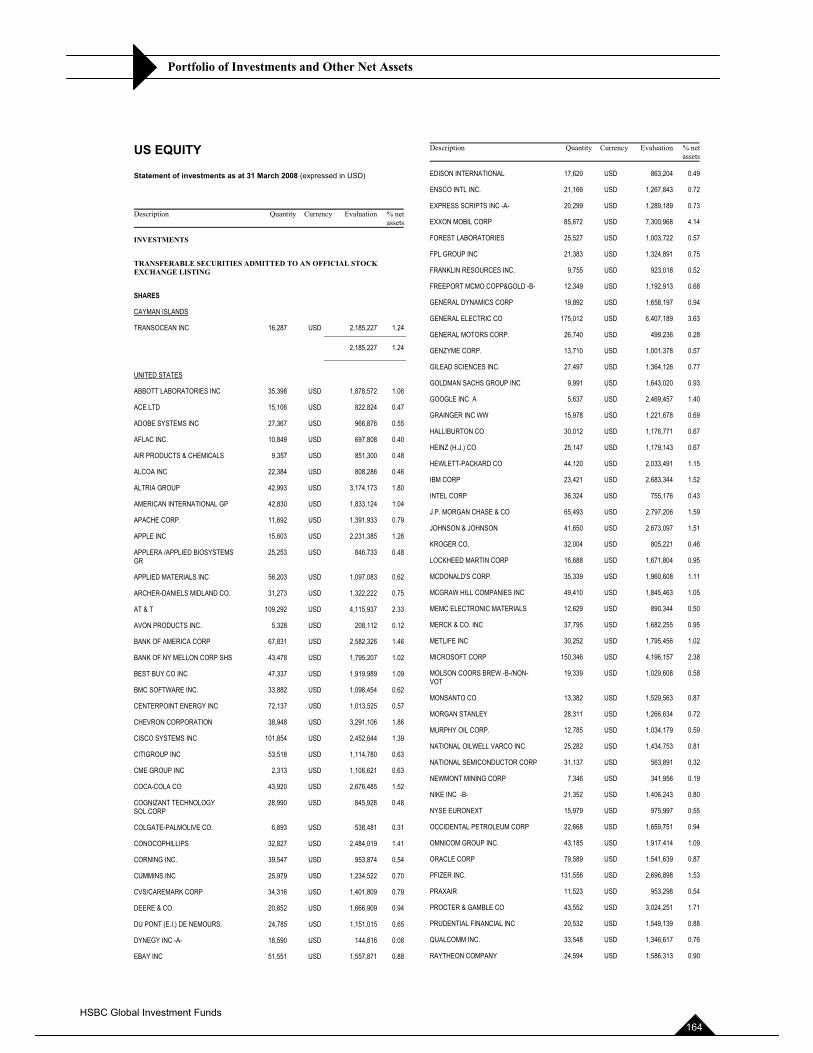
Portfolio of Investments and Other Net Assets
US EQUITY
Statement of investments as at 31 March 2008 (expressed in USD)
Description Quantity Currency Evaluation % netassets
INVESTMENTS
TRANSFERABLE SECURITIES ADMITTED TO AN OFFICIAL STOCK EXCHANGE LISTING
SHARES
CAYMAN ISLANDS
TRANSOCEAN INC 16,287 USD 2,185,227 1.24 ______________________
2,185,227 1.24 ______________________
UNITED STATES
ABBOTT LABORATORIES INC 35,398 USD 1,878,572 1.06
ACE LTD 15,106 USD 822,824 0.47
ADOBE SYSTEMS INC 27,367 USD 966,876 0.55
AFLAC INC. 10,849 USD 697,808 0.40
AIR PRODUCTS & CHEMICALS 9,357 USD 851,300 0.48
ALCOA INC 22,384 USD 808,286 0.46
ALTRIA GROUP 42,993 USD 3,174,173 1.80
AMERICAN INTERNATIONAL GP 42,830 USD 1,833,124 1.04
APACHE CORP. 11,692 USD 1,391,933 0.79
APPLE INC 15,603 USD 2,231,385 1.26
APPLERA /APPLIED BIOSYSTEMS GR
25,253 USD 846,733 0.48
APPLIED MATERIALS INC 56,203 USD 1,097,083 0.62
ARCHER-DANIELS MIDLAND CO. 31,273 USD 1,322,222 0.75
AT & T 109,292 USD 4,115,937 2.33
AVON PRODUCTS INC. 5,328 USD 208,112 0.12
BANK OF AMERICA CORP 67,831 USD 2,582,326 1.46
BANK OF NY MELLON CORP SHS 43,478 USD 1,795,207 1.02
BEST BUY CO INC 47,337 USD 1,919,989 1.09
BMC SOFTWARE INC. 33,882 USD 1,098,454 0.62
CENTERPOINT ENERGY INC 72,137 USD 1,013,525 0.57
CHEVRON CORPORATION 38,948 USD 3,291,106 1.86
CISCO SYSTEMS INC 101,854 USD 2,452,644 1.39
CITIGROUP INC 53,518 USD 1,114,780 0.63
CME GROUP INC 2,313 USD 1,108,621 0.63
COCA-COLA CO 43,920 USD 2,676,485 1.52
COGNIZANT TECHNOLOGY SOL.CORP
28,990 USD 845,928 0.48
COLGATE-PALMOLIVE CO. 6,893 USD 538,481 0.31
CONOCOPHILLIPS 32,827 USD 2,484,019 1.41
CORNING INC. 39,547 USD 953,874 0.54
CUMMINS INC 25,979 USD 1,234,522 0.70
CVS/CAREMARK CORP 34,316 USD 1,401,809 0.79
DEERE & CO. 20,852 USD 1,666,909 0.94
DU PONT (E.I.) DE NEMOURS. 24,785 USD 1,151,015 0.65
DYNEGY INC -A- 18,590 USD 144,816 0.08
EBAY INC 51,551 USD 1,557,871 0.88
Description Quantity Currency Evaluation % netassets
EDISON INTERNATIONAL 17,620 USD 863,204 0.49
ENSCO INTL INC. 21,166 USD 1,267,843 0.72
EXPRESS SCRIPTS INC -A- 20,299 USD 1,289,189 0.73
EXXON MOBIL CORP 85,672 USD 7,300,968 4.14
FOREST LABORATORIES 25,527 USD 1,003,722 0.57
FPL GROUP INC 21,383 USD 1,324,891 0.75
FRANKLIN RESOURCES INC. 9,755 USD 923,018 0.52
FREEPORT MCMO.COPP&GOLD -B- 12,349 USD 1,192,913 0.68
GENERAL DYNAMICS CORP 19,892 USD 1,658,197 0.94
GENERAL ELECTRIC CO 175,012 USD 6,407,189 3.63
GENERAL MOTORS CORP. 26,740 USD 499,236 0.28
GENZYME CORP. 13,710 USD 1,001,378 0.57
GILEAD SCIENCES INC. 27,497 USD 1,364,126 0.77
GOLDMAN SACHS GROUP INC 9,991 USD 1,643,020 0.93
GOOGLE INC A 5,637 USD 2,469,457 1.40
GRAINGER INC WW 15,978 USD 1,221,678 0.69
HALLIBURTON CO 30,012 USD 1,176,771 0.67
HEINZ (H.J.) CO 25,147 USD 1,179,143 0.67
HEWLETT-PACKARD CO 44,120 USD 2,033,491 1.15
IBM CORP 23,421 USD 2,683,344 1.52
INTEL CORP 36,324 USD 755,176 0.43
J.P. MORGAN CHASE & CO 65,493 USD 2,797,206 1.59
JOHNSON & JOHNSON 41,650 USD 2,673,097 1.51
KROGER CO. 32,004 USD 805,221 0.46
LOCKHEED MARTIN CORP 16,688 USD 1,671,804 0.95
MCDONALD'S CORP. 35,339 USD 1,960,608 1.11
MCGRAW HILL COMPANIES INC 49,410 USD 1,845,463 1.05
MEMC ELECTRONIC MATERIALS 12,629 USD 890,344 0.50
MERCK & CO. INC 37,795 USD 1,682,255 0.95
METLIFE INC 30,252 USD 1,795,456 1.02
MICROSOFT CORP 150,346 USD 4,196,157 2.38
MOLSON COORS BREW.-B-/NON-VOT
19,339 USD 1,029,608 0.58
MONSANTO CO 13,382 USD 1,529,563 0.87
MORGAN STANLEY 28,311 USD 1,266,634 0.72
MURPHY OIL CORP. 12,785 USD 1,034,179 0.59
NATIONAL OILWELL VARCO INC 25,282 USD 1,434,753 0.81
NATIONAL SEMICONDUCTOR CORP 31,137 USD 563,891 0.32
NEWMONT MINING CORP 7,346 USD 341,956 0.19
NIKE INC -B- 21,352 USD 1,406,243 0.80
NYSE EURONEXT 15,979 USD 975,997 0.55
OCCIDENTAL PETROLEUM CORP 22,668 USD 1,659,751 0.94
OMNICOM GROUP INC. 43,185 USD 1,917,414 1.09
ORACLE CORP 79,589 USD 1,541,639 0.87
PFIZER INC. 131,556 USD 2,696,898 1.53
PRAXAIR 11,523 USD 953,298 0.54
PROCTER & GAMBLE CO 43,552 USD 3,024,251 1.71
PRUDENTIAL FINANCIAL INC 20,532 USD 1,549,139 0.88
QUALCOMM INC. 33,548 USD 1,346,617 0.76
RAYTHEON COMPANY 24,594 USD 1,586,313 0.90
HSBC Global Investment Funds 164
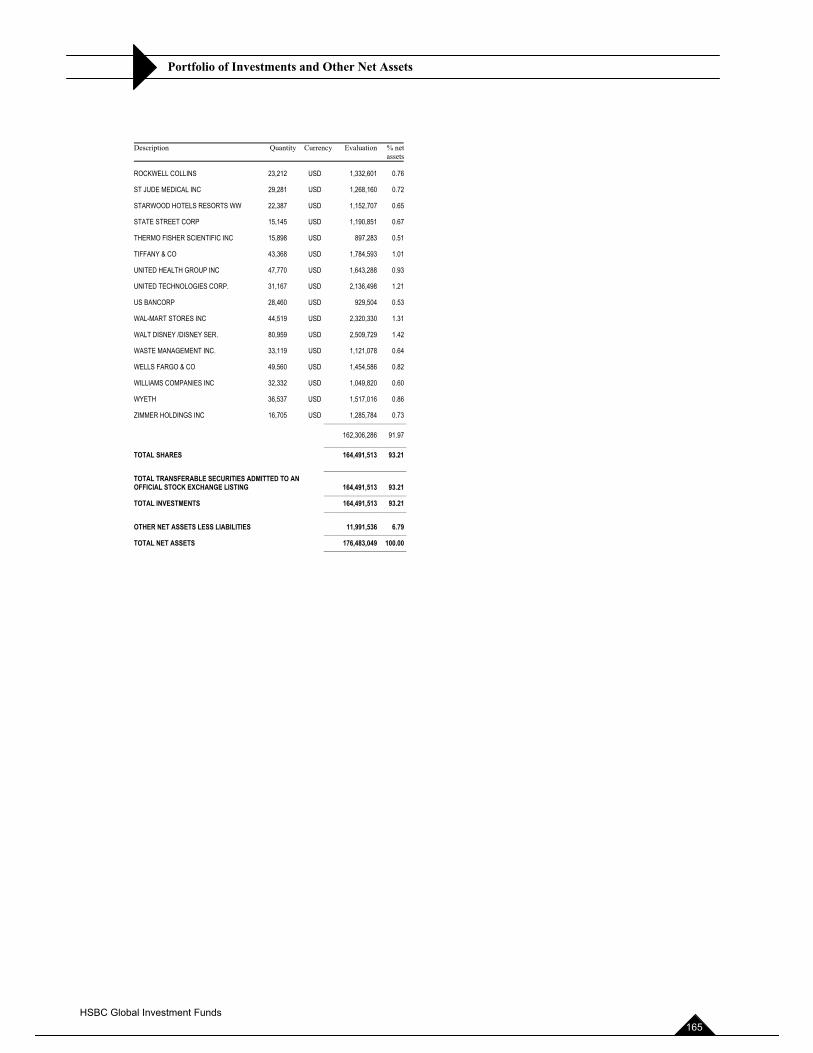
Portfolio of Investments and Other Net Assets
Description Quantity Currency Evaluation % netassets
ROCKWELL COLLINS 23,212 USD 1,332,601 0.76
ST JUDE MEDICAL INC 29,281 USD 1,268,160 0.72
STARWOOD HOTELS RESORTS WW 22,387 USD 1,152,707 0.65
STATE STREET CORP 15,145 USD 1,190,851 0.67
THERMO FISHER SCIENTIFIC INC 15,898 USD 897,283 0.51
TIFFANY & CO 43,368 USD 1,784,593 1.01
UNITED HEALTH GROUP INC 47,770 USD 1,643,288 0.93
UNITED TECHNOLOGIES CORP. 31,167 USD 2,136,498 1.21
US BANCORP 28,460 USD 929,504 0.53
WAL-MART STORES INC 44,519 USD 2,320,330 1.31
WALT DISNEY /DISNEY SER. 80,959 USD 2,509,729 1.42
WASTE MANAGEMENT INC. 33,119 USD 1,121,078 0.64
WELLS FARGO & CO 49,560 USD 1,454,586 0.82
WILLIAMS COMPANIES INC 32,332 USD 1,049,820 0.60
WYETH 36,537 USD 1,517,016 0.86
ZIMMER HOLDINGS INC 16,705 USD 1,285,784 0.73 ______________________
162,306,286 91.97 ______________________ TOTAL SHARES 164,491,513 93.21 ______________________ TOTAL TRANSFERABLE SECURITIES ADMITTED TO AN OFFICIAL STOCK EXCHANGE LISTING 164,491,513 93.21 ______________________ TOTAL INVESTMENTS 164,491,513 93.21 ______________________
OTHER NET ASSETS LESS LIABILITIES 11,991,536 6.79 ______________________ TOTAL NET ASSETS 176,483,049 100.00 ______________________
HSBC Global Investment Funds 165
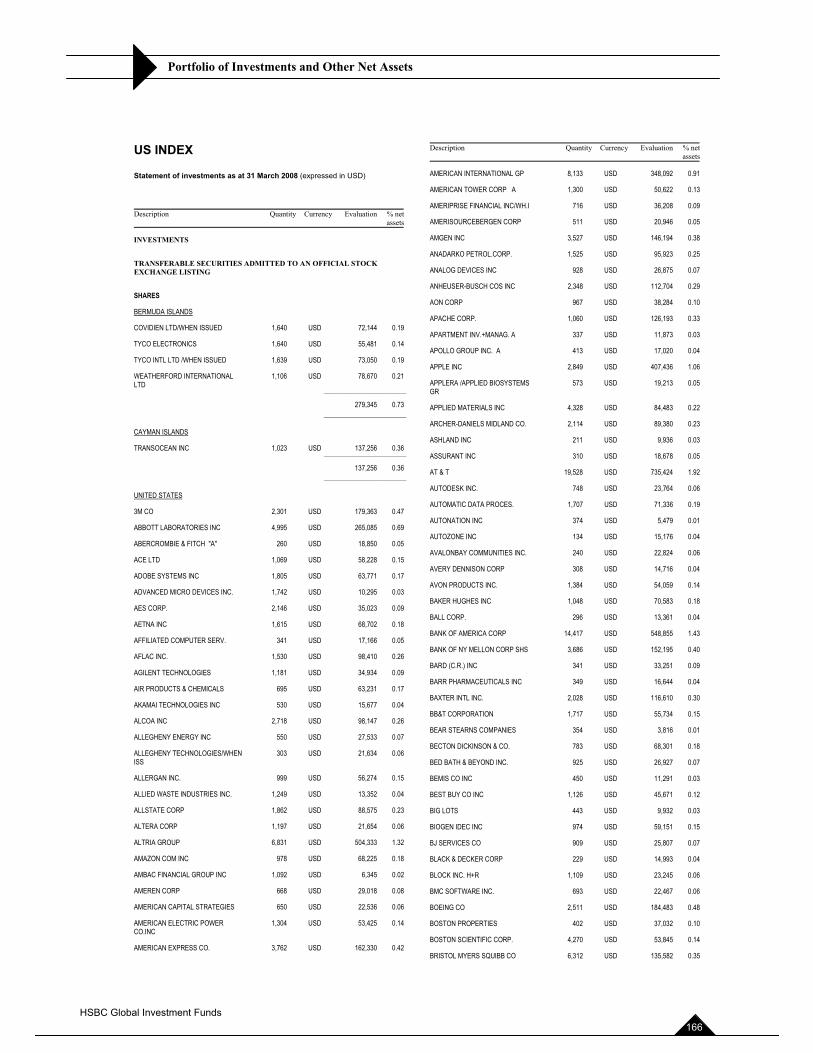
Portfolio of Investments and Other Net Assets
US INDEX
Statement of investments as at 31 March 2008 (expressed in USD)
Description Quantity Currency Evaluation % netassets
INVESTMENTS
TRANSFERABLE SECURITIES ADMITTED TO AN OFFICIAL STOCK EXCHANGE LISTING
SHARES
BERMUDA ISLANDS
COVIDIEN LTD/WHEN ISSUED 1,640 USD 72,144 0.19
TYCO ELECTRONICS 1,640 USD 55,481 0.14
TYCO INTL LTD /WHEN ISSUED 1,639 USD 73,050 0.19
WEATHERFORD INTERNATIONAL LTD ______________________
1,106 USD 78,670 0.21
279,345 0.73 ______________________
CAYMAN ISLANDS
TRANSOCEAN INC 1,023 USD 137,256 0.36 ______________________
137,256 0.36 ______________________
UNITED STATES
3M CO 2,301 USD 179,363 0.47
ABBOTT LABORATORIES INC 4,995 USD 265,085 0.69
ABERCROMBIE & FITCH "A" 260 USD 18,850 0.05
ACE LTD 1,069 USD 58,228 0.15
ADOBE SYSTEMS INC 1,805 USD 63,771 0.17
ADVANCED MICRO DEVICES INC. 1,742 USD 10,295 0.03
AES CORP. 2,146 USD 35,023 0.09
AETNA INC 1,615 USD 68,702 0.18
AFFILIATED COMPUTER SERV. 341 USD 17,166 0.05
AFLAC INC. 1,530 USD 98,410 0.26
AGILENT TECHNOLOGIES 1,181 USD 34,934 0.09
AIR PRODUCTS & CHEMICALS 695 USD 63,231 0.17
AKAMAI TECHNOLOGIES INC 530 USD 15,677 0.04
ALCOA INC 2,718 USD 98,147 0.26
ALLEGHENY ENERGY INC 550 USD 27,533 0.07
ALLEGHENY TECHNOLOGIES/WHENISS
303 USD 21,634 0.06
ALLERGAN INC. 999 USD 56,274 0.15
ALLIED WASTE INDUSTRIES INC. 1,249 USD 13,352 0.04
ALLSTATE CORP 1,862 USD 88,575 0.23
ALTERA CORP 1,197 USD 21,654 0.06
ALTRIA GROUP 6,831 USD 504,333 1.32
AMAZON COM INC 978 USD 68,225 0.18
AMBAC FINANCIAL GROUP INC 1,092 USD 6,345 0.02
AMEREN CORP 668 USD 29,018 0.08
AMERICAN CAPITAL STRATEGIES 650 USD 22,536 0.06
AMERICAN ELECTRIC POWER CO.INC
1,304 USD 53,425 0.14
AMERICAN EXPRESS CO. 3,762 USD 162,330 0.42
Description Quantity Currency Evaluation % netassets
AMERICAN INTERNATIONAL GP 8,133 USD 348,092 0.91
AMERICAN TOWER CORP A 1,300 USD 50,622 0.13
AMERIPRISE FINANCIAL INC/WH.I 716 USD 36,208 0.09
AMERISOURCEBERGEN CORP 511 USD 20,946 0.05
AMGEN INC 3,527 USD 146,194 0.38
ANADARKO PETROL.CORP. 1,525 USD 95,923 0.25
ANALOG DEVICES INC 928 USD 26,875 0.07
ANHEUSER-BUSCH COS INC 2,348 USD 112,704 0.29
AON CORP 967 USD 38,284 0.10
APACHE CORP. 1,060 USD 126,193 0.33
APARTMENT INV.+MANAG. A 337 USD 11,873 0.03
APOLLO GROUP INC. A 413 USD 17,020 0.04
APPLE INC 2,849 USD 407,436 1.06
APPLERA /APPLIED BIOSYSTEMS GR
573 USD 19,213 0.05
APPLIED MATERIALS INC 4,328 USD 84,483 0.22
ARCHER-DANIELS MIDLAND CO. 2,114 USD 89,380 0.23
ASHLAND INC 211 USD 9,936 0.03
ASSURANT INC 310 USD 18,678 0.05
AT & T 19,528 USD 735,424 1.92
AUTODESK INC. 748 USD 23,764 0.06
AUTOMATIC DATA PROCES. 1,707 USD 71,336 0.19
AUTONATION INC 374 USD 5,479 0.01
AUTOZONE INC 134 USD 15,176 0.04
AVALONBAY COMMUNITIES INC. 240 USD 22,824 0.06
AVERY DENNISON CORP 308 USD 14,716 0.04
AVON PRODUCTS INC. 1,384 USD 54,059 0.14
BAKER HUGHES INC 1,048 USD 70,583 0.18
BALL CORP. 296 USD 13,361 0.04
BANK OF AMERICA CORP 14,417 USD 548,855 1.43
BANK OF NY MELLON CORP SHS 3,686 USD 152,195 0.40
BARD (C.R.) INC 341 USD 33,251 0.09
BARR PHARMACEUTICALS INC 349 USD 16,644 0.04
BAXTER INTL INC. 2,028 USD 116,610 0.30
BB&T CORPORATION 1,717 USD 55,734 0.15
BEAR STEARNS COMPANIES 354 USD 3,816 0.01
BECTON DICKINSON & CO. 783 USD 68,301 0.18
BED BATH & BEYOND INC. 925 USD 26,927 0.07
BEMIS CO INC 450 USD 11,291 0.03
BEST BUY CO INC 1,126 USD 45,671 0.12
BIG LOTS 443 USD 9,932 0.03
BIOGEN IDEC INC 974 USD 59,151 0.15
BJ SERVICES CO 909 USD 25,807 0.07
BLACK & DECKER CORP 229 USD 14,993 0.04
BLOCK INC. H+R 1,109 USD 23,245 0.06
BMC SOFTWARE INC. 693 USD 22,467 0.06
BOEING CO 2,511 USD 184,483 0.48
BOSTON PROPERTIES 402 USD 37,032 0.10
BOSTON SCIENTIFIC CORP. 4,270 USD 53,845 0.14
BRISTOL MYERS SQUIBB CO 6,312 USD 135,582 0.35
HSBC Global Investment Funds 166
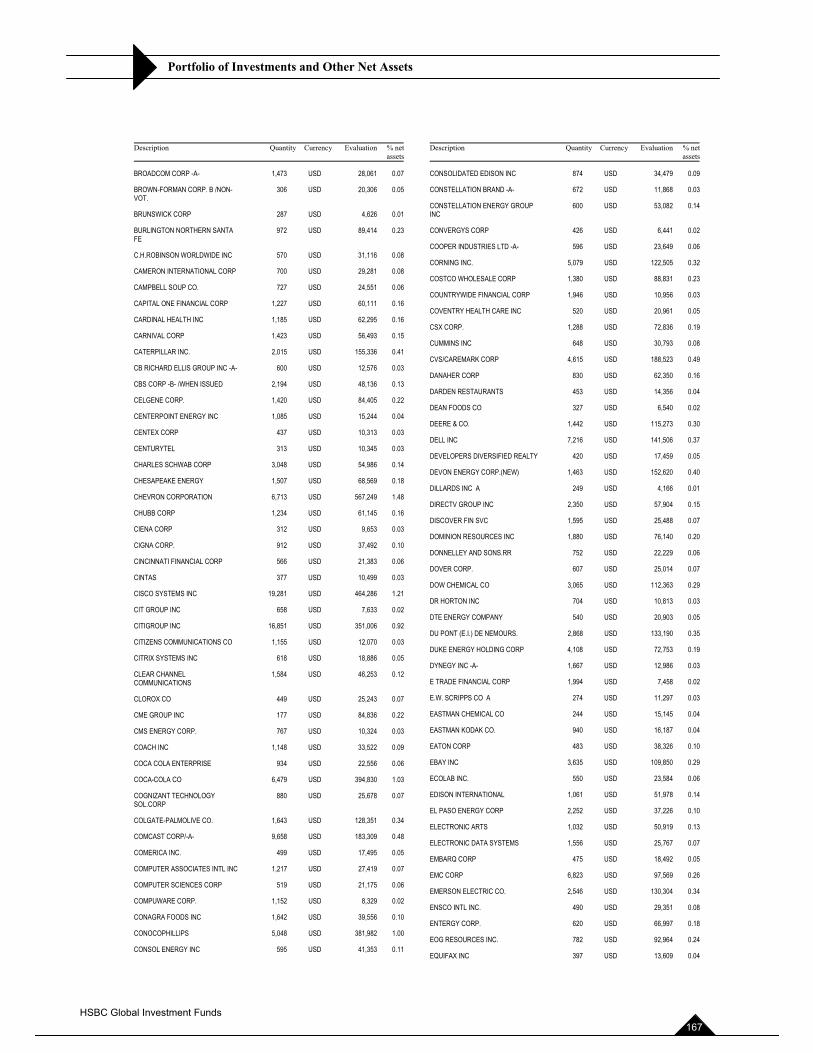
Portfolio of Investments and Other Net Assets
Description Quantity Currency Evaluation % netassets
BROADCOM CORP -A- 1,473 USD 28,061 0.07
BROWN-FORMAN CORP. B /NON-VOT.
306 USD 20,306 0.05
BRUNSWICK CORP 287 USD 4,626 0.01
BURLINGTON NORTHERN SANTA FE
972 USD 89,414 0.23
C.H.ROBINSON WORLDWIDE INC 570 USD 31,116 0.08
CAMERON INTERNATIONAL CORP 700 USD 29,281 0.08
CAMPBELL SOUP CO. 727 USD 24,551 0.06
CAPITAL ONE FINANCIAL CORP 1,227 USD 60,111 0.16
CARDINAL HEALTH INC 1,185 USD 62,295 0.16
CARNIVAL CORP 1,423 USD 56,493 0.15
CATERPILLAR INC. 2,015 USD 155,336 0.41
CB RICHARD ELLIS GROUP INC -A- 600 USD 12,576 0.03
CBS CORP -B- /WHEN ISSUED 2,194 USD 48,136 0.13
CELGENE CORP. 1,420 USD 84,405 0.22
CENTERPOINT ENERGY INC 1,085 USD 15,244 0.04
CENTEX CORP 437 USD 10,313 0.03
CENTURYTEL 313 USD 10,345 0.03
CHARLES SCHWAB CORP 3,048 USD 54,986 0.14
CHESAPEAKE ENERGY 1,507 USD 68,569 0.18
CHEVRON CORPORATION 6,713 USD 567,249 1.48
CHUBB CORP 1,234 USD 61,145 0.16
CIENA CORP 312 USD 9,653 0.03
CIGNA CORP. 912 USD 37,492 0.10
CINCINNATI FINANCIAL CORP 566 USD 21,383 0.06
CINTAS 377 USD 10,499 0.03
CISCO SYSTEMS INC 19,281 USD 464,286 1.21
CIT GROUP INC 658 USD 7,633 0.02
CITIGROUP INC 16,851 USD 351,006 0.92
CITIZENS COMMUNICATIONS CO 1,155 USD 12,070 0.03
CITRIX SYSTEMS INC 618 USD 18,886 0.05
CLEAR CHANNEL COMMUNICATIONS
1,584 USD 46,253 0.12
CLOROX CO 449 USD 25,243 0.07
CME GROUP INC 177 USD 84,836 0.22
CMS ENERGY CORP. 767 USD 10,324 0.03
COACH INC 1,148 USD 33,522 0.09
COCA COLA ENTERPRISE 934 USD 22,556 0.06
COCA-COLA CO 6,479 USD 394,830 1.03
COGNIZANT TECHNOLOGY SOL.CORP
880 USD 25,678 0.07
COLGATE-PALMOLIVE CO. 1,643 USD 128,351 0.34
COMCAST CORP/-A- 9,658 USD 183,309 0.48
COMERICA INC. 499 USD 17,495 0.05
COMPUTER ASSOCIATES INTL INC 1,217 USD 27,419 0.07
COMPUTER SCIENCES CORP 519 USD 21,175 0.06
COMPUWARE CORP. 1,152 USD 8,329 0.02
CONAGRA FOODS INC 1,642 USD 39,556 0.10
CONOCOPHILLIPS 5,048 USD 381,982 1.00
CONSOL ENERGY INC 595 USD 41,353 0.11
Description Quantity Currency Evaluation % netassets
CONSOLIDATED EDISON INC 874 USD 34,479 0.09
CONSTELLATION BRAND -A- 672 USD 11,868 0.03
CONSTELLATION ENERGY GROUP INC
600 USD 53,082 0.14
CONVERGYS CORP 426 USD 6,441 0.02
COOPER INDUSTRIES LTD -A- 596 USD 23,649 0.06
CORNING INC. 5,079 USD 122,505 0.32
COSTCO WHOLESALE CORP 1,380 USD 88,831 0.23
COUNTRYWIDE FINANCIAL CORP 1,946 USD 10,956 0.03
COVENTRY HEALTH CARE INC 520 USD 20,961 0.05
CSX CORP. 1,288 USD 72,836 0.19
CUMMINS INC 648 USD 30,793 0.08
CVS/CAREMARK CORP 4,615 USD 188,523 0.49
DANAHER CORP 830 USD 62,350 0.16
DARDEN RESTAURANTS 453 USD 14,356 0.04
DEAN FOODS CO 327 USD 6,540 0.02
DEERE & CO. 1,442 USD 115,273 0.30
DELL INC 7,216 USD 141,506 0.37
DEVELOPERS DIVERSIFIED REALTY 420 USD 17,459 0.05
DEVON ENERGY CORP.(NEW) 1,463 USD 152,620 0.40
DILLARDS INC A 249 USD 4,166 0.01
DIRECTV GROUP INC 2,350 USD 57,904 0.15
DISCOVER FIN SVC 1,595 USD 25,488 0.07
DOMINION RESOURCES INC 1,880 USD 76,140 0.20
DONNELLEY AND SONS.RR 752 USD 22,229 0.06
DOVER CORP. 607 USD 25,014 0.07
DOW CHEMICAL CO 3,065 USD 112,363 0.29
DR HORTON INC 704 USD 10,813 0.03
DTE ENERGY COMPANY 540 USD 20,903 0.05
DU PONT (E.I.) DE NEMOURS. 2,868 USD 133,190 0.35
DUKE ENERGY HOLDING CORP 4,108 USD 72,753 0.19
DYNEGY INC -A- 1,667 USD 12,986 0.03
E TRADE FINANCIAL CORP 1,994 USD 7,458 0.02
E.W. SCRIPPS CO A 274 USD 11,297 0.03
EASTMAN CHEMICAL CO 244 USD 15,145 0.04
EASTMAN KODAK CO. 940 USD 16,187 0.04
EATON CORP 483 USD 38,326 0.10
EBAY INC 3,635 USD 109,850 0.29
ECOLAB INC. 550 USD 23,584 0.06
EDISON INTERNATIONAL 1,061 USD 51,978 0.14
EL PASO ENERGY CORP 2,252 USD 37,226 0.10
ELECTRONIC ARTS 1,032 USD 50,919 0.13
ELECTRONIC DATA SYSTEMS 1,556 USD 25,767 0.07
EMBARQ CORP 475 USD 18,492 0.05
EMC CORP 6,823 USD 97,569 0.26
EMERSON ELECTRIC CO. 2,546 USD 130,304 0.34
ENSCO INTL INC. 490 USD 29,351 0.08
ENTERGY CORP. 620 USD 66,997 0.18
EOG RESOURCES INC. 782 USD 92,964 0.24
EQUIFAX INC 397 USD 13,609 0.04
HSBC Global Investment Funds 167
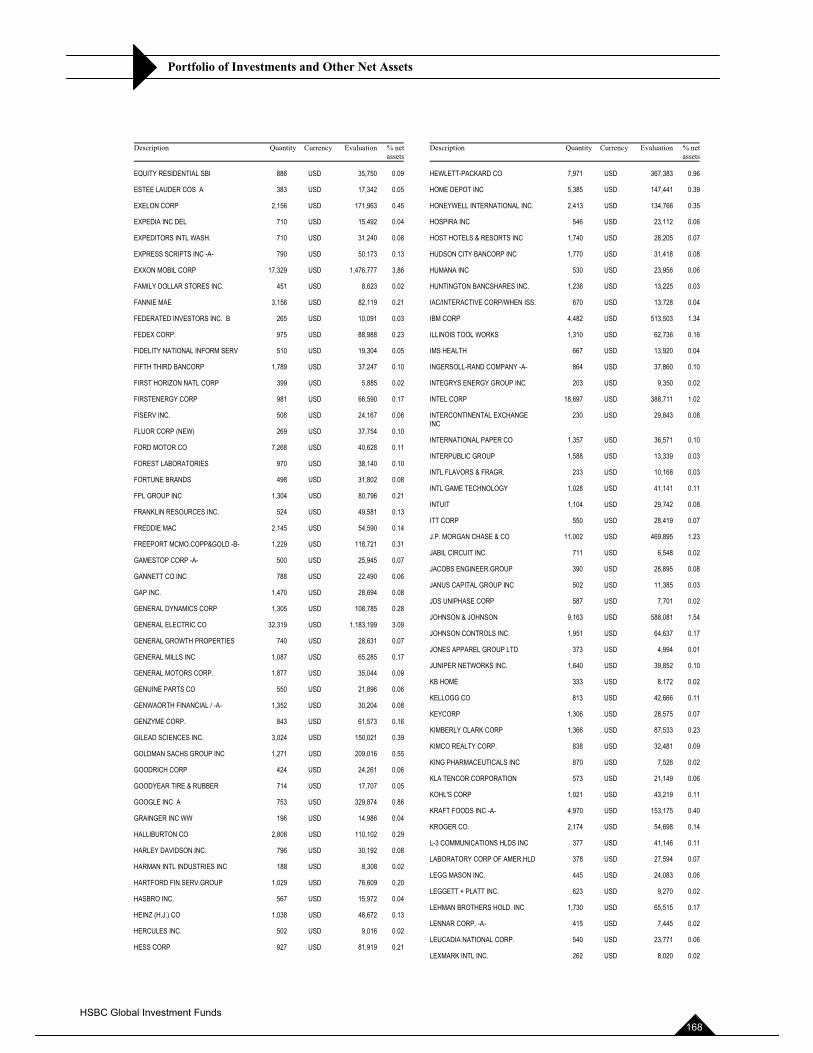
Portfolio of Investments and Other Net Assets
Description Quantity Currency Evaluation % netassets
EQUITY RESIDENTIAL SBI 886 USD 35,750 0.09
ESTEE LAUDER COS A 383 USD 17,342 0.05
EXELON CORP 2,156 USD 171,963 0.45
EXPEDIA INC DEL 710 USD 15,492 0.04
EXPEDITORS INTL WASH. 710 USD 31,240 0.08
EXPRESS SCRIPTS INC -A- 790 USD 50,173 0.13
EXXON MOBIL CORP 17,329 USD 1,476,777 3.86
FAMILY DOLLAR STORES INC. 451 USD 8,623 0.02
FANNIE MAE 3,156 USD 82,119 0.21
FEDERATED INVESTORS INC. B 265 USD 10,091 0.03
FEDEX CORP. 975 USD 88,988 0.23
FIDELITY NATIONAL INFORM SERV 510 USD 19,304 0.05
FIFTH THIRD BANCORP 1,789 USD 37,247 0.10
FIRST HORIZON NATL CORP 399 USD 5,885 0.02
FIRSTENERGY CORP 981 USD 66,590 0.17
FISERV INC. 506 USD 24,167 0.06
FLUOR CORP (NEW) 269 USD 37,754 0.10
FORD MOTOR CO 7,268 USD 40,628 0.11
FOREST LABORATORIES 970 USD 38,140 0.10
FORTUNE BRANDS 498 USD 31,802 0.08
FPL GROUP INC 1,304 USD 80,796 0.21
FRANKLIN RESOURCES INC. 524 USD 49,581 0.13
FREDDIE MAC 2,145 USD 54,590 0.14
FREEPORT MCMO.COPP&GOLD -B- 1,229 USD 118,721 0.31
GAMESTOP CORP -A- 500 USD 25,945 0.07
GANNETT CO INC 788 USD 22,490 0.06
GAP INC. 1,470 USD 28,694 0.08
GENERAL DYNAMICS CORP 1,305 USD 108,785 0.28
GENERAL ELECTRIC CO 32,319 USD 1,183,199 3.09
GENERAL GROWTH PROPERTIES 740 USD 28,631 0.07
GENERAL MILLS INC 1,087 USD 65,285 0.17
GENERAL MOTORS CORP. 1,877 USD 35,044 0.09
GENUINE PARTS CO 550 USD 21,896 0.06
GENWAORTH FINANCIAL / -A- 1,352 USD 30,204 0.08
GENZYME CORP. 843 USD 61,573 0.16
GILEAD SCIENCES INC. 3,024 USD 150,021 0.39
GOLDMAN SACHS GROUP INC 1,271 USD 209,016 0.55
GOODRICH CORP 424 USD 24,261 0.06
GOODYEAR TIRE & RUBBER 714 USD 17,707 0.05
GOOGLE INC A 753 USD 329,874 0.86
GRAINGER INC WW 196 USD 14,986 0.04
HALLIBURTON CO 2,808 USD 110,102 0.29
HARLEY DAVIDSON INC. 796 USD 30,192 0.08
HARMAN INTL INDUSTRIES INC 188 USD 8,308 0.02
HARTFORD FIN.SERV.GROUP 1,029 USD 76,609 0.20
HASBRO INC. 567 USD 15,972 0.04
HEINZ (H.J.) CO 1,038 USD 48,672 0.13
HERCULES INC. 502 USD 9,016 0.02
HESS CORP 927 USD 81,919 0.21
Description Quantity Currency Evaluation % netassets
HEWLETT-PACKARD CO 7,971 USD 367,383 0.96
HOME DEPOT INC 5,385 USD 147,441 0.39
HONEYWELL INTERNATIONAL INC. 2,413 USD 134,766 0.35
HOSPIRA INC 546 USD 23,112 0.06
HOST HOTELS & RESORTS INC 1,740 USD 28,205 0.07
HUDSON CITY BANCORP INC 1,770 USD 31,418 0.08
HUMANA INC 530 USD 23,956 0.06
HUNTINGTON BANCSHARES INC. 1,236 USD 13,225 0.03
IAC/INTERACTIVE CORP/WHEN ISS. 670 USD 13,728 0.04
IBM CORP 4,482 USD 513,503 1.34
ILLINOIS TOOL WORKS 1,310 USD 62,736 0.16
IMS HEALTH 667 USD 13,920 0.04
INGERSOLL-RAND COMPANY -A- 864 USD 37,860 0.10
INTEGRYS ENERGY GROUP INC 203 USD 9,350 0.02
INTEL CORP 18,697 USD 388,711 1.02
INTERCONTINENTAL EXCHANGE INC
230 USD 29,843 0.08
INTERNATIONAL PAPER CO 1,357 USD 36,571 0.10
INTERPUBLIC GROUP 1,588 USD 13,339 0.03
INTL FLAVORS & FRAGR. 233 USD 10,168 0.03
INTL GAME TECHNOLOGY 1,028 USD 41,141 0.11
INTUIT 1,104 USD 29,742 0.08
ITT CORP 550 USD 28,419 0.07
J.P. MORGAN CHASE & CO 11,002 USD 469,895 1.23
JABIL CIRCUIT INC. 711 USD 6,548 0.02
JACOBS ENGINEER.GROUP 390 USD 28,895 0.08
JANUS CAPITAL GROUP INC 502 USD 11,385 0.03
JDS UNIPHASE CORP 587 USD 7,701 0.02
JOHNSON & JOHNSON 9,163 USD 588,081 1.54
JOHNSON CONTROLS INC. 1,951 USD 64,637 0.17
JONES APPAREL GROUP LTD 373 USD 4,994 0.01
JUNIPER NETWORKS INC. 1,640 USD 39,852 0.10
KB HOME 333 USD 8,172 0.02
KELLOGG CO 813 USD 42,666 0.11
KEYCORP 1,306 USD 28,575 0.07
KIMBERLY CLARK CORP 1,366 USD 87,533 0.23
KIMCO REALTY CORP. 838 USD 32,481 0.09
KING PHARMACEUTICALS INC 870 USD 7,526 0.02
KLA TENCOR CORPORATION 573 USD 21,149 0.06
KOHL'S CORP 1,021 USD 43,219 0.11
KRAFT FOODS INC -A- 4,970 USD 153,175 0.40
KROGER CO. 2,174 USD 54,698 0.14
L-3 COMMUNICATIONS HLDS INC 377 USD 41,146 0.11
LABORATORY CORP OF AMER.HLD 378 USD 27,594 0.07
LEGG MASON INC. 445 USD 24,083 0.06
LEGGETT + PLATT INC. 623 USD 9,270 0.02
LEHMAN BROTHERS HOLD. INC 1,730 USD 65,515 0.17
LENNAR CORP. -A- 415 USD 7,445 0.02
LEUCADIA NATIONAL CORP. 540 USD 23,771 0.06
LEXMARK INTL INC. 262 USD 8,020 0.02
HSBC Global Investment Funds 168
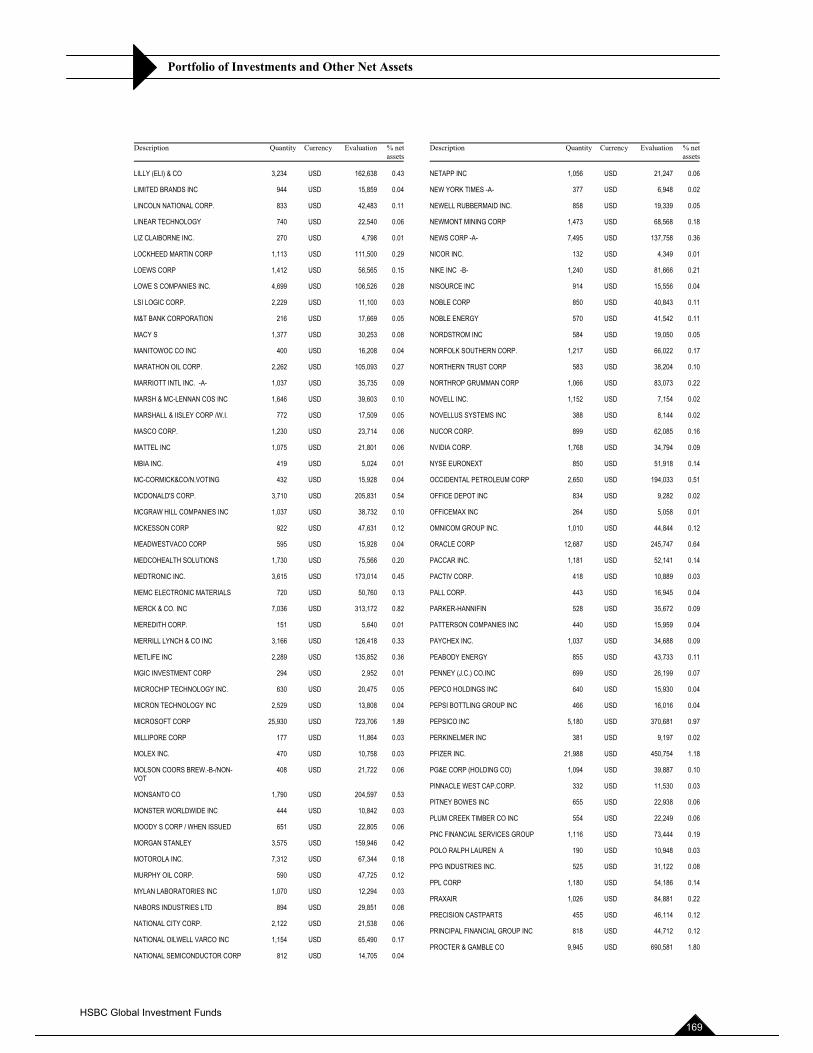
Portfolio of Investments and Other Net Assets
Description Quantity Currency Evaluation % netassets
LILLY (ELI) & CO 3,234 USD 162,638 0.43
LIMITED BRANDS INC 944 USD 15,859 0.04
LINCOLN NATIONAL CORP. 833 USD 42,483 0.11
LINEAR TECHNOLOGY 740 USD 22,540 0.06
LIZ CLAIBORNE INC. 270 USD 4,798 0.01
LOCKHEED MARTIN CORP 1,113 USD 111,500 0.29
LOEWS CORP 1,412 USD 56,565 0.15
LOWE S COMPANIES INC. 4,699 USD 106,526 0.28
LSI LOGIC CORP. 2,229 USD 11,100 0.03
M&T BANK CORPORATION 216 USD 17,669 0.05
MACY S 1,377 USD 30,253 0.08
MANITOWOC CO INC 400 USD 16,208 0.04
MARATHON OIL CORP. 2,262 USD 105,093 0.27
MARRIOTT INTL INC. -A- 1,037 USD 35,735 0.09
MARSH & MC-LENNAN COS INC 1,646 USD 39,603 0.10
MARSHALL & IISLEY CORP /W.I. 772 USD 17,509 0.05
MASCO CORP. 1,230 USD 23,714 0.06
MATTEL INC 1,075 USD 21,801 0.06
MBIA INC. 419 USD 5,024 0.01
MC-CORMICK&CO/N.VOTING 432 USD 15,928 0.04
MCDONALD'S CORP. 3,710 USD 205,831 0.54
MCGRAW HILL COMPANIES INC 1,037 USD 38,732 0.10
MCKESSON CORP 922 USD 47,631 0.12
MEADWESTVACO CORP 595 USD 15,928 0.04
MEDCOHEALTH SOLUTIONS 1,730 USD 75,566 0.20
MEDTRONIC INC. 3,615 USD 173,014 0.45
MEMC ELECTRONIC MATERIALS 720 USD 50,760 0.13
MERCK & CO. INC 7,036 USD 313,172 0.82
MEREDITH CORP. 151 USD 5,640 0.01
MERRILL LYNCH & CO INC 3,166 USD 126,418 0.33
METLIFE INC 2,289 USD 135,852 0.36
MGIC INVESTMENT CORP 294 USD 2,952 0.01
MICROCHIP TECHNOLOGY INC. 630 USD 20,475 0.05
MICRON TECHNOLOGY INC 2,529 USD 13,808 0.04
MICROSOFT CORP 25,930 USD 723,706 1.89
MILLIPORE CORP 177 USD 11,864 0.03
MOLEX INC. 470 USD 10,758 0.03
MOLSON COORS BREW.-B-/NON-VOT
408 USD 21,722 0.06
MONSANTO CO 1,790 USD 204,597 0.53
MONSTER WORLDWIDE INC 444 USD 10,842 0.03
MOODY S CORP / WHEN ISSUED 651 USD 22,805 0.06
MORGAN STANLEY 3,575 USD 159,946 0.42
MOTOROLA INC. 7,312 USD 67,344 0.18
MURPHY OIL CORP. 590 USD 47,725 0.12
MYLAN LABORATORIES INC 1,070 USD 12,294 0.03
NABORS INDUSTRIES LTD 894 USD 29,851 0.08
NATIONAL CITY CORP. 2,122 USD 21,538 0.06
NATIONAL OILWELL VARCO INC 1,154 USD 65,490 0.17
NATIONAL SEMICONDUCTOR CORP 812 USD 14,705 0.04
Description Quantity Currency Evaluation % netassets
NETAPP INC 1,056 USD 21,247 0.06
NEW YORK TIMES -A- 377 USD 6,948 0.02
NEWELL RUBBERMAID INC. 858 USD 19,339 0.05
NEWMONT MINING CORP 1,473 USD 68,568 0.18
NEWS CORP -A- 7,495 USD 137,758 0.36
NICOR INC. 132 USD 4,349 0.01
NIKE INC -B- 1,240 USD 81,666 0.21
NISOURCE INC 914 USD 15,556 0.04
NOBLE CORP 850 USD 40,843 0.11
NOBLE ENERGY 570 USD 41,542 0.11
NORDSTROM INC 584 USD 19,050 0.05
NORFOLK SOUTHERN CORP. 1,217 USD 66,022 0.17
NORTHERN TRUST CORP 583 USD 38,204 0.10
NORTHROP GRUMMAN CORP 1,066 USD 83,073 0.22
NOVELL INC. 1,152 USD 7,154 0.02
NOVELLUS SYSTEMS INC 388 USD 8,144 0.02
NUCOR CORP. 899 USD 62,085 0.16
NVIDIA CORP. 1,768 USD 34,794 0.09
NYSE EURONEXT 850 USD 51,918 0.14
OCCIDENTAL PETROLEUM CORP 2,650 USD 194,033 0.51
OFFICE DEPOT INC 834 USD 9,282 0.02
OFFICEMAX INC 264 USD 5,058 0.01
OMNICOM GROUP INC. 1,010 USD 44,844 0.12
ORACLE CORP 12,687 USD 245,747 0.64
PACCAR INC. 1,181 USD 52,141 0.14
PACTIV CORP. 418 USD 10,889 0.03
PALL CORP. 443 USD 16,945 0.04
PARKER-HANNIFIN 528 USD 35,672 0.09
PATTERSON COMPANIES INC 440 USD 15,959 0.04
PAYCHEX INC. 1,037 USD 34,688 0.09
PEABODY ENERGY 855 USD 43,733 0.11
PENNEY (J.C.) CO.INC 699 USD 26,199 0.07
PEPCO HOLDINGS INC 640 USD 15,930 0.04
PEPSI BOTTLING GROUP INC 466 USD 16,016 0.04
PEPSICO INC 5,180 USD 370,681 0.97
PERKINELMER INC 381 USD 9,197 0.02
PFIZER INC. 21,988 USD 450,754 1.18
PG&E CORP (HOLDING CO) 1,094 USD 39,887 0.10
PINNACLE WEST CAP.CORP. 332 USD 11,530 0.03
PITNEY BOWES INC 655 USD 22,938 0.06
PLUM CREEK TIMBER CO INC 554 USD 22,249 0.06
PNC FINANCIAL SERVICES GROUP 1,116 USD 73,444 0.19
POLO RALPH LAUREN A 190 USD 10,948 0.03
PPG INDUSTRIES INC. 525 USD 31,122 0.08
PPL CORP 1,180 USD 54,186 0.14
PRAXAIR 1,026 USD 84,881 0.22
PRECISION CASTPARTS 455 USD 46,114 0.12
PRINCIPAL FINANCIAL GROUP INC 818 USD 44,712 0.12
PROCTER & GAMBLE CO 9,945 USD 690,581 1.80
HSBC Global Investment Funds 169
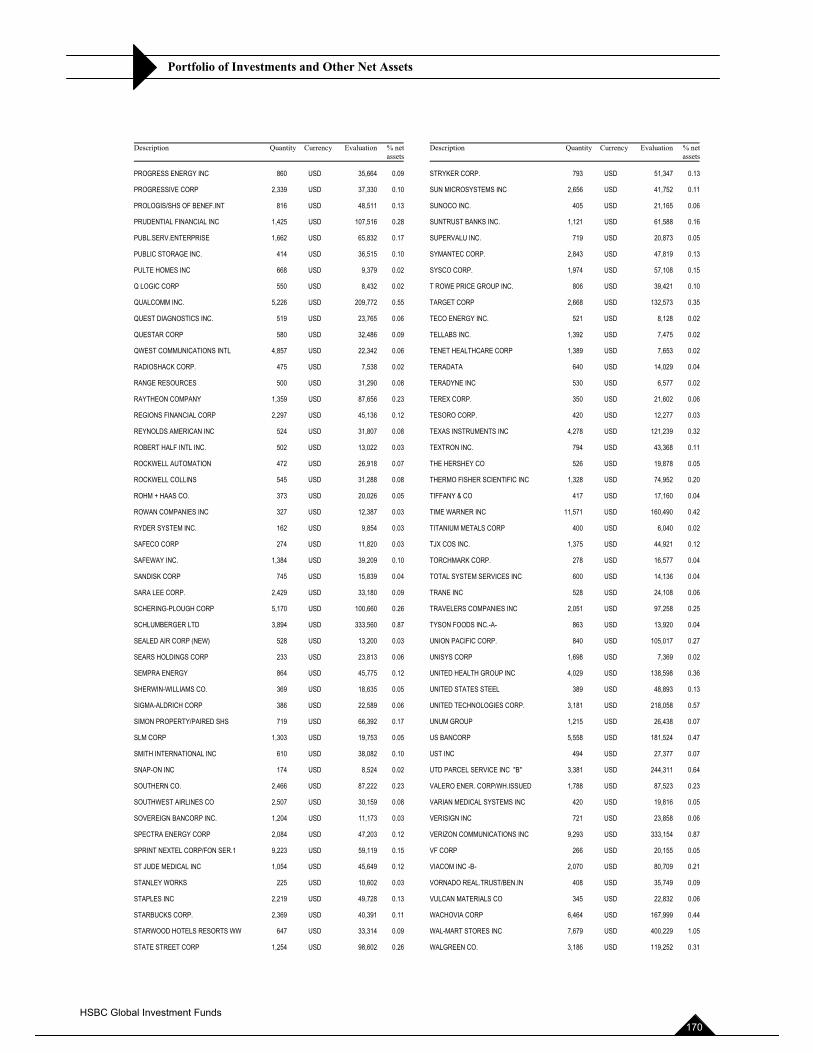
Portfolio of Investments and Other Net Assets
Description Quantity Currency Evaluation % netassets
PROGRESS ENERGY INC 860 USD 35,664 0.09
PROGRESSIVE CORP 2,339 USD 37,330 0.10
PROLOGIS/SHS OF BENEF.INT 816 USD 48,511 0.13
PRUDENTIAL FINANCIAL INC 1,425 USD 107,516 0.28
PUBL.SERV.ENTERPRISE 1,662 USD 65,832 0.17
PUBLIC STORAGE INC. 414 USD 36,515 0.10
PULTE HOMES INC 668 USD 9,379 0.02
Q LOGIC CORP 550 USD 8,432 0.02
QUALCOMM INC. 5,226 USD 209,772 0.55
QUEST DIAGNOSTICS INC. 519 USD 23,765 0.06
QUESTAR CORP 580 USD 32,486 0.09
QWEST COMMUNICATIONS INTL 4,857 USD 22,342 0.06
RADIOSHACK CORP. 475 USD 7,538 0.02
RANGE RESOURCES 500 USD 31,290 0.08
RAYTHEON COMPANY 1,359 USD 87,656 0.23
REGIONS FINANCIAL CORP 2,297 USD 45,136 0.12
REYNOLDS AMERICAN INC 524 USD 31,807 0.08
ROBERT HALF INTL INC. 502 USD 13,022 0.03
ROCKWELL AUTOMATION 472 USD 26,918 0.07
ROCKWELL COLLINS 545 USD 31,288 0.08
ROHM + HAAS CO. 373 USD 20,026 0.05
ROWAN COMPANIES INC 327 USD 12,387 0.03
RYDER SYSTEM INC. 162 USD 9,854 0.03
SAFECO CORP 274 USD 11,820 0.03
SAFEWAY INC. 1,384 USD 39,209 0.10
SANDISK CORP 745 USD 15,839 0.04
SARA LEE CORP. 2,429 USD 33,180 0.09
SCHERING-PLOUGH CORP 5,170 USD 100,660 0.26
SCHLUMBERGER LTD 3,894 USD 333,560 0.87
SEALED AIR CORP (NEW) 528 USD 13,200 0.03
SEARS HOLDINGS CORP 233 USD 23,813 0.06
SEMPRA ENERGY 864 USD 45,775 0.12
SHERWIN-WILLIAMS CO. 369 USD 18,635 0.05
SIGMA-ALDRICH CORP 386 USD 22,589 0.06
SIMON PROPERTY/PAIRED SHS 719 USD 66,392 0.17
SLM CORP 1,303 USD 19,753 0.05
SMITH INTERNATIONAL INC 610 USD 38,082 0.10
SNAP-ON INC 174 USD 8,524 0.02
SOUTHERN CO. 2,466 USD 87,222 0.23
SOUTHWEST AIRLINES CO 2,507 USD 30,159 0.08
SOVEREIGN BANCORP INC. 1,204 USD 11,173 0.03
SPECTRA ENERGY CORP 2,084 USD 47,203 0.12
SPRINT NEXTEL CORP/FON SER.1 9,223 USD 59,119 0.15
ST JUDE MEDICAL INC 1,054 USD 45,649 0.12
STANLEY WORKS 225 USD 10,602 0.03
STAPLES INC 2,219 USD 49,728 0.13
STARBUCKS CORP. 2,369 USD 40,391 0.11
STARWOOD HOTELS RESORTS WW 647 USD 33,314 0.09
STATE STREET CORP 1,254 USD 98,602 0.26
Description Quantity Currency Evaluation % netassets
STRYKER CORP. 793 USD 51,347 0.13
SUN MICROSYSTEMS INC 2,656 USD 41,752 0.11
SUNOCO INC. 405 USD 21,165 0.06
SUNTRUST BANKS INC. 1,121 USD 61,588 0.16
SUPERVALU INC. 719 USD 20,873 0.05
SYMANTEC CORP. 2,843 USD 47,819 0.13
SYSCO CORP. 1,974 USD 57,108 0.15
T ROWE PRICE GROUP INC. 806 USD 39,421 0.10
TARGET CORP 2,668 USD 132,573 0.35
TECO ENERGY INC. 521 USD 8,128 0.02
TELLABS INC. 1,392 USD 7,475 0.02
TENET HEALTHCARE CORP 1,389 USD 7,653 0.02
TERADATA 640 USD 14,029 0.04
TERADYNE INC 530 USD 6,577 0.02
TEREX CORP. 350 USD 21,602 0.06
TESORO CORP. 420 USD 12,277 0.03
TEXAS INSTRUMENTS INC 4,278 USD 121,239 0.32
TEXTRON INC. 794 USD 43,368 0.11
THE HERSHEY CO 526 USD 19,878 0.05
THERMO FISHER SCIENTIFIC INC 1,328 USD 74,952 0.20
TIFFANY & CO 417 USD 17,160 0.04
TIME WARNER INC 11,571 USD 160,490 0.42
TITANIUM METALS CORP 400 USD 6,040 0.02
TJX COS INC. 1,375 USD 44,921 0.12
TORCHMARK CORP. 278 USD 16,577 0.04
TOTAL SYSTEM SERVICES INC 600 USD 14,136 0.04
TRANE INC 528 USD 24,108 0.06
TRAVELERS COMPANIES INC 2,051 USD 97,258 0.25
TYSON FOODS INC.-A- 863 USD 13,920 0.04
UNION PACIFIC CORP. 840 USD 105,017 0.27
UNISYS CORP 1,698 USD 7,369 0.02
UNITED HEALTH GROUP INC 4,029 USD 138,598 0.36
UNITED STATES STEEL 389 USD 48,893 0.13
UNITED TECHNOLOGIES CORP. 3,181 USD 218,058 0.57
UNUM GROUP 1,215 USD 26,438 0.07
US BANCORP 5,558 USD 181,524 0.47
UST INC 494 USD 27,377 0.07
UTD PARCEL SERVICE INC "B" 3,381 USD 244,311 0.64
VALERO ENER. CORP/WH.ISSUED 1,788 USD 87,523 0.23
VARIAN MEDICAL SYSTEMS INC 420 USD 19,816 0.05
VERISIGN INC 721 USD 23,858 0.06
VERIZON COMMUNICATIONS INC 9,293 USD 333,154 0.87
VF CORP 266 USD 20,155 0.05
VIACOM INC -B- 2,070 USD 80,709 0.21
VORNADO REAL.TRUST/BEN.IN 408 USD 35,749 0.09
VULCAN MATERIALS CO 345 USD 22,832 0.06
WACHOVIA CORP 6,464 USD 167,999 0.44
WAL-MART STORES INC 7,679 USD 400,229 1.05
WALGREEN CO. 3,186 USD 119,252 0.31
HSBC Global Investment Funds 170
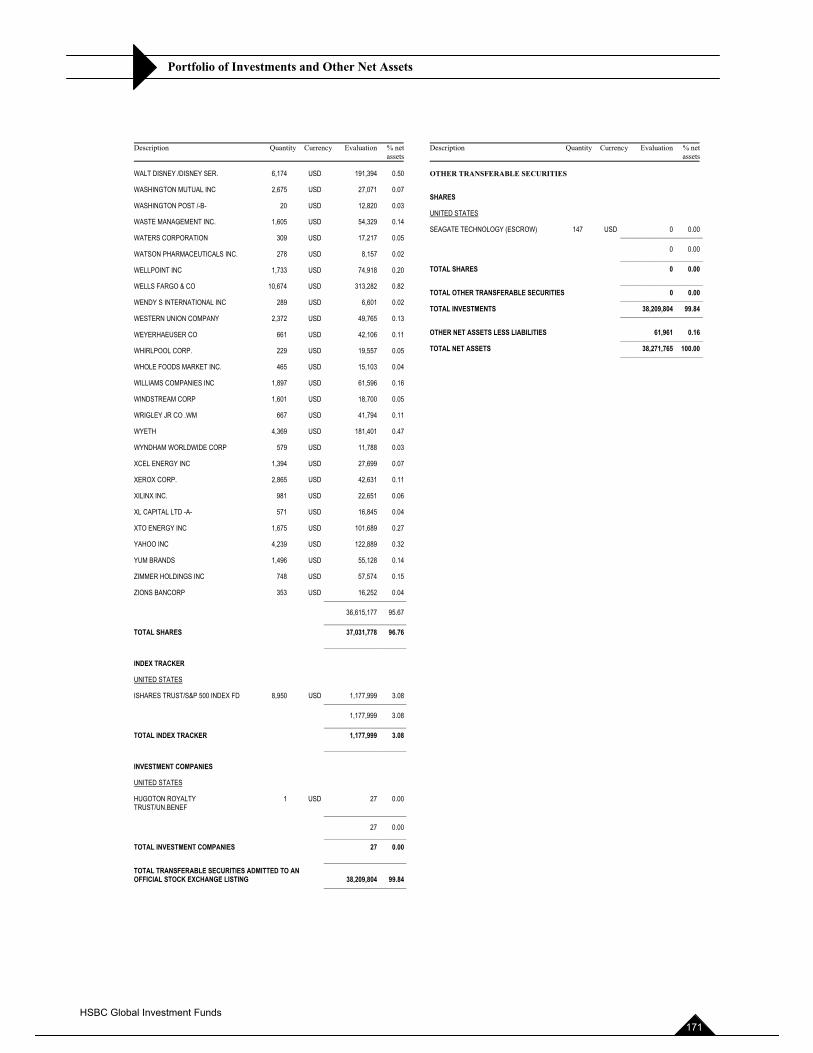
Portfolio of Investments and Other Net Assets
Description Quantity Currency Evaluation % netassets
WALT DISNEY /DISNEY SER. 6,174 USD 191,394 0.50
WASHINGTON MUTUAL INC 2,675 USD 27,071 0.07
WASHINGTON POST /-B- 20 USD 12,820 0.03
WASTE MANAGEMENT INC. 1,605 USD 54,329 0.14
WATERS CORPORATION 309 USD 17,217 0.05
WATSON PHARMACEUTICALS INC. 278 USD 8,157 0.02
WELLPOINT INC 1,733 USD 74,918 0.20
WELLS FARGO & CO 10,674 USD 313,282 0.82
WENDY S INTERNATIONAL INC 289 USD 6,601 0.02
WESTERN UNION COMPANY 2,372 USD 49,765 0.13
WEYERHAEUSER CO 661 USD 42,106 0.11
WHIRLPOOL CORP. 229 USD 19,557 0.05
WHOLE FOODS MARKET INC. 465 USD 15,103 0.04
WILLIAMS COMPANIES INC 1,897 USD 61,596 0.16
WINDSTREAM CORP 1,601 USD 18,700 0.05
WRIGLEY JR CO .WM 667 USD 41,794 0.11
WYETH 4,369 USD 181,401 0.47
WYNDHAM WORLDWIDE CORP 579 USD 11,788 0.03
XCEL ENERGY INC 1,394 USD 27,699 0.07
XEROX CORP. 2,865 USD 42,631 0.11
XILINX INC. 981 USD 22,651 0.06
XL CAPITAL LTD -A- 571 USD 16,845 0.04
XTO ENERGY INC 1,675 USD 101,689 0.27
YAHOO INC 4,239 USD 122,889 0.32
YUM BRANDS 1,496 USD 55,128 0.14
ZIMMER HOLDINGS INC 748 USD 57,574 0.15
ZIONS BANCORP 353 USD 16,252 0.04 ______________________
36,615,177 95.67 ______________________ TOTAL SHARES 37,031,778 96.76 ______________________
INDEX TRACKER
UNITED STATES
ISHARES TRUST/S&P 500 INDEX FD 8,950 USD 1,177,999 3.08 ______________________
1,177,999 3.08 ______________________ TOTAL INDEX TRACKER 1,177,999 3.08 ______________________
INVESTMENT COMPANIES
UNITED STATES
HUGOTON ROYALTY TRUST/UN.BENEF ______________________
1 USD 27 0.00
27 0.00 ______________________ TOTAL INVESTMENT COMPANIES 27 0.00 ______________________ TOTAL TRANSFERABLE SECURITIES ADMITTED TO AN OFFICIAL STOCK EXCHANGE LISTING 38,209,804 99.84 ______________________
Description Quantity Currency Evaluation % netassets
OTHER TRANSFERABLE SECURITIES
SHARES
UNITED STATES
SEAGATE TECHNOLOGY (ESCROW) 147 USD 0 0.00 ______________________
0 0.00 ______________________ TOTAL SHARES 0 0.00 ______________________ TOTAL OTHER TRANSFERABLE SECURITIES 0 0.00 ______________________ TOTAL INVESTMENTS 38,209,804 99.84 ______________________
OTHER NET ASSETS LESS LIABILITIES 61,961 0.16 ______________________ TOTAL NET ASSETS 38,271,765 100.00 ______________________
HSBC Global Investment Funds 171
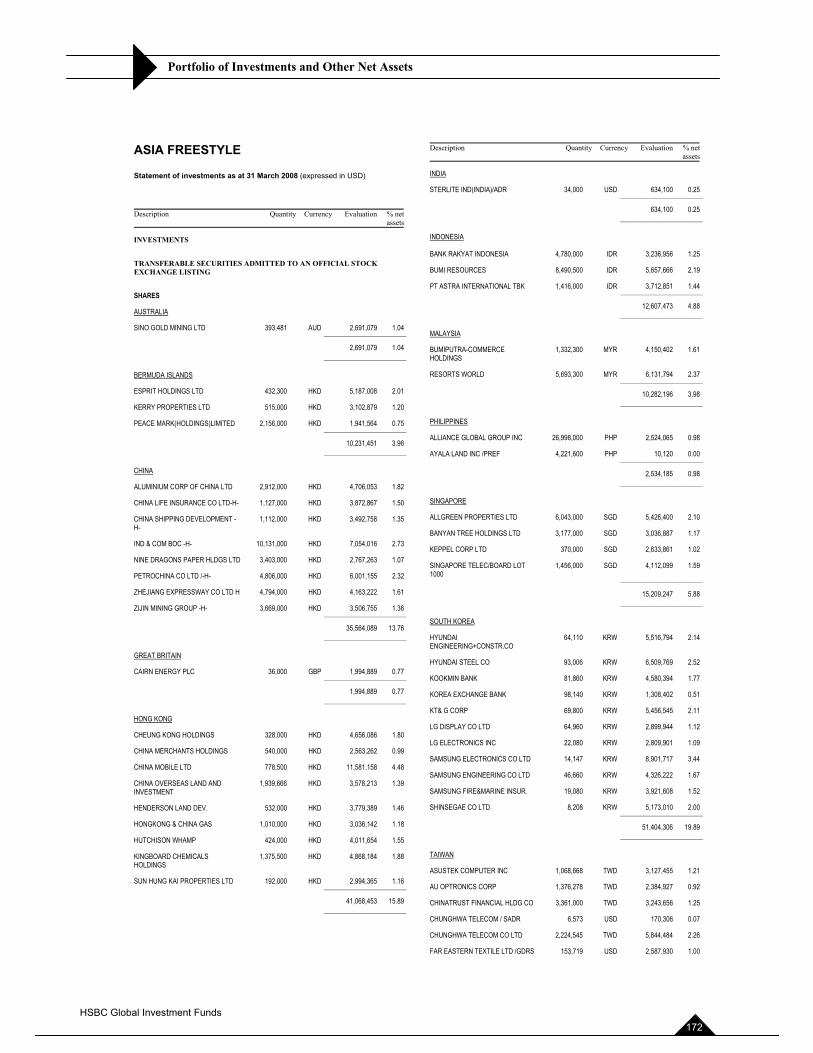
Portfolio of Investments and Other Net Assets
ASIA FREESTYLE
Statement of investments as at 31 March 2008 (expressed in USD)
Description Quantity Currency Evaluation % netassets
INVESTMENTS
TRANSFERABLE SECURITIES ADMITTED TO AN OFFICIAL STOCK EXCHANGE LISTING
SHARES
AUSTRALIA
SINO GOLD MINING LTD 393,481 AUD 2,691,079 1.04 ______________________
2,691,079 1.04 ______________________
BERMUDA ISLANDS
ESPRIT HOLDINGS LTD 432,300 HKD 5,187,008 2.01
KERRY PROPERTIES LTD 515,000 HKD 3,102,879 1.20
PEACE MARK(HOLDINGS)LIMITED 2,156,000 HKD 1,941,564 0.75 ______________________
10,231,451 3.96 ______________________
CHINA
ALUMINIUM CORP OF CHINA LTD 2,912,000 HKD 4,706,053 1.82
CHINA LIFE INSURANCE CO LTD-H- 1,127,000 HKD 3,872,867 1.50
CHINA SHIPPING DEVELOPMENT -H-
1,112,000 HKD 3,492,758 1.35
IND & COM BOC -H- 10,131,000 HKD 7,054,016 2.73
NINE DRAGONS PAPER HLDGS LTD 3,403,000 HKD 2,767,263 1.07
PETROCHINA CO LTD /-H- 4,806,000 HKD 6,001,155 2.32
ZHEJIANG EXPRESSWAY CO LTD H 4,794,000 HKD 4,163,222 1.61
ZIJIN MINING GROUP -H- 3,669,000 HKD 3,506,755 1.36 ______________________
35,564,089 13.76 ______________________
GREAT BRITAIN
CAIRN ENERGY PLC 36,000 GBP 1,994,889 0.77 ______________________
1,994,889 0.77 ______________________
HONG KONG
CHEUNG KONG HOLDINGS 328,000 HKD 4,656,086 1.80
CHINA MERCHANTS HOLDINGS 540,000 HKD 2,563,262 0.99
CHINA MOBILE LTD 778,500 HKD 11,581,158 4.48
CHINA OVERSEAS LAND AND INVESTMENT
1,939,666 HKD 3,578,213 1.39
HENDERSON LAND DEV. 532,000 HKD 3,779,389 1.46
HONGKONG & CHINA GAS 1,010,000 HKD 3,036,142 1.18
HUTCHISON WHAMP 424,000 HKD 4,011,654 1.55
KINGBOARD CHEMICALS HOLDINGS
1,375,500 HKD 4,868,184 1.88
SUN HUNG KAI PROPERTIES LTD 192,000 HKD 2,994,365 1.16 ______________________
41,068,453 15.89 ______________________
Description Quantity Currency Evaluation % netassets
INDIA
STERLITE IND(INDIA)/ADR 34,000 USD 634,100 0.25 ______________________
634,100 0.25 ______________________
INDONESIA
BANK RAKYAT INDONESIA 4,780,000 IDR 3,236,956 1.25
BUMI RESOURCES 8,490,500 IDR 5,657,666 2.19
PT ASTRA INTERNATIONAL TBK 1,416,000 IDR 3,712,851 1.44 ______________________
12,607,473 4.88 ______________________
MALAYSIA
BUMIPUTRA-COMMERCE HOLDINGS
1,332,300 MYR 4,150,402 1.61
RESORTS WORLD 5,693,300 MYR 6,131,794 2.37 ______________________
10,282,196 3.98 ______________________
PHILIPPINES
ALLIANCE GLOBAL GROUP INC 26,998,000 PHP 2,524,065 0.98
AYALA LAND INC /PREF 4,221,600 PHP 10,120 0.00 ______________________
2,534,185 0.98 ______________________
SINGAPORE
ALLGREEN PROPERTIES LTD 6,043,000 SGD 5,426,400 2.10
BANYAN TREE HOLDINGS LTD 3,177,000 SGD 3,036,887 1.17
KEPPEL CORP LTD 370,000 SGD 2,633,861 1.02
SINGAPORE TELEC/BOARD LOT 1000 ______________________
1,456,000 SGD 4,112,099 1.59
15,209,247 5.88 ______________________
SOUTH KOREA
HYUNDAIENGINEERING+CONSTR.CO
64,110 KRW 5,516,794 2.14
HYUNDAI STEEL CO 93,006 KRW 6,509,769 2.52
KOOKMIN BANK 81,860 KRW 4,580,394 1.77
KOREA EXCHANGE BANK 98,140 KRW 1,308,402 0.51
KT& G CORP 69,800 KRW 5,456,545 2.11
LG DISPLAY CO LTD 64,960 KRW 2,899,944 1.12
LG ELECTRONICS INC 22,080 KRW 2,809,901 1.09
SAMSUNG ELECTRONICS CO LTD 14,147 KRW 8,901,717 3.44
SAMSUNG ENGINEERING CO LTD 46,660 KRW 4,326,222 1.67
SAMSUNG FIRE&MARINE INSUR. 19,080 KRW 3,921,608 1.52
SHINSEGAE CO LTD 8,208 KRW 5,173,010 2.00 ______________________
51,404,306 19.89 ______________________
TAIWAN
ASUSTEK COMPUTER INC 1,068,668 TWD 3,127,455 1.21
AU OPTRONICS CORP 1,376,278 TWD 2,384,927 0.92
CHINATRUST FINANCIAL HLDG CO 3,361,000 TWD 3,243,656 1.25
CHUNGHWA TELECOM / SADR 6,573 USD 170,306 0.07
CHUNGHWA TELECOM CO LTD 2,224,545 TWD 5,844,484 2.26
FAR EASTERN TEXTILE LTD /GDRS 153,719 USD 2,587,930 1.00
HSBC Global Investment Funds 172
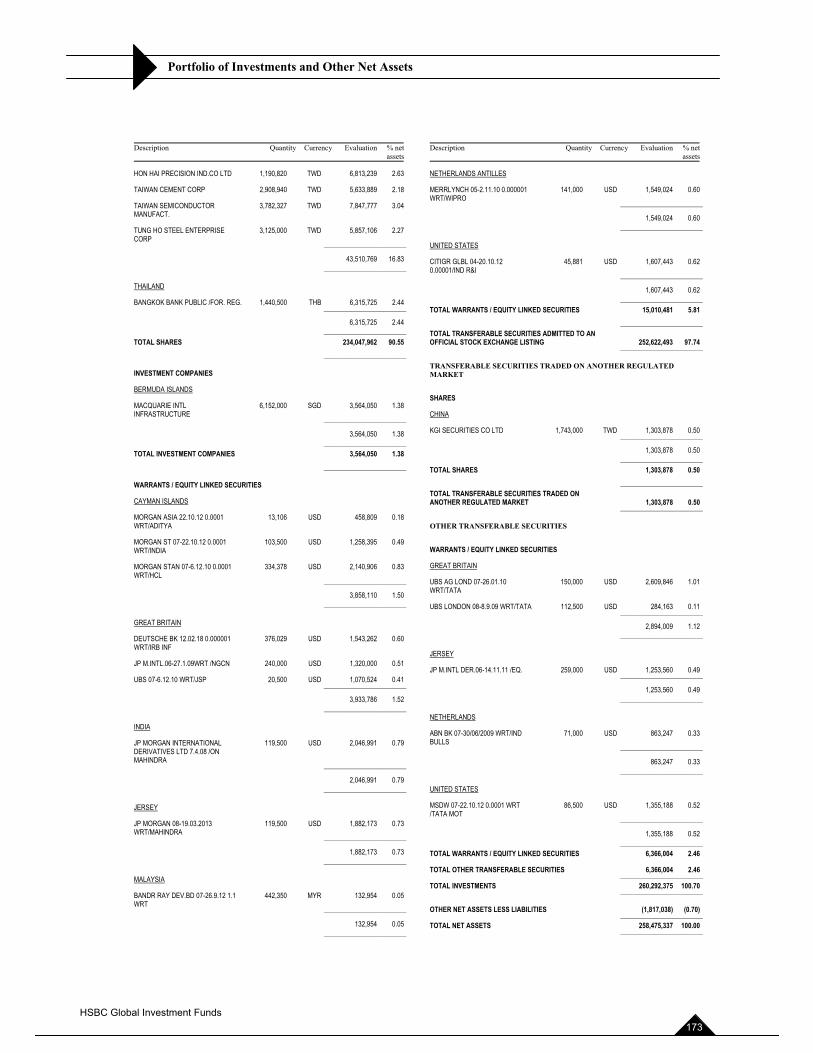
Portfolio of Investments and Other Net Assets
Description Quantity Currency Evaluation % netassets
HON HAI PRECISION IND.CO LTD 1,190,820 TWD 6,813,239 2.63
TAIWAN CEMENT CORP 2,908,940 TWD 5,633,889 2.18
TAIWAN SEMICONDUCTOR MANUFACT.
3,782,327 TWD 7,847,777 3.04
TUNG HO STEEL ENTERPRISE CORP ______________________
3,125,000 TWD 5,857,106 2.27
43,510,769 16.83 ______________________
THAILAND
BANGKOK BANK PUBLIC /FOR. REG. 1,440,500 THB 6,315,725 2.44 ______________________
6,315,725 2.44 ______________________ TOTAL SHARES 234,047,962 90.55 ______________________
INVESTMENT COMPANIES
BERMUDA ISLANDS
MACQUARIE INTL INFRASTRUCTURE ______________________
6,152,000 SGD 3,564,050 1.38
3,564,050 1.38 ______________________ TOTAL INVESTMENT COMPANIES 3,564,050 1.38 ______________________
WARRANTS / EQUITY LINKED SECURITIES
CAYMAN ISLANDS
MORGAN ASIA 22.10.12 0.0001 WRT/ADITYA
13,106 USD 458,809 0.18
MORGAN ST 07-22.10.12 0.0001 WRT/INDIA
103,500 USD 1,258,395 0.49
MORGAN STAN 07-6.12.10 0.0001 WRT/HCL ______________________
334,378 USD 2,140,906 0.83
3,858,110 1.50 ______________________
GREAT BRITAIN
DEUTSCHE BK 12.02.18 0.000001 WRT/IRB INF
376,029 USD 1,543,262 0.60
JP M.INTL.06-27.1.09WRT /NGCN 240,000 USD 1,320,000 0.51
UBS 07-6.12.10 WRT/JSP 20,500 USD 1,070,524 0.41 ______________________
3,933,786 1.52 ______________________
INDIA
JP MORGAN INTERNATIONAL DERIVATIVES LTD 7.4.08 /ON MAHINDRA ______________________
119,500 USD 2,046,991 0.79
2,046,991 0.79 ______________________
JERSEY
JP MORGAN 08-19.03.2013 WRT/MAHINDRA ______________________
119,500 USD 1,882,173 0.73
1,882,173 0.73 ______________________
MALAYSIA
BANDR RAY DEV.BD 07-26.9.12 1.1 WRT ______________________
442,350 MYR 132,954 0.05
132,954 0.05 ______________________
Description Quantity Currency Evaluation % netassets
NETHERLANDS ANTILLES
MERRLYNCH 05-2.11.10 0.000001 WRT/WIPRO ______________________
141,000 USD 1,549,024 0.60
1,549,024 0.60 ______________________
UNITED STATES
CITIGR GLBL 04-20.10.12 0.00001/IND R&I
45,881 USD 1,607,443 0.62
______________________
1,607,443 0.62 ______________________ TOTAL WARRANTS / EQUITY LINKED SECURITIES 15,010,481 5.81 ______________________ TOTAL TRANSFERABLE SECURITIES ADMITTED TO AN OFFICIAL STOCK EXCHANGE LISTING 252,622,493 97.74 ______________________
TRANSFERABLE SECURITIES TRADED ON ANOTHER REGULATED MARKET
SHARES
CHINA
KGI SECURITIES CO LTD 1,743,000 TWD 1,303,878 0.50 ______________________
1,303,878 0.50 ______________________ TOTAL SHARES 1,303,878 0.50 ______________________ TOTAL TRANSFERABLE SECURITIES TRADED ON ANOTHER REGULATED MARKET 1,303,878 0.50 ______________________
OTHER TRANSFERABLE SECURITIES
WARRANTS / EQUITY LINKED SECURITIES
GREAT BRITAIN
UBS AG LOND 07-26.01.10 WRT/TATA
150,000 USD 2,609,846 1.01
UBS LONDON 08-8.9.09 WRT/TATA 112,500 USD 284,163 0.11 ______________________
2,894,009 1.12 ______________________
JERSEY
JP M.INTL DER.06-14.11.11 /EQ. 259,000 USD 1,253,560 0.49 ______________________
1,253,560 0.49 ______________________
NETHERLANDS
ABN BK 07-30/06/2009 WRT/IND BULLS
71,000 USD 863,247 0.33
______________________
863,247 0.33 ______________________
UNITED STATES
MSDW 07-22.10.12 0.0001 WRT /TATA MOT ______________________
86,500 USD 1,355,188 0.52
1,355,188 0.52 ______________________ TOTAL WARRANTS / EQUITY LINKED SECURITIES 6,366,004 2.46
TOTAL OTHER TRANSFERABLE SECURITIES 6,366,004 2.46 ______________________ TOTAL INVESTMENTS 260,292,375 100.70 ______________________
OTHER NET ASSETS LESS LIABILITIES (1,817,038) (0.70) ______________________ TOTAL NET ASSETS 258,475,337 100.00 ______________________
HSBC Global Investment Funds 173
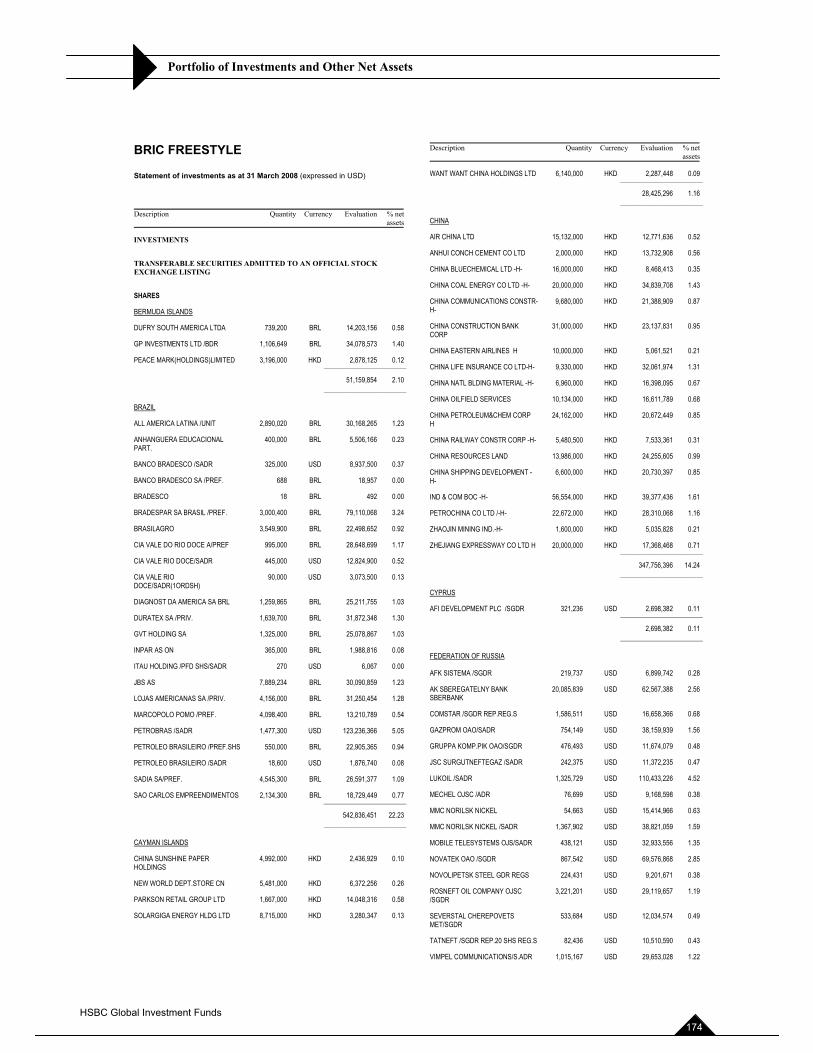
Portfolio of Investments and Other Net Assets
BRIC FREESTYLE
Statement of investments as at 31 March 2008 (expressed in USD)
Description Quantity Currency Evaluation % netassets
INVESTMENTS
TRANSFERABLE SECURITIES ADMITTED TO AN OFFICIAL STOCK EXCHANGE LISTING
SHARES
BERMUDA ISLANDS
DUFRY SOUTH AMERICA LTDA 739,200 BRL 14,203,156 0.58
GP INVESTMENTS LTD /BDR 1,106,649 BRL 34,078,573 1.40
PEACE MARK(HOLDINGS)LIMITED 3,196,000 HKD 2,878,125 0.12 ______________________
51,159,854 2.10 ______________________
BRAZIL
ALL AMERICA LATINA /UNIT 2,890,020 BRL 30,168,265 1.23
ANHANGUERA EDUCACIONAL PART.
400,000 BRL 5,506,166 0.23
BANCO BRADESCO /SADR 325,000 USD 8,937,500 0.37
BANCO BRADESCO SA /PREF. 688 BRL 18,957 0.00
BRADESCO 18 BRL 492 0.00
BRADESPAR SA BRASIL /PREF. 3,000,400 BRL 79,110,068 3.24
BRASILAGRO 3,549,900 BRL 22,498,652 0.92
CIA VALE DO RIO DOCE A/PREF 995,000 BRL 28,648,699 1.17
CIA VALE RIO DOCE/SADR 445,000 USD 12,824,900 0.52
CIA VALE RIO DOCE/SADR(1ORDSH)
90,000 USD 3,073,500 0.13
DIAGNOST DA AMERICA SA BRL 1,259,865 BRL 25,211,755 1.03
DURATEX SA /PRIV. 1,639,700 BRL 31,872,348 1.30
GVT HOLDING SA 1,325,000 BRL 25,078,867 1.03
INPAR AS ON 365,000 BRL 1,988,816 0.08
ITAU HOLDING /PFD SHS/SADR 270 USD 6,067 0.00
JBS AS 7,889,234 BRL 30,090,859 1.23
LOJAS AMERICANAS SA /PRIV. 4,156,000 BRL 31,250,454 1.28
MARCOPOLO POMO /PREF. 4,098,400 BRL 13,210,789 0.54
PETROBRAS /SADR 1,477,300 USD 123,236,366 5.05
PETROLEO BRASILEIRO /PREF.SHS 550,000 BRL 22,905,365 0.94
PETROLEO BRASILEIRO /SADR 18,600 USD 1,876,740 0.08
SADIA SA/PREF. 4,545,300 BRL 26,591,377 1.09
SAO CARLOS EMPREENDIMENTOS 2,134,300 BRL 18,729,449 0.77 ______________________
542,836,451 22.23 ______________________
CAYMAN ISLANDS
CHINA SUNSHINE PAPER HOLDINGS
4,992,000 HKD 2,436,929 0.10
NEW WORLD DEPT.STORE CN 5,481,000 HKD 6,372,256 0.26
PARKSON RETAIL GROUP LTD 1,667,000 HKD 14,048,316 0.58
SOLARGIGA ENERGY HLDG LTD 8,715,000 HKD 3,280,347 0.13
Description Quantity Currency Evaluation % netassets
WANT WANT CHINA HOLDINGS LTD 6,140,000 HKD 2,287,448 0.09 ______________________
28,425,296 1.16 ______________________
CHINA
AIR CHINA LTD 15,132,000 HKD 12,771,636 0.52
ANHUI CONCH CEMENT CO LTD 2,000,000 HKD 13,732,908 0.56
CHINA BLUECHEMICAL LTD -H- 16,000,000 HKD 8,468,413 0.35
CHINA COAL ENERGY CO LTD -H- 20,000,000 HKD 34,839,708 1.43
CHINA COMMUNICATIONS CONSTR-H-
9,680,000 HKD 21,388,909 0.87
CHINA CONSTRUCTION BANK CORP
31,000,000 HKD 23,137,831 0.95
CHINA EASTERN AIRLINES H 10,000,000 HKD 5,061,521 0.21
CHINA LIFE INSURANCE CO LTD-H- 9,330,000 HKD 32,061,974 1.31
CHINA NATL BLDING MATERIAL -H- 6,960,000 HKD 16,398,095 0.67
CHINA OILFIELD SERVICES 10,134,000 HKD 16,611,789 0.68
CHINA PETROLEUM&CHEM CORP H
24,162,000 HKD 20,672,449 0.85
CHINA RAILWAY CONSTR CORP -H- 5,480,500 HKD 7,533,361 0.31
CHINA RESOURCES LAND 13,986,000 HKD 24,255,605 0.99
CHINA SHIPPING DEVELOPMENT -H-
6,600,000 HKD 20,730,397 0.85
IND & COM BOC -H- 56,554,000 HKD 39,377,436 1.61
PETROCHINA CO LTD /-H- 22,672,000 HKD 28,310,068 1.16
ZHAOJIN MINING IND.-H- 1,600,000 HKD 5,035,828 0.21
ZHEJIANG EXPRESSWAY CO LTD H 20,000,000 HKD 17,368,468 0.71 ______________________
347,756,396 14.24 ______________________
CYPRUS
AFI DEVELOPMENT PLC /SGDR 321,236 USD 2,698,382 0.11 ______________________
2,698,382 0.11 ______________________
FEDERATION OF RUSSIA
AFK SISTEMA /SGDR 219,737 USD 6,899,742 0.28
AK SBEREGATELNY BANK SBERBANK
20,085,839 USD 62,567,388 2.56
COMSTAR /SGDR REP.REG.S 1,586,511 USD 16,658,366 0.68
GAZPROM OAO/SADR 754,149 USD 38,159,939 1.56
GRUPPA KOMP.PIK OAO/SGDR 476,493 USD 11,674,079 0.48
JSC SURGUTNEFTEGAZ /SADR 242,375 USD 11,372,235 0.47
LUKOIL /SADR 1,325,729 USD 110,433,226 4.52
MECHEL OJSC /ADR 76,699 USD 9,168,598 0.38
MMC NORILSK NICKEL 54,663 USD 15,414,966 0.63
MMC NORILSK NICKEL /SADR 1,367,902 USD 38,821,059 1.59
MOBILE TELESYSTEMS OJS/SADR 438,121 USD 32,933,556 1.35
NOVATEK OAO /SGDR 867,542 USD 69,576,868 2.85
NOVOLIPETSK STEEL GDR REGS 224,431 USD 9,201,671 0.38
ROSNEFT OIL COMPANY OJSC /SGDR
3,221,201 USD 29,119,657 1.19
SEVERSTAL CHEREPOVETS MET/SGDR
533,684 USD 12,034,574 0.49
TATNEFT /SGDR REP.20 SHS REG.S 82,436 USD 10,510,590 0.43
VIMPEL COMMUNICATIONS/S.ADR 1,015,167 USD 29,653,028 1.22
HSBC Global Investment Funds 174
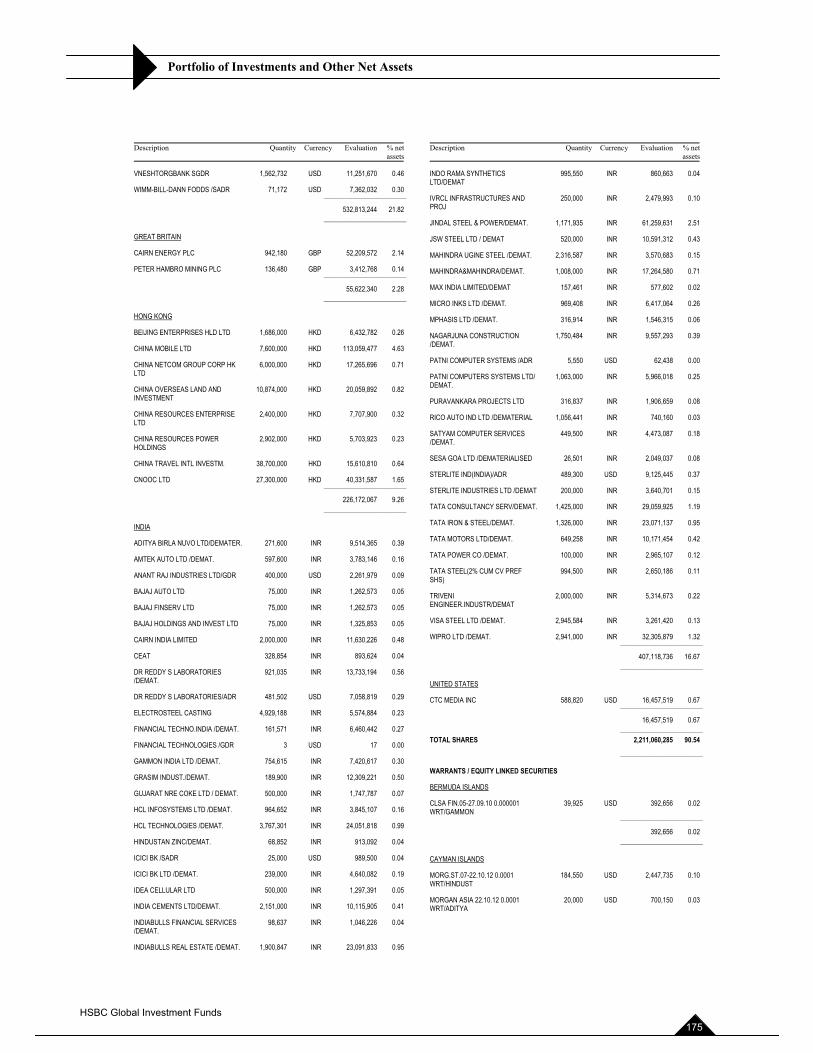
Portfolio of Investments and Other Net Assets
Description Quantity Currency Evaluation % netassets
VNESHTORGBANK SGDR 1,562,732 USD 11,251,670 0.46
WIMM-BILL-DANN FODDS /SADR 71,172 USD 7,362,032 0.30 ______________________
532,813,244 21.82 ______________________
GREAT BRITAIN
CAIRN ENERGY PLC 942,180 GBP 52,209,572 2.14
PETER HAMBRO MINING PLC 136,480 GBP 3,412,768 0.14 ______________________
55,622,340 2.28 ______________________
HONG KONG
BEIJING ENTERPRISES HLD LTD 1,686,000 HKD 6,432,782 0.26
CHINA MOBILE LTD 7,600,000 HKD 113,059,477 4.63
CHINA NETCOM GROUP CORP HK LTD
6,000,000 HKD 17,265,696 0.71
CHINA OVERSEAS LAND AND INVESTMENT
10,874,000 HKD 20,059,892 0.82
CHINA RESOURCES ENTERPRISE LTD
2,400,000 HKD 7,707,900 0.32
CHINA RESOURCES POWER HOLDINGS
2,902,000 HKD 5,703,923 0.23
CHINA TRAVEL INTL INVESTM. 38,700,000 HKD 15,610,810 0.64
CNOOC LTD 27,300,000 HKD 40,331,587 1.65 ______________________
226,172,067 9.26 ______________________
INDIA
ADITYA BIRLA NUVO LTD/DEMATER. 271,600 INR 9,514,365 0.39
AMTEK AUTO LTD /DEMAT. 597,600 INR 3,783,146 0.16
ANANT RAJ INDUSTRIES LTD/GDR 400,000 USD 2,261,979 0.09
BAJAJ AUTO LTD 75,000 INR 1,262,573 0.05
BAJAJ FINSERV LTD 75,000 INR 1,262,573 0.05
BAJAJ HOLDINGS AND INVEST LTD 75,000 INR 1,325,853 0.05
CAIRN INDIA LIMITED 2,000,000 INR 11,630,226 0.48
CEAT 328,854 INR 893,624 0.04
DR REDDY S LABORATORIES /DEMAT.
921,035 INR 13,733,194 0.56
DR REDDY S LABORATORIES/ADR 481,502 USD 7,058,819 0.29
ELECTROSTEEL CASTING 4,929,188 INR 5,574,884 0.23
FINANCIAL TECHNO.INDIA /DEMAT. 161,571 INR 6,460,442 0.27
FINANCIAL TECHNOLOGIES /GDR 3 USD 17 0.00
GAMMON INDIA LTD /DEMAT. 754,615 INR 7,420,617 0.30
GRASIM INDUST./DEMAT. 189,900 INR 12,309,221 0.50
GUJARAT NRE COKE LTD / DEMAT. 500,000 INR 1,747,787 0.07
HCL INFOSYSTEMS LTD /DEMAT. 964,652 INR 3,845,107 0.16
HCL TECHNOLOGIES /DEMAT. 3,767,301 INR 24,051,818 0.99
HINDUSTAN ZINC/DEMAT. 68,852 INR 913,092 0.04
ICICI BK /SADR 25,000 USD 989,500 0.04
ICICI BK LTD /DEMAT. 239,000 INR 4,640,082 0.19
IDEA CELLULAR LTD 500,000 INR 1,297,391 0.05
INDIA CEMENTS LTD/DEMAT. 2,151,000 INR 10,115,905 0.41
INDIABULLS FINANCIAL SERVICES /DEMAT.
98,637 INR 1,046,226 0.04
INDIABULLS REAL ESTATE /DEMAT. 1,900,847 INR 23,091,833 0.95
Description Quantity Currency Evaluation % netassets
INDO RAMA SYNTHETICS LTD/DEMAT
995,550 INR 860,663 0.04
IVRCL INFRASTRUCTURES AND PROJ
250,000 INR 2,479,993 0.10
JINDAL STEEL & POWER/DEMAT. 1,171,935 INR 61,259,631 2.51
JSW STEEL LTD / DEMAT 520,000 INR 10,591,312 0.43
MAHINDRA UGINE STEEL /DEMAT. 2,316,587 INR 3,570,683 0.15
MAHINDRA&MAHINDRA/DEMAT. 1,008,000 INR 17,264,580 0.71
MAX INDIA LIMITED/DEMAT 157,461 INR 577,602 0.02
MICRO INKS LTD /DEMAT. 969,408 INR 6,417,064 0.26
MPHASIS LTD /DEMAT. 316,914 INR 1,546,315 0.06
NAGARJUNA CONSTRUCTION /DEMAT.
1,750,484 INR 9,557,293 0.39
PATNI COMPUTER SYSTEMS /ADR 5,550 USD 62,438 0.00
PATNI COMPUTERS SYSTEMS LTD/ DEMAT.
1,063,000 INR 5,966,018 0.25
PURAVANKARA PROJECTS LTD 316,837 INR 1,906,659 0.08
RICO AUTO IND LTD /DEMATERIAL 1,056,441 INR 740,160 0.03
SATYAM COMPUTER SERVICES /DEMAT.
449,500 INR 4,473,087 0.18
SESA GOA LTD /DEMATERIALISED 26,501 INR 2,049,037 0.08
STERLITE IND(INDIA)/ADR 489,300 USD 9,125,445 0.37
STERLITE INDUSTRIES LTD /DEMAT 200,000 INR 3,640,701 0.15
TATA CONSULTANCY SERV/DEMAT. 1,425,000 INR 29,059,925 1.19
TATA IRON & STEEL/DEMAT. 1,326,000 INR 23,071,137 0.95
TATA MOTORS LTD/DEMAT. 649,258 INR 10,171,454 0.42
TATA POWER CO /DEMAT. 100,000 INR 2,965,107 0.12
TATA STEEL(2% CUM CV PREF SHS)
994,500 INR 2,650,186 0.11
TRIVENIENGINEER.INDUSTR/DEMAT
2,000,000 INR 5,314,673 0.22
VISA STEEL LTD /DEMAT. 2,945,584 INR 3,261,420 0.13
WIPRO LTD /DEMAT. 2,941,000 INR 32,305,879 1.32 ______________________
407,118,736 16.67 ______________________
UNITED STATES
CTC MEDIA INC 588,820 USD 16,457,519 0.67 ______________________
16,457,519 0.67 ______________________ TOTAL SHARES 2,211,060,285 90.54 ______________________
WARRANTS / EQUITY LINKED SECURITIES
BERMUDA ISLANDS
CLSA FIN.05-27.09.10 0.000001 WRT/GAMMON
39,925 USD 392,656 0.02
______________________
392,656 0.02 ______________________
CAYMAN ISLANDS
MORG.ST.07-22.10.12 0.0001 WRT/HINDUST
184,550 USD 2,447,735 0.10
MORGAN ASIA 22.10.12 0.0001 WRT/ADITYA
20,000 USD 700,150 0.03
HSBC Global Investment Funds 175
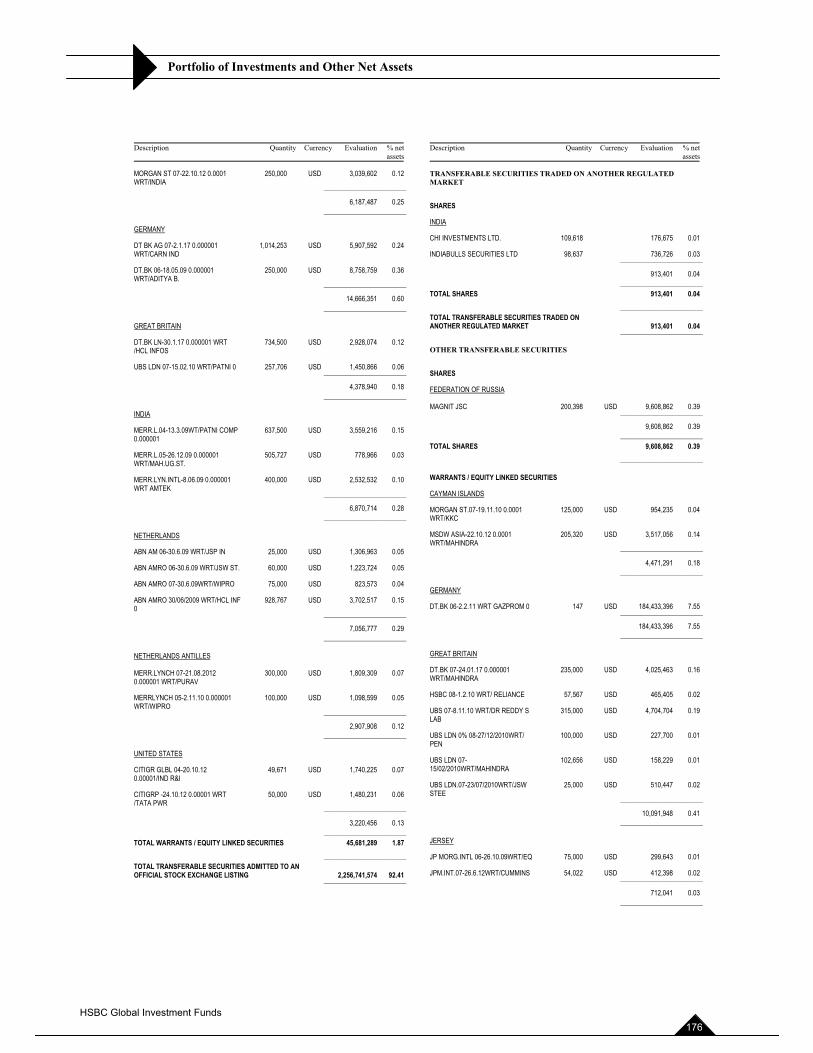
Portfolio of Investments and Other Net Assets
Description Quantity Currency Evaluation % netassets
MORGAN ST 07-22.10.12 0.0001 WRT/INDIA
250,000 USD 3,039,602 0.12
______________________
6,187,487 0.25 ______________________
GERMANY
DT BK AG 07-2.1.17 0.000001 WRT/CARN IND
1,014,253 USD 5,907,592 0.24
DT.BK 06-18.05.09 0.000001 WRT/ADITYA B. ______________________
250,000 USD 8,758,759 0.36
14,666,351 0.60 ______________________
GREAT BRITAIN
DT.BK LN-30.1.17 0.000001 WRT /HCL INFOS
734,500 USD 2,928,074 0.12
UBS LDN 07-15.02.10 WRT/PATNI 0 257,706 USD 1,450,866 0.06 ______________________
4,378,940 0.18 ______________________
INDIA
MERR.L.04-13.3.09WT/PATNI COMP 0.000001
637,500 USD 3,559,216 0.15
MERR.L.05-26.12.09 0.000001 WRT/MAH.UG.ST.
505,727 USD 778,966 0.03
MERR.LYN.INTL-8.06.09 0.000001 WRT AMTEK ______________________
400,000 USD 2,532,532 0.10
6,870,714 0.28 ______________________
NETHERLANDS
ABN AM 06-30.6.09 WRT/JSP IN 25,000 USD 1,306,963 0.05
ABN AMRO 06-30.6.09 WRT/JSW ST. 60,000 USD 1,223,724 0.05
ABN AMRO 07-30.6.09WRT/WIPRO 75,000 USD 823,573 0.04
ABN AMRO 30/06/2009 WRT/HCL INF 0 ______________________
928,767 USD 3,702,517 0.15
7,056,777 0.29 ______________________
NETHERLANDS ANTILLES
MERR.LYNCH 07-21.08.2012 0.000001 WRT/PURAV
300,000 USD 1,809,309 0.07
MERRLYNCH 05-2.11.10 0.000001 WRT/WIPRO ______________________
100,000 USD 1,098,599 0.05
2,907,908 0.12 ______________________
UNITED STATES
CITIGR GLBL 04-20.10.12 0.00001/IND R&I
49,671 USD 1,740,225 0.07
CITIGRP -24.10.12 0.00001 WRT /TATA PWR ______________________
50,000 USD 1,480,231 0.06
3,220,456 0.13 ______________________ TOTAL WARRANTS / EQUITY LINKED SECURITIES 45,681,289 1.87 ______________________ TOTAL TRANSFERABLE SECURITIES ADMITTED TO AN OFFICIAL STOCK EXCHANGE LISTING 2,256,741,574 92.41 ______________________
Description Quantity Currency Evaluation % netassets
TRANSFERABLE SECURITIES TRADED ON ANOTHER REGULATED MARKET
SHARES
INDIA
CHI INVESTMENTS LTD. 109,618 176,675 0.01
INDIABULLS SECURITIES LTD 98,637 736,726 0.03 ______________________
913,401 0.04 ______________________ TOTAL SHARES 913,401 0.04 ______________________ TOTAL TRANSFERABLE SECURITIES TRADED ON ANOTHER REGULATED MARKET 913,401 0.04 ______________________
OTHER TRANSFERABLE SECURITIES
SHARES
FEDERATION OF RUSSIA
MAGNIT JSC 200,398 USD 9,608,862 0.39 ______________________
9,608,862 0.39 ______________________ TOTAL SHARES 9,608,862 0.39 ______________________
WARRANTS / EQUITY LINKED SECURITIES
CAYMAN ISLANDS
MORGAN ST.07-19.11.10 0.0001 WRT/KKC
125,000 USD 954,235 0.04
MSDW ASIA-22.10.12 0.0001 WRT/MAHINDRA ______________________
205,320 USD 3,517,056 0.14
4,471,291 0.18 ______________________
GERMANY
DT.BK 06-2.2.11 WRT GAZPROM 0 147 USD 184,433,396 7.55 ______________________
184,433,396 7.55 ______________________
GREAT BRITAIN
DT.BK 07-24.01.17 0.000001 WRT/MAHINDRA
235,000 USD 4,025,463 0.16
HSBC 08-1.2.10 WRT/ RELIANCE 57,567 USD 465,405 0.02
UBS 07-8.11.10 WRT/DR REDDY S LAB
315,000 USD 4,704,704 0.19
UBS LDN 0% 08-27/12/2010WRT/ PEN
100,000 USD 227,700 0.01
UBS LDN 07-15/02/2010WRT/MAHINDRA
102,656 USD 158,229 0.01
UBS LDN.07-23/07/2010WRT/JSW STEE ______________________
25,000 USD 510,447 0.02
10,091,948 0.41 ______________________
JERSEY
JP MORG.INTL 06-26.10.09WRT/EQ 75,000 USD 299,643 0.01
JPM.INT.07-26.6.12WRT/CUMMINS 54,022 USD 412,398 0.02 ______________________
712,041 0.03 ______________________
HSBC Global Investment Funds 176
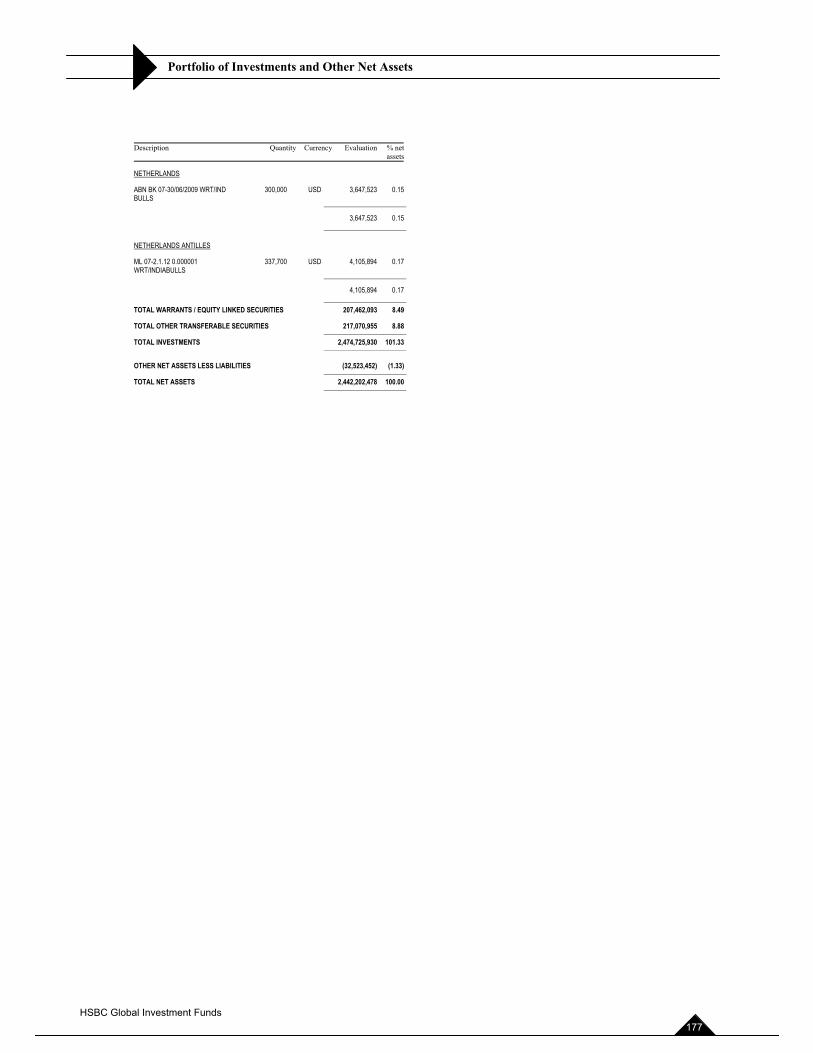
Portfolio of Investments and Other Net Assets
Description Quantity Currency Evaluation % netassets
NETHERLANDS
ABN BK 07-30/06/2009 WRT/IND BULLS ______________________
300,000 USD 3,647,523 0.15
3,647,523 0.15 ______________________
NETHERLANDS ANTILLES
ML 07-2.1.12 0.000001 WRT/INDIABULLS
337,700 USD 4,105,894 0.17
______________________
4,105,894 0.17 ______________________ TOTAL WARRANTS / EQUITY LINKED SECURITIES 207,462,093 8.49
TOTAL OTHER TRANSFERABLE SECURITIES 217,070,955 8.88 ______________________ TOTAL INVESTMENTS 2,474,725,930 101.33 ______________________
OTHER NET ASSETS LESS LIABILITIES (32,523,452) (1.33) ______________________ TOTAL NET ASSETS 2,442,202,478 100.00 ______________________
HSBC Global Investment Funds 177
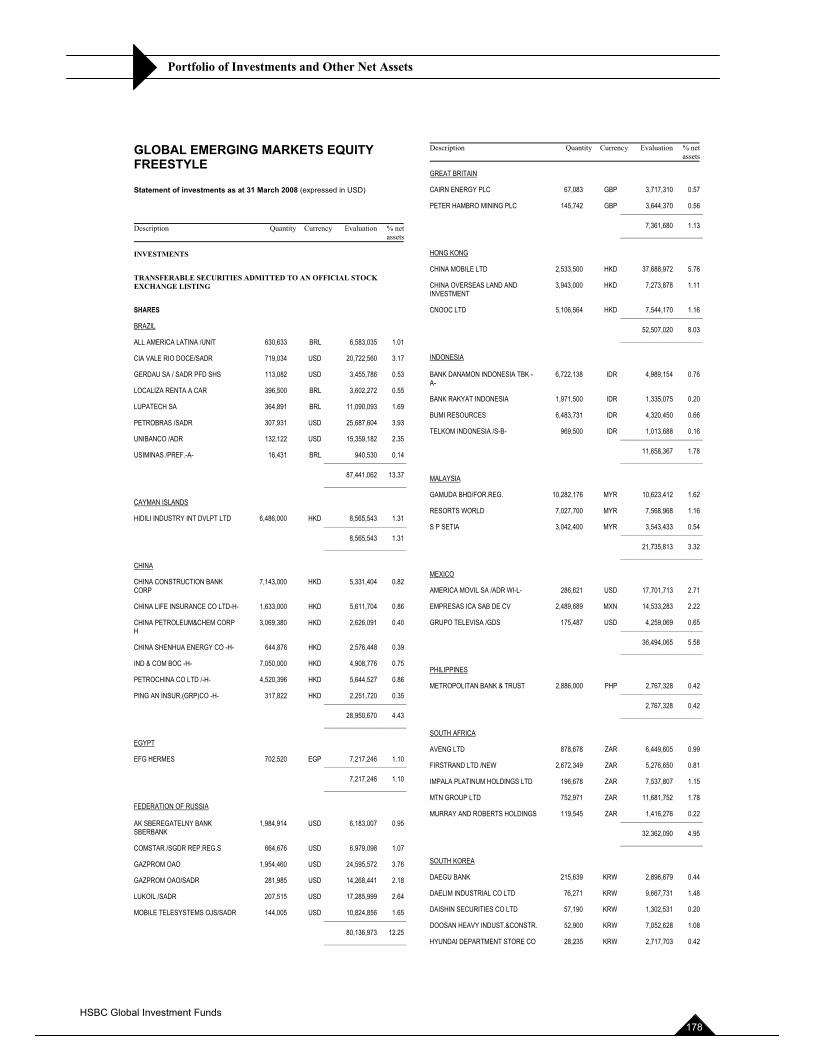
Portfolio of Investments and Other Net Assets
GLOBAL EMERGING MARKETS EQUITY FREESTYLE
Statement of investments as at 31 March 2008 (expressed in USD)
Description Quantity Currency Evaluation % netassets
INVESTMENTS
TRANSFERABLE SECURITIES ADMITTED TO AN OFFICIAL STOCK EXCHANGE LISTING
SHARES
BRAZIL
ALL AMERICA LATINA /UNIT 630,633 BRL 6,583,035 1.01
CIA VALE RIO DOCE/SADR 719,034 USD 20,722,560 3.17
GERDAU SA / SADR PFD SHS 113,082 USD 3,455,786 0.53
LOCALIZA RENTA A CAR 396,500 BRL 3,602,272 0.55
LUPATECH SA 364,891 BRL 11,090,093 1.69
PETROBRAS /SADR 307,931 USD 25,687,604 3.93
UNIBANCO /ADR 132,122 USD 15,359,182 2.35
USIMINAS /PREF.-A- 16,431 BRL 940,530 0.14 ______________________
87,441,062 13.37 ______________________
CAYMAN ISLANDS
HIDILI INDUSTRY INT DVLPT LTD 6,486,000 HKD 8,565,543 1.31 ______________________
8,565,543 1.31 ______________________
CHINA
CHINA CONSTRUCTION BANK CORP
7,143,000 HKD 5,331,404 0.82
CHINA LIFE INSURANCE CO LTD-H- 1,633,000 HKD 5,611,704 0.86
CHINA PETROLEUM&CHEM CORP H
3,069,380 HKD 2,626,091 0.40
CHINA SHENHUA ENERGY CO -H- 644,876 HKD 2,576,448 0.39
IND & COM BOC -H- 7,050,000 HKD 4,908,776 0.75
PETROCHINA CO LTD /-H- 4,520,396 HKD 5,644,527 0.86
PING AN INSUR.(GRP)CO -H- 317,822 HKD 2,251,720 0.35 ______________________
28,950,670 4.43 ______________________
EGYPT
EFG HERMES 702,520 EGP 7,217,246 1.10 ______________________
7,217,246 1.10 ______________________
FEDERATION OF RUSSIA
AK SBEREGATELNY BANK SBERBANK
1,984,914 USD 6,183,007 0.95
COMSTAR /SGDR REP.REG.S 664,676 USD 6,979,098 1.07
GAZPROM OAO 1,954,460 USD 24,595,572 3.76
GAZPROM OAO/SADR 281,985 USD 14,268,441 2.18
LUKOIL /SADR 207,515 USD 17,285,999 2.64
MOBILE TELESYSTEMS OJS/SADR 144,005 USD 10,824,856 1.65 ______________________
80,136,973 12.25 ______________________
Description Quantity Currency Evaluation % netassets
GREAT BRITAIN
CAIRN ENERGY PLC 67,083 GBP 3,717,310 0.57
PETER HAMBRO MINING PLC 145,742 GBP 3,644,370 0.56 ______________________
7,361,680 1.13 ______________________
HONG KONG
CHINA MOBILE LTD 2,533,500 HKD 37,688,972 5.76
CHINA OVERSEAS LAND AND INVESTMENT
3,943,000 HKD 7,273,878 1.11
CNOOC LTD 5,106,564 HKD 7,544,170 1.16 ______________________
52,507,020 8.03 ______________________
INDONESIA
BANK DANAMON INDONESIA TBK -A-
6,722,138 IDR 4,989,154 0.76
BANK RAKYAT INDONESIA 1,971,500 IDR 1,335,075 0.20
BUMI RESOURCES 6,483,731 IDR 4,320,450 0.66
TELKOM INDONESIA /S-B- 969,500 IDR 1,013,688 0.16 ______________________
11,658,367 1.78 ______________________
MALAYSIA
GAMUDA BHD/FOR.REG. 10,282,176 MYR 10,623,412 1.62
RESORTS WORLD 7,027,700 MYR 7,568,968 1.16
S P SETIA 3,042,400 MYR 3,543,433 0.54 ______________________
21,735,813 3.32 ______________________
MEXICO
AMERICA MOVIL SA /ADR WI-L- 286,621 USD 17,701,713 2.71
EMPRESAS ICA SAB DE CV 2,489,689 MXN 14,533,283 2.22
GRUPO TELEVISA /GDS 175,487 USD 4,259,069 0.65 ______________________
36,494,065 5.58 ______________________
PHILIPPINES
METROPOLITAN BANK & TRUST 2,886,000 PHP 2,767,328 0.42 ______________________
2,767,328 0.42 ______________________
SOUTH AFRICA
AVENG LTD 878,678 ZAR 6,449,605 0.99
FIRSTRAND LTD /NEW 2,672,349 ZAR 5,276,650 0.81
IMPALA PLATINUM HOLDINGS LTD 196,678 ZAR 7,537,807 1.15
MTN GROUP LTD 752,971 ZAR 11,681,752 1.78
MURRAY AND ROBERTS HOLDINGS 119,545 ZAR 1,416,276 0.22 ______________________
32,362,090 4.95 ______________________
SOUTH KOREA
DAEGU BANK 215,639 KRW 2,896,679 0.44
DAELIM INDUSTRIAL CO LTD 76,271 KRW 9,667,731 1.48
DAISHIN SECURITIES CO LTD 57,190 KRW 1,302,531 0.20
DOOSAN HEAVY INDUST.&CONSTR. 52,900 KRW 7,052,628 1.08
HYUNDAI DEPARTMENT STORE CO 28,235 KRW 2,717,703 0.42
HSBC Global Investment Funds 178
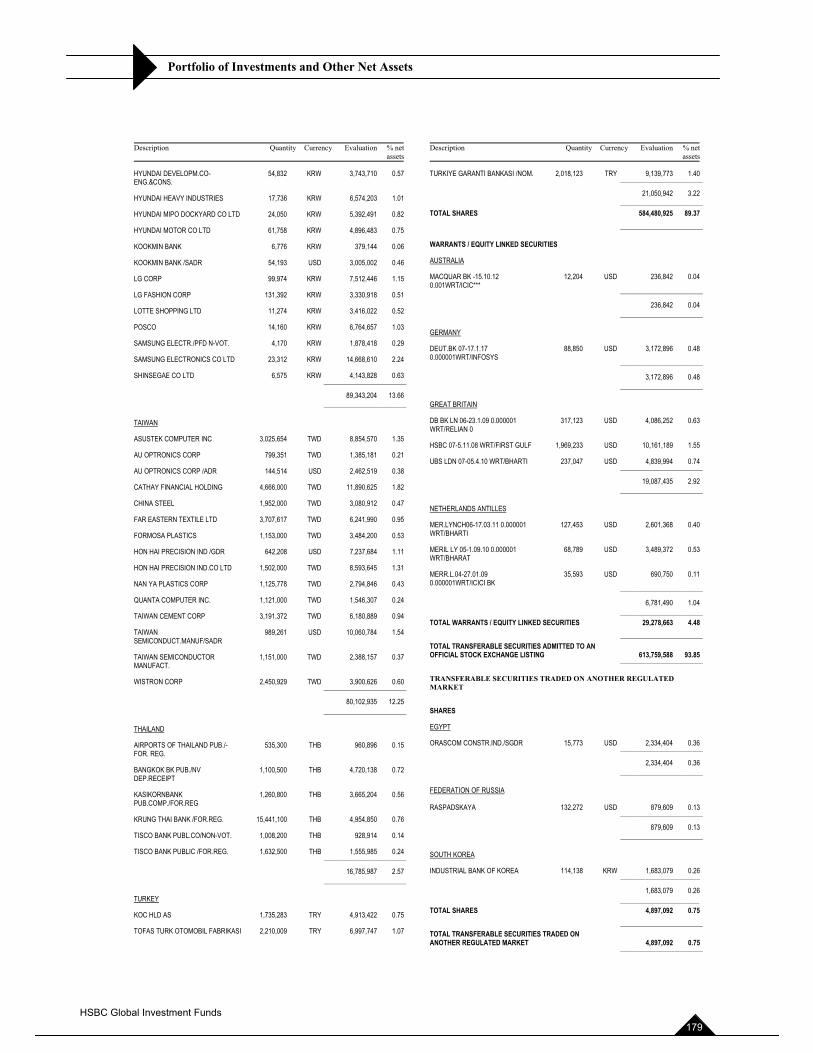
Portfolio of Investments and Other Net Assets
Description Quantity Currency Evaluation % netassets
HYUNDAI DEVELOPM.CO-ENG.&CONS.
54,832 KRW 3,743,710 0.57
HYUNDAI HEAVY INDUSTRIES 17,736 KRW 6,574,203 1.01
HYUNDAI MIPO DOCKYARD CO LTD 24,050 KRW 5,392,491 0.82
HYUNDAI MOTOR CO LTD 61,758 KRW 4,896,483 0.75
KOOKMIN BANK 6,776 KRW 379,144 0.06
KOOKMIN BANK /SADR 54,193 USD 3,005,002 0.46
LG CORP 99,974 KRW 7,512,446 1.15
LG FASHION CORP 131,392 KRW 3,330,918 0.51
LOTTE SHOPPING LTD 11,274 KRW 3,416,022 0.52
POSCO 14,160 KRW 6,764,657 1.03
SAMSUNG ELECTR./PFD N-VOT. 4,170 KRW 1,878,418 0.29
SAMSUNG ELECTRONICS CO LTD 23,312 KRW 14,668,610 2.24
SHINSEGAE CO LTD 6,575 KRW 4,143,828 0.63 ______________________
89,343,204 13.66 ______________________
TAIWAN
ASUSTEK COMPUTER INC 3,025,654 TWD 8,854,570 1.35
AU OPTRONICS CORP 799,351 TWD 1,385,181 0.21
AU OPTRONICS CORP /ADR 144,514 USD 2,462,519 0.38
CATHAY FINANCIAL HOLDING 4,666,000 TWD 11,890,625 1.82
CHINA STEEL 1,952,000 TWD 3,080,912 0.47
FAR EASTERN TEXTILE LTD 3,707,617 TWD 6,241,990 0.95
FORMOSA PLASTICS 1,153,000 TWD 3,484,200 0.53
HON HAI PRECISION IND /GDR 642,208 USD 7,237,684 1.11
HON HAI PRECISION IND.CO LTD 1,502,000 TWD 8,593,645 1.31
NAN YA PLASTICS CORP 1,125,778 TWD 2,794,846 0.43
QUANTA COMPUTER INC. 1,121,000 TWD 1,546,307 0.24
TAIWAN CEMENT CORP 3,191,372 TWD 6,180,889 0.94
TAIWANSEMICONDUCT.MANUF/SADR
989,261 USD 10,060,784 1.54
TAIWAN SEMICONDUCTOR MANUFACT.
1,151,000 TWD 2,388,157 0.37
WISTRON CORP 2,450,929 TWD 3,900,626 0.60 ______________________
80,102,935 12.25 ______________________
THAILAND
AIRPORTS OF THAILAND PUB./-FOR. REG.
535,300 THB 960,896 0.15
BANGKOK BK PUB./NV DEP.RECEIPT
1,100,500 THB 4,720,138 0.72
KASIKORNBANK PUB.COMP./FOR.REG
1,260,800 THB 3,665,204 0.56
KRUNG THAI BANK /FOR.REG. 15,441,100 THB 4,954,850 0.76
TISCO BANK PUBL.CO/NON-VOT. 1,008,200 THB 928,914 0.14
TISCO BANK PUBLIC /FOR.REG. 1,632,500 THB 1,555,985 0.24 ______________________
16,785,987 2.57 ______________________
TURKEY
KOC HLD AS 1,735,283 TRY 4,913,422 0.75
TOFAS TURK OTOMOBIL FABRIKASI 2,210,009 TRY 6,997,747 1.07
Description Quantity Currency Evaluation % netassets
TURKIYE GARANTI BANKASI /NOM. 2,018,123 TRY 9,139,773 1.40 ______________________
21,050,942 3.22 ______________________ TOTAL SHARES 584,480,925 89.37 ______________________
WARRANTS / EQUITY LINKED SECURITIES
AUSTRALIA
MACQUAR BK -15.10.12 0.001WRT/ICIC***
12,204 USD 236,842 0.04
______________________
236,842 0.04 ______________________
GERMANY
DEUT.BK 07-17.1.17 0.000001WRT/INFOSYS ______________________
88,850 USD 3,172,896 0.48
3,172,896 0.48 ______________________
GREAT BRITAIN
DB BK LN 06-23.1.09 0.000001 WRT/RELIAN 0
317,123 USD 4,086,252 0.63
HSBC 07-5.11.08 WRT/FIRST GULF 1,969,233 USD 10,161,189 1.55
UBS LDN 07-05.4.10 WRT/BHARTI 237,047 USD 4,839,994 0.74 ______________________
19,087,435 2.92 ______________________
NETHERLANDS ANTILLES
MER.LYNCH06-17.03.11 0.000001 WRT/BHARTI
127,453 USD 2,601,368 0.40
MERIL LY 05-1.09.10 0.000001 WRT/BHARAT
68,789 USD 3,489,372 0.53
MERR.L.04-27.01.09 0.000001WRT/ICICI BK ______________________
35,593 USD 690,750 0.11
6,781,490 1.04 ______________________ TOTAL WARRANTS / EQUITY LINKED SECURITIES 29,278,663 4.48 ______________________ TOTAL TRANSFERABLE SECURITIES ADMITTED TO AN OFFICIAL STOCK EXCHANGE LISTING 613,759,588 93.85 ______________________
TRANSFERABLE SECURITIES TRADED ON ANOTHER REGULATED MARKET
SHARES
EGYPT
ORASCOM CONSTR.IND./SGDR 15,773 USD 2,334,404 0.36 ______________________
2,334,404 0.36 ______________________
FEDERATION OF RUSSIA
RASPADSKAYA 132,272 USD 879,609 0.13 ______________________
879,609 0.13 ______________________
SOUTH KOREA
INDUSTRIAL BANK OF KOREA 114,138 KRW 1,683,079 0.26 ______________________
1,683,079 0.26 ______________________TOTAL SHARES 4,897,092 0.75 ______________________ TOTAL TRANSFERABLE SECURITIES TRADED ON ANOTHER REGULATED MARKET 4,897,092 0.75 ______________________
HSBC Global Investment Funds 179
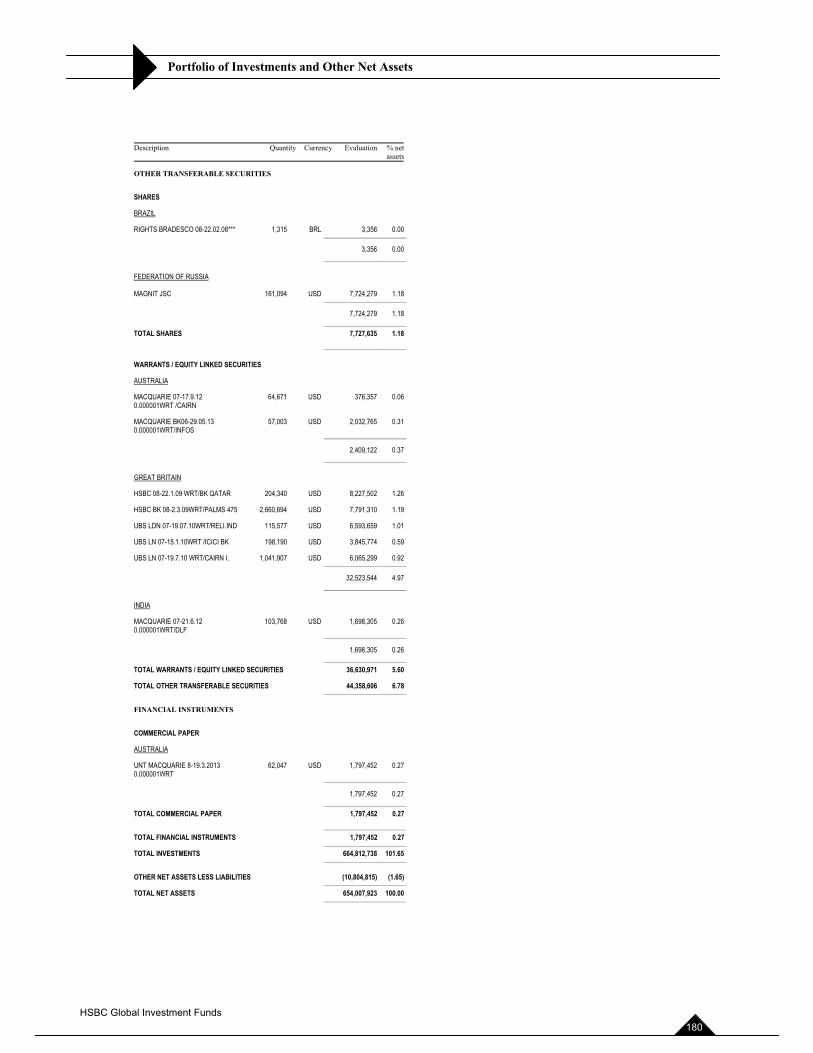
Portfolio of Investments and Other Net Assets
Description Quantity Currency Evaluation % netassets
OTHER TRANSFERABLE SECURITIES
SHARES
BRAZIL
RIGHTS BRADESCO 08-22.02.08*** 1,315 BRL 3,356 0.00 ______________________
3,356 0.00 ______________________
FEDERATION OF RUSSIA
MAGNIT JSC 161,094 USD 7,724,279 1.18 ______________________
7,724,279 1.18 ______________________ TOTAL SHARES 7,727,635 1.18 ______________________
WARRANTS / EQUITY LINKED SECURITIES
AUSTRALIA
MACQUARIE 07-17.9.12 0.000001WRT /CAIRN
64,671 USD 376,357 0.06
MACQUARIE BK06-29.05.13 0.000001WRT/INFOS ______________________
57,003 USD 2,032,765 0.31
2,409,122 0.37 ______________________
GREAT BRITAIN
HSBC 08-22.1.09 WRT/BK QATAR 204,340 USD 8,227,502 1.26
HSBC BK 08-2.3.09WRT/PALMS 475 2,660,694 USD 7,791,310 1.19
UBS LDN 07-19.07.10WRT/RELI.IND 115,577 USD 6,593,659 1.01
UBS LN 07-15.1.10WRT /ICICI BK 198,190 USD 3,845,774 0.59
UBS LN 07-19.7.10 WRT/CAIRN I. 1,041,907 USD 6,065,299 0.92 ______________________
32,523,544 4.97 ______________________
INDIA
MACQUARIE 07-21.6.12 0.000001WRT/DLF ______________________
103,768 USD 1,698,305 0.26
1,698,305 0.26 ______________________ TOTAL WARRANTS / EQUITY LINKED SECURITIES 36,630,971 5.60
TOTAL OTHER TRANSFERABLE SECURITIES 44,358,606 6.78 ______________________
FINANCIAL INSTRUMENTS
COMMERCIAL PAPER
AUSTRALIA
UNT MACQUARIE 8-19.3.2013 0.000001WRT ______________________
62,047 USD 1,797,452 0.27
1,797,452 0.27 ______________________ TOTAL COMMERCIAL PAPER 1,797,452 0.27 ______________________ TOTAL FINANCIAL INSTRUMENTS 1,797,452 0.27 ______________________ TOTAL INVESTMENTS 664,812,738 101.65 ______________________
OTHER NET ASSETS LESS LIABILITIES (10,804,815) (1.65) ______________________ TOTAL NET ASSETS 654,007,923 100.00 ______________________
HSBC Global Investment Funds 180
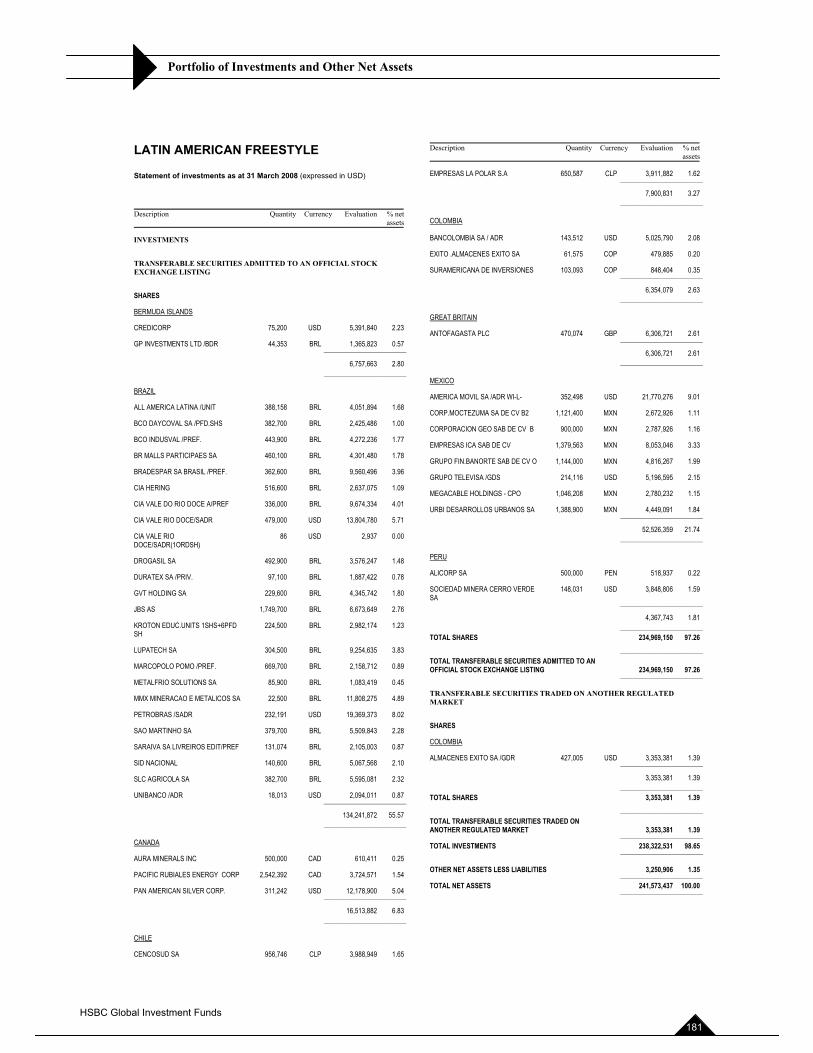
Portfolio of Investments and Other Net Assets
LATIN AMERICAN FREESTYLE
Statement of investments as at 31 March 2008 (expressed in USD)
Description Quantity Currency Evaluation % netassets
INVESTMENTS
TRANSFERABLE SECURITIES ADMITTED TO AN OFFICIAL STOCK EXCHANGE LISTING
SHARES
BERMUDA ISLANDS
CREDICORP 75,200 USD 5,391,840 2.23
GP INVESTMENTS LTD /BDR 44,353 BRL 1,365,823 0.57 ______________________
6,757,663 2.80 ______________________
BRAZIL
ALL AMERICA LATINA /UNIT 388,158 BRL 4,051,894 1.68
BCO DAYCOVAL SA /PFD.SHS 382,700 BRL 2,425,486 1.00
BCO INDUSVAL /PREF. 443,900 BRL 4,272,236 1.77
BR MALLS PARTICIPAES SA 460,100 BRL 4,301,480 1.78
BRADESPAR SA BRASIL /PREF. 362,600 BRL 9,560,496 3.96
CIA HERING 516,600 BRL 2,637,075 1.09
CIA VALE DO RIO DOCE A/PREF 336,000 BRL 9,674,334 4.01
CIA VALE RIO DOCE/SADR 479,000 USD 13,804,780 5.71
CIA VALE RIO DOCE/SADR(1ORDSH)
86 USD 2,937 0.00
DROGASIL SA 492,900 BRL 3,576,247 1.48
DURATEX SA /PRIV. 97,100 BRL 1,887,422 0.78
GVT HOLDING SA 229,600 BRL 4,345,742 1.80
JBS AS 1,749,700 BRL 6,673,649 2.76
KROTON EDUC.UNITS 1SHS+6PFD SH
224,500 BRL 2,982,174 1.23
LUPATECH SA 304,500 BRL 9,254,635 3.83
MARCOPOLO POMO /PREF. 669,700 BRL 2,158,712 0.89
METALFRIO SOLUTIONS SA 85,900 BRL 1,083,419 0.45
MMX MINERACAO E METALICOS SA 22,500 BRL 11,808,275 4.89
PETROBRAS /SADR 232,191 USD 19,369,373 8.02
SAO MARTINHO SA 379,700 BRL 5,509,843 2.28
SARAIVA SA LIVREIROS EDIT/PREF 131,074 BRL 2,105,003 0.87
SID NACIONAL 140,600 BRL 5,067,568 2.10
SLC AGRICOLA SA 382,700 BRL 5,595,081 2.32
UNIBANCO /ADR 18,013 USD 2,094,011 0.87 ______________________
134,241,872 55.57 ______________________
CANADA
AURA MINERALS INC 500,000 CAD 610,411 0.25
PACIFIC RUBIALES ENERGY CORP 2,542,392 CAD 3,724,571 1.54
PAN AMERICAN SILVER CORP. 311,242 USD 12,178,900 5.04 ______________________
16,513,882 6.83 ______________________
CHILE
CENCOSUD SA 956,746 CLP 3,988,949 1.65
Description Quantity Currency Evaluation % netassets
EMPRESAS LA POLAR S.A 650,587 CLP 3,911,882 1.62 ______________________
7,900,831 3.27 ______________________
COLOMBIA
BANCOLOMBIA SA / ADR 143,512 USD 5,025,790 2.08
EXITO .ALMACENES EXITO SA 61,575 COP 479,885 0.20
SURAMERICANA DE INVERSIONES 103,093 COP 848,404 0.35 ______________________
6,354,079 2.63 ______________________
GREAT BRITAIN
ANTOFAGASTA PLC 470,074 GBP 6,306,721 2.61 ______________________
6,306,721 2.61 ______________________
MEXICO
AMERICA MOVIL SA /ADR WI-L- 352,498 USD 21,770,276 9.01
CORP.MOCTEZUMA SA DE CV B2 1,121,400 MXN 2,672,926 1.11
CORPORACION GEO SAB DE CV B 900,000 MXN 2,787,926 1.16
EMPRESAS ICA SAB DE CV 1,379,563 MXN 8,053,046 3.33
GRUPO FIN.BANORTE SAB DE CV O 1,144,000 MXN 4,816,267 1.99
GRUPO TELEVISA /GDS 214,116 USD 5,196,595 2.15
MEGACABLE HOLDINGS - CPO 1,046,208 MXN 2,780,232 1.15
URBI DESARROLLOS URBANOS SA 1,388,900 MXN 4,449,091 1.84 ______________________
52,526,359 21.74 ______________________
PERU
ALICORP SA 500,000 PEN 518,937 0.22
SOCIEDAD MINERA CERRO VERDE SA ______________________
148,031 USD 3,848,806 1.59
4,367,743 1.81 ______________________ TOTAL SHARES 234,969,150 97.26 ______________________ TOTAL TRANSFERABLE SECURITIES ADMITTED TO AN OFFICIAL STOCK EXCHANGE LISTING 234,969,150 97.26 ______________________
TRANSFERABLE SECURITIES TRADED ON ANOTHER REGULATED MARKET
SHARES
COLOMBIA
ALMACENES EXITO SA /GDR 427,005 USD 3,353,381 1.39 ______________________
3,353,381 1.39 ______________________ TOTAL SHARES 3,353,381 1.39 ______________________ TOTAL TRANSFERABLE SECURITIES TRADED ON ANOTHER REGULATED MARKET 3,353,381 1.39 ______________________ TOTAL INVESTMENTS 238,322,531 98.65 ______________________
OTHER NET ASSETS LESS LIABILITIES 3,250,906 1.35 ______________________ TOTAL NET ASSETS 241,573,437 100.00 ______________________
HSBC Global Investment Funds 181
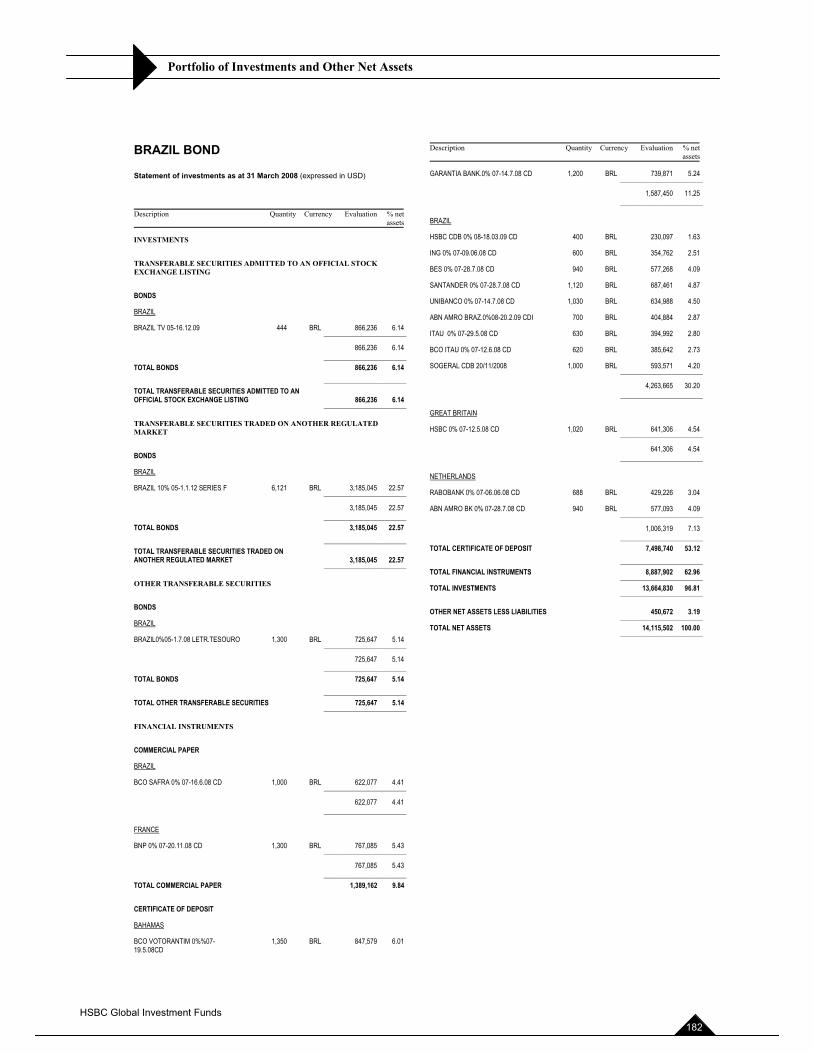
Portfolio of Investments and Other Net Assets
BRAZIL BOND
Statement of investments as at 31 March 2008 (expressed in USD)
Description Quantity Currency Evaluation % netassets
INVESTMENTS
TRANSFERABLE SECURITIES ADMITTED TO AN OFFICIAL STOCK EXCHANGE LISTING
BONDS
BRAZIL
BRAZIL TV 05-16.12.09 444 BRL 866,236 6.14 ______________________
866,236 6.14 ______________________ TOTAL BONDS 866,236 6.14 ______________________ TOTAL TRANSFERABLE SECURITIES ADMITTED TO AN OFFICIAL STOCK EXCHANGE LISTING 866,236 6.14 ______________________
TRANSFERABLE SECURITIES TRADED ON ANOTHER REGULATED MARKET
BONDS
BRAZIL
BRAZIL 10% 05-1.1.12 SERIES F 6,121 BRL 3,185,045 22.57 ______________________
3,185,045 22.57 ______________________ TOTAL BONDS 3,185,045 22.57 ______________________ TOTAL TRANSFERABLE SECURITIES TRADED ON ANOTHER REGULATED MARKET 3,185,045 22.57 ______________________
OTHER TRANSFERABLE SECURITIES
BONDS
BRAZIL
BRAZIL0%05-1.7.08 LETR.TESOURO 1,300 BRL 725,647 5.14 ______________________
725,647 5.14 ______________________ TOTAL BONDS 725,647 5.14 ______________________ TOTAL OTHER TRANSFERABLE SECURITIES 725,647 5.14 ______________________
FINANCIAL INSTRUMENTS
COMMERCIAL PAPER
BRAZIL
BCO SAFRA 0% 07-16.6.08 CD 1,000 BRL 622,077 4.41 ______________________
622,077 4.41 ______________________
FRANCE
BNP 0% 07-20.11.08 CD 1,300 BRL 767,085 5.43 ______________________
767,085 5.43 ______________________ TOTAL COMMERCIAL PAPER 1,389,162 9.84
CERTIFICATE OF DEPOSIT
BAHAMAS
BCO VOTORANTIM 0%%07-19.5.08CD
1,350 BRL 847,579 6.01
Description Quantity Currency Evaluation % netassets
GARANTIA BANK.0% 07-14.7.08 CD 1,200 BRL 739,871 5.24 ______________________
1,587,450 11.25 ______________________
BRAZIL
HSBC CDB 0% 08-18.03.09 CD 400 BRL 230,097 1.63
ING 0% 07-09.06.08 CD 600 BRL 354,762 2.51
BES 0% 07-28.7.08 CD 940 BRL 577,268 4.09
SANTANDER 0% 07-28.7.08 CD 1,120 BRL 687,461 4.87
UNIBANCO 0% 07-14.7.08 CD 1,030 BRL 634,988 4.50
ABN AMRO BRAZ.0%08-20.2.09 CDI 700 BRL 404,884 2.87
ITAU 0% 07-29.5.08 CD 630 BRL 394,992 2.80
BCO ITAU 0% 07-12.6.08 CD 620 BRL 385,642 2.73
SOGERAL CDB 20/11/2008 1,000 BRL 593,571 4.20 ______________________
4,263,665 30.20 ______________________
GREAT BRITAIN
HSBC 0% 07-12.5.08 CD 1,020 BRL 641,306 4.54 ______________________
641,306 4.54 ______________________
NETHERLANDS
RABOBANK 0% 07-06.06.08 CD 688 BRL 429,226 3.04
ABN AMRO BK 0% 07-28.7.08 CD 940 BRL 577,093 4.09 ______________________
1,006,319 7.13 ______________________ TOTAL CERTIFICATE OF DEPOSIT 7,498,740 53.12 ______________________ TOTAL FINANCIAL INSTRUMENTS 8,887,902 62.96 ______________________ TOTAL INVESTMENTS 13,664,830 96.81 ______________________
OTHER NET ASSETS LESS LIABILITIES 450,672 3.19 ______________________ TOTAL NET ASSETS 14,115,502 100.00 ______________________
HSBC Global Investment Funds 182
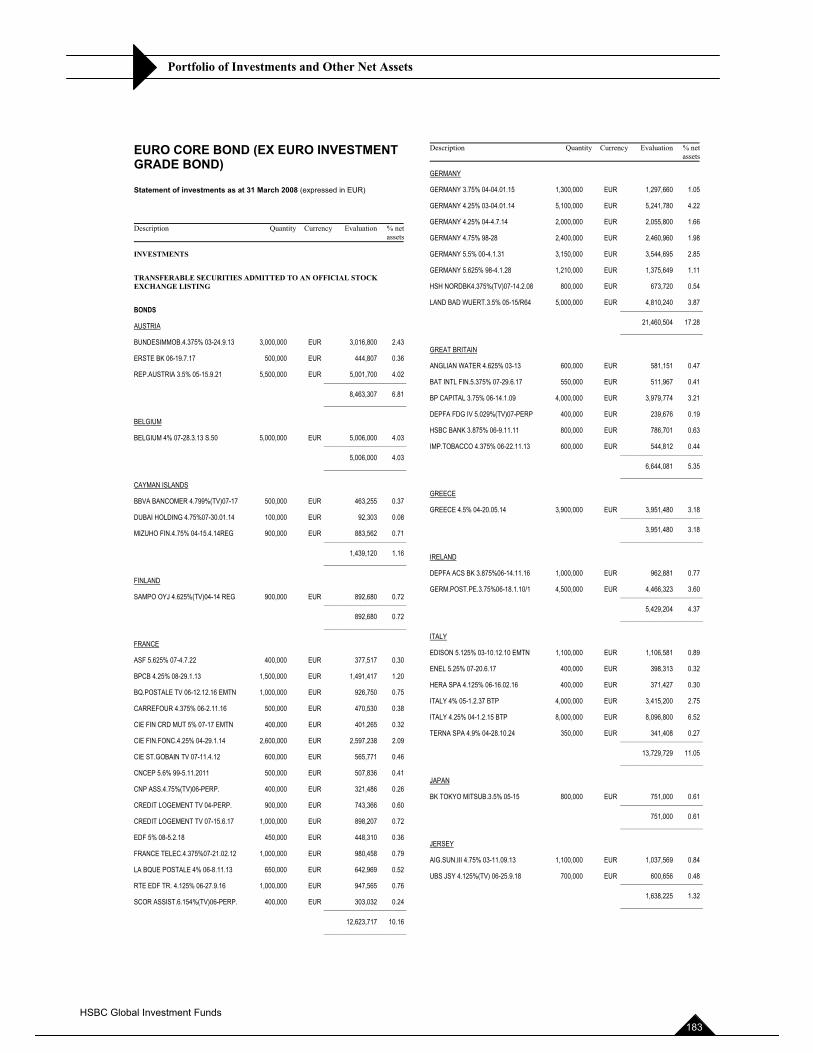
Portfolio of Investments and Other Net Assets
EURO CORE BOND (EX EURO INVESTMENT GRADE BOND)
Statement of investments as at 31 March 2008 (expressed in EUR)
Description Quantity Currency Evaluation % netassets
INVESTMENTS
TRANSFERABLE SECURITIES ADMITTED TO AN OFFICIAL STOCK EXCHANGE LISTING
BONDS
AUSTRIA
BUNDESIMMOB.4.375% 03-24.9.13 3,000,000 EUR 3,016,800 2.43
ERSTE BK 06-19.7.17 500,000 EUR 444,807 0.36
REP.AUSTRIA 3.5% 05-15.9.21 5,500,000 EUR 5,001,700 4.02 ______________________
8,463,307 6.81 ______________________
BELGIUM
BELGIUM 4% 07-28.3.13 S.50 5,000,000 EUR 5,006,000 4.03 ______________________
5,006,000 4.03 ______________________
CAYMAN ISLANDS
BBVA BANCOMER 4.799%(TV)07-17 500,000 EUR 463,255 0.37
DUBAI HOLDING 4.75%07-30.01.14 100,000 EUR 92,303 0.08
MIZUHO FIN.4.75% 04-15.4.14REG 900,000 EUR 883,562 0.71 ______________________
1,439,120 1.16 ______________________
FINLAND
SAMPO OYJ 4.625%(TV)04-14 REG 900,000 EUR 892,680 0.72 ______________________
892,680 0.72 ______________________
FRANCE
ASF 5.625% 07-4.7.22 400,000 EUR 377,517 0.30
BPCB 4.25% 08-29.1.13 1,500,000 EUR 1,491,417 1.20
BQ.POSTALE TV 06-12.12.16 EMTN 1,000,000 EUR 926,750 0.75
CARREFOUR 4.375% 06-2.11.16 500,000 EUR 470,530 0.38
CIE FIN CRD MUT 5% 07-17 EMTN 400,000 EUR 401,265 0.32
CIE FIN.FONC.4.25% 04-29.1.14 2,600,000 EUR 2,597,238 2.09
CIE ST.GOBAIN TV 07-11.4.12 600,000 EUR 565,771 0.46
CNCEP 5.6% 99-5.11.2011 500,000 EUR 507,836 0.41
CNP ASS.4.75%(TV)06-PERP. 400,000 EUR 321,486 0.26
CREDIT LOGEMENT TV 04-PERP. 900,000 EUR 743,366 0.60
CREDIT LOGEMENT TV 07-15.6.17 1,000,000 EUR 898,207 0.72
EDF 5% 08-5.2.18 450,000 EUR 448,310 0.36
FRANCE TELEC.4.375%07-21.02.12 1,000,000 EUR 980,458 0.79
LA BQUE POSTALE 4% 06-8.11.13 650,000 EUR 642,969 0.52
RTE EDF TR. 4.125% 06-27.9.16 1,000,000 EUR 947,565 0.76
SCOR ASSIST.6.154%(TV)06-PERP. 400,000 EUR 303,032 0.24 ______________________
12,623,717 10.16 ______________________
Description Quantity Currency Evaluation % netassets
GERMANY
GERMANY 3.75% 04-04.01.15 1,300,000 EUR 1,297,660 1.05
GERMANY 4.25% 03-04.01.14 5,100,000 EUR 5,241,780 4.22
GERMANY 4.25% 04-4.7.14 2,000,000 EUR 2,055,800 1.66
GERMANY 4.75% 98-28 2,400,000 EUR 2,460,960 1.98
GERMANY 5.5% 00-4.1.31 3,150,000 EUR 3,544,695 2.85
GERMANY 5.625% 98-4.1.28 1,210,000 EUR 1,375,649 1.11
HSH NORDBK4.375%(TV)07-14.2.08 800,000 EUR 673,720 0.54
LAND BAD WUERT.3.5% 05-15/R64 5,000,000 EUR 4,810,240 3.87 ______________________
21,460,504 17.28 ______________________
GREAT BRITAIN
ANGLIAN WATER 4.625% 03-13 600,000 EUR 581,151 0.47
BAT INTL FIN.5.375% 07-29.6.17 550,000 EUR 511,967 0.41
BP CAPITAL 3.75% 06-14.1.09 4,000,000 EUR 3,979,774 3.21
DEPFA FDG IV 5.029%(TV)07-PERP 400,000 EUR 239,676 0.19
HSBC BANK 3.875% 06-9.11.11 800,000 EUR 786,701 0.63
IMP.TOBACCO 4.375% 06-22.11.13 600,000 EUR 544,812 0.44 ______________________
6,644,081 5.35 ______________________
GREECE
GREECE 4.5% 04-20.05.14 3,900,000 EUR 3,951,480 3.18 ______________________
3,951,480 3.18 ______________________
IRELAND
DEPFA ACS BK 3.875%06-14.11.16 1,000,000 EUR 962,881 0.77
GERM.POST.PE.3.75%06-18.1.10/1 4,500,000 EUR 4,466,323 3.60 ______________________
5,429,204 4.37 ______________________
ITALY
EDISON 5.125% 03-10.12.10 EMTN 1,100,000 EUR 1,106,581 0.89
ENEL 5.25% 07-20.6.17 400,000 EUR 398,313 0.32
HERA SPA 4.125% 06-16.02.16 400,000 EUR 371,427 0.30
ITALY 4% 05-1.2.37 BTP 4,000,000 EUR 3,415,200 2.75
ITALY 4.25% 04-1.2.15 BTP 8,000,000 EUR 8,096,800 6.52
TERNA SPA 4.9% 04-28.10.24 350,000 EUR 341,408 0.27 ______________________
13,729,729 11.05 ______________________
JAPAN
BK TOKYO MITSUB.3.5% 05-15 800,000 EUR 751,000 0.61 ______________________
751,000 0.61 ______________________
JERSEY
AIG.SUN.III 4.75% 03-11.09.13 1,100,000 EUR 1,037,569 0.84
UBS JSY 4.125%(TV) 06-25.9.18 700,000 EUR 600,656 0.48 ______________________
1,638,225 1.32 ______________________
HSBC Global Investment Funds 183
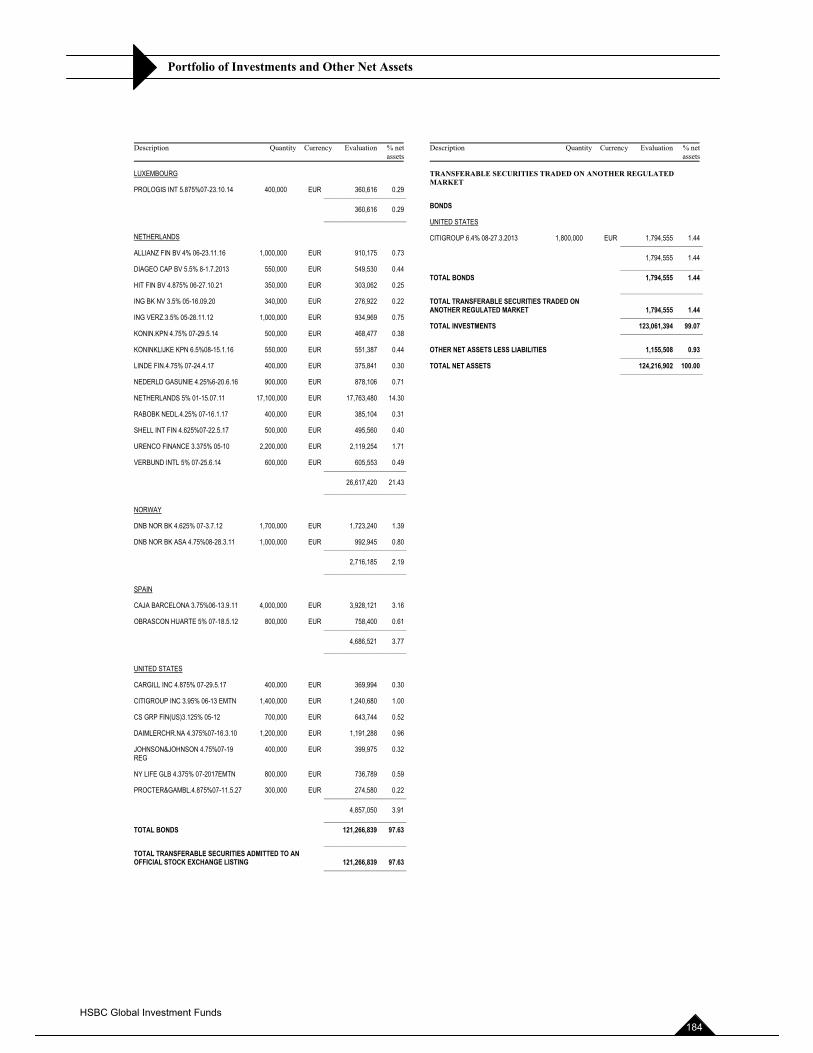
Portfolio of Investments and Other Net Assets
Description Quantity Currency Evaluation % netassets
LUXEMBOURG
PROLOGIS INT 5.875%07-23.10.14 400,000 EUR 360,616 0.29 ______________________
360,616 0.29 ______________________
NETHERLANDS
ALLIANZ FIN BV 4% 06-23.11.16 1,000,000 EUR 910,175 0.73
DIAGEO CAP BV 5.5% 8-1.7.2013 550,000 EUR 549,530 0.44
HIT FIN BV 4.875% 06-27.10.21 350,000 EUR 303,062 0.25
ING BK NV 3.5% 05-16.09.20 340,000 EUR 276,922 0.22
ING VERZ.3.5% 05-28.11.12 1,000,000 EUR 934,969 0.75
KONIN.KPN 4.75% 07-29.5.14 500,000 EUR 468,477 0.38
KONINKLIJKE KPN 6.5%08-15.1.16 550,000 EUR 551,387 0.44
LINDE FIN.4.75% 07-24.4.17 400,000 EUR 375,841 0.30
NEDERLD GASUNIE 4.25%6-20.6.16 900,000 EUR 878,106 0.71
NETHERLANDS 5% 01-15.07.11 17,100,000 EUR 17,763,480 14.30
RABOBK NEDL.4.25% 07-16.1.17 400,000 EUR 385,104 0.31
SHELL INT FIN 4.625%07-22.5.17 500,000 EUR 495,560 0.40
URENCO FINANCE 3.375% 05-10 2,200,000 EUR 2,119,254 1.71
VERBUND INTL 5% 07-25.6.14 600,000 EUR 605,553 0.49 ______________________
26,617,420 21.43 ______________________
NORWAY
DNB NOR BK 4.625% 07-3.7.12 1,700,000 EUR 1,723,240 1.39
DNB NOR BK ASA 4.75%08-28.3.11 1,000,000 EUR 992,945 0.80 ______________________
2,716,185 2.19 ______________________
SPAIN
CAJA BARCELONA 3.75%06-13.9.11 4,000,000 EUR 3,928,121 3.16
OBRASCON HUARTE 5% 07-18.5.12 800,000 EUR 758,400 0.61 ______________________
4,686,521 3.77 ______________________
UNITED STATES
CARGILL INC 4.875% 07-29.5.17 400,000 EUR 369,994 0.30
CITIGROUP INC 3.95% 06-13 EMTN 1,400,000 EUR 1,240,680 1.00
CS GRP FIN(US)3.125% 05-12 700,000 EUR 643,744 0.52
DAIMLERCHR.NA 4.375%07-16.3.10 1,200,000 EUR 1,191,288 0.96
JOHNSON&JOHNSON 4.75%07-19 REG
400,000 EUR 399,975 0.32
NY LIFE GLB 4.375% 07-2017EMTN 800,000 EUR 736,789 0.59
PROCTER&GAMBL.4.875%07-11.5.27 300,000 EUR 274,580 0.22 ______________________
4,857,050 3.91 ______________________ TOTAL BONDS 121,266,839 97.63 ______________________ TOTAL TRANSFERABLE SECURITIES ADMITTED TO AN OFFICIAL STOCK EXCHANGE LISTING 121,266,839 97.63 ______________________
Description Quantity Currency Evaluation % netassets
TRANSFERABLE SECURITIES TRADED ON ANOTHER REGULATED MARKET
BONDS
UNITED STATES
CITIGROUP 6.4% 08-27.3.2013 1,800,000 EUR 1,794,555 1.44 ______________________
1,794,555 1.44 ______________________ TOTAL BONDS 1,794,555 1.44 ______________________ TOTAL TRANSFERABLE SECURITIES TRADED ON ANOTHER REGULATED MARKET 1,794,555 1.44 ______________________ TOTAL INVESTMENTS 123,061,394 99.07 ______________________
OTHER NET ASSETS LESS LIABILITIES 1,155,508 0.93 ______________________ TOTAL NET ASSETS 124,216,902 100.00 ______________________
HSBC Global Investment Funds 184
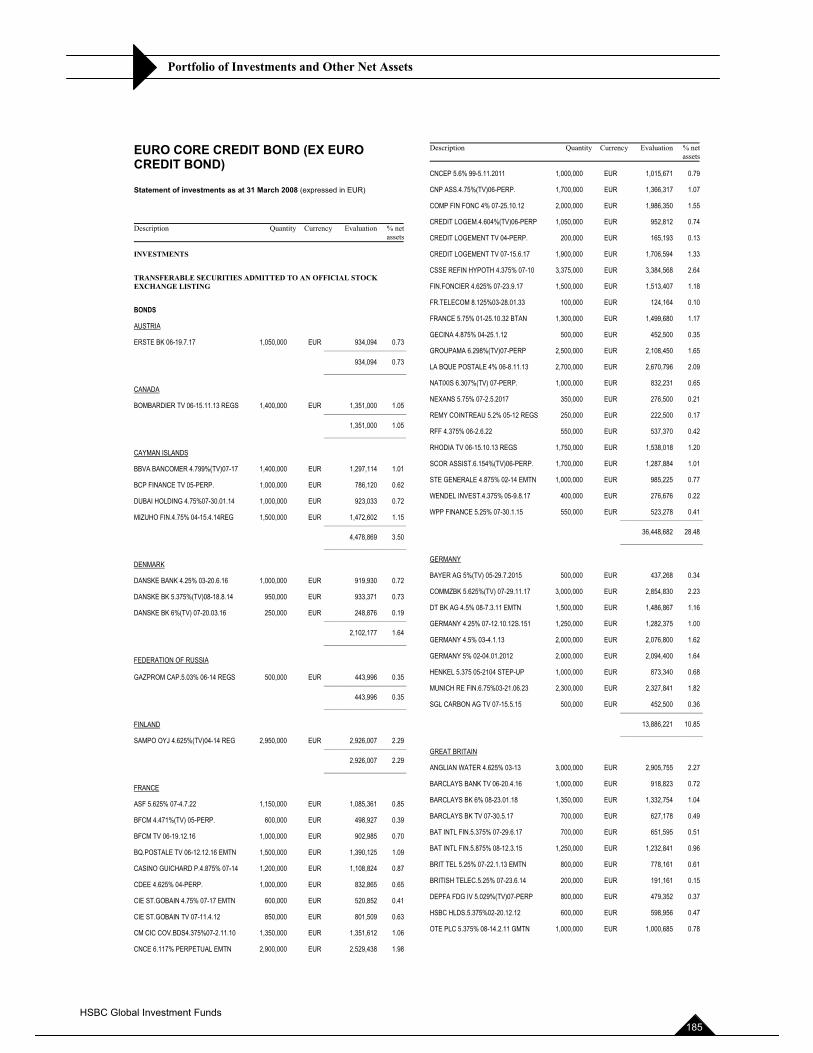
Portfolio of Investments and Other Net Assets
EURO CORE CREDIT BOND (EX EURO CREDIT BOND)
Statement of investments as at 31 March 2008 (expressed in EUR)
Description Quantity Currency Evaluation % netassets
INVESTMENTS
TRANSFERABLE SECURITIES ADMITTED TO AN OFFICIAL STOCK EXCHANGE LISTING
BONDS
AUSTRIA
ERSTE BK 06-19.7.17 1,050,000 EUR 934,094 0.73 ______________________
934,094 0.73 ______________________
CANADA
BOMBARDIER TV 06-15.11.13 REGS 1,400,000 EUR 1,351,000 1.05 ______________________
1,351,000 1.05 ______________________
CAYMAN ISLANDS
BBVA BANCOMER 4.799%(TV)07-17 1,400,000 EUR 1,297,114 1.01
BCP FINANCE TV 05-PERP. 1,000,000 EUR 786,120 0.62
DUBAI HOLDING 4.75%07-30.01.14 1,000,000 EUR 923,033 0.72
MIZUHO FIN.4.75% 04-15.4.14REG 1,500,000 EUR 1,472,602 1.15 ______________________
4,478,869 3.50 ______________________
DENMARK
DANSKE BANK 4.25% 03-20.6.16 1,000,000 EUR 919,930 0.72
DANSKE BK 5.375%(TV)08-18.8.14 950,000 EUR 933,371 0.73
DANSKE BK 6%(TV) 07-20.03.16 250,000 EUR 248,876 0.19 ______________________
2,102,177 1.64 ______________________
FEDERATION OF RUSSIA
GAZPROM CAP.5.03% 06-14 REGS 500,000 EUR 443,996 0.35 ______________________
443,996 0.35 ______________________
FINLAND
SAMPO OYJ 4.625%(TV)04-14 REG 2,950,000 EUR 2,926,007 2.29 ______________________
2,926,007 2.29 ______________________
FRANCE
ASF 5.625% 07-4.7.22 1,150,000 EUR 1,085,361 0.85
BFCM 4.471%(TV) 05-PERP. 600,000 EUR 498,927 0.39
BFCM TV 06-19.12.16 1,000,000 EUR 902,985 0.70
BQ.POSTALE TV 06-12.12.16 EMTN 1,500,000 EUR 1,390,125 1.09
CASINO GUICHARD P.4.875% 07-14 1,200,000 EUR 1,108,824 0.87
CDEE 4.625% 04-PERP. 1,000,000 EUR 832,865 0.65
CIE ST.GOBAIN 4.75% 07-17 EMTN 600,000 EUR 520,852 0.41
CIE ST.GOBAIN TV 07-11.4.12 850,000 EUR 801,509 0.63
CM CIC COV.BDS4.375%07-2.11.10 1,350,000 EUR 1,351,612 1.06
CNCE 6.117% PERPETUAL EMTN 2,900,000 EUR 2,529,438 1.98
Description Quantity Currency Evaluation % netassets
CNCEP 5.6% 99-5.11.2011 1,000,000 EUR 1,015,671 0.79
CNP ASS.4.75%(TV)06-PERP. 1,700,000 EUR 1,366,317 1.07
COMP FIN FONC 4% 07-25.10.12 2,000,000 EUR 1,986,350 1.55
CREDIT LOGEM.4.604%(TV)06-PERP 1,050,000 EUR 952,812 0.74
CREDIT LOGEMENT TV 04-PERP. 200,000 EUR 165,193 0.13
CREDIT LOGEMENT TV 07-15.6.17 1,900,000 EUR 1,706,594 1.33
CSSE REFIN HYPOTH 4.375% 07-10 3,375,000 EUR 3,384,568 2.64
FIN.FONCIER 4.625% 07-23.9.17 1,500,000 EUR 1,513,407 1.18
FR.TELECOM 8.125%03-28.01.33 100,000 EUR 124,164 0.10
FRANCE 5.75% 01-25.10.32 BTAN 1,300,000 EUR 1,499,680 1.17
GECINA 4.875% 04-25.1.12 500,000 EUR 452,500 0.35
GROUPAMA 6.298%(TV)07-PERP 2,500,000 EUR 2,108,450 1.65
LA BQUE POSTALE 4% 06-8.11.13 2,700,000 EUR 2,670,796 2.09
NATIXIS 6.307%(TV) 07-PERP. 1,000,000 EUR 832,231 0.65
NEXANS 5.75% 07-2.5.2017 350,000 EUR 276,500 0.21
REMY COINTREAU 5.2% 05-12 REGS 250,000 EUR 222,500 0.17
RFF 4.375% 06-2.6.22 550,000 EUR 537,370 0.42
RHODIA TV 06-15.10.13 REGS 1,750,000 EUR 1,538,018 1.20
SCOR ASSIST.6.154%(TV)06-PERP. 1,700,000 EUR 1,287,884 1.01
STE GENERALE 4.875% 02-14 EMTN 1,000,000 EUR 985,225 0.77
WENDEL INVEST.4.375% 05-9.8.17 400,000 EUR 276,676 0.22
WPP FINANCE 5.25% 07-30.1.15 550,000 EUR 523,278 0.41 ______________________
36,448,682 28.48 ______________________
GERMANY
BAYER AG 5%(TV) 05-29.7.2015 500,000 EUR 437,268 0.34
COMMZBK 5.625%(TV) 07-29.11.17 3,000,000 EUR 2,854,830 2.23
DT BK AG 4.5% 08-7.3.11 EMTN 1,500,000 EUR 1,486,867 1.16
GERMANY 4.25% 07-12.10.12S.151 1,250,000 EUR 1,282,375 1.00
GERMANY 4.5% 03-4.1.13 2,000,000 EUR 2,076,800 1.62
GERMANY 5% 02-04.01.2012 2,000,000 EUR 2,094,400 1.64
HENKEL 5.375 05-2104 STEP-UP 1,000,000 EUR 873,340 0.68
MUNICH RE FIN.6.75%03-21.06.23 2,300,000 EUR 2,327,841 1.82
SGL CARBON AG TV 07-15.5.15 500,000 EUR 452,500 0.36 ______________________
13,886,221 10.85 ______________________
GREAT BRITAIN
ANGLIAN WATER 4.625% 03-13 3,000,000 EUR 2,905,755 2.27
BARCLAYS BANK TV 06-20.4.16 1,000,000 EUR 918,823 0.72
BARCLAYS BK 6% 08-23.01.18 1,350,000 EUR 1,332,754 1.04
BARCLAYS BK TV 07-30.5.17 700,000 EUR 627,178 0.49
BAT INTL FIN.5.375% 07-29.6.17 700,000 EUR 651,595 0.51
BAT INTL FIN.5.875% 08-12.3.15 1,250,000 EUR 1,232,841 0.96
BRIT TEL 5.25% 07-22.1.13 EMTN 800,000 EUR 778,161 0.61
BRITISH TELEC.5.25% 07-23.6.14 200,000 EUR 191,161 0.15
DEPFA FDG IV 5.029%(TV)07-PERP 800,000 EUR 479,352 0.37
HSBC HLDS.5.375%02-20.12.12 600,000 EUR 598,956 0.47
OTE PLC 5.375% 08-14.2.11 GMTN 1,000,000 EUR 1,000,685 0.78
HSBC Global Investment Funds 185
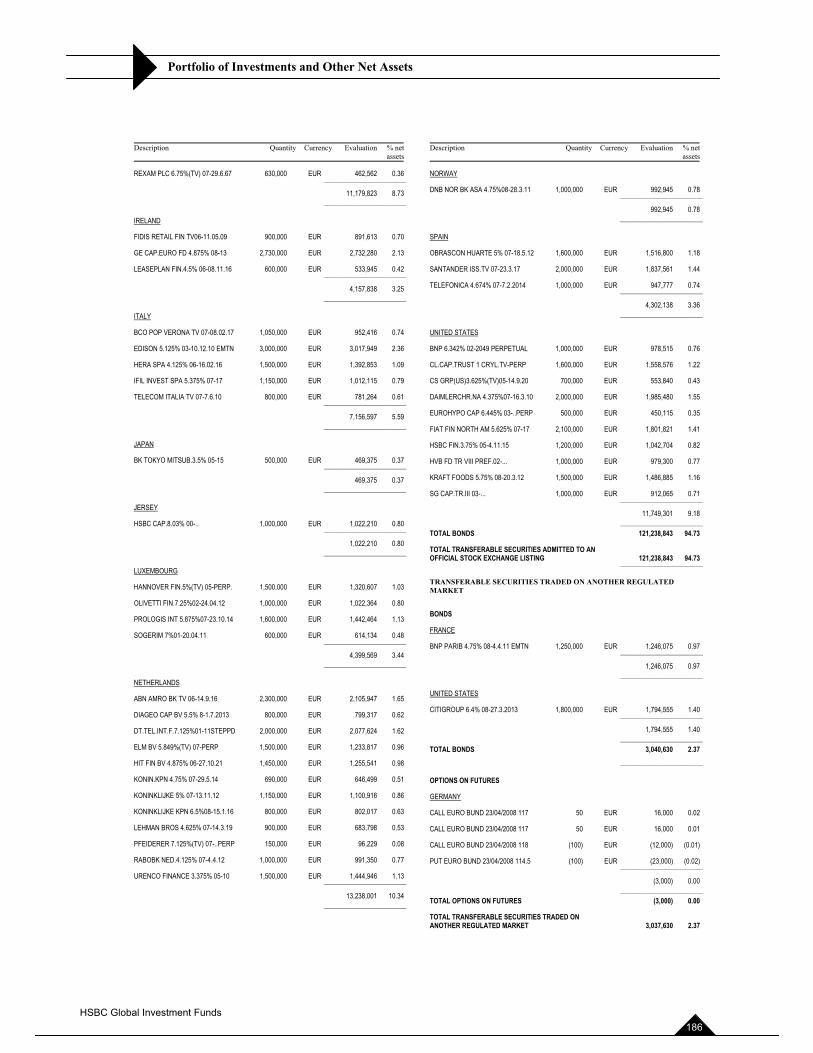
Portfolio of Investments and Other Net Assets
Description Quantity Currency Evaluation % netassets
REXAM PLC 6.75%(TV) 07-29.6.67 630,000 EUR 462,562 0.36 ______________________
11,179,823 8.73 ______________________
IRELAND
FIDIS RETAIL FIN TV06-11.05.09 900,000 EUR 891,613 0.70
GE CAP.EURO FD 4.875% 08-13 2,730,000 EUR 2,732,280 2.13
LEASEPLAN FIN.4.5% 06-08.11.16 600,000 EUR 533,945 0.42 ______________________
4,157,838 3.25 ______________________
ITALY
BCO POP VERONA TV 07-08.02.17 1,050,000 EUR 952,416 0.74
EDISON 5.125% 03-10.12.10 EMTN 3,000,000 EUR 3,017,949 2.36
HERA SPA 4.125% 06-16.02.16 1,500,000 EUR 1,392,853 1.09
IFIL INVEST SPA 5.375% 07-17 1,150,000 EUR 1,012,115 0.79
TELECOM ITALIA TV 07-7.6.10 800,000 EUR 781,264 0.61 ______________________
7,156,597 5.59 ______________________
JAPAN
BK TOKYO MITSUB.3.5% 05-15 500,000 EUR 469,375 0.37 ______________________
469,375 0.37 ______________________
JERSEY
HSBC CAP.8.03% 00-.. 1,000,000 EUR 1,022,210 0.80 ______________________
1,022,210 0.80 ______________________
LUXEMBOURG
HANNOVER FIN.5%(TV) 05-PERP. 1,500,000 EUR 1,320,607 1.03
OLIVETTI FIN.7.25%02-24.04.12 1,000,000 EUR 1,022,364 0.80
PROLOGIS INT 5.875%07-23.10.14 1,600,000 EUR 1,442,464 1.13
SOGERIM 7%01-20.04.11 600,000 EUR 614,134 0.48 ______________________
4,399,569 3.44 ______________________
NETHERLANDS
ABN AMRO BK TV 06-14.9.16 2,300,000 EUR 2,105,947 1.65
DIAGEO CAP BV 5.5% 8-1.7.2013 800,000 EUR 799,317 0.62
DT.TEL.INT.F.7.125%01-11STEPPD 2,000,000 EUR 2,077,624 1.62
ELM BV 5.849%(TV) 07-PERP 1,500,000 EUR 1,233,817 0.96
HIT FIN BV 4.875% 06-27.10.21 1,450,000 EUR 1,255,541 0.98
KONIN.KPN 4.75% 07-29.5.14 690,000 EUR 646,499 0.51
KONINKLIJKE 5% 07-13.11.12 1,150,000 EUR 1,100,916 0.86
KONINKLIJKE KPN 6.5%08-15.1.16 800,000 EUR 802,017 0.63
LEHMAN BROS 4.625% 07-14.3.19 900,000 EUR 683,798 0.53
PFEIDERER 7.125%(TV) 07-..PERP 150,000 EUR 96,229 0.08
RABOBK NED.4.125% 07-4.4.12 1,000,000 EUR 991,350 0.77
URENCO FINANCE 3.375% 05-10 1,500,000 EUR 1,444,946 1.13 ______________________
13,238,001 10.34 ______________________
Description Quantity Currency Evaluation % netassets
NORWAY
DNB NOR BK ASA 4.75%08-28.3.11 1,000,000 EUR 992,945 0.78 ______________________
992,945 0.78 ______________________
SPAIN
OBRASCON HUARTE 5% 07-18.5.12 1,600,000 EUR 1,516,800 1.18
SANTANDER ISS.TV 07-23.3.17 2,000,000 EUR 1,837,561 1.44
TELEFONICA 4.674% 07-7.2.2014 1,000,000 EUR 947,777 0.74 ______________________
4,302,138 3.36 ______________________
UNITED STATES
BNP 6.342% 02-2049 PERPETUAL 1,000,000 EUR 978,515 0.76
CL.CAP.TRUST 1 CRYL.TV-PERP 1,600,000 EUR 1,558,576 1.22
CS GRP(US)3.625%(TV)05-14.9.20 700,000 EUR 553,840 0.43
DAIMLERCHR.NA 4.375%07-16.3.10 2,000,000 EUR 1,985,480 1.55
EUROHYPO CAP 6.445% 03-..PERP 500,000 EUR 450,115 0.35
FIAT FIN NORTH AM 5.625% 07-17 2,100,000 EUR 1,801,821 1.41
HSBC FIN.3.75% 05-4.11.15 1,200,000 EUR 1,042,704 0.82
HVB FD TR VIII PREF.02-... 1,000,000 EUR 979,300 0.77
KRAFT FOODS 5.75% 08-20.3.12 1,500,000 EUR 1,486,885 1.16
SG CAP.TR.III 03-... 1,000,000 EUR 912,065 0.71 ______________________
11,749,301 9.18 ______________________ TOTAL BONDS 121,238,843 94.73
TOTAL TRANSFERABLE SECURITIES ADMITTED TO AN OFFICIAL STOCK EXCHANGE LISTING 121,238,843 94.73 ______________________
TRANSFERABLE SECURITIES TRADED ON ANOTHER REGULATED MARKET
BONDS
FRANCE
BNP PARIB 4.75% 08-4.4.11 EMTN 1,250,000 EUR 1,246,075 0.97 ______________________
1,246,075 0.97 ______________________
UNITED STATES
CITIGROUP 6.4% 08-27.3.2013 1,800,000 EUR 1,794,555 1.40 ______________________
1,794,555 1.40 ______________________ TOTAL BONDS 3,040,630 2.37 ______________________
OPTIONS ON FUTURES
GERMANY
CALL EURO BUND 23/04/2008 117 50 EUR 16,000 0.02
CALL EURO BUND 23/04/2008 117 50 EUR 16,000 0.01
CALL EURO BUND 23/04/2008 118 (100) EUR (12,000) (0.01)
PUT EURO BUND 23/04/2008 114.5 (100) EUR (23,000) (0.02) ______________________
(3,000) 0.00 ______________________ TOTAL OPTIONS ON FUTURES (3,000) 0.00
TOTAL TRANSFERABLE SECURITIES TRADED ON ANOTHER REGULATED MARKET 3,037,630 2.37
HSBC Global Investment Funds 186
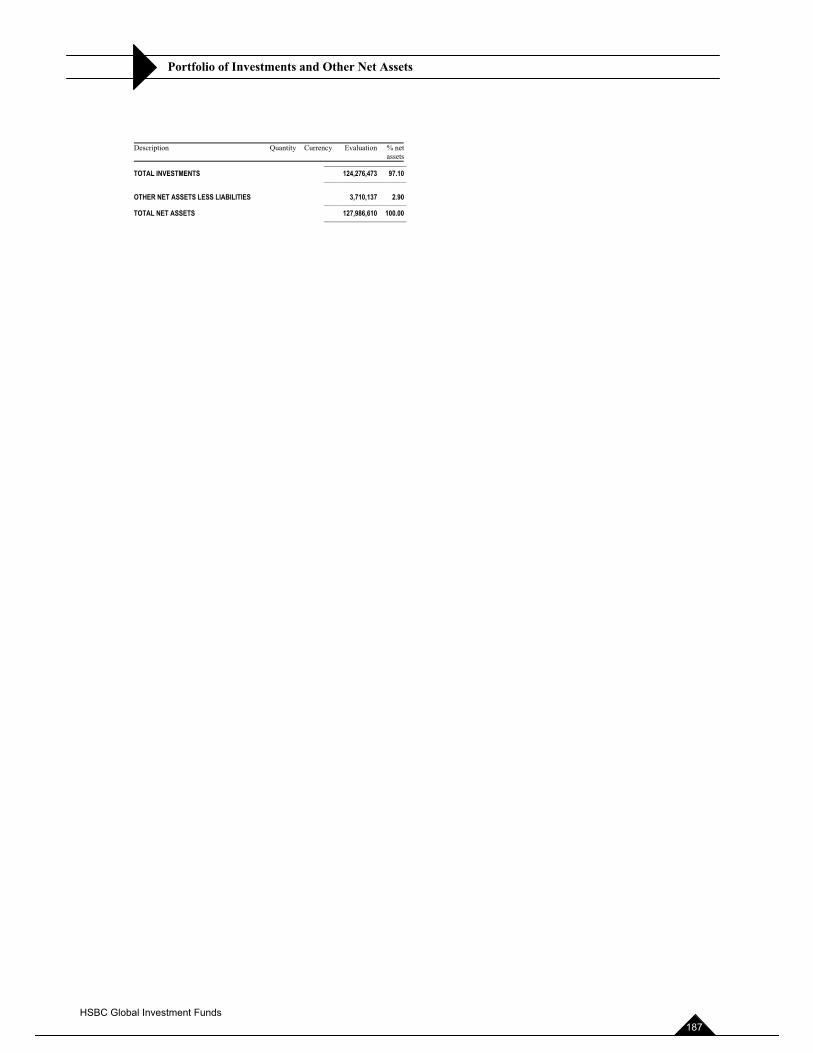
Portfolio of Investments and Other Net Assets
Description Quantity Currency Evaluation % netassets
______________________ TOTAL INVESTMENTS 124,276,473 97.10 ______________________
OTHER NET ASSETS LESS LIABILITIES 3,710,137 2.90 ______________________ TOTAL NET ASSETS 127,986,610 100.00 ______________________
HSBC Global Investment Funds 187
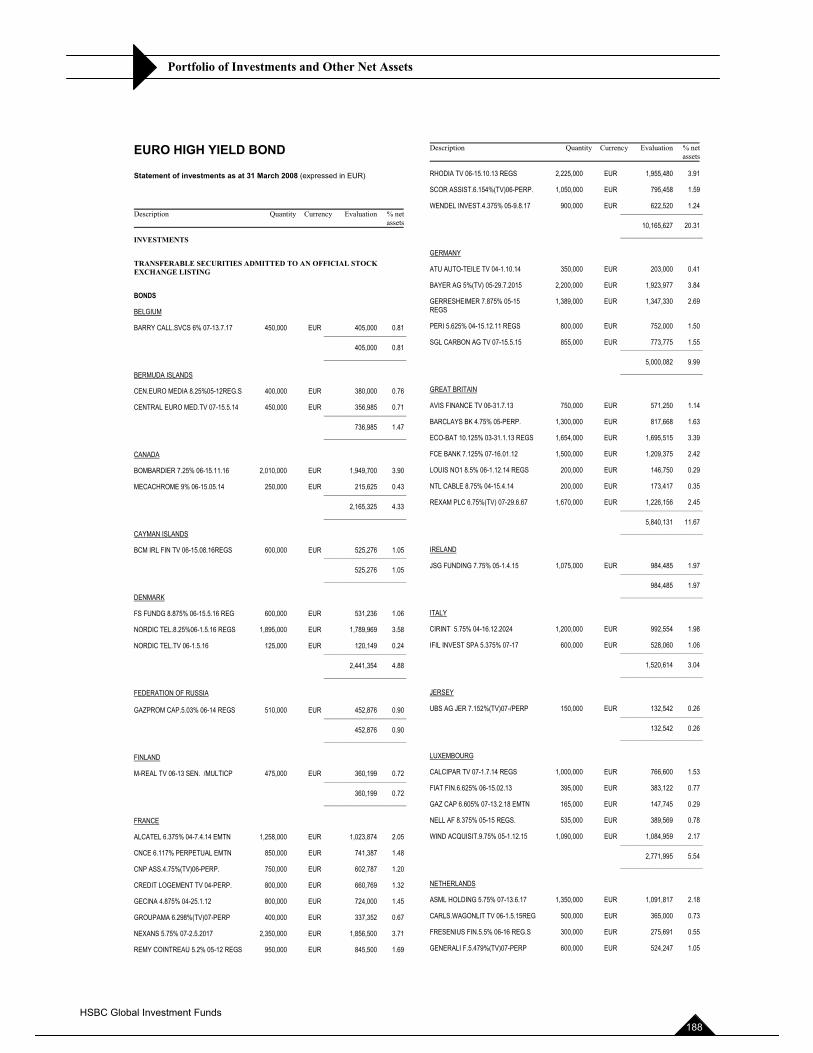
Portfolio of Investments and Other Net Assets
EURO HIGH YIELD BOND
Statement of investments as at 31 March 2008 (expressed in EUR)
Description Quantity Currency Evaluation % netassets
INVESTMENTS
TRANSFERABLE SECURITIES ADMITTED TO AN OFFICIAL STOCK EXCHANGE LISTING
BONDS
BELGIUM
BARRY CALL.SVCS 6% 07-13.7.17 450,000 EUR 405,000 0.81 ______________________
405,000 0.81 ______________________
BERMUDA ISLANDS
CEN.EURO MEDIA 8.25%05-12REG.S 400,000 EUR 380,000 0.76
CENTRAL EURO MED.TV 07-15.5.14 450,000 EUR 356,985 0.71 ______________________
736,985 1.47 ______________________
CANADA
BOMBARDIER 7.25% 06-15.11.16 2,010,000 EUR 1,949,700 3.90
MECACHROME 9% 06-15.05.14 250,000 EUR 215,625 0.43 ______________________
2,165,325 4.33 ______________________
CAYMAN ISLANDS
BCM IRL FIN TV 06-15.08.16REGS 600,000 EUR 525,276 1.05 ______________________
525,276 1.05 ______________________
DENMARK
FS FUNDG 8.875% 06-15.5.16 REG 600,000 EUR 531,236 1.06
NORDIC TEL.8.25%06-1.5.16 REGS 1,895,000 EUR 1,789,969 3.58
NORDIC TEL.TV 06-1.5.16 125,000 EUR 120,149 0.24 ______________________
2,441,354 4.88 ______________________
FEDERATION OF RUSSIA
GAZPROM CAP.5.03% 06-14 REGS 510,000 EUR 452,876 0.90 ______________________
452,876 0.90 ______________________
FINLAND
M-REAL TV 06-13 SEN. /MULTICP 475,000 EUR 360,199 0.72 ______________________
360,199 0.72 ______________________
FRANCE
ALCATEL 6.375% 04-7.4.14 EMTN 1,258,000 EUR 1,023,874 2.05
CNCE 6.117% PERPETUAL EMTN 850,000 EUR 741,387 1.48
CNP ASS.4.75%(TV)06-PERP. 750,000 EUR 602,787 1.20
CREDIT LOGEMENT TV 04-PERP. 800,000 EUR 660,769 1.32
GECINA 4.875% 04-25.1.12 800,000 EUR 724,000 1.45
GROUPAMA 6.298%(TV)07-PERP 400,000 EUR 337,352 0.67
NEXANS 5.75% 07-2.5.2017 2,350,000 EUR 1,856,500 3.71
REMY COINTREAU 5.2% 05-12 REGS 950,000 EUR 845,500 1.69
Description Quantity Currency Evaluation % netassets
RHODIA TV 06-15.10.13 REGS 2,225,000 EUR 1,955,480 3.91
SCOR ASSIST.6.154%(TV)06-PERP. 1,050,000 EUR 795,458 1.59
WENDEL INVEST.4.375% 05-9.8.17 900,000 EUR 622,520 1.24 ______________________
10,165,627 20.31 ______________________
GERMANY
ATU AUTO-TEILE TV 04-1.10.14 350,000 EUR 203,000 0.41
BAYER AG 5%(TV) 05-29.7.2015 2,200,000 EUR 1,923,977 3.84
GERRESHEIMER 7.875% 05-15 REGS
1,389,000 EUR 1,347,330 2.69
PERI 5.625% 04-15.12.11 REGS 800,000 EUR 752,000 1.50
SGL CARBON AG TV 07-15.5.15 855,000 EUR 773,775 1.55 ______________________
5,000,082 9.99 ______________________
GREAT BRITAIN
AVIS FINANCE TV 06-31.7.13 750,000 EUR 571,250 1.14
BARCLAYS BK 4.75% 05-PERP. 1,300,000 EUR 817,668 1.63
ECO-BAT 10.125% 03-31.1.13 REGS 1,654,000 EUR 1,695,515 3.39
FCE BANK 7.125% 07-16.01.12 1,500,000 EUR 1,209,375 2.42
LOUIS NO1 8.5% 06-1.12.14 REGS 200,000 EUR 146,750 0.29
NTL CABLE 8.75% 04-15.4.14 200,000 EUR 173,417 0.35
REXAM PLC 6.75%(TV) 07-29.6.67 1,670,000 EUR 1,226,156 2.45 ______________________
5,840,131 11.67 ______________________
IRELAND
JSG FUNDING 7.75% 05-1.4.15 1,075,000 EUR 984,485 1.97 ______________________
984,485 1.97 ______________________
ITALY
CIRINT 5.75% 04-16.12.2024 1,200,000 EUR 992,554 1.98
IFIL INVEST SPA 5.375% 07-17 600,000 EUR 528,060 1.06 ______________________
1,520,614 3.04 ______________________
JERSEY
UBS AG JER 7.152%(TV)07-/PERP 150,000 EUR 132,542 0.26 ______________________
132,542 0.26 ______________________
LUXEMBOURG
CALCIPAR TV 07-1.7.14 REGS 1,000,000 EUR 766,600 1.53
FIAT FIN.6.625% 06-15.02.13 395,000 EUR 383,122 0.77
GAZ CAP 6.605% 07-13.2.18 EMTN 165,000 EUR 147,745 0.29
NELL AF 8.375% 05-15 REGS. 535,000 EUR 389,569 0.78
WIND ACQUISIT.9.75% 05-1.12.15 1,090,000 EUR 1,084,959 2.17 ______________________
2,771,995 5.54 ______________________
NETHERLANDS
ASML HOLDING 5.75% 07-13.6.17 1,350,000 EUR 1,091,817 2.18
CARLS.WAGONLIT TV 06-1.5.15REG 500,000 EUR 365,000 0.73
FRESENIUS FIN.5.5% 06-16 REG.S 300,000 EUR 275,691 0.55
GENERALI F.5.479%(TV)07-PERP 600,000 EUR 524,247 1.05
HSBC Global Investment Funds 188
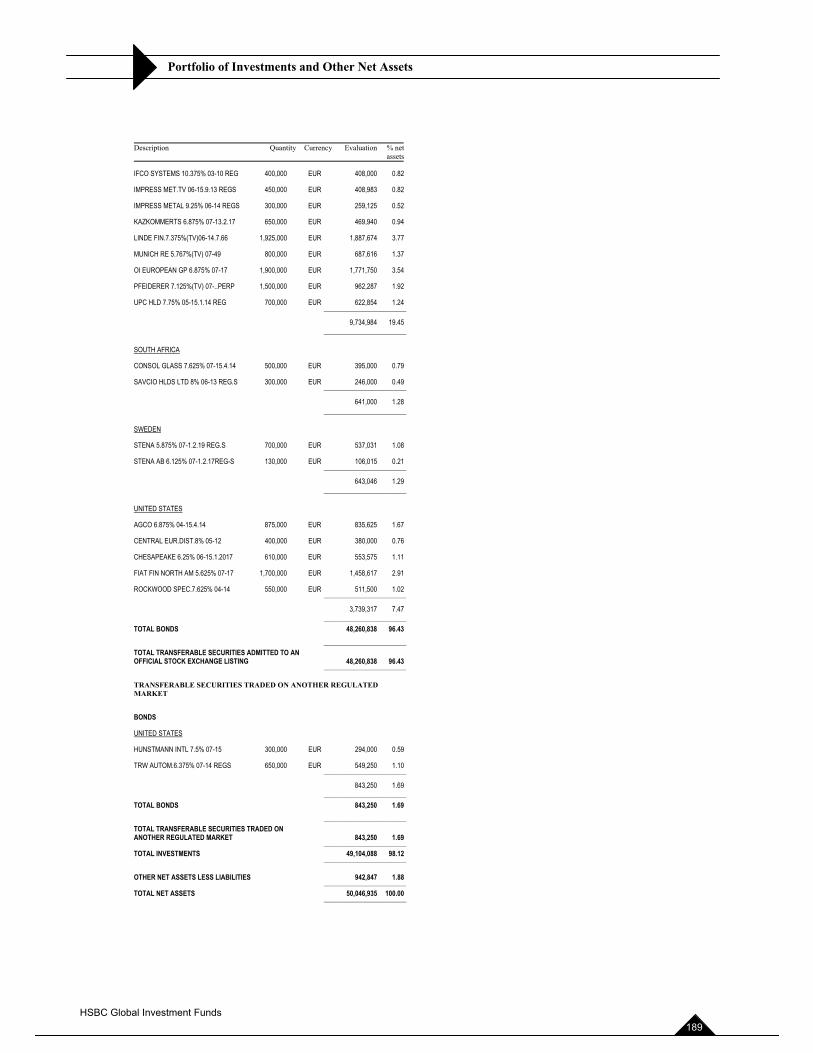
Portfolio of Investments and Other Net Assets
Description Quantity Currency Evaluation % netassets
IFCO SYSTEMS 10.375% 03-10 REG 400,000 EUR 408,000 0.82
IMPRESS MET.TV 06-15.9.13 REGS 450,000 EUR 408,983 0.82
IMPRESS METAL 9.25% 06-14 REGS 300,000 EUR 259,125 0.52
KAZKOMMERTS 6.875% 07-13.2.17 650,000 EUR 469,940 0.94
LINDE FIN.7.375%(TV)06-14.7.66 1,925,000 EUR 1,887,674 3.77
MUNICH RE 5.767%(TV) 07-49 800,000 EUR 687,616 1.37
OI EUROPEAN GP 6.875% 07-17 1,900,000 EUR 1,771,750 3.54
PFEIDERER 7.125%(TV) 07-..PERP 1,500,000 EUR 962,287 1.92
UPC HLD 7.75% 05-15.1.14 REG 700,000 EUR 622,854 1.24 ______________________
9,734,984 19.45 ______________________
SOUTH AFRICA
CONSOL GLASS 7.625% 07-15.4.14 500,000 EUR 395,000 0.79
SAVCIO HLDS LTD 8% 06-13 REG.S 300,000 EUR 246,000 0.49 ______________________
641,000 1.28 ______________________
SWEDEN
STENA 5.875% 07-1.2.19 REG.S 700,000 EUR 537,031 1.08
STENA AB 6.125% 07-1.2.17REG-S 130,000 EUR 106,015 0.21 ______________________
643,046 1.29 ______________________
UNITED STATES
AGCO 6.875% 04-15.4.14 875,000 EUR 835,625 1.67
CENTRAL EUR.DIST.8% 05-12 400,000 EUR 380,000 0.76
CHESAPEAKE 6.25% 06-15.1.2017 610,000 EUR 553,575 1.11
FIAT FIN NORTH AM 5.625% 07-17 1,700,000 EUR 1,458,617 2.91
ROCKWOOD SPEC.7.625% 04-14 550,000 EUR 511,500 1.02 ______________________
3,739,317 7.47 ______________________ TOTAL BONDS 48,260,838 96.43 ______________________ TOTAL TRANSFERABLE SECURITIES ADMITTED TO AN OFFICIAL STOCK EXCHANGE LISTING 48,260,838 96.43 ______________________
TRANSFERABLE SECURITIES TRADED ON ANOTHER REGULATED MARKET
BONDS
UNITED STATES
HUNSTMANN INTL 7.5% 07-15 300,000 EUR 294,000 0.59
TRW AUTOM.6.375% 07-14 REGS 650,000 EUR 549,250 1.10 ______________________
843,250 1.69 ______________________ TOTAL BONDS 843,250 1.69 ______________________ TOTAL TRANSFERABLE SECURITIES TRADED ON ANOTHER REGULATED MARKET 843,250 1.69 ______________________ TOTAL INVESTMENTS 49,104,088 98.12 ______________________
OTHER NET ASSETS LESS LIABILITIES 942,847 1.88 ______________________ TOTAL NET ASSETS 50,046,935 100.00 ______________________
HSBC Global Investment Funds 189
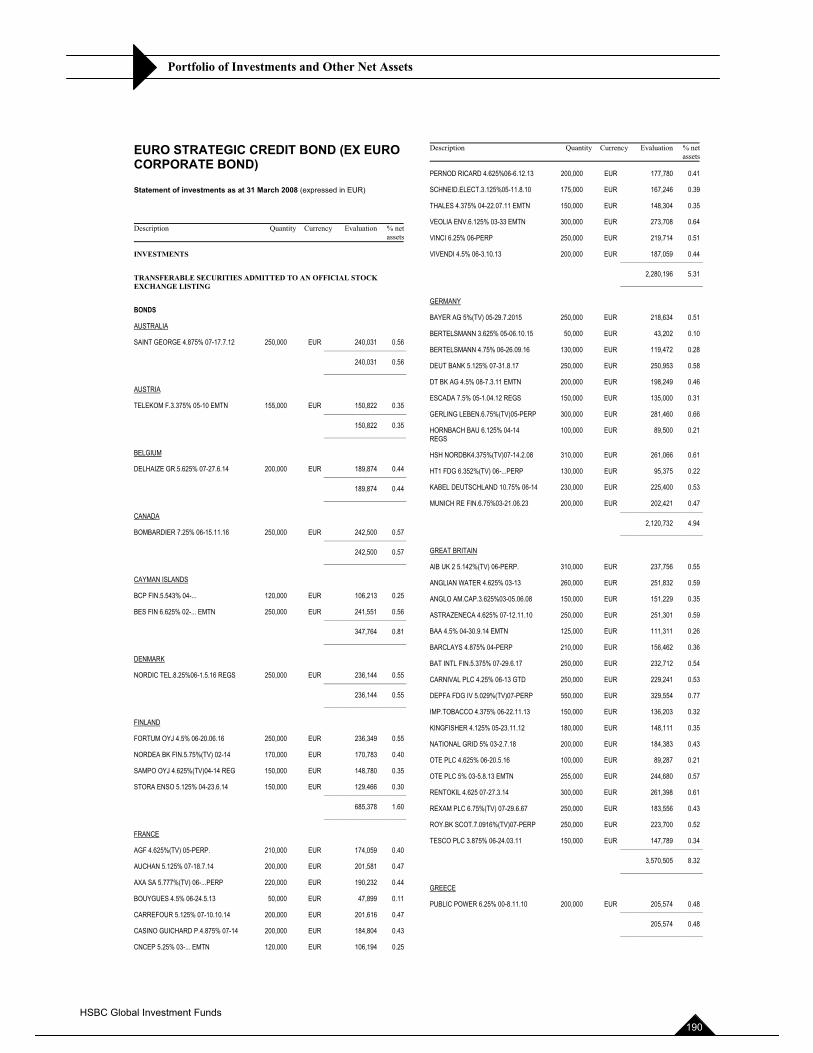
Portfolio of Investments and Other Net Assets
EURO STRATEGIC CREDIT BOND (EX EURO CORPORATE BOND)
Statement of investments as at 31 March 2008 (expressed in EUR)
Description Quantity Currency Evaluation % netassets
INVESTMENTS
TRANSFERABLE SECURITIES ADMITTED TO AN OFFICIAL STOCK EXCHANGE LISTING
BONDS
AUSTRALIA
SAINT GEORGE 4.875% 07-17.7.12 250,000 EUR 240,031 0.56 ______________________
240,031 0.56 ______________________
AUSTRIA
TELEKOM F.3.375% 05-10 EMTN 155,000 EUR 150,822 0.35 ______________________
150,822 0.35 ______________________
BELGIUM
DELHAIZE GR.5.625% 07-27.6.14 200,000 EUR 189,874 0.44 ______________________
189,874 0.44 ______________________
CANADA
BOMBARDIER 7.25% 06-15.11.16 250,000 EUR 242,500 0.57 ______________________
242,500 0.57 ______________________
CAYMAN ISLANDS
BCP FIN.5.543% 04-... 120,000 EUR 106,213 0.25
BES FIN 6.625% 02-... EMTN 250,000 EUR 241,551 0.56 ______________________
347,764 0.81 ______________________
DENMARK
NORDIC TEL.8.25%06-1.5.16 REGS 250,000 EUR 236,144 0.55 ______________________
236,144 0.55 ______________________
FINLAND
FORTUM OYJ 4.5% 06-20.06.16 250,000 EUR 236,349 0.55
NORDEA BK FIN.5.75%(TV) 02-14 170,000 EUR 170,783 0.40
SAMPO OYJ 4.625%(TV)04-14 REG 150,000 EUR 148,780 0.35
STORA ENSO 5.125% 04-23.6.14 150,000 EUR 129,466 0.30 ______________________
685,378 1.60 ______________________
FRANCE
AGF 4.625%(TV) 05-PERP. 210,000 EUR 174,059 0.40
AUCHAN 5.125% 07-18.7.14 200,000 EUR 201,581 0.47
AXA SA 5.777%(TV) 06-...PERP 220,000 EUR 190,232 0.44
BOUYGUES 4.5% 06-24.5.13 50,000 EUR 47,899 0.11
CARREFOUR 5.125% 07-10.10.14 200,000 EUR 201,616 0.47
CASINO GUICHARD P.4.875% 07-14 200,000 EUR 184,804 0.43
CNCEP 5.25% 03-... EMTN 120,000 EUR 106,194 0.25
Description Quantity Currency Evaluation % netassets
PERNOD RICARD 4.625%06-6.12.13 200,000 EUR 177,780 0.41
SCHNEID.ELECT.3.125%05-11.8.10 175,000 EUR 167,246 0.39
THALES 4.375% 04-22.07.11 EMTN 150,000 EUR 148,304 0.35
VEOLIA ENV.6.125% 03-33 EMTN 300,000 EUR 273,708 0.64
VINCI 6.25% 06-PERP 250,000 EUR 219,714 0.51
VIVENDI 4.5% 06-3.10.13 200,000 EUR 187,059 0.44 ______________________
2,280,196 5.31 ______________________
GERMANY
BAYER AG 5%(TV) 05-29.7.2015 250,000 EUR 218,634 0.51
BERTELSMANN 3.625% 05-06.10.15 50,000 EUR 43,202 0.10
BERTELSMANN 4.75% 06-26.09.16 130,000 EUR 119,472 0.28
DEUT BANK 5.125% 07-31.8.17 250,000 EUR 250,953 0.58
DT BK AG 4.5% 08-7.3.11 EMTN 200,000 EUR 198,249 0.46
ESCADA 7.5% 05-1.04.12 REGS 150,000 EUR 135,000 0.31
GERLING LEBEN.6.75%(TV)05-PERP 300,000 EUR 281,460 0.66
HORNBACH BAU 6.125% 04-14 REGS
100,000 EUR 89,500 0.21
HSH NORDBK4.375%(TV)07-14.2.08 310,000 EUR 261,066 0.61
HT1 FDG 6.352%(TV) 06-...PERP 130,000 EUR 95,375 0.22
KABEL DEUTSCHLAND 10.75% 06-14 230,000 EUR 225,400 0.53
MUNICH RE FIN.6.75%03-21.06.23 200,000 EUR 202,421 0.47 ______________________
2,120,732 4.94 ______________________
GREAT BRITAIN
AIB UK 2 5.142%(TV) 06-PERP. 310,000 EUR 237,756 0.55
ANGLIAN WATER 4.625% 03-13 260,000 EUR 251,832 0.59
ANGLO AM.CAP.3.625%03-05.06.08 150,000 EUR 151,229 0.35
ASTRAZENECA 4.625% 07-12.11.10 250,000 EUR 251,301 0.59
BAA 4.5% 04-30.9.14 EMTN 125,000 EUR 111,311 0.26
BARCLAYS 4.875% 04-PERP 210,000 EUR 156,462 0.36
BAT INTL FIN.5.375% 07-29.6.17 250,000 EUR 232,712 0.54
CARNIVAL PLC 4.25% 06-13 GTD 250,000 EUR 229,241 0.53
DEPFA FDG IV 5.029%(TV)07-PERP 550,000 EUR 329,554 0.77
IMP.TOBACCO 4.375% 06-22.11.13 150,000 EUR 136,203 0.32
KINGFISHER 4.125% 05-23.11.12 180,000 EUR 148,111 0.35
NATIONAL GRID 5% 03-2.7.18 200,000 EUR 184,383 0.43
OTE PLC 4.625% 06-20.5.16 100,000 EUR 89,287 0.21
OTE PLC 5% 03-5.8.13 EMTN 255,000 EUR 244,680 0.57
RENTOKIL 4.625 07-27.3.14 300,000 EUR 261,398 0.61
REXAM PLC 6.75%(TV) 07-29.6.67 250,000 EUR 183,556 0.43
ROY.BK SCOT.7.0916%(TV)07-PERP 250,000 EUR 223,700 0.52
TESCO PLC 3.875% 06-24.03.11 150,000 EUR 147,789 0.34 ______________________
3,570,505 8.32 ______________________
GREECE
PUBLIC POWER 6.25% 00-8.11.10 200,000 EUR 205,574 0.48 ______________________
205,574 0.48 ______________________
HSBC Global Investment Funds 190
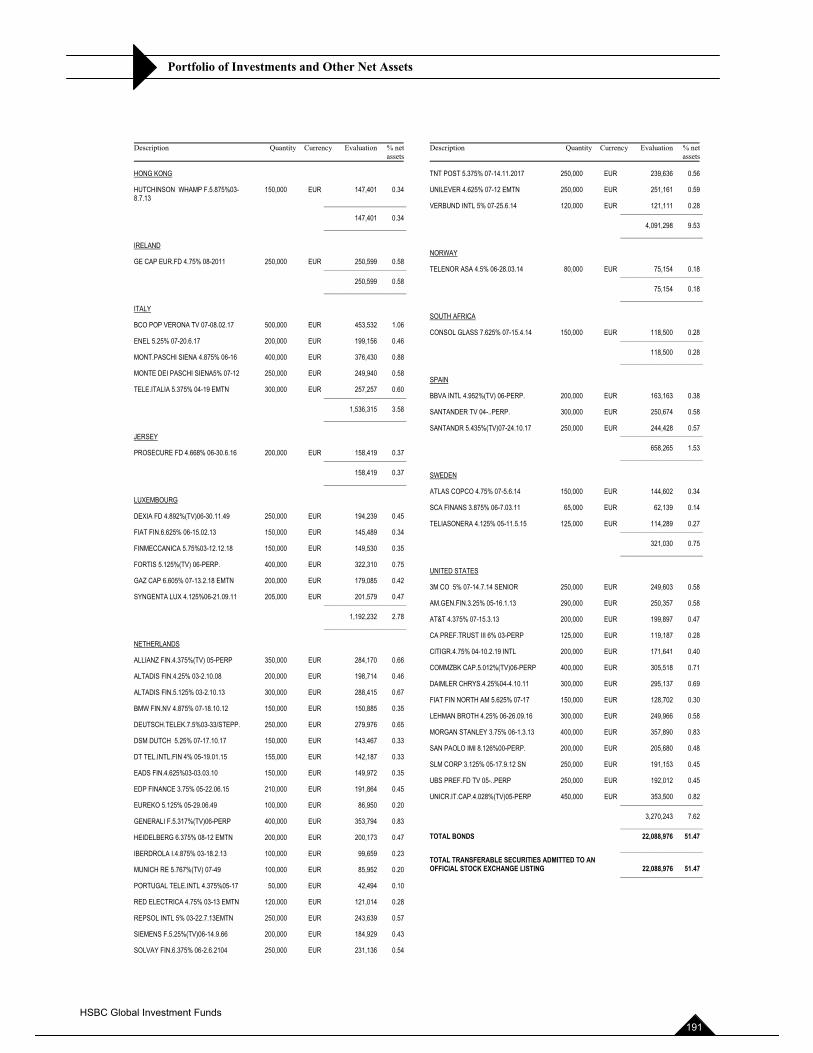
Portfolio of Investments and Other Net Assets
Description Quantity Currency Evaluation % netassets
HONG KONG
HUTCHINSON WHAMP F.5.875%03-8.7.13
150,000 EUR
______________________
147,401 0.34
147,401 0.34 ______________________
IRELAND
GE CAP EUR.FD 4.75% 08-2011 250,000 EUR 250,599 0.58 ______________________
250,599 0.58 ______________________
ITALY
BCO POP VERONA TV 07-08.02.17 500,000 EUR 453,532 1.06
ENEL 5.25% 07-20.6.17 200,000 EUR 199,156 0.46
MONT.PASCHI SIENA 4.875% 06-16 400,000 EUR 376,430 0.88
MONTE DEI PASCHI SIENA5% 07-12 250,000 EUR 249,940 0.58
TELE.ITALIA 5.375% 04-19 EMTN 300,000 EUR 257,257 0.60 ______________________
1,536,315 3.58 ______________________
JERSEY
PROSECURE FD 4.668% 06-30.6.16 200,000 EUR 158,419 0.37 ______________________
158,419 0.37 ______________________
LUXEMBOURG
DEXIA FD 4.892%(TV)06-30.11.49 250,000 EUR 194,239 0.45
FIAT FIN.6.625% 06-15.02.13 150,000 EUR 145,489 0.34
FINMECCANICA 5.75%03-12.12.18 150,000 EUR 149,530 0.35
FORTIS 5.125%(TV) 06-PERP. 400,000 EUR 322,310 0.75
GAZ CAP 6.605% 07-13.2.18 EMTN 200,000 EUR 179,085 0.42
SYNGENTA LUX 4.125%06-21.09.11 205,000 EUR 201,579 0.47 ______________________
1,192,232 2.78 ______________________
NETHERLANDS
ALLIANZ FIN.4.375%(TV) 05-PERP 350,000 EUR 284,170 0.66
ALTADIS FIN.4.25% 03-2.10.08 200,000 EUR 198,714 0.46
ALTADIS FIN.5.125% 03-2.10.13 300,000 EUR 288,415 0.67
BMW FIN.NV 4.875% 07-18.10.12 150,000 EUR 150,885 0.35
DEUTSCH.TELEK.7.5%03-33/STEPP. 250,000 EUR 279,976 0.65
DSM DUTCH 5.25% 07-17.10.17 150,000 EUR 143,467 0.33
DT TEL.INTL.FIN 4% 05-19.01.15 155,000 EUR 142,187 0.33
EADS FIN.4.625%03-03.03.10 150,000 EUR 149,972 0.35
EDP FINANCE 3.75% 05-22.06.15 210,000 EUR 191,864 0.45
EUREKO 5.125% 05-29.06.49 100,000 EUR 86,950 0.20
GENERALI F.5.317%(TV)06-PERP 400,000 EUR 353,794 0.83
HEIDELBERG 6.375% 08-12 EMTN 200,000 EUR 200,173 0.47
IBERDROLA I.4.875% 03-18.2.13 100,000 EUR 99,659 0.23
MUNICH RE 5.767%(TV) 07-49 100,000 EUR 85,952 0.20
PORTUGAL TELE.INTL 4.375%05-17 50,000 EUR 42,494 0.10
RED ELECTRICA 4.75% 03-13 EMTN 120,000 EUR 121,014 0.28
REPSOL INTL 5% 03-22.7.13EMTN 250,000 EUR 243,639 0.57
SIEMENS F.5.25%(TV)06-14.9.66 200,000 EUR 184,929 0.43
SOLVAY FIN.6.375% 06-2.6.2104 250,000 EUR 231,136 0.54
Description Quantity Currency Evaluation % netassets
TNT POST 5.375% 07-14.11.2017 250,000 EUR 239,636 0.56
UNILEVER 4.625% 07-12 EMTN 250,000 EUR 251,161 0.59
VERBUND INTL 5% 07-25.6.14 120,000 EUR 121,111 0.28 ______________________
4,091,298 9.53 ______________________
NORWAY
TELENOR ASA 4.5% 06-28.03.14 80,000 EUR 75,154 0.18 ______________________
75,154 0.18 ______________________
SOUTH AFRICA
CONSOL GLASS 7.625% 07-15.4.14 150,000 EUR 118,500 0.28 ______________________
118,500 0.28 ______________________
SPAIN
BBVA INTL 4.952%(TV) 06-PERP. 200,000 EUR 163,163 0.38
SANTANDER TV 04-..PERP. 300,000 EUR 250,674 0.58
SANTANDR 5.435%(TV)07-24.10.17 250,000 EUR 244,428 0.57 ______________________
658,265 1.53 ______________________
SWEDEN
ATLAS COPCO 4.75% 07-5.6.14 150,000 EUR 144,602 0.34
SCA FINANS 3.875% 06-7.03.11 65,000 EUR 62,139 0.14
TELIASONERA 4.125% 05-11.5.15 125,000 EUR 114,289 0.27 ______________________
321,030 0.75 ______________________
UNITED STATES
3M CO 5% 07-14.7.14 SENIOR 250,000 EUR 249,603 0.58
AM.GEN.FIN.3.25% 05-16.1.13 290,000 EUR 250,357 0.58
AT&T 4.375% 07-15.3.13 200,000 EUR 199,897 0.47
CA PREF.TRUST III 6% 03-PERP 125,000 EUR 119,187 0.28
CITIGR.4.75% 04-10.2.19 INTL 200,000 EUR 171,641 0.40
COMMZBK CAP.5.012%(TV)06-PERP 400,000 EUR 305,518 0.71
DAIMLER CHRYS.4.25%04-4.10.11 300,000 EUR 295,137 0.69
FIAT FIN NORTH AM 5.625% 07-17 150,000 EUR 128,702 0.30
LEHMAN BROTH 4.25% 06-26.09.16 300,000 EUR 249,966 0.58
MORGAN STANLEY 3.75% 06-1.3.13 400,000 EUR 357,890 0.83
SAN PAOLO IMI 8.126%00-PERP. 200,000 EUR 205,680 0.48
SLM CORP 3.125% 05-17.9.12 SN 250,000 EUR 191,153 0.45
UBS PREF.FD TV 05-..PERP 250,000 EUR 192,012 0.45
UNICR.IT.CAP.4.028%(TV)05-PERP 450,000 EUR 353,500 0.82 ______________________
3,270,243 7.62 ______________________ TOTAL BONDS 22,088,976 51.47 ______________________ TOTAL TRANSFERABLE SECURITIES ADMITTED TO AN OFFICIAL STOCK EXCHANGE LISTING 22,088,976 51.47 ______________________
HSBC Global Investment Funds 191
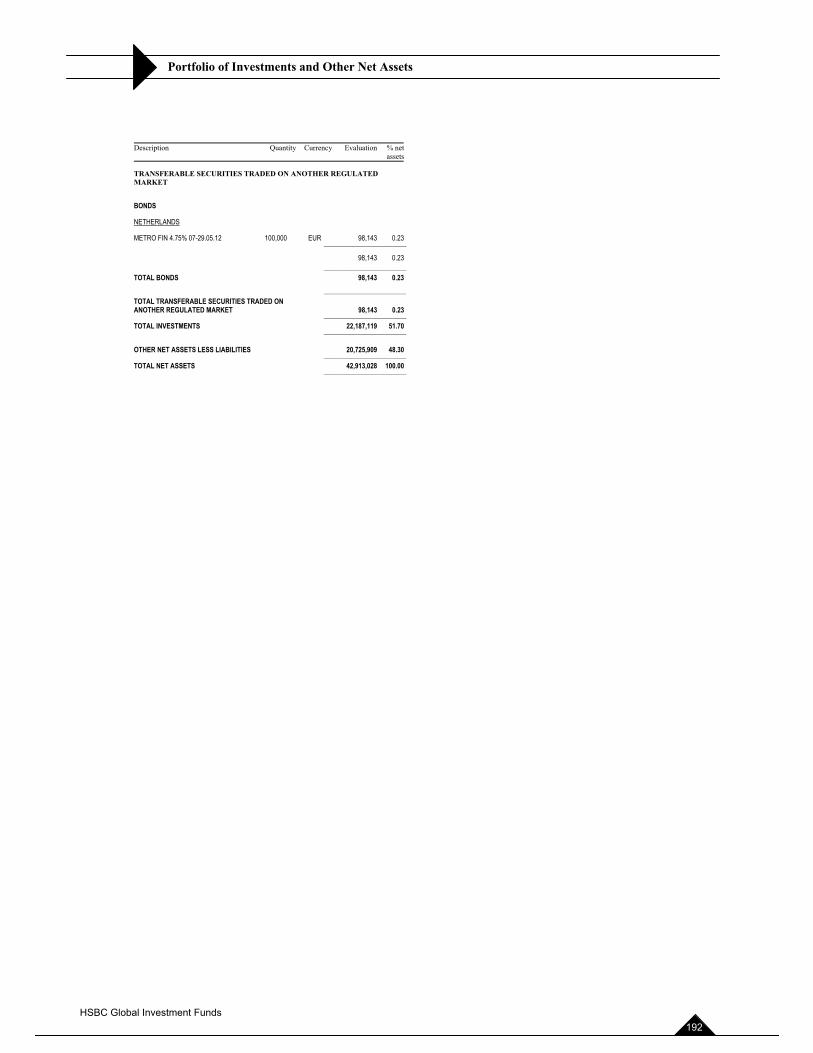
Portfolio of Investments and Other Net Assets
Description Quantity Currency Evaluation % netassets
TRANSFERABLE SECURITIES TRADED ON ANOTHER REGULATED MARKET
BONDS
NETHERLANDS
METRO FIN 4.75% 07-29.05.12 100,000 EUR 98,143 0.23 ______________________
98,143 0.23 ______________________ TOTAL BONDS 98,143 0.23 ______________________ TOTAL TRANSFERABLE SECURITIES TRADED ON ANOTHER REGULATED MARKET 98,143 0.23 ______________________ TOTAL INVESTMENTS 22,187,119 51.70 ______________________
OTHER NET ASSETS LESS LIABILITIES 20,725,909 48.30 ______________________ TOTAL NET ASSETS 42,913,028 100.00 ______________________
HSBC Global Investment Funds 192
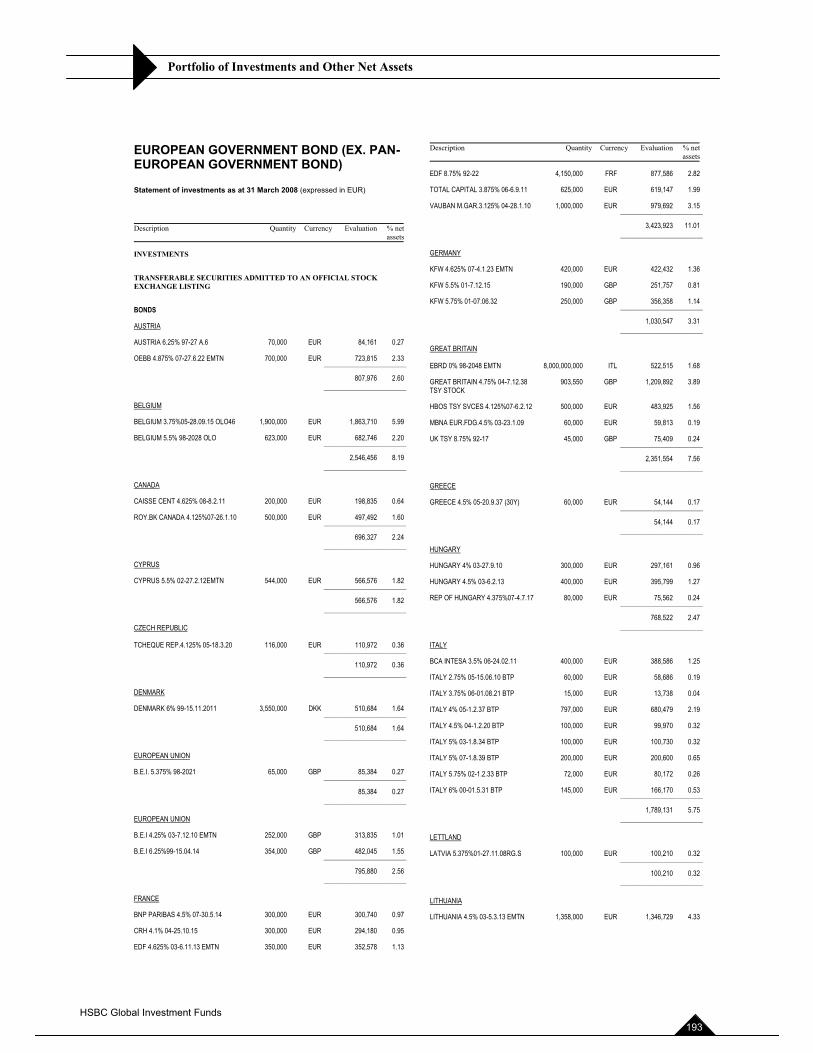
Portfolio of Investments and Other Net Assets
EUROPEAN GOVERNMENT BOND (EX. PAN-EUROPEAN GOVERNMENT BOND)
Statement of investments as at 31 March 2008 (expressed in EUR)
Description Quantity Currency Evaluation % netassets
INVESTMENTS
TRANSFERABLE SECURITIES ADMITTED TO AN OFFICIAL STOCK EXCHANGE LISTING
BONDS
AUSTRIA
AUSTRIA 6.25% 97-27 A.6 70,000 EUR 84,161 0.27
OEBB 4.875% 07-27.6.22 EMTN 700,000 EUR 723,815 2.33 ______________________
807,976 2.60 ______________________
BELGIUM
BELGIUM 3.75%05-28.09.15 OLO46 1,900,000 EUR 1,863,710 5.99
BELGIUM 5.5% 98-2028 OLO 623,000 EUR 682,746 2.20 ______________________
2,546,456 8.19 ______________________
CANADA
CAISSE CENT 4.625% 08-8.2.11 200,000 EUR 198,835 0.64
ROY.BK CANADA 4.125%07-26.1.10 500,000 EUR 497,492 1.60 ______________________
696,327 2.24 ______________________
CYPRUS
CYPRUS 5.5% 02-27.2.12EMTN 544,000 EUR 566,576 1.82 ______________________
566,576 1.82 ______________________
CZECH REPUBLIC
TCHEQUE REP.4.125% 05-18.3.20 116,000 EUR 110,972 0.36 ______________________
110,972 0.36 ______________________
DENMARK
DENMARK 6% 99-15.11.2011 3,550,000 DKK 510,684 1.64 ______________________
510,684 1.64 ______________________
EUROPEAN UNION
B.E.I. 5.375% 98-2021 65,000 GBP 85,384 0.27 ______________________
85,384 0.27 ______________________
EUROPEAN UNION
B.E.I 4.25% 03-7.12.10 EMTN 252,000 GBP 313,835 1.01
B.E.I 6.25%99-15.04.14 354,000 GBP 482,045 1.55 ______________________
795,880 2.56 ______________________
FRANCE
BNP PARIBAS 4.5% 07-30.5.14 300,000 EUR 300,740 0.97
CRH 4.1% 04-25.10.15 300,000 EUR 294,180 0.95
EDF 4.625% 03-6.11.13 EMTN 350,000 EUR 352,578 1.13
Description Quantity Currency Evaluation % netassets
EDF 8.75% 92-22 4,150,000 FRF 877,586 2.82
TOTAL CAPITAL 3.875% 06-6.9.11 625,000 EUR 619,147 1.99
VAUBAN M.GAR.3.125% 04-28.1.10 1,000,000 EUR 979,692 3.15 ______________________
3,423,923 11.01 ______________________
GERMANY
KFW 4.625% 07-4.1.23 EMTN 420,000 EUR 422,432 1.36
KFW 5.5% 01-7.12.15 190,000 GBP 251,757 0.81
KFW 5.75% 01-07.06.32 250,000 GBP 356,358 1.14 ______________________
1,030,547 3.31 ______________________
GREAT BRITAIN
EBRD 0% 98-2048 EMTN 8,000,000,000 ITL 522,515 1.68
GREAT BRITAIN 4.75% 04-7.12.38 TSY STOCK
903,550 GBP 1,209,892 3.89
HBOS TSY SVCES 4.125%07-6.2.12 500,000 EUR 483,925 1.56
MBNA EUR.FDG.4.5% 03-23.1.09 60,000 EUR 59,813 0.19
UK TSY 8.75% 92-17 45,000 GBP 75,409 0.24 ______________________
2,351,554 7.56 ______________________
GREECE
GREECE 4.5% 05-20.9.37 (30Y) 60,000 EUR 54,144 0.17 ______________________
54,144 0.17 ______________________
HUNGARY
HUNGARY 4% 03-27.9.10 300,000 EUR 297,161 0.96
HUNGARY 4.5% 03-6.2.13 400,000 EUR 395,799 1.27
REP OF HUNGARY 4.375%07-4.7.17 80,000 EUR 75,562 0.24 ______________________
768,522 2.47 ______________________
ITALY
BCA INTESA 3.5% 06-24.02.11 400,000 EUR 388,586 1.25
ITALY 2.75% 05-15.06.10 BTP 60,000 EUR 58,686 0.19
ITALY 3.75% 06-01.08.21 BTP 15,000 EUR 13,738 0.04
ITALY 4% 05-1.2.37 BTP 797,000 EUR 680,479 2.19
ITALY 4.5% 04-1.2.20 BTP 100,000 EUR 99,970 0.32
ITALY 5% 03-1.8.34 BTP 100,000 EUR 100,730 0.32
ITALY 5% 07-1.8.39 BTP 200,000 EUR 200,600 0.65
ITALY 5.75% 02-1.2.33 BTP 72,000 EUR 80,172 0.26
ITALY 6% 00-01.5.31 BTP 145,000 EUR 166,170 0.53 ______________________
1,789,131 5.75 ______________________
LETTLAND
LATVIA 5.375%01-27.11.08RG.S 100,000 EUR 100,210 0.32 ______________________
100,210 0.32 ______________________
LITHUANIA
LITHUANIA 4.5% 03-5.3.13 EMTN 1,358,000 EUR 1,346,729 4.33
HSBC Global Investment Funds 193
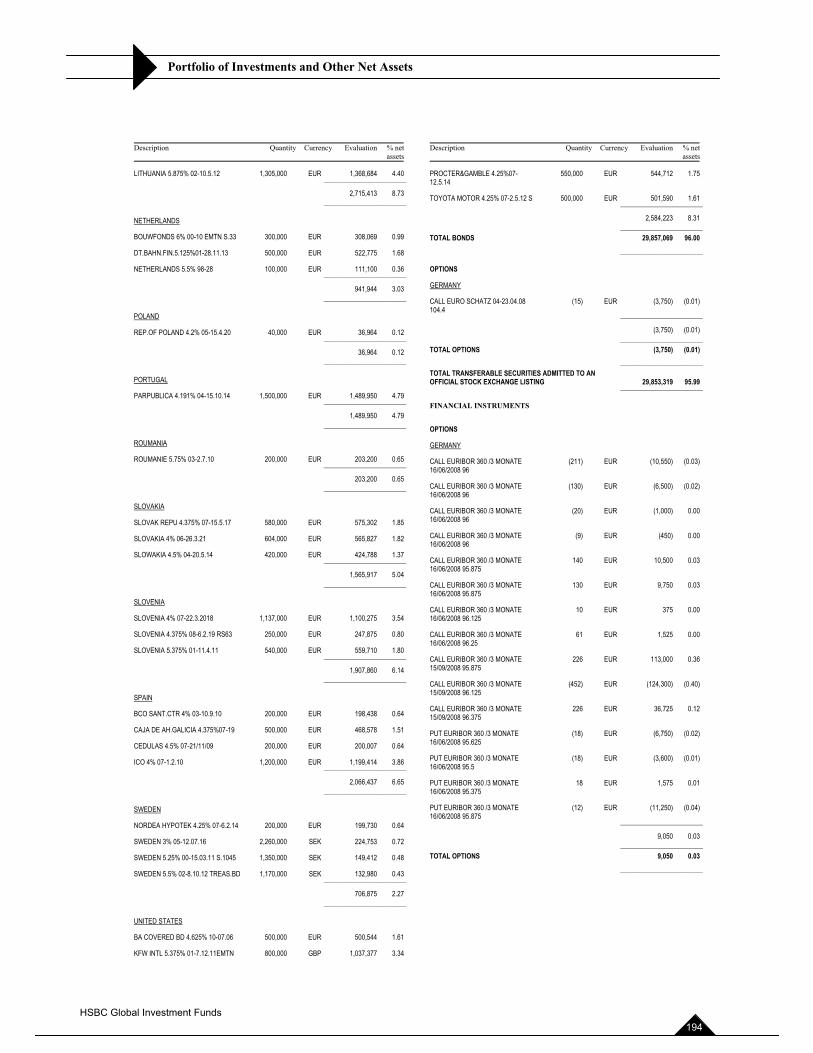
Portfolio of Investments and Other Net Assets
Description Quantity Currency Evaluation % netassets
LITHUANIA 5.875% 02-10.5.12 1,305,000 EUR 1,368,684 4.40 ______________________
2,715,413 8.73 ______________________
NETHERLANDS
BOUWFONDS 6% 00-10 EMTN S.33 300,000 EUR 308,069 0.99
DT.BAHN.FIN.5.125%01-28.11.13 500,000 EUR 522,775 1.68
NETHERLANDS 5.5% 98-28 100,000 EUR 111,100 0.36 ______________________
941,944 3.03 ______________________
POLAND
REP.OF POLAND 4.2% 05-15.4.20 40,000 EUR 36,964 0.12 ______________________
36,964 0.12 ______________________
PORTUGAL
PARPUBLICA 4.191% 04-15.10.14 1,500,000 EUR 1,489,950 4.79 ______________________
1,489,950 4.79 ______________________
ROUMANIA
ROUMANIE 5.75% 03-2.7.10 200,000 EUR 203,200 0.65 ______________________
203,200 0.65 ______________________
SLOVAKIA
SLOVAK REPU 4.375% 07-15.5.17 580,000 EUR 575,302 1.85
SLOVAKIA 4% 06-26.3.21 604,000 EUR 565,827 1.82
SLOWAKIA 4.5% 04-20.5.14 420,000 EUR 424,788 1.37 ______________________
1,565,917 5.04 ______________________
SLOVENIA
SLOVENIA 4% 07-22.3.2018 1,137,000 EUR 1,100,275 3.54
SLOVENIA 4.375% 08-6.2.19 RS63 250,000 EUR 247,875 0.80
SLOVENIA 5.375% 01-11.4.11 540,000 EUR 559,710 1.80 ______________________
1,907,860 6.14 ______________________
SPAIN
BCO SANT.CTR 4% 03-10.9.10 200,000 EUR 198,438 0.64
CAJA DE AH.GALICIA 4.375%07-19 500,000 EUR 468,578 1.51
CEDULAS 4.5% 07-21/11/09 200,000 EUR 200,007 0.64
ICO 4% 07-1.2.10 1,200,000 EUR 1,199,414 3.86 ______________________
2,066,437 6.65 ______________________
SWEDEN
NORDEA HYPOTEK 4.25% 07-6.2.14 200,000 EUR 199,730 0.64
SWEDEN 3% 05-12.07.16 2,260,000 SEK 224,753 0.72
SWEDEN 5.25% 00-15.03.11 S.1045 1,350,000 SEK 149,412 0.48
SWEDEN 5.5% 02-8.10.12 TREAS.BD 1,170,000 SEK 132,980 0.43 ______________________
706,875 2.27 ______________________
UNITED STATES
BA COVERED BD 4.625% 10-07.06 500,000 EUR 500,544 1.61
KFW INTL 5.375% 01-7.12.11EMTN 800,000 GBP 1,037,377 3.34
Description Quantity Currency Evaluation % netassets
PROCTER&GAMBLE 4.25%07-12.5.14
550,000 EUR 544,712 1.75
TOYOTA MOTOR 4.25% 07-2.5.12 S 500,000 EUR 501,590 1.61 ______________________
2,584,223 8.31 ______________________ TOTAL BONDS 29,857,069 96.00 ______________________
OPTIONS
GERMANY
CALL EURO SCHATZ 04-23.04.08 104.4 ______________________
(15) EUR (3,750) (0.01)
(3,750) (0.01) ______________________ TOTAL OPTIONS (3,750) (0.01) ______________________ TOTAL TRANSFERABLE SECURITIES ADMITTED TO AN OFFICIAL STOCK EXCHANGE LISTING 29,853,319 95.99 ______________________
FINANCIAL INSTRUMENTS
OPTIONS
GERMANY
CALL EURIBOR 360 /3 MONATE 16/06/2008 96
(211) EUR (10,550) (0.03)
CALL EURIBOR 360 /3 MONATE 16/06/2008 96
(130) EUR (6,500) (0.02)
CALL EURIBOR 360 /3 MONATE 16/06/2008 96
(20) EUR (1,000) 0.00
CALL EURIBOR 360 /3 MONATE 16/06/2008 96
(9) EUR (450) 0.00
CALL EURIBOR 360 /3 MONATE 16/06/2008 95.875
140 EUR 10,500 0.03
CALL EURIBOR 360 /3 MONATE 16/06/2008 95.875
130 EUR 9,750 0.03
CALL EURIBOR 360 /3 MONATE 16/06/2008 96.125
10 EUR 375 0.00
CALL EURIBOR 360 /3 MONATE 16/06/2008 96.25
61 EUR 1,525 0.00
CALL EURIBOR 360 /3 MONATE 15/09/2008 95.875
226 EUR 113,000 0.36
CALL EURIBOR 360 /3 MONATE 15/09/2008 96.125
(452) EUR (124,300) (0.40)
CALL EURIBOR 360 /3 MONATE 15/09/2008 96.375
226 EUR 36,725 0.12
PUT EURIBOR 360 /3 MONATE 16/06/2008 95.625
(18) EUR (6,750) (0.02)
PUT EURIBOR 360 /3 MONATE 16/06/2008 95.5
(18) EUR (3,600) (0.01)
PUT EURIBOR 360 /3 MONATE 16/06/2008 95.375
18 EUR 1,575 0.01
PUT EURIBOR 360 /3 MONATE 16/06/2008 95.875 ______________________
(12) EUR (11,250) (0.04)
9,050 0.03 ______________________ TOTAL OPTIONS 9,050 0.03 ______________________
HSBC Global Investment Funds 194
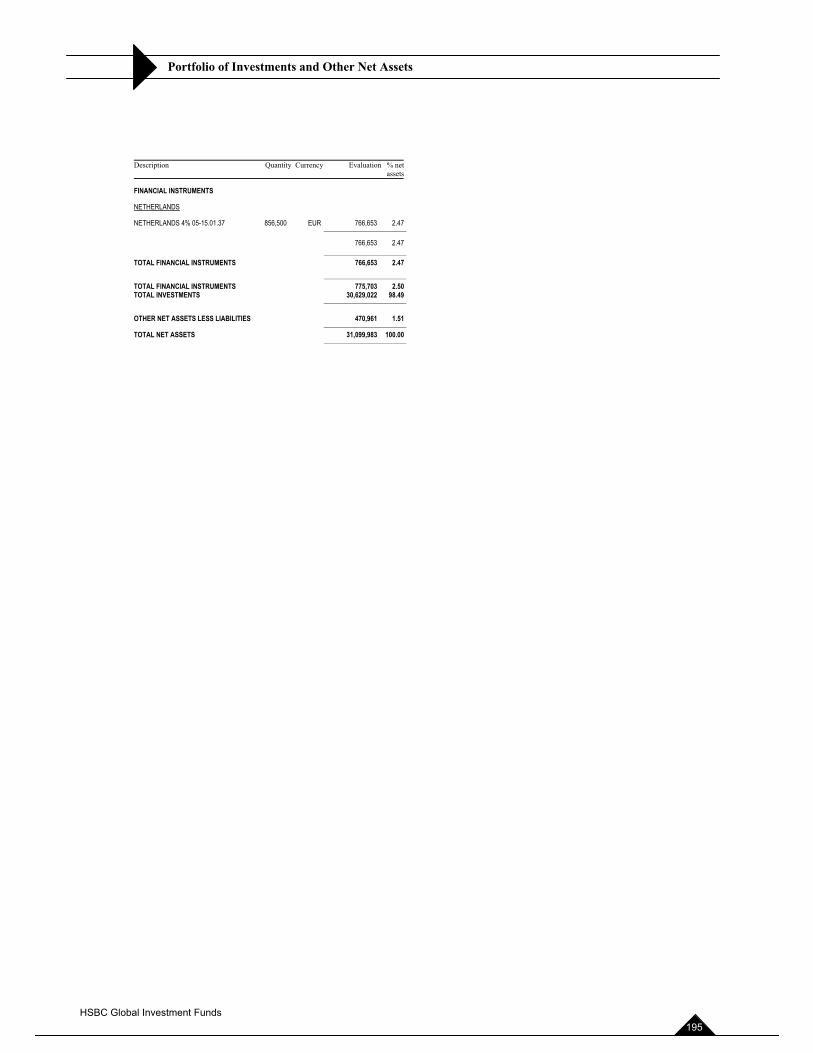
Portfolio of Investments and Other Net Assets
Description Quantity Currency Evaluation % netassets
FINANCIAL INSTRUMENTS
NETHERLANDS
NETHERLANDS 4% 05-15.01.37 856,500 EUR 766,653 2.47 ______________________
766,653 2.47 ______________________ TOTAL FINANCIAL INSTRUMENTS 766,653 2.47 ______________________ TOTAL FINANCIAL INSTRUMENTS 775,703 2.50TOTAL INVESTMENTS 30,629,022 98.49 ______________________
OTHER NET ASSETS LESS LIABILITIES 470,961 1.51 ______________________ TOTAL NET ASSETS 31,099,983 100.00 ______________________
HSBC Global Investment Funds 195
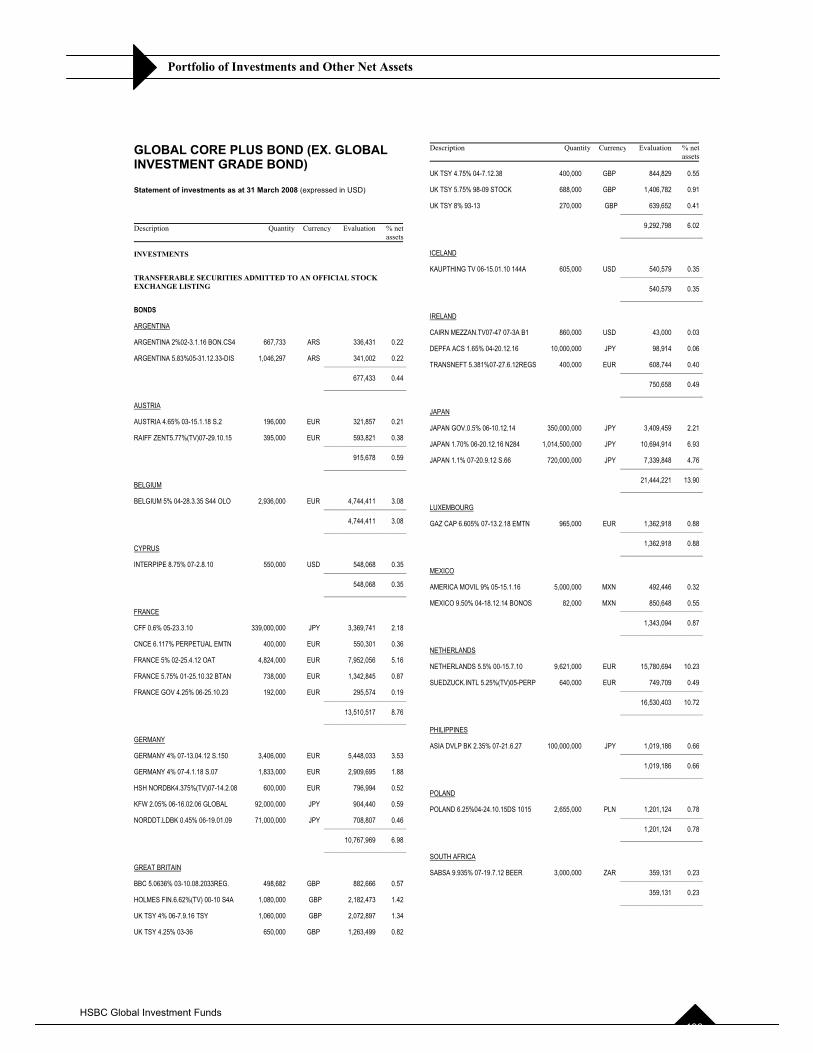
Portfolio of Investments and Other Net Assets
GLOBAL CORE PLUS BOND (EX. GLOBAL INVESTMENT GRADE BOND)
Statement of investments as at 31 March 2008 (expressed in USD)
Description Quantity Currency Evaluation % netassets
INVESTMENTS
TRANSFERABLE SECURITIES ADMITTED TO AN OFFICIAL STOCK EXCHANGE LISTING
BONDS
ARGENTINA
ARGENTINA 2%02-3.1.16 BON.CS4 667,733 ARS 336,431 0.22
ARGENTINA 5.83%05-31.12.33-DIS 1,046,297 ARS 341,002 0.22 ______________________
677,433 0.44 ______________________
AUSTRIA
AUSTRIA 4.65% 03-15.1.18 S.2 196,000 EUR 321,857 0.21
RAIFF ZENT5.77%(TV)07-29.10.15 395,000 EUR 593,821 0.38 ______________________
915,678 0.59 ______________________
BELGIUM
BELGIUM 5% 04-28.3.35 S44 OLO 2,936,000 EUR 4,744,411 3.08 ______________________
4,744,411 3.08 ______________________
CYPRUS
INTERPIPE 8.75% 07-2.8.10 550,000 USD 548,068 0.35 ______________________
548,068 0.35 ______________________
FRANCE
CFF 0.6% 05-23.3.10 339,000,000 JPY 3,369,741 2.18
CNCE 6.117% PERPETUAL EMTN 400,000 EUR 550,301 0.36
FRANCE 5% 02-25.4.12 OAT 4,824,000 EUR 7,952,056 5.16
FRANCE 5.75% 01-25.10.32 BTAN 738,000 EUR 1,342,845 0.87
FRANCE GOV 4.25% 06-25.10.23 192,000 EUR 295,574 0.19 ______________________
13,510,517 8.76 ______________________
GERMANY
GERMANY 4% 07-13.04.12 S.150 3,406,000 EUR 5,448,033 3.53
GERMANY 4% 07-4.1.18 S.07 1,833,000 EUR 2,909,695 1.88
HSH NORDBK4.375%(TV)07-14.2.08 600,000 EUR 796,994 0.52
KFW 2.05% 06-16.02.06 GLOBAL 92,000,000 JPY 904,440 0.59
NORDDT.LDBK 0.45% 06-19.01.09 71,000,000 JPY 708,807 0.46 ______________________
10,767,969 6.98 ______________________
GREAT BRITAIN
BBC 5.0636% 03-10.08.2033REG. 498,682 GBP 882,666 0.57
HOLMES FIN.6.62%(TV) 00-10 S4A 1,080,000 GBP 2,182,473 1.42
UK TSY 4% 06-7.9.16 TSY 1,060,000 GBP 2,072,897 1.34
UK TSY 4.25% 03-36 650,000 GBP 1,263,499 0.82
Description Quantity Currency Evaluation % netassets
UK TSY 4.75% 04-7.12.38 400,000 GBP 844,829 0.55
UK TSY 5.75% 98-09 STOCK 688,000 GBP 1,406,782 0.91
UK TSY 8% 93-13 270,000 GBP 639,652 0.41 ______________________
9,292,798 6.02 ______________________
ICELAND
KAUPTHING TV 06-15.01.10 144A 605,000 USD 540,579 0.35 ______________________
540,579 0.35 ______________________
IRELAND
CAIRN MEZZAN.TV07-47 07-3A B1 860,000 USD 43,000 0.03
DEPFA ACS 1.65% 04-20.12.16 10,000,000 JPY 98,914 0.06
TRANSNEFT 5.381%07-27.6.12REGS 400,000 EUR 608,744 0.40 ______________________
750,658 0.49 ______________________
JAPAN
JAPAN GOV.0.5% 06-10.12.14 350,000,000 JPY 3,409,459 2.21
JAPAN 1.70% 06-20.12.16 N284 1,014,500,000 JPY 10,694,914 6.93
JAPAN 1.1% 07-20.9.12 S.66 720,000,000 JPY 7,339,848 4.76 ______________________
21,444,221 13.90 ______________________
LUXEMBOURG
GAZ CAP 6.605% 07-13.2.18 EMTN 965,000 EUR 1,362,918 0.88 ______________________
1,362,918 0.88 ______________________
MEXICO
AMERICA MOVIL 9% 05-15.1.16 5,000,000 MXN 492,446 0.32
MEXICO 9.50% 04-18.12.14 BONOS 82,000 MXN 850,648 0.55 ______________________
1,343,094 0.87 ______________________
NETHERLANDS
NETHERLANDS 5.5% 00-15.7.10 9,621,000 EUR 15,780,694 10.23
SUEDZUCK.INTL 5.25%(TV)05-PERP 640,000 EUR 749,709 0.49 ______________________
16,530,403 10.72 ______________________
PHILIPPINES
ASIA DVLP BK 2.35% 07-21.6.27 100,000,000 JPY 1,019,186 0.66 ______________________
1,019,186 0.66 ______________________
POLAND
POLAND 6.25%04-24.10.15DS 1015 2,655,000 PLN 1,201,124 0.78 ______________________
1,201,124 0.78 ______________________
SOUTH AFRICA
SABSA 9.935% 07-19.7.12 BEER 3,000,000 ZAR 359,131 0.23 ______________________
359,131 0.23 ______________________
HSBC Global Investment Funds 196
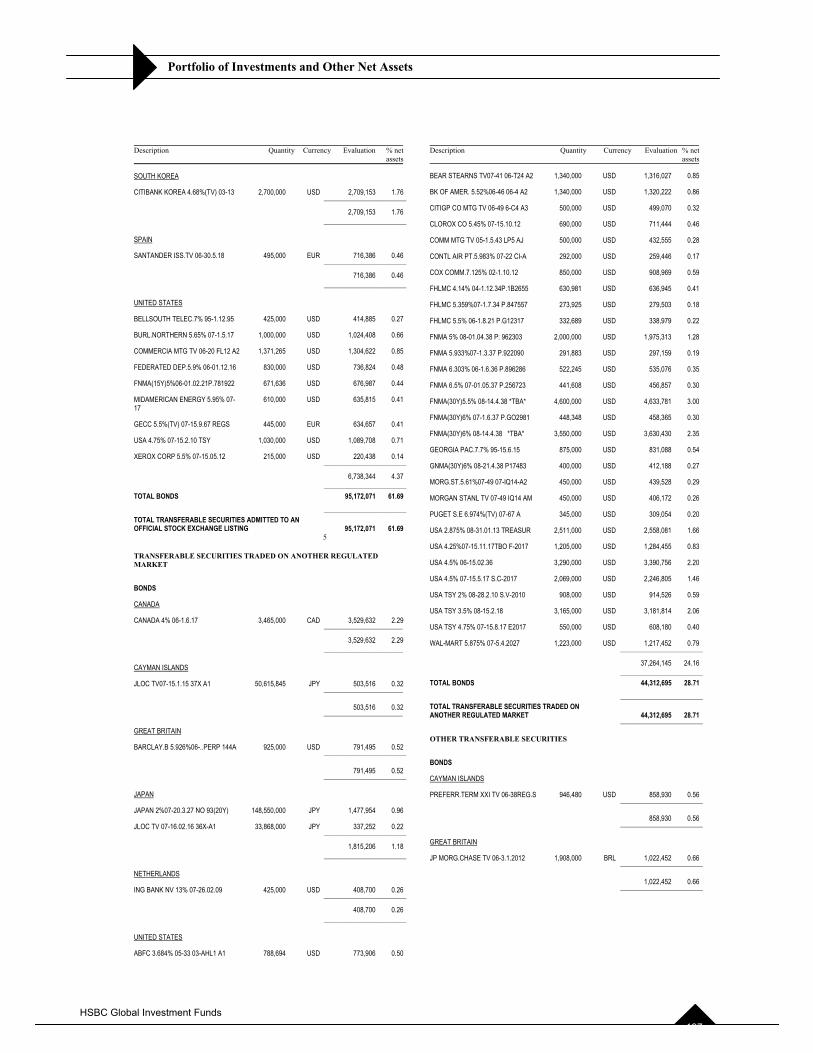
Portfolio of Investments and Other Net Assets
Description Quantity Currency Evaluation % netassets
SOUTH KOREA
CITIBANK KOREA 4.68%(TV) 03-13 2,700,000 USD 2,709,153 1.76 ______________________
2,709,153 1.76 ______________________
SPAIN
SANTANDER ISS.TV 06-30.5.18 495,000 EUR 716,386 0.46 ______________________
716,386 0.46 ______________________
UNITED STATES
BELLSOUTH TELEC.7% 95-1.12.95 425,000 USD 414,885 0.27
BURL.NORTHERN 5.65% 07-1.5.17 1,000,000 USD 1,024,408 0.66
COMMERCIA MTG TV 06-20 FL12 A2 1,371,265 USD 1,304,622 0.85
FEDERATED DEP.5.9% 06-01.12.16 830,000 USD 736,824 0.48
FNMA(15Y)5%06-01.02.21P.781922 671,636 USD 676,987 0.44
MIDAMERICAN ENERGY 5.95% 07-17
610,000 USD 635,815 0.41
GECC 5.5%(TV) 07-15.9.67 REGS 445,000 EUR 634,657 0.41
USA 4.75% 07-15.2.10 TSY 1,030,000 USD 1,089,708 0.71
XEROX CORP 5.5% 07-15.05.12 215,000 USD 220,438 0.14 ______________________
6,738,344 4.37 ______________________TOTAL BONDS 95,172,071 61.69 ______________________TOTAL TRANSFERABLE SECURITIES ADMITTED TO AN
OFFICIAL STOCK EXCHANGE LISTING 95,172,071 61.69 5
TRANSFERABLE SECURITIES TRADED ON ANOTHER REGULATED MARKET
BONDS
CANADA
CANADA 4% 06-1.6.17 3,465,000 CAD 3,529,632 2.29 ______________________
3,529,632 2.29 ______________________
CAYMAN ISLANDS
JLOC TV07-15.1.15 37X A1 50,615,845 JPY 503,516 0.32 ______________________
503,516 0.32 ______________________
GREAT BRITAIN
BARCLAY.B 5.926%06-..PERP 144A 925,000 USD 791,495 0.52 ______________________
791,495 0.52 ______________________
JAPAN
JAPAN 2%07-20.3.27 NO 93(20Y) 148,550,000 JPY 1,477,954 0.96
JLOC TV 07-16.02.16 36X-A1 33,868,000 JPY 337,252 0.22 ______________________
1,815,206 1.18 ______________________
NETHERLANDS
ING BANK NV 13% 07-26.02.09 425,000 USD 408,700 0.26 ______________________
408,700 0.26 ______________________
UNITED STATES
ABFC 3.684% 05-33 03-AHL1 A1 788,694 USD 773,906 0.50
Description Quantity Currency Evaluation % netassets
BEAR STEARNS TV07-41 06-T24 A2 1,340,000 USD 1,316,027 0.85
BK OF AMER. 5.52%06-46 06-4 A2 1,340,000 USD 1,320,222 0.86
CITIGP CO MTG TV 06-49 6-C4 A3 500,000 USD 499,070 0.32
CLOROX CO 5.45% 07-15.10.12 690,000 USD 711,444 0.46
COMM MTG TV 05-1.5.43 LP5 AJ 500,000 USD 432,555 0.28
CONTL AIR PT.5.983% 07-22 CI-A 292,000 USD 259,446 0.17
COX COMM.7.125% 02-1.10.12 850,000 USD 908,969 0.59
FHLMC 4.14% 04-1.12.34P.1B2655 630,981 USD 636,945 0.41
FHLMC 5.359%07-1.7.34 P.847557 273,925 USD 279,503 0.18
FHLMC 5.5% 06-1.8.21 P.G12317 332,689 USD 338,979 0.22
FNMA 5% 08-01.04.38 P: 962303 2,000,000 USD 1,975,313 1.28
FNMA 5.933%07-1.3.37 P.922090 291,883 USD 297,159 0.19
FNMA 6.303% 06-1.6.36 P.896286 522,245 USD 535,076 0.35
FNMA 6.5% 07-01.05.37 P.256723 441,608 USD 456,857 0.30
FNMA(30Y)5.5% 08-14.4.38 *TBA* 4,600,000 USD 4,633,781 3.00
FNMA(30Y)6% 07-1.6.37 P.GO2981 448,348 USD 458,365 0.30
FNMA(30Y)6% 08-14.4.38 *TBA* 3,550,000 USD 3,630,430 2.35
GEORGIA PAC.7.7% 95-15.6.15 875,000 USD 831,088 0.54
GNMA(30Y)6% 08-21.4.38 P17483 400,000 USD 412,188 0.27
MORG.ST.5.61%07-49 07-IQ14-A2 450,000 USD 439,528 0.29
MORGAN STANL TV 07-49 IQ14 AM 450,000 USD 406,172 0.26
PUGET S.E 6.974%(TV) 07-67 A 345,000 USD 309,054 0.20
USA 2.875% 08-31.01.13 TREASUR 2,511,000 USD 2,558,081 1.66
USA 4.25%07-15.11.17TBO F-2017 1,205,000 USD 1,284,455 0.83
USA 4.5% 06-15.02.36 3,290,000 USD 3,390,756 2.20
USA 4.5% 07-15.5.17 S.C-2017 2,069,000 USD 2,246,805 1.46
USA TSY 2% 08-28.2.10 S.V-2010 908,000 USD 914,526 0.59
USA TSY 3.5% 08-15.2.18 3,165,000 USD 3,181,814 2.06
USA TSY 4.75% 07-15.8.17 E2017 550,000 USD 608,180 0.40
WAL-MART 5.875% 07-5.4.2027 1,223,000 USD 1,217,452 0.79 ______________________
37,264,145 24.16 ______________________TOTAL BONDS 44,312,695 28.71 ______________________TOTAL TRANSFERABLE SECURITIES TRADED ON ANOTHER REGULATED MARKET 44,312,695 28.71 ______________________
OTHER TRANSFERABLE SECURITIES
BONDS
CAYMAN ISLANDS
PREFERR.TERM XXI TV 06-38REG.S 946,480 USD 858,930 0.56 ______________________
858,930 0.56 ______________________
GREAT BRITAIN
JP MORG.CHASE TV 06-3.1.2012 1,908,000 BRL 1,022,452 0.66 ______________________
1,022,452 0.66 ______________________
HSBC Global Investment Funds 197
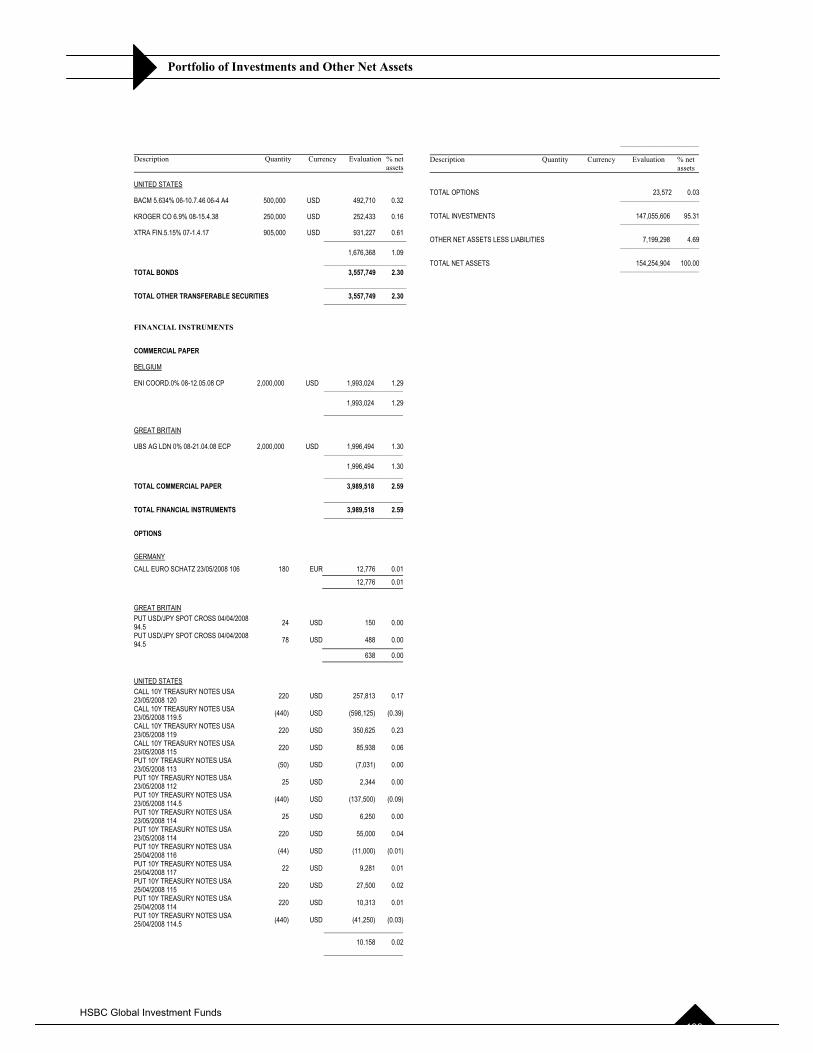
Portfolio of Investments and Other Net Assets
Description Quantity Currency Evaluation % netassets
UNITED STATES
BACM 5.634% 06-10.7.46 06-4 A4 500,000 USD 492,710 0.32
KROGER CO 6.9% 08-15.4.38 250,000 USD 252,433 0.16
XTRA FIN.5.15% 07-1.4.17 905,000 USD 931,227 0.61 ______________________
1,676,368 1.09 ______________________TOTAL BONDS 3,557,749 2.30 ______________________TOTAL OTHER TRANSFERABLE SECURITIES 3,557,749 2.30 ______________________
FINANCIAL INSTRUMENTS
COMMERCIAL PAPER
BELGIUM
ENI COORD.0% 08-12.05.08 CP 2,000,000 USD 1,993,024 1.29 ______________________
1,993,024 1.29 ______________________
GREAT BRITAIN
UBS AG LDN 0% 08-21.04.08 ECP 2,000,000 USD 1,996,494 1.30 ______________________
1,996,494 1.30 ______________________TOTAL COMMERCIAL PAPER 3,989,518 2.59 ______________________TOTAL FINANCIAL INSTRUMENTS 3,989,518 2.59 ______________________
OPTIONS
GERMANY
CALL EURO SCHATZ 23/05/2008 106 180 EUR 12,776_ 0.01
12,776_ 0.01
GREAT BRITAIN
PUT USD/JPY SPOT CROSS 04/04/2008 94.5 24 USD 150_ 0.00PUT USD/JPY SPOT CROSS 04/04/2008 94.5 78 USD 488_ 0.00
638_ 0.00
UNITED STATES
CALL 10Y TREASURY NOTES USA 23/05/2008 120 220 USD 257,813_ 0.17CALL 10Y TREASURY NOTES USA 23/05/2008 119.5 (440) USD (598,125)_ (0.39)CALL 10Y TREASURY NOTES USA 23/05/2008 119 220 USD 350,625_ 0.23CALL 10Y TREASURY NOTES USA 23/05/2008 115 220 USD 85,938_ 0.06PUT 10Y TREASURY NOTES USA 23/05/2008 113 (50) USD (7,031)_ 0.00PUT 10Y TREASURY NOTES USA 23/05/2008 112 25 USD 2,344_ 0.00PUT 10Y TREASURY NOTES USA 23/05/2008 114.5 (440) USD (137,500)_ (0.09)PUT 10Y TREASURY NOTES USA 23/05/2008 114 25 USD 6,250_ 0.00PUT 10Y TREASURY NOTES USA 23/05/2008 114 220 USD 55,000_ 0.04PUT 10Y TREASURY NOTES USA 25/04/2008 116 (44) USD (11,000)_ (0.01)PUT 10Y TREASURY NOTES USA 25/04/2008 117 22 USD 9,281_ 0.01PUT 10Y TREASURY NOTES USA 25/04/2008 115 220 USD 27,500_ 0.02PUT 10Y TREASURY NOTES USA 25/04/2008 114 220 USD 10,313_ 0.01PUT 10Y TREASURY NOTES USA 25/04/2008 114.5 _____________________
(440) USD (41,250)_ (0.03)_
10.158_ 0.02 ______________________
______________________
Description Quantity Currency Evaluation % netassets
TOTAL OPTIONS 23,572_ 0.03 ______________________
TOTAL INVESTMENTS 147,055,606 95.31 ______________________
OTHER NET ASSETS LESS LIABILITIES 7,199,298 4.69 ______________________
TOTAL NET ASSETS 154,254,904 100.00 ______________________
HSBC Global Investment Funds 198
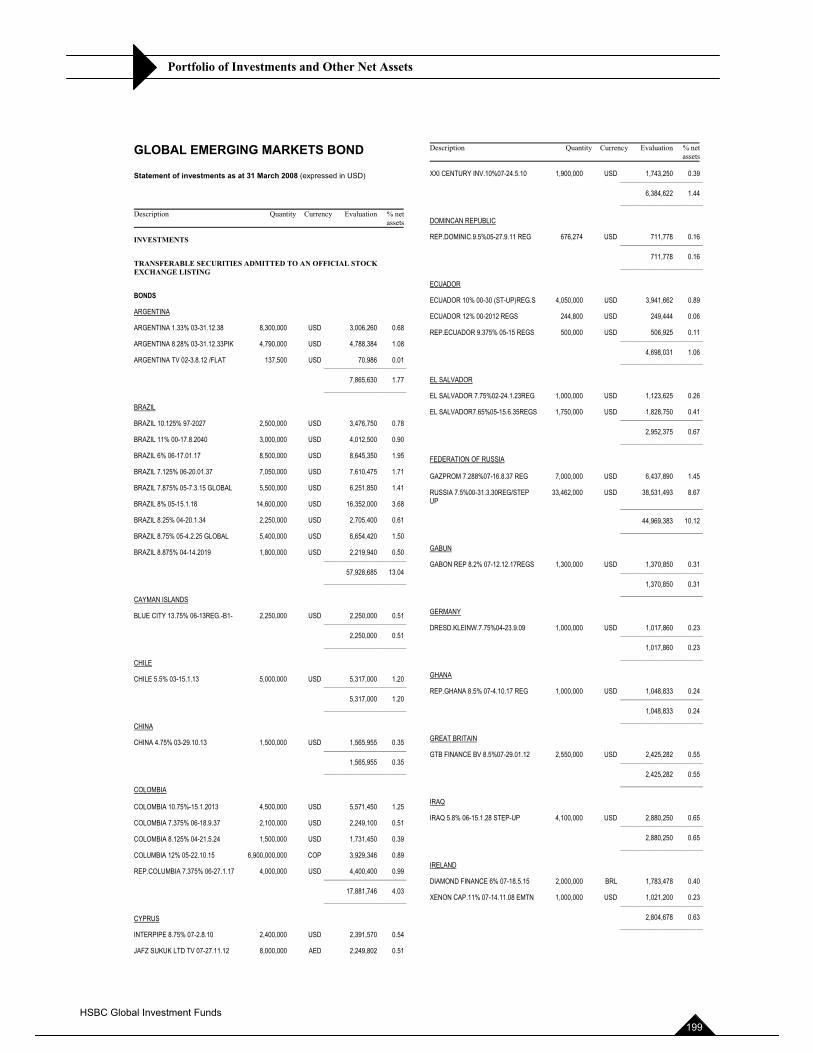
Portfolio of Investments and Other Net Assets
GLOBAL EMERGING MARKETS BOND
Statement of investments as at 31 March 2008 (expressed in USD)
Description Quantity Currency Evaluation % netassets
INVESTMENTS
TRANSFERABLE SECURITIES ADMITTED TO AN OFFICIAL STOCK EXCHANGE LISTING
BONDS
ARGENTINA
ARGENTINA 1.33% 03-31.12.38 8,300,000 USD 3,006,260 0.68
ARGENTINA 8.28% 03-31.12.33PIK 4,790,000 USD 4,788,384 1.08
ARGENTINA TV 02-3.8.12 /FLAT 137,500 USD 70,986 0.01 ______________________
7,865,630 1.77 ______________________
BRAZIL
BRAZIL 10.125% 97-2027 2,500,000 USD 3,476,750 0.78
BRAZIL 11% 00-17.8.2040 3,000,000 USD 4,012,500 0.90
BRAZIL 6% 06-17.01.17 8,500,000 USD 8,645,350 1.95
BRAZIL 7.125% 06-20.01.37 7,050,000 USD 7,610,475 1.71
BRAZIL 7.875% 05-7.3.15 GLOBAL 5,500,000 USD 6,251,850 1.41
BRAZIL 8% 05-15.1.18 14,600,000 USD 16,352,000 3.68
BRAZIL 8.25% 04-20.1.34 2,250,000 USD 2,705,400 0.61
BRAZIL 8.75% 05-4.2.25 GLOBAL 5,400,000 USD 6,654,420 1.50
BRAZIL 8.875% 04-14.2019 1,800,000 USD 2,219,940 0.50 ______________________
57,928,685 13.04 ______________________
CAYMAN ISLANDS
BLUE CITY 13.75% 06-13REG.-B1- 2,250,000 USD 2,250,000 0.51 ______________________
2,250,000 0.51 ______________________
CHILE
CHILE 5.5% 03-15.1.13 5,000,000 USD 5,317,000 1.20 ______________________
5,317,000 1.20 ______________________
CHINA
CHINA 4.75% 03-29.10.13 1,500,000 USD 1,565,955 0.35 ______________________
1,565,955 0.35 ______________________
COLOMBIA
COLOMBIA 10.75%-15.1.2013 4,500,000 USD 5,571,450 1.25
COLOMBIA 7.375% 06-18.9.37 2,100,000 USD 2,249,100 0.51
COLOMBIA 8.125% 04-21.5.24 1,500,000 USD 1,731,450 0.39
COLUMBIA 12% 05-22.10.15 6,900,000,000 COP 3,929,346 0.89
REP.COLUMBIA 7.375% 06-27.1.17 4,000,000 USD 4,400,400 0.99 ______________________
17,881,746 4.03 ______________________
CYPRUS
INTERPIPE 8.75% 07-2.8.10 2,400,000 USD 2,391,570 0.54
JAFZ SUKUK LTD TV 07-27.11.12 8,000,000 AED 2,249,802 0.51
Description Quantity Currency Evaluation % netassets
XXI CENTURY INV.10%07-24.5.10 1,900,000 USD 1,743,250 0.39 ______________________
6,384,622 1.44 ______________________
DOMINCAN REPUBLIC
REP.DOMINIC.9.5%05-27.9.11 REG 676,274 USD 711,778 0.16 ______________________
711,778 0.16 ______________________
ECUADOR
ECUADOR 10% 00-30 (ST-UP)REG.S 4,050,000 USD 3,941,662 0.89
ECUADOR 12% 00-2012 REGS 244,800 USD 249,444 0.06
REP.ECUADOR 9.375% 05-15 REGS 500,000 USD 506,925 0.11 ______________________
4,698,031 1.06 ______________________
EL SALVADOR
EL SALVADOR 7.75%02-24.1.23REG 1,000,000 USD 1,123,625 0.26
EL SALVADOR7.65%05-15.6.35REGS 1,750,000 USD 1,828,750 0.41 ______________________
2,952,375 0.67 ______________________
FEDERATION OF RUSSIA
GAZPROM 7.288%07-16.8.37 REG 7,000,000 USD 6,437,890 1.45
RUSSIA 7.5%00-31.3.30REG/STEP UP ______________________
33,462,000 USD 38,531,493 8.67
44,969,383 10.12 ______________________
GABUN
GABON REP 8.2% 07-12.12.17REGS 1,300,000 USD 1,370,850 0.31 ______________________
1,370,850 0.31 ______________________
GERMANY
DRESD.KLEINW.7.75%04-23.9.09 1,000,000 USD 1,017,860 0.23 ______________________
1,017,860 0.23 ______________________
GHANA
REP.GHANA 8.5% 07-4.10.17 REG 1,000,000 USD 1,048,833 0.24 ______________________
1,048,833 0.24 ______________________
GREAT BRITAIN
GTB FINANCE BV 8.5%07-29.01.12 2,550,000 USD 2,425,282 0.55 ______________________
2,425,282 0.55 ______________________
IRAQ
IRAQ 5.8% 06-15.1.28 STEP-UP 4,100,000 USD 2,880,250 0.65 ______________________
2,880,250 0.65 ______________________
IRELAND
DIAMOND FINANCE 6% 07-18.5.15 2,000,000 BRL 1,783,478 0.40
XENON CAP.11% 07-14.11.08 EMTN 1,000,000 USD 1,021,200 0.23 ______________________
2,804,678 0.63 ______________________
HSBC Global Investment Funds 199
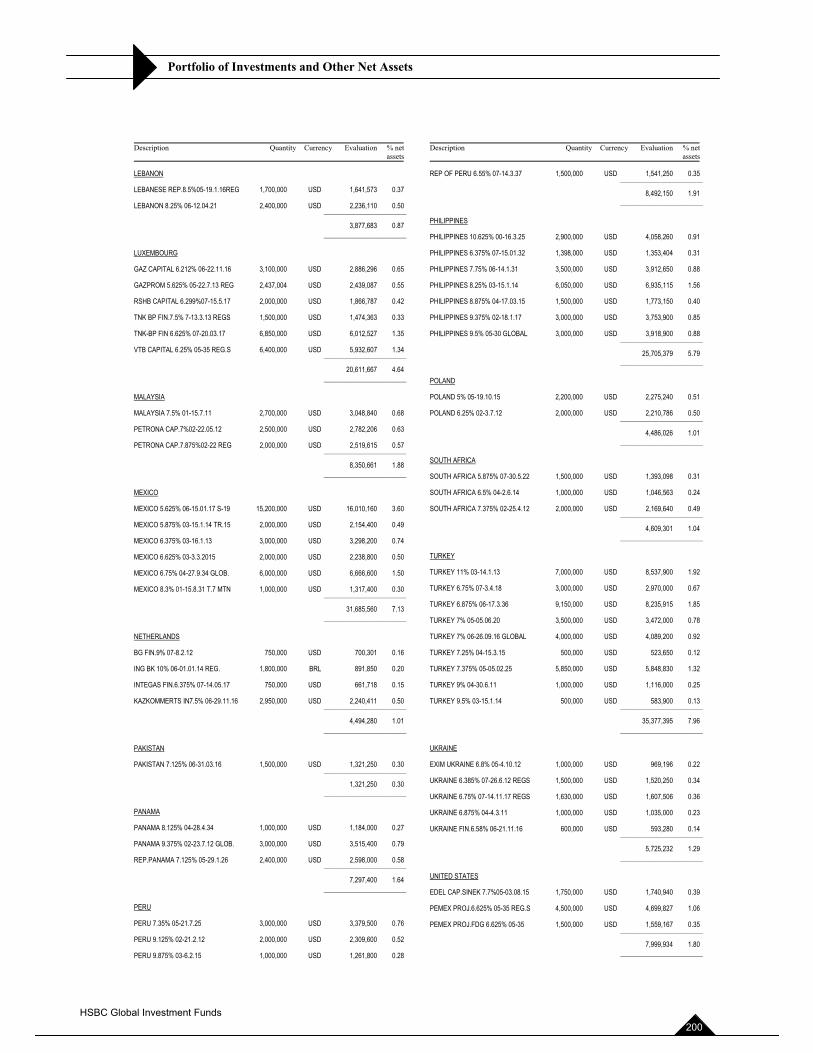
Portfolio of Investments and Other Net Assets
Description Quantity Currency Evaluation % netassets
LEBANON
LEBANESE REP.8.5%05-19.1.16REG 1,700,000 USD 1,641,573 0.37
LEBANON 8.25% 06-12.04.21 2,400,000 USD 2,236,110 0.50 ______________________
3,877,683 0.87 ______________________
LUXEMBOURG
GAZ CAPITAL 6.212% 06-22.11.16 3,100,000 USD 2,886,296 0.65
GAZPROM 5.625% 05-22.7.13 REG 2,437,004 USD 2,439,087 0.55
RSHB CAPITAL 6.299%07-15.5.17 2,000,000 USD 1,866,787 0.42
TNK BP FIN.7.5% 7-13.3.13 REGS 1,500,000 USD 1,474,363 0.33
TNK-BP FIN 6.625% 07-20.03.17 6,850,000 USD 6,012,527 1.35
VTB CAPITAL 6.25% 05-35 REG.S 6,400,000 USD 5,932,607 1.34 ______________________
20,611,667 4.64 ______________________
MALAYSIA
MALAYSIA 7.5% 01-15.7.11 2,700,000 USD 3,048,840 0.68
PETRONA CAP.7%02-22.05.12 2,500,000 USD 2,782,206 0.63
PETRONA CAP.7.875%02-22 REG 2,000,000 USD 2,519,615 0.57 ______________________
8,350,661 1.88 ______________________
MEXICO
MEXICO 5.625% 06-15.01.17 S-19 15,200,000 USD 16,010,160 3.60
MEXICO 5.875% 03-15.1.14 TR.15 2,000,000 USD 2,154,400 0.49
MEXICO 6.375% 03-16.1.13 3,000,000 USD 3,298,200 0.74
MEXICO 6.625% 03-3.3.2015 2,000,000 USD 2,238,800 0.50
MEXICO 6.75% 04-27.9.34 GLOB. 6,000,000 USD 6,666,600 1.50
MEXICO 8.3% 01-15.8.31 T.7 MTN 1,000,000 USD 1,317,400 0.30 ______________________
31,685,560 7.13 ______________________
NETHERLANDS
BG FIN.9% 07-8.2.12 750,000 USD 700,301 0.16
ING BK 10% 06-01.01.14 REG. 1,800,000 BRL 891,850 0.20
INTEGAS FIN.6.375% 07-14.05.17 750,000 USD 661,718 0.15
KAZKOMMERTS IN7.5% 06-29.11.16 2,950,000 USD 2,240,411 0.50 ______________________
4,494,280 1.01 ______________________
PAKISTAN
PAKISTAN 7.125% 06-31.03.16 1,500,000 USD 1,321,250 0.30 ______________________
1,321,250 0.30 ______________________
PANAMA
PANAMA 8.125% 04-28.4.34 1,000,000 USD 1,184,000 0.27
PANAMA 9.375% 02-23.7.12 GLOB. 3,000,000 USD 3,515,400 0.79
REP.PANAMA 7.125% 05-29.1.26 2,400,000 USD 2,598,000 0.58 ______________________
7,297,400 1.64 ______________________
PERU
PERU 7.35% 05-21.7.25 3,000,000 USD 3,379,500 0.76
PERU 9.125% 02-21.2.12 2,000,000 USD 2,309,600 0.52
PERU 9.875% 03-6.2.15 1,000,000 USD 1,261,800 0.28
Description Quantity Currency Evaluation % netassets
REP OF PERU 6.55% 07-14.3.37 1,500,000 USD 1,541,250 0.35 ______________________
8,492,150 1.91 ______________________
PHILIPPINES
PHILIPPINES 10.625% 00-16.3.25 2,900,000 USD 4,058,260 0.91
PHILIPPINES 6.375% 07-15.01.32 1,398,000 USD 1,353,404 0.31
PHILIPPINES 7.75% 06-14.1.31 3,500,000 USD 3,912,650 0.88
PHILIPPINES 8.25% 03-15.1.14 6,050,000 USD 6,935,115 1.56
PHILIPPINES 8.875% 04-17.03.15 1,500,000 USD 1,773,150 0.40
PHILIPPINES 9.375% 02-18.1.17 3,000,000 USD 3,753,900 0.85
PHILIPPINES 9.5% 05-30 GLOBAL 3,000,000 USD 3,918,900 0.88 ______________________
25,705,379 5.79 ______________________
POLAND
POLAND 5% 05-19.10.15 2,200,000 USD 2,275,240 0.51
POLAND 6.25% 02-3.7.12 2,000,000 USD 2,210,786 0.50 ______________________
4,486,026 1.01 ______________________
SOUTH AFRICA
SOUTH AFRICA 5.875% 07-30.5.22 1,500,000 USD 1,393,098 0.31
SOUTH AFRICA 6.5% 04-2.6.14 1,000,000 USD 1,046,563 0.24
SOUTH AFRICA 7.375% 02-25.4.12 2,000,000 USD 2,169,640 0.49 ______________________
4,609,301 1.04 ______________________
TURKEY
TURKEY 11% 03-14.1.13 7,000,000 USD 8,537,900 1.92
TURKEY 6.75% 07-3.4.18 3,000,000 USD 2,970,000 0.67
TURKEY 6.875% 06-17.3.36 9,150,000 USD 8,235,915 1.85
TURKEY 7% 05-05.06.20 3,500,000 USD 3,472,000 0.78
TURKEY 7% 06-26.09.16 GLOBAL 4,000,000 USD 4,089,200 0.92
TURKEY 7.25% 04-15.3.15 500,000 USD 523,650 0.12
TURKEY 7.375% 05-05.02.25 5,850,000 USD 5,848,830 1.32
TURKEY 9% 04-30.6.11 1,000,000 USD 1,116,000 0.25
TURKEY 9.5% 03-15.1.14 500,000 USD 583,900 0.13 ______________________
35,377,395 7.96 ______________________
UKRAINE
EXIM UKRAINE 6.8% 05-4.10.12 1,000,000 USD 969,196 0.22
UKRAINE 6.385% 07-26.6.12 REGS 1,500,000 USD 1,520,250 0.34
UKRAINE 6.75% 07-14.11.17 REGS 1,630,000 USD 1,607,506 0.36
UKRAINE 6.875% 04-4.3.11 1,000,000 USD 1,035,000 0.23
UKRAINE FIN.6.58% 06-21.11.16 600,000 USD 593,280 0.14 ______________________
5,725,232 1.29 ______________________
UNITED STATES
EDEL CAP.SINEK 7.7%05-03.08.15 1,750,000 USD 1,740,940 0.39
PEMEX PROJ.6.625% 05-35 REG.S 4,500,000 USD 4,699,827 1.06
PEMEX PROJ.FDG 6.625% 05-35 1,500,000 USD 1,559,167 0.35 ______________________
7,999,934 1.80 ______________________
HSBC Global Investment Funds 200
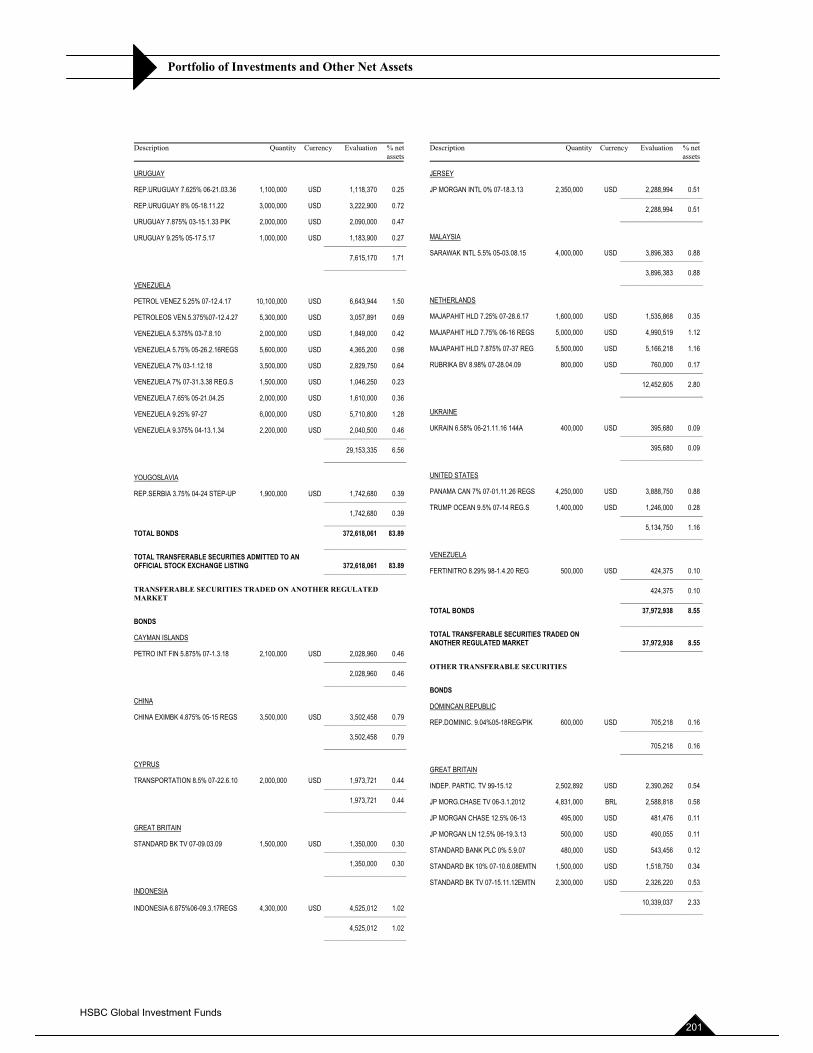
Portfolio of Investments and Other Net Assets
Description Quantity Currency Evaluation % netassets
URUGUAY
REP.URUGUAY 7.625% 06-21.03.36 1,100,000 USD 1,118,370 0.25
REP.URUGUAY 8% 05-18.11.22 3,000,000 USD 3,222,900 0.72
URUGUAY 7.875% 03-15.1.33 PIK 2,000,000 USD 2,090,000 0.47
URUGUAY 9.25% 05-17.5.17 1,000,000 USD 1,183,900 0.27 ______________________
7,615,170 1.71 ______________________
VENEZUELA
PETROL VENEZ 5.25% 07-12.4.17 10,100,000 USD 6,643,944 1.50
PETROLEOS VEN.5.375%07-12.4.27 5,300,000 USD 3,057,891 0.69
VENEZUELA 5.375% 03-7.8.10 2,000,000 USD 1,849,000 0.42
VENEZUELA 5.75% 05-26.2.16REGS 5,600,000 USD 4,365,200 0.98
VENEZUELA 7% 03-1.12.18 3,500,000 USD 2,829,750 0.64
VENEZUELA 7% 07-31.3.38 REG.S 1,500,000 USD 1,046,250 0.23
VENEZUELA 7.65% 05-21.04.25 2,000,000 USD 1,610,000 0.36
VENEZUELA 9.25% 97-27 6,000,000 USD 5,710,800 1.28
VENEZUELA 9.375% 04-13.1.34 2,200,000 USD 2,040,500 0.46 ______________________
29,153,335 6.56 ______________________
YOUGOSLAVIA
REP.SERBIA 3.75% 04-24 STEP-UP 1,900,000 USD 1,742,680 0.39 ______________________
1,742,680 0.39 ______________________ TOTAL BONDS 372,618,061 83.89 ______________________ TOTAL TRANSFERABLE SECURITIES ADMITTED TO AN OFFICIAL STOCK EXCHANGE LISTING 372,618,061 83.89 ______________________
TRANSFERABLE SECURITIES TRADED ON ANOTHER REGULATED MARKET
BONDS
CAYMAN ISLANDS
PETRO INT FIN 5.875% 07-1.3.18 2,100,000 USD 2,028,960 0.46 ______________________
2,028,960 0.46 ______________________
CHINA
CHINA EXIMBK 4.875% 05-15 REGS 3,500,000 USD 3,502,458 0.79 ______________________
3,502,458 0.79 ______________________
CYPRUS
TRANSPORTATION 8.5% 07-22.6.10 2,000,000 USD 1,973,721 0.44 ______________________
1,973,721 0.44 ______________________
GREAT BRITAIN
STANDARD BK TV 07-09.03.09 1,500,000 USD 1,350,000 0.30 ______________________
1,350,000 0.30 ______________________
INDONESIA
INDONESIA 6.875%06-09.3.17REGS 4,300,000 USD 4,525,012 1.02 ______________________
4,525,012 1.02 ______________________
Description Quantity Currency Evaluation % netassets
JERSEY
JP MORGAN INTL 0% 07-18.3.13 2,350,000 USD 2,288,994 0.51 ______________________
2,288,994 0.51 ______________________
MALAYSIA
SARAWAK INTL 5.5% 05-03.08.15 4,000,000 USD 3,896,383 0.88 ______________________
3,896,383 0.88 ______________________
NETHERLANDS
MAJAPAHIT HLD 7.25% 07-28.6.17 1,600,000 USD 1,535,868 0.35
MAJAPAHIT HLD 7.75% 06-16 REGS 5,000,000 USD 4,990,519 1.12
MAJAPAHIT HLD 7.875% 07-37 REG 5,500,000 USD 5,166,218 1.16
RUBRIKA BV 8.98% 07-28.04.09 800,000 USD 760,000 0.17 ______________________
12,452,605 2.80 ______________________
UKRAINE
UKRAIN 6.58% 06-21.11.16 144A 400,000 USD 395,680 0.09 ______________________
395,680 0.09 ______________________
UNITED STATES
PANAMA CAN 7% 07-01.11.26 REGS 4,250,000 USD 3,888,750 0.88
TRUMP OCEAN 9.5% 07-14 REG.S 1,400,000 USD 1,246,000 0.28 ______________________
5,134,750 1.16 ______________________
VENEZUELA
FERTINITRO 8.29% 98-1.4.20 REG 500,000 USD 424,375 0.10 ______________________
424,375 0.10 ______________________ TOTAL BONDS 37,972,938 8.55 ______________________ TOTAL TRANSFERABLE SECURITIES TRADED ON ANOTHER REGULATED MARKET 37,972,938 8.55 ______________________
OTHER TRANSFERABLE SECURITIES
BONDS
DOMINCAN REPUBLIC
REP.DOMINIC. 9.04%05-18REG/PIK 600,000 USD 705,218 0.16 ______________________
705,218 0.16 ______________________
GREAT BRITAIN
INDEP. PARTIC. TV 99-15.12 2,502,892 USD 2,390,262 0.54
JP MORG.CHASE TV 06-3.1.2012 4,831,000 BRL 2,588,818 0.58
JP MORGAN CHASE 12.5% 06-13 495,000 USD 481,476 0.11
JP MORGAN LN 12.5% 06-19.3.13 500,000 USD 490,055 0.11
STANDARD BANK PLC 0% 5.9.07 480,000 USD 543,456 0.12
STANDARD BK 10% 07-10.6.08EMTN 1,500,000 USD 1,518,750 0.34
STANDARD BK TV 07-15.11.12EMTN 2,300,000 USD 2,326,220 0.53 ______________________
10,339,037 2.33 ______________________
HSBC Global Investment Funds 201
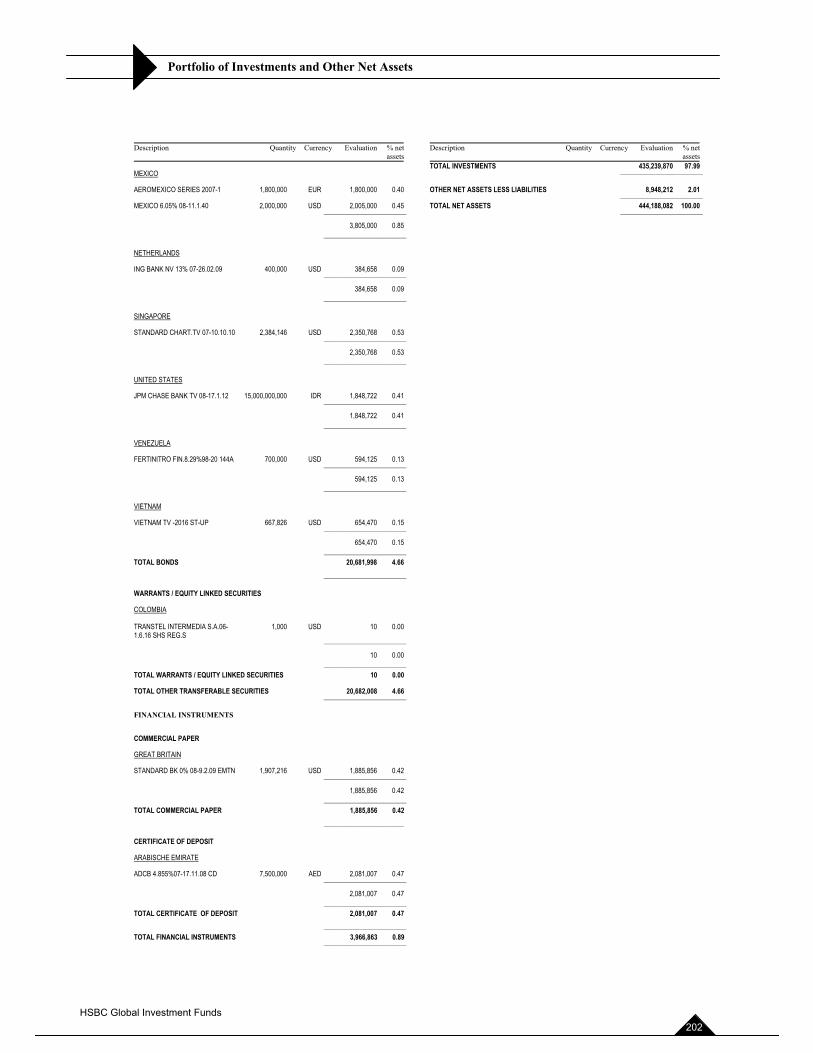
Portfolio of Investments and Other Net Assets
Description Quantity Currency Evaluation % netassets
MEXICO
AEROMEXICO SERIES 2007-1 1,800,000 EUR 1,800,000 0.40
MEXICO 6.05% 08-11.1.40 2,000,000 USD 2,005,000 0.45 ______________________
3,805,000 0.85 ______________________
NETHERLANDS
ING BANK NV 13% 07-26.02.09 400,000 USD 384,658 0.09 ______________________
384,658 0.09 ______________________
SINGAPORE
STANDARD CHART.TV 07-10.10.10 2,384,146 USD 2,350,768 0.53 ______________________
2,350,768 0.53 ______________________
UNITED STATES
JPM CHASE BANK TV 08-17.1.12 15,000,000,000 IDR 1,848,722 0.41 ______________________
1,848,722 0.41 ______________________
VENEZUELA
FERTINITRO FIN.8.29%98-20 144A 700,000 USD 594,125 0.13 ______________________
594,125 0.13 ______________________
VIETNAM
VIETNAM TV -2016 ST-UP 667,826 USD 654,470 0.15 ______________________
654,470 0.15 ______________________ TOTAL BONDS 20,681,998 4.66 ______________________
WARRANTS / EQUITY LINKED SECURITIES
COLOMBIA
TRANSTEL INTERMEDIA S.A.06-1.6.16 SHS REG.S ______________________
1,000 USD 10 0.00
10 0.00 ______________________ TOTAL WARRANTS / EQUITY LINKED SECURITIES 10 0.00
TOTAL OTHER TRANSFERABLE SECURITIES 20,682,008 4.66 ______________________
FINANCIAL INSTRUMENTS
COMMERCIAL PAPER
GREAT BRITAIN
STANDARD BK 0% 08-9.2.09 EMTN 1,907,216 USD 1,885,856 0.42 ______________________
1,885,856 0.42 ______________________ TOTAL COMMERCIAL PAPER 1,885,856 0.42 ______________________
CERTIFICATE OF DEPOSIT
ARABISCHE EMIRATE
ADCB 4.855%07-17.11.08 CD 7,500,000 AED 2,081,007 0.47 ______________________
2,081,007 0.47 ______________________ TOTAL CERTIFICATE OF DEPOSIT 2,081,007 0.47 ______________________ TOTAL FINANCIAL INSTRUMENTS 3,966,863 0.89 ______________________
Description Quantity Currency Evaluation % netassets
TOTAL INVESTMENTS 435,239,870 97.99 ______________________
OTHER NET ASSETS LESS LIABILITIES 8,948,212 2.01 ______________________ TOTAL NET ASSETS 444,188,082 100.00 ______________________
HSBC Global Investment Funds 202
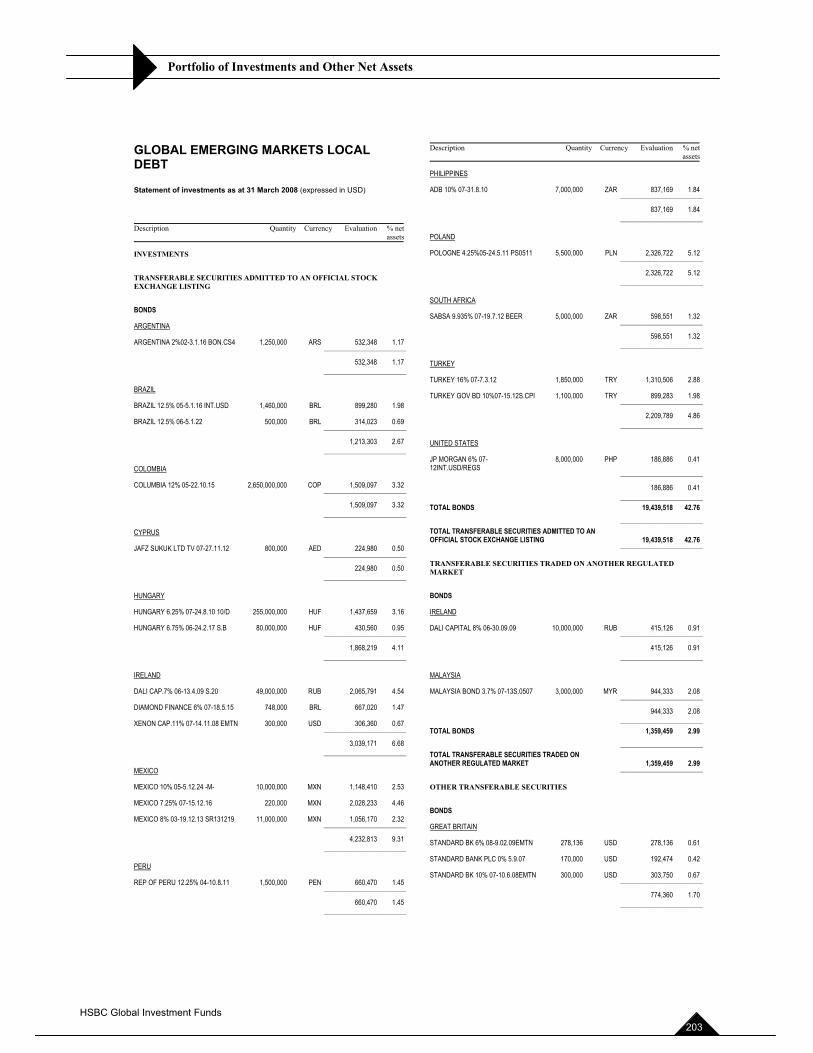
Portfolio of Investments and Other Net Assets
GLOBAL EMERGING MARKETS LOCAL DEBT
Statement of investments as at 31 March 2008 (expressed in USD)
Description Quantity Currency Evaluation % netassets
INVESTMENTS
TRANSFERABLE SECURITIES ADMITTED TO AN OFFICIAL STOCK EXCHANGE LISTING
BONDS
ARGENTINA
ARGENTINA 2%02-3.1.16 BON.CS4 1,250,000 ARS 532,348 1.17 ______________________
532,348 1.17 ______________________
BRAZIL
BRAZIL 12.5% 05-5.1.16 INT.USD 1,460,000 BRL 899,280 1.98
BRAZIL 12.5% 06-5.1.22 500,000 BRL 314,023 0.69 ______________________
1,213,303 2.67 ______________________
COLOMBIA
COLUMBIA 12% 05-22.10.15 2,650,000,000 COP 1,509,097 3.32 ______________________
1,509,097 3.32 ______________________
CYPRUS
JAFZ SUKUK LTD TV 07-27.11.12 800,000 AED 224,980 0.50 ______________________
224,980 0.50 ______________________
HUNGARY
HUNGARY 6.25% 07-24.8.10 10/D 255,000,000 HUF 1,437,659 3.16
HUNGARY 6.75% 06-24.2.17 S.B 80,000,000 HUF 430,560 0.95 ______________________
1,868,219 4.11 ______________________
IRELAND
DALI CAP.7% 06-13.4.09 S.20 49,000,000 RUB 2,065,791 4.54
DIAMOND FINANCE 6% 07-18.5.15 748,000 BRL 667,020 1.47
XENON CAP.11% 07-14.11.08 EMTN 300,000 USD 306,360 0.67 ______________________
3,039,171 6.68 ______________________
MEXICO
MEXICO 10% 05-5.12.24 -M- 10,000,000 MXN 1,148,410 2.53
MEXICO 7.25% 07-15.12.16 220,000 MXN 2,028,233 4.46
MEXICO 8% 03-19.12.13 SR131219 11,000,000 MXN 1,056,170 2.32 ______________________
4,232,813 9.31 ______________________
PERU
REP OF PERU 12.25% 04-10.8.11 1,500,000 PEN 660,470 1.45 ______________________
660,470 1.45 ______________________
Description Quantity Currency Evaluation % netassets
PHILIPPINES
ADB 10% 07-31.8.10 7,000,000 ZAR 837,169 1.84 ______________________
837,169 1.84 ______________________
POLAND
POLOGNE 4.25%05-24.5.11 PS0511 5,500,000 PLN 2,326,722 5.12 ______________________
2,326,722 5.12 ______________________
SOUTH AFRICA
SABSA 9.935% 07-19.7.12 BEER 5,000,000 ZAR 598,551 1.32 ______________________
598,551 1.32 ______________________
TURKEY
TURKEY 16% 07-7.3.12 1,850,000 TRY 1,310,506 2.88
TURKEY GOV BD 10%07-15.12S.CPI 1,100,000 TRY 899,283 1.98 ______________________
2,209,789 4.86 ______________________
UNITED STATES
JP MORGAN 6% 07-12INT.USD/REGS ______________________
8,000,000 PHP 186,886 0.41
186,886 0.41 ______________________ TOTAL BONDS 19,439,518 42.76 ______________________ TOTAL TRANSFERABLE SECURITIES ADMITTED TO AN OFFICIAL STOCK EXCHANGE LISTING 19,439,518 42.76 ______________________
TRANSFERABLE SECURITIES TRADED ON ANOTHER REGULATED MARKET
BONDS
IRELAND
DALI CAPITAL 8% 06-30.09.09 10,000,000 RUB 415,126 0.91 ______________________
415,126 0.91 ______________________
MALAYSIA
MALAYSIA BOND 3.7% 07-13S.0507 3,000,000 MYR 944,333 2.08 ______________________
944,333 2.08 ______________________ TOTAL BONDS 1,359,459 2.99 ______________________ TOTAL TRANSFERABLE SECURITIES TRADED ON ANOTHER REGULATED MARKET 1,359,459 2.99 ______________________
OTHER TRANSFERABLE SECURITIES
BONDS
GREAT BRITAIN
STANDARD BK 6% 08-9.02.09EMTN 278,136 USD 278,136 0.61
STANDARD BANK PLC 0% 5.9.07 170,000 USD 192,474 0.42
STANDARD BK 10% 07-10.6.08EMTN 300,000 USD 303,750 0.67 ______________________
774,360 1.70 ______________________
HSBC Global Investment Funds 203
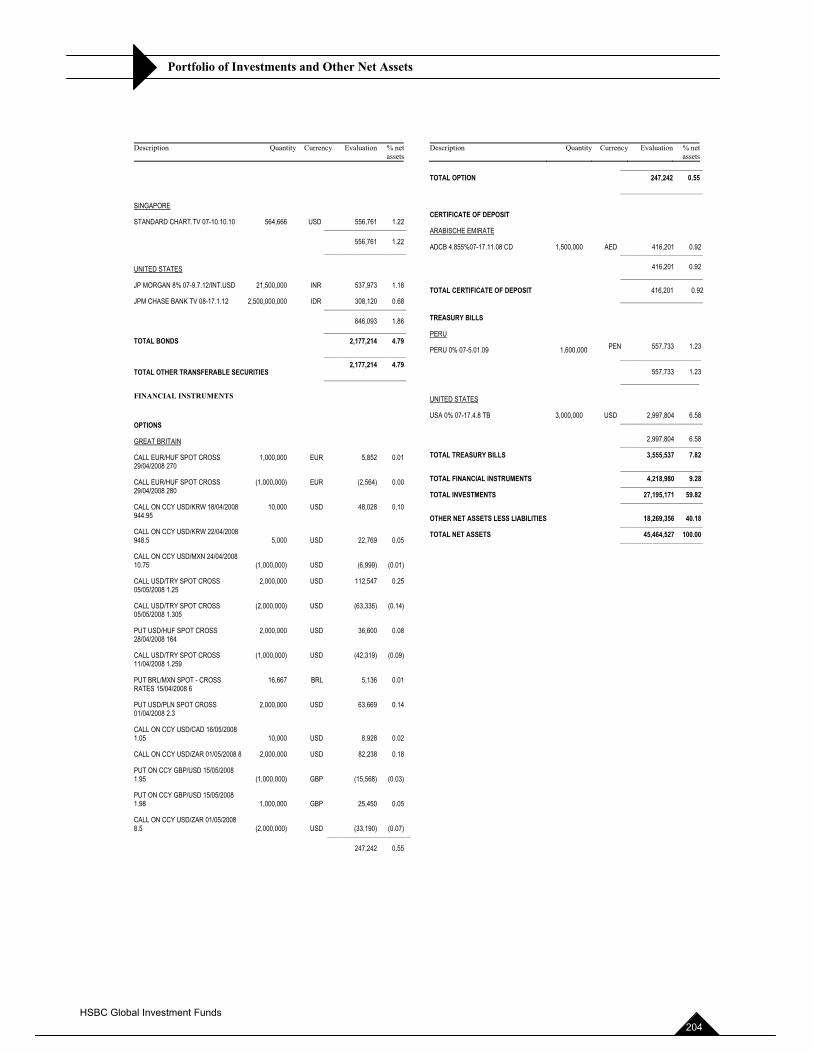
Portfolio of Investments and Other Net Assets
Description Quantity Currency Evaluation % netassets
SINGAPORE
STANDARD CHART.TV 07-10.10.10 564,666 USD 556,761 1.22 ______________________
556,761 1.22 ______________________
UNITED STATES
JP MORGAN 8% 07-9.7.12/INT.USD 21,500,000 INR 537,973 1.18
JPM CHASE BANK TV 08-17.1.12 2,500,000,000 IDR 308,120 0.68 ______________________
846,093 1.86 ______________________ TOTAL BONDS 2,177,214 4.79 ______________________
TOTAL OTHER TRANSFERABLE SECURITIES ______________________ 2,177,214 4.79
FINANCIAL INSTRUMENTS
OPTIONS
GREAT BRITAIN
CALL EUR/HUF SPOT CROSS 29/04/2008 270
1,000,000 EUR 5,852 0.01
CALL EUR/HUF SPOT CROSS 29/04/2008 280
(1,000,000) EUR (2,564) 0.00
CALL ON CCY USD/KRW 18/04/2008 944.95
10,000 USD 48,028 0.10
CALL ON CCY USD/KRW 22/04/2008 948.5 5,000 USD 22,769 0.05
CALL ON CCY USD/MXN 24/04/2008 10.75 (1,000,000) USD (6,999) (0.01)
CALL USD/TRY SPOT CROSS 05/05/2008 1.25
2,000,000 USD 112,547 0.25
CALL USD/TRY SPOT CROSS 05/05/2008 1.305
(2,000,000) USD (63,335) (0.14)
PUT USD/HUF SPOT CROSS 28/04/2008 164
2,000,000 USD 36,600 0.08
CALL USD/TRY SPOT CROSS 11/04/2008 1.259
(1,000,000) USD (42,319) (0.09)
PUT BRL/MXN SPOT - CROSS RATES 15/04/2008 6
16,667 BRL 5,136 0.01
PUT USD/PLN SPOT CROSS 01/04/2008 2.3
2,000,000 USD 63,669 0.14
CALL ON CCY USD/CAD 16/05/2008 1.05 10,000 USD 8,928 0.02
CALL ON CCY USD/ZAR 01/05/2008 8 2,000,000 USD 82,238 0.18
PUT ON CCY GBP/USD 15/05/2008 1.95 (1,000,000) GBP (15,568) (0.03)
PUT ON CCY GBP/USD 15/05/2008 1.98 1,000,000 GBP 25,450 0.05
CALL ON CCY USD/ZAR 01/05/2008 8.5 (2,000,000) USD (33,190) (0.07) ______________________
247,242 0.55
Description Quantity Currency Evaluation % netassets
______________________ TOTAL OPTION 247,242 0.55 ______________________
CERTIFICATE OF DEPOSIT
ARABISCHE EMIRATE
ADCB 4.855%07-17.11.08 CD 1,500,000 AED 416,201 0.92 ______________________
416,201 0.92 ______________________
TOTAL CERTIFICATE OF DEPOSIT 416,201 1 0.9211 ______________________
TREASURY BILLS
PERU
PERU 0% 07-5.01.09 1,600,000 PEN 557,733_ 1.23 ______________________
_____________________557,733_ 1.23
_
UNITED STATES
USA 0% 07-17.4.8 TB 3,000,000 USD 2,997,804 6.58 ______________________
2,997,804 6.58 ______________________ TOTAL TREASURY BILLS 3,555,537 7.82 ______________________ TOTAL FINANCIAL INSTRUMENTS 4,218,980 9.28 ______________________ TOTAL INVESTMENTS 27,195,171 59.82 ______________________
OTHER NET ASSETS LESS LIABILITIES 18,269,356 40.18 ______________________ TOTAL NET ASSETS 45,464,527 100.00 ______________________
HSBC Global Investment Funds 204
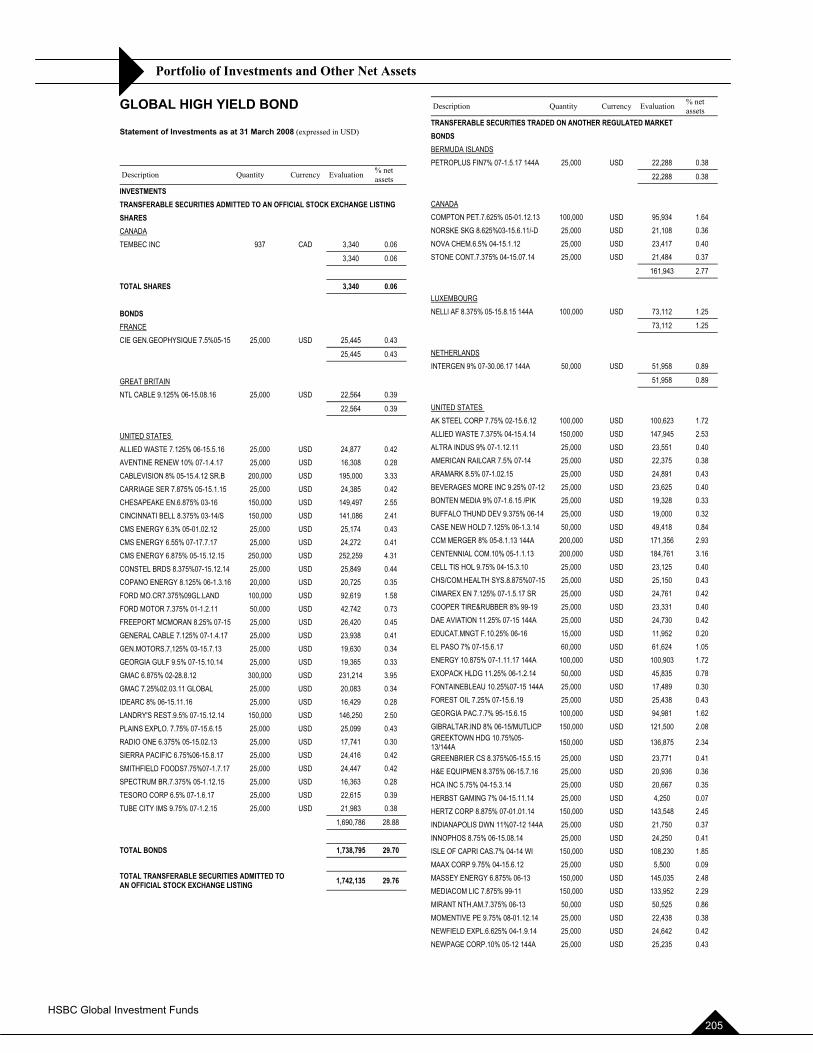
Portfolio of Investments and Other Net Assets
GLOBAL HIGH YIELD BOND
Statement of Investments as at 31 March 2008 (expressed in USD)
Description Quantity Currency Evaluation % net assets
INVESTMENTSTRANSFERABLE SECURITIES ADMITTED TO AN OFFICIAL STOCK EXCHANGE LISTING SHARESCANADA
TEMBEC INC 937 CAD 3,340 0.06
3,340 0.06
TOTAL SHARES 3,340 0.06
BONDSFRANCE
CIE GEN.GEOPHYSIQUE 7.5%05-15 25,000 USD 25,445 0.43
25,445 0.43
GREAT BRITAIN
NTL CABLE 9.125% 06-15.08.16 25,000 USD 22,564 0.39
22,564 0.39
UNITED STATES
ALLIED WASTE 7.125% 06-15.5.16 25,000 USD 24,877 0.42AVENTINE RENEW 10% 07-1.4.17 25,000 USD 16,308 0.28CABLEVISION 8% 05-15.4.12 SR.B 200,000 USD 195,000 3.33CARRIAGE SER 7.875% 05-15.1.15 25,000 USD 24,385 0.42CHESAPEAKE EN.6.875% 03-16 150,000 USD 149,497 2.55CINCINNATI BELL 8.375% 03-14/S 150,000 USD 141,086 2.41CMS ENERGY 6.3% 05-01.02.12 25,000 USD 25,174 0.43CMS ENERGY 6.55% 07-17.7.17 25,000 USD 24,272 0.41CMS ENERGY 6.875% 05-15.12.15 250,000 USD 252,259 4.31CONSTEL BRDS 8.375%07-15.12.14 25,000 USD 25,849 0.44COPANO ENERGY 8.125% 06-1.3.16 20,000 USD 20,725 0.35FORD MO.CR7.375%09GL.LAND 100,000 USD 92,619 1.58FORD MOTOR 7.375% 01-1.2.11 50,000 USD 42,742 0.73FREEPORT MCMORAN 8.25% 07-15 25,000 USD 26,420 0.45GENERAL CABLE 7.125% 07-1.4.17 25,000 USD 23,938 0.41GEN.MOTORS.7,125% 03-15.7.13 25,000 USD 19,630 0.34GEORGIA GULF 9.5% 07-15.10.14 25,000 USD 19,365 0.33GMAC 6.875% 02-28.8.12 300,000 USD 231,214 3.95GMAC 7.25%02.03.11 GLOBAL 25,000 USD 20,083 0.34IDEARC 8% 06-15.11.16 25,000 USD 16,429 0.28LANDRY'S REST.9.5% 07-15.12.14 150,000 USD 146,250 2.50PLAINS EXPLO. 7.75% 07-15.6.15 25,000 USD 25,099 0.43RADIO ONE 6.375% 05-15.02.13 25,000 USD 17,741 0.30SIERRA PACIFIC 6.75%06-15.8.17 25,000 USD 24,416 0.42SMITHFIELD FOODS7.75%07-1.7.17 25,000 USD 24,447 0.42SPECTRUM BR.7.375% 05-1.12.15 25,000 USD 16,363 0.28TESORO CORP 6.5% 07-1.6.17 25,000 USD 22,615 0.39TUBE CITY IMS 9.75% 07-1.2.15 25,000 USD 21,983 0.38
1,690,786 28.88
TOTAL BONDS 1,738,795 29.70
TOTAL TRANSFERABLE SECURITIES ADMITTED TO AN OFFICIAL STOCK EXCHANGE LISTING 1,742,135 29.76
Description Quantity Currency Evaluation % net assets
TRANSFERABLE SECURITIES TRADED ON ANOTHER REGULATED MARKET BONDSBERMUDA ISLANDS
PETROPLUS FIN7% 07-1.5.17 144A 25,000 USD 22,288 0.38
22,288 0.38
CANADA
COMPTON PET.7.625% 05-01.12.13 100,000 USD 95,934 1.64NORSKE SKG 8.625%03-15.6.11/-D 25,000 USD 21,108 0.36NOVA CHEM.6.5% 04-15.1.12 25,000 USD 23,417 0.40STONE CONT.7.375% 04-15.07.14 25,000 USD 21,484 0.37
161,943 2.77
LUXEMBOURG
NELLl AF 8.375% 05-15.8.15 144A 100,000 USD 73,112 1.2573,112 1.25
NETHERLANDS
INTERGEN 9% 07-30.06.17 144A 50,000 USD 51,958 0.89
51,958 0.89
UNITED STATES
AK STEEL CORP 7.75% 02-15.6.12 100,000 USD 100,623 1.72ALLIED WASTE 7.375% 04-15.4.14 150,000 USD 147,945 2.53ALTRA INDUS 9% 07-1.12.11 25,000 USD 23,551 0.40 AMERICAN RAILCAR 7.5% 07-14 25,000 USD 22,375 0.38ARAMARK 8.5% 07-1.02.15 25,000 USD 24,891 0.43BEVERAGES MORE INC 9.25% 07-12 25,000 USD 23,625 0.40BONTEN MEDIA 9% 07-1.6.15 /PIK 25,000 USD 19,328 0.33BUFFALO THUND DEV 9.375% 06-14 25,000 USD 19,000 0.32 CASE NEW HOLD 7.125% 06-1.3.14 50,000 USD 49,418 0.84CCM MERGER 8% 05-8.1.13 144A 200,000 USD 171,356 2.93CENTENNIAL COM.10% 05-1.1.13 200,000 USD 184,761 3.16CELL TIS HOL 9.75% 04-15.3.10 25,000 USD 23,125 0.40CHS/COM.HEALTH SYS.8.875%07-15 25,000 USD 25,150 0.43CIMAREX EN 7.125% 07-1.5.17 SR 25,000 USD 24,761 0.42COOPER TIRE&RUBBER 8% 99-19 25,000 USD 23,331 0.40DAE AVIATION 11.25% 07-15 144A 25,000 USD 24,730 0.42EDUCAT.MNGT F.10.25% 06-16 15,000 USD 11,952 0.20 EL PASO 7% 07-15.6.17 60,000 USD 61,624 1.05ENERGY 10.875% 07-1.11.17 144A 100,000 USD 100,903 1.72EXOPACK HLDG 11.25% 06-1.2.14 50,000 USD 45,835 0.78FONTAINEBLEAU 10.25%07-15 144A 25,000 USD 17,489 0.30FOREST OIL 7.25% 07-15.6.19 25,000 USD 25,438 0.43GEORGIA PAC.7.7% 95-15.6.15 100,000 USD 94,981 1.62GIBRALTAR.IND 8% 06-15/MUTLICP 150,000 USD 121,500 2.08GREEKTOWN HDG 10.75%05-13/144A 150,000 USD 136,875 2.34
GREENBRIER CS 8.375%05-15.5.15 25,000 USD 23,771 0.41H&E EQUIPMEN 8.375% 06-15.7.16 25,000 USD 20,936 0.36HCA INC 5.75% 04-15.3.14 25,000 USD 20,667 0.35HERBST GAMING 7% 04-15.11.14 25,000 USD 4,250 0.07HERTZ CORP 8.875% 07-01.01.14 150,000 USD 143,548 2.45INDIANAPOLIS DWN 11%07-12 144A 25,000 USD 21,750 0.37INNOPHOS 8.75% 06-15.08.14 25,000 USD 24,250 0.41ISLE OF CAPRI CAS.7% 04-14 WI 150,000 USD 108,230 1.85MAAX CORP 9.75% 04-15.6.12 25,000 USD 5,500 0.09MASSEY ENERGY 6.875% 06-13 150,000 USD 145,035 2.48MEDIACOM LIC 7.875% 99-11 150,000 USD 133,952 2.29MIRANT NTH.AM.7.375% 06-13 50,000 USD 50,525 0.86MOMENTIVE PE 9.75% 08-01.12.14 25,000 USD 22,438 0.38NEWFIELD EXPL.6.625% 04-1.9.14 25,000 USD 24,642 0.42NEWPAGE CORP.10% 05-12 144A 25,000 USD 25,235 0.43
HSBC Global Investment Funds 205
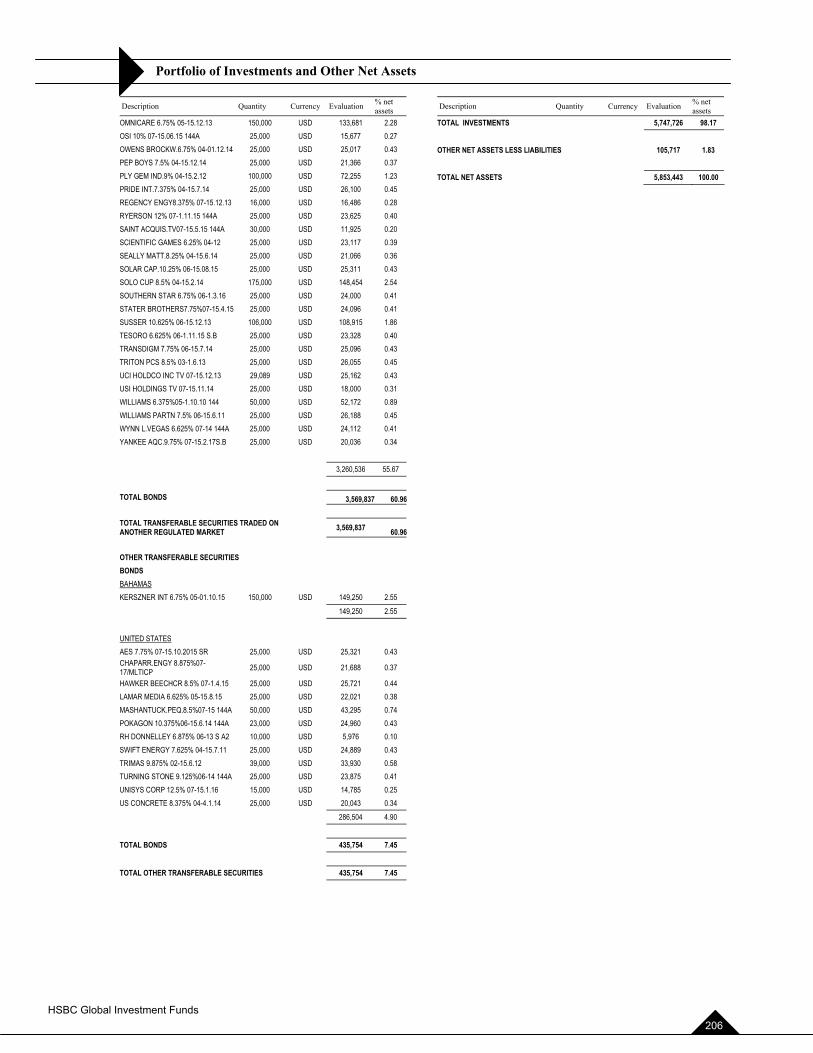
Portfolio of Investments and Other Net Assets
Description Quantity Currency Evaluation % net assets
OMNICARE 6.75% 05-15.12.13 150,000 USD 133,681 2.28OSI 10% 07-15.06.15 144A 25,000 USD 15,677 0.27OWENS BROCKW.6.75% 04-01.12.14 25,000 USD 25,017 0.43PEP BOYS 7.5% 04-15.12.14 25,000 USD 21,366 0.37PLY GEM IND.9% 04-15.2.12 100,000 USD 72,255 1.23PRIDE INT.7.375% 04-15.7.14 25,000 USD 26,100 0.45REGENCY ENGY8.375% 07-15.12.13 16,000 USD 16,486 0.28RYERSON 12% 07-1.11.15 144A 25,000 USD 23,625 0.40SAINT ACQUIS.TV07-15.5.15 144A 30,000 USD 11,925 0.20SCIENTIFIC GAMES 6.25% 04-12 25,000 USD 23,117 0.39SEALLY MATT.8.25% 04-15.6.14 25,000 USD 21,066 0.36SOLAR CAP.10.25% 06-15.08.15 25,000 USD 25,311 0.43SOLO CUP 8.5% 04-15.2.14 175,000 USD 148,454 2.54SOUTHERN STAR 6.75% 06-1.3.16 25,000 USD 24,000 0.41STATER BROTHERS7.75%07-15.4.15 25,000 USD 24,096 0.41SUSSER 10.625% 06-15.12.13 106,000 USD 108,915 1.86TESORO 6.625% 06-1.11.15 S.B 25,000 USD 23,328 0.40TRANSDIGM 7.75% 06-15.7.14 25,000 USD 25,096 0.43TRITON PCS 8.5% 03-1.6.13 25,000 USD 26,055 0.45UCI HOLDCO INC TV 07-15.12.13 29,089 USD 25,162 0.43USI HOLDINGS TV 07-15.11.14 25,000 USD 18,000 0.31WILLIAMS 6.375%05-1.10.10 144 50,000 USD 52,172 0.89WILLIAMS PARTN 7.5% 06-15.6.11 25,000 USD 26,188 0.45WYNN L.VEGAS 6.625% 07-14 144A 25,000 USD 24,112 0.41YANKEE AQC.9.75% 07-15.2.17S.B 25,000 USD 20,036 0.34
3,260,536 55.67
TOTAL BONDS 3,569,837 60.96
TOTAL TRANSFERABLE SECURITIES TRADED ON ANOTHER REGULATED MARKET 3,569,837 60.96
OTHER TRANSFERABLE SECURITIES BONDSBAHAMAS
KERSZNER INT 6.75% 05-01.10.15 150,000 USD 149,250 2.55
149,250 2.55
UNITED STATES
AES 7.75% 07-15.10.2015 SR 25,000 USD 25,321 0.43CHAPARR.ENGY 8.875%07-17/MLTICP 25,000 USD 21,688 0.37
HAWKER BEECHCR 8.5% 07-1.4.15 25,000 USD 25,721 0.44 LAMAR MEDIA 6.625% 05-15.8.15 25,000 USD 22,021 0.38MASHANTUCK.PEQ.8.5%07-15 144A 50,000 USD 43,295 0.74POKAGON 10.375%06-15.6.14 144A 23,000 USD 24,960 0.43RH DONNELLEY 6.875% 06-13 S A2 10,000 USD 5,976 0.10SWIFT ENERGY 7.625% 04-15.7.11 25,000 USD 24,889 0.43TRIMAS 9.875% 02-15.6.12 39,000 USD 33,930 0.58TURNING STONE 9.125%06-14 144A 25,000 USD 23,875 0.41UNISYS CORP 12.5% 07-15.1.16 15,000 USD 14,785 0.25US CONCRETE 8.375% 04-4.1.14 25,000 USD 20,043 0.34
286,504 4.90
TOTAL BONDS 435,754 7.45
TOTAL OTHER TRANSFERABLE SECURITIES 435,754 7.45
Description Quantity Currency Evaluation % net assets
TOTAL INVESTMENTS 5,747,726 98.17
OTHER NET ASSETS LESS LIABILITIES 105,717 1.83
TOTAL NET ASSETS 5,853,443 100.00
HSBC Global Investment Funds 206
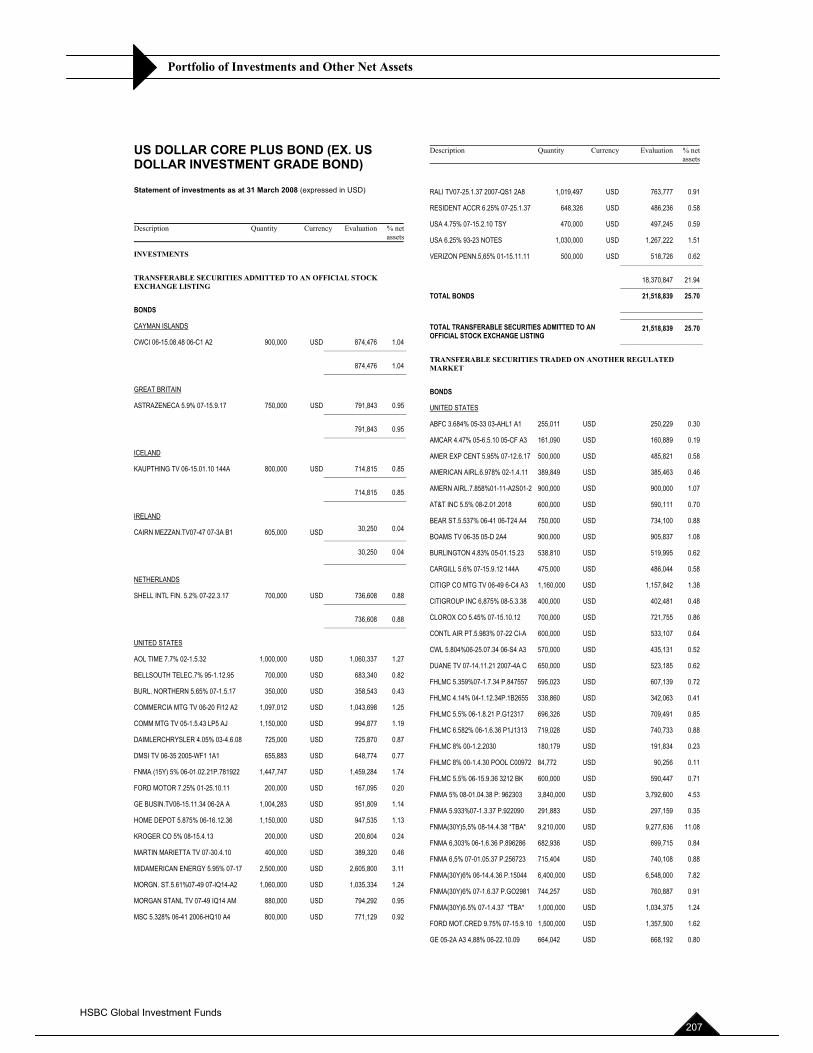
Portfolio of Investments and Other Net Assets
US DOLLAR CORE PLUS BOND (EX. US DOLLAR INVESTMENT GRADE BOND)
Statement of investments as at 31 March 2008 (expressed in USD)
Description Quantity Currency Evaluation % netassets
INVESTMENTS
TRANSFERABLE SECURITIES ADMITTED TO AN OFFICIAL STOCK EXCHANGE LISTING
BONDS
CAYMAN ISLANDS
CWCI 06-15.08.48 06-C1 A2 900,000 USD 874,476 1.04 ______________________
874,476 1.04 ______________________
GREAT BRITAIN
ASTRAZENECA 5.9% 07-15.9.17 750,000 USD 791,843 0.95 ______________________
791,843 0.95 ______________________
ICELAND
KAUPTHING TV 06-15.01.10 144A 800,000 USD 714,815 0.85 ______________________
714,815 0.85 ______________________
IRELAND
CAIRN MEZZAN.TV07-47 07-3A B1 605,000 USD ______________________ 30,250 0.04
30,250 0.04 ______________________
NETHERLANDS
SHELL INTL FIN. 5.2% 07-22.3.17 700,000 USD 736,608 0.88 ______________________
736,608 0.88 ______________________
UNITED STATES
AOL TIME 7.7% 02-1.5.32 1,000,000 USD 1,060,337 1.27
BELLSOUTH TELEC.7% 95-1.12.95 700,000 USD 683,340 0.82
BURL. NORTHERN 5.65% 07-1.5.17 350,000 USD 358,543 0.43
COMMERCIA MTG TV 06-20 Fl12 A2 1,097,012 USD 1,043,698 1.25
COMM MTG TV 05-1.5.43 LP5 AJ 1,150,000 USD 994,877 1.19
DAIMLERCHRYSLER 4.05% 03-4.6.08 725,000 USD 725,870 0.87
DMSI TV 06-35 2005-WF1 1A1 655,883 USD 648,774 0.77
FNMA (15Y) 5% 06-01.02.21P.781922 1,447,747 USD 1,459,284 1.74
FORD MOTOR 7.25% 01-25.10.11 200,000 USD 167,095 0.20
GE BUSIN.TV06-15.11.34 06-2A A 1,004,283 USD 951,809 1.14
HOME DEPOT 5.875% 06-16.12.36 1,150,000 USD 947,535 1.13
KROGER CO 5% 08-15.4.13 200,000 USD 200,604 0.24
MARTIN MARIETTA TV 07-30.4.10 400,000 USD 389,320 0.46
MIDAMERICAN ENERGY 5.95% 07-17 2,500,000 USD 2,605,800 3.11
MORGN. ST.5.61%07-49 07-IQ14-A2 1,060,000 USD 1,035,334 1.24
MORGAN STANL TV 07-49 IQ14 AM 880,000 USD 794,292 0.95
MSC 5.328% 06-41 2006-HQ10 A4 800,000 USD 771,129 0.92
Description Quantity Currency Evaluation % netassets
RALI TV07-25.1.37 2007-QS1 2A8 1,019,497 USD 763,777 0.91
RESIDENT ACCR 6.25% 07-25.1.37 648,326 USD 486,236 0.58
USA 4.75% 07-15.2.10 TSY 470,000 USD 497,245 0.59
USA 6.25% 93-23 NOTES 1,030,000 USD 1,267,222 1.51
VERIZON PENN.5,65% 01-15.11.11 500,000 USD 518,726 0.62 ______________________
18,370,847 21.94 ______________________ TOTAL BONDS 21,518,839 25.70 ______________________ ______________________ TOTAL TRANSFERABLE SECURITIES ADMITTED TO AN OFFICIAL STOCK EXCHANGE LISTING ______________________
21,518,839 25.70
TRANSFERABLE SECURITIES TRADED ON ANOTHER REGULATED MARKET
BONDS
UNITED STATES
ABFC 3.684% 05-33 03-AHL1 A1 255,011 USD 250,229 0.30
AMCAR 4.47% 05-6.5.10 05-CF A3 161,090 USD 160,889 0.19
AMER EXP CENT 5.95% 07-12.6.17 500,000 USD 485,821 0.58
AMERICAN AIRL.6.978% 02-1.4.11 389,849 USD 385,463 0.46
AMERN AIRL.7.858%01-11-A2S01-2 900,000 USD 900,000 1.07
AT&T INC 5.5% 08-2.01.2018 600,000 USD 590,111 0.70
BEAR ST.5.537% 06-41 06-T24 A4 750,000 USD 734,100 0.88
BOAMS TV 06-35 05-D 2A4 900,000 USD 905,837 1.08
BURLINGTON 4.83% 05-01.15.23 538,810 USD 519,995 0.62
CARGILL 5.6% 07-15.9.12 144A 475,000 USD 486,044 0.58
CITIGP CO MTG TV 06-49 6-C4 A3 1,160,000 USD 1,157,842 1.38
CITIGROUP INC 6,875% 08-5.3.38 400,000 USD 402,481 0.48
CLOROX CO 5.45% 07-15.10.12 700,000 USD 721,755 0.86
CONTL AIR PT.5.983% 07-22 CI-A 600,000 USD 533,107 0.64
CWL 5.804%06-25.07.34 06-S4 A3 570,000 USD 435,131 0.52
DUANE TV 07-14.11.21 2007-4A C 650,000 USD 523,185 0.62
FHLMC 5.359%07-1.7.34 P.847557 595,023 USD 607,139 0.72
FHLMC 4.14% 04-1.12.34P.1B2655 338,860 USD 342,063 0.41
FHLMC 5.5% 06-1.8.21 P.G12317 696,326 USD 709,491 0.85
FHLMC 6.582% 06-1.6.36 P1J1313 719,028 USD 740,733 0.88
FHLMC 8% 00-1.2.2030 180,179 USD 191,834 0.23
FHLMC 8% 00-1.4.30 POOL C00972 84,772 USD 90,256 0.11
FHLMC 5.5% 06-15.9.36 3212 BK 600,000 USD 590,447 0.71
FNMA 5% 08-01.04.38 P: 962303 3,840,000 USD 3,792,600 4.53
FNMA 5.933%07-1.3.37 P.922090 291,883 USD 297,159 0.35
FNMA(30Y)5,5% 08-14.4.38 *TBA* 9,210,000 USD 9,277,636 11.08
FNMA 6,303% 06-1.6.36 P.896286 682,936 USD 699,715 0.84
FNMA 6,5% 07-01.05.37 P.256723 715,404 USD 740,108 0.88
FNMA(30Y)6% 06-14.4.36 P.15044 6,400,000 USD 6,548,000 7.82
FNMA(30Y)6% 07-1.6.37 P.GO2981 744,257 USD 760,887 0.91
FNMA(30Y)6.5% 07-1.4.37 *TBA* 1,000,000 USD 1,034,375 1.24
FORD MOT.CRED 9.75% 07-15.9.10 1,500,000 USD 1,357,500 1.62
GE 05-2A A3 4,88% 06-22.10.09 664,042 USD 668,192 0.80
HSBC Global Investment Funds 207
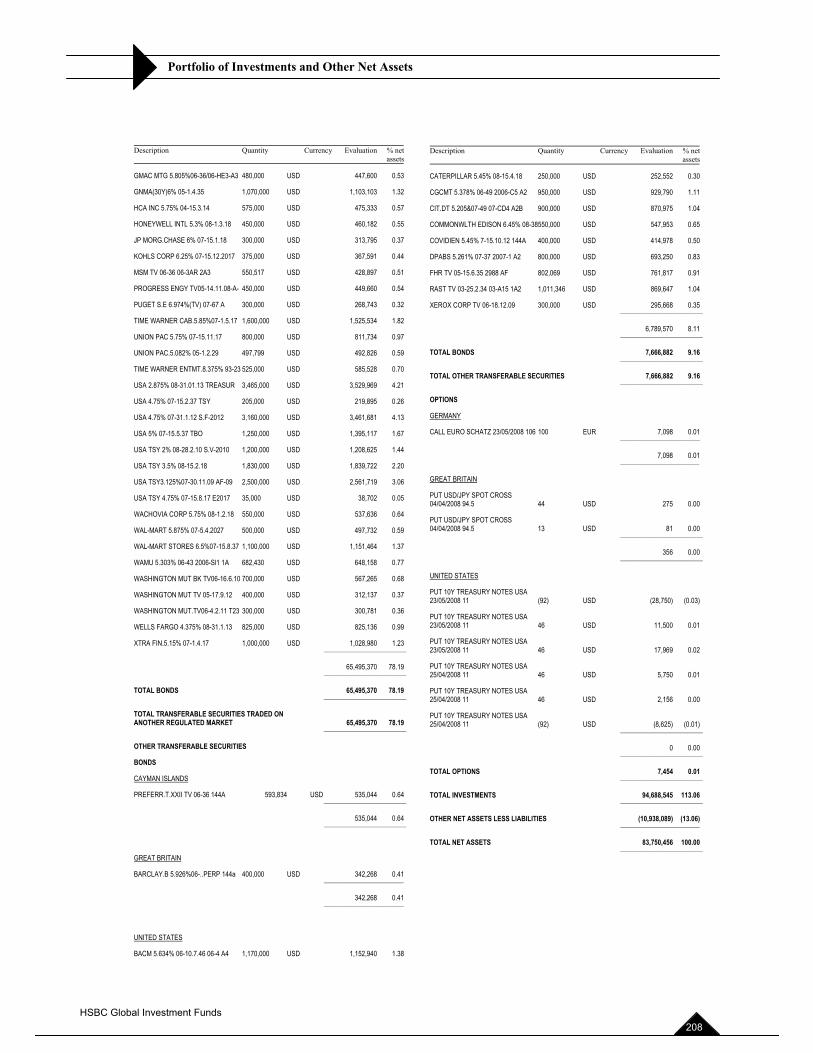
Portfolio of Investments and Other Net Assets
Description Quantity Currency Evaluation % netassets
GMAC MTG 5.805%06-36/06-HE3-A3 480,000 USD 447,600 0.53
GNMA(30Y)6% 05-1.4.35 1,070,000 USD 1,103,103 1.32
HCA INC 5.75% 04-15.3.14 575,000 USD 475,333 0.57
HONEYWELL INTL 5.3% 08-1.3.18 450,000 USD 460,182 0.55
JP MORG.CHASE 6% 07-15.1.18 300,000 USD 313,795 0.37
KOHLS CORP 6.25% 07-15.12.2017 375,000 USD 367,591 0.44
MSM TV 06-36 06-3AR 2A3 550,517 USD 428,897 0.51
PROGRESS ENGY TV05-14.11.08-A- 450,000 USD 449,660 0.54
PUGET S.E 6.974%(TV) 07-67 A 300,000 USD 268,743 0.32
TIME WARNER CAB.5.85%07-1.5.17 1,600,000 USD 1,525,534 1.82
UNION PAC 5.75% 07-15.11.17 800,000 USD 811,734 0.97
UNION PAC.5.082% 05-1.2.29 497,799 USD 492,826 0.59
TIME WARNER ENTMT.8.375% 93-23 525,000 USD 585,528 0.70
USA 2.875% 08-31.01.13 TREASUR 3,465,000 USD 3,529,969 4.21
USA 4.75% 07-15.2.37 TSY 205,000 USD 219,895 0.26
USA 4.75% 07-31.1.12 S.F-2012 3,160,000 USD 3,461,681 4.13
USA 5% 07-15.5.37 TBO 1,250,000 USD 1,395,117 1.67
USA TSY 2% 08-28.2.10 S.V-2010 1,200,000 USD 1,208,625 1.44
USA TSY 3.5% 08-15.2.18 1,830,000 USD 1,839,722 2.20
USA TSY3.125%07-30.11.09 AF-09 2,500,000 USD 2,561,719 3.06
USA TSY 4.75% 07-15.8.17 E2017 35,000 USD 38,702 0.05
WACHOVIA CORP 5.75% 08-1.2.18 550,000 USD 537,636 0.64
WAL-MART 5.875% 07-5.4.2027 500,000 USD 497,732 0.59
WAL-MART STORES 6.5%07-15.8.37 1,100,000 USD 1,151,464 1.37
WAMU 5.303% 06-43 2006-Sl1 1A 682,430 USD 648,158 0.77
WASHINGTON MUT BK TV06-16.6.10 700,000 USD 567,265 0.68
WASHINGTON MUT TV 05-17.9.12 400,000 USD 312,137 0.37
WASHINGTON MUT.TV06-4.2.11 T23 300,000 USD 300,781 0.36
WELLS FARGO 4.375% 08-31.1.13 825,000 USD 825,136 0.99
XTRA FIN.5.15% 07-1.4.17 1,000,000 USD 1,028,980 1.23 ______________________
65,495,370 78.19 ______________________
TOTAL BONDS 65,495,370 78.19 ______________________
TOTAL TRANSFERABLE SECURITIES TRADED ON ANOTHER REGULATED MARKET 65,495,370 78.19 ______________________
OTHER TRANSFERABLE SECURITIES
BONDS
CAYMAN ISLANDS
PREFERR.T.XXII TV 06-36 144A 593,834 USD 535,044 0.64 ______________________
535,044 0.64 ______________________
GREAT BRITAIN
BARCLAY.B 5.926%06-..PERP 144a 400,000 USD 342,268 0.41 ______________________
342,268 0.41 ______________________
UNITED STATES
BACM 5.634% 06-10.7.46 06-4 A4 1,170,000 USD 1,152,940 1.38
Description Quantity Currency Evaluation % netassets
CATERPILLAR 5.45% 08-15.4.18 250,000 USD 252,552 0.30
CGCMT 5.378% 06-49 2006-C5 A2 950,000 USD 929,790 1.11
CIT.DT 5.205&07-49 07-CD4 A2B 900,000 USD 870,975 1.04
COMMONWLTH EDISON 6.45% 08-38550,000 USD 547,953 0.65
COVIDIEN 5.45% 7-15.10.12 144A 400,000 USD 414,978 0.50
DPABS 5.261% 07-37 2007-1 A2 800,000 USD 693,250 0.83
FHR TV 05-15.6.35 2988 AF 802,069 USD 761,817 0.91
RAST TV 03-25.2.34 03-A15 1A2 1,011,346 USD 869,647 1.04
XEROX CORP TV 06-18.12.09 300,000 USD 295,668 0.35 ______________________
6,789,570 8.11 ______________________
TOTAL BONDS 7,666,882 9.16 ______________________
TOTAL OTHER TRANSFERABLE SECURITIES 7,666,882 9.16 ______________________
OPTIONS
GERMANY
CALL EURO SCHATZ 23/05/2008 106 100 EUR 7,098 0.01 ______________________
7,098 0.01 ______________________
GREAT BRITAIN
PUT USD/JPY SPOT CROSS 04/04/2008 94.5 44 USD 275 0.00
PUT USD/JPY SPOT CROSS 04/04/2008 94.5 13 USD 81 0.00 ______________________
356 0.00 ______________________
UNITED STATES
PUT 10Y TREASURY NOTES USA 23/05/2008 11 (92) USD (28,750) (0.03)
PUT 10Y TREASURY NOTES USA 23/05/2008 11 46 USD 11,500 0.01
PUT 10Y TREASURY NOTES USA 23/05/2008 11 46 USD 17,969 0.02
PUT 10Y TREASURY NOTES USA 25/04/2008 11 46 USD 5,750 0.01
PUT 10Y TREASURY NOTES USA 25/04/2008 11 46 USD 2,156 0.00
PUT 10Y TREASURY NOTES USA 25/04/2008 11 (92) USD (8,625) (0.01) ______________________
0 0.00 ______________________
TOTAL OPTIONS 7,454 0.01 ______________________
TOTAL INVESTMENTS 94,688,545 113.06 ______________________
OTHER NET ASSETS LESS LIABILITIES (10,938,089) (13.06) ______________________
TOTAL NET ASSETS 83,750,456 100.00 ______________________
HSBC Global Investment Funds 208
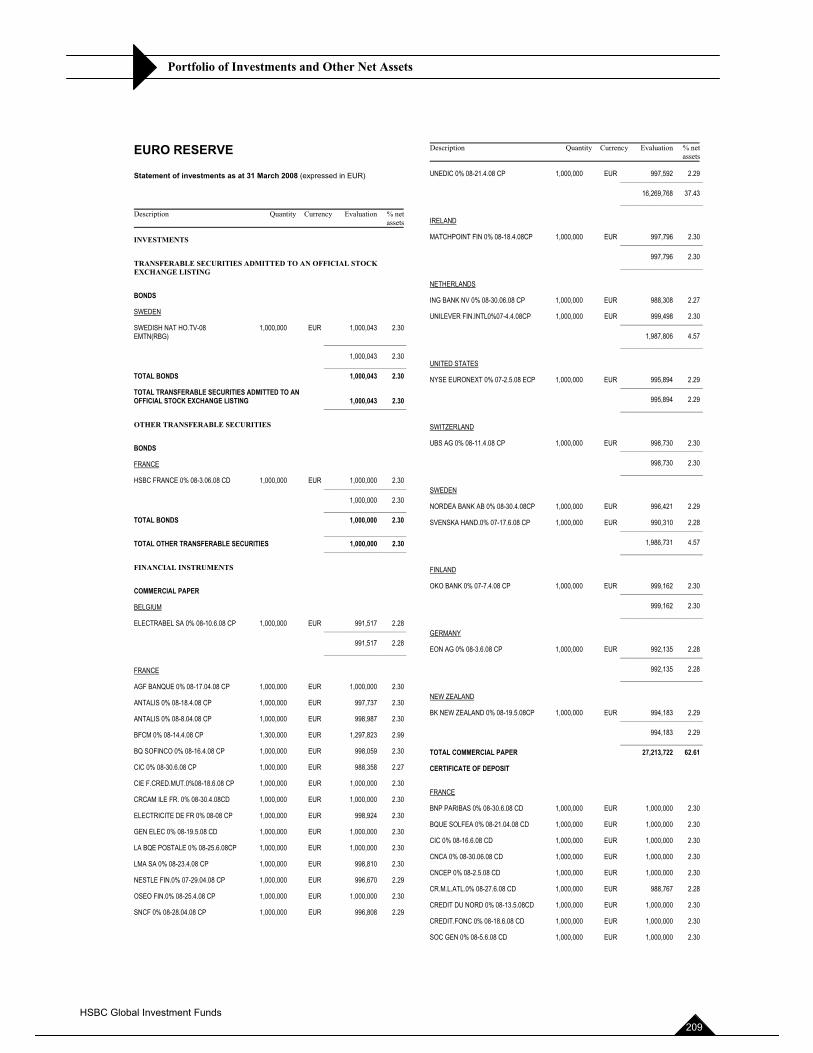
Portfolio of Investments and Other Net Assets
EURO RESERVE
Statement of investments as at 31 March 2008 (expressed in EUR)
Description Quantity Currency Evaluation % netassets
INVESTMENTS
TRANSFERABLE SECURITIES ADMITTED TO AN OFFICIAL STOCK EXCHANGE LISTING
BONDS
SWEDEN
SWEDISH NAT HO.TV-08 EMTN(RBG) ______________________
1,000,000 EUR 1,000,043 2.30
1,000,043 2.30 ______________________ TOTAL BONDS 1,000,043 2.30
TOTAL TRANSFERABLE SECURITIES ADMITTED TO AN OFFICIAL STOCK EXCHANGE LISTING 1,000,043 2.30 ______________________
OTHER TRANSFERABLE SECURITIES
BONDS
FRANCE
HSBC FRANCE 0% 08-3.06.08 CD 1,000,000 EUR 1,000,000 2.30 ______________________
1,000,000 2.30 ______________________ TOTAL BONDS 1,000,000 2.30 ______________________ TOTAL OTHER TRANSFERABLE SECURITIES 1,000,000 2.30 ______________________
FINANCIAL INSTRUMENTS
COMMERCIAL PAPER
BELGIUM
ELECTRABEL SA 0% 08-10.6.08 CP 1,000,000 EUR 991,517 2.28 ______________________
991,517 2.28 ______________________
FRANCE
AGF BANQUE 0% 08-17.04.08 CP 1,000,000 EUR 1,000,000 2.30
ANTALIS 0% 08-18.4.08 CP 1,000,000 EUR 997,737 2.30
ANTALIS 0% 08-8.04.08 CP 1,000,000 EUR 998,987 2.30
BFCM 0% 08-14.4.08 CP 1,300,000 EUR 1,297,823 2.99
BQ SOFINCO 0% 08-16.4.08 CP 1,000,000 EUR 998,059 2.30
CIC 0% 08-30.6.08 CP 1,000,000 EUR 988,358 2.27
CIE F.CRED.MUT.0%08-18.6.08 CP 1,000,000 EUR 1,000,000 2.30
CRCAM ILE FR. 0% 08-30.4.08CD 1,000,000 EUR 1,000,000 2.30
ELECTRICITE DE FR 0% 08-08 CP 1,000,000 EUR 998,924 2.30
GEN ELEC 0% 08-19.5.08 CD 1,000,000 EUR 1,000,000 2.30
LA BQE POSTALE 0% 08-25.6.08CP 1,000,000 EUR 1,000,000 2.30
LMA SA 0% 08-23.4.08 CP 1,000,000 EUR 998,810 2.30
NESTLE FIN.0% 07-29.04.08 CP 1,000,000 EUR 996,670 2.29
OSEO FIN.0% 08-25.4.08 CP 1,000,000 EUR 1,000,000 2.30
SNCF 0% 08-28.04.08 CP 1,000,000 EUR 996,808 2.29
Description Quantity Currency Evaluation % netassets
UNEDIC 0% 08-21.4.08 CP 1,000,000 EUR 997,592 2.29 ______________________
16,269,768 37.43 ______________________
IRELAND
MATCHPOINT FIN 0% 08-18.4.08CP 1,000,000 EUR 997,796 2.30 ______________________
997,796 2.30 ______________________
NETHERLANDS
ING BANK NV 0% 08-30.06.08 CP 1,000,000 EUR 988,308 2.27
UNILEVER FIN.INTL0%07-4.4.08CP 1,000,000 EUR 999,498 2.30 ______________________
1,987,806 4.57 ______________________
UNITED STATES
NYSE EURONEXT 0% 07-2.5.08 ECP 1,000,000 EUR 995,894 2.29 ______________________
995,894 2.29 ______________________
SWITZERLAND
UBS AG 0% 08-11.4.08 CP 1,000,000 EUR 998,730 2.30 ______________________
998,730 2.30 ______________________
SWEDEN
NORDEA BANK AB 0% 08-30.4.08CP 1,000,000 EUR 996,421 2.29
SVENSKA HAND.0% 07-17.6.08 CP 1,000,000 EUR 990,310 2.28 ______________________
1,986,731 4.57 ______________________
FINLAND
OKO BANK 0% 07-7.4.08 CP 1,000,000 EUR 999,162 2.30 ______________________
999,162 2.30 ______________________
GERMANY
EON AG 0% 08-3.6.08 CP 1,000,000 EUR 992,135 2.28 ______________________
992,135 2.28 ______________________
NEW ZEALAND
BK NEW ZEALAND 0% 08-19.5.08CP 1,000,000 EUR 994,183 2.29 ______________________
994,183 2.29 ______________________ TOTAL COMMERCIAL PAPER 27,213,722 62.61
CERTIFICATE OF DEPOSIT
FRANCE
BNP PARIBAS 0% 08-30.6.08 CD 1,000,000 EUR 1,000,000 2.30
BQUE SOLFEA 0% 08-21.04.08 CD 1,000,000 EUR 1,000,000 2.30
CIC 0% 08-16.6.08 CD 1,000,000 EUR 1,000,000 2.30
CNCA 0% 08-30.06.08 CD 1,000,000 EUR 1,000,000 2.30
CNCEP 0% 08-2.5.08 CD 1,000,000 EUR 1,000,000 2.30
CR.M.L.ATL.0% 08-27.6.08 CD 1,000,000 EUR 988,767 2.28
CREDIT DU NORD 0% 08-13.5.08CD 1,000,000 EUR 1,000,000 2.30
CREDIT.FONC 0% 08-18.6.08 CD 1,000,000 EUR 1,000,000 2.30
SOC GEN 0% 08-5.6.08 CD 1,000,000 EUR 1,000,000 2.30
HSBC Global Investment Funds 209
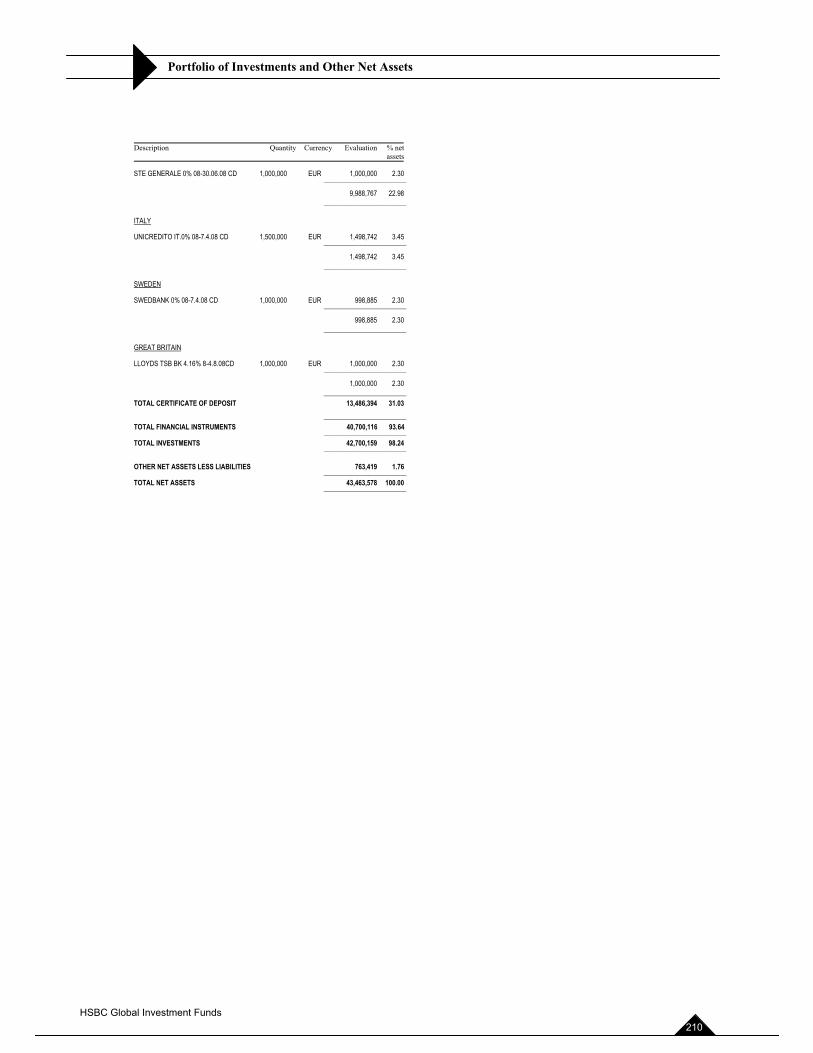
Portfolio of Investments and Other Net Assets
Description Quantity Currency Evaluation % netassets
STE GENERALE 0% 08-30.06.08 CD 1,000,000 EUR 1,000,000 2.30 ______________________
9,988,767 22.98 ______________________
ITALY
UNICREDITO IT.0% 08-7.4.08 CD 1,500,000 EUR 1,498,742 3.45 ______________________
1,498,742 3.45 ______________________
SWEDEN
SWEDBANK 0% 08-7.4.08 CD 1,000,000 EUR 998,885 2.30 ______________________
998,885 2.30 ______________________
GREAT BRITAIN
LLOYDS TSB BK 4.16% 8-4.8.08CD 1,000,000 EUR 1,000,000 2.30 ______________________
1,000,000 2.30 ______________________ TOTAL CERTIFICATE OF DEPOSIT 13,486,394 31.03 ______________________ TOTAL FINANCIAL INSTRUMENTS 40,700,116 93.64 ______________________ TOTAL INVESTMENTS 42,700,159 98.24 ______________________
OTHER NET ASSETS LESS LIABILITIES 763,419 1.76 ______________________ TOTAL NET ASSETS 43,463,578 100.00 ______________________
HSBC Global Investment Funds 210
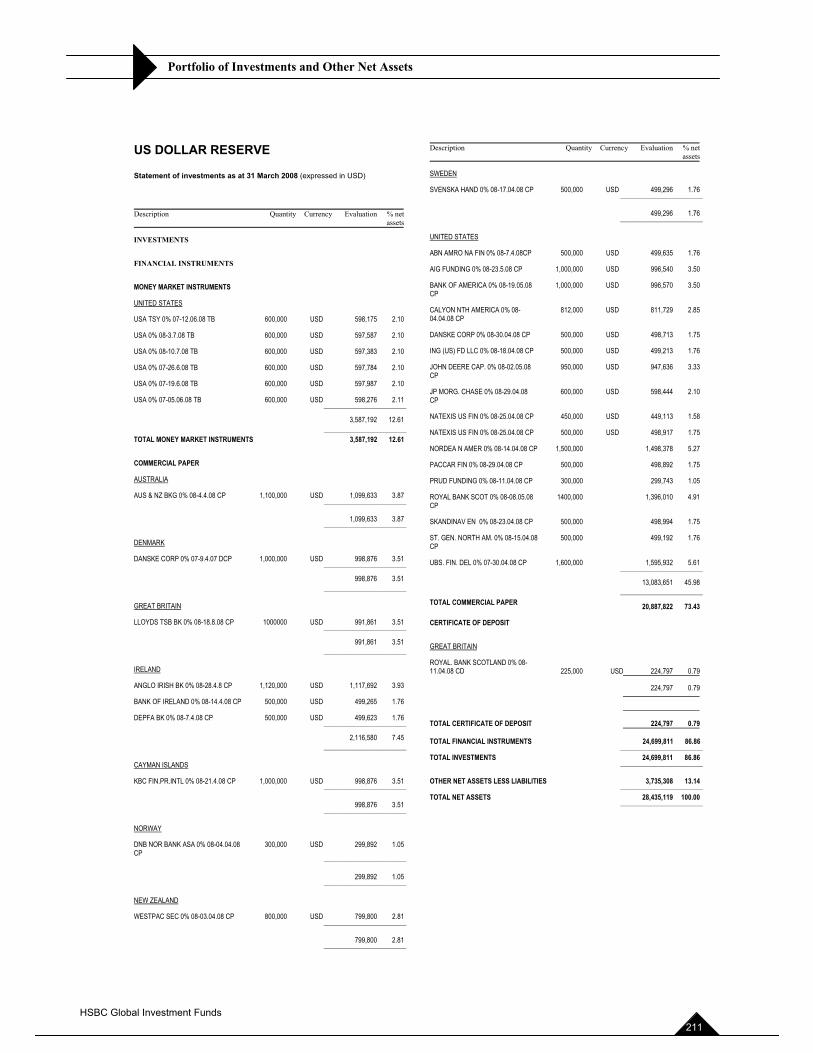
Portfolio of Investments and Other Net Assets
US DOLLAR RESERVE
Statement of investments as at 31 March 2008 (expressed in USD)
Description Quantity Currency Evaluation % netassets
INVESTMENTS
FINANCIAL INSTRUMENTS
MONEY MARKET INSTRUMENTS
UNITED STATES
USA TSY 0% 07-12.06.08 TB 600,000 USD 598,175 2.10
USA 0% 08-3.7.08 TB 600,000 USD 597,587 2.10
USA 0% 08-10.7.08 TB 600,000 USD 597,383 2.10
USA 0% 07-26.6.08 TB 600,000 USD 597,784 2.10
USA 0% 07-19.6.08 TB 600,000 USD 597,987 2.10
USA 0% 07-05.06.08 TB 600,000 USD 598,276 2.11 ______________________
3,587,192 12.61 ______________________ TOTAL MONEY MARKET INSTRUMENTS 3,587,192 12.61
COMMERCIAL PAPER
AUSTRALIA
AUS & NZ BKG 0% 08-4.4.08 CP 1,100,000 USD 1,099,633 3.87 ______________________
1,099,633 3.87 ______________________
DENMARK
DANSKE CORP 0% 07-9.4.07 DCP 1,000,000 USD 998,876 3.51 ______________________
998,876 3.51 ______________________
GREAT BRITAIN
LLOYDS TSB BK 0% 08-18.8.08 CP 1000000 USD 991,861 3.51 ______________________
991,861 3.51 ______________________
IRELAND
ANGLO IRISH BK 0% 08-28.4.8 CP 1,120,000 USD 1,117,692 3.93
BANK OF IRELAND 0% 08-14.4.08 CP 500,000 USD 499,265 1.76
DEPFA BK 0% 08-7.4.08 CP 500,000 USD 499,623 1.76 ______________________
2,116,580 7.45 ______________________
CAYMAN ISLANDS
KBC FIN.PR.INTL 0% 08-21.4.08 CP 1,000,000 USD 998,876 3.51 ______________________
998,876 3.51 ______________________
NORWAY
DNB NOR BANK ASA 0% 08-04.04.08 CP ______________________
300,000 USD 299,892 1.05
299,892 1.05 ______________________
NEW ZEALAND
WESTPAC SEC 0% 08-03.04.08 CP 800,000 USD 799,800 2.81 ______________________
799,800 2.81 ______________________
Description Quantity Currency Evaluation % netassets
SWEDEN
SVENSKA HAND 0% 08-17.04.08 CP 500,000 USD 499,296 1.76 ______________________
499,296 1.76 ______________________
UNITED STATES
ABN AMRO NA FIN 0% 08-7.4.08CP 500,000 USD 499,635 1.76
AIG FUNDING 0% 08-23.5.08 CP 1,000,000 USD 996,540 3.50
BANK OF AMERICA 0% 08-19.05.08 CP
1,000,000 USD 996,570 3.50
CALYON NTH AMERICA 0% 08-04.04.08 CP
812,000 USD 811,729 2.85
DANSKE CORP 0% 08-30.04.08 CP 500,000 USD 498,713 1.75
ING (US) FD LLC 0% 08-18.04.08 CP 500,000 USD 499,213 1.76
JOHN DEERE CAP. 0% 08-02.05.08 CP
950,000 USD 947,636 3.33
JP MORG. CHASE 0% 08-29.04.08 CP
600,000 USD 598,444 2.10
NATEXIS US FIN 0% 08-25.04.08 CP 450,000 USD 449,113 1.58
NATEXIS US FIN 0% 08-25.04.08 CP 500,000 USD 498,917 1.75
NORDEA N AMER 0% 08-14.04.08 CP 1,500,000 1,498,378 5.27
PACCAR FIN 0% 08-29.04.08 CP 500,000 498,892 1.75
PRUD FUNDING 0% 08-11.04.08 CP 300,000 299,743 1.05
ROYAL BANK SCOT 0% 08-08.05.08 CP
1400,000 1,396,010 4.91
SKANDINAV EN 0% 08-23.04.08 CP 500,000 498,994 1.75
ST. GEN. NORTH AM. 0% 08-15.04.08CP
500,000 499,192 1.76
UBS. FIN. DEL 0% 07-30.04.08 CP 1,600,000 1,595,932 5.61 ______________________
13,083,651 45.98 ______________________ TOTAL COMMERCIAL PAPER 20,887,822 73.43
CERTIFICATE OF DEPOSIT
GREAT BRITAIN
ROYAL. BANK SCOTLAND 0% 08-11.04.08 CD 225,000 USD 224,797 0.79
224,797 0.79
TOTAL CERTIFICATE OF DEPOSIT 224,797 0.79
TOTAL FINANCIAL INSTRUMENTS 24,699,811 86.86 ______________________ TOTAL INVESTMENTS 24,699,811 86.86 ______________________
OTHER NET ASSETS LESS LIABILITIES 3,735,308 13.14 ______________________ TOTAL NET ASSETS 28,435,119 100.00 ______________________
HSBC Global Investment Funds 211
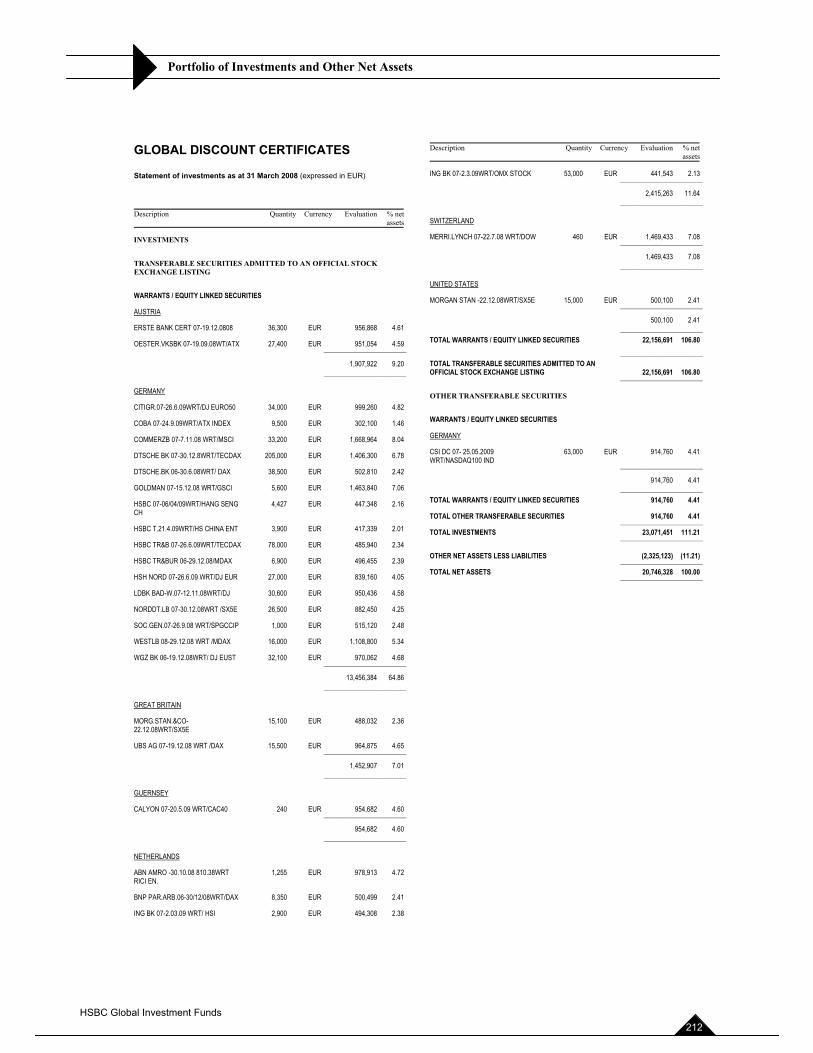
Portfolio of Investments and Other Net Assets
GLOBAL DISCOUNT CERTIFICATES
Statement of investments as at 31 March 2008 (expressed in EUR)
Description Quantity Currency Evaluation % netassets
INVESTMENTS
TRANSFERABLE SECURITIES ADMITTED TO AN OFFICIAL STOCK EXCHANGE LISTING
WARRANTS / EQUITY LINKED SECURITIES
AUSTRIA
ERSTE BANK CERT 07-19.12.0808 36,300 EUR 956,868 4.61
OESTER.VKSBK 07-19.09.08WT/ATX 27,400 EUR 951,054 4.59 ______________________
1,907,922 9.20 ______________________
GERMANY
CITIGR.07-26.6.09WRT/DJ EURO50 34,000 EUR 999,260 4.82
COBA 07-24.9.09WRT/ATX INDEX 9,500 EUR 302,100 1.46
COMMERZB 07-7.11.08 WRT/MSCI 33,200 EUR 1,668,964 8.04
DTSCHE BK 07-30.12.8WRT/TECDAX 205,000 EUR 1,406,300 6.78
DTSCHE.BK 06-30.6.08WRT/ DAX 38,500 EUR 502,810 2.42
GOLDMAN 07-15.12.08 WRT/GSCI 5,600 EUR 1,463,840 7.06
HSBC 07-06/04/09WRT/HANG SENG CH
4,427 EUR 447,348 2.16
HSBC T.21.4.09WRT/HS CHINA ENT 3,900 EUR 417,339 2.01
HSBC TR&B 07-26.6.09WRT/TECDAX 78,000 EUR 485,940 2.34
HSBC TR&BUR 06-29.12.08/MDAX 6,900 EUR 496,455 2.39
HSH NORD 07-26.6.09 WRT/DJ EUR 27,000 EUR 839,160 4.05
LDBK BAD-W.07-12.11.08WRT/DJ 30,600 EUR 950,436 4.58
NORDDT.LB 07-30.12.08WRT /SX5E 26,500 EUR 882,450 4.25
SOC.GEN.07-26.9.08 WRT/SPGCCIP 1,000 EUR 515,120 2.48
WESTLB 08-29.12.08 WRT /MDAX 16,000 EUR 1,108,800 5.34
WGZ BK 06-19.12.08WRT/ DJ EUST 32,100 EUR 970,062 4.68 ______________________
13,456,384 64.86 ______________________
GREAT BRITAIN
MORG.STAN.&CO-22.12.08WRT/SX5E
15,100 EUR 488,032 2.36
UBS AG 07-19.12.08 WRT /DAX 15,500 EUR 964,875 4.65 ______________________
1,452,907 7.01 ______________________
GUERNSEY
CALYON 07-20.5.09 WRT/CAC40 240 EUR 954,682 4.60 ______________________
954,682 4.60 ______________________
NETHERLANDS
ABN AMRO -30.10.08 810.38WRT RICI EN.
1,255 EUR 978,913 4.72
BNP PAR.ARB.06-30/12/08WRT/DAX 8,350 EUR 500,499 2.41
ING BK 07-2.03.09 WRT/ HSI 2,900 EUR 494,308 2.38
Description Quantity Currency Evaluation % netassets
ING BK 07-2.3.09WRT/OMX STOCK 53,000 EUR 441,543 2.13 ______________________
2,415,263 11.64 ______________________
SWITZERLAND
MERRI.LYNCH 07-22.7.08 WRT/DOW 460 EUR 1,469,433 7.08 ______________________
1,469,433 7.08 ______________________
UNITED STATES
MORGAN STAN -22.12.08WRT/SX5E 15,000 EUR 500,100 2.41 ______________________
500,100 2.41 ______________________ TOTAL WARRANTS / EQUITY LINKED SECURITIES 22,156,691 106.80 ______________________ TOTAL TRANSFERABLE SECURITIES ADMITTED TO AN OFFICIAL STOCK EXCHANGE LISTING 22,156,691 106.80 ______________________
OTHER TRANSFERABLE SECURITIES
WARRANTS / EQUITY LINKED SECURITIES
GERMANY
CSI DC 07- 25.05.2009 WRT/NASDAQ100 IND ______________________
63,000 EUR 914,760 4.41
914,760 4.41 ______________________ TOTAL WARRANTS / EQUITY LINKED SECURITIES 914,760 4.41
TOTAL OTHER TRANSFERABLE SECURITIES 914,760 4.41 ______________________ TOTAL INVESTMENTS 23,071,451 111.21 ______________________
OTHER NET ASSETS LESS LIABILITIES (2,325,123) (11.21) ______________________ TOTAL NET ASSETS 20,746,328 100.00 ______________________
HSBC Global Investment Funds 212
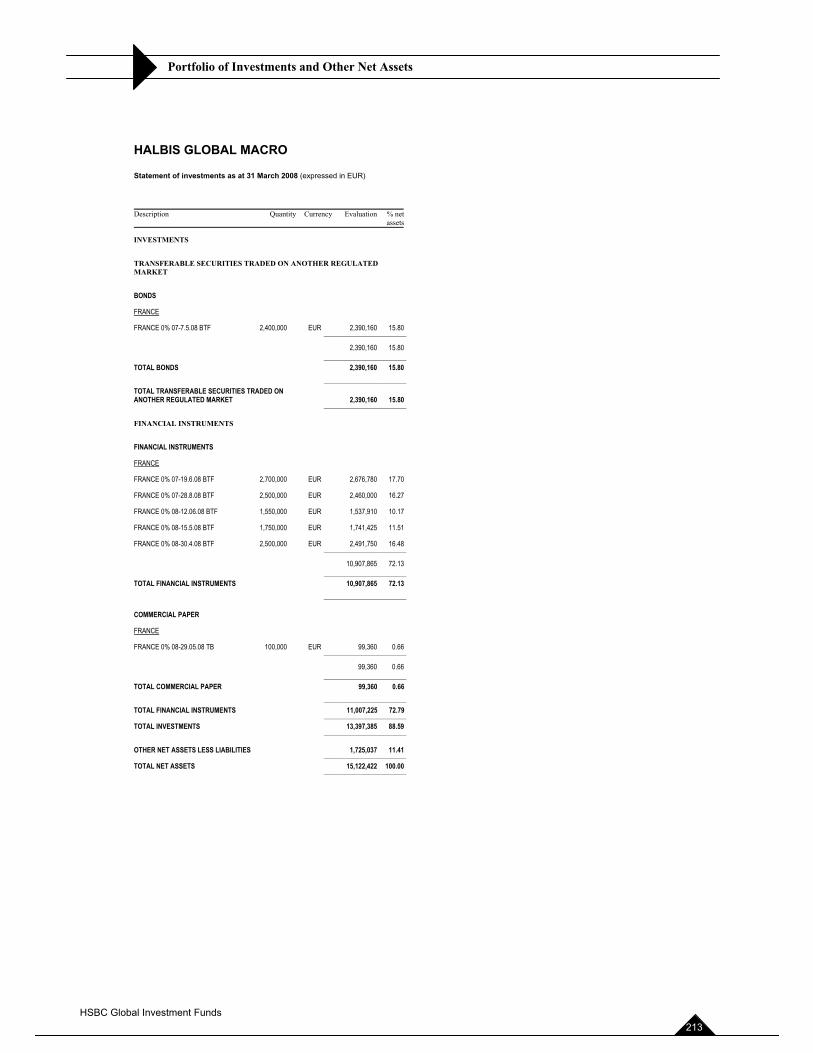
Portfolio of Investments and Other Net Assets
HALBIS GLOBAL MACRO
Statement of investments as at 31 March 2008 (expressed in EUR)
Description Quantity Currency Evaluation % netassets
INVESTMENTS
TRANSFERABLE SECURITIES TRADED ON ANOTHER REGULATED MARKET
BONDS
FRANCE
FRANCE 0% 07-7.5.08 BTF 2,400,000 EUR 2,390,160 15.80 ______________________
2,390,160 15.80 ______________________ TOTAL BONDS 2,390,160 15.80 ______________________ TOTAL TRANSFERABLE SECURITIES TRADED ON ANOTHER REGULATED MARKET 2,390,160 15.80 ______________________
FINANCIAL INSTRUMENTS
FINANCIAL INSTRUMENTS
FRANCE
FRANCE 0% 07-19.6.08 BTF 2,700,000 EUR 2,676,780 17.70
FRANCE 0% 07-28.8.08 BTF 2,500,000 EUR 2,460,000 16.27
FRANCE 0% 08-12.06.08 BTF 1,550,000 EUR 1,537,910 10.17
FRANCE 0% 08-15.5.08 BTF 1,750,000 EUR 1,741,425 11.51
FRANCE 0% 08-30.4.08 BTF 2,500,000 EUR 2,491,750 16.48 ______________________
10,907,865 72.13 ______________________ TOTAL FINANCIAL INSTRUMENTS 10,907,865 72.13 ______________________
COMMERCIAL PAPER
FRANCE
FRANCE 0% 08-29.05.08 TB 100,000 EUR 99,360 0.66 ______________________
99,360 0.66 ______________________ TOTAL COMMERCIAL PAPER 99,360 0.66 ______________________ TOTAL FINANCIAL INSTRUMENTS 11,007,225 72.79 ______________________ TOTAL INVESTMENTS 13,397,385 88.59 ______________________
OTHER NET ASSETS LESS LIABILITIES 1,725,037 11.41 ______________________ TOTAL NET ASSETS 15,122,422 100.00 ______________________
HSBC Global Investment Funds 213
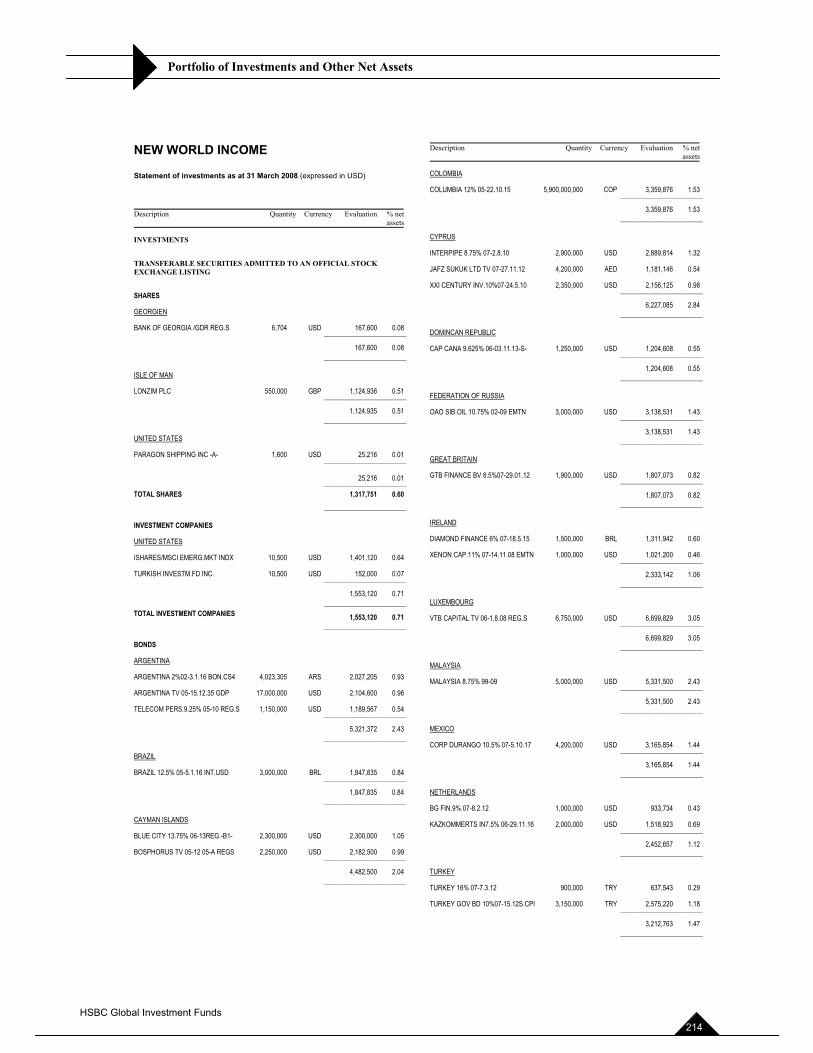
Portfolio of Investments and Other Net Assets
NEW WORLD INCOME
Statement of investments as at 31 March 2008 (expressed in USD)
Description Quantity Currency Evaluation % netassets
INVESTMENTS
TRANSFERABLE SECURITIES ADMITTED TO AN OFFICIAL STOCK EXCHANGE LISTING
SHARES
GEORGIEN
BANK OF GEORGIA /GDR REG.S 6,704 USD 167,600 0.08 ______________________
167,600 0.08 ______________________
ISLE OF MAN
LONZIM PLC 550,000 GBP 1,124,936 0.51 ______________________
1,124,935 0.51 ______________________
UNITED STATES
PARAGON SHIPPING INC -A- 1,600 USD 25,216 0.01 ______________________
25,216 0.01 ______________________ TOTAL SHARES 1,317,751 0.60 ______________________
INVESTMENT COMPANIES
UNITED STATES
ISHARES/MSCI EMERG.MKT INDX 10,500 USD 1,401,120 0.64
TURKISH INVESTM.FD INC. 10,500 USD 152,000 0.07 ______________________
1,553,120 0.71 ______________________ TOTAL INVESTMENT COMPANIES 1,553,120 0.71 ______________________
BONDS
ARGENTINA
ARGENTINA 2%02-3.1.16 BON.CS4 4,023,305 ARS 2,027,205 0.93
ARGENTINA TV 05-15.12.35 GDP 17,000,000 USD 2,104,600 0.96
TELECOM PERS.9.25% 05-10 REG.S 1,150,000 USD 1,189,567 0.54 ______________________
5,321,372 2.43 ______________________
BRAZIL
BRAZIL 12.5% 05-5.1.16 INT.USD 3,000,000 BRL 1,847,835 0.84 ______________________
1,847,835 0.84 ______________________
CAYMAN ISLANDS
BLUE CITY 13.75% 06-13REG.-B1- 2,300,000 USD 2,300,000 1.05
BOSPHORUS TV 05-12 05-A REGS 2,250,000 USD 2,182,500 0.99 ______________________
4,482,500 2.04 ______________________
Description Quantity Currency Evaluation % netassets
COLOMBIA
COLUMBIA 12% 05-22.10.15 5,900,000,000 COP 3,359,876 1.53 ______________________
3,359,876 1.53 ______________________
CYPRUS
INTERPIPE 8.75% 07-2.8.10 2,900,000 USD 2,889,814 1.32
JAFZ SUKUK LTD TV 07-27.11.12 4,200,000 AED 1,181,146 0.54
XXI CENTURY INV.10%07-24.5.10 2,350,000 USD 2,156,125 0.98 ______________________
6,227,085 2.84 ______________________
DOMINCAN REPUBLIC
CAP CANA 9.625% 06-03.11.13-S- 1,250,000 USD 1,204,608 0.55 ______________________
1,204,608 0.55 ______________________
FEDERATION OF RUSSIA
OAO SIB.OIL 10.75% 02-09 EMTN 3,000,000 USD 3,138,531 1.43 ______________________
3,138,531 1.43 ______________________
GREAT BRITAIN
GTB FINANCE BV 8.5%07-29.01.12 1,900,000 USD 1,807,073 0.82 ______________________
1,807,073 0.82 ______________________
IRELAND
DIAMOND FINANCE 6% 07-18.5.15 1,500,000 BRL 1,311,942 0.60
XENON CAP.11% 07-14.11.08 EMTN 1,000,000 USD 1,021,200 0.46 ______________________
2,333,142 1.06 ______________________
LUXEMBOURG
VTB CAPITAL TV 06-1.8.08 REG.S 6,750,000 USD 6,699,829 3.05 ______________________
6,699,829 3.05 ______________________
MALAYSIA
MALAYSIA 8.75% 99-09 5,000,000 USD 5,331,500 2.43 ______________________
5,331,500 2.43 ______________________
MEXICO
CORP DURANGO 10.5% 07-5.10.17 4,200,000 USD 3,165,854 1.44 ______________________
3,165,854 1.44 ______________________
NETHERLANDS
BG FIN.9% 07-8.2.12 1,000,000 USD 933,734 0.43
KAZKOMMERTS IN7.5% 06-29.11.16 2,000,000 USD 1,518,923 0.69 ______________________
2,452,657 1.12 ______________________
TURKEY
TURKEY 16% 07-7.3.12 900,000 TRY 637,543 0.29
TURKEY GOV BD 10%07-15.12S.CPI 3,150,000 TRY 2,575,220 1.18 ______________________
3,212,763 1.47 ______________________
HSBC Global Investment Funds 214
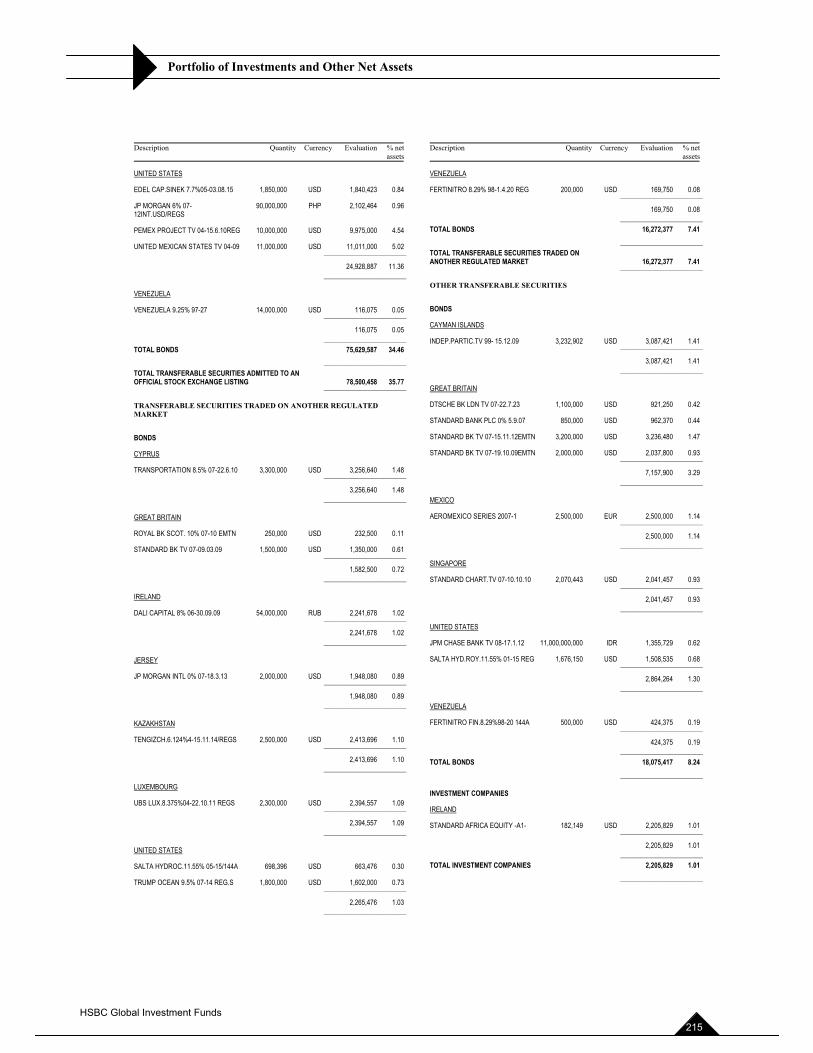
Portfolio of Investments and Other Net Assets
Description Quantity Currency Evaluation % netassets
UNITED STATES
EDEL CAP.SINEK 7.7%05-03.08.15 1,850,000 USD 1,840,423 0.84
JP MORGAN 6% 07-12INT.USD/REGS
90,000,000 PHP 2,102,464 0.96
PEMEX PROJECT TV 04-15.6.10REG 10,000,000 USD 9,975,000 4.54
UNITED MEXICAN STATES TV 04-09 11,000,000 USD 11,011,000 5.02 ______________________
24,928,887 11.36 ______________________
VENEZUELA
VENEZUELA 9.25% 97-27 14,000,000 USD 116,075 0.05 ______________________
116,075 0.05 ______________________ TOTAL BONDS 75,629,587 34.46 ______________________ TOTAL TRANSFERABLE SECURITIES ADMITTED TO AN OFFICIAL STOCK EXCHANGE LISTING 78,500,458 35.77 ______________________
TRANSFERABLE SECURITIES TRADED ON ANOTHER REGULATED MARKET
BONDS
CYPRUS
TRANSPORTATION 8.5% 07-22.6.10 3,300,000 USD 3,256,640 1.48 ______________________
3,256,640 1.48 ______________________
GREAT BRITAIN
ROYAL BK SCOT. 10% 07-10 EMTN 250,000 USD 232,500 0.11
STANDARD BK TV 07-09.03.09 1,500,000 USD 1,350,000 0.61 ______________________
1,582,500 0.72 ______________________
IRELAND
DALI CAPITAL 8% 06-30.09.09 54,000,000 RUB 2,241,678 1.02 ______________________
2,241,678 1.02 ______________________
JERSEY
JP MORGAN INTL 0% 07-18.3.13 2,000,000 USD 1,948,080 0.89 ______________________
1,948,080 0.89 ______________________
KAZAKHSTAN
TENGIZCH.6.124%4-15.11.14/REGS 2,500,000 USD 2,413,696 1.10 ______________________
2,413,696 1.10 ______________________
LUXEMBOURG
UBS LUX.8.375%04-22.10.11 REGS 2,300,000 USD 2,394,557 1.09 ______________________
2,394,557 1.09 ______________________
UNITED STATES
SALTA HYDROC.11.55% 05-15/144A 698,396 USD 663,476 0.30
TRUMP OCEAN 9.5% 07-14 REG.S 1,800,000 USD 1,602,000 0.73 ______________________
2,265,476 1.03 ______________________
Description Quantity Currency Evaluation % netassets
VENEZUELA
FERTINITRO 8.29% 98-1.4.20 REG 200,000 USD 169,750 0.08 ______________________
169,750 0.08 ______________________ TOTAL BONDS 16,272,377 7.41 ______________________ TOTAL TRANSFERABLE SECURITIES TRADED ON ANOTHER REGULATED MARKET 16,272,377 7.41 ______________________
OTHER TRANSFERABLE SECURITIES
BONDS
CAYMAN ISLANDS
INDEP.PARTIC.TV 99- 15.12.09 3,232,902 USD 3,087,421 1.41 ______________________
3,087,421 1.41 ______________________
GREAT BRITAIN
DTSCHE BK LDN TV 07-22.7.23 1,100,000 USD 921,250 0.42
STANDARD BANK PLC 0% 5.9.07 850,000 USD 962,370 0.44
STANDARD BK TV 07-15.11.12EMTN 3,200,000 USD 3,236,480 1.47
STANDARD BK TV 07-19.10.09EMTN 2,000,000 USD 2,037,800 0.93 ______________________
7,157,900 3.29 ______________________
MEXICO
AEROMEXICO SERIES 2007-1 2,500,000 EUR 2,500,000 1.14 ______________________
2,500,000 1.14 ______________________
SINGAPORE
STANDARD CHART.TV 07-10.10.10 2,070,443 USD 2,041,457 0.93 ______________________
2,041,457 0.93 ______________________
UNITED STATES
JPM CHASE BANK TV 08-17.1.12 11,000,000,000 IDR 1,355,729 0.62
SALTA HYD.ROY.11.55% 01-15 REG 1,676,150 USD 1,508,535 0.68 ______________________
2,864,264 1.30 ______________________
VENEZUELA
FERTINITRO FIN.8.29%98-20 144A 500,000 USD 424,375 0.19 ______________________
424,375 0.19 ______________________ TOTAL BONDS 18,075,417 8.24 ______________________
INVESTMENT COMPANIES
IRELAND
STANDARD AFRICA EQUITY -A1- 182,149 USD 2,205,829 1.01 ______________________
2,205,829 1.01 ______________________ TOTAL INVESTMENT COMPANIES 2,205,829 1.01 ______________________
HSBC Global Investment Funds 215
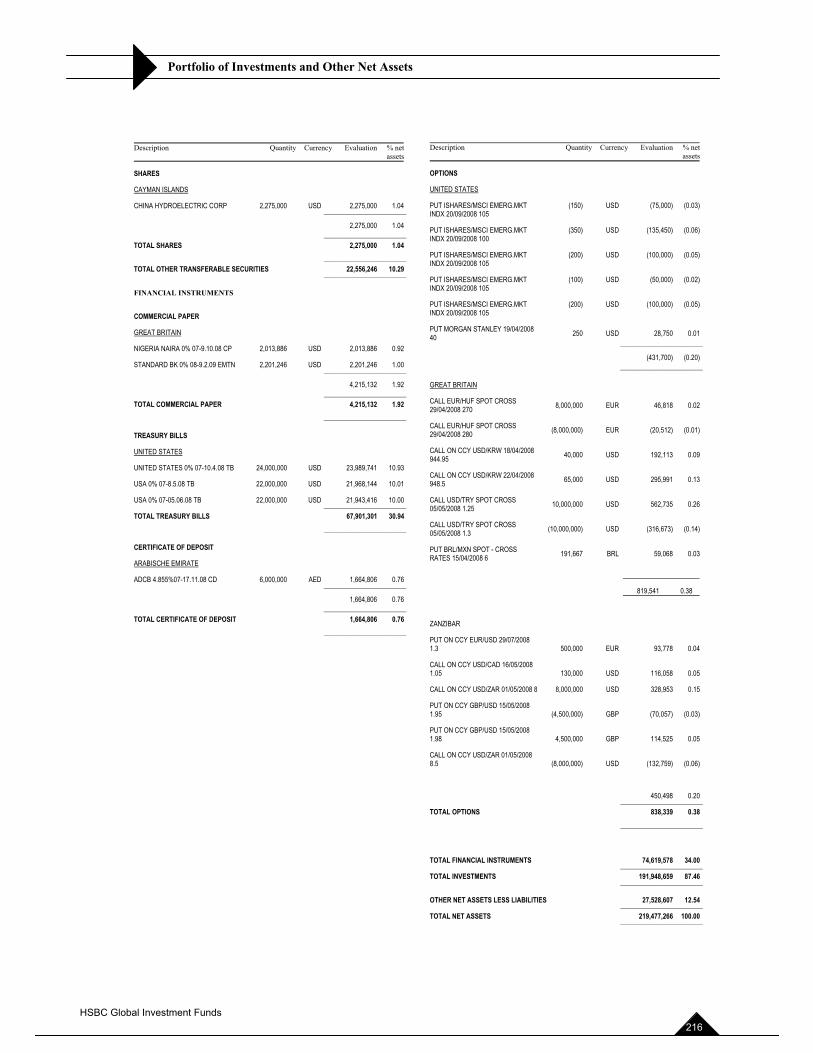
Portfolio of Investments and Other Net Assets
Description Quantity Currency Evaluation % netassets
SHARES
CAYMAN ISLANDS
CHINA HYDROELECTRIC CORP 2,275,000 USD 2,275,000 1.04 ______________________
2,275,000 1.04 ______________________ TOTAL SHARES 2,275,000 1.04 ______________________ TOTAL OTHER TRANSFERABLE SECURITIES 22,556,246 10.29 ______________________
FINANCIAL INSTRUMENTS
COMMERCIAL PAPER
GREAT BRITAIN
NIGERIA NAIRA 0% 07-9.10.08 CP 2,013,886 USD 2,013,886 0.92
STANDARD BK 0% 08-9.2.09 EMTN 2,201,246 USD 2,201,246 1.00 ______________________
4,215,132 1.92 ______________________ TOTAL COMMERCIAL PAPER 4,215,132 1.92 ______________________
TREASURY BILLS
UNITED STATES
UNITED STATES 0% 07-10.4.08 TB 24,000,000 USD 23,989,741 10.93
USA 0% 07-8.5.08 TB 22,000,000 USD 21,968,144 10.01
USA 0% 07-05.06.08 TB 22,000,000 USD 21,943,416 10.00 ______________________ TOTAL TREASURY BILLS 67,901,301 30.94 ______________________
CERTIFICATE OF DEPOSIT
ARABISCHE EMIRATE
ADCB 4.855%07-17.11.08 CD 6,000,000 AED 1,664,806 0.76 ______________________
1,664,806 0.76 ______________________ TOTAL CERTIFICATE OF DEPOSIT 1,664,806 0.76 ______________________
Description Quantity Currency Evaluation % netassets
OPTIONS
UNITED STATES
PUT ISHARES/MSCI EMERG.MKT INDX 20/09/2008 105
(150) USD (75,000) (0.03)
PUT ISHARES/MSCI EMERG.MKT INDX 20/09/2008 100
(350) USD (135,450) (0.06)
PUT ISHARES/MSCI EMERG.MKT INDX 20/09/2008 105
(200) USD (100,000) (0.05)
PUT ISHARES/MSCI EMERG.MKT INDX 20/09/2008 105
(100) USD (50,000) (0.02)
PUT ISHARES/MSCI EMERG.MKT INDX 20/09/2008 105
(200) USD (100,000) (0.05)
PUT MORGAN STANLEY 19/04/2008 40 ______________________
250 USD 28,750 0.01
(431,700) (0.20) ______________________
GREAT BRITAIN
CALL EUR/HUF SPOT CROSS 29/04/2008 270 8,000,000 EUR 46,818 0.02
CALL EUR/HUF SPOT CROSS 29/04/2008 280 (8,000,000) EUR (20,512) (0.01)
CALL ON CCY USD/KRW 18/04/2008 944.95 40,000 USD 192,113 0.09
CALL ON CCY USD/KRW 22/04/2008 948.5 65,000 USD 295,991 0.13
CALL USD/TRY SPOT CROSS 05/05/2008 1.25 10,000,000 USD 562,735 0.26
CALL USD/TRY SPOT CROSS 05/05/2008 1.3 (10,000,000) USD (316,673) (0.14)
PUT BRL/MXN SPOT - CROSS RATES 15/04/2008 6 191,667 BRL 59,068 0.03
819,541 0.38
ZANZIBAR
PUT ON CCY EUR/USD 29/07/2008 1.3 500,000 EUR 93,778 0.04
CALL ON CCY USD/CAD 16/05/2008 1.05 130,000 USD 116,058 0.05
CALL ON CCY USD/ZAR 01/05/2008 8 8,000,000 USD 328,953 0.15
PUT ON CCY GBP/USD 15/05/2008 1.95 (4,500,000) GBP (70,057) (0.03)
PUT ON CCY GBP/USD 15/05/2008 1.98 4,500,000 GBP 114,525 0.05
CALL ON CCY USD/ZAR 01/05/2008 8.5 (8,000,000) USD (132,759) (0.06)
450,498 0.20 ______________________ TOTAL OPTIONS 838,339 0.38 ______________________
TOTAL FINANCIAL INSTRUMENTS 74,619,578 34.00 ______________________ TOTAL INVESTMENTS 191,948,659 87.46 ______________________
OTHER NET ASSETS LESS LIABILITIES 27,528,607 12.54 ______________________ TOTAL NET ASSETS 219,477,266 100.00 ______________________
HSBC Global Investment Funds 216
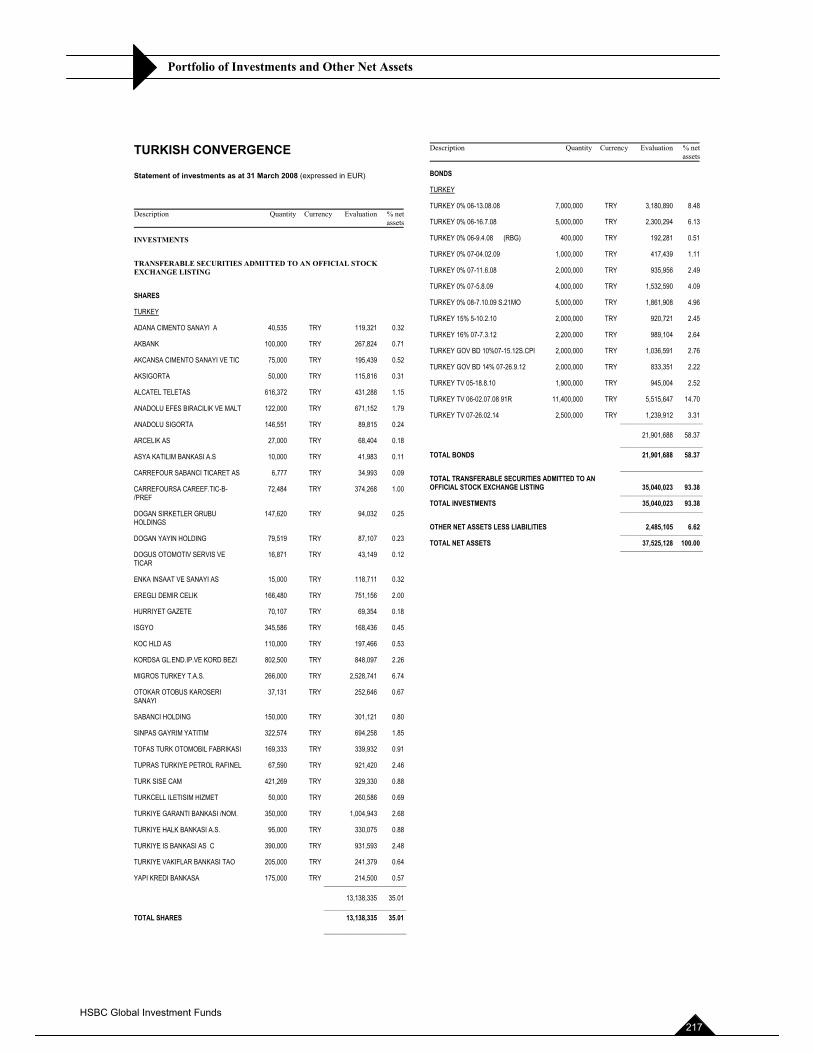
Portfolio of Investments and Other Net Assets
TURKISH CONVERGENCE
Statement of investments as at 31 March 2008 (expressed in EUR)
Description Quantity Currency Evaluation % netassets
INVESTMENTS
TRANSFERABLE SECURITIES ADMITTED TO AN OFFICIAL STOCK EXCHANGE LISTING
SHARES
TURKEY
ADANA CIMENTO SANAYI A 40,535 TRY 119,321 0.32
AKBANK 100,000 TRY 267,824 0.71
AKCANSA CIMENTO SANAYI VE TIC 75,000 TRY 195,439 0.52
AKSIGORTA 50,000 TRY 115,816 0.31
ALCATEL TELETAS 616,372 TRY 431,288 1.15
ANADOLU EFES BIRACILIK VE MALT 122,000 TRY 671,152 1.79
ANADOLU SIGORTA 146,551 TRY 89,815 0.24
ARCELIK AS 27,000 TRY 68,404 0.18
ASYA KATILIM BANKASI A.S 10,000 TRY 41,983 0.11
CARREFOUR SABANCI TICARET AS 6,777 TRY 34,993 0.09
CARREFOURSA CAREEF.TIC-B-/PREF
72,484 TRY 374,268 1.00
DOGAN SIRKETLER GRUBU HOLDINGS
147,620 TRY 94,032 0.25
DOGAN YAYIN HOLDING 79,519 TRY 87,107 0.23
DOGUS OTOMOTIV SERVIS VE TICAR
16,871 TRY 43,149 0.12
ENKA INSAAT VE SANAYI AS 15,000 TRY 118,711 0.32
EREGLI DEMIR CELIK 166,480 TRY 751,156 2.00
HURRIYET GAZETE 70,107 TRY 69,354 0.18
ISGYO 345,586 TRY 168,436 0.45
KOC HLD AS 110,000 TRY 197,466 0.53
KORDSA GL.END.IP.VE KORD BEZI 802,500 TRY 848,097 2.26
MIGROS TURKEY T.A.S. 266,000 TRY 2,528,741 6.74
OTOKAR OTOBUS KAROSERI SANAYI
37,131 TRY 252,646 0.67
SABANCI HOLDING 150,000 TRY 301,121 0.80
SINPAS GAYRIM YATITIM 322,574 TRY 694,258 1.85
TOFAS TURK OTOMOBIL FABRIKASI 169,333 TRY 339,932 0.91
TUPRAS TURKIYE PETROL RAFINEL 67,590 TRY 921,420 2.46
TURK SISE CAM 421,269 TRY 329,330 0.88
TURKCELL ILETISIM HIZMET 50,000 TRY 260,586 0.69
TURKIYE GARANTI BANKASI /NOM. 350,000 TRY 1,004,943 2.68
TURKIYE HALK BANKASI A.S. 95,000 TRY 330,075 0.88
TURKIYE IS BANKASI AS C 390,000 TRY 931,593 2.48
TURKIYE VAKIFLAR BANKASI TAO 205,000 TRY 241,379 0.64
YAPI KREDI BANKASA 175,000 TRY 214,500 0.57 ______________________
13,138,335 35.01 ______________________ TOTAL SHARES 13,138,335 35.01 ______________________
Description Quantity Currency Evaluation % netassets
BONDS
TURKEY
TURKEY 0% 06-13.08.08 7,000,000 TRY 3,180,890 8.48
TURKEY 0% 06-16.7.08 5,000,000 TRY 2,300,294 6.13
TURKEY 0% 06-9.4.08 (RBG) 400,000 TRY 192,281 0.51
TURKEY 0% 07-04.02.09 1,000,000 TRY 417,439 1.11
TURKEY 0% 07-11.6.08 2,000,000 TRY 935,956 2.49
TURKEY 0% 07-5.8.09 4,000,000 TRY 1,532,590 4.09
TURKEY 0% 08-7.10.09 S.21MO 5,000,000 TRY 1,861,908 4.96
TURKEY 15% 5-10.2.10 2,000,000 TRY 920,721 2.45
TURKEY 16% 07-7.3.12 2,200,000 TRY 989,104 2.64
TURKEY GOV BD 10%07-15.12S.CPI 2,000,000 TRY 1,036,591 2.76
TURKEY GOV BD 14% 07-26.9.12 2,000,000 TRY 833,351 2.22
TURKEY TV 05-18.8.10 1,900,000 TRY 945,004 2.52
TURKEY TV 06-02.07.08 91R 11,400,000 TRY 5,515,647 14.70
TURKEY TV 07-26.02.14 2,500,000 TRY 1,239,912 3.31 ______________________
21,901,688 58.37 ______________________ TOTAL BONDS 21,901,688 58.37 ______________________ TOTAL TRANSFERABLE SECURITIES ADMITTED TO AN OFFICIAL STOCK EXCHANGE LISTING 35,040,023 93.38 ______________________ TOTAL INVESTMENTS 35,040,023 93.38 ______________________
OTHER NET ASSETS LESS LIABILITIES 2,485,105 6.62 ______________________ TOTAL NET ASSETS 37,525,128 100.00 ______________________
HSBC Global Investment Funds 217
Currency Conversion Table
�The detailed list of movements in the investment portfolio can be obtained free of charge upon request at the registered office of the Company. The current prospectus, the articles of association as well as the interim report and the audited annual report are available free of charge upon request from the German payment and information officer from the Management Company.
��
HSBC Global Investment Funds 218
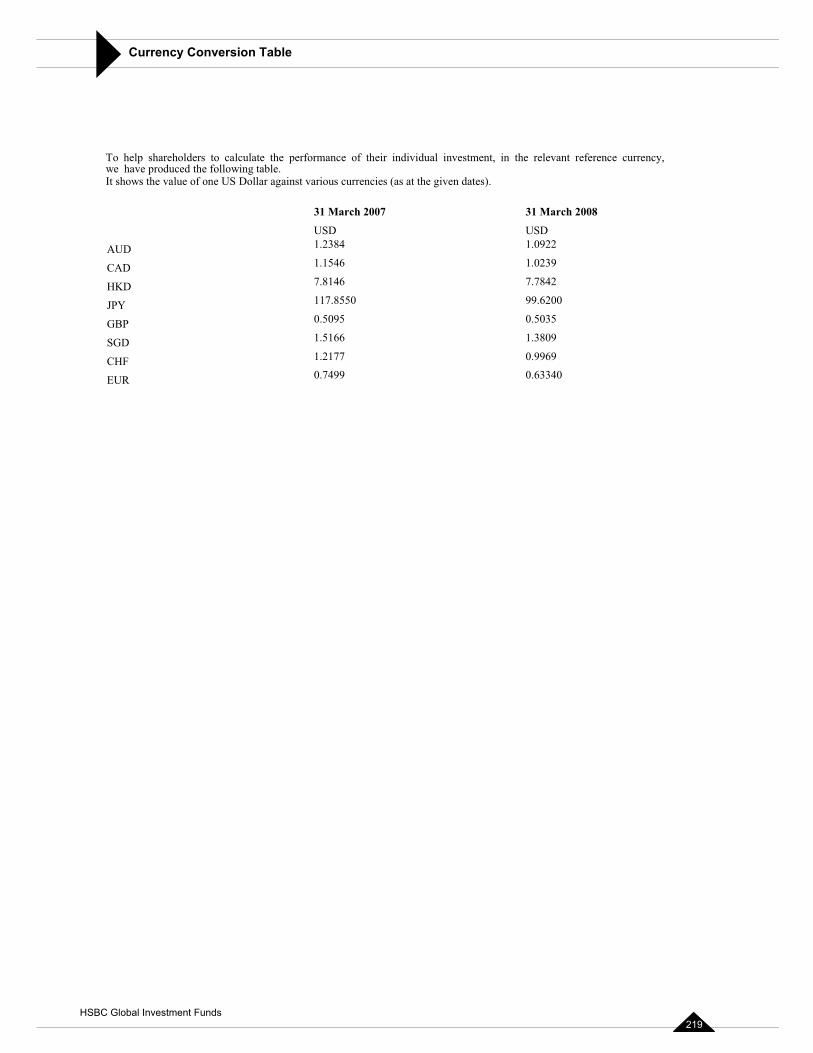
Currency Conversion Table
�To help shareholders to calculate the performance of their individual investment, in the relevant reference currency, we have produced the following table. It shows the value of one US Dollar against various currencies (as at the given dates).
31 March 2007 31 March 2008
USD USD
AUD 1.2384 1.0922
CAD 1.1546 1.0239
HKD 7.8146 7.7842
JPY 117.8550 99.6200
GBP 0.5095 0.5035
SGD 1.5166 1.3809
CHF 1.2177 0.9969
EUR 0.7499 0.63340
253
HSBC Global Investment Funds 219
Dealing Days of the Fund
Dealing for Shares of the Company will take place on any Business Day (a day on which banks are open for normal banking business in Luxembourg) other than days during a period of suspension of dealing in Shares provided that, for sub-funds materially invested in markets other than North or South American markets, such Business Day is a day where stock exchanges and regulated markets in countries where the sub-fund is materially invested are open for normal trading. For sub-funds materially invested in North or South American markets, dealing for Shares of the sub-fund will take place on any Business Day (other than days during a period of suspension of dealing in Shares) except a Business Day following the day where stock exchanges and regulated markets in such countries were closed for normal trading.
Shareholders who deal through the Company's local distributor or representative should note that there will be no dealing for the Shares of the Company in the jurisdiction in which such distributor or representative operates on a day which is not a business day in such jurisdiction.
The Company will determine the dealing/non-dealing calendar according to the latest market information obtained by the Company from time to time. Shareholders can obtain the latest dealing/non-dealing calendar of the Company from the registered office of the Company or from the Company's local distributor or representative.
254
HSBC Global Investment Funds 220
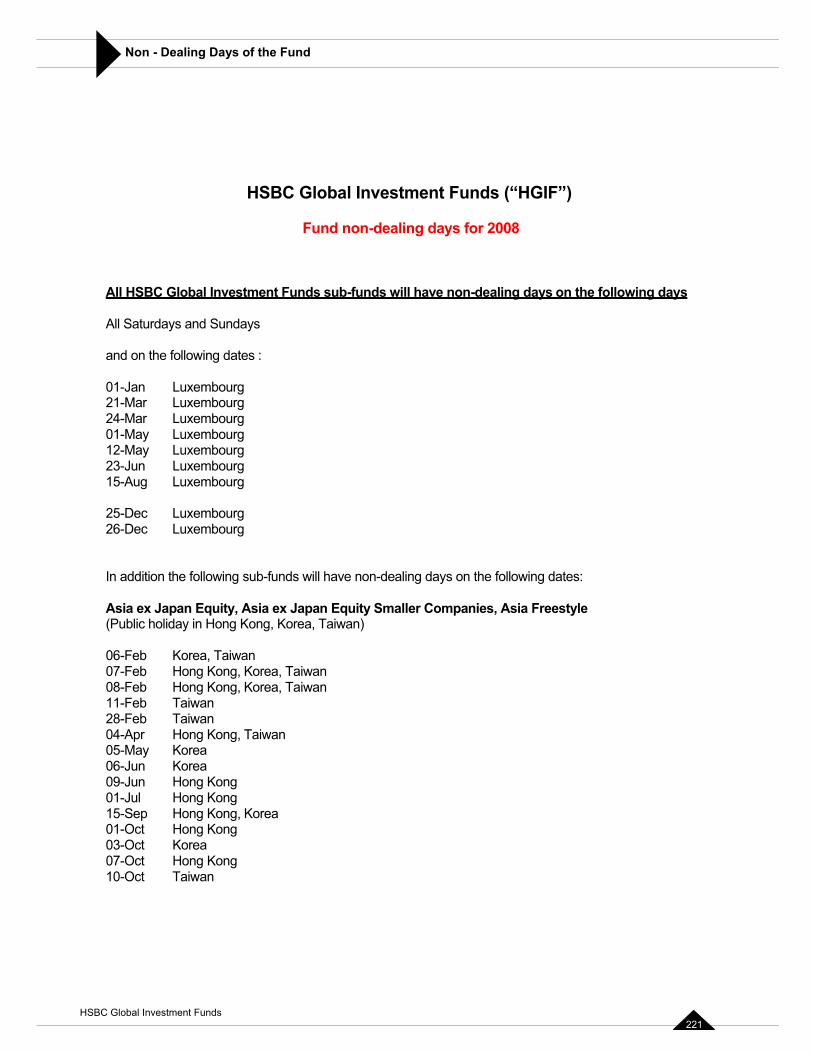
Non - Dealing Days of the Fund
HSBC Global Investment Funds (“HGIF”)
Fund non-dealing days for 2008
All HSBC Global Investment Funds sub-funds will have non-dealing days on the following days
All Saturdays and Sundays
and on the following dates :
01-Jan Luxembourg21-Mar Luxembourg24-Mar Luxembourg01-May Luxembourg12-May Luxembourg23-Jun Luxembourg15-Aug Luxembourg
25-Dec Luxembourg26-Dec Luxembourg
In addition the following sub-funds will have non-dealing days on the following dates:
Asia ex Japan Equity, Asia ex Japan Equity Smaller Companies, Asia Freestyle(Public holiday in Hong Kong, Korea, Taiwan)
06-Feb Korea, Taiwan07-Feb Hong Kong, Korea, Taiwan08-Feb Hong Kong, Korea, Taiwan11-Feb Taiwan28-Feb Taiwan04-Apr Hong Kong, Taiwan05-May Korea06-Jun Korea09-Jun Hong Kong01-Jul Hong Kong15-Sep Hong Kong, Korea01-Oct Hong Kong03-Oct Korea07-Oct Hong Kong10-Oct Taiwan
255
HSBC Global Investment Funds 221
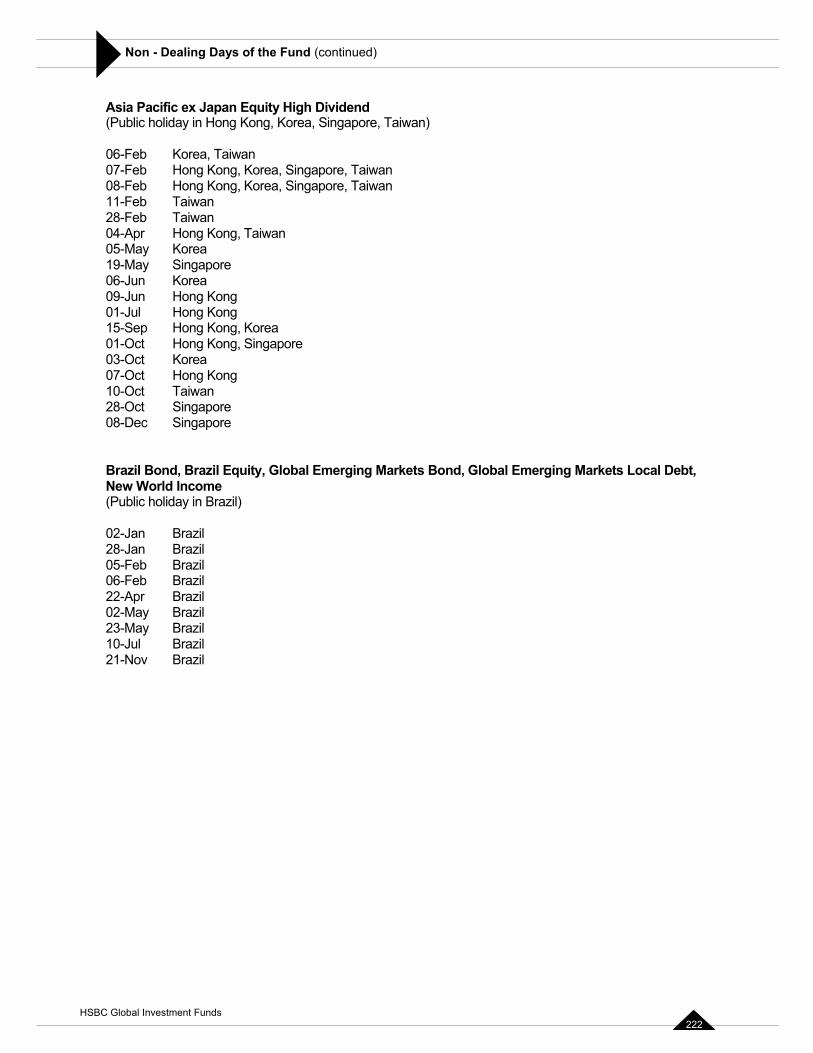
Non - Dealing Days of the Fund (continued)
Asia Pacific ex Japan Equity High Dividend(Public holiday in Hong Kong, Korea, Singapore, Taiwan)
06-Feb Korea, Taiwan07-Feb Hong Kong, Korea, Singapore, Taiwan08-Feb Hong Kong, Korea, Singapore, Taiwan11-Feb Taiwan28-Feb Taiwan04-Apr Hong Kong, Taiwan05-May Korea19-May Singapore06-Jun Korea09-Jun Hong Kong01-Jul Hong Kong15-Sep Hong Kong, Korea01-Oct Hong Kong, Singapore03-Oct Korea07-Oct Hong Kong10-Oct Taiwan28-Oct Singapore08-Dec Singapore
Brazil Bond, Brazil Equity, Global Emerging Markets Bond, Global Emerging Markets Local Debt, New World Income(Public holiday in Brazil)
02-Jan Brazil28-Jan Brazil05-Feb Brazil06-Feb Brazil22-Apr Brazil02-May Brazil23-May Brazil10-Jul Brazil21-Nov Brazil
256
HSBC Global Investment Funds 222
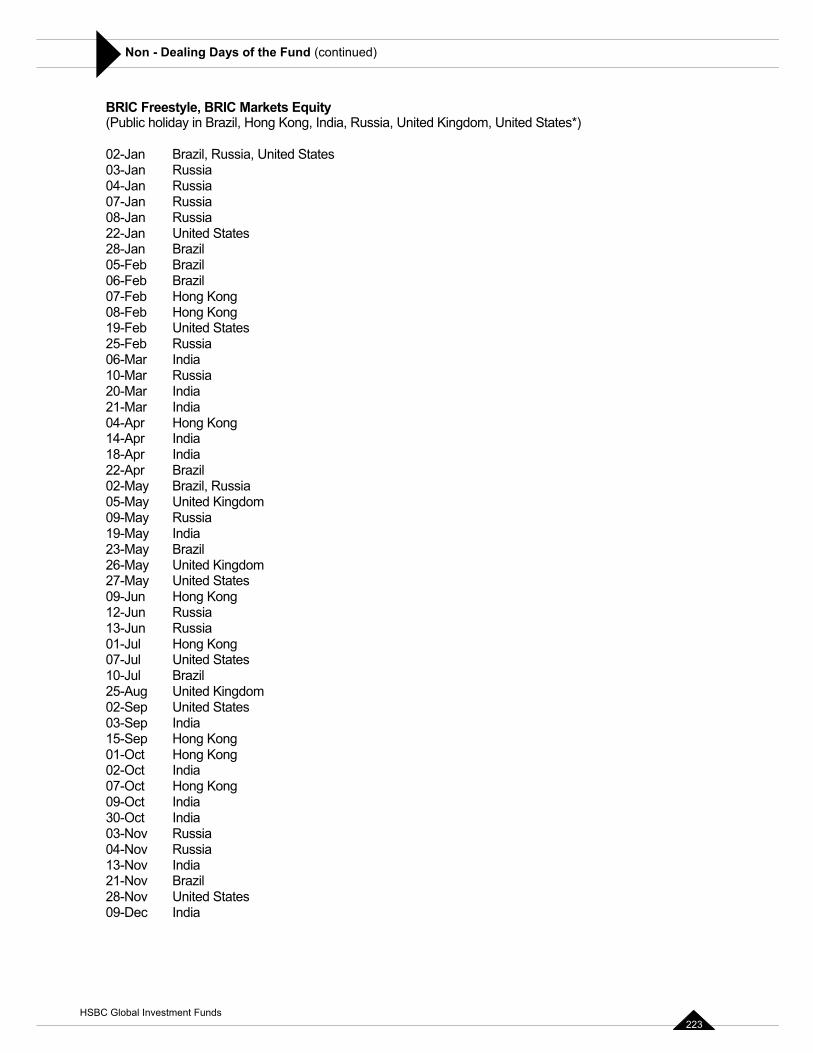
Non - Dealing Days of the Fund (continued)
BRIC Freestyle, BRIC Markets Equity(Public holiday in Brazil, Hong Kong, India, Russia, United Kingdom, United States*)
02-Jan Brazil, Russia, United States03-Jan Russia04-Jan Russia07-Jan Russia08-Jan Russia22-Jan United States28-Jan Brazil05-Feb Brazil06-Feb Brazil07-Feb Hong Kong08-Feb Hong Kong19-Feb United States25-Feb Russia06-Mar India 10-Mar Russia20-Mar India 21-Mar India 04-Apr Hong Kong14-Apr India18-Apr India 22-Apr Brazil02-May Brazil, Russia 05-May United Kingdom09-May Russia 19-May India23-May Brazil26-May United Kingdom27-May United States09-Jun Hong Kong12-Jun Russia13-Jun Russia01-Jul Hong Kong07-Jul United States10-Jul Brazil25-Aug United Kingdom02-Sep United States 03-Sep India15-Sep Hong Kong01-Oct Hong Kong02-Oct India07-Oct Hong Kong09-Oct India30-Oct India03-Nov Russia04-Nov Russia 13-Nov India21-Nov Brazil28-Nov United States 09-Dec India
HSBC Global Investment Funds 223
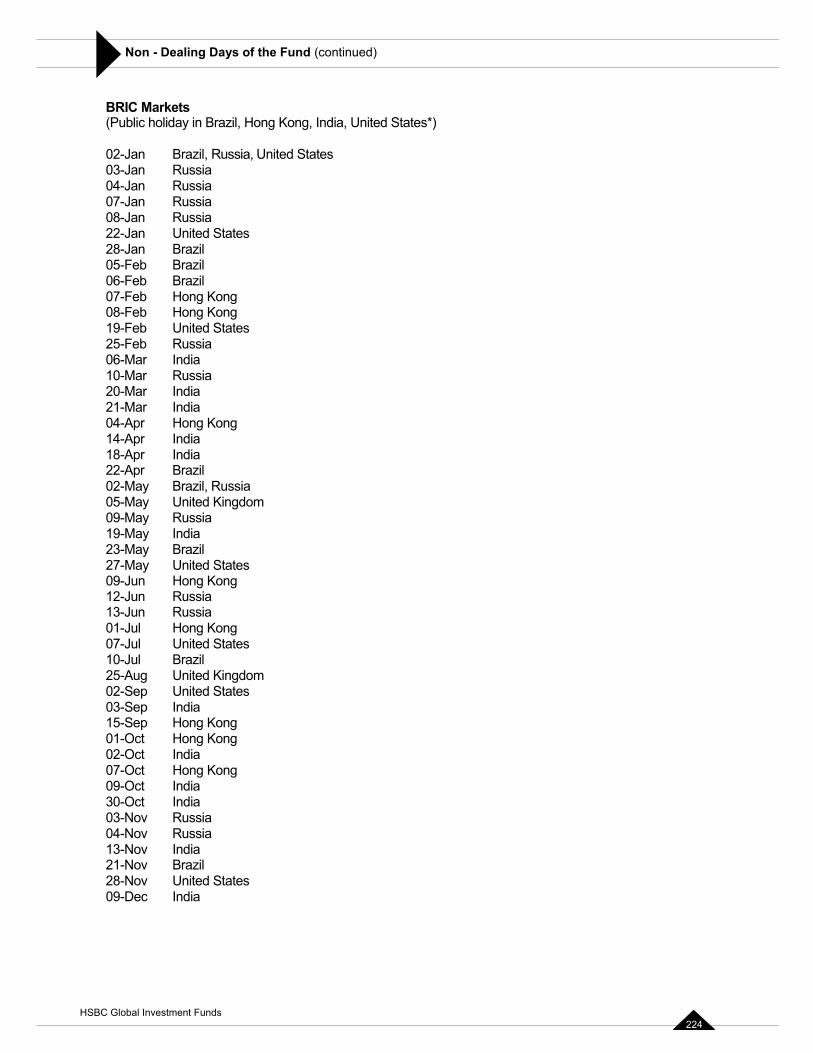
Non - Dealing Days of the Fund (continued)
BRIC Markets(Public holiday in Brazil, Hong Kong, India, United States*)
02-Jan Brazil, Russia, United States 03-Jan Russia 04-Jan Russia 07-Jan Russia 08-Jan Russia22-Jan United States28-Jan Brazil05-Feb Brazil06-Feb Brazil07-Feb Hong Kong08-Feb Hong Kong19-Feb United States 25-Feb Russia 06-Mar India 10-Mar Russia 20-Mar India 21-Mar India04-Apr Hong Kong14-Apr India 18-Apr India22-Apr Brazil02-May Brazil, Russia 05-May United Kingdom09-May Russia 19-May India23-May Brazil27-May United States09-Jun Hong Kong12-Jun Russia 13-Jun Russia01-Jul Hong Kong07-Jul United States10-Jul Brazil25-Aug United Kingdom02-Sep United States 03-Sep India15-Sep Hong Kong01-Oct Hong Kong02-Oct India07-Oct Hong Kong09-Oct India30-Oct India 03-Nov Russia 04-Nov Russia 13-Nov India21-Nov Brazil28-Nov United States09-Dec India
HSBC Global Investment Funds 224
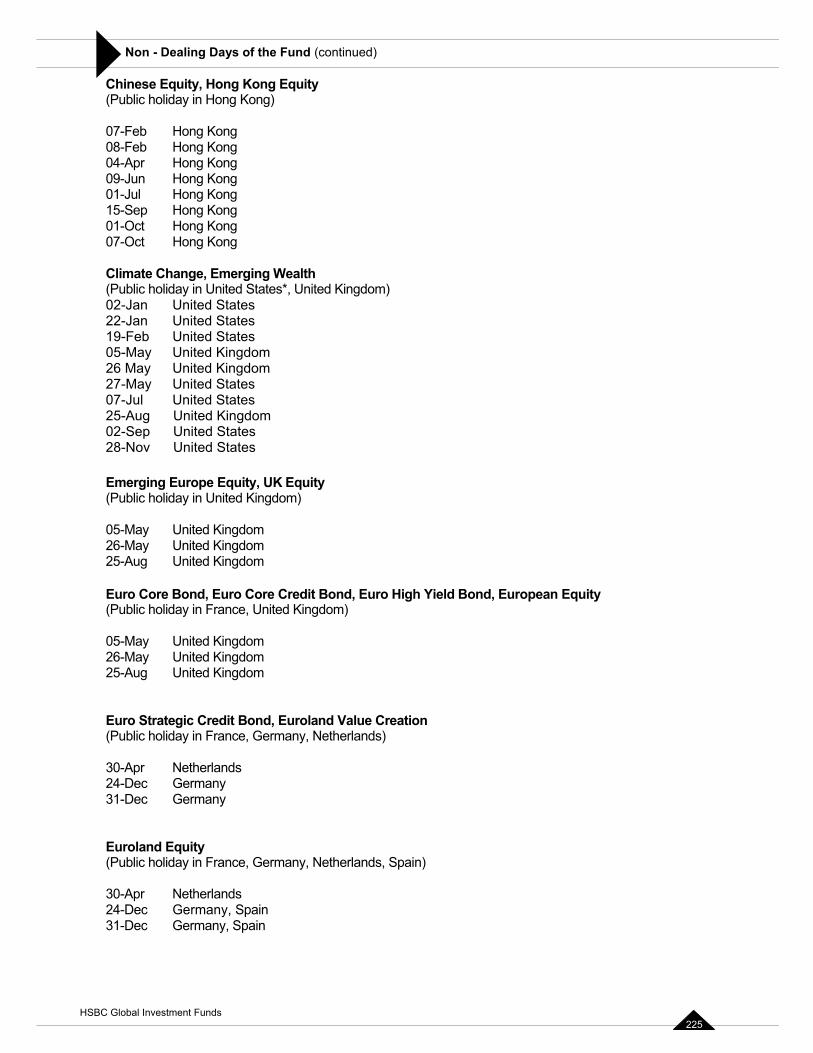
Non - Dealing Days of the Fund (continued)
Chinese Equity, Hong Kong Equity(Public holiday in Hong Kong)
07-Feb Hong Kong08-Feb Hong Kong04-Apr Hong Kong09-Jun Hong Kong01-Jul Hong Kong15-Sep Hong Kong01-Oct Hong Kong07-Oct Hong Kong
Climate Change, Emerging Wealth (Public holiday in United States*, United Kingdom)02-Jan United States 22-Jan United States 19-Feb United States 05-May United Kingdom 26 May United Kingdom 27-May United States 07-Jul United States 25-Aug United Kingdom 02-Sep United States 28-Nov United States
Emerging Europe Equity, UK Equity(Public holiday in United Kingdom)
05-May United Kingdom 26-May United Kingdom25-Aug United Kingdom
Euro Core Bond, Euro Core Credit Bond, Euro High Yield Bond, European Equity(Public holiday in France, United Kingdom)
05-May United Kingdom 26-May United Kingdom25-Aug United Kingdom
Euro Strategic Credit Bond, Euroland Value Creation(Public holiday in France, Germany, Netherlands)
30-Apr Netherlands 24-Dec Germany31-Dec Germany
Euroland Equity(Public holiday in France, Germany, Netherlands, Spain)
30-Apr Netherlands24-Dec Germany, Spain31-Dec Germany, Spain
HSBC Global Investment Funds 225
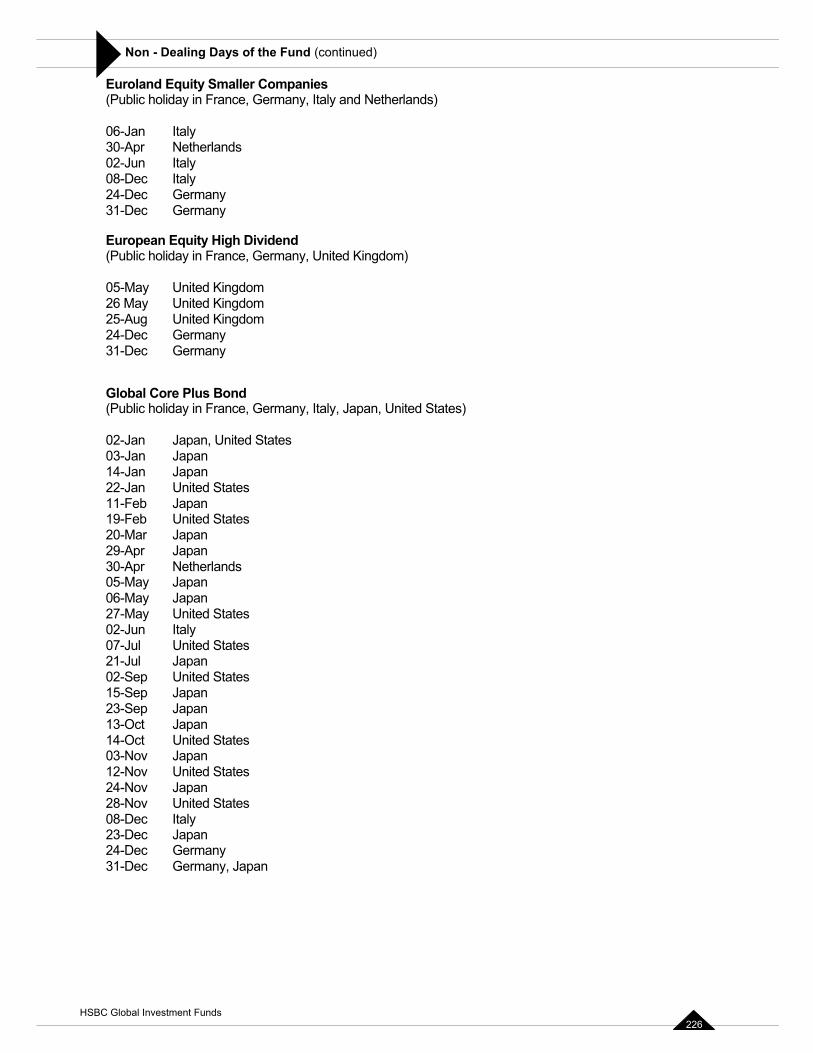
Non - Dealing Days of the Fund (continued)
Euroland Equity Smaller Companies(Public holiday in France, Germany, Italy and Netherlands)
06-Jan Italy30-Apr Netherlands02-Jun Italy08-Dec Italy24-Dec Germany31-Dec Germany
European Equity High Dividend (Public holiday in France, Germany, United Kingdom)
05-May United Kingdom 26 May United Kingdom 25-Aug United Kingdom 24-Dec Germany 31-Dec Germany
Global Core Plus Bond(Public holiday in France, Germany, Italy, Japan, United States)
02-Jan Japan, United States03-Jan Japan14-Jan Japan22-Jan United States11-Feb Japan19-Feb United States20-Mar Japan29-Apr Japan30-Apr Netherlands05-May Japan06-May Japan27-May United States02-Jun Italy07-Jul United States21-Jul Japan02-Sep United States15-Sep Japan23-Sep Japan13-Oct Japan14-Oct United States03-Nov Japan12-Nov United States24-Nov Japan28-Nov United States08-Dec Italy23-Dec Japan 24-Dec Germany31-Dec Germany, Japan
HSBC Global Investment Funds 226
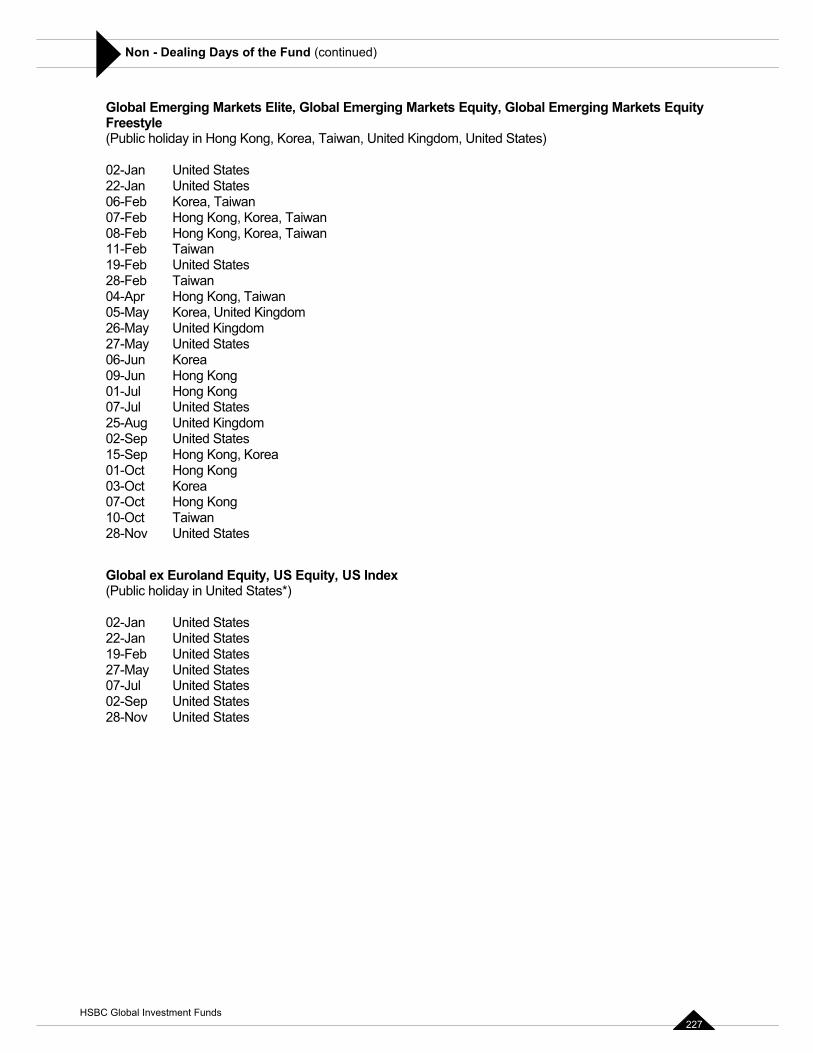
Non - Dealing Days of the Fund (continued)
Global Emerging Markets Elite, Global Emerging Markets Equity, Global Emerging Markets EquityFreestyle(Public holiday in Hong Kong, Korea, Taiwan, United Kingdom, United States)
02-Jan United States 22-Jan United States06-Feb Korea, Taiwan07-Feb Hong Kong, Korea, Taiwan08-Feb Hong Kong, Korea, Taiwan11-Feb Taiwan19-Feb United States28-Feb Taiwan04-Apr Hong Kong, Taiwan05-May Korea, United Kingdom26-May United Kingdom 27-May United States06-Jun Korea09-Jun Hong Kong01-Jul Hong Kong07-Jul United States25-Aug United Kingdom02-Sep United States15-Sep Hong Kong, Korea01-Oct Hong Kong03-Oct Korea07-Oct Hong Kong10-Oct Taiwan28-Nov United States
Global ex Euroland Equity, US Equity, US Index(Public holiday in United States*)
02-Jan United States 22-Jan United States19-Feb United States27-May United States07-Jul United States02-Sep United States28-Nov United States
HSBC Global Investment Funds 227
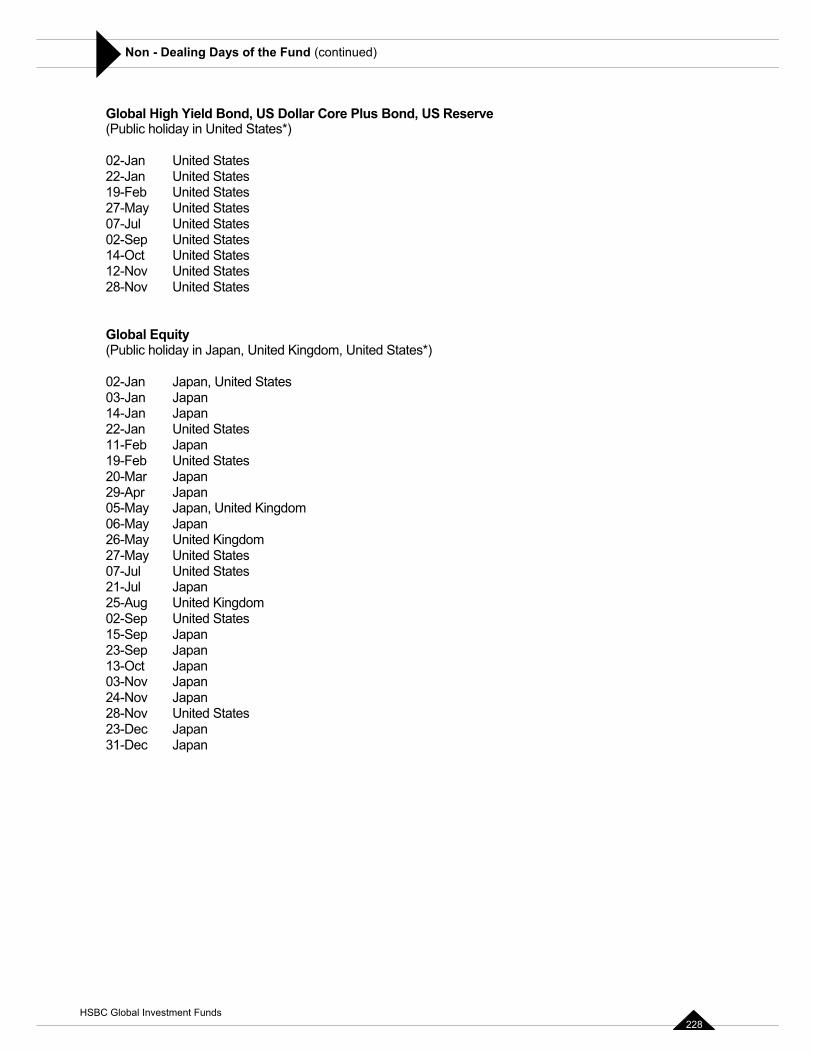
Non - Dealing Days of the Fund (continued)
Global High Yield Bond, US Dollar Core Plus Bond, US Reserve(Public holiday in United States*)
02-Jan United States22-Jan United States19-Feb United States27-May United States07-Jul United States02-Sep United States14-Oct United States12-Nov United States28-Nov United States
Global Equity(Public holiday in Japan, United Kingdom, United States*)
02-Jan Japan, United States03-Jan Japan14-Jan Japan22-Jan United States11-Feb Japan19-Feb United States20-Mar Japan29-Apr Japan05-May Japan, United Kingdom06-May Japan26-May United Kingdom27-May United States07-Jul United States21-Jul Japan25-Aug United Kingdom02-Sep United States15-Sep Japan23-Sep Japan13-Oct Japan03-Nov Japan24-Nov Japan28-Nov United States23-Dec Japan31-Dec Japan
262
HSBC Global Investment Funds 228
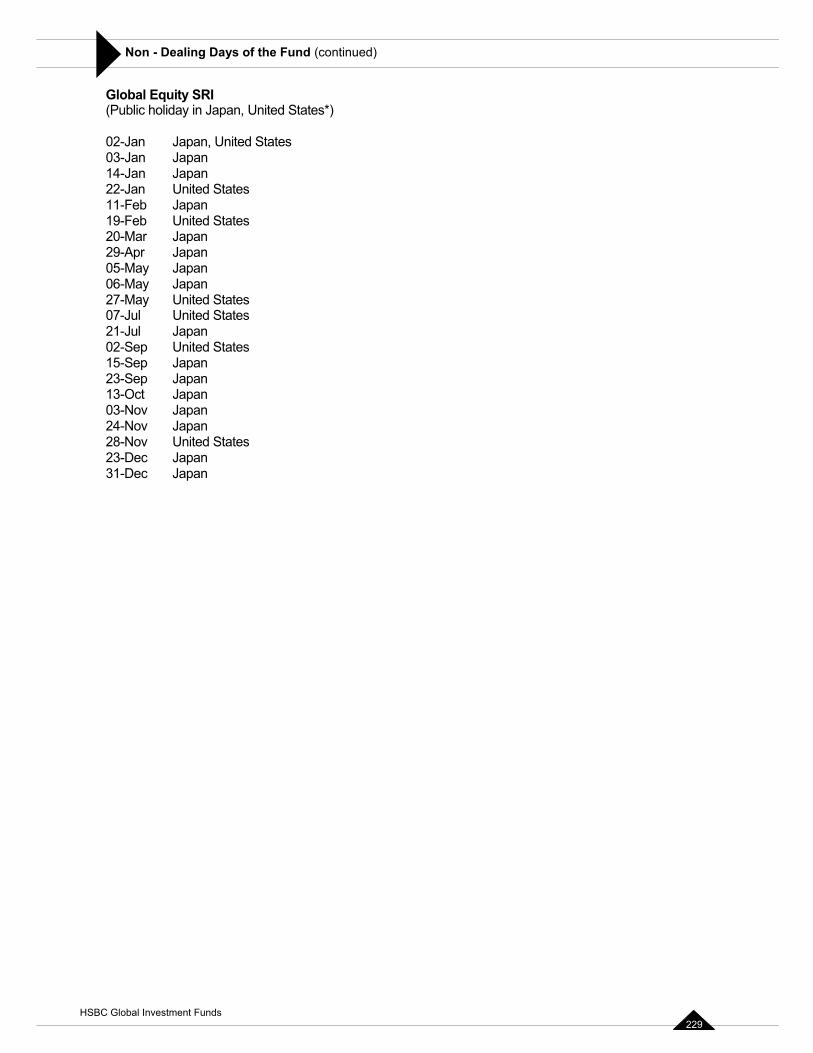
Non - Dealing Days of the Fund (continued)
Global Equity SRI(Public holiday in Japan, United States*)
02-Jan Japan, United States03-Jan Japan14-Jan Japan22-Jan United States11-Feb Japan19-Feb United States20-Mar Japan29-Apr Japan05-May Japan06-May Japan27-May United States07-Jul United States21-Jul Japan02-Sep United States15-Sep Japan23-Sep Japan13-Oct Japan03-Nov Japan24-Nov Japan28-Nov United States23-Dec Japan31-Dec Japan
63
HSBC Global Investment Funds 229
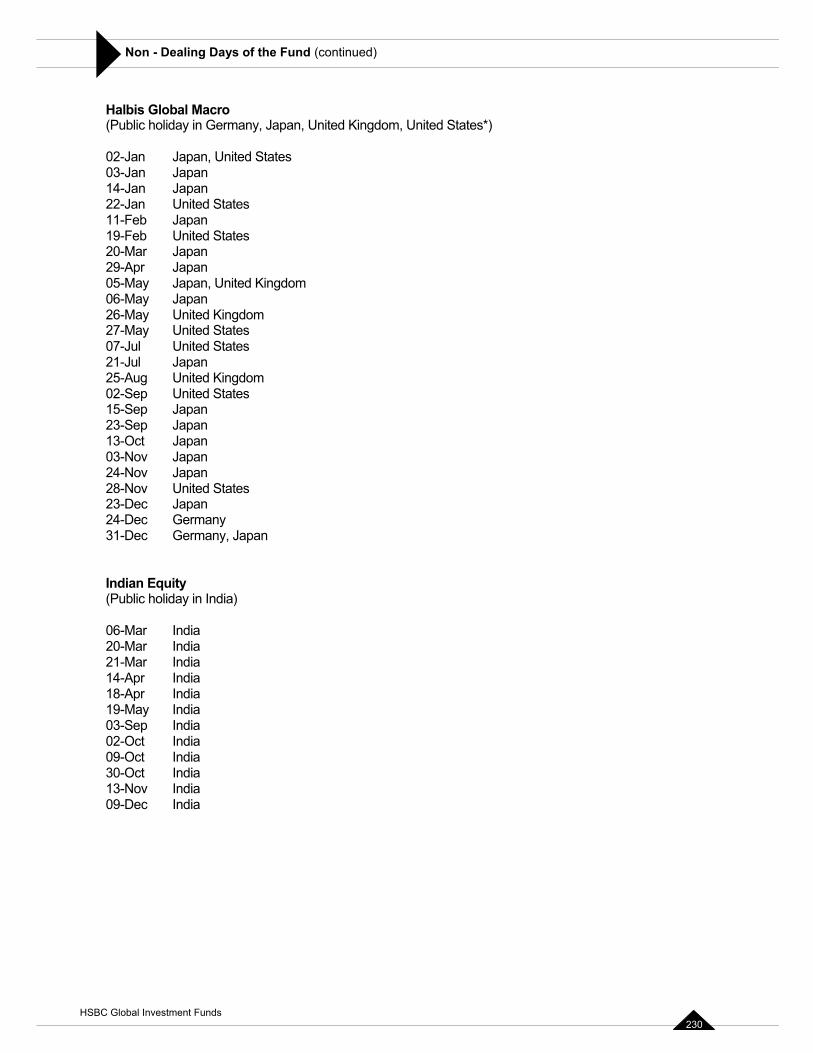
Non - Dealing Days of the Fund (continued)
Halbis Global Macro(Public holiday in Germany, Japan, United Kingdom, United States*)
02-Jan Japan, United States03-Jan Japan14-Jan Japan22-Jan United States11-Feb Japan19-Feb United States20-Mar Japan29-Apr Japan05-May Japan, United Kingdom06-May Japan26-May United Kingdom27-May United States07-Jul United States21-Jul Japan25-Aug United Kingdom02-Sep United States15-Sep Japan23-Sep Japan13-Oct Japan03-Nov Japan24-Nov Japan28-Nov United States23-Dec Japan 24-Dec Germany31-Dec Germany, Japan
Indian Equity(Public holiday in India)
06-Mar India 20-Mar India 21-Mar India 14-Apr India 18-Apr India 19-May India 03-Sep India02-Oct India 09-Oct India30-Oct India 13-Nov India 09-Dec India
264
HSBC Global Investment Funds 230
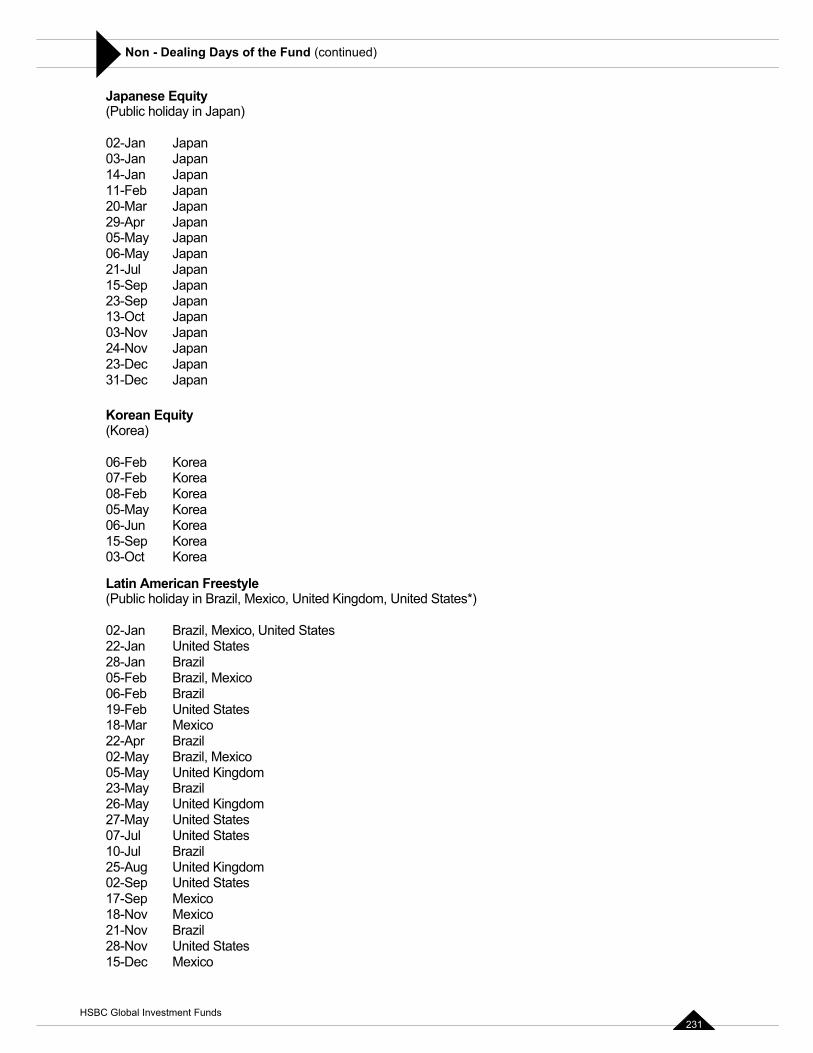
Non - Dealing Days of the Fund (continued)
Japanese Equity(Public holiday in Japan)
02-Jan Japan03-Jan Japan14-Jan Japan11-Feb Japan20-Mar Japan29-Apr Japan05-May Japan06-May Japan21-Jul Japan15-Sep Japan23-Sep Japan13-Oct Japan03-Nov Japan24-Nov Japan23-Dec Japan31-Dec Japan
Korean Equity(Korea)
06-Feb Korea07-Feb Korea08-Feb Korea05-May Korea06-Jun Korea15-Sep Korea03-Oct Korea
Latin American Freestyle(Public holiday in Brazil, Mexico, United Kingdom, United States*)
02-Jan Brazil, Mexico, United States22-Jan United States28-Jan Brazil05-Feb Brazil, Mexico06-Feb Brazil19-Feb United States18-Mar Mexico22-Apr Brazil02-May Brazil, Mexico05-May United Kingdom23-May Brazil26-May United Kingdom27-May United States07-Jul United States10-Jul Brazil25-Aug United Kingdom02-Sep United States17-Sep Mexico18-Nov Mexico21-Nov Brazil28-Nov United States15-Dec Mexico
HSBC Global Investment Funds 231
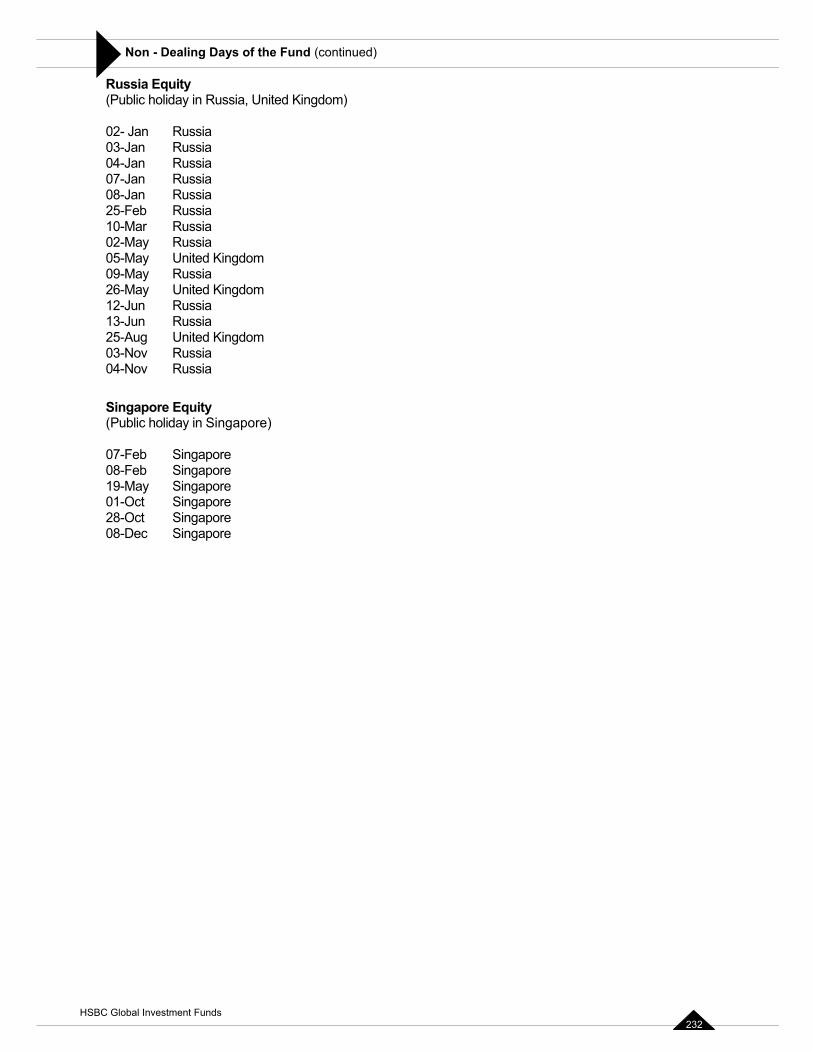
Non - Dealing Days of the Fund (continued)
Russia Equity (Public holiday in Russia, United Kingdom)
02- Jan Russia 03-Jan Russia 04-Jan Russia 07-Jan Russia 08-Jan Russia 25-Feb Russia 10-Mar Russia 02-May Russia 05-May United Kingdom 09-May Russia 26-May United Kingdom 12-Jun Russia 13-Jun Russia 25-Aug United Kingdom 03-Nov Russia 04-Nov Russia
Singapore Equity(Public holiday in Singapore)
07-Feb Singapore08-Feb Singapore19-May Singapore01-Oct Singapore28-Oct Singapore08-Dec Singapore
266
HSBC Global Investment Funds 232
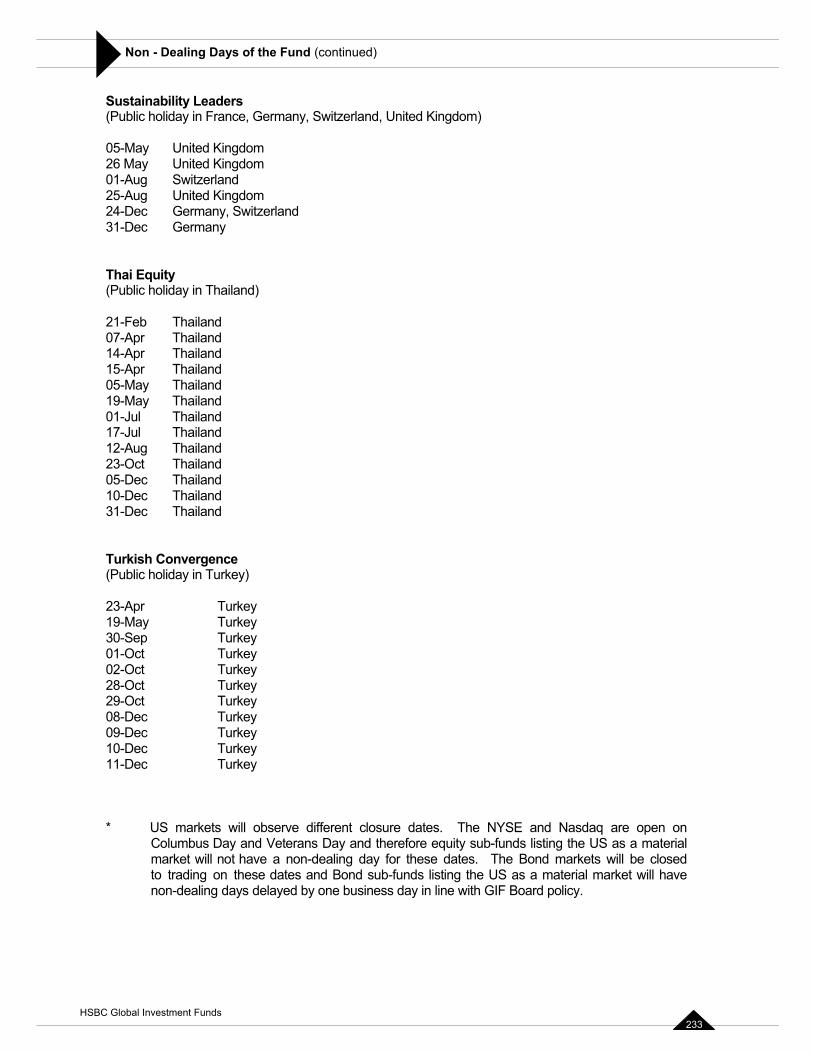
Non - Dealing Days of the Fund (continued)
Sustainability Leaders(Public holiday in France, Germany, Switzerland, United Kingdom)
05-May United Kingdom 26 May United Kingdom01-Aug Switzerland25-Aug United Kingdom 24-Dec Germany, Switzerland31-Dec Germany
Thai Equity(Public holiday in Thailand)
21-Feb Thailand07-Apr Thailand14-Apr Thailand15-Apr Thailand05-May Thailand19-May Thailand01-Jul Thailand17-Jul Thailand12-Aug Thailand23-Oct Thailand05-Dec Thailand10-Dec Thailand31-Dec Thailand
Turkish Convergence(Public holiday in Turkey)
23-Apr Turkey19-May Turkey30-Sep Turkey01-Oct Turkey02-Oct Turkey28-Oct Turkey29-Oct Turkey08-Dec Turkey09-Dec Turkey10-Dec Turkey11-Dec Turkey
* US markets will observe different closure dates. The NYSE and Nasdaq are open onColumbus Day and Veterans Day and therefore equity sub-funds listing the US as a materialmarket will not have a non-dealing day for these dates. The Bond markets will be closedto trading on these dates and Bond sub-funds listing the US as a material market will havenon-dealing days delayed by one business day in line with GIF Board policy.
HSBC Global Investment Funds 233

Issued by HSBC Global Asset Management (Singapore) Limited Company registration no.: 198602036R


