1 FY20 Fixed income factbook HSBC Holdings plc Fixed Income 31 December 2020 Issuance strategy Maturity profile (notional) at FY20 2 $bn-equivalent HoldCo Senior 2021: Expect to issue c.$15bn on a gross basis 2022: Broadly limited to refinancing Tier 2 2021: No current plans 2022: Broadly limited to refinancing AT1 Broadly limited to refinancing OpCo Expect certain subsidiaries to issue senior and secured debt in local markets Issuance strategy and plan 1 Since 2015, HSBC Holdings has been the Group’s issuing entity for external AT1, T2 and MREL/TLAC-eligible Senior Issuance over time to broadly match group currency exposures Issuance executed with consideration to our maturity profile 2.0 2.6 4.1 2.3 2.5 2.7 2.0 4.1 5.7 10.7 10.4 9.0 10.0 10.4 2021 2023 0.1 2022 2024 0.4 2025 13.5 15.0 13.3 16.6 HoldCo Senior ‘21 & ‘22 maturities reduced by c.$12bn through tenders in 2020 Senior (HSBC Holdings) Tier 2 (HSBC Group) AT1 (HSBC Holdings)
Transcript
1
FY20 Fixed income factbookHSBC Holdings plc
Fixe
d In
com
e
31 December 2020
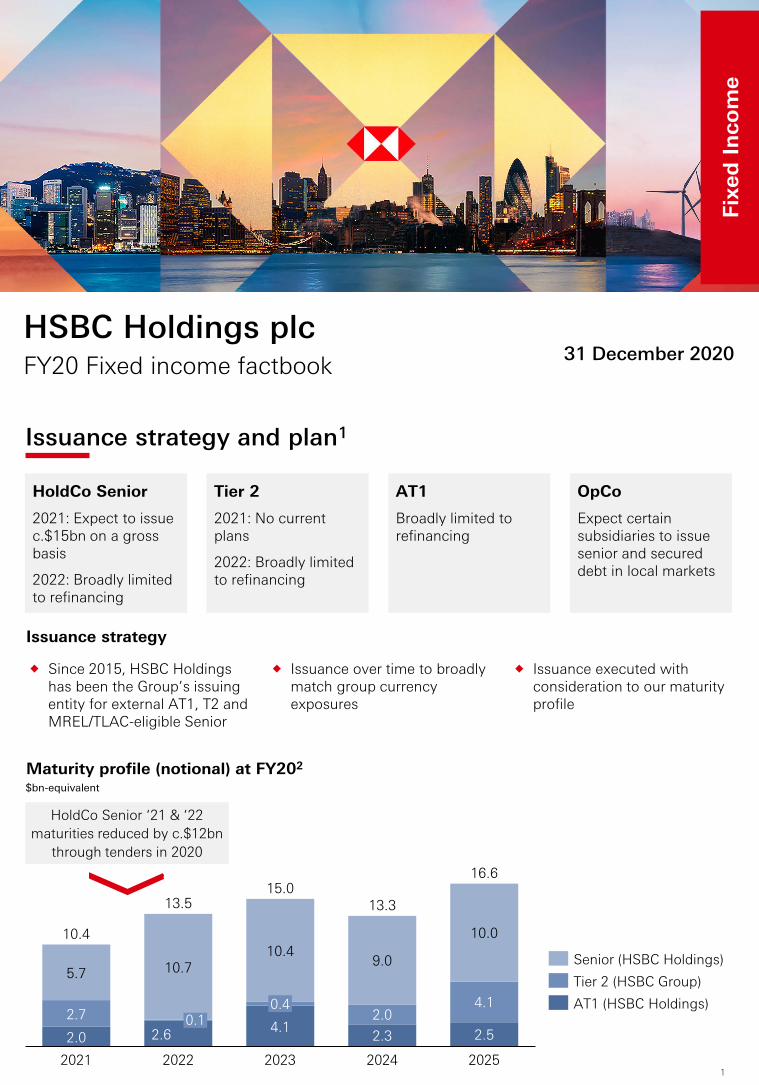
Issuance strategy
Maturity profile (notional) at FY202
$bn-equivalent
HoldCo Senior
2021: Expect to issue c.$15bn on a gross basis
2022: Broadly limited to refinancing
Tier 2
2021: No current plans
2022: Broadly limited to refinancing
AT1
Broadly limited to refinancing
OpCo
Expect certain subsidiaries to issue senior and secured debt in local markets
Issuance strategy and plan1
Since 2015, HSBC Holdings has been the Group’s issuing entity for external AT1, T2 and MREL/TLAC-eligible Senior
Issuance over time to broadly match group currency exposures
Issuance executed with consideration to our maturity profile
2.0 2.6 4.1 2.3 2.52.7 2.0
4.1
5.7 10.710.4
9.0
10.010.4
2021 2023
0.1
2022 2024
0.4
2025
13.515.0
13.3
16.6
HoldCo Senior ‘21 & ‘22 maturities reduced by c.$12bn
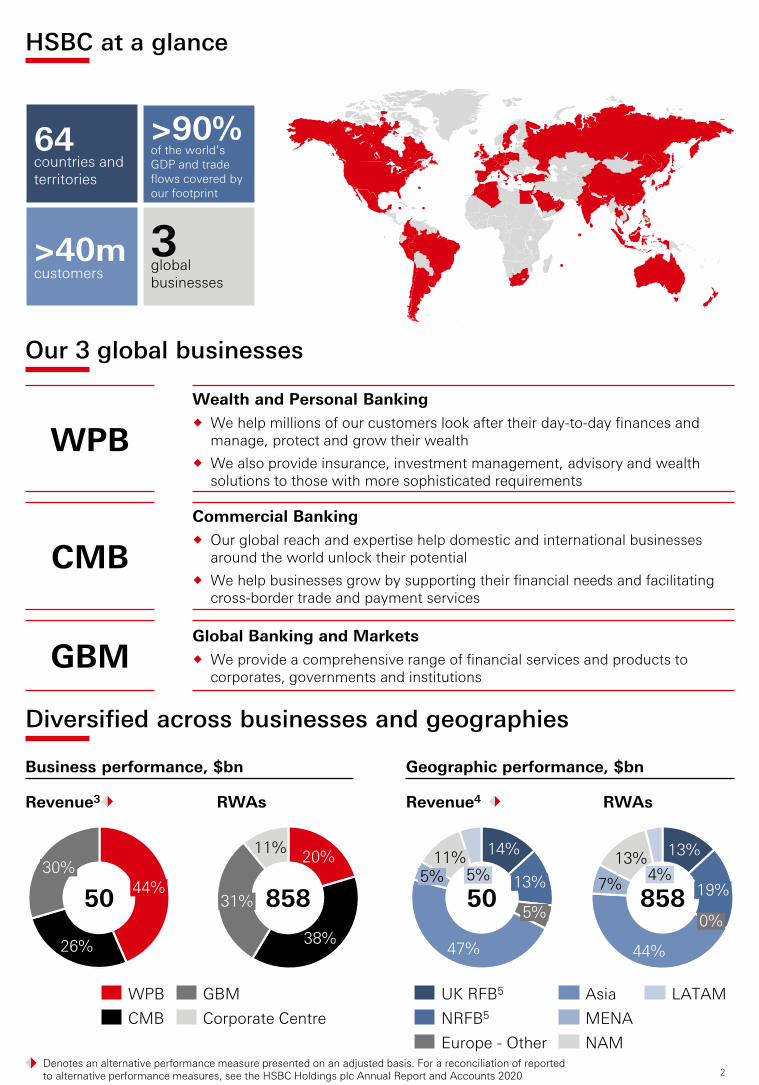
>90%of the world’s GDP and trade flows covered by our footprint
HSBC at a glance
GBMGlobal Banking and Markets We provide a comprehensive range of financial services and products to
corporates, governments and institutions
CMBCommercial Banking Our global reach and expertise help domestic and international businesses
around the world unlock their potential We help businesses grow by supporting their financial needs and facilitating
cross-border trade and payment services
WPBWealth and Personal Banking We help millions of our customers look after their day-to-day finances and
manage, protect and grow their wealth We also provide insurance, investment management, advisory and wealth
solutions to those with more sophisticated requirements
3global businesses
>40mcustomers
Our 3 global businesses
Diversified across businesses and geographies
Europe - Other
UK RFB5
NRFB5
AsiaMENANAM
LATAMCMBWPB
Corporate CentreGBM
20%
38%
11%
31%
47%
5%
14%11%13%
5%
5%
26%
44%30%
13%
44%
7%
13%
19%
0%
4%
Revenue3 RWAs Revenue4 RWAs
Business performance, $bn Geographic performance, $bn
50 858 50 858
Denotes an alternative performance measure presented on an adjusted basis. For a reconciliation of reported to alternative performance measures, see the HSBC Holdings plc Annual Report and Accounts 2020
3
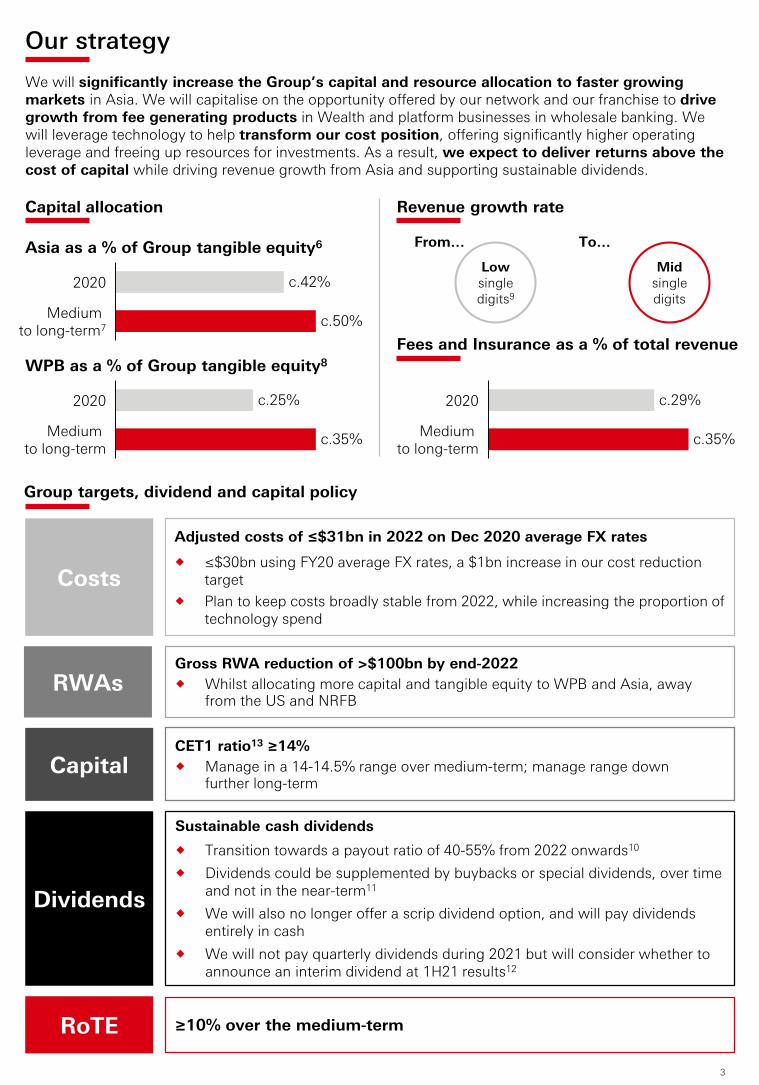
Our strategyWe will significantly increase the Group’s capital and resource allocation to faster growing markets in Asia. We will capitalise on the opportunity offered by our network and our franchise to drive growth from fee generating products in Wealth and platform businesses in wholesale banking. We will leverage technology to help transform our cost position, offering significantly higher operating leverage and freeing up resources for investments. As a result, we expect to deliver returns above the cost of capital while driving revenue growth from Asia and supporting sustainable dividends.
Capital allocation
c.42%2020
Medium to long-term7 c.50%
Asia as a % of Group tangible equity6
Medium to long-term
2020 c.25%
c.35%
WPB as a % of Group tangible equity8
2020
Medium to long-term
c.29%
c.35%
Fees and Insurance as a % of total revenue
Group targets, dividend and capital policy
Sustainable cash dividends
Transition towards a payout ratio of 40-55% from 2022 onwards10
Dividends could be supplemented by buybacks or special dividends, over time and not in the near-term11
We will also no longer offer a scrip dividend option, and will pay dividends entirely in cash
We will not pay quarterly dividends during 2021 but will consider whether to announce an interim dividend at 1H21 results12
Dividends
≥10% over the medium-termRoTE
Adjusted costs of ≤$31bn in 2022 on Dec 2020 average FX rates
≤$30bn using FY20 average FX rates, a $1bn increase in our cost reduction target
Plan to keep costs broadly stable from 2022, while increasing the proportion of technology spend
Costs
Gross RWA reduction of >$100bn by end-2022 Whilst allocating more capital and tangible equity to WPB and Asia, away
from the US and NRFBRWAs
CET1 ratio13 ≥14% Manage in a 14-14.5% range over medium-term; manage range down
further long-termCapital
Revenue growth rate
Lowsingledigits9
Mid single digits
From… To…
4
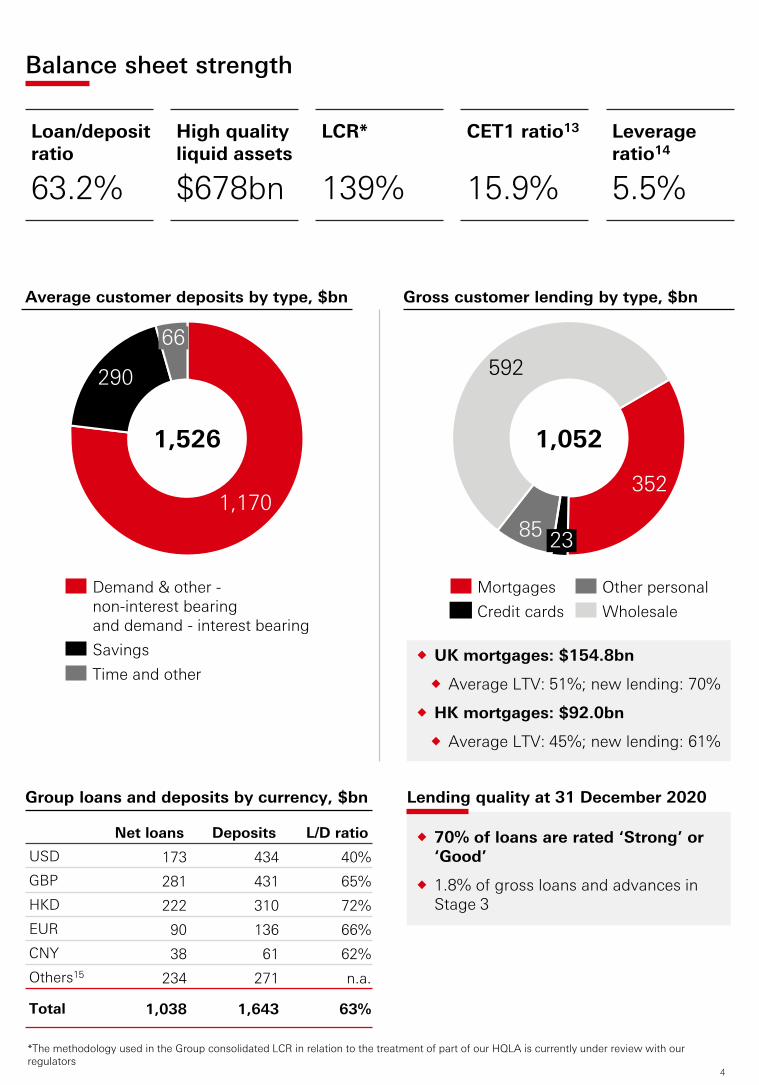
Balance sheet strength
1,170
290
66
Demand & other -non-interest bearing and demand - interest bearingSavingsTime and other
352
2385
592
1,526 1,052
Average customer deposits by type, $bn Gross customer lending by type, $bn
*The methodology used in the Group consolidated LCR in relation to the treatment of part of our HQLA is currently under review with our regulators
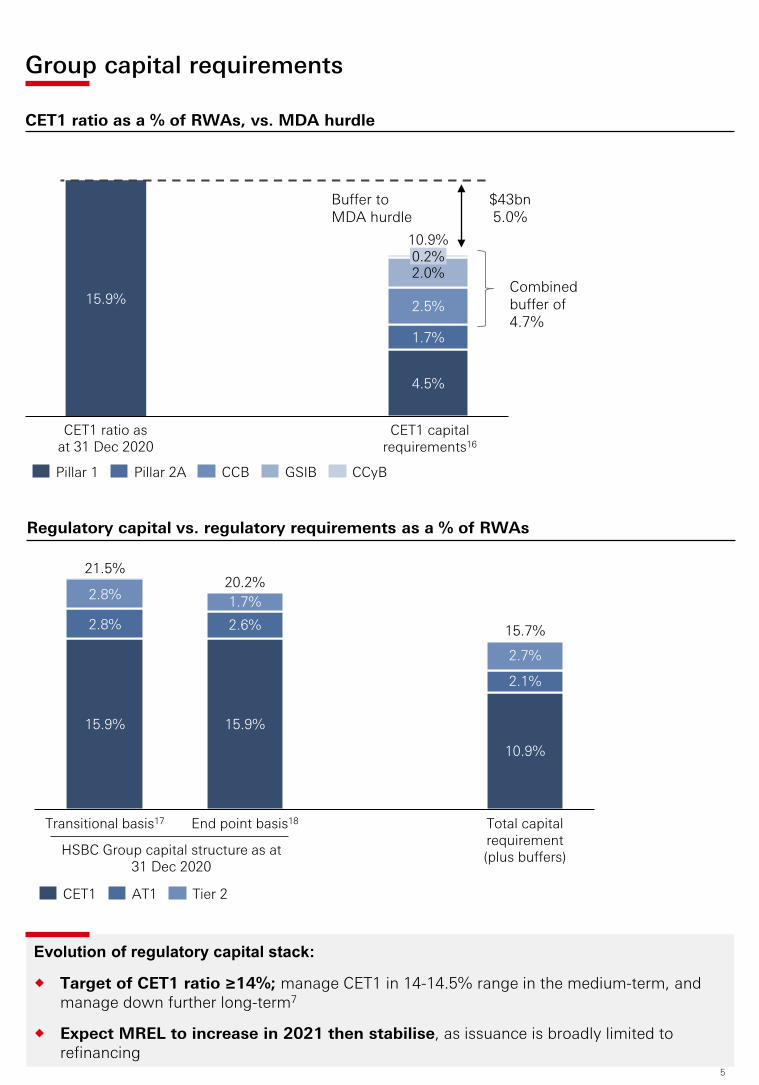
Group capital requirements
CET1 ratio as a % of RWAs, vs. MDA hurdle
4.5%
2.0%
15.9%
0.2%
CET1 ratio as at 31 Dec 2020
1.7%
2.5%
10.9%
Pillar 1 CCyBPillar 2A CCB GSIB
Buffer to MDA hurdle
$43bn5.0%
CET1 capital requirements16
Combined buffer of 4.7%
Regulatory capital vs. regulatory requirements as a % of RWAs
End point basis18
15.7%
Transitional basis17
15.9%
2.7%
2.8%
2.8%
15.9%
2.6%
1.7%
10.9%
2.1%
Total capital requirement(plus buffers)
21.5%20.2%
CET1 AT1 Tier 2
HSBC Group capital structure as at 31 Dec 2020
Evolution of regulatory capital stack:
Target of CET1 ratio ≥14%; manage CET1 in 14-14.5% range in the medium-term, and manage down further long-term7
Expect MREL to increase in 2021 then stabilise, as issuance is broadly limited to refinancing
5
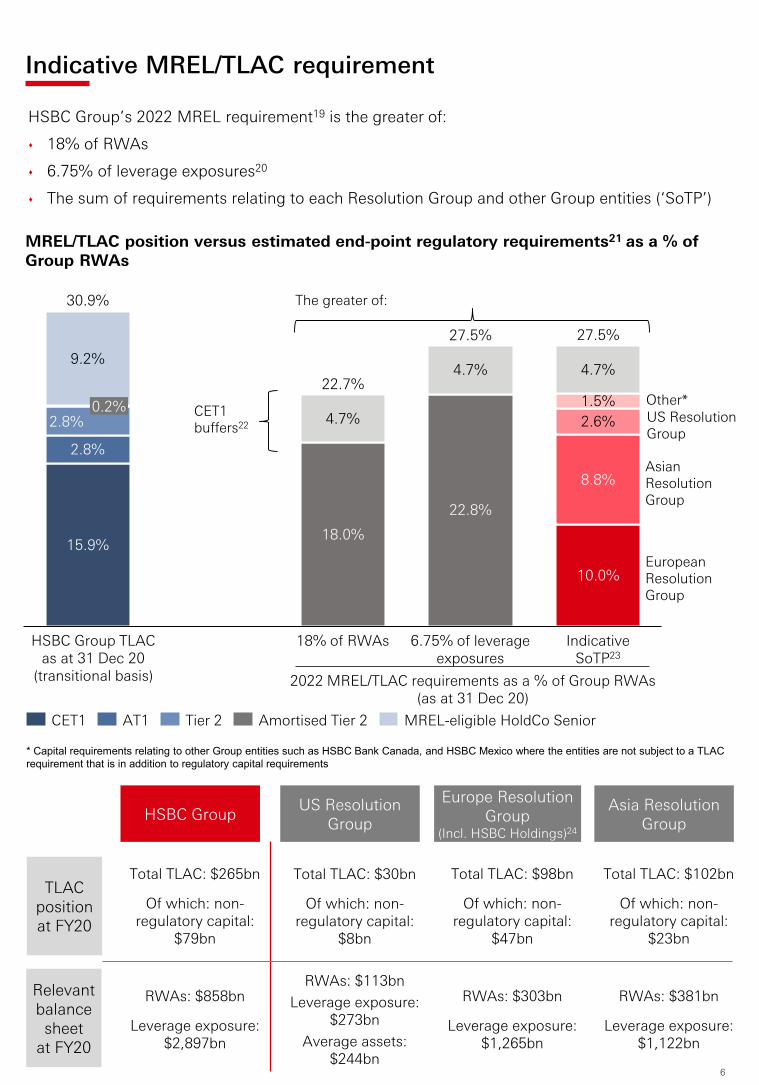
Indicative MREL/TLAC requirement
* Capital requirements relating to other Group entities such as HSBC Bank Canada, and HSBC Mexico where the entities are not subject to a TLAC requirement that is in addition to regulatory capital requirements
18.0%15.9%
2.8%
18% of RWAs
2.8% 4.7%0.2%
9.2%
22.8%
4.7%
6.75% of leverage exposures
2.6%
10.0%
8.8%
1.5%
4.7%
IndicativeSoTP23
30.9%
22.7%
27.5% 27.5%
MREL/TLAC position versus estimated end-point regulatory requirements21 as a % of Group RWAs
(transitional basis) 2022 MREL/TLAC requirements as a % of Group RWAs (as at 31 Dec 20)
CET1 buffers22
Other*
European Resolution Group
Asian Resolution Group
US Resolution Group
The greater of:
HSBC Group’s 2022 MREL requirement19 is the greater of:
18% of RWAs
6.75% of leverage exposures20
The sum of requirements relating to each Resolution Group and other Group entities (‘SoTP’)
Europe Resolution Group
(Incl. HSBC Holdings)24
Asia Resolution Group
TLAC position at FY20
Total TLAC: $102bn
Of which: non-regulatory capital:
$23bn
Total TLAC: $98bn
Of which: non-regulatory capital:
$47bn
Relevant balance sheet
at FY20
RWAs: $381bn
Leverage exposure: $1,122bn
RWAs: $303bn
Leverage exposure: $1,265bn
US Resolution Group
Total TLAC: $30bn
Of which: non-regulatory capital:
$8bn
RWAs: $113bnLeverage exposure:
$273bnAverage assets:
$244bn
HSBC Group
Total TLAC: $265bn
Of which: non-regulatory capital:
$79bn
RWAs: $858bn
Leverage exposure: $2,897bn
6
7
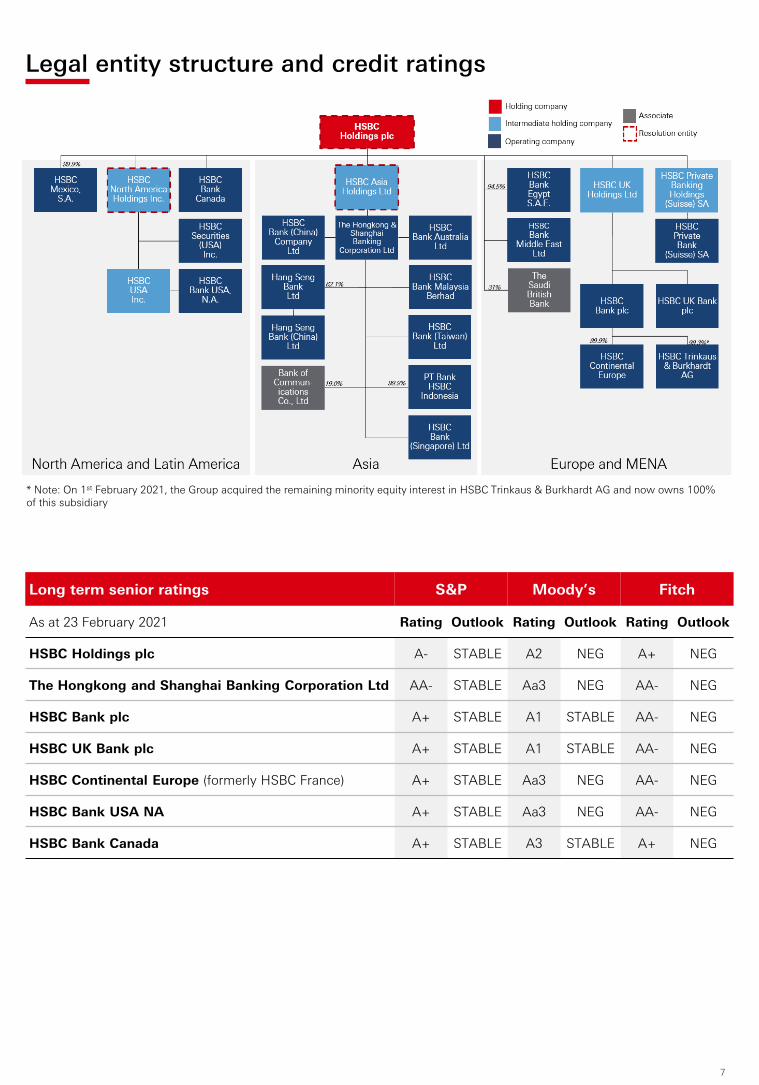
* Note: On 1st February 2021, the Group acquired the remaining minority equity interest in HSBC Trinkaus & Burkhardt AG and now owns 100% of this subsidiary
Legal entity structure and credit ratings
Long term senior ratings S&P Moody’s Fitch
As at 23 February 2021 Rating Outlook Rating Outlook Rating Outlook
HSBC Holdings plc A- STABLE A2 NEG A+ NEG
The Hongkong and Shanghai Banking Corporation Ltd AA- STABLE Aa3 NEG AA- NEG
Footnotes1. The issuance plan is guidance only; it is a point in time assessment and subject to change2. To next call date if callable; otherwise to maturity. Included in FY21 maturities/calls are $1.95bn of Tier 2 instruments3. Calculation is based on adjusted revenue of our global businesses excluding Corporate Centre, which is also excluded from the total adjusted
revenue number4. Regional percentage compositions calculated with regional figures that include intra-Group revenue. Intra-Group revenue is excluded from the
total Group revenue number5. UK RFB: HSBC UK Bank plc, the UK ring-fenced bank; NRFB: HSBC Bank plc, the non-ring-fenced bank in Europe and the UK6. Based on tangible equity of the Group’s major legal entities excluding Associates, Holdings Companies, consolidation adjustments, and any
potential inorganic actions7. Medium-term defined as 3-4 years; long-term is defined as 5-6 years8. WPB TE as a share of TE allocated to the Global Businesses (excluding Corporate Centre). Excludes Holdings Companies, consolidation
adjustments and any potential inorganic actions9. 2015-19 adjusted revenue CAGR10. We intend to transition towards a target payout ratio of between 40% and 55% of reported earnings per ordinary share (‘EPS’) from 2022
onwards, with the flexibility to adjust EPS for non-cash significant items, such as goodwill or intangibles impairments11. Should the Group find itself in an excess capital position absent compelling investment opportunities to deploy that excess12. The Group will review whether to revert to paying quarterly dividends at or ahead of its 2021 results announcement in February 202213. Unless otherwise stated, regulatory capital ratios and requirements are based on the transitional arrangements of the Capital Requirements
Regulation in force at the time. These include the regulatory transitional arrangements for IFRS 9 ‘Financial Instruments’. Following the end of the transition period after the UK’s withdrawal from the EU, any reference to EU regulations and directives (including technical standards) should be read as a reference to the UK’s version of such regulation and/or directive, as onshored into UK law under the European Union (Withdrawal) Act 2018
14. Leverage ratio at 31 December 2020 is calculated using the CRR II end-point basis for additional tier 1 capital and the CRR regulatory transitional arrangements for IFRS9; Leverage ratio includes CET1 benefit from the change in treatment of software assets, however the impact is immaterial
15. ‘Others’ includes items with no currency information available ($56,729m for loans to customers and $5m for customer accounts)16. CET1 capital and buffers as at 31 December 2020; and subject to change17. Numbers presented under the transitional arrangements in CRR II for capital instruments18. Numbers presented after the expiry of the transitional arrangements in CRR II for capital instruments. For the avoidance of doubt, the end
point numbers do include the benefit of the regulatory transitional arrangements for IFRS 919. The Bank of England has written to HSBC confirming the preferred resolution strategy for HSBC Group remains a multiple-point-of-entry
(‘MPE’) resolution strategy and setting out the minimum requirements for 2021 and 2022 external MREL requirements applicable to the HSBC Group
20. Leverage exposure is calculated as the higher of either the requirements as defined in the Capital Requirements Regulation or the PRA’s leverage ratio framework
21. Minimum requirement for own funds and eligible liabilities (MREL) consists of a minimum level of own funds and eligible debt liabilities that will need to be maintained pursuant to a direction from the Bank of England in the exercise of its powers under the Banking Act 2009, with the purpose of absorbing losses and recapitalising an institution upon failure whilst ensuring the continuation of critical economic functions.
22. Group CET1 buffers are shown in addition to the MREL requirements. The buffers shown in addition to the RWA, leverage and SoTPTLAC/MREL requirement are calculated in accordance with the PRA Supervisory statement 16/16 updated in December 2017
23. Indicative SoTP derived per HSBC’s current understanding of regulatory guidance. The requirement will change over time as the TLAC requirements of our subsidiaries change per regulatory rules, any BoE MREL recalibration in 2021, and as we gain further clarity on the components of end-state requirements across the Group
24. Investments by the European resolution group in the regulatory capital or TLAC of other group companies are deducted25. YTD, annualised. RoTE by Global Business excludes significant items and the UK bank levy. RoTE methodology annualises Profits Attributable
to Shareholders, including ECL, in order to provide a returns metric. RoTE by Global Business for 4Q20 considers AT1 Coupons on an accruals basis, vs. Reported RoTE where it is treated on a cash basis
The information, statements and opinions set out in this presentation and accompanying discussion (“this Presentation”) are forinformational and reference purposes only and do not constitute a public offer for the purposes of any applicable law or an offer tosell or solicitation of any offer to purchase any securities or other financial instruments or any advice or recommendation in respectof such securities or other financial instruments.
This Presentation, which does not purport to be comprehensive nor render any form of legal, tax, investment, accounting, financialor other advice, has been provided by HSBC Holdings plc (together with its consolidated subsidiaries, the “Group”) and has notbeen independently verified by any person. You should consult your own advisers as to legal, tax investment, accounting, financialor other related matters concerning any investment in any securities. No responsibility, liability or obligation (whether in tort,contract or otherwise) is accepted by the Group or any member of the Group or any of their affiliates or any of its or their officers,employees, agents or advisers (each an “Identified Person”) as to or in relation to this Presentation (including the accuracy,completeness or sufficiency thereof) or any other written or oral information made available or any errors contained therein oromissions therefrom, and any such liability is expressly disclaimed.
No representations or warranties, express or implied, are given by any Identified Person as to, and no reliance should be placed on,the accuracy or completeness of any information contained in this Presentation, any other written or oral information provided inconnection therewith or any data which such information generates. No Identified Person undertakes, or is under any obligation, toprovide the recipient with access to any additional information, to update, revise or supplement this Presentation or any additionalinformation or to remedy any inaccuracies in or omissions from this Presentation. Past performance is not necessarily indicative offuture results. Differences between past performance and actual results may be material and adverse.
Forward-looking statements
This Presentation may contain projections, estimates, forecasts, targets, opinions, prospects, results, returns and forward-lookingstatements with respect to the financial condition, results of operations, capital position, strategy and business of the Group whichcan be identified by the use of forward-looking terminology such as “may”, “will”, “should”, “expect”, “anticipate”, “project”,“plan”, “estimate”, “seek”, “intend”, “target” or “believe” or the negatives thereof or other variations thereon or comparableterminology (together, “forward-looking statements”), including the strategic priorities and any financial, investment and capitaltargets described herein. Any such forward-looking statements are not a reliable indicator of future performance, as they mayinvolve significant stated or implied assumptions and subjective judgements which may or may not prove to be correct. There canbe no assurance that any of the matters set out in forward-looking statements are attainable, will actually occur or will be realisedor are complete or accurate. The assumptions and judgments may prove to be incorrect and involve known and unknown risks,uncertainties, contingencies and other important factors, many of which are outside the control of the Group. Actual achievements,results, performance or other future events or conditions may differ materially from those stated, implied and/or reflected in anyforward-looking statements due to a variety of risks, uncertainties and other factors (including without limitation those which arereferable to general market conditions, regulatory changes or due to the impact of the Covid-19 outbreak). Any such forward-looking statements are based on the beliefs, expectations and opinions of the Group at the date the statements are made, and theGroup does not assume, and hereby disclaims, any obligation or duty to update, revise or supplement them if circumstances ormanagement’s beliefs, expectations or opinions should change. For these reasons, recipients should not place reliance on, and arecautioned about relying on, any forward-looking statements. No representations or warranties, expressed or implied, are given byor on behalf of the Group as to the achievement or reasonableness of any projections, estimates, forecasts, targets, prospects orreturns contained herein.
Additional detailed information concerning important factors that could cause actual results to differ materially from thisPresentation is available in our Annual Report and Accounts for the fiscal year ended 31 December 2019 filed with the Securitiesand Exchange Commission (the “SEC”) on Form 20-F on 19 February 2020 (the “2019 Form 20-F”), our 1Q 2020 Earnings Releasefurnished to the SEC on Form 6-K on 28 April 2020 (the “1Q 2020 Earnings Release”), our Interim Financial Report for the sixmonths ended 30 June 2020 furnished to the SEC on Form 6-K on 3 August 2020 (the “2020 Interim Report”), our 3Q 2020 EarningsRelease furnished to the SEC on Form 6-K on 27 October 2020 (the “Q3 2020 Earnings Release”) as well as in our Annual Reportand Accounts for the fiscal year ended 31 December 2020 available at www.hsbc.com and which we expect to file with the SEC onForm 20-F on 24 February 2021 (the “2020 Form 20-F”).
Alternative Performance Measures
This Presentation contains non-IFRS measures used by management internally that constitute alternative performance measuresunder European Securities and Markets Authority guidance and non-GAAP financial measures defined in and presented inaccordance with SEC rules and regulations (“Alternative Performance Measures”). The primary Alternative Performance Measureswe use are presented on an “adjusted performance” basis which is computed by adjusting reported results for the period-on-periodeffects of foreign currency translation differences and significant items which distort period-on-period comparisons. Significantitems are those items which management and investors would ordinarily identify and consider separately when assessingperformance in order to better understand the underlying trends in the business.
Reconciliations between Alternative Performance Measures and the most directly comparable measures under IFRS are provided inour 2019 Form 20-F, our 1Q 2020 Earnings Release, our 2020 Interim Report, our 3Q 2020 Earnings Release and our 2020 Form 20-F, when filed, each of which are available at www.hsbc.com.
Information in this Presentation was prepared as at 23 February 2021.