66
R.C.S. Luxembourg B 147 223 16, boulevard d’Avranches L-1160 Luxembourg Grand Duchy of Luxembourg HSBC Portfolios Audited Annual Report for the year ended 31 July 2019

R.C.S. Luxembourg B 147 223 16, boulevard d’Avranches L-1160 Luxembourg Grand Duchy of Luxembourg
HSBC Portfolios Audited Annual Report for the year ended 31 July 2019

Audited annual report for the year from 1 August 2018 to 31 July 2019
Société d'Investissement à Capital Variable (SICAV), Luxembourg

No subscription can be received on the basis of financial reports. Subscriptions are only valid if made on the basis of the current Prospectus
accompanied by the latest annual and the most recent semi-annual report, if published thereafter.
Audited report for the year ended 31 July 2019.

Table of Contents General Information 2
Directors’ Report 6
Audit report 9
Statement of Net Assets as at 31 July 2019 12
Statement of Operations for the year ended 31 July 2019 13
Statement of Changes in Net Assets for the year ended 31 July 2019 14
Statement of Changes in Shares Issued 15
Statistical Information 19
Notes to the Financial Statements 22
Schedules of Investments and Other Net Assets as at 31 July 2019
HSBC Portfolios - World Selection 1 36
HSBC Portfolios - World Selection 2 42
HSBC Portfolios - World Selection 3 48
HSBC Portfolios - World Selection 4 54
HSBC Portfolios - World Selection 5 55
Appendix I (Unaudited Additional Disclosures) – Taxation of the Company (foreign countries) 56
Appendix II (Unaudited Additional Disclosures) – UK SORP Disclosure 57
Appendix III (Unaudited Additional Disclosures) – Fund Holiday Calendar for 2019 60
Appendix IV (Unaudited Additional Disclosures) – Publication of TER (Total Expense Ratio) 61
Appendix V (Unaudited Additional Disclosures) – Securities Financing Transactions
Regulation (“SFTR”) 62

2
General Information
Directors George Efthimiou (Chairman), Global Chief Operating Officer
HSBC Global Asset Management Limited
8 Canada Square, Canary Wharf,
London E14 5HQ, United Kingdom
Dr. Michael Boehm, Chief Operating Officer
HSBC Global Asset Management (Deutschland) GmbH
Königsallee 21/23, 40212 Düsseldorf, Germany
Eimear Cowhey, Independent Director
Resident in the Republic of Ireland
Peter Dew, Independent Director
Resident in the United Kingdom
Jean de Courrèges, Independent Director
Resident in Grand Duchy of Luxembourg
John Li, Independent Director
The Directors Office
19 Rue de Bitbourg, L-1273, Luxembourg
Matteo Pardi, Chief Executive Officer
HSBC Global Asset Management (France)
Immeuble “Coeur Défense” - Tour A
110 Esplanade du Général de Gaulle - La Défense 4
75419 Paris, Cedex 08, France
Anthony Jeffs, Head of Product Platforms
HSBC Global Asset Management Limited
8 Canada Square, Canary Wharf,
London E14 5HQ, United Kingdom

General Information (continued)
3
Registered Office 16, boulevard d’Avranches
L-1160 Luxembourg
Grand Duchy of Luxembourg
Administration Agent,
Depositary Bank,
Paying Agent, Corporate and
Domiciliary Agent, Registrar and
Transfer Agent
HSBC France, Luxembourg Branch (from 1 March 2019)
HSBC Bank Plc, Luxembourg Branch (until 28 February 2019)
16, boulevard d’Avranches
L-1160 Luxembourg
Grand Duchy of Luxembourg
Management Company HSBC Investment Funds (Luxembourg) S.A.
16, boulevard d’Avranches
L-1160 Luxembourg
Grand Duchy of Luxembourg
Auditor PricewaterhouseCoopers, Société coopérative
2, rue Gerhard Mercator, B.P.1443, L-1014 Luxembourg,
Grand Duchy of Luxembourg
Legal Advisers Elvinger Hoss Prussen, Société anonyme
2, Place Winston Churchill
L-1340 Luxembourg
Grand Duchy of Luxembourg
Investment Advisers HSBC Global Asset Management (UK) Limited
8 Canada Square
London E14 5HQ
United Kingdom
Distributors and Representatives Global Distributor
HSBC Investment Funds (Luxembourg) S.A.
16, boulevard d’Avranches
L-1160 Luxembourg
Grand Duchy of Luxembourg
Austria and Eastern Europe Distributor
HSBC Trinkaus & Burkhardt AG
Königsallee 21/23
D-40212 Düsseldorf
Germany

General Information (continued)
4
Distributors and Representatives
(continued)
Continental Europe Distributor
HSBC Global Asset Management (France)
Immeuble “Coeur Défense” - Tour A
110 Esplanade du Général de Gaulle - La Défense 4
75419 Paris, Cedex 08, France
Hong Kong Representative and Distributor
HSBC Investment Funds (Hong Kong) Limited
HSBC Main Building, 1 Queen’s Road Central
Hong Kong
Singapore Representative and Distributor
HSBC Global Asset Management (Singapore) Limited
21 Collyer Quay, #06-01 HSBC Building
Singapore 049320
Singapore
United Kingdom Representative and Distributor
HSBC Global Asset Management (UK) Limited
8 Canada Square
London E14 5HQ
United Kingdom
Malta Distributor
HSBC Global Asset Management (Malta) Ltd
80 Mill Street,
Qormi, QRM 3101
Malta
North America and South America Distributor
HSBC Securities (USA) Inc
452 Fifth Avenue, New York, 10018,
United States
Poland Representative
ProService Agent Transferowy Sp. Z.o.o.
436 Pulawska Street,
Warszawa
Poland

General Information (continued)
5
Note on the risk management
HSBC Investment Funds (Luxembourg) S.A. (the “Management Company”) uses a risk management process that allows monitoring of the risk of
the portfolio positions and their share of the overall risk profile of the portfolios of HSBC Portfolios (the “Company”) at any time. In accordance
with the Law of 17 December 2010 on undertakings for collective investment, as amended (the “2010 Law”), and the applicable regulatory
requirements of the Commission de Surveillance du Secteur Financier (“CSSF”), the Management Company reports to the CSSF on a regular
basis on the risk management process. The Management Company shall monitor, on the basis of appropriate and reasonable methods, that the
Company’s global exposure relating to derivative instruments does not exceed the total net asset value of its portfolio.
For the Company, the Management Company uses the “commitment approach” for the calculation of the global exposure. The “commitment
approach” is based on converting the value of each financial derivative instrument position into the market value of an equivalent position in the
underlying asset of that derivative. Netting and hedging might be considered for derivative financial instruments and their underlying assets. The
sum of these underlying equivalents must not exceed the net asset value of the portfolio.
Statement of changes in the investment portfolio
A list, specifying for each portfolio total purchases and sales transacted during the year under review, may be obtained, upon request, at the
registered office of the Company.

6
Directors’ Report Directors’ Comments
The Board of Directors present the Audited Annual Report for HSBC Portfolios (the “Company”) for the year ending 31 July 2019.
The Company
The Company is a variable capital investment company, incorporated under the laws of the Grand Duchy of Luxembourg and is organized as an
“umbrella” with a number of Portfolios, each of which has their own investment policies and restrictions. At present, the Company has issued shares in 5 Portfolios. During the year, total net assets of the Company decreased from USD 3,586.96 million to USD 2,991.94 million at year end.
The Company qualifies as an Undertaking for Collective Investments in Transferable Securities under Directive 2009/65/EC of 13 July 2009, as amended, and may therefore be offered for sale in European Union Member States, subject to registration in countries other than the Grand Duchy
of Luxembourg. In addition, applications to register the Company and its Portfolios may be made in other countries. The Company and its Portfolios are currently registered for offer and distribution in the Grand Duchy of Luxembourg and in the following jurisdictions: Bahrain, Brunei, France, Germany, Greece, Guernsey, Hong Kong, Isle of Man, Japan, Jersey, Jordan, Lebanon, Macau, Malta, Oman, Qatar, Singapore, United Arab
Emirates, United Kingdom and Vietnam.
The Portfolios
Each Portfolio is managed to a specific risk profile.
World Selection 1 - Aims to provide long term return by investing in a portfolio of fixed income and securities consistent with a low risk investment strategy.
World Selection 2 - Aims to provide long term return by investing in a portfolio of fixed income and securities consistent with a low to medium risk investment strategy.
World Selection 3 - Aims to provide long term return by investing in a portfolio of fixed income and securities consistent with a medium risk investment strategy.
World Selection 4 - Aims to provide long term return by investing in a portfolio of fixed income and securities consistent with a medium to high risk investment strategy.
World Selection 5 - Aims to provide long term return by investing in a portfolio of fixed income and securities consistent with a high risk investment strategy.
Responsibility of the Directors
The responsibility of the Directors of the Company is governed exclusively by Luxembourg law. With respect to these financial statements, the duties of the Directors are governed by general corporate law and the law of 19 December 2002 on, inter alia, the accounting and annual accounts
of undertakings, as amended, and by the law of 17 December 2010, as amended, relating to undertakings for collective investments.
Remuneration Policy
HSBC Investment Funds (Luxembourg) S.A. (“HIFL”) has implemented a remuneration policy pursuant to Directive 2014/91/EU of the European Parliament and of the Council of 23 July 2014 amending Directive 2009/65/EC on the coordination of laws, regulations and administrative
provisions relating to undertakings for collective investment in transferable securities (UCITS) as regards to depositary functions, remuneration policies and sanctions (the “UCITS V Directive”), which was transposed into Luxembourg law on 1 June 2016 by way of the Luxembourg law of 10 May 2016.
The remuneration policy, which has been approved by HIFL’s board of directors, includes measures to avoid conflicts of interest and seeks to promote sound and effective risk management that neither encourages risk taking which is inconsistent with the risk profile and articles of incorporation of the Company nor impairs compliance with HIFL’s duty to act in the best interest of the Company.
The remuneration policy, which describes how remuneration and benefits are determined, is available at www.global.assetmanagement.hsbc.com/about-us/governance-structure, or on request from HIFL.
Total amount of remuneration paid by HIFL to its staff and paid by the investment advisers to their identified staff * during the 12 months period ending 31 July 2019 is as follows:
Number of beneficiaries: 23
Fixed remuneration EUR 2,149,030
Variable remuneration EUR 326,243
of which, the disclosure of the fixed and variable remuneration of senior management within HIFL and of identified staff * of the investment advisers
is:
Number of beneficiaries: 7
Fixed remuneration EUR 1,000,168
Variable remuneration EUR 234,353

7
Directors’ Report (continued) Remuneration Policy (continued)
The above amounts of remuneration include the staff of HIFL and the staff of HSBC Global Asset Management (UK) Limited involved in the investment management of HSBC Portfolios.
The annual review of the remuneration policy, including a review of the existing remuneration structure as well as implementation of the regulatory requirements and compliance with them, was completed during the year and no irregularities were identified. Furthermore, there were no material changes made to the remuneration policy in the past financial year.
* identified staff are defined as members of staff whose actions have a material impact on the risk profile of the Company
Withdrawal of the UK from the EU
On 29 March 2017, the Government of the UK formally notified the EU of its intention to leave the Union (‘‘Brexit’’). In light of this decision, HSBC has made some business changes to the entities that are providing services to the Company. These changes were communicated in a shareholder communication dated 28 January 2019. This communication advised that it had been decided to appoint HSBC France, Luxembourg Branch (“HSBC France, Luxembourg Branch”), a newly created branch of HSBC France, to provide depositary and paying agency, as well as domiciliary agency, administration, register and transfer agency services in replacement of HSBC Bank plc, Luxembourg Branch. Both HSBC France and HSBC Bank plc are subsidiaries of HSBC Holdings plc and the change is thus an intragroup transfer of HSBC Bank plc, Luxembourg Branch’s business to HSBC France, Luxembourg Branch.
The transfer of the above services to HSBC France, Luxembourg Branch took effect from 1 March 2019.
Investment management activities remain unchanged as delegation by the Company both to EU and non- EU entities remains permitted. This will include delegation to UK entities post-Brexit.
From the date of the implementation of Brexit, UK domiciled UCITS Funds (UK OEICs) will be considered as non-UCITS vehicles. Under the requirements of Art. 46 of the Luxembourg Law, the fund is prohibited from holding more than 30% of its NAV in non-UCITS vehicles at any time. The CSSF has granted a 12 months grace period, effective from the Brexit implementation date, to allow impacted investment funds sufficient time to comply with the 30% NAV limit in non-UCITS vehicles, where this limit has been exceeded as a result of UK domiciled funds losing their UCITS status. In preparation for this, the investment manager has not acquired any new positions in UK domiciled funds, however, no active selling of the UK OEICS already held has taken place. World Selection Portfolios 3, 4 and 5 currently have exposure to non-UCITS vehicles above the 30% NAV limit as at the Company’s Financial Year End.
The Company has submitted a notification to the Financial Conduct Authority for entry into the Temporary Permissions Regime, which has been established to enable European domiciled Funds to be distributed in the UK once Brexit has been implemented.
Corporate Governance Statement
The Board of Directors confirms its adoption of the principles of the ALFI (Association of the Luxembourg Fund Industry) Code of Conduct for Luxembourg Investment Funds. A copy of the Code of Conduct can be obtained at http://www.alfi.lu/sites/alfi.lu/files/ALFI-Code-of-Conduct.pdf.
Annual General Meeting
The next Annual General Meeting of the Company will be held on 29 November 2019.
Market review
Global stocks gained over the 12-month review period, overcoming severe volatility in late 2018. The US-China trade war was a key market influence, with both sides imposing tariffs and counter-tariffs. By the end of the review period, the latest round of additional tariffs on Chinese imports had been postponed, after signs of progress at the G20 summit in Japan.
While US economic indicators were reasonably resilient for most of the period, the economic outlook remained uncertain in Europe, the UK and Japan. Towards the end of the period, the US Treasury yield curve inverted, which some investors interpreted as a sign of impending recession.
The US Federal Reserve (Fed) raised interest rates twice during the first half of the review period, but subsequently kept rates on hold until July, when it made a 25-basis-point reduction – the first cut for a decade. Given the uncertainty over global economic growth, investors anticipated that the Fed’s policymakers could well cut rates again in 2019.
Other central banks appeared likely to stay dovish – the European Central Bank (ECB) has ended its quantitative easing programme, but the bank made it clear that it could reinstate supportive measures for the eurozone’s economy. The ECB also indicated that interest rates would be unlikely to be raised until the second half of 2020. On the political front, Europe’s parliamentary elections in May 2019 did not result in the populist victory some market participants had feared – the results were well received by investors, as pro-EU parties continued to hold sway.

8
Directors’ Report (continued) Market review (continued)
Elsewhere, the Bank of Japan also stayed accommodative, as Japan’s economy has yet to achieve the levels of inflation or wage growth that were apparent in the US or the UK.
Meanwhile, the Bank of England held interest rates steady at 0.75%. The UK economy continued to be overshadowed by Brexit-related uncertainty, which caused a slump in sterling, and affected business and consumer confidence. Brexit also led to bouts of uncertainty for UK equity markets, particularly later in the period, when it appeared that a ‘no deal’ scenario was more likely. Despite this, the weaker pound boosted returns for some larger constituents of the FTSE 100, as this benefited their overseas earnings.
In emerging markets, Asian equities came under particular pressure, as sentiment was affected by global trade friction and the potential consequences for manufacturing. The People’s Bank of China took steps to ease liquidity by cutting banks’ reserve requirement ratios. Policymakers also flooded the money markets with record amounts of liquidity in early 2019, fearful of banking conditions and the prospect of an economic downturn.
HSBC Portfolios - World Selection Portfolios 1-5
The MSCI All Country World Index increased by 3.1% in USD terms over the period, although this masks phases of heightened volatility. After a
gradual recovery over the summer, equity markets dropped again in Q4 2018 with US equities suffering particularly sharp falls. The weak equity
performance seen in Q4 2018 reflected investor concerns over a slowdown in the pace of global economic expansion, the US-China ‘trade-war’
and fears that the US Federal Reserve (Fed) may raise interest rates too far.
The existing position in Indian bonds was closed in August 2018 as we reviewed our emerging market local currency debt allocation. At the end
of the month, the proceeds were held in cash awaiting re-investment.
In September, we continued to adjust our exposure to emerging market debt within the wider fixed income asset allocation. Our view on hard
currency emerging market debt improved as spreads widened during previous market volatility which had made the asset class more attractive
from a valuation perspective. We therefore added to this asset class, with the proceeds coming from a combination of the closed India bond
position plus investment grade credit in the World Selection 3 portfolio and global high yield in World Selection 4 and World Selection 5.
The Strategic Asset Allocation was reviewed in December 2018, leading to a reduction in both global equities and global bonds and a new
allocation to liquid alternatives. These comprise of an allocation to style factors and trend following hedge funds in World Selection 1-3, and only
trend following hedge funds in World Selection 4 and 5. This was to provide exposure to uncorrelated assets with the aim of improving
diversification.
After a rebound at the beginning of 2019, driven by easing trade tensions and dovish comments by the Fed, which pivoted to an easing rather
than tightening policy stance, volatility returned in May on a re-escalation in the trade-war and renewed fears over slowing global growth. However,
the prospect of an increased likelihood of US rate cuts to support a slowing US economy, combined with renewed hope for progress in the trade
talks between the US and China, led to a strong recovery in June 2019.
In January 2019, we added a position in US index-linked (TIPS) from conventional bonds as we believed the market was mispricing inflation risk
and bought a new holding in US financials out of the broader US equity allocation. At the time, US Financials looked oversold and we anticipated
an improving outlook amid tightening Fed policy.
In February 2019, we closed the allocation to US financials following the change in tone from the Fed, with the proceeds reinvested into the wider
US allocation. A position in China A shares (onshore equities) was also added out of the broader emerging market allocation due to attractive
valuations. Finally, our allocation to liquid alternatives was completed with a further allocation to trend following hedge funds.
In March 2019, we reduced duration whilst maintaining yield by switching some of the “Fallen Angels” position into short duration high yield.
Following strong outperformance since purchase, we took some profits from the position in the China A shares and switched back into the wider
emerging market allocation.
In April 2019, we completed trading out of the Fallen Angels position and re-invested into short duration high yield. We also implemented a small
tactical overweight in UK equity as we believed favorable valuations outweighed Brexit risks.
In May2019, we sold the remaining position in China A shares given increased market volatility in China; the proceeds were reinvested into US
equities. We also introduced a new position in Indian bonds, out of the existing allocation to emerging market bonds in local currency.
In June 2019, we reduced the allocation to emerging market and Japan equities and added to US equities to reduce portfolio risk in view of
lingering trade tensions.
The information stated in the report is historical and is not representative of future result.

PricewaterhouseCoopers, Société coopérative, 2 rue Gerhard Mercator, B.P. 1443, L-1014 LuxembourgT : +352 494848 1, F : +352 494848 2900, www.pwc.lu
Cabinet de révision agréé. Expert-comptable (autorisation gouvernementale n°10028256) R.C.S. Luxembourg B 65 477 - TVA LU25482518
9
Audit report
To the Shareholders of HSBC Portfolios
Our opinion
In our opinion, the accompanying financial statements give a true and fair view of the financial position of HSBC Portfolios (the “Fund”) and of each of its sub-funds as at 31 July 2019, and of the results of their operations and changes in their net assets for the year then ended in accordance with Luxembourg legal and regulatory requirements relating to the preparation and presentation of the financial statements.
What we have audited
The Fund’s financial statements comprise:
the statement of net assets as at 31 July 2019; the schedule of investments and other net assets as at 31 July 2019; the statement of operations for the year then ended; the statement of changes in net assets for the year then ended; and the notes to the financial statements, which include a summary of significant accounting policies.
Basis for opinion
We conducted our audit in accordance with the Law of 23 July 2016 on the audit profession (Law of 23 July 2016) and with International Standards on Auditing (ISAs) as adopted for Luxembourg by the “Commission de Surveillance du Secteur Financier” (CSSF). Our responsibilities under the Law of 23 July 2016 and ISAs as adopted for Luxembourg by the CSSF are further described in the “Responsibilities of the “Réviseur d’entreprises agréé” for the audit of the financial statements” section of our report.
We believe that the audit evidence we have obtained is sufficient and appropriate to provide a basis for our opinion.
We are independent of the Fund in accordance with the International Ethics Standards Board for Accountants’ Code of Ethics for Professional Accountants (IESBA Code) as adopted for Luxembourg by the CSSF together with the ethical requirements that are relevant to our audit of the financial statements. We have fulfilled our other ethical responsibilities under those ethical requirements.
Other information
The Board of Directors of the Fund is responsible for the other information. The other information comprises the information stated in the annual report but does not include the financial statements and our audit report thereon.
Our opinion on the financial statements does not cover the other information and we do not express any form of assurance conclusion thereon.

10
In connection with our audit of the financial statements, our responsibility is to read the other information identified above and, in doing so, consider whether the other information is materially inconsistent with the financial statements or our knowledge obtained in the audit, or otherwise appears to be materially misstated. If, based on the work we have performed, we conclude that there is a material misstatement of this other information, we are required to report that fact. We have nothing to report in this regard.
Responsibilities of the Board of Directors of the Fund for the financial statements
The Board of Directors of the Fund is responsible for the preparation and fair presentation of the financial statements in accordance with Luxembourg legal and regulatory requirements relating to the preparation and presentation of the financial statements, and for such internal control as the Board of Directors of the Fund determines is necessary to enable the preparation of financial statements that are free from material misstatement, whether due to fraud or error.
In preparing the financial statements, the Board of Directors of the Fund is responsible for assessing the Fund’s and each of its sub-funds' ability to continue as a going concern, disclosing, as applicable, matters related to going concern and using the going concern basis of accounting unless the Board of Directors of the Fund either intends to liquidate the Fund or close any of its sub-funds or to cease operations, or has no realistic alternative but to do so.
Responsibilities of the “Réviseur d’entreprises agréé” for the audit of the financial statements
The objectives of our audit are to obtain reasonable assurance about whether the financial statements as a whole are free from material misstatement, whether due to fraud or error, and to issue an audit report that includes our opinion. Reasonable assurance is a high level of assurance, but is not a guarantee that an audit conducted in accordance with the Law of 23 July 2016 and with ISAs as adopted for Luxembourg by the CSSF will always detect a material misstatement when it exists. Misstatements can arise from fraud or error and are considered material if, individually or in the aggregate, they could reasonably be expected to influence the economic decisions of users taken on the basis of these financial statements.
As part of an audit in accordance with the Law of 23 July 2016 and with ISAs as adopted for Luxembourg by the CSSF, we exercise professional judgment and maintain professional scepticism throughout the audit. We also:
identify and assess the risks of material misstatement of the financial statements, whether due to fraud or error, design and perform audit procedures responsive to those risks, and obtain audit evidence that is sufficient and appropriate to provide a basis for our opinion. The risk of not detecting a material misstatement resulting from fraud is higher than for one resulting from error, as fraud may involve collusion, forgery, intentional omissions, misrepresentations, or the override of internal control;
obtain an understanding of internal control relevant to the audit in order to design audit procedures that are appropriate in the circumstances, but not for the purpose of expressing an opinion on the effectiveness of the Fund’s internal control;
evaluate the appropriateness of accounting policies used and the reasonableness of accounting estimates and related disclosures made by the Board of Directors of the Fund;

__l1]
PW“ ,o conclude on the appropriateness of the Board of Directors of the Fund's use of the going concernbasis of accounting and, based on the audit evidence obtained, whether a material uncertainty existsrelated to events or conditions that may cast significant doubt on the Fund's or any of its sub-funds‘ability to continue as a going concern. If we conclude that a material uncertainty exists, we are
‘ required to draw attention in our audit report to the related disclosures in the financial statements or,if such disclosures are inadequate, to modify our opinion. Our conclusions are based on the auditevidence obtained up to the date of our audit report. However, future events or conditions may causethe Fund or any of its sub-funds to cease to continue as a going concern;
o evaluate the overall presentation, structure and content of the financial statements, including thedisclosures, and whether the financial statements represent the underlying transactions and eventsin a manner that achieves fair presentation.
We communicate with those charged with governance regarding, among other matters, the plannedscope and timing of the audit and significant audit findings, including any significant deficiencies ininternal control that we identify during our audit.
Pricewaterhousecoopers, Société coopérative Luxembourg, 5 November 2019Represented by
C, (,\irF_.Christelle Crépin
11

12
Statement of Net Assets as at 31 July 2019
The accompanying notes form an integral part of these financial statements.
HSBC Portfolios HSBC Portfolios HSBC Portfolios HSBC Portfolios HSBC Portfolios
Notes Combined World Selection 1 World Selection 2 World Selection 3 World Selection 4 World Selection 5
USD USD USD USD USD USD
ASSETS
Investments in securities at cost 2,663,451,855 418,600,930 528,428,675 798,533,461 641,080,224 276,808,565
Unrealised appreciation 251,805,005 22,364,834 37,117,983 76,734,338 77,463,050 38,124,800
Investments in securities at market value 3 b 2,915,256,860 440,965,764 565,546,658 875,267,799 718,543,274 314,933,365
Net unrealised gain on forw ard foreign exchange contracts 3 b, 6 583,189 583,189 - - - -
Net unrealised appreciation on futures contracts 3 b, 7 2,307,755 356,084 403,639 739,412 458,805 349,815
OTHER ASSETS
Cash at bank and at broker 83,406,758 17,566,731 18,620,037 25,645,992 16,440,618 5,133,380
Amounts receivable on sale of Investments 7,573,986 440,579 1,511,807 4,358,721 - 1,262,879
Amounts receivable on subscriptions 12,396,828 5,753,643 2,789,727 3,136,923 588,082 128,453
Dividend and interest receivable, net 6,832,119 1,654,847 1,909,086 1,715,368 1,102,290 450,528
TOTAL OTHER ASSETS 110,209,691 25,415,800 24,830,657 34,857,004 18,130,990 6,975,240
TOTAL ASSETS 3,028,357,495 467,320,837 590,780,954 910,864,215 737,133,069 322,258,420
LIABILITIES
Net unrealised loss on forw ard foreign exchange contracts 3 b, 6 9,234,082 - 1,751,241 3,587,703 2,779,557 1,115,581
Bank overdraft 3,857,595 2,929,372 125,503 668,805 69,186 64,729
Amounts payable on purchase of investments 5,141,263 1,029,535 554,941 3,556,787 - -
Amounts payable on redemptions 13,776,772 4,266,515 2,472,465 5,146,913 1,212,870 678,009
Management fees payable 2,837,166 377,595 482,370 888,677 735,182 353,342
Accounts payable and accrued expenses 413,625 59,672 79,367 131,636 88,868 54,082
Dividends payable 3 g, 8 1,157,872 249,970 296,914 463,030 118,001 29,957
TOTAL LIABILITIES 36,418,375 8,912,659 5,762,801 14,443,551 5,003,664 2,295,700
TOTAL NET ASSETS 2,991,939,120 458,408,178 585,018,153 896,420,664 732,129,405 319,962,720
TWO YEAR ASSET SUMMARY
31 July 2018 3,586,961,327 506,298,839 690,395,503 1,145,129,015 854,309,914 390,828,056
31 July 2017 2,800,834,487 473,953,198 566,840,362 768,871,689 717,578,704 273,590,534

13
Statement of Operationsfor the year ended 31 July 2019
The accompanying notes form an integral part of these financial statements.
HSBC Portfolios HSBC Portfolios HSBC Portfolios HSBC Portfolios HSBC Portfolios
Notes Combined World Selection 1 World Selection 2 World Selection 3 World Selection 4 World Selection 5
USD USD USD USD USD USD
INCOME
Income from investments 3 c 55,109,466 8,947,247 14,049,677 18,086,497 10,910,853 3,115,192
Deposit interest 722,210 143,064 163,605 182,041 167,961 65,539
TOTAL INCOME 55,831,676 9,090,311 14,213,282 18,268,538 11,078,814 3,180,731
EXPENSES
Management fees 4 a 36,121,149 4,721,997 6,176,485 11,839,884 8,976,711 4,406,072
Operating, administrative and servicing expenses 4 b 5,646,819 879,855 1,107,442 1,662,537 1,317,524 679,461
Bank interest and charges 29,091 7,786 9,317 8,305 1,065 2,618
TOTAL EXPENSES 41,797,059 5,609,638 7,293,244 13,510,726 10,295,300 5,088,151
NET OPERATING PROFIT / (LOSS) FOR THE YEAR 14,034,617 3,480,673 6,920,038 4,757,812 783,514 (1,907,420)
14
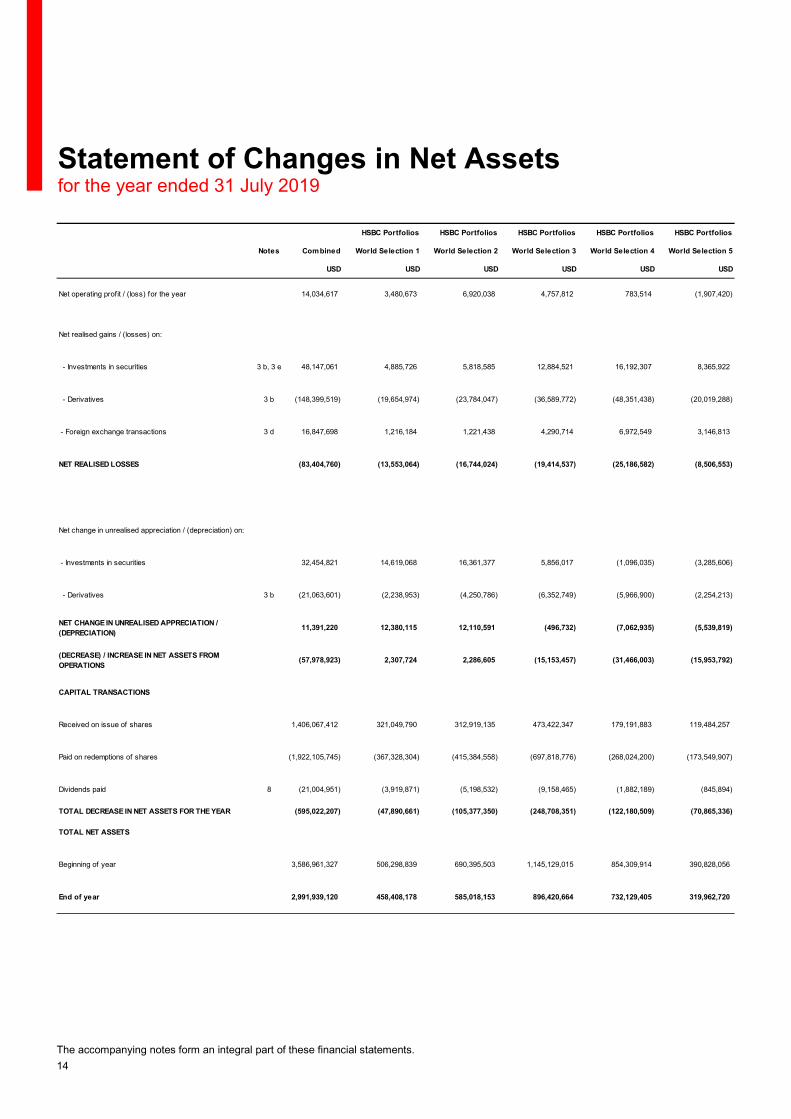
Statement of Changes in Net Assetsfor the year ended 31 July 2019
The accompanying notes form an integral part of these financial statements.
HSBC Portfolios HSBC Portfolios HSBC Portfolios HSBC Portfolios HSBC Portfolios
Notes Combined World Selection 1 World Selection 2 World Selection 3 World Selection 4 World Selection 5
USD USD USD USD USD USD
Net operating profit / (loss) for the year 14,034,617 3,480,673 6,920,038 4,757,812 783,514 (1,907,420)
Net realised gains / (losses) on:
- Investments in securities 3 b, 3 e 48,147,061 4,885,726 5,818,585 12,884,521 16,192,307 8,365,922
- Derivatives 3 b (148,399,519) (19,654,974) (23,784,047) (36,589,772) (48,351,438) (20,019,288)
- Foreign exchange transactions 3 d 16,847,698 1,216,184 1,221,438 4,290,714 6,972,549 3,146,813
NET REALISED LOSSES (83,404,760) (13,553,064) (16,744,024) (19,414,537) (25,186,582) (8,506,553)
Net change in unrealised appreciation / (depreciation) on:
- Investments in securities 32,454,821 14,619,068 16,361,377 5,856,017 (1,096,035) (3,285,606)
- Derivatives 3 b (21,063,601) (2,238,953) (4,250,786) (6,352,749) (5,966,900) (2,254,213)
NET CHANGE IN UNREALISED APPRECIATION /
(DEPRECIATION)11,391,220 12,380,115 12,110,591 (496,732) (7,062,935) (5,539,819)
(DECREASE) / INCREASE IN NET ASSETS FROM
OPERATIONS (57,978,923) 2,307,724 2,286,605 (15,153,457) (31,466,003) (15,953,792)
CAPITAL TRANSACTIONS
Received on issue of shares 1,406,067,412 321,049,790 312,919,135 473,422,347 179,191,883 119,484,257
Paid on redemptions of shares (1,922,105,745) (367,328,304) (415,384,558) (697,818,776) (268,024,200) (173,549,907)
Dividends paid 8 (21,004,951) (3,919,871) (5,198,532) (9,158,465) (1,882,189) (845,894)
TOTAL DECREASE IN NET ASSETS FOR THE YEAR (595,022,207) (47,890,661) (105,377,350) (248,708,351) (122,180,509) (70,865,336)
TOTAL NET ASSETS
Beginning of year 3,586,961,327 506,298,839 690,395,503 1,145,129,015 854,309,914 390,828,056
End of year 2,991,939,120 458,408,178 585,018,153 896,420,664 732,129,405 319,962,720

15
Statement of Changes in Shares Issued for the year ended 31 July 2019
* Hedged Classes
HSBC Portfolios HSBC Portfolios HSBC Portfolios HSBC Portfolios HSBC Portfolios
World Selection 1 World Selection 2 World Selection 3 World Selection 4 World Selection 5
Class A (C) (USD)
Shares outstanding, beginning of year 7,735,297.01 12,512,381.61 22,983,173.75 11,620,866.32 7,182,911.69
Shares issued 4,937,694.31 5,098,766.73 8,289,441.54 2,539,018.13 2,610,860.37
Shares redeemed (6,154,319.04) (6,952,554.22) (12,190,436.95) (4,329,387.69) (5,389,697.00)
Shares outstanding, end of year 6,518,672.28 10,658,594.12 19,082,178.34 9,830,496.76 4,404,075.06
Class A (C) (HAUD)*
Shares outstanding, beginning of year - - 612,080.28 527,573.32 398,177.38
Shares issued - - 545,085.47 84,160.90 226,985.33
Shares redeemed - - (911,605.73) (562,400.83) (501,576.67)
Shares outstanding, end of year - - 245,560.02 49,333.39 123,586.04
Class A (C) (HEUR)*
Shares outstanding, beginning of year 16,603,512.05 15,811,927.47 16,069,980.38 27,280,826.08 10,430,053.55
Shares issued 357,340.01 1,213,834.51 1,406,212.89 1,761,645.93 1,443,618.32
Shares redeemed (3,378,270.18) (3,801,742.98) (3,065,120.38) (2,635,724.07) (698,784.38)
Shares outstanding, end of year 13,582,581.88 13,224,019.00 14,411,072.89 26,406,747.94 11,174,887.49
Class A (C) (HGBP)*
Shares outstanding, beginning of year 1,346,462.23 4,323,458.87 6,859,997.73 4,114,235.34 1,600,510.34
Shares issued 132,057.05 350,197.68 785,390.96 441,107.01 144,958.83
Shares redeemed (274,412.69) (430,385.23) (1,093,017.14) (903,565.06) (442,689.35)
Shares outstanding, end of year 1,204,106.59 4,243,271.32 6,552,371.55 3,651,777.29 1,302,779.82
Class A (C) (HSGD)*
Shares outstanding, beginning of year 1,865.69 - 42,773.09 - 5,559.50
Shares issued 335,445.31 8,247.69 1,122,624.14 14,106.49 2,120,417.38
Shares redeemed (30,071.13) (254.86) (36,976.92) - (156,426.14)
Shares outstanding, end of year 307,239.87 7,992.83 1,128,420.31 14,106.49 1,969,550.74
Class A (D) (USD)
Shares outstanding, beginning of year - 29,326.48 - - -
Shares issued - - - - -
Shares redeemed - - - - -
Shares outstanding, end of year - 29,326.48 - - -
Class A (D) (HEUR)*
Shares outstanding, beginning of year - 31,636.94 20,933.56 5,463.28 356.88
Shares issued - 470.32 1,160.89 1,680.82 272.04
Shares redeemed - (5,502.30) (1,410.37) (8.46) -
Shares outstanding, end of year - 26,604.96 20,684.08 7,135.64 628.92
Class A (D) (HGBP)*
Shares outstanding, beginning of year - 201,387.36 - - -
Shares issued - 11,386.41 - - -
Shares redeemed - (15,040.62) - - -
Shares outstanding, end of year - 197,733.15 - - -
Class A (M) (HKD)
Shares outstanding, beginning of year 34,269,760.62 28,213,854.69 73,317,079.27 25,995,503.94 9,160,352.80
Shares issued 31,842,813.14 48,179,139.16 49,000,946.06 27,291,913.07 5,793,746.28
Shares redeemed (41,007,534.09) (55,077,824.23) (86,617,121.81) (44,424,101.82) (11,087,587.50)
Shares outstanding, end of year 25,105,039.67 21,315,169.62 35,700,903.52 8,863,315.19 3,866,511.58

16
Statement of Changes in Shares Issued(continued)for the year ended 31 July 2019
* Hedged Classes
HSBC Portfolios HSBC Portfolios HSBC Portfolios HSBC Portfolios HSBC Portfolios
World Selection 1 World Selection 2 World Selection 3 World Selection 4 World Selection 5
Class A (M) (USD)
Shares outstanding, beginning of year 4,559,044.20 9,036,113.13 17,925,424.88 3,919,179.67 2,359,056.69
Shares issued 11,322,210.88 11,780,892.37 18,150,615.60 5,340,298.72 1,606,318.08
Shares redeemed (11,155,837.97) (13,758,374.00) (25,741,360.18) (6,231,728.22) (3,386,343.31)
Shares outstanding, end of year 4,725,417.11 7,058,631.50 10,334,680.30 3,027,750.17 579,031.46
Class A (M) (FLXHKD)
Shares outstanding, beginning of year - - - - -
Shares issued - - 79.05 79.11 -
Shares redeemed - - - - -
Shares outstanding, end of year - - 79.05 79.11 -
Class A (M) (FLXUSD)
Shares outstanding, beginning of year - - - - -
Shares issued - - 232.31 10.08 -
Shares redeemed - - - - -
Shares outstanding, end of year - - 232.31 10.08 -
Class A (M) (FLXHAUD)*
Shares outstanding, beginning of year - - - - -
Shares issued - - 14.02 14.03 -
Shares redeemed - - - - -
Shares outstanding, end of year - - 14.02 14.03 -
Class A (M) (FLXHEUR)*
Shares outstanding, beginning of year - - - - -
Shares issued - - 8.87 8.88 -
Shares redeemed - - - - -
Shares outstanding, end of year - - 8.87 8.88 -
Class A (M) (FLXHGBP)*
Shares outstanding, beginning of year - - - - -
Shares issued - - 7.68 7.69 -
Shares redeemed - - - - -
Shares outstanding, end of year - - 7.68 7.69 -
Class A (M) (FLXHRMB)*
Shares outstanding, beginning of year - - - - -
Shares issued - - 67.63 67.68 -
Shares redeemed - - - - -
Shares outstanding, end of year - - 67.63 67.68 -
Class A (M) (FLXHSGD)*
Shares outstanding, beginning of year - - - - -
Shares issued - - 13.62 13.63 -
Shares redeemed - - - - -
Shares outstanding, end of year - - 13.62 13.63 -
Class A (M) (HAUD)*
Shares outstanding, beginning of year 2,918,911.29 2,209,570.22 3,639,612.28 384,085.40 1,026,944.00
Shares issued 8,575,662.09 2,851,627.55 3,872,401.51 333,088.20 863,123.98
Shares redeemed (8,342,594.42) (3,987,641.45) (5,659,071.75) (472,385.03) (1,757,743.60)
Shares outstanding, end of year 3,151,978.96 1,073,556.32 1,852,942.04 244,788.57 132,324.38

17
Statement of Changes in Shares Issued(continued)for the year ended 31 July 2019
* Hedged Classes
HSBC Portfolios HSBC Portfolios HSBC Portfolios HSBC Portfolios HSBC Portfolios
World Selection 1 World Selection 2 World Selection 3 World Selection 4 World Selection 5
Class A (M) (HEUR)*
Shares outstanding, beginning of year 257,856.77 242,278.70 380,854.98 72,991.63 25,556.43
Shares issued 101,725.17 75,369.86 441,096.90 23,865.09 12,188.72
Shares redeemed (83,362.86) (244,370.78) (577,889.59) (18,951.81) (10,947.41)
Shares outstanding, end of year 276,219.08 73,277.78 244,062.29 77,904.91 26,797.74
Class A (M) (HGBP)*
Shares outstanding, beginning of year 513,438.93 414,361.80 1,182,852.94 148,422.10 75,358.74
Shares issued 1,318,025.43 936,453.57 871,761.00 95,833.64 47,361.04
Shares redeemed (619,960.85) (970,491.03) (1,300,832.07) (215,356.81) (49,921.56)
Shares outstanding, end of year 1,211,503.51 380,324.34 753,781.87 28,898.93 72,798.22
Class A (M) (HRMB)*
Shares outstanding, beginning of year - - - - -
Shares issued 5,305.33 10,387.88 675.08 674.63 674.22
Shares redeemed - - - - -
Shares outstanding, end of year 5,305.33 10,387.88 675.08 674.63 674.22
Class A (M) (HSGD)*
Shares outstanding, beginning of year 20,615.42 - 16,266.24 - 2,745.99
Shares issued 6,981.39 - 30,070.47 - 274.92
Shares redeemed (8,381.21) - (12,483.07) - (1,495.03)
Shares outstanding, end of year 19,215.60 - 33,853.64 - 1,525.88
Class B (C) (USD)
Shares outstanding, beginning of year 41,994.12 96,547.97 245,572.58 283,976.73 19,050.20
Shares issued 10,366.23 21,847.28 126,140.64 112,976.98 5,071.49
Shares redeemed (3,000.00) (0.99) (10,077.04) (13,669.04) (0.54)
Shares outstanding, end of year 49,360.35 118,394.26 361,636.18 383,284.67 24,121.15
Class B (C) (HEUR)*
Shares outstanding, beginning of year 10,002.00 68,184.70 487,993.15 19,363.00 60,284.03
Shares issued - 143,741.49 64,885.50 53,919.09 43,687.74
Shares redeemed (2.00) (572.53) (43,667.54) (4,755.56) (424.76)
Shares outstanding, end of year 10,000.00 211,353.66 509,211.11 68,526.53 103,547.01
Class B (C) (HGBP)*
Shares outstanding, beginning of year 657,345.30 1,583,758.44 2,660,611.31 968,340.15 271,300.69
Shares issued 17,495.60 95,781.40 191,726.56 153,339.22 25,017.90
Shares redeemed (108,467.23) (122,680.02) (487,408.29) (331,616.04) (72,686.07)
Shares outstanding, end of year 566,373.67 1,556,859.82 2,364,929.58 790,063.33 223,632.52
Class X (C) (HGBP)*
Shares outstanding, beginning of year - 42,715.67 - - -
Shares issued - - - - -
Shares redeemed - (26,175.37) - - -
Shares outstanding, end of year - 16,540.30 - - -
Class X (C) (HJPY)*
Shares outstanding, beginning of year - - - - -
Shares issued 158,474.61 - - - -
Shares redeemed (3,354.54) - - - -
Shares outstanding, end of year 155,120.08 - - - -

18
Statement of Changes in Shares Issued(continued)for the year ended 31 July 2019
* Hedged Classes
HSBC Portfolios HSBC Portfolios HSBC Portfolios HSBC Portfolios HSBC Portfolios
World Selection 1 World Selection 2 World Selection 3 World Selection 4 World Selection 5
Class Z (C) (HGBP)*
Shares outstanding, beginning of year - 79,471.98 - - -
Shares issued - 288.00 - - -
Shares redeemed - (4,388.00) - - -
Shares outstanding, end of year - 75,371.98 - - -
Class Z (D) (HGBP)*
Shares outstanding, beginning of year - 153,965.64 - - -
Shares issued - 1,585.46 - - -
Shares redeemed - (1,622.01) - - -
Shares outstanding, end of year - 153,929.09 - - -

19
Statistical Information
* Hedged Classes
as at
31 July
2019
as at
31 July
2018
as at
31 July
2017
HSBC Portfolios - World Selection 1
Class A (C) (USD) USD 14.4655 USD 13.6626 USD 13.4713
Class A (C) (HEUR)* EUR 12.9477 EUR 12.6545 EUR 12.8396
Class A (C) (HGBP)* GBP 13.7106 GBP 13.2195 GBP 13.2824
Class A (C) (HSGD)* SGD 11.3496 SGD 10.7064 SGD 10.6976
Class A (M) (HKD) HKD 10.3165 HKD 10.1111 HKD 10.2281
Class A (M) (USD) USD 10.2124 USD 9.9852 USD 10.1487
Class A (M) (HAUD)* AUD 10.0266 AUD 9.8557 AUD 10.0618
Class A (M) (HEUR)* EUR 9.9496 EUR 9.7782 EUR 9.9941
Class A (M) (HGBP)* GBP 9.9934 GBP 9.8137 GBP 10.0145
Class A (M) (HRMB)* CNH 10.5761 - -
Class A (M) (HSGD)* SGD 9.8855 SGD 9.6948 SGD 9.9165
Class B (C) (USD) USD 11.9806 USD 11.2665 USD 11.0612
Class B (C) (HEUR)* EUR 10.9952 EUR 10.6983 EUR 10.8100
Class B (C) (HGBP)* GBP 12.1313 GBP 11.6451 GBP 11.6371
Class X (C) (HJPY)* JPY 10,679.7347 - -
HSBC Portfolios - World Selection 2
Class A (C) (USD) USD 15.2037 USD 14.3582 USD 14.0718
Class A (C) (HEUR)* EUR 13.5609 EUR 13.2555 EUR 13.3731
Class A (C) (HGBP)* GBP 14.2927 GBP 13.7933 GBP 13.7841
Class A (C) (HSGD)* SGD 10.7273 - -
Class A (D) (USD) USD 11.7411 USD 11.2085 USD 11.0991
Class A (D) (HEUR)* EUR 10.4218 EUR 10.2932 EUR 10.4730
Class A (D) (HGBP)* GBP 11.0557 GBP 10.7876 GBP 10.8727
Class A (M) (HKD) HKD 10.3798 HKD 10.2045 HKD 10.2935
Class A (M) (USD) USD 10.2728 USD 10.0728 USD 10.2060
Class A (M) (HAUD)* AUD 10.0998 AUD 9.9639 AUD 10.1478
Class A (M) (HEUR)* EUR 9.9343 EUR 9.7995 EUR 9.9850
Class A (M) (HGBP)* GBP 9.9064 GBP 9.7636 GBP 9.9398
Class A (M) (HRMB)* CNH 10.3577 - -
Class B (C) (USD) USD 12.8577 USD 12.0823 USD 11.7876
Class B (C) (HEUR)* EUR 11.0901 EUR 10.7866 EUR 10.8328
Class B (C) (HGBP)* GBP 12.8008 GBP 12.2896 GBP 12.2119
Class X (C) (HGBP)* GBP 11.5783 GBP 11.1193 GBP 11.0520
Class X (D) (HGBP)* - - GBP 10.9184
Class Z (C) (HGBP)* GBP 11.7990 GBP 11.2736 GBP 11.1505
Class Z (D) (HGBP)* GBP 11.1517 GBP 10.8869 GBP 10.9593
Net Asset Value per Share

20
Statistical Information (continued)
* Hedged Classes
as at
31 July
2019
as at
31 July
2018
as at
31 July
2017
HSBC Portfolios - World Selection 3
Class A (C) (USD) USD 16.0072 USD 15.3948 USD 14.7584
Class A (C) (HAUD)* AUD 12.6258 AUD 12.3145 AUD 11.8729
Class A (C) (HEUR)* EUR 14.2375 EUR 14.1764 EUR 14.0015
Class A (C) (HGBP)* GBP 14.9592 GBP 14.7231 GBP 14.4004
Class A (C) (HSGD)* SGD 11.6166 SGD 11.2931 SGD 10.9798
Class A (D) (HEUR)* EUR 10.7688 EUR 10.7635 EUR 10.6730
Class A (M) (HKD) HKD 10.4360 HKD 10.4339 HKD 10.2887
Class A (M) (USD) USD 10.3319 USD 10.3043 USD 10.2077
Class A (M) (FLXHKD) HKD 100.6990 - -
Class A (M) (FLXUSD) USD 103.5147 - -
Class A (M) (FLXHAUD)* AUD 100.7666 - -
Class A (M) (FLXHEUR)* EUR 100.7223 - -
Class A (M) (FLXHGBP)* GBP 100.7572 - -
Class A (M) (FLXHRMB)* CNH 100.9501 - -
Class A (M) (FLXHSGD)* SGD 100.8654 - -
Class A (M) (HAUD)* AUD 10.0662 AUD 10.1117 AUD 10.0752
Class A (M) (HEUR)* EUR 10.0496 EUR 10.0851 EUR 10.0523
Class A (M) (HGBP)* GBP 9.9371 GBP 9.9773 GBP 9.9599
Class A (M) (HRMB)* CNH 10.3133 - -
Class A (M) (HSGD)* SGD 10.0022 SGD 10.0129 SGD 9.9886
Class B (C) (USD) USD 13.6706 USD 13.0690 USD 12.4546
Class B (C) (HEUR)* EUR 12.2397 EUR 12.1117 EUR 11.8931
Class B (C) (HGBP)* GBP 13.5531 GBP 13.2565 GBP 12.8940
HSBC Portfolios - World Selection 4
Class A (C) (USD) USD 16.5187 USD 16.0791 USD 15.1403
Class A (C) (HAUD)* AUD 12.8874 AUD 12.7305 AUD 12.0579
Class A (C) (HEUR)* EUR 14.7276 EUR 14.8490 EUR 14.4026
Class A (C) (HGBP)* GBP 15.4224 GBP 15.3731 GBP 14.7798
Class A (C) (HSGD)* SGD 11.0010 - -
Class A (D) (HEUR)* EUR 11.8369 EUR 11.9425 EUR 11.6099
Class A (M) (HKD) HKD 10.5396 HKD 10.6372 HKD 10.2919
Class A (M) (USD) USD 10.4423 USD 10.5139 USD 10.2195
Class A (M) (FLXHKD) HKD 100.1244 - -
Class A (M) (FLXUSD) USD 100.3835 - -
Class A (M) (FLXHAUD)* AUD 100.1712 - -
Class A (M) (FLXHEUR)* EUR 100.1283 - -
Class A (M) (FLXHGBP)* GBP 100.1586 - -
Class A (M) (FLXHRMB)* CNH 100.3625 - -
Class A (M) (FLXHSGD)* SGD 100.2907 - -
Class A (M) (HAUD)* AUD 14.6269 AUD 14.8405 AUD 14.5325
Class A (M) (HEUR)* EUR 10.2022 EUR 10.3346 EUR 10.1146
Class A (M) (HGBP)* GBP 10.0513 GBP 10.1914 GBP 9.9643
Class A (M) (HRMB)* CNH 10.3114 - -
Class B (C) (USD) USD 13.6252 USD 13.1825 USD 12.3379
Class B (C) (HEUR)* EUR 11.5250 EUR 11.5525 EUR 11.1460
Class B (C) (HGBP)* GBP 14.2202 GBP 14.0804 GBP 13.4617
Net Asset Value per Share

21
Statistical Information (continued)
* Hedged Classes
as at
31 July
2019
as at
31 July
2018
as at
31 July
2017
HSBC Portfolios - World Selection 5
Class A (C) (USD) USD 16.7280 USD 16.3284 USD 15.1987
Class A (C) (HAUD)* AUD 12.9531 AUD 12.8409 AUD 12.0330
Class A (C) (HEUR)* EUR 14.8787 EUR 15.0423 EUR 14.4276
Class A (C) (HGBP)* GBP 15.4914 GBP 15.4817 GBP 14.7283
Class A (C) (HSGD)* SGD 11.0101 SGD 10.8637 SGD 10.2527
Class A (D) (HEUR)* EUR 10.8978 EUR 11.0228 EUR 10.5781
Class A (M) (HKD) HKD 10.7248 HKD 10.8288 HKD 10.3296
Class A (M) (USD) USD 10.6149 USD 10.6916 USD 10.2471
Class A (M) (HRMB)* CNH 10.3286 - -
Class A (M) (HAUD)* AUD 10.2707 AUD 10.4239 AUD 10.0525
Class A (M) (HEUR)* EUR 10.2438 EUR 10.3829 EUR 10.0242
Class A (M) (HGBP)* GBP 10.2306 GBP 10.3721 GBP 10.0056
Class A (M) (HSGD)* SGD 10.2401 SGD 10.3478 SGD 9.9865
Class B (C) (USD) USD 12.7296 USD 12.3536 USD 11.4311
Class B (C) (HEUR)* EUR 12.8319 EUR 12.8927 EUR 12.2895
Class B (C) (HGBP)* GBP 14.9831 GBP 14.8747 GBP 14.0574
Net Asset Value per Share

22
Notes to the Financial Statementsfor the year ended 31 July 2019
1. General Information
The Company was incorporated under the laws of the Grand Duchy of Luxembourg as an investment company (Société d’Investissement à
Capital Variable or “SICAV”) on 21 July 2009 with different compartments (hereafter called a “Portfolio”). Within each Portfolio, various Classes
of Shares may be issued. Each Portfolio consists of securities, cash and other sundry assets and liabilities. The accompanying Financial
Statements present the assets and liabilities of the individual Portfolios and of the Company taken as a whole. The Financial Statements of each
individual Portfolio are expressed in the currency designated in the prospectus for that particular Portfolio and the Financial Statements of the
Company are expressed in US Dollar (“USD”). The financial statements have been prepared in accordance with the format prescribed by the
Luxembourg authorities for Luxembourg investment companies under the going concern basis of accounting.
The Company is an officially registered investment fund under Part I of the 2010 Law, as amended and qualifies as a UCITS fund under the
amended European directive 2009/65/EC.
The Company seeks to provide a comprehensive range of Portfolios with the purpose of spreading investment risk and satisfying the requirements
of investors seeking to emphasise income, capital conservation and/or capital growth.
The Company offers investors, within the same vehicle, a choice of investments in one or more Portfolios. The Company may issue different
Classes of Shares in one or several Portfolios. Details of the characteristics of such share classes, if and when offered, by one or several Portfolios
will be determined by the Directors of the Company (the “Directors” and each a “Director”).
As at 31 July 2019, the Company was comprised of the following Portfolios:
HSBC Portfolios - World Selection 1
HSBC Portfolios - World Selection 2
HSBC Portfolios - World Selection 3
HSBC Portfolios - World Selection 4
HSBC Portfolios - World Selection 5
2. Share Capital
The Company currently offers the following classes of shares:
Class Description
Class A A Shares are available to all investors.
Class B B Shares are available to sub-distributors who are prohibited from accepting and retaining inducements from third parties under applicable laws and regulations or court rulings, such as in the United Kingdom or the Netherlands; or
sub-distributors who have a separate fee arrangement with their clients in relation to the provision of investment services and activities (for example, in the European Union, services and activities performed under MiFID II) and who have opted to not accept and retain inducements from third parties.
Class E E Shares will be available in certain countries, subject to the relevant regulatory approval, through specific distributors selected by the Distributor on application to the Company.
Class S* S Shares are available through distributors selected by the Distributor provided that the investors qualify as institutional investors within the meaning of article 174 of the 2010 Law, as amended.
Class X X Shares are available through distributors selected by the Distributor provided that the investors qualify as institutional investors within the meaning of article 174 of the 2010 Law, as amended.
Class Z Z Shares are available to investors having entered into a discretionary management agreement with an HSBC Group entity and to investors subscribing via distributors selected by the Distributor provided that such investors qualify as institutional investors within the meaning of article 174 of 2010 Law, as amended.
* Successive issue of Classes S Shares are numbered 1, 2, 3, etc. and respectively referred to as S1, S2, S3 etc. A series of Class S Shares may
be issued in one or more Portfolios and each series may or may not be available in all Portfolios.
Within each share class of a Portfolio, the Company is entitled to create different sub-classes, distinguished by their class name, by their
distribution policy (Capital-Accumulation (“C”), Distribution (“D”), Quarterly Distribution (“Q”) and Monthly Distribution (“M”) shares), their reference
currency, their hedging activity (“H”) and/or by any other criterion to be stipulated by the Board of Directors of the Company.

Notes to the Financial Statementsfor the year ended 31 July 2019 (continued)
23
2. Share Capital (continued)
Within each share class of a Portfolio, separate currency hedged classes may be issued (suffixed by “H” and the currency into which the Base
Currency is hedged e.g. “HEUR” or “HGBP”) which seek to minimise the effect of currency fluctuations between the reference currency of the
share class and the base currency of the relevant Portfolio. Any fees relating to the execution of the currency hedging policy will be borne by the
relevant currency hedged class.
Within each share class of a Portfolio, Pay-Out share classes may be offered as Fixed Pay-Out shares (suffixed by “FIX”) and Flexible Pay-Out
shares (suffixed by “FLX”). The dividend rate on Fixed Pay-Out shares is based upon a pre-determined fixed percentage of the net asset value
per share. The dividend rate on Flexible Pay-Out shares is based upon the Portfolio’s long-term expected income and net capital gains (both
realised and unrealised) (the “Expected Return”) which is attributable to the Flexible Pay-Out shares. Dividends will be paid gross of fees and
expenses and may be paid gross of taxes. The “Excepted Return” will vary over time and consequently the dividend rate will be adjusted. The
Board of Directors may decide, as its discretion, to make adjustments to the dividend rate at any time on each share class.
Within each share class of a Portfolio, the Management Company may decide to issue share classes having a different reference currency than
the base currency of the Portfolio and which denotes the currency in which the net asset value per share of the share class will be calculated. A
share class' reference currency is identified by a standard international currency acronym added as a suffix e.g. “ACEUR” for a Capital
Accumulation Share class expressed in Euro”.
Investment Minima:
* or equivalent to USD amount in any other Dealing Currencies or Share Class Reference Currencies.
3. Accounting Policies
The following accounting policies have been used consistently in dealing with items which are considered material in relation to the Company’s
financial statements.
a) Accounting convention
The financial statements have been prepared under the historical cost convention modified by the revaluation of investments.
b) Assets and portfolio securities valuation
Securities are initially recognised at cost, being the fair value of the consideration given.
All purchases and sales of securities are recognised on the trade date, i.e. the date the Company commits to purchase or sell the security.
Portfolio securities and/or financial derivative instruments which are listed on an official stock exchange are valued at the last available stock price.
Where such securities or other assets are quoted or dealt in on more than one stock exchange or other organised markets, the Board of Directors
shall select the principal of such stock exchanges or markets for such purposes. Shares or units in undertakings for collective investment the
issue or redemption of which is restricted and in respect of which a secondary market is maintained by dealers who, as principal market-makers,
offer prices in response to market conditions may be valued by the Board of Directors in line with such prices.
Shares or units in open-ended undertakings for collective investment, which do not have a price quotation on a regulated market, will be valued
at the actual net asset value for such shares or units as of the relevant dealing day, failing which they shall be valued at the last available net
asset value which is calculated prior to such dealing day. In the case where events have occurred which have resulted in a material change in the
net asset value of such shares or units since the last net asset value was calculated, the value of such shares or units may be adjusted at their
fair value in order to reflect, in the reasonable opinion of the Board of Directors, such change.
Class of Shares A, B and E* S1 * X and Z*
Dealing Currency USD EUR GBP USD EUR GBP USD EUR GBP
Minimum initial investment and minimum holding
5,000 5,000 5,000 10,000,000 10,000,000 10,000,000 1,000,000 1,000,000 1,000,000
Minimum subsequent investment
1,000 1,000 1,000 1,000,000 1,000,000 1,000,000 100,000 100,000 100,000

Notes to the Financial Statementsfor the year ended 31 July 2019 (continued)
24
3. Accounting Policies (continued)
b) Assets and portfolio securities valuation (continued)
The financial derivative instruments which are not listed on any official stock exchange or traded on any other organised market are valued in a
reliable and verifiable manner on a daily basis and verified by a competent professional appointed by the Company.
The Financial Statements are presented on the basis of the net asset value calculated on 31 July 2019.
Futures Contracts
Upon entering into a futures contract, the Company is required to deposit with the broker, cash or securities in an amount equal to a certain percentage
of the contract amount which is referred to as the initial margin account. Subsequent payments, referred to as variation margin, are made or received
by each Portfolio periodically and are based on changes in the market value of open futures contracts.
The unrealised appreciation on future contracts is disclosed in the statement of net assets under “Unrealised appreciation on future contracts”. Changes
in the market value of open futures contracts are recorded as “Net change in unrealised appreciation/(depreciation) on derivatives” in the statement of
changes in net assets. Realised gains or losses, representing the difference between the value of the contract at the time it was opened and the value
at the time it was closed, are reported at the closing or expiration of futures contracts in the statement of changes in net assets under “Net realised
gains/(losses) on derivatives”. Securities deposited as initial margin account are designated in the statement of investments and cash deposited is
recorded under cash at bank and at broker in the statement of net assets. A receivable and/or a payable to brokers for the daily variation margin is also
recorded in the statement of net assets.
Forward Foreign Exchange Contracts
The values of the forward foreign currency exchange contracts are adjusted daily based on the applicable exchange rate of the underlying currency.
Changes in the value of these contracts are recorded as unrealised appreciation or depreciation until the contract settlement date. When the forward
contract is closed, the Portfolio records a realised gain or loss equal to the difference between the value at the time the contract was opened and the
value at the time it was closed.
The unrealised appreciation/(depreciation) on forward foreign exchange contracts is disclosed in the statement of net assets under “Unrealised
gain/(loss) on forward foreign exchange contracts”. Realised gains/(losses) and change in unrealised appreciation/(depreciation) resulting there from
are included in the statement of changes in net assets respectively under “Net realised gains/(losses) on derivatives” and “Net change in unrealised
appreciation/(depreciation) on derivatives”.
c) Income and Expenses
Interest is accrued on a day-to-day basis. Dividends are accounted for on an ex-dividend basis.
Expenses are recognised on an accrual basis.
d) Foreign Exchange
The cost of investments, income and expenses in currencies other than the Company relevant reporting currency have been recorded at the rate
of exchange ruling at the time of the transaction. The market value of the investments and other assets and liabilities in currencies other than the
relevant reporting currency has been converted at the rates of exchange ruling at the date of these financial statements. The exchange rates used
as at 31 July 2019 are as follows:
USD/AUD : 1.45085
USD/CAD : 1.31315
USD/CNH : 6.89140
USD/CNY : 6.88550
USD/DKK : 6.70665
USD/EUR : 0.89815
USD/GBP : 0.81669
USD/HKD : 7.82790
USD/JPY : 108.57500
USD/SEK : 9.59315
USD/SGD : 1.36855
Notes to the Financial Statementsfor the year ended 31 July 2019 (continued)
25
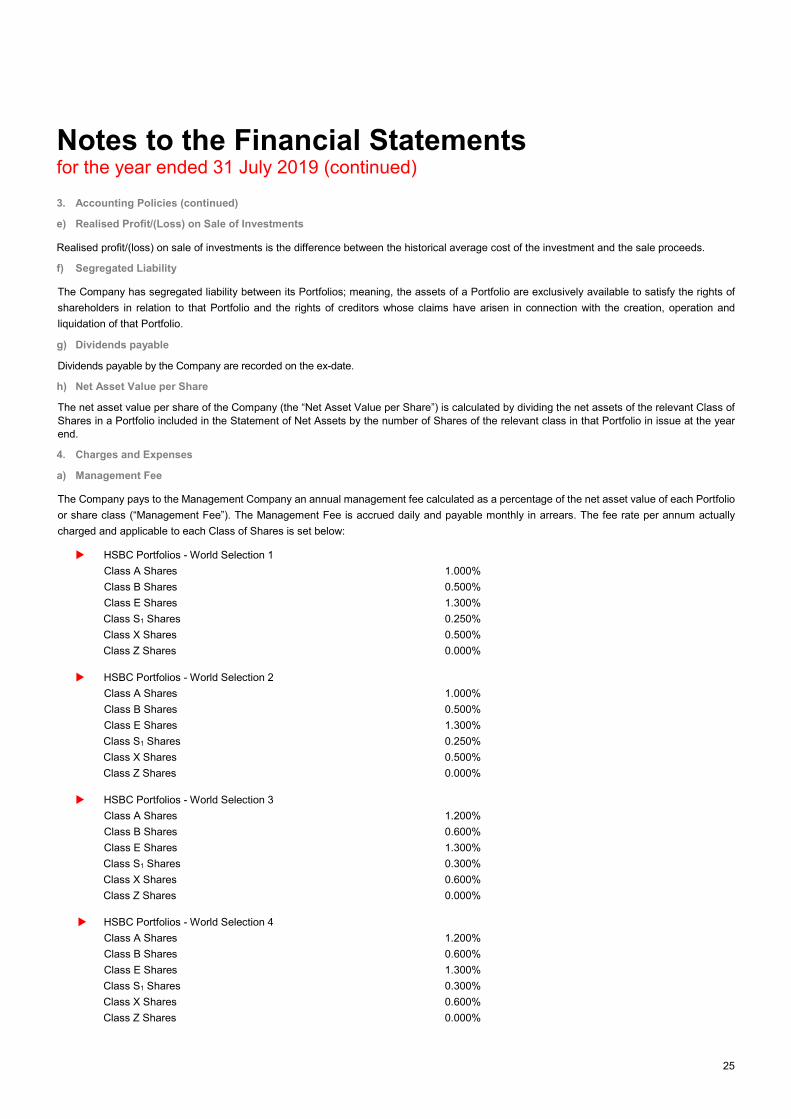
3. Accounting Policies (continued)
e) Realised Profit/(Loss) on Sale of Investments
Realised profit/(loss) on sale of investments is the difference between the historical average cost of the investment and the sale proceeds.
f) Segregated Liability
The Company has segregated liability between its Portfolios; meaning, the assets of a Portfolio are exclusively available to satisfy the rights of
shareholders in relation to that Portfolio and the rights of creditors whose claims have arisen in connection with the creation, operation and
liquidation of that Portfolio.
g) Dividends payable
Dividends payable by the Company are recorded on the ex-date.
h) Net Asset Value per Share
The net asset value per share of the Company (the “Net Asset Value per Share”) is calculated by dividing the net assets of the relevant Class of
Shares in a Portfolio included in the Statement of Net Assets by the number of Shares of the relevant class in that Portfolio in issue at the year end.
4. Charges and Expenses
a) Management Fee
The Company pays to the Management Company an annual management fee calculated as a percentage of the net asset value of each Portfolio
or share class (“Management Fee”). The Management Fee is accrued daily and payable monthly in arrears. The fee rate per annum actually
charged and applicable to each Class of Shares is set below:
HSBC Portfolios - World Selection 1
Class A Shares 1.000%
Class B Shares 0.500%
Class E Shares 1.300%
Class S1 Shares 0.250%
Class X Shares 0.500%
Class Z Shares 0.000%
HSBC Portfolios - World Selection 2
Class A Shares 1.000%
Class B Shares 0.500%
Class E Shares 1.300%
Class S1 Shares 0.250%
Class X Shares 0.500%
Class Z Shares 0.000%
HSBC Portfolios - World Selection 3
Class A Shares 1.200%
Class B Shares 0.600%
Class E Shares 1.300%
Class S1 Shares 0.300%
Class X Shares 0.600%
Class Z Shares 0.000%
HSBC Portfolios - World Selection 4
Class A Shares 1.200%
Class B Shares 0.600%
Class E Shares 1.300%
Class S1 Shares 0.300%
Class X Shares 0.600%
Class Z Shares 0.000%

Notes to the Financial Statementsfor the year ended 31 July 2019 (continued)
26
4. Charges and Expenses (continued)
a) Management Fee (continued)
HSBC Portfolios - World Selection 5
Class A Shares 1.300%
Class B Shares 0.650%
Class E Shares 1.300%
Class S1 Shares 0.325%
Class X Shares 0.650%
Class Z Shares 0.000%
The Management Fee covers management, advisory and distribution services provided in relation to the relevant Portfolio of the Company by the
Management Company, the Investment Advisers and the Share Distributors. The Management Company is responsible for discharging, out of
such fee, the fees of the Investment Advisers and the Share Distributors and may pay part of such fee to recognised intermediaries or such other
person as the Management Company may determine, at its discretion.
The Management Company may instruct the Company to pay a portion of the Management Fee directly out of the assets of the Company to any
of such service providers. In such case the Management Fee due to Management Company is reduced accordingly.
The Management Company is also acting as a management company for other investment funds, namely HSBC AdvantEdge plc, HSBC ETF plc,
HSBC Global Funds ICAV plc, HSBC Global Investment Funds, HSBC Global Liquidity plc and HSBC Islamic Funds.
The Company has invested in other HSBC promoted funds, which include the following funds:
HSBC Global Investment Funds - Global Asset Backed Bond “ZC” +
HSBC Global Investment Funds - Global Corporate Bond “ZQ”
HSBC Global Investment Funds - Global Emerging Markets Bond “ZQ”
HSBC Global Investment Funds - Global Emerging Markets Local Debt “ZQ”
HSBC Global Investment Funds - Global Government Bond “ZQ”
HSBC Global Investment Funds - Global High Yield Bond “ZQ”
HSBC Global Investment Funds - Global Real Estate Equity “ZQ”
HSBC Global Investment Funds - Global Short Duration Bond "ZQ"
HSBC Global Investment Funds - India Fixed Income "ZD"
HSBC Global Investment Funds - Multi - Asset Style Factors “ZC”
HSBC American Index “Institutional Acc”
HSBC Corporate Bond Fund "Institutional Acc"
HSBC European Index “Institutional Acc”
HSBC FTSE All Share Index "Institutional Acc"
HSBC Japan Index “Institutional Acc”
The management fee rate applicable to the above underlying funds' share classes is nil.
HSBC Economic Scale Worldwide Equity UCITS ETF (formerly HSBC ESI Worldwide Equity ETF)
HSBC Global Liquidity Funds - US Dollar Liquidity Fund “Y”
HSBC Multi Factor Worldwide Equity UCITS ETF (formerly HSBC Worldwide Equity ETF)
The above underlying funds are subject to a single fee, referred to as the “Total Expense Ratio” or “TER” which covers all fees and expenses
except transaction charges and taxes or duties for portfolio rebalancing. The maximum TER applicable to each underlying fund is 0.25% per
annum.
+ Effective from 23rd of August 2019 the name of the fund changed into HSBC Global Investment Funds - Global Investment Grade Securitised
Credit Bond.
Notes to the Financial Statementsfor the year ended 31 July 2019 (continued)
27
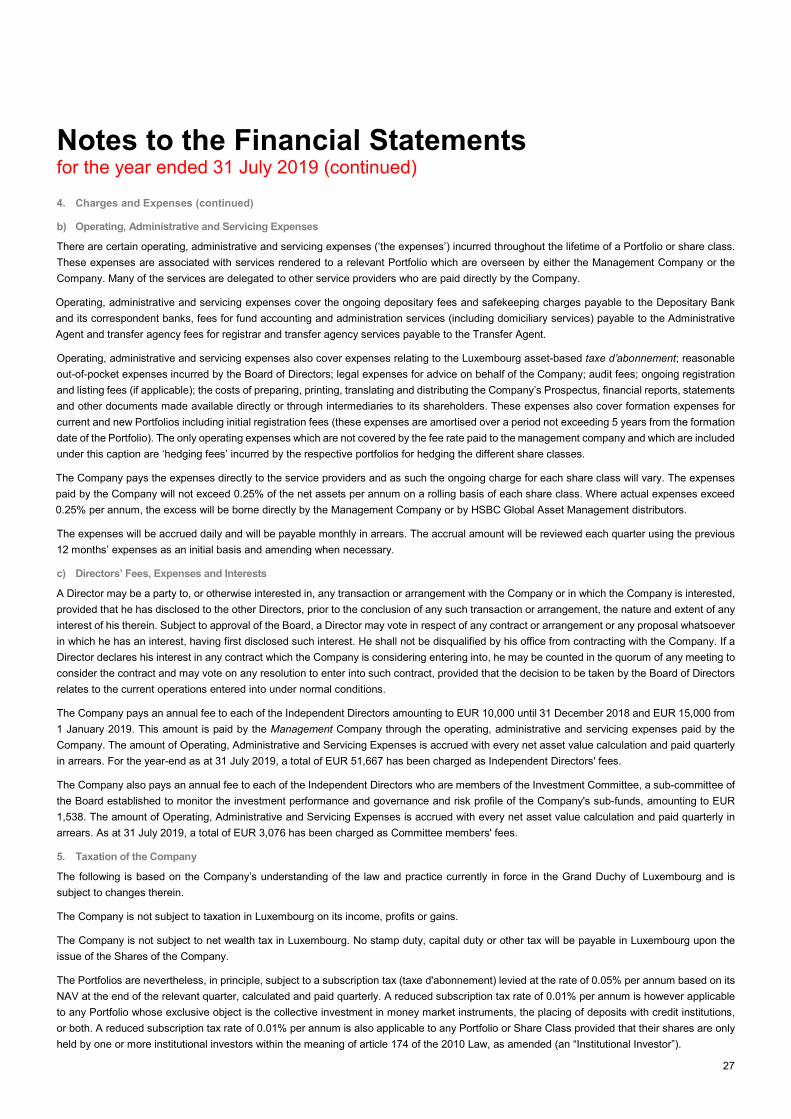
4. Charges and Expenses (continued)
b) Operating, Administrative and Servicing Expenses
There are certain operating, administrative and servicing expenses (‘the expenses’) incurred throughout the lifetime of a Portfolio or share class.
These expenses are associated with services rendered to a relevant Portfolio which are overseen by either the Management Company or the
Company. Many of the services are delegated to other service providers who are paid directly by the Company.
Operating, administrative and servicing expenses cover the ongoing depositary fees and safekeeping charges payable to the Depositary Bank
and its correspondent banks, fees for fund accounting and administration services (including domiciliary services) payable to the Administrative
Agent and transfer agency fees for registrar and transfer agency services payable to the Transfer Agent.
Operating, administrative and servicing expenses also cover expenses relating to the Luxembourg asset-based taxe d’abonnement; reasonable
out-of-pocket expenses incurred by the Board of Directors; legal expenses for advice on behalf of the Company; audit fees; ongoing registration
and listing fees (if applicable); the costs of preparing, printing, translating and distributing the Company’s Prospectus, financial reports, statements
and other documents made available directly or through intermediaries to its shareholders. These expenses also cover formation expenses for
current and new Portfolios including initial registration fees (these expenses are amortised over a period not exceeding 5 years from the formation
date of the Portfolio). The only operating expenses which are not covered by the fee rate paid to the management company and which are included
under this caption are ‘hedging fees’ incurred by the respective portfolios for hedging the different share classes.
The Company pays the expenses directly to the service providers and as such the ongoing charge for each share class will vary. The expenses
paid by the Company will not exceed 0.25% of the net assets per annum on a rolling basis of each share class. Where actual expenses exceed
0.25% per annum, the excess will be borne directly by the Management Company or by HSBC Global Asset Management distributors.
The expenses will be accrued daily and will be payable monthly in arrears. The accrual amount will be reviewed each quarter using the previous
12 months’ expenses as an initial basis and amending when necessary.
c) Directors’ Fees, Expenses and Interests
A Director may be a party to, or otherwise interested in, any transaction or arrangement with the Company or in which the Company is interested,
provided that he has disclosed to the other Directors, prior to the conclusion of any such transaction or arrangement, the nature and extent of any
interest of his therein. Subject to approval of the Board, a Director may vote in respect of any contract or arrangement or any proposal whatsoever
in which he has an interest, having first disclosed such interest. He shall not be disqualified by his office from contracting with the Company. If a
Director declares his interest in any contract which the Company is considering entering into, he may be counted in the quorum of any meeting to
consider the contract and may vote on any resolution to enter into such contract, provided that the decision to be taken by the Board of Directors
relates to the current operations entered into under normal conditions.
The Company pays an annual fee to each of the Independent Directors amounting to EUR 10,000 until 31 December 2018 and EUR 15,000 from
1 January 2019. This amount is paid by the Management Company through the operating, administrative and servicing expenses paid by the
Company. The amount of Operating, Administrative and Servicing Expenses is accrued with every net asset value calculation and paid quarterly
in arrears. For the year-end as at 31 July 2019, a total of EUR 51,667 has been charged as Independent Directors' fees.
The Company also pays an annual fee to each of the Independent Directors who are members of the Investment Committee, a sub-committee of
the Board established to monitor the investment performance and governance and risk profile of the Company's sub-funds, amounting to EUR
1,538. The amount of Operating, Administrative and Servicing Expenses is accrued with every net asset value calculation and paid quarterly in
arrears. As at 31 July 2019, a total of EUR 3,076 has been charged as Committee members' fees.
5. Taxation of the Company
The following is based on the Company’s understanding of the law and practice currently in force in the Grand Duchy of Luxembourg and is
subject to changes therein.
The Company is not subject to taxation in Luxembourg on its income, profits or gains.
The Company is not subject to net wealth tax in Luxembourg. No stamp duty, capital duty or other tax will be payable in Luxembourg upon the
issue of the Shares of the Company.
The Portfolios are nevertheless, in principle, subject to a subscription tax (taxe d'abonnement) levied at the rate of 0.05% per annum based on its
NAV at the end of the relevant quarter, calculated and paid quarterly. A reduced subscription tax rate of 0.01% per annum is however applicable
to any Portfolio whose exclusive object is the collective investment in money market instruments, the placing of deposits with credit institutions,
or both. A reduced subscription tax rate of 0.01% per annum is also applicable to any Portfolio or Share Class provided that their shares are only
held by one or more institutional investors within the meaning of article 174 of the 2010 Law, as amended (an “Institutional Investor”).

Notes to the Financial Statementsfor the year ended 31 July 2019 (continued)
28
5. Taxation of the Company (continued)
A subscription tax exemption applies to:
a) The portion of any Portfolio’s assets (prorata) invested in a Luxembourg investment fund or any of its Portfolio to the extent it is subject to the
subscription tax;
b) Any Portfolio (i) whose securities are only held by Institutional Investor(s), and (ii) whose sole object is the collective investment in money
market instruments and the placing of deposits with credit institutions, and (iii) whose weighted residual portfolio maturity does not exceed 90
days, and (iv) that have obtained the highest possible rating from a recognised rating agency. If several Share Classes are in issue in the relevant
Portfolio meeting (ii) to (iv) above, only those Share Classes meeting (i) above will benefit from this exemption;
c) Any Portfolio, whose main objective is the investment in microfinance institutions;
d) Any Portfolio, (i) whose securities are listed or traded on a stock exchange and (ii) whose exclusive object is to replicate the performance of
one or more indices. If several Share Classes are in issue in the relevant Portfolio meeting (ii) above, only those Share Classes meeting (i) above
will benefit from this exemption; and
e) Any Portfolio only held by pension funds and assimilated vehicles.
Withholding tax
Interest and dividend income received by the Company may be subject to non-recoverable withholding tax in the source countries. The Company
may further be subject to tax on the realised or unrealised capital appreciation of its assets in the countries of origin. The Company may benefit
from double tax treaties entered into by Luxembourg, which may provide for exemption from withholding tax or reduction of withholding tax rate.
Distributions made by the Company as well as liquidation proceeds and capital gains derived therefrom are not subject to withholding tax in Luxembourg.
6. Forward Foreign Exchange Contracts
As at 31 July 2019, the Company had entered into various forward foreign exchange contracts, for the purpose of portfolio and share class
hedging, which obliges the Company to deliver currencies at specified dates.
Open forward foreign exchange contracts as at 31 July 2019, are as follows:
Currency Bought Currency Sold Unrealised
Maturity Date Bought Amount Sold Amount Counterparty Gain / (Loss)
USD
HSBC Portfolios - World Selection 1
6 August 2019 CAD 8,552,000 USD (6,504,337) HSBC, Sheffield 8,772
6 August 2019 GBP 8,703,000 USD (10,597,077) NATWEST Markets 61,410
6 August 2019 USD 42,915,104 EUR (37,612,000) State Street Bank and Trust Company 1,024,353
6 August 2019 USD 10,885,217 GBP (8,561,000) HSBC, Sheffield 400,636
6 August 2019 USD 181,030 GBP (142,000) NATWEST Markets 7,124
6 August 2019 USD 4,815,940 AUD (6,864,000) HSBC, Sheffield 84,237
6 August 2019 USD 20,358,441 JPY (2,185,837,000) NATWEST Markets 220,457
6 August 2019 USD 1,108,211 DKK (7,245,000) HSBC, Sheffield 27,563
6 August 2019 USD 6,655,454 CAD (8,698,000) NATWEST Markets 31,153
6 August 2019 USD 1,691,359 SEK (15,627,000) State Street Bank and Trust Company 61,887
7 August 2019 USD 92,061 EUR (82,500) HSBC, Sheffield 169
7 August 2019 USD 18,064,472 EUR (16,063,000) NATWEST Markets 172,692
7 August 2019 USD 512,312 AUD (742,649) HSBC Bank Plc, London 318
8 August 2019 USD 5,151,219 GBP (4,069,000) NATWEST Markets 167,460
8 August 2019 USD 127,293 GBP (100,000) State Street Bank and Trust Company 4,812
8 August 2019 USD 579,261 GBP (455,000) Citibank, London 21,972
6 September 2019 USD 41,926,989 EUR (37,515,000) HSBC, Sheffield 39,502

Notes to the Financial Statementsfor the year ended 31 July 2019 (continued)
29
6. Forward Foreign Exchange Contracts (continued)
Currency Bought Currency Sold Unrealised
Maturity Date Bought Amount Sold Amount Counterparty Gain / (Loss)
USD
HSBC Portfolios - World Selection 1 (continued)
6 September 2019 USD 4,737,203 AUD (6,864,000) HSBC, Sheffield 278
6 September 2019 USD 20,185,516 JPY (2,185,837,000) HSBC, Sheffield 1,246
6 September 2019 USD 1,084,540 DKK (7,245,000) HSBC, Sheffield 971
6 September 2019 USD 1,581,116 SEK (15,095,000) Citibank, London 3,422
2,340,434
6 August 2019 AUD 6,864,000 USD (4,732,337) HSBC, Sheffield (633)
6 August 2019 CAD 146,000 USD (111,791) State Street Bank and Trust Company (599)
6 August 2019 DKK 7,245,000 USD (1,081,690) HSBC, Sheffield (1,042)
6 August 2019 EUR 37,515,000 USD (41,824,686) HSBC, Sheffield (41,969)
6 August 2019 EUR 97,000 USD (110,814) State Street Bank and Trust Company (2,779)
6 August 2019 JPY 2,185,837,000 USD (20,140,190) HSBC, Sheffield (2,206)
6 August 2019 SEK 532,000 USD (57,505) NATWEST Markets (2,032)
6 August 2019 SEK 15,095,000 USD (1,577,482) Citibank, London (3,482)
7 August 2019 AUD 32,331,462 USD (22,521,676) HSBC Bank Plc, London (231,866)
7 August 2019 CNH 56,185 USD (8,180) HSBC Bank Plc, London (27)
7 August 2019 EUR 142,000 USD (160,745) UBS, London (2,579)
7 August 2019 EUR 178,968,248 USD (199,838,272) HSBC Bank Plc, London (468,981)
7 August 2019 EUR 272,000 USD (308,956) State Street Bank and Trust Company (5,988)
7 August 2019 EUR 519,000 USD (581,257) Citibank, London (3,169)
7 August 2019 JPY 1,655,184,534 USD (15,259,840) HSBC Bank Plc, London (7,828)
7 August 2019 GBP 35,429,950 USD (44,295,055) HSBC Bank Plc, London (898,809)
7 August 2019 SGD 3,673,578 USD (2,690,673) HSBC Bank Plc, London (6,132)
21 August 2019 USD 13,696,188 EUR (12,287,264) J.P. Morgan Securities Limited (6,322)
6 September 2019 USD 10,612,812 GBP (8,703,000) NATWEST Markets (61,866)
6 September 2019 USD 6,508,149 CAD (8,552,000) HSBC, Sheffield (8,936)
(1,757,245)
HSBC Portfolios - World Selection 2
7 August 2019 USD 379,014 EUR (337,000) HSBC, Sheffield 3,647
7 August 2019 USD 57,060,962 EUR (50,745,000) NATWEST Markets 538,622
8 August 2019 USD 17,390,736 GBP (13,737,000) NATWEST Markets 565,497
8 August 2019 USD 388,243 GBP (305,000) State Street Bank and Trust Company 14,676
8 August 2019 USD 1,311,027 GBP (1,029,000) Citibank, London 50,696
1,173,138
7 August 2019 AUD 10,908,071 USD (7,598,420) HSBC Bank Plc, London (78,227)
7 August 2019 CNH 107,793 USD (15,694) HSBC Bank Plc, London (52)
7 August 2019 EUR 552,000 USD (624,869) UBS, London (10,024)
7 August 2019 EUR 182,785,261 USD (204,100,398) HSBC Bank Plc, London (478,984)
7 August 2019 EUR 2,375,000 USD (2,699,699) State Street Bank and Trust Company (54,304)
7 August 2019 EUR 1,294,000 USD (1,450,278) Citibank, London (8,955)
7 August 2019 GBP 89,331,158 USD (111,682,014) HSBC Bank Plc, London (2,265,069)
7 August 2019 SGD 85,677 USD (62,753) HSBC Bank Plc, London (143)
8 August 2019 GBP 143,000 USD (178,622) NATWEST Markets (3,474)
8 August 2019 GBP 295,000 USD (376,467) Citibank, London (15,148)
21 August 2019 USD 21,661,457 EUR (19,433,147) J.P. Morgan Securities Limited (9,999)
(2,924,379)

Notes to the Financial Statementsfor the year ended 31 July 2019 (continued)
30
6. Forward Foreign Exchange Contracts (continued)
Currency Bought Currency Sold Unrealised
Maturity Date Bought Amount Sold Amount Counterparty Gain / (Loss)
USD
HSBC Portfolios - World Selection 3
7 August 2019 USD 323,906 EUR (288,000) HSBC, Sheffield 3,117
7 August 2019 USD 26,815,193 EUR (23,845,000) NATWEST Markets 255,429
8 August 2019 USD 11,339,356 GBP (8,957,000) NATWEST Markets 368,717
8 August 2019 USD 190,939 GBP (150,000) State Street Bank and Trust Company 7,218
8 August 2019 USD 761,582 GBP (598,000) Citibank, London 29,144
663,625
7 August 2019 AUD 21,523,248 USD (14,992,815) HSBC Bank Plc, London (154,354)
7 August 2019 CNH 13,831 USD (2,014) HSBC Bank Plc, London (7)
7 August 2019 EUR 291,000 USD (329,415) UBS, London (5,284)
7 August 2019 EUR 214,524,129 USD (239,540,431) HSBC Bank Plc, London (562,155)
7 August 2019 EUR 357,000 USD (405,504) State Street Bank and Trust Company (7,860)
7 August 2019 EUR 783,000 USD (875,676) Citibank, London (3,531)
7 August 2019 GBP 137,315,946 USD (171,674,455) HSBC Bank Plc, London (3,483,515)
7 August 2019 SGD 13,448,717 USD (9,850,368) HSBC Bank Plc, London (22,448)
8 August 2019 GBP 143,000 USD (178,622) NATWEST Markets (3,474)
8 August 2019 GBP 90,000 USD (114,854) Citibank, London (4,621)
21 August 2019 USD 8,835,536 EUR (7,926,626) J.P. Morgan Securities Limited (4,079)
(4,251,328)
HSBC Portfolios - World Selection 4
7 August 2019 AUD 4,227,013 USD (2,944,482) HSBC Bank Plc, London (30,314)
7 August 2019 CNH 13,804 USD (2,010) HSBC Bank Plc, London (7)
7 August 2019 EUR 391,462,582 USD (437,112,208) HSBC Bank Plc, London (1,025,817)
7 August 2019 GBP 67,924,322 USD (84,920,007) HSBC Bank Plc, London (1,723,146)
7 August 2019 SGD 156,689 USD (114,765) HSBC Bank Plc, London (262)
7 August 2019 USD 8,774 GBP (7,173) HSBC Bank Plc, London (11)
(2,779,557)
HSBC Portfolios - World Selection 5
7 August 2019 AUD 2,965,452 USD (2,065,696) HSBC Bank Plc, London (21,267)
7 August 2019 CNH 6,988 USD (1,017) HSBC Bank Plc, London (3)
7 August 2019 EUR 168,373,476 USD (188,008,012) HSBC Bank Plc, London (441,218)
7 August 2019 GBP 24,310,752 USD (30,393,667) HSBC Bank Plc, London (616,730)
7 August 2019 SGD 21,784,813 USD (15,956,051) HSBC Bank Plc, London (36,363)
(1,115,581)

Notes to the Financial Statementsfor the year ended 31 July 2019 (continued)
31
7. Futures Contracts
As at 31 July 2019, the Company had entered in the following outstanding futures contracts. The margin accounts on these futures contracts are
recognized under the cash at bank and at broker figures in the Statement of Net Assets.
Underlying Number of Currency Commitment Maturity date Unrealised
contracts Gain / (Loss)
USD USD
HSBC Portfolios - World Selection 1
EURO BOBL 1 EUR 150,303 06/09/2019 273
EURO BUND 5 EUR 974,253 06/09/2019 20,292
EURO SCHATZ 4 EUR 500,262 06/09/2019 33
TOPIX INDEX (TOKYO) 8 JPY 1,153,304 12/09/2019 11,236
FTSE 100 INDEX 23 GBP 2,117,035 20/09/2019 68,646
MSCI EMERGING MKT INDEX 66 USD 3,414,840 20/09/2019 97,350
S&P 500 EMINI 54 USD 8,134,763 20/09/2019 253,646
2Y TREASURY NOTES USA 5 USD 1,073,379 30/09/2019 184
451,660
EURO BUXL 30YEAR BND (1) EUR (232,422) 06/09/2019 (5,823)
10Y TREASURY NOTES USA (4) USD (510,031) 19/09/2019 (1,219)
US 10Y ULTRA (41) USD (5,646,149) 19/09/2019 (46,602)
US LONG BOND (5) USD (775,703) 19/09/2019 (10,109)
US ULTRA BOND (2) USD (353,219) 19/09/2019 (10,188)
LONG GILT (4) GBP (650,404) 26/09/2019 (11,240)
5Y TREASURY NOTES USA (13) USD (1,530,395) 30/09/2019 (10,395)
(95,576)
HSBC Portfolios - World Selection 2
EURO BOBL 17 EUR 2,555,158 06/09/2019 7,476
EURO BUND 12 EUR 2,338,206 06/09/2019 53,109
TOPIX INDEX (TOKYO) 10 JPY 1,441,630 12/09/2019 14,046
10Y TREASURY NOTES USA 25 USD 3,187,695 19/09/2019 48,242
FTSE 100 INDEX 32 GBP 2,945,440 20/09/2019 95,507
MSCI EMERGING MKT INDEX 87 USD 4,501,380 20/09/2019 128,325
S&P 500 EMINI 71 USD 10,695,706 20/09/2019 333,351
680,056
EURO BUXL 30YEAR BND (2) EUR (464,844) 06/09/2019 (18,727)
EURO SCHATZ (4) EUR (500,262) 06/09/2019 (1,102)
US 10Y ULTRA (72) USD (9,915,188) 19/09/2019 (176,672)
US ULTRA BOND (7) USD (1,236,266) 19/09/2019 (30,406)
LONG GILT (13) GBP (2,113,811) 26/09/2019 (46,119)
5Y TREASURY NOTES USA (42) USD (4,944,352) 30/09/2019 (3,391)
(276,417)

Notes to the Financial Statementsfor the year ended 31 July 2019 (continued)
32
7. Futures Contracts (continued)
The broker linked to all of the above futures contracts is HSBC Bank Plc, London.
8. Dividends
The Company paid the following dividends during the year ended 31 July 2019:
Certain share classes in issue as at 31 July 2019 have had UK Reporting Fund status since 1 August 2015. Details of the share classes that have
UK Reporting Fund status can be found on the HM Revenue & Customs website (www.hmrc.gov.uk).
At the date of this Report, the status can be found at https://www.gov.uk/government/publications/offshore-funds-list-of-reporting-funds.
The Company publishes annual reportable income information that shareholders require for their UK tax returns at
www.kpmgreportingfunds.co.uk. If investors do not have access to the internet they can apply in writing at the registered office of the Company.
Underlying Number of Currency Commitment Maturity date Unrealised
contracts Gain / (Loss)
USD USD
HSBC Portfolios - World Selection 3
EURO BUND 27 EUR 5,260,964 06/09/2019 119,496
TOPIX INDEX (TOKYO) 31 JPY 4,469,054 12/09/2019 43,541
10Y TREASURY NOTES USA 19 USD 2,422,648 19/09/2019 36,664
FTSE 100 INDEX 74 GBP 6,811,329 20/09/2019 220,860
MSCI EMERGING MKT INDEX 127 USD 6,570,980 20/09/2019 187,325
S&P 500 EMINI 106 USD 15,968,238 20/09/2019 516,106
1,123,992
EURO BOBL (9) EUR (1,352,731) 06/09/2019 (6,586)
EURO BUXL 30YEAR BND (2) EUR (464,844) 06/09/2019 (18,727)
EURO SCHATZ 3 EUR 375,196 06/09/2019 (25)
US 10Y ULTRA (113) USD (15,561,336) 19/09/2019 (273,524)
US LONG BOND (1) USD (155,141) 19/09/2019 (765)
LONG GILT (22) GBP (3,577,219) 26/09/2019 (84,867)
2Y TREASURY NOTES USA 2 USD 429,352 30/09/2019 (86)
(384,580)
HSBC Portfolios - World Selection 4
TOPIX INDEX (TOKYO) 25 JPY 3,604,076 12/09/2019 35,114
FTSE 100 INDEX 58 GBP 5,338,609 20/09/2019 173,106
MSCI EMERGING MKT INDEX 104 USD 5,380,960 20/09/2019 153,400
S&P 500 EMINI 87 USD 13,106,006 20/09/2019 423,013
784,633
US 10Y ULTRA (126) USD (17,351,578) 19/09/2019 (325,828)
(325,828)
HSBC Portfolios - World Selection 5
TOPIX INDEX (TOKYO) 11 JPY 1,585,793 12/09/2019 15,450
FTSE 100 INDEX 26 GBP 2,393,170 20/09/2019 77,599
MSCI EMERGING MKT INDEX 46 USD 2,380,040 20/09/2019 67,850
S&P 500 EMINI 39 USD 5,875,106 20/09/2019 188,916
349,815

Notes to the Financial Statementsfor the year ended 31 July 2019 (continued)
33
8. Dividends (continued)
Currency Aug-
2018
Sep-
2018
Oct-
2018
Nov-
2018
Dec-
2018
Jan-
2019
Feb-
2019
Mar-
2019
Apr-
2019
May-
2019
Jun-
2019
Jul-
2019
HSBC Portfolios - World Selection 1
A (M) (HKD) USD 0.003774 0.003135 0.003908 0.003991 0.004002 0.003946 0.003608 0.003590 0.003582 0.003566 0.003552 0.003349
A (M) (USD) USD 0.029256 0.024189 0.030358 0.030865 0.031038 0.030639 0.027969 0.027821 0.027741 0.027655 0.027431 0.025991
A (M) (HAUD) USD 0.019757 0.015833 0.017699 0.019560 0.017945 0.017727 0.015464 0.015509 0.014702 0.013467 0.012957 0.009434
A (M) (HEUR) USD 0.008020 0.005116 0.005844 0.009740 0.007418 0.000837 0.005436 0.004799 - 0.001607 0.004707 -
A (M) (HGBP) USD 0.021030 0.017379 0.019768 0.022806 0.021813 0.015978 0.018084 0.017380 0.014643 0.014422 0.016651 0.010658
A (M) (HRMB) USD - - - - - - 0.004212 0.003895 0.003871 0.003861 0.004523 0.003937
A (M) (HSGD) USD 0.016136 0.013634 0.017159 0.016895 0.017894 0.016824 0.015660 0.015246 0.014250 0.014969 0.016482 0.013528
HSBC Portfolios - World Selection 2
A (D) (USD) USD - - - 0.106830 - - - - - - - -
A (D) (HEUR) USD - - - 0.107244 - - - - - - - -
A (D) (HGBP) USD - - - 0.138358 - - - - - - - -
A (M) (HKD) USD 0.004091 0.003651 0.004201 0.004264 0.004365 0.004298 0.003931 0.003912 0.003905 0.003854 0.003878 0.003676
A (M) (USD) USD 0.031703 0.028158 0.032620 0.032964 0.033836 0.033360 0.030467 0.030312 0.030230 0.029876 0.029940 0.028527
A (M) (HAUD) USD 0.021570 0.018691 0.019288 0.021109 0.019935 0.019731 0.017252 0.017263 0.016457 0.014961 0.014724 0.011142
A (M) (HEUR) USD 0.010596 0.009454 0.008083 0.011985 0.010508 0.004261 0.008206 0.007408 0.002364 0.003796 0.007532 0.000409
A (M) (HGBP) USD 0.023694 0.022102 0.022146 0.025086 0.024965 0.019478 0.021085 0.020229 0.017513 0.016787 0.019544 0.013426
A (M) (HRMB) USD - - - - - - - - 0.004153 0.004082 0.004772 0.004204
Z (D) (HGBP) USD - - - 0.279603 - - - - - - - -
HSBC Portfolios - World Selection 3
A (D) (HEUR) USD - - - 0.031590 - - - - - - - -
A (M) (HKD) USD 0.003965 0.003801 0.003973 0.004035 0.004079 0.004046 0.003807 0.003830 0.003839 0.003815 0.003874 0.003718
A (M) (USD) USD 0.030743 0.029327 0.030864 0.031207 0.031635 0.031418 0.029518 0.029688 0.029729 0.029583 0.029919 0.028864
A (M) (FLXHKD) USD - - - - - - - - - 0.055210 0.046083 0.047437
A (M) (FLXUSD) USD - - - - - - - 0.375000 0.376606 0.382798 0.369949 0.382805
A (M) (FLXHAUD) USD - - - - - - - - - 0.204447 0.194549 0.175476
A (M) (FLXHEUR) USD - - - - - - - - - 0.126582 0.155791 0.110484
A (M) (FLXHGBP) USD - - - - - - - - - 0.271895 0.285639 0.251171
A (M) (FLXHRMB) USD - - - - - - - - - 0.051239 0.056103 0.054559
A (M) (FLXHSGD) USD - - - - - - - - - 0.225308 0.234921 0.223168
A (M) (HAUD) USD 0.020670 0.019333 0.017807 0.019664 0.018203 0.018244 0.016422 0.016638 0.015935 0.014553 0.014594 0.011223
A (M) (HEUR) USD 0.008922 0.010310 0.005354 0.009941 0.007788 0.002493 0.007101 0.006496 0.001639 0.003084 0.007625 0.000612
A (M) (HGBP) USD 0.022078 0.023235 0.019418 0.022766 0.022019 0.017244 0.019745 0.019207 0.016723 0.016102 0.019515 0.013677
A (M) (HRMB) USD - - - - - - - - 0.004033 0.003993 0.004725 0.004206
A (M) (HSGD) USD 0.017062 0.017190 0.017367 0.017114 0.018283 0.017512 0.016771 0.016525 0.015632 0.016230 0.018288 0.015521
HSBC Portfolios - World Selection 4
A (D) (HEUR) USD - - - - - - - - - - - -
A (M) (HKD) USD 0.003668 0.003646 0.003611 0.003680 0.003684 0.003686 0.003500 0.003547 0.003567 0.003551 0.003633 0.003523
A (M) (USD) USD 0.028464 0.028153 0.028077 0.028486 0.028594 0.028643 0.027158 0.027513 0.027650 0.027559 0.028081 0.027364
A (M) (FLXHKD) USD - - - - - - - - - 0.058908 0.050637 0.052587
A (M) (FLXUSD) USD - - - - - - - - - 0.402000 0.396374 0.412657
A (M) (FLXHAUD) USD - - - - - - - - - 0.224533 0.220220 0.203848
A (M) (FLXHEUR) USD - - - - - - - - - 0.160488 0.200880 0.157710
A (M) (FLXHGBP) USD - - - - - - - - - 0.308496 0.333811 0.301729
A (M) (FLXHRMB) USD - - - - - - - - - 0.055558 0.061130 0.060285
A (M) (FLXHSGD) USD - - - - - - - - - 0.245992 0.262073 0.253080
A (M) (HAUD) USD 0.027319 0.026563 0.022670 0.025454 0.023082 0.023459 0.021201 0.021689 0.020771 0.018819 0.019149 0.014555
A (M) (HEUR) USD 0.005715 0.008445 0.001444 0.006728 0.004025 - 0.004312 0.003804 - 0.000364 0.005524 -
A (M) (HGBP) USD 0.018875 0.021431 0.015477 0.019290 0.018079 0.013879 0.016592 0.016248 0.013928 0.013290 0.017228 0.011695
A (M) (HRMB) USD - - - - - - - - 0.003675 0.003651 0.004400 0.003957
HSBC Portfolios - World Selection 5
A (D) (HEUR) USD - - - - - - - - - - - -
A (M) (HKD) USD 0.003428 0.003423 0.003343 0.003407 0.003404 0.003450 0.003299 0.003344 0.003368 0.003331 0.003425 0.003350
A (M) (USD) USD 0.026569 0.026402 0.025963 0.026345 0.026393 0.026782 0.025575 0.025910 0.026075 0.025827 0.026447 0.025999
A (M) (HAUD) USD 0.017483 0.017080 0.014102 0.016004 0.014348 0.014849 0.013480 0.013815 0.013186 0.011726 0.012025 0.008997
A (M) (HEUR) USD 0.002970 0.005811 - 0.003845 0.001033 - 0.002136 0.001585 - - 0.003242 -
A (M) (HGBP) USD 0.016198 0.018885 0.012435 0.016379 0.015083 0.011275 0.014297 0.013935 0.011627 0.010777 0.014968 0.009736
A (M) (HRMB) USD - - - - - - - - 0.003391 0.003353 0.004119 0.003707
A (M) (HSGD) USD 0.013819 0.014877 0.013655 0.013491 0.014387 0.014098 0.013786 0.013638 0.012823 0.013361 0.015677 0.013303

Notes to the Financial Statementsfor the year ended 31 July 2019 (continued)
34
9. Soft Commission Arrangements
The Investment Adviser of the Portfolios may from time to time receive goods and services which are paid for out of broker commissions provided
that they relate to execution and research services which meet the criteria laid down by United Kingdom’s Financial Conduct Authority Rules.
There were no soft commissions paid or accrued during the year.
10. Transactions with connected persons
(a) Bank accounts and deposits with related parties
Bank accounts are maintained and deposits are made with HSBC Bank Plc, a member of HSBC Group. Details of such bank balances and
deposits held as at 31 July 2019 and interest income earned from the deposits during the year then ended are shown below.
(b) Investment transactions with related parties
In their purchases and sales of investments, the Portfolios utilise the services of HSBC Bank Plc, a member of HSBC Group. Details of such
transactions executed during the year ended 31 July 2019 are shown below.
HSBC Portfolios - HSBC Portfolios - HSBC Portfolios - HSBC Portfolios - HSBC Portfolios -
World Selection 1 World Selection 2 World Selection 3 World Selection 4 World Selection 5
USD USD USD USD USD
HSBC Bank Plc
-Cash at bank and at broker 17,566,731 18,620,037 25,645,992 16,440,618 5,133,380
-Interest income earned
from deposits 143,064 163,605 182,041 167,961 65,539
-Bank overdraft (2,929,372) (125,503) (668,805) (69,186) (64,729)
-Interest on bank overdraft (7,726) (9,227) (8,245) (1,066) (2,558)
HSBC Portfolios - HSBC Portfolios - HSBC Portfolios - HSBC Portfolios - HSBC Portfolios -
World Selection 1 World Selection 2 World Selection 3 World Selection 4 World Selection 5
USD USD USD USD USD
HSBC Bank Plc
Total aggregate value of such
transactions during the year 705,676,457 878,491,181 1,083,606,357 492,120,186 211,498,828
Percentage of such transactions in value
to total transactions during the year 73.59% 66.95% 71.12% 66.40% 57.76%
Commission paid during the year 7,273 8,315 15,293 10,718 5,967
Average rate of commission 0.001% 0.001% 0.001% 0.002% 0.003%

Notes to the Financial Statementsfor the year ended 31 July 2019 (continued)
35
11. Transaction costs
For the year from 1 August 2018 to 31 July 2019, the Company incurred transaction costs related to purchase or sale of securities and derivative
products as follows:
The above transaction costs include costs directly linked to the acquisition or sale of investments, to the extent that such costs are shown
separately on transaction confirmations.
Transaction costs are incorporated directly in dealing prices of assets and are not reported as a separate line in the Statement of Operations.
12. Global Exposure
The global risk on derivatives has been determined according to the commitment approach during the financial year ended 31 July 2019.
13. Subsequent Events
There were no events subsequent to the annual report date which would require adjustments to or disclosures in these financial statements.
HSBC Portfolios - World Selection 1 USD 12,564
HSBC Portfolios - World Selection 2 USD 34,998
HSBC Portfolios - World Selection 3 USD 59,765
HSBC Portfolios - World Selection 4 USD 34,541
HSBC Portfolios - World Selection 5 USD 32,807

Schedule of Investments and Other Net Assets as at 31 July 2019
HSBC Portfolios - World Selection 1
Quantity/ Description Security Market Value Market Value as a Percentage
Face Value Currency USD of Net Assets %
Transferable Securities Admitted to an Official Stock Exchange Listing 170,794,782 37.26
Bonds 170,794,782 37.26
Australia 5,752,874 1.25
198,000 Australia (Govt) 2.75% 21/10/2019 AUD 136,969 0.03
1,000,000 Australia (Govt) 2.75% 21/04/2024 AUD 749,725 0.16
300,000 Australia (Govt) 3% 21/03/2047 AUD 257,685 0.06
1,760,000 Australia (Govt) 3.25% 21/04/2029 AUD 1,440,436 0.31
225,000 Australia (Govt) 3.75% 21/04/2037 AUD 207,714 0.04
280,000 Australia (Govt) 4.5% 21/04/2033 AUD 269,297 0.06
1,025,000 Australia (Govt) 4.75% 21/04/2027 AUD 897,087 0.20
1,000,000 Australia (Govt) 5.75% 15/05/2021 AUD 749,029 0.16
100,000 BHP Billiton Finance 4.75% VRN 22/04/2076 EUR 119,911 0.03
167,000 Scentre Management 3.75% 23/03/2027 USD 172,604 0.04
246,000 Sydney Airport Finance 2.75% 23/04/2024 EUR 309,978 0.07
330,000 Westpac Banking Corporation 4.11% VRN 24/07/2034 USD 336,892 0.07
55,000 Westpac Banking Corporation 4.421% 24/07/2039 USD 57,462 0.01
50,000 Westpac Banking Corporation 5% VRN Perp USD 48,085 0.01
Austria 248,167 0.05
207,000 Telekom Finanzmanagement 3.125% 03/12/2021 EUR 248,167 0.05
Belgium 1,867,274 0.41
121,000 Anheuser Busch InBev 1.5% 17/03/2025 EUR 147,139 0.03
32,000 Anheuser Busch InBev 2% 17/03/2028 EUR 40,705 0.01
50,000 Belgium (Govt) 0.8% 22/06/2025 EUR 59,926 0.02
200,000 Belgium (Govt) 0.8% 22/06/2027 EUR 242,143 0.05
340,000 Belgium (Govt) 1% 22/06/2031 EUR 422,069 0.09
100,000 Belgium (Govt) 1.7% 22/06/2050 EUR 138,436 0.03
250,000 Belgium (Govt) 2.6% 22/06/2024 EUR 322,379 0.07
164,000 Belgium (Govt) 3.75% 22/06/2045 EUR 318,940 0.07
150,000 Belgium (Govt) 3.75% 28/09/2020 EUR 175,537 0.04
Bermuda 138,441 0.03
125,000 IHS Markit 4.75% 01/08/2028 USD 138,441 0.03
Canada 6,272,782 1.37
2,172,000 Canada (Govt) 0.75% 01/09/2021 CAD 1,627,433 0.36
400,000 Canada (Govt) 1.5% 01/06/2026 CAD 305,213 0.07
130,000 Canada (Govt) 2% 01/12/2051 CAD 105,678 0.02
767,000 Canada (Govt) 2.5% 01/06/2024 CAD 612,569 0.14
2,050,000 Canada (Govt) 2.75% 01/06/2022 CAD 1,614,655 0.35
275,000 Canada (Govt) 2.75% 01/12/2064 CAD 278,167 0.06
500,000 Canada (Govt) 3.5% 01/12/2045 CAD 521,157 0.11
400,000 Canada (Govt) 5% 01/06/2037 CAD 459,189 0.10
710,000 Canada (Govt) 5.75% 01/06/2029 CAD 748,721 0.16
Cayman Islands 253,852 0.05
235,000 Park Aerospace Holdings 5.5% 15/02/2024 USD 253,852 0.05
Denmark 1,071,498 0.23
2,100,000 Denmark (Govt) 1.5% 15/11/2023 DKK 343,816 0.07
1,300,000 Denmark (Govt) 4% 15/11/2019 DKK 196,489 0.04
1,830,000 Denmark (Govt) 4.5% 15/11/2039 DKK 531,193 0.12
Finland 118,431 0.03
100,000 Sampo OYJ 1.25% 30/05/2025 EUR 118,431 0.03
France 12,653,455 2.76
100,000 ALD 1.25% 11/10/2022 EUR 116,061 0.02
100,000 AXA 3.25% VRN 28/05/2049 EUR 125,885 0.03
100,000 AXA 3.875% VRN Perp EUR 126,323 0.03
161,000 AXA 3.941% VRN Perp EUR 202,797 0.04
200,000 Banque Federative Credit Mutuel 2.375% 24/03/2026 EUR 246,621 0.05
20,000 BNP Paribas 5.75% 24/01/2022 GBP 26,995 0.01
200,000 BPCE 3% 19/07/2024 EUR 256,924 0.06
200,000 Essilor International 1.75% 09/04/2021 EUR 229,204 0.05
The accompanying notes form an integral part of these financial statements.
36

Schedule of Investments and Other Net Assets as at 31 July 2019 (continued)
HSBC Portfolios - World Selection 1
Quantity/ Description Market Value Market Value as a Percentage
Face Value USD of Net Assets %
France (continued)
455,000 France (Govt) 1.75% 25/05/2023 EUR 554,622 0.12
55,000 France (Govt) 1.75% 25/05/2066 EUR 80,363 0.02
440,000 France (Govt) 2% 25/05/2048 EUR 657,781 0.14
450,000 France (Govt) 2.25% 25/10/2022 EUR 549,950 0.12
300,000 France (Govt) 2.5% 25/05/2030 EUR 429,276 0.09
750,000 France (Govt) 3% 25/04/2022 EUR 921,361 0.20
605,000 France (Govt) 4% 25/10/2038 EUR 1,135,742 0.25
920,000 France (Govt) 8.25% 25/04/2022 EUR 1,278,945 0.28
1,000,000 French Republik (Govt) 0.75% 25/11/2028 EUR 1,216,100 0.27
100,000 HSBC France 0.2% 04/09/2021 EUR 112,371 0.02
100,000 Imerys 1.875% 31/03/2028 EUR 120,095 0.03
475,000 OAT France 4.5% 25/04/2041 EUR 977,165 0.21
960,000 OAT France 6% 25/10/2025 EUR 1,510,411 0.33
100,000 Orange 0.5% 15/01/2022 EUR 113,250 0.02
200,000 Pernod Ricard 2% 22/06/2020 EUR 227,221 0.05
425,000 RCI Banque 1.75% 10/04/2026 EUR 500,288 0.11
100,000 RTE Reseau De Transport 1% 19/10/2026 EUR 119,298 0.03
100,000 RTE Reseau De Transport 2% 18/04/2036 EUR 133,633 0.03
200,000 Sanofi 1.75% 10/09/2026 EUR 250,736 0.05
100,000 SCOR 3% VRN 08/06/2046 EUR 123,593 0.03
200,000 SCOR 5.25% VRN Perp USD 188,789 0.04
100,000 Total 3.875% VRN Perp EUR 121,655 0.03
Germany 16,413,023 3.58
254,000 Bayer 3% VRN 01/07/2075 EUR 284,751 0.06
1,239,000 Bundesrepublik Deutschland 0.25% 15/02/2029 EUR 1,477,806 0.32
1,400,000 Bundesrepublik Deutschland 1% 15/08/2025 EUR 1,723,388 0.38
118,000 Bundesrepublik Deutschland 1.25% 15/08/2048 EUR 173,416 0.04
900,000 Bundesrepublik Deutschland 1.75% 04/07/2022 EUR 1,078,201 0.23
1,370,000 Bundesrepublik Deutschland 1.75% 15/02/2024 EUR 1,703,573 0.37
785,000 Bundesrepublik Deutschland 2.5% 15/08/2046 EUR 1,436,026 0.31
2,100,000 Bundesrepublik Deutschland 3% 04/07/2020 EUR 2,418,653 0.53
500,000 Bundesrepublik Deutschland 4% 04/01/2037 EUR 966,654 0.21
1,690,000 Bundesrepublik Deutschland 4.75% 04/07/2028 EUR 2,798,797 0.61
480,000 Bundesrepublik Deutschland 4.75% 04/07/2040 EUR 1,079,470 0.24
100,000 Bundesrepublik Deutschland 5.5% 04/01/2031 EUR 188,798 0.04
231,000 Daimler 2% 25/06/2021 EUR 267,762 0.06
100,000 Deutsche Bank 1.625% 12/02/2021 EUR 112,786 0.02
150,000 Germany (Govt) 0.25% 15/02/2027 EUR 178,358 0.04
100,000 Merck KGaA 2.875% VRN 25/06/2079 EUR 118,462 0.03
223,000 Vier Gas Transport 3.125% 10/07/2023 EUR 282,019 0.06
100,000 Volkswagen Bank 2.5% 31/07/2026 EUR 124,103 0.03
Ireland 548,303 0.12
207,000 Aquarius & Investments Zurich 4.25% VRN 02/10/2043 EUR 267,026 0.06
278,000 GE Capital International Funding 4.418% 15/11/2035 USD 281,277 0.06
Israel 244,395 0.05
225,000 Israel Electric 5% 12/11/2024 USD 244,395 0.05
Italy 7,456,226 1.63
30,000 Italy (Govt) 2.8% 01/03/2067 EUR 33,501 0.01
800,000 Italy (Govt) 3.75% 01/09/2024 EUR 1,019,545 0.22
440,000 Italy (Govt) 4.25% 01/03/2020 EUR 502,631 0.11
1,000,000 Italy (Govt) 4.75% 01/09/2028 EUR 1,438,006 0.31
1,090,000 Italy (Govt) 5% 01/03/2022 EUR 1,362,339 0.30
700,000 Italy (Govt) 5% 01/08/2039 EUR 1,107,888 0.24
800,000 Italy Buoni Poliennali Del Tesoro 1.25% 01/12/2026 EUR 899,061 0.20
500,000 Italy Buoni Poliennali Del Tesoro 1.6% 01/06/2026 EUR 575,695 0.13
330,000 Italy Buoni Poliennali Del Tesoro 4.75% 01/09/2044 EUR 517,560 0.11
Japan 20,655,913 4.51
151,000,000 Japan (Govt) 0.1% 20/06/2020 JPY 1,394,311 0.31
53,000,000 Japan (Govt) 0.1% 20/09/2021 JPY 491,378 0.11
23,000,000 Japan (Govt) 0.8% 20/03/2058 JPY 243,095 0.05
130,300,000 Japan (Govt) 0.9% 20/03/2022 JPY 1,235,279 0.27
12,000,000 Japan (Govt) 1.4% 20/03/2055 JPY 148,199 0.03
The accompanying notes form an integral part of these financial statements.
37

Schedule of Investments and Other Net Assets as at 31 July 2019 (continued)
HSBC Portfolios - World Selection 1
Quantity/ Description Market Value Market Value as a Percentage
Face Value USD of Net Assets %
Japan (continued)
181,200,000 Japan (Govt) 1.7% 20/03/2044 JPY 2,232,219 0.49
275,500,000 Japan (Govt) 1.8% 20/03/2032 JPY 3,133,075 0.68
220,000,000 Japan (Govt) 1.9% 20/09/2023 JPY 2,206,595 0.48
159,500,000 Japan (Govt) 1.9% 20/09/2042 JPY 2,009,649 0.44
87,000,000 Japan (Govt) 2.1% 20/03/2024 JPY 888,786 0.19
80,000,000 Japan (Govt) 2.2% 20/12/2021 JPY 779,317 0.17
189,000,000 Japan (Govt) 2.2% 20/03/2026 JPY 2,026,395 0.44
296,800,000 Japan (Govt) 2.2% 20/09/2028 JPY 3,338,716 0.73
18,000,000 Japan (Govt) 2.5% 20/09/2036 JPY 232,723 0.05
278,000 Mitsubishi UFJ Financial Group 3.741% 07/03/2029 USD 296,176 0.07
Luxembourg 1,618,624 0.35
137,000 Aroundtown SA 4.75% VRN Perp GBP 169,469 0.04
100,000 Euroclear Investments 1.125% 07/12/2026 EUR 119,945 0.03
207,000 Glencore Finance Europe 3.375% 30/09/2020 EUR 239,906 0.05
200,000 Hannover Finance 5% VRN 30/06/2043 EUR 262,071 0.06
100,000 Heidelbergcement Finance Luxembourg 1.625% 07/04/2026 EUR 120,816 0.03
100,000 Medtronic Global Holdings 1% 02/07/2031 EUR 116,022 0.02
131,000 Medtronic Global Holdings 1.625% 07/03/2031 EUR 162,840 0.03
100,000 Medtronic Global Holdings 1.75% 02/07/2049 EUR 114,071 0.02
240,000 Novartis Finance 1.7% 14/08/2038 EUR 313,484 0.07
Mexico 506,041 0.11
200,000 América Móvil 3.125% 16/07/2022 USD 203,692 0.04
300,000 Kimberly-Clark de Mexico 3.8% 08/04/2024 USD 302,349 0.07
Netherlands 6,935,852 1.51
207,000 ABN Amro Bank 7.125% 06/07/2022 EUR 277,641 0.06
282,000 Aegon 5.625% VRN 29/12/2049 EUR 352,851 0.08
200,000 Allianz Finance 5.75% 08/07/2041 EUR 246,813 0.05
200,000 Cooperatieve Rabobank UA 6.625% VRN Perp EUR 246,015 0.05
100,000 Deutsche Telekom International 2.5% 10/10/2025 GBP 130,149 0.03
500,000 Dutch (Govt) 5.5% 15/01/2028 EUR 843,804 0.18
124,000 ELM 4.5% VRN Perp EUR 162,146 0.04
265,000 Enel Finance International 3.5% 06/04/2028 USD 264,899 0.06
140,000 Heineken 1.5% 07/12/2024 EUR 168,705 0.04
100,000 LeasePlan 1% 24/05/2021 EUR 113,816 0.02
271,000 Lyondell Basell Industries 4.625% 26/02/2055 USD 271,264 0.06
290,000 Netherlands (Govt) 1.75% 15/07/2023 EUR 355,475 0.08
510,000 Netherlands (Govt) 2% 15/07/2024 EUR 644,574 0.14
130,000 Netherlands (Govt) 2.75% 15/01/2047 EUR 246,942 0.05
270,000 Netherlands (Govt) 3.25% 15/07/2021 EUR 324,502 0.07
150,000 Netherlands (Govt) 3.75% 15/01/2042 EUR 304,786 0.07
200,000 Netherlands (Govt) 4% 15/01/2037 EUR 380,619 0.08
100,000 Relx Finance 1.375% 12/05/2026 EUR 120,293 0.03
200,000 Repsol International Finance 0.25% 02/08/2027 EUR 222,309 0.05
200,000 Repsol International Finance 3.625% 07/10/2021 EUR 241,603 0.05
200,000 Syngenta Finance 3.698% 24/04/2020 USD 201,225 0.04
170,000 Unilever 1.125% 12/02/2027 EUR 205,828 0.04
100,000 Volkswagen International Finance 1.125% 02/10/2023 EUR 115,294 0.02
100,000 Volkswagen International Finance 1.875% 30/03/2027 EUR 120,031 0.03
100,000 Volkswagen International Finance 3.375% VRN Perp EUR 116,156 0.03
207,000 Wolters Kluwer 2.5% 13/05/2024 EUR 258,112 0.06
Saudi Arabia 256,148 0.06
250,000 Saudi Arabian Oil 3.5% 16/04/2029 USD 256,148 0.06
Spain 8,063,427 1.76
500,000 Abertis Infraestructuras 3% 27/03/2031 EUR 639,194 0.14
100,000 Banco Santander 2.125% 08/02/2028 EUR 119,181 0.03
100,000 Bankia 1% 25/06/2024 EUR 112,490 0.02
238,000 Ferrovial Emisiones 3.375% 07/06/2021 EUR 282,382 0.06
200,000 Red Électrica Finance 3.875% 25/01/2022 EUR 245,640 0.05
100,000 Santander Issuances 3.25% 04/04/2026 EUR 128,360 0.03
100,000 Spain (Govt) 1.4% 31/01/2020 EUR 112,420 0.03
950,000 Spain (Govt) 1.45% 31/10/2027 EUR 1,176,730 0.26
1,000,000 Spain (Govt) 2.75% 31/10/2024 EUR 1,290,291 0.28
The accompanying notes form an integral part of these financial statements.
38

Schedule of Investments and Other Net Assets as at 31 July 2019 (continued)
HSBC Portfolios - World Selection 1
Quantity/ Description Market Value Market Value as a Percentage
Face Value USD of Net Assets %
Spain (continued)
155,000 Spain (Govt) 3.45% 30/07/2066 EUR 278,216 0.06
575,000 Spain (Govt) 4.8% 31/01/2024 EUR 788,899 0.17
100,000 Spain (Govt) 5.15% 31/10/2028 EUR 162,260 0.04
270,000 Spain (Govt) 5.15% 31/10/2044 EUR 566,226 0.12
570,000 Spain (Govt) 5.5% 30/04/2021 EUR 701,535 0.15
100,000 Spain (Govt) 5.75% 30/07/2032 EUR 185,904 0.04
300,000 Spanish (Govt) 4.2% 31/01/2037 EUR 522,733 0.11
400,000 Telefonica Emisiones 1.788% 12/03/2029 EUR 496,158 0.11
200,000 Telefónica Emisiones 3.987% 23/01/2023 EUR 254,808 0.06
Sweden 1,644,937 0.36
2,000,000 Sweden (Govt) 0.75% 12/05/2028 SEK 227,663 0.05
1,000,000 Sweden (Govt) 0.75% 12/11/2029 SEK 113,911 0.03
2,100,000 Sweden (Govt) 2.5% 12/05/2025 SEK 257,693 0.06
3,600,000 Sweden (Govt) 3.5% 01/06/2022 SEK 420,444 0.09
1,500,000 Sweden (Govt) 3.5% 30/03/2039 SEK 249,696 0.05
2,350,000 Sweden (Govt) 5% 01/12/2020 SEK 263,498 0.06
100,000 Volvo Treasury 0.1% 24/05/2022 EUR 112,032 0.02
Switzerland 1,091,313 0.24
500,000 Credit Suisse 3.625% 09/09/2024 USD 525,883 0.12
307,000 UBS 4.75% VRN 12/02/2026 EUR 364,621 0.08
200,000 UBS Group Funding 2.65% 01/02/2022 USD 200,809 0.04
United Kingdom 13,456,303 2.94
93,000 Barclays Bank 10% 21/05/2021 GBP 130,549 0.03
214,000 HSBC Holdings 0.875% 06/09/2024 EUR 247,119 0.05
100,000 HSBC Holdings 2.5% 15/03/2027 EUR 129,370 0.03
200,000 HSBC Holdings 6% VRN Perp USD 203,583 0.04
200,000 Lloyds Banking Group 4.45% 08/05/2025 USD 212,229 0.05
207,000 Mondi Finance 3.375% 28/09/2020 EUR 239,887 0.05
121,000 NatWest Markets 1% 28/05/2024 EUR 136,399 0.03
210,000 UK (Govt) 1.625% 22/10/2071 GBP 294,526 0.06
500,000 UK (Govt) 1.75% 07/09/2022 GBP 638,456 0.14
410,500 UK (Govt) 2.25% 07/09/2023 GBP 541,156 0.12
110,000 UK (Govt) 3.5% 22/01/2045 GBP 198,546 0.04
566,000 UK (Govt) 3.75% 07/09/2020 GBP 717,728 0.16
135,000 UK (Govt) 3.75% 07/09/2021 GBP 176,926 0.04
895,000 UK (Govt) 4% 22/01/2060 GBP 2,041,904 0.45
1,004,200 UK (Govt) 4.25% 07/12/2027 GBP 1,605,394 0.35
1,110,000 UK (Govt) 4.25% 07/06/2032 GBP 1,918,086 0.42
920,000 UK (Govt) 4.25% 07/12/2040 GBP 1,764,208 0.39
550,000 UK Treasury Gilt 2% 07/09/2025 GBP 738,607 0.16
325,000 Unilever 1.5% 22/07/2026 GBP 406,759 0.09
275,000 Unilever 1.5% 11/06/2039 EUR 334,072 0.07
184,000 Vodafone Group 4.65% 20/01/2022 EUR 229,749 0.05
118,000 Vodafone Group 7% VRN 04/04/2079 USD 129,418 0.03
407,000 WPP Finance 3.75% 19/09/2024 USD 421,632 0.09
United States 63,527,503 13.86
17,000 Abbott Laboratories 3.75% 30/11/2026 USD 18,315 -
400,000 Air Products And Chemicals 3.35% 31/07/2024 USD 419,146 0.09
300,000 American Tower 3.55% 15/07/2027 USD 308,715 0.07
223,000 Amgen 3.875% 15/11/2021 USD 229,778 0.05
30,000 AT&T 3.55% 01/06/2024 USD 31,217 0.01
230,000 AT&T 5.35% 01/09/2040 USD 259,209 0.06
404,000 AT&T 4.9% 15/08/2037 USD 440,930 0.10
283,000 Bank of America 3.3% 11/01/2023 USD 291,046 0.06
60,000 Bank of America 3.419% VRN 20/12/2028 USD 61,786 0.01
33,000 Bank of America 4.2% 26/08/2024 USD 35,074 0.01
458,000 Bayer US Finance 4.4% 15/07/2044 USD 433,050 0.09
250,000 Branch Banking & Trust 3.8% 30/10/2026 USD 264,696 0.06
104,000 Brandywine Operating Partners 4.1% 01/10/2024 USD 108,326 0.02
150,000 Bristol Myers Squibb 1% 15/05/2025 EUR 177,247 0.04
428,000 Burlington Northern Santa 4.55% 01/09/2044 USD 493,187 0.11
200,000 Capital One Financial 1.65% 12/06/2029 EUR 230,733 0.05
509,000 Citigroup Inc 3.98% VRN 20/03/2030 USD 543,658 0.12
The accompanying notes form an integral part of these financial statements.
39

Schedule of Investments and Other Net Assets as at 31 July 2019 (continued)
HSBC Portfolios - World Selection 1
Quantity/ Description Market Value Market Value as a Percentage
Face Value USD of Net Assets %
United States (continued)
212,000 Citigroup Inc 5.5% 13/09/2025 USD 239,662 0.05
60,000 Citigroup Inc 8.125% 15/07/2039 USD 96,400 0.02
95,000 Citigroup Inc 4.75% 18/05/2046 USD 107,828 0.02
200,000 Coca Cola 1.125% 09/03/2027 EUR 240,080 0.05
413,000 Comcast Corporation 3.375% 15/02/2025 USD 431,160 0.09
79,000 Comcast Corporation 3.95% 15/10/2025 USD 85,200 0.02
176,000 Continental Resources 4.9% 01/06/2044 USD 180,460 0.04
141,000 CSX 3.4% 01/08/2024 USD 147,432 0.03
283,000 CSX 4.5% 01/08/2054 USD 310,035 0.07
79,000 CVS Health Corp 4.78% 25/03/2038 USD 83,636 0.02
480,000 Dell International 4.9% 01/10/2026 USD 502,260 0.11
100,000 Devon Energy Corporation 5% 15/06/2045 USD 113,312 0.03
119,000 Dominion Resources 5.75% VRN 01/10/2054 USD 124,145 0.03
460,000 Dow Chemical 3.5% 01/10/2024 USD 477,379 0.10
83,000 Duke Energy Pogress 4.15% 01/12/2044 USD 91,166 0.02
92,000 Eastman Chemical 3.8% 15/03/2025 USD 96,174 0.02
216,000 EMD Finance 3.25% 19/03/2025 USD 221,028 0.05
33,000 Energy Transfer Operating 6.25% 15/04/2049 USD 39,085 0.01
424,000 Energy Transfer Partners 5.15% 01/02/2043 USD 431,710 0.09
90,000 Energy Transfer Partners LP 5.3% 15/04/2047 USD 94,242 0.02
100,000 Enlink Midstream Partners 5.05% 01/04/2045 USD 84,585 0.02
150,000 Enterprise Products 5.375% VRN 15/02/2078 USD 143,881 0.03
142,000 EOG Resources 3.15% 01/04/2025 USD 146,898 0.03
200,000 Fifth Third Bank 2.875% 01/10/2021 USD 202,218 0.04
100,000 Fiserv 2.25% 01/07/2025 GBP 126,355 0.03
253,000 Ford Motor Credit 3.664% 08/09/2024 USD 250,452 0.06
150,000 Ford Motor Credit 3.021% 06/03/2024 EUR 179,098 0.04
240,000 Ford Motor Credit 5.875% 02/08/2021 USD 252,862 0.06
88,000 General Electric 5.875% 14/01/2038 USD 102,685 0.02
215,000 General Motors 6.75% 01/04/2046 USD 245,733 0.05
60,000 General Motors Financial 4.35% 17/01/2027 USD 61,291 0.01
150,000 General Motors Financial FRN 06/11/2021 USD 150,191 0.03
355,000 Goldman Sachs 3.5% 16/11/2026 USD 364,589 0.08
130,000 Goldman Sachs 4.75% 21/10/2045 USD 151,806 0.03
85,000 HCA 5.25% 15/06/2049 USD 89,316 0.02
266,000 HCP 3.875% 15/08/2024 USD 282,273 0.06
141,000 Johnson Controls 4.625% 02/07/2044 USD 146,005 0.03
317,000 JP Morgan Chase 3.875% 10/09/2024 USD 333,814 0.07
41,000 JP Morgan Chase 4.005% VRN 23/04/2029 USD 44,182 0.01
157,000 JP Morgan Chase 4.25% 15/10/2020 USD 160,609 0.04
527,000 Kilroy Realty 4.25% 15/08/2029 USD 562,472 0.12
82,000 Kinder Morgan 5.55% 01/06/2045 USD 94,397 0.02
320,000 Kinder Morgan Energy 3.95% 01/09/2022 USD 332,405 0.07
34,000 Kinder Morgan Energy Partners 5.4% 01/09/2044 USD 38,022 0.01
140,000 KLA Tencor 5% 15/03/2049 USD 160,287 0.04
253,000 Kroger 3.3% 15/01/2021 USD 255,954 0.06
42,000 Kroger 3.875% 15/10/2046 USD 38,047 0.01
141,000 Liberty Mutual Group 4.85% 01/08/2044 USD 157,290 0.03
260,000 Marathon Petroleum 3.625% 15/09/2024 USD 270,653 0.06
200,000 Marathon Petroleum 4.75% 15/09/2044 USD 209,108 0.05
145,000 Mass Mutual Life Insurance 4.9% 01/04/2077 USD 169,938 0.04
30,000 Medtronic 4.625% 15/03/2045 USD 37,126 0.01
467,000 Merck 4% 07/03/2049 USD 519,654 0.11
83,000 Microsoft 3.45% 08/08/2036 USD 87,904 0.02
83,000 Morgan Stanley 3.125% 27/07/2026 USD 84,325 0.02
155,000 Morgan Stanley 4.35% 08/09/2026 USD 166,269 0.04
25,000 Mplx LP 5.2% 01/03/2047 USD 26,754 0.01
84,000 Noble Energy 5.05% 15/11/2044 USD 88,758 0.02
71,000 Oracle 2.8% 08/07/2021 USD 71,878 0.02
207,000 Prologis 3.375% 20/02/2024 EUR 265,597 0.06
25,000 Prudential Financial 5.375% 21/06/2020 USD 25,683 0.01
268,000 Realty Income 4.125% 15/10/2026 USD 291,213 0.06
145,000 Santander Holdings USA 3.5% 07/06/2024 USD 147,340 0.03
300,000 Simon Property Group 4.25% 01/10/2044 USD 330,934 0.07
220,000 Synchrony Financial 2.85% 25/07/2022 USD 220,460 0.05
40,000 Teachers Insurance & Annuity 4.9% 15/09/2044 USD 47,221 0.01
18,000 Teachers Insurance & Annuity 6.85% 16/12/2039 USD 25,509 0.01
The accompanying notes form an integral part of these financial statements.
40
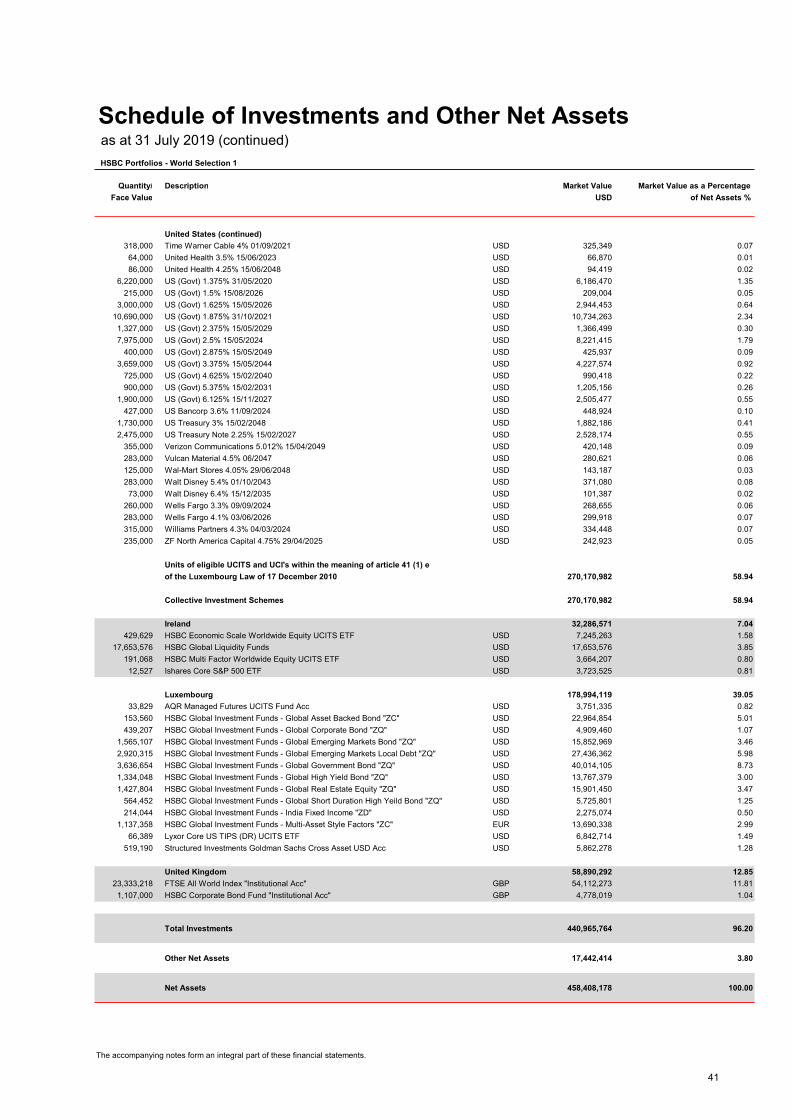
Schedule of Investments and Other Net Assets as at 31 July 2019 (continued)
HSBC Portfolios - World Selection 1
Quantity/ Description Market Value Market Value as a Percentage
Face Value USD of Net Assets %
United States (continued)
318,000 Time Warner Cable 4% 01/09/2021 USD 325,349 0.07
64,000 United Health 3.5% 15/06/2023 USD 66,870 0.01
86,000 United Health 4.25% 15/06/2048 USD 94,419 0.02
6,220,000 US (Govt) 1.375% 31/05/2020 USD 6,186,470 1.35
215,000 US (Govt) 1.5% 15/08/2026 USD 209,004 0.05
3,000,000 US (Govt) 1.625% 15/05/2026 USD 2,944,453 0.64
10,690,000 US (Govt) 1.875% 31/10/2021 USD 10,734,263 2.34
1,327,000 US (Govt) 2.375% 15/05/2029 USD 1,366,499 0.30
7,975,000 US (Govt) 2.5% 15/05/2024 USD 8,221,415 1.79
400,000 US (Govt) 2.875% 15/05/2049 USD 425,937 0.09
3,659,000 US (Govt) 3.375% 15/05/2044 USD 4,227,574 0.92
725,000 US (Govt) 4.625% 15/02/2040 USD 990,418 0.22
900,000 US (Govt) 5.375% 15/02/2031 USD 1,205,156 0.26
1,900,000 US (Govt) 6.125% 15/11/2027 USD 2,505,477 0.55
427,000 US Bancorp 3.6% 11/09/2024 USD 448,924 0.10
1,730,000 US Treasury 3% 15/02/2048 USD 1,882,186 0.41
2,475,000 US Treasury Note 2.25% 15/02/2027 USD 2,528,174 0.55
355,000 Verizon Communications 5.012% 15/04/2049 USD 420,148 0.09
283,000 Vulcan Material 4.5% 06/2047 USD 280,621 0.06
125,000 Wal-Mart Stores 4.05% 29/06/2048 USD 143,187 0.03
283,000 Walt Disney 5.4% 01/10/2043 USD 371,080 0.08
73,000 Walt Disney 6.4% 15/12/2035 USD 101,387 0.02
260,000 Wells Fargo 3.3% 09/09/2024 USD 268,655 0.06
283,000 Wells Fargo 4.1% 03/06/2026 USD 299,918 0.07
315,000 Williams Partners 4.3% 04/03/2024 USD 334,448 0.07
235,000 ZF North America Capital 4.75% 29/04/2025 USD 242,923 0.05
Units of eligible UCITS and UCI's within the meaning of article 41 (1) e
of the Luxembourg Law of 17 December 2010 270,170,982 58.94
Collective Investment Schemes 270,170,982 58.94
Ireland 32,286,571 7.04
429,629 HSBC Economic Scale Worldwide Equity UCITS ETF USD 7,245,263 1.58
17,653,576 HSBC Global Liquidity Funds USD 17,653,576 3.85
191,068 HSBC Multi Factor Worldwide Equity UCITS ETF USD 3,664,207 0.80
12,527 Ishares Core S&P 500 ETF USD 3,723,525 0.81
Luxembourg 178,994,119 39.05
33,829 AQR Managed Futures UCITS Fund Acc USD 3,751,335 0.82
153,560 HSBC Global Investment Funds - Global Asset Backed Bond "ZC" USD 22,964,854 5.01
439,207 HSBC Global Investment Funds - Global Corporate Bond "ZQ" USD 4,909,460 1.07
1,565,107 HSBC Global Investment Funds - Global Emerging Markets Bond "ZQ" USD 15,852,969 3.46
2,920,315 HSBC Global Investment Funds - Global Emerging Markets Local Debt "ZQ" USD 27,436,362 5.98
3,636,654 HSBC Global Investment Funds - Global Government Bond "ZQ" USD 40,014,105 8.73
1,334,048 HSBC Global Investment Funds - Global High Yield Bond "ZQ" USD 13,767,379 3.00
1,427,804 HSBC Global Investment Funds - Global Real Estate Equity "ZQ" USD 15,901,450 3.47
564,452 HSBC Global Investment Funds - Global Short Duration High Yeild Bond "ZQ" USD 5,725,801 1.25
214,044 HSBC Global Investment Funds - India Fixed Income "ZD" USD 2,275,074 0.50
1,137,358 HSBC Global Investment Funds - Multi-Asset Style Factors "ZC" EUR 13,690,338 2.99
66,389 Lyxor Core US TIPS (DR) UCITS ETF USD 6,842,714 1.49
519,190 Structured Investments Goldman Sachs Cross Asset USD Acc USD 5,862,278 1.28
United Kingdom 58,890,292 12.85
23,333,218 FTSE All World Index "Institutional Acc" GBP 54,112,273 11.81
1,107,000 HSBC Corporate Bond Fund "Institutional Acc" GBP 4,778,019 1.04
Total Investments 440,965,764 96.20
Other Net Assets 17,442,414 3.80
Net Assets 458,408,178 100.00
The accompanying notes form an integral part of these financial statements.
41

Schedule of Investments and Other Net Assets as at 31 July 2019 (continued)
HSBC Portfolios - World Selection 2
Quantity/ Description Security Market Value Market Value as a Percentage
Face Value Currency USD of Net Assets %
Transferable Securities Admitted to an Official Stock Exchange Listing 139,432,513 23.83
Bonds 139,432,513 23.83
Australia 4,059,011 0.69
100,000 BHP Billiton Finance 4.3% 25/09/2042 GBP 169,663 0.03
300,000 BHP Billiton Finance 4.75% VRN 22/04/2076 EUR 359,733 0.06
100,000 BHP Billiton Finance 6.5% VRN 22/10/2077 GBP 139,627 0.02
140,000 Macquarie Bank 3.5% 18/12/2020 GBP 177,297 0.03
178,000 Scentre Management 1.375% 22/03/2023 EUR 207,971 0.03
500,000 Scentre Management 3.75% 23/03/2027 USD 516,780 0.09
100,000 Scentre Management 3.875% 16/07/2026 GBP 137,299 0.02
502,000 Sydney Airport Finance 2.75% 23/04/2024 EUR 632,557 0.11
955,000 Westpac Banking Corporation 4.11% VRN 24/07/2034 USD 974,945 0.17
159,000 Westpac Banking Corporation 4.421% 24/07/2039 USD 166,116 0.03
600,000 Westpac Banking Corporation 5% VRN Perp USD 577,023 0.10
Austria 507,124 0.09
423,000 Telekom Finanzmanagement 3.125% 03/12/2021 EUR 507,124 0.09
Belgium 1,220,063 0.21
332,000 Anheuser Busch InBev 1.5% 17/03/2025 EUR 403,719 0.07
108,000 Anheuser Busch InBev 2% 17/03/2028 EUR 137,380 0.02
262,000 Anheuser-Busch Inbev 1.75% 07/03/2025 GBP 329,917 0.06
300,000 KBC Groep 1.875% VRN 11/03/2027 EUR 349,047 0.06
Bermuda 664,518 0.11
600,000 IHS Markit 4.75% 01/08/2028 USD 664,518 0.11
Cayman Islands 987,415 0.17
244,000 Alibaba Group Holding 3.125% 28/11/2021 USD 247,465 0.04
685,000 Park Aerospace Holdings 5.5% 15/02/2024 USD 739,950 0.13
Channel Islands 566,066 0.10
350,000 Delphi Automotive 1.5% 10/03/2025 EUR 409,936 0.07
132,000 Delphi Automotive 1.6% 15/09/2028 EUR 156,130 0.03
Denmark 367,282 0.06
300,000 ISS Global 2.125% 02/12/2024 EUR 367,282 0.06
Finland 600,963 0.10
100,000 Pohjola Bank 2.5% 20/05/2022 GBP 127,238 0.02
400,000 Sampo OYJ 1.25% 30/05/2025 EUR 473,725 0.08
France 10,329,317 1.76
200,000 Air Liquide Finance 0.375% 18/04/2022 EUR 226,537 0.04
300,000 ALD 1.25% 11/10/2022 EUR 348,182 0.06
171,000 AXA 3.25% VRN 28/05/2049 EUR 215,264 0.04
400,000 AXA 3.875% VRN Perp EUR 505,292 0.09
329,000 AXA 3.941% VRN Perp EUR 414,410 0.07
153,000 AXA 5.453% VRN Perp GBP 210,869 0.04
400,000 Banque Federative Credit Mutuel 2.375% 24/03/2026 EUR 493,243 0.08
300,000 Banque Federative Credit Mutuel 3% 21/05/2024 EUR 374,962 0.06
22,000 BNP Paribas 5.75% 24/01/2022 GBP 29,694 -
300,000 BPCE 1.625% 31/01/2028 EUR 369,854 0.06
600,000 BPCE 3% 19/07/2024 EUR 770,771 0.13
100,000 Électricité de France 6% VRN Perp GBP 133,843 0.02
400,000 Essilor International 1.75% 09/04/2021 EUR 458,409 0.08
400,000 Imerys 1.875% 31/03/2028 EUR 480,381 0.08
100,000 Orange 0.5% 15/01/2022 EUR 113,250 0.02
114,000 Orange 5.75% VRN Perp GBP 155,812 0.03
154,000 Orange 8.125% 20/11/2028 GBP 290,473 0.05
700,000 Pernod Ricard 2% 22/06/2020 EUR 795,275 0.14
1,225,000 RCI Banque 1.75% 10/04/2026 EUR 1,442,006 0.25
200,000 RTE Reseau De Transport 1% 19/10/2026 EUR 238,596 0.04
100,000 RTE Reseau de Transport 1.625% 27/11/2025 EUR 122,835 0.02
300,000 RTE Reseau De Transport 2% 18/04/2036 EUR 400,899 0.07
The accompanying notes form an integral part of these financial statements.
42
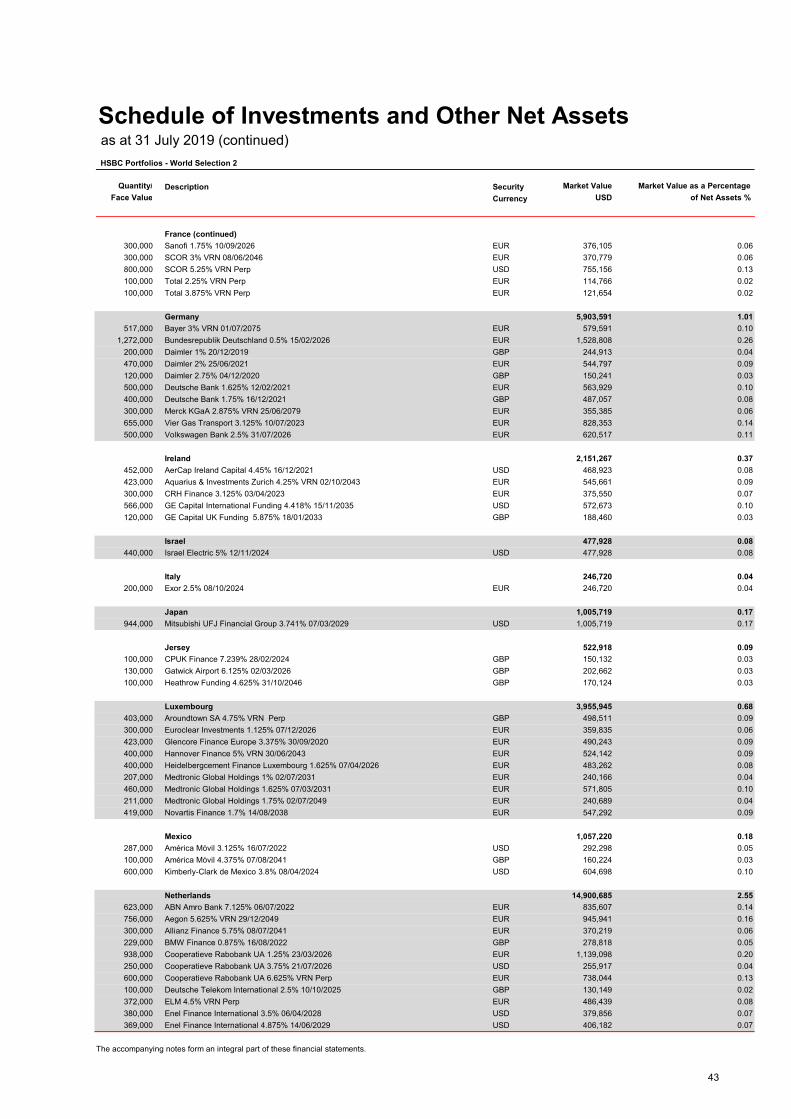
Schedule of Investments and Other Net Assets as at 31 July 2019 (continued)
HSBC Portfolios - World Selection 2
Quantity/ Description Security Market Value Market Value as a Percentage
Face Value Currency USD of Net Assets %
France (continued)
300,000 Sanofi 1.75% 10/09/2026 EUR 376,105 0.06
300,000 SCOR 3% VRN 08/06/2046 EUR 370,779 0.06
800,000 SCOR 5.25% VRN Perp USD 755,156 0.13
100,000 Total 2.25% VRN Perp EUR 114,766 0.02
100,000 Total 3.875% VRN Perp EUR 121,654 0.02
Germany 5,903,591 1.01
517,000 Bayer 3% VRN 01/07/2075 EUR 579,591 0.10
1,272,000 Bundesrepublik Deutschland 0.5% 15/02/2026 EUR 1,528,808 0.26
200,000 Daimler 1% 20/12/2019 GBP 244,913 0.04
470,000 Daimler 2% 25/06/2021 EUR 544,797 0.09
120,000 Daimler 2.75% 04/12/2020 GBP 150,241 0.03
500,000 Deutsche Bank 1.625% 12/02/2021 EUR 563,929 0.10
400,000 Deutsche Bank 1.75% 16/12/2021 GBP 487,057 0.08
300,000 Merck KGaA 2.875% VRN 25/06/2079 EUR 355,385 0.06
655,000 Vier Gas Transport 3.125% 10/07/2023 EUR 828,353 0.14
500,000 Volkswagen Bank 2.5% 31/07/2026 EUR 620,517 0.11
Ireland 2,151,267 0.37
452,000 AerCap Ireland Capital 4.45% 16/12/2021 USD 468,923 0.08
423,000 Aquarius & Investments Zurich 4.25% VRN 02/10/2043 EUR 545,661 0.09
300,000 CRH Finance 3.125% 03/04/2023 EUR 375,550 0.07
566,000 GE Capital International Funding 4.418% 15/11/2035 USD 572,673 0.10
120,000 GE Capital UK Funding 5.875% 18/01/2033 GBP 188,460 0.03
Israel 477,928 0.08
440,000 Israel Electric 5% 12/11/2024 USD 477,928 0.08
Italy 246,720 0.04
200,000 Exor 2.5% 08/10/2024 EUR 246,720 0.04
Japan 1,005,719 0.17
944,000 Mitsubishi UFJ Financial Group 3.741% 07/03/2029 USD 1,005,719 0.17
Jersey 522,918 0.09
100,000 CPUK Finance 7.239% 28/02/2024 GBP 150,132 0.03
130,000 Gatwick Airport 6.125% 02/03/2026 GBP 202,662 0.03
100,000 Heathrow Funding 4.625% 31/10/2046 GBP 170,124 0.03
Luxembourg 3,955,945 0.68
403,000 Aroundtown SA 4.75% VRN Perp GBP 498,511 0.09
300,000 Euroclear Investments 1.125% 07/12/2026 EUR 359,835 0.06
423,000 Glencore Finance Europe 3.375% 30/09/2020 EUR 490,243 0.09
400,000 Hannover Finance 5% VRN 30/06/2043 EUR 524,142 0.09
400,000 Heidelbergcement Finance Luxembourg 1.625% 07/04/2026 EUR 483,262 0.08
207,000 Medtronic Global Holdings 1% 02/07/2031 EUR 240,166 0.04
460,000 Medtronic Global Holdings 1.625% 07/03/2031 EUR 571,805 0.10
211,000 Medtronic Global Holdings 1.75% 02/07/2049 EUR 240,689 0.04
419,000 Novartis Finance 1.7% 14/08/2038 EUR 547,292 0.09
Mexico 1,057,220 0.18
287,000 América Móvil 3.125% 16/07/2022 USD 292,298 0.05
100,000 América Móvil 4.375% 07/08/2041 GBP 160,224 0.03
600,000 Kimberly-Clark de Mexico 3.8% 08/04/2024 USD 604,698 0.10
Netherlands 14,900,685 2.55
623,000 ABN Amro Bank 7.125% 06/07/2022 EUR 835,607 0.14
756,000 Aegon 5.625% VRN 29/12/2049 EUR 945,941 0.16
300,000 Allianz Finance 5.75% 08/07/2041 EUR 370,219 0.06
229,000 BMW Finance 0.875% 16/08/2022 GBP 278,818 0.05
938,000 Cooperatieve Rabobank UA 1.25% 23/03/2026 EUR 1,139,098 0.20
250,000 Cooperatieve Rabobank UA 3.75% 21/07/2026 USD 255,917 0.04
600,000 Cooperatieve Rabobank UA 6.625% VRN Perp EUR 738,044 0.13
100,000 Deutsche Telekom International 2.5% 10/10/2025 GBP 130,149 0.02
372,000 ELM 4.5% VRN Perp EUR 486,439 0.08
380,000 Enel Finance International 3.5% 06/04/2028 USD 379,856 0.07
369,000 Enel Finance International 4.875% 14/06/2029 USD 406,182 0.07
The accompanying notes form an integral part of these financial statements.
43

Schedule of Investments and Other Net Assets as at 31 July 2019 (continued)
HSBC Portfolios - World Selection 2
Quantity/ Description Security Market Value Market Value as a Percentage
Face Value Currency USD of Net Assets %
Netherlands (continued)
152,000 Enexis Holding 1.5% 20/10/2023 EUR 181,035 0.03
440,000 Heineken 1.5% 07/12/2024 EUR 530,217 0.09
100,000 ING Bank 5.375% 15/04/2021 GBP 131,720 0.02
78,000 Innogy Finance 6.25% 03/06/2030 GBP 134,121 0.02
70,000 Koninklijke KPN 5.75% 17/09/2029 GBP 103,899 0.02
400,000 LeasePlan 1% 24/05/2021 EUR 455,265 0.08
547,000 Lyondell Basell Industries 4.625% 26/02/2055 USD 547,533 0.09
100,000 Petrobras International Finance 6.25% 14/12/2026 GBP 143,669 0.03
480,000 Relx Finance 1.375% 12/05/2026 EUR 577,406 0.10
500,000 Repsol International Finance 0.25% 02/08/2027 EUR 555,773 0.10
400,000 Repsol International Finance 3.625% 07/10/2021 EUR 483,207 0.08
400,000 Siemens Financieringsmaatschappij 1.375% 06/09/2030 EUR 494,601 0.09
200,000 Swiss Reinsurance Company 2.6% VRN Perp EUR 239,979 0.04
800,000 Unilever 1% 03/06/2023 EUR 934,503 0.16
1,020,000 Unilever 1.125% 12/02/2027 EUR 1,234,965 0.21
300,000 Volkswagen Financial Services 1.875% 07/09/2021 GBP 371,462 0.06
200,000 Volkswagen International Finance 1.125% 02/10/2023 EUR 230,587 0.04
300,000 Volkswagen International Finance 1.875% 30/03/2027 EUR 360,093 0.06
600,000 Volkswagen International Finance 3.375% VRN Perp EUR 696,933 0.12
423,000 Wolters Kluwer 2.5% 13/05/2024 EUR 527,447 0.09
Saudi Arabia 860,656 0.15
840,000 Saudi Arabian Oil 3.5% 16/04/2029 USD 860,656 0.15
Spain 6,489,096 1.11
900,000 Abertis Infraestructuras 3% 27/03/2031 EUR 1,150,550 0.20
400,000 Banco Santander 2.125% 08/02/2028 EUR 476,722 0.08
200,000 Bankia 1% 25/06/2024 EUR 224,980 0.04
686,000 Ferrovial Emisiones 3.375% 07/06/2021 EUR 813,924 0.14
400,000 Red Électrica Finance 3.875% 25/01/2022 EUR 491,281 0.08
600,000 Santander Issuances 3.25% 04/04/2026 EUR 770,163 0.13
600,000 Telefonica Emisiones 1.495% 11/09/2025 EUR 721,884 0.12
1,000,000 Telefonica Emisiones 1.788% 12/03/2029 EUR 1,240,394 0.21
400,000 Telefónica Emisiones 3.987% 23/01/2023 EUR 509,617 0.09
60,000 Telefónica Emisiones 5.375% 02/02/2026 GBP 89,581 0.02
Sweden 692,883 0.12
300,000 Teliasonera 1.625% 23/02/2035 EUR 356,787 0.06
300,000 Volvo Treasury 0.1% 24/05/2022 EUR 336,096 0.06
Switzerland 3,479,892 0.59
300,000 Credit Suisse 1.25% 14/04/2022 EUR 345,921 0.06
181,000 Credit Suisse 3% 27/05/2022 GBP 232,480 0.04
1,218,000 Credit Suisse 3.625% 09/09/2024 USD 1,281,050 0.22
823,000 UBS 4.75% VRN 12/02/2026 EUR 977,470 0.17
230,000 UBS Group Funding 1.25% 01/09/2026 EUR 274,487 0.04
367,000 UBS Group Funding 2.65% 01/02/2022 USD 368,484 0.06
United Kingdom 18,910,200 3.23
150,000 Affinity Water Finance 5.875% 13/07/2026 GBP 238,496 0.04
250,000 Astrazeneca 3.375% 16/11/2025 USD 261,366 0.05
100,000 Aviva 6.625% VRN 03/06/2041 GBP 133,165 0.02
243,000 Barclays Bank 10% 21/05/2021 GBP 341,112 0.06
390,000 Barclays Bank 10.179% 12/06/2021 USD 438,814 0.08
250,000 Barclays PLC 5.25% 17/08/2045 USD 268,036 0.05
290,000 BP Capital Markets 2.03% 14/02/2025 GBP 371,206 0.06
100,000 BUPA Finance 5% 08/12/2026 GBP 139,394 0.02
350,000 Cadent Finance 2.75% 22/09/2046 GBP 442,368 0.09
200,000 Centrica FRN 25/09/2020 USD 200,526 0.03
100,000 Compass Group 2% 03/07/2029 GBP 131,415 0.02
300,000 FCE Bank 1.528% 09/11/2020 EUR 340,964 0.06
125,000 Glaxo Smith Kline Capital 6.375% 09/03/2039 GBP 252,392 0.04
100,000 Hammerson 7.25% 21/04/2028 GBP 158,195 0.03
429,000 HSBC Holdings 0.875% 06/09/2024 EUR 495,393 0.09
365,000 HSBC Holdings 2.5% 15/03/2027 EUR 472,202 0.08
378,000 HSBC Holdings 2.625% 16/08/2028 GBP 482,619 0.08
200,000 HSBC Holdings 3.4% 08/03/2021 USD 202,837 0.04
The accompanying notes form an integral part of these financial statements.
44

Schedule of Investments and Other Net Assets as at 31 July 2019 (continued)
HSBC Portfolios - World Selection 2
Quantity/ Description Security Market Value Market Value as a Percentage
Face Value Currency USD of Net Assets %
United Kingdom (continued)
500,000 HSBC Holdings 6% VRN Perp USD 508,957 0.09
250,000 HSBC Holdings 6.75% 11/09/2028 GBP 402,869 0.07
167,000 Legal & General Group 5.125% VRN 14/11/2048 GBP 226,924 0.04
133,000 Legal & General Group 5.375% VRN 27/10/2045 GBP 182,156 0.03
280,000 Lloyds Banking Group 4.45% 08/05/2025 USD 297,121 0.05
100,000 Manc Airport Group Funding 4.75% 31/03/2034 GBP 160,476 0.03
100,000 Marks & Spencer 4.75% 12/06/2025 GBP 135,531 0.02
423,000 Mondi Finance 3.375% 28/09/2020 EUR 490,205 0.08
100,000 Motability Operations 2.375% 14/03/2032 GBP 130,024 0.02
423,000 NatWest Markets 1% 28/05/2024 EUR 476,834 0.08
362,000 NatWest Markets 3.625% 29/09/2022 USD 368,377 0.06
200,000 NGG Finance 5.625% VRN 18/06/2073 GBP 268,970 0.05
100,000 Peabody Capital 5.25% 17/03/2043 GBP 176,721 0.03
100,000 Places For People Homes 5.875% 23/05/2031 GBP 159,321 0.03
174,000 Places For People Treasury 2.875% 17/08/2026 GBP 219,777 0.04
150,000 Prudential Financial 5% VRN 20/07/2055 GBP 199,012 0.03
100,000 Prudential Financial 5.7% VRN 19/12/2063 GBP 140,488 0.02
870,000 Royal Bank of Scotland 3.875% 12/09/2023 USD 888,244 0.15
108,000 Santander UK Group Holdings 3.625% 14/01/2026 GBP 142,737 0.02
200,000 Severn Trent Utilities Finance 6.25% 07/06/2029 GBP 344,590 0.06
100,000 Severn Trent Water Utilities 2.75% 05/12/2031 GBP 134,583 0.02
170,000 Severn Trent Water Utilities 3.625% 16/01/2026 GBP 234,321 0.04
566,000 Sky 3.75% 16/09/2024 USD 599,431 0.10
100,000 South Eastern Power Networks 6.375% 12/11/2031 GBP 181,353 0.03
100,000 SSE 3.875% VRN Perp GBP 124,489 0.02
150,000 Tesco Corporate Treasury Service 1.375% 24/10/2023 EUR 173,765 0.03
109,000 Thames Water Utilities Finance 1.875% 24/01/2024 GBP 135,788 0.02
249,000 Thames Water Utilities Finance 2.375% 03/05/2023 GBP 308,128 0.05
140,000 Thames Water Utilities Finance 2.625% 24/01/2032 GBP 176,614 0.03
140,000 Thames Water Utilities Finance 5.125% 28/09/2037 GBP 231,815 0.04
438,000 UK (Govt) 1% 22/04/2024 GBP 551,680 0.10
48,000 UK (Govt) 3.25% 22/01/2044 GBP 82,681 0.01
785,000 Unilever 1.5% 11/06/2039 EUR 953,624 0.16
935,000 Unilever 1.5% 22/07/2026 GBP 1,170,214 0.20
376,000 Vodafone Group 4.65% 20/01/2022 EUR 469,486 0.08
418,000 Vodafone Group 7% VRN 04/04/2079 USD 458,446 0.08
150,000 Western Power Distribution 3.5% 16/10/2026 GBP 196,316 0.03
350,000 Western Power Distribution 3.875% 17/10/2024 GBP 480,203 0.08
831,000 WPP Finance 3.75% 19/09/2024 USD 860,874 0.15
70,000 Zurich Finance 6.625% VRN Perp GBP 96,555 0.02
United States 59,476,034 10.17
56,000 Abbott Laboratories 3.75% 30/11/2026 USD 60,331 0.01
1,015,000 Air Products And Chemicals 3.35% 31/07/2024 USD 1,063,583 0.18
150,000 American Honda Finance 1.3% 21/03/2022 GBP 185,262 0.03
100,000 American International Group 5% 26/04/2023 GBP 138,700 0.02
1,000,000 American Tower 3.55% 15/07/2027 USD 1,029,050 0.18
452,000 Amgen 3.875% 15/11/2021 USD 465,739 0.08
100,000 Amgen 4% 13/09/2029 GBP 145,581 0.03
500,000 Anheuser-Busch InBev Worldwide 4.15% 23/01/2025 USD 539,593 0.09
296,000 Anheuser-Busch InBev Worldwide 5.55% 23/01/2049 USD 366,858 0.06
200,000 Apple 3.05% 31/07/2029 GBP 286,388 0.05
150,000 Apple 3.6% 31/07/2042 GBP 240,078 0.04
33,000 AT&T 3.55% 01/06/2024 USD 34,339 0.01
100,000 AT&T 5.2% 18/11/2033 GBP 158,877 0.03
470,000 AT&T 5.35% 01/09/2040 USD 529,688 0.09
150,000 AT&T 7% 30/04/2040 GBP 290,416 0.05
808,000 AT&T 4.9% 15/08/2037 USD 881,859 0.15
575,000 Bank of America 3.3% 11/01/2023 USD 591,347 0.10
66,000 Bank of America 3.419% VRN 20/12/2028 USD 67,965 0.01
67,000 Bank of America 4.2% 26/08/2024 USD 71,211 0.01
150,000 Bank of America 7% 31/07/2028 GBP 262,678 0.05
1,133,000 Bayer US Finance 4.4% 15/07/2044 USD 1,071,280 0.18
700,000 Branch Banking & Trust 3.8% 30/10/2026 USD 741,150 0.13
210,000 Brandywine Operating Partners 4.1% 01/10/2024 USD 218,735 0.04
300,000 Bristol Myers Squibb 1% 15/05/2025 EUR 354,494 0.06
The accompanying notes form an integral part of these financial statements.
45

Schedule of Investments and Other Net Assets as at 31 July 2019 (continued)
HSBC Portfolios - World Selection 2
Quantity/ Description Security Market Value Market Value as a Percentage
Face Value Currency USD of Net Assets %
United States (continued)
872,000 Burlington Northern Santa 4.55% 01/09/2044 USD 1,004,810 0.17
570,000 Capital One Financial 1.65% 12/06/2029 EUR 657,590 0.11
1,089,000 Citigroup Inc 3.98% VRN 20/03/2030 USD 1,163,150 0.20
430,000 Citigroup Inc 5.5% 13/09/2025 USD 486,106 0.08
66,000 Citigroup Inc 8.125% 15/07/2039 USD 106,040 0.02
285,000 Citigroup Inc 4.75% 18/05/2046 USD 323,485 0.06
500,000 Coca Cola 1.125% 09/03/2027 EUR 600,200 0.10
837,000 Comcast Corporation 3.375% 15/02/2025 USD 873,803 0.15
750,000 Comcast Corporation 3.95% 15/10/2025 USD 808,860 0.14
501,000 Comerica 3.8% 22/07/2026 USD 524,529 0.09
594,000 Continental Resources 4.9% 01/06/2044 USD 609,052 0.10
287,000 CSX 3.4% 01/08/2024 USD 300,092 0.05
374,000 CSX 4.5% 01/08/2054 USD 409,728 0.07
236,000 CVS Health Corp 4.78% 25/03/2038 USD 249,851 0.04
843,000 Daimler Finance FRN 04/05/2023 USD 844,947 0.14
1,380,000 Dell International 4.9% 01/10/2026 USD 1,443,998 0.25
285,000 Devon Energy Corporation 5% 15/06/2045 USD 322,939 0.06
350,000 Discovery Communications 1.9% 19/03/2027 EUR 417,783 0.07
243,000 Dominion Resources 5.75% VRN 01/10/2054 USD 253,506 0.04
1,140,000 Dow Chemical 3.5% 01/10/2024 USD 1,183,069 0.20
171,000 Duke Energy Pogress 4.15% 01/12/2044 USD 187,823 0.03
190,000 Eastman Chemical 3.8% 15/03/2025 USD 198,620 0.03
438,000 EMD Finance 3.25% 19/03/2025 USD 448,197 0.08
200,000 Energy Transfer Operating 6.25% 15/04/2049 USD 236,879 0.04
1,050,000 Energy Transfer Partners 5.15% 01/02/2043 USD 1,069,094 0.18
226,000 Enlink Midstream Partners 5.05% 01/04/2045 USD 191,163 0.03
350,000 Enterprise Products 5.375% VRN 15/02/2078 USD 335,724 0.06
288,000 EOG Resources 3.15% 01/04/2025 USD 297,933 0.05
273,000 FedEx 4.55% 01/04/2046 USD 282,182 0.05
304,000 Fifth Third Bank 2.875% 01/10/2021 USD 307,371 0.05
306,000 Fiserv 2.25% 01/07/2025 GBP 386,647 0.07
529,000 Ford Motor Credit 3.664% 08/09/2024 USD 523,673 0.09
488,000 Ford Motor Credit 5.875% 02/08/2021 USD 514,152 0.09
177,000 General Electric 5.875% 14/01/2038 USD 206,538 0.04
432,000 General Motors 6.75% 01/04/2046 USD 493,752 0.08
179,000 General Motors Financial 4.35% 17/01/2027 USD 182,850 0.03
600,000 General Motors Financial FRN 06/11/2021 USD 600,765 0.10
1,020,000 Goldman Sachs 3.5% 16/11/2026 USD 1,047,550 0.18
370,000 Goldman Sachs 4.75% 21/10/2045 USD 432,064 0.07
250,000 HCA 5.25% 15/06/2049 USD 262,694 0.05
1,154,000 HCP 3.875% 15/08/2024 USD 1,224,596 0.21
1,400,000 International Business Machines 0.375% 31/01/2023 EUR 1,587,168 0.27
287,000 Johnson Controls 4.625% 02/07/2044 USD 297,187 0.05
1,306,000 JP Morgan Chase 3.875% 10/09/2024 USD 1,375,270 0.24
250,000 JP Morgan Chase 4.005% VRN 23/04/2029 USD 269,401 0.05
172,000 JP Morgan Chase 4.25% 15/10/2020 USD 175,953 0.03
478,000 Kilroy Realty 4.25% 15/08/2029 USD 510,174 0.09
339,000 Kinder Morgan 5.55% 01/06/2045 USD 390,252 0.07
650,000 Kinder Morgan Energy 3.95% 01/09/2022 USD 675,197 0.12
70,000 Kinder Morgan Energy Partners 5.4% 01/09/2044 USD 78,281 0.01
576,000 KLA Tencor 5% 15/03/2049 USD 659,465 0.11
513,000 Kroger 3.3% 15/01/2021 USD 518,989 0.09
125,000 Kroger 3.875% 15/10/2046 USD 113,234 0.02
287,000 Liberty Mutual Group 4.85% 01/08/2044 USD 320,157 0.05
820,000 Lowe's Companies 4.25% 15/09/2044 USD 839,565 0.14
528,000 Marathon Petroleum 3.625% 15/09/2024 USD 549,635 0.09
410,000 Marathon Petroleum 4.75% 15/09/2044 USD 428,671 0.07
434,000 Mass Mutual Life Insurance 4.9% 01/04/2077 USD 508,642 0.09
60,000 Medtronic 4.625% 15/03/2045 USD 74,251 0.01
380,000 Merck 4% 07/03/2049 USD 422,845 0.07
322,000 Metropolitan Life Global Funding I 3% 10/01/2023 USD 328,685 0.06
259,000 Microsoft 3.45% 08/08/2036 USD 274,303 0.05
167,000 Microsoft 4.2% 03/11/2035 USD 192,145 0.03
250,000 Morgan Stanley 3.125% 27/07/2026 USD 253,994 0.04
317,000 Morgan Stanley 4.35% 08/09/2026 USD 340,046 0.06
467,000 Motorola Solutions 4% 01/09/2024 USD 485,311 0.08
80,000 Mplx LP 5.2% 01/03/2047 USD 85,614 0.01
The accompanying notes form an integral part of these financial statements.
46

Schedule of Investments and Other Net Assets as at 31 July 2019 (continued)
HSBC Portfolios - World Selection 2
Quantity/ Description Security Market Value Market Value as a Percentage
Face Value Currency USD of Net Assets %
United States (continued)
174,000 Noble Energy 5.05% 15/11/2044 USD 183,856 0.03
423,000 Prologis 3.375% 20/02/2024 EUR 542,741 0.09
27,000 Prudential Financial 5.375% 21/06/2020 USD 27,738 -
547,000 Realty Income 4.125% 15/10/2026 USD 594,378 0.10
1,309,000 Roche Holding 2.875% 29/09/2021 USD 1,328,046 0.23
405,000 Santander Holdings USA 3.5% 07/06/2024 USD 411,537 0.07
612,000 Simon Property Group 4.25% 01/10/2044 USD 675,106 0.12
630,000 Synchrony Financial 2.85% 25/07/2022 USD 631,317 0.11
81,000 Teachers Insurance & Annuity 4.9% 15/09/2044 USD 95,623 0.02
34,000 Teachers Insurance & Annuity 6.85% 16/12/2039 USD 48,184 0.01
646,000 Time Warner Cable 4% 01/09/2021 USD 660,929 0.11
100,000 Time Warner Cable 5.25% 15/07/2042 GBP 144,868 0.03
218,000 United Health 3.35% 15/07/2022 USD 224,976 0.04
428,000 United Health 3.5% 15/06/2023 USD 447,194 0.08
714,000 United Health 4.25% 15/06/2048 USD 783,893 0.13
870,000 US Bancorp 3.6% 11/09/2024 USD 914,670 0.16
1,015,000 Verizon Communications 5.012% 15/04/2049 USD 1,201,268 0.21
900,000 Vulcan Material 4.5% 06/2047 USD 892,436 0.15
875,000 Wal-Mart Stores 4.05% 29/06/2048 USD 1,002,308 0.17
100,000 Wal-Mart Stores 5.625% 27/03/2034 GBP 184,631 0.03
574,000 Walt Disney 5.4% 01/10/2043 USD 752,649 0.13
81,000 Walt Disney 6.4% 15/12/2035 USD 112,498 0.02
528,000 Wells Fargo 3.3% 09/09/2024 USD 545,577 0.09
1,149,000 Wells Fargo 4.1% 03/06/2026 USD 1,217,687 0.21
100,000 Wells Fargo 4.875% 29/11/2035 GBP 158,437 0.03
1,349,000 Williams Partners 4.3% 04/03/2024 USD 1,432,287 0.25
675,000 ZF North America Capital 4.75% 29/04/2025 USD 697,758 0.12
Units of eligible UCITS and UCI's within the meaning of article 41 (1) e
of the Luxembourg Law of 17 December 2010
426,114,145 72.84
Collective Investment Schemes 426,114,145 72.84
Ireland 79,878,853 13.65
758,586 HSBC Economic Scale Worldwide Equity UCITS ETF USD 12,792,794 2.19
22,305,324 HSBC Global Liquidity Funds USD 22,305,324 3.81
450,372 HSBC Multi Factor Worldwide Equity UCITS ETF USD 8,637,009 1.48
13,280 Ishares Core S&P 500 ETF USD 3,947,347 0.67
62,551 Ishares Euro Corporate Bond Large Cap ETF EUR 9,837,601 1.68
82,985 Ishares USD Corporate Bond UCITS ETF USD 9,918,367 1.70
143,059 Vanguard FTSE All-World ETF USD 12,440,411 2.12
Luxembourg 239,716,967 40.98
67,178 AQR Managed Futures UCITS Fund Acc USD 7,449,368 1.27
195,711 HSBC Global Investment Funds - Global Asset Backed Bond "ZC" USD 29,268,580 5.00
2,627,861 HSBC Global Investment Funds - Global Emerging Markets Bond "ZQ" USD 26,617,606 4.55
4,338,968 HSBC Global Investment Funds - Global Emerging Markets Local Debt "ZQ" USD 40,764,608 6.97
4,166,908 HSBC Global Investment Funds - Global Government Bond "ZQ" USD 45,848,492 7.84
2,018,066 HSBC Global Investment Funds - Global High Yield Bond "ZQ" USD 20,826,442 3.56
2,573,442 HSBC Global Investment Funds - Global Real Estate Equity "ZQ" USD 28,660,424 4.90
546,604 HSBC Global Investment Funds - Global Short Duration High Yeild Bond "ZQ" USD 5,544,751 0.95
268,978 HSBC Global Investment Funds - India Fixed Income "ZD" USD 2,858,967 0.49
980,867 HSBC Global Investment Funds - Multi-Asset Style Factors "ZC" EUR 11,806,662 2.02
83,943 Lyxor Core US TIPS (DR) UCITS ETF USD 8,652,005 1.48
1,011,324 Structured Investments Goldman Sachs Cross Asset USD Acc USD 11,419,062 1.95
United Kingdom 106,518,325 18.21
45,930,713 FTSE All World Index "Institutional Acc" GBP 106,518,325 18.21
Total Investments 565,546,658 96.67
Other Net Assets 19,471,495 3.33
Net Assets 585,018,153 100.00
The accompanying notes form an integral part of these financial statements.
47

Schedule of Investments and Other Net Assets as at 31 July 2019 (continued)
HSBC Portfolios - World Selection 3
Quantity/ Description Security Market Value Market Value as a Percentage
Face Value Currency USD of Net Assets %
Transferable Securities Admitted to an Official Stock Exchange Listing 69,409,545 7.74
Bonds 69,409,545 7.74
Australia 1,892,986 0.21
100,000 BHP Billiton Finance 4.3% 25/09/2042 GBP 169,664 0.02
150,000 BHP Billiton Finance 4.75% VRN 22/04/2076 EUR 179,866 0.02
100,000 BHP Billiton Finance 6.5% VRN 22/10/2077 GBP 139,627 0.02
140,000 Macquarie Bank 3.5% 18/12/2020 GBP 177,297 0.02
100,000 Scentre Management 1.375% 22/03/2023 EUR 116,837 0.01
100,000 Scentre Management 3.875% 16/07/2026 GBP 137,299 0.01
202,000 Sydney Airport Finance 2.75% 23/04/2024 EUR 254,535 0.03
480,000 Westpac Banking Corporation 4.11% VRN 24/07/2034 USD 490,025 0.05
80,000 Westpac Banking Corporation 4.421% 24/07/2039 USD 83,580 0.01
150,000 Westpac Banking Corporation 5% VRN Perp USD 144,256 0.02
Austria 507,124 0.06
423,000 Telekom Finanzmanagement 3.125% 03/12/2021 EUR 507,124 0.06
Belgium 546,745 0.06
157,000 Anheuser-Busch Inbev 1.75% 07/03/2025 GBP 197,698 0.02
300,000 KBC Groep 1.875% VRN 11/03/2027 EUR 349,047 0.04
Bermuda 304,571 0.03
275,000 IHS Markit 4.75% 01/08/2028 USD 304,571 0.03
Cayman Islands 620,141 0.07
244,000 Alibaba Group Holding 3.125% 28/11/2021 USD 247,465 0.03
345,000 Park Aerospace Holdings 5.5% 15/02/2024 USD 372,676 0.04
Channel Islands 528,216 0.06
350,000 Delphi Automotive 1.5% 10/03/2025 EUR 409,936 0.05
100,000 Delphi Automotive 1.6% 15/09/2028 EUR 118,280 0.01
Denmark 367,282 0.04
300,000 ISS Global 2.125% 02/12/2024 EUR 367,282 0.04
Finland 127,238 0.01
100,000 Pohjola Bank 2.5% 20/05/2022 GBP 127,238 0.01
France 5,613,739 0.63
100,000 ALD 1.25% 11/10/2022 EUR 116,061 0.01
119,000 AXA 3.25% VRN 28/05/2049 EUR 149,804 0.02
300,000 AXA 3.875% VRN Perp EUR 378,969 0.04
329,000 AXA 3.941% VRN Perp EUR 414,410 0.05
153,000 AXA 5.453% VRN Perp GBP 210,869 0.02
300,000 Banque Federative Credit Mutuel 3% 21/05/2024 EUR 374,962 0.04
28,000 BNP Paribas 5.75% 24/01/2022 GBP 37,793 0.01
100,000 BPCE 1.625% 31/01/2028 EUR 123,285 0.02
200,000 BPCE 3% 19/07/2024 EUR 256,924 0.03
100,000 Électricité de France 6% VRN Perp GBP 133,843 0.02
400,000 Essilor International 1.75% 09/04/2021 EUR 458,409 0.05
400,000 HSBC France 0.2% 04/09/2021 EUR 449,484 0.05
200,000 Orange 0.5% 15/01/2022 EUR 226,500 0.03
114,000 Orange 5.75% VRN Perp GBP 155,812 0.02
54,000 Orange 8.125% 20/11/2028 GBP 101,854 0.01
620,000 RCI Banque 1.75% 10/04/2026 EUR 729,831 0.08
100,000 RTE Reseau de Transport 1.625% 27/11/2025 EUR 122,835 0.01
300,000 Sanofi 1.75% 10/09/2026 EUR 376,105 0.04
300,000 SCOR 3% VRN 08/06/2046 EUR 370,779 0.04
200,000 SCOR 5.25% VRN Perp USD 188,789 0.02
100,000 Total 2.25% VRN Perp EUR 114,766 0.01
100,000 Total 3.875% VRN Perp EUR 121,655 0.01
The accompanying notes form an integral part of these financial statements.
48
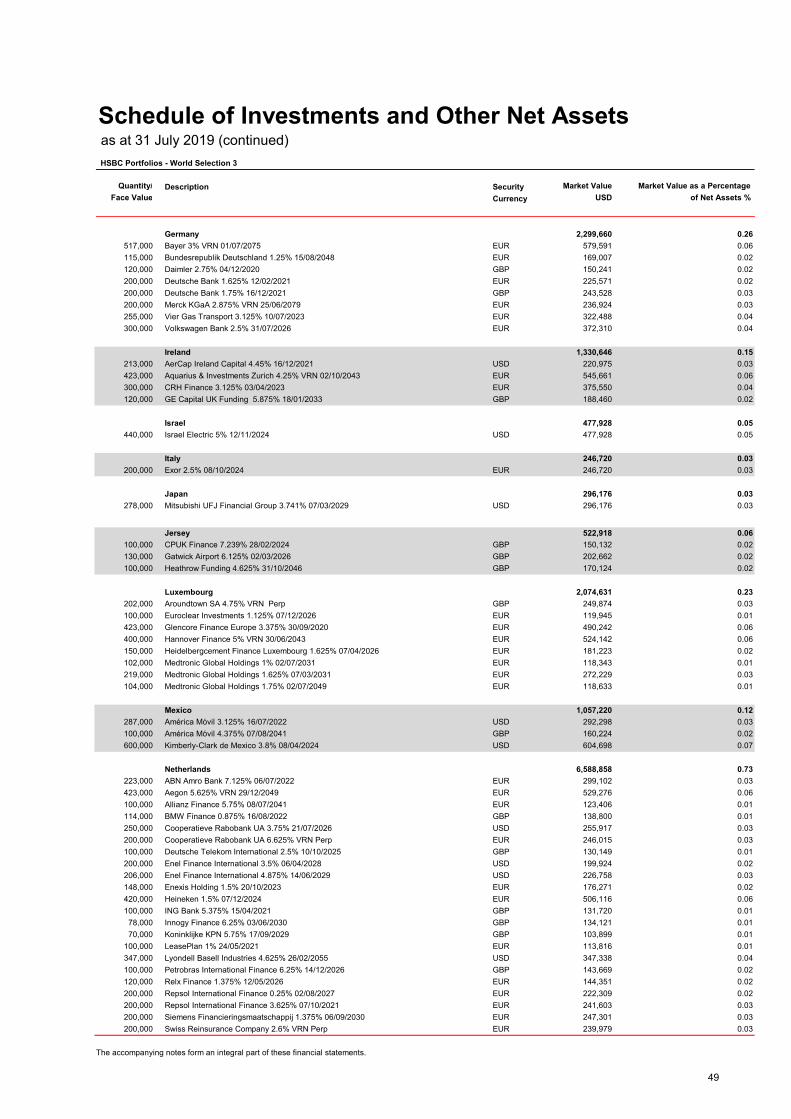
Schedule of Investments and Other Net Assets as at 31 July 2019 (continued)
HSBC Portfolios - World Selection 3
Quantity/ Description Security Market Value Market Value as a Percentage
Face Value Currency USD of Net Assets %
Germany 2,299,660 0.26
517,000 Bayer 3% VRN 01/07/2075 EUR 579,591 0.06
115,000 Bundesrepublik Deutschland 1.25% 15/08/2048 EUR 169,007 0.02
120,000 Daimler 2.75% 04/12/2020 GBP 150,241 0.02
200,000 Deutsche Bank 1.625% 12/02/2021 EUR 225,571 0.02
200,000 Deutsche Bank 1.75% 16/12/2021 GBP 243,528 0.03
200,000 Merck KGaA 2.875% VRN 25/06/2079 EUR 236,924 0.03
255,000 Vier Gas Transport 3.125% 10/07/2023 EUR 322,488 0.04
300,000 Volkswagen Bank 2.5% 31/07/2026 EUR 372,310 0.04
Ireland 1,330,646 0.15
213,000 AerCap Ireland Capital 4.45% 16/12/2021 USD 220,975 0.03
423,000 Aquarius & Investments Zurich 4.25% VRN 02/10/2043 EUR 545,661 0.06
300,000 CRH Finance 3.125% 03/04/2023 EUR 375,550 0.04
120,000 GE Capital UK Funding 5.875% 18/01/2033 GBP 188,460 0.02
Israel 477,928 0.05
440,000 Israel Electric 5% 12/11/2024 USD 477,928 0.05
Italy 246,720 0.03
200,000 Exor 2.5% 08/10/2024 EUR 246,720 0.03
Japan 296,176 0.03
278,000 Mitsubishi UFJ Financial Group 3.741% 07/03/2029 USD 296,176 0.03
Jersey 522,918 0.06
100,000 CPUK Finance 7.239% 28/02/2024 GBP 150,132 0.02
130,000 Gatwick Airport 6.125% 02/03/2026 GBP 202,662 0.02
100,000 Heathrow Funding 4.625% 31/10/2046 GBP 170,124 0.02
Luxembourg 2,074,631 0.23
202,000 Aroundtown SA 4.75% VRN Perp GBP 249,874 0.03
100,000 Euroclear Investments 1.125% 07/12/2026 EUR 119,945 0.01
423,000 Glencore Finance Europe 3.375% 30/09/2020 EUR 490,242 0.06
400,000 Hannover Finance 5% VRN 30/06/2043 EUR 524,142 0.06
150,000 Heidelbergcement Finance Luxembourg 1.625% 07/04/2026 EUR 181,223 0.02
102,000 Medtronic Global Holdings 1% 02/07/2031 EUR 118,343 0.01
219,000 Medtronic Global Holdings 1.625% 07/03/2031 EUR 272,229 0.03
104,000 Medtronic Global Holdings 1.75% 02/07/2049 EUR 118,633 0.01
Mexico 1,057,220 0.12
287,000 América Móvil 3.125% 16/07/2022 USD 292,298 0.03
100,000 América Móvil 4.375% 07/08/2041 GBP 160,224 0.02
600,000 Kimberly-Clark de Mexico 3.8% 08/04/2024 USD 604,698 0.07
Netherlands 6,588,858 0.73
223,000 ABN Amro Bank 7.125% 06/07/2022 EUR 299,102 0.03
423,000 Aegon 5.625% VRN 29/12/2049 EUR 529,276 0.06
100,000 Allianz Finance 5.75% 08/07/2041 EUR 123,406 0.01
114,000 BMW Finance 0.875% 16/08/2022 GBP 138,800 0.01
250,000 Cooperatieve Rabobank UA 3.75% 21/07/2026 USD 255,917 0.03
200,000 Cooperatieve Rabobank UA 6.625% VRN Perp EUR 246,015 0.03
100,000 Deutsche Telekom International 2.5% 10/10/2025 GBP 130,149 0.01
200,000 Enel Finance International 3.5% 06/04/2028 USD 199,924 0.02
206,000 Enel Finance International 4.875% 14/06/2029 USD 226,758 0.03
148,000 Enexis Holding 1.5% 20/10/2023 EUR 176,271 0.02
420,000 Heineken 1.5% 07/12/2024 EUR 506,116 0.06
100,000 ING Bank 5.375% 15/04/2021 GBP 131,720 0.01
78,000 Innogy Finance 6.25% 03/06/2030 GBP 134,121 0.01
70,000 Koninklijke KPN 5.75% 17/09/2029 GBP 103,899 0.01
100,000 LeasePlan 1% 24/05/2021 EUR 113,816 0.01
347,000 Lyondell Basell Industries 4.625% 26/02/2055 USD 347,338 0.04
100,000 Petrobras International Finance 6.25% 14/12/2026 GBP 143,669 0.02
120,000 Relx Finance 1.375% 12/05/2026 EUR 144,351 0.02
200,000 Repsol International Finance 0.25% 02/08/2027 EUR 222,309 0.02
200,000 Repsol International Finance 3.625% 07/10/2021 EUR 241,603 0.03
200,000 Siemens Financieringsmaatschappij 1.375% 06/09/2030 EUR 247,301 0.03
200,000 Swiss Reinsurance Company 2.6% VRN Perp EUR 239,979 0.03
The accompanying notes form an integral part of these financial statements.
49

Schedule of Investments and Other Net Assets as at 31 July 2019 (continued)
HSBC Portfolios - World Selection 3
Quantity/ Description Security Market Value Market Value as a Percentage
Face Value Currency USD of Net Assets %
Netherlands (continued)
400,000 Unilever 1% 03/06/2023 EUR 467,252 0.05
284,000 Unilever 1.125% 12/02/2027 EUR 343,853 0.04
300,000 Volkswagen International Finance 3.375% VRN Perp EUR 348,466 0.04
423,000 Wolters Kluwer 2.5% 13/05/2024 EUR 527,447 0.06
Saudi Arabia 368,852 0.04
360,000 Saudi Arabian Oil 3.5% 16/04/2029 USD 368,852 0.04
Spain 1,640,035 0.18
200,000 Banco Santander 2.125% 08/02/2028 EUR 238,361 0.03
100,000 Bankia 1% 25/06/2024 EUR 112,490 0.01
286,000 Ferrovial Emisiones 3.375% 07/06/2021 EUR 339,333 0.04
400,000 Red Électrica Finance 3.875% 25/01/2022 EUR 491,281 0.05
100,000 Santander Issuances 3.25% 04/04/2026 EUR 128,361 0.01
200,000 Telefonica Emisiones 1.495% 11/09/2025 EUR 240,628 0.03
60,000 Telefónica Emisiones 5.375% 02/02/2026 GBP 89,581 0.01
Sweden 468,819 0.05
300,000 Teliasonera 1.625% 23/02/2035 EUR 356,787 0.04
100,000 Volvo Treasury 0.1% 24/05/2022 EUR 112,032 0.01
Switzerland 1,930,474 0.22
300,000 Credit Suisse 1.25% 14/04/2022 EUR 345,921 0.04
181,000 Credit Suisse 3% 27/05/2022 GBP 232,480 0.03
468,000 Credit Suisse 3.625% 09/09/2024 USD 492,226 0.05
523,000 UBS 4.75% VRN 12/02/2026 EUR 621,163 0.07
200,000 UBS Group Funding 1.25% 01/09/2026 EUR 238,684 0.03
United Kingdom 10,139,144 1.13
150,000 Affinity Water Finance 5.875% 13/07/2026 GBP 238,496 0.03
250,000 Astrazeneca 3.375% 16/11/2025 USD 261,366 0.03
100,000 Aviva 6.625% VRN 03/06/2041 GBP 133,165 0.01
171,000 Barclays Bank 10% 21/05/2021 GBP 240,042 0.03
250,000 Barclays PLC 5.25% 17/08/2045 USD 268,036 0.03
100,000 BP Capital Markets 2.03% 14/02/2025 GBP 128,002 0.01
100,000 BUPA Finance 5% 08/12/2026 GBP 139,394 0.02
107,000 Cadent Finance 2.75% 22/09/2046 GBP 135,238 0.02
200,000 Centrica FRN 25/09/2020 USD 200,526 0.02
100,000 Compass Group 2% 03/07/2029 GBP 131,415 0.01
300,000 FCE Bank 1.528% 09/11/2020 EUR 340,964 0.04
125,000 Glaxo Smith Kline Capital 6.375% 09/03/2039 GBP 252,392 0.03
100,000 Hammerson 7.25% 21/04/2028 GBP 158,195 0.02
322,000 HSBC Holdings 0.875% 06/09/2024 EUR 371,834 0.04
100,000 HSBC Holdings 2.5% 15/03/2027 EUR 129,370 0.01
172,000 HSBC Holdings 2.625% 16/08/2028 GBP 219,605 0.02
226,000 HSBC Holdings 6% VRN Perp USD 230,049 0.03
150,000 HSBC Holdings 6.75% 11/09/2028 GBP 241,721 0.03
133,000 Legal & General Group 5.375% VRN 27/10/2045 GBP 182,156 0.02
200,000 Lloyds Banking Group 4.45% 08/05/2025 USD 212,229 0.02
100,000 Manc Airport Group Funding 4.75% 31/03/2034 GBP 160,476 0.02
100,000 Marks & Spencer 4.75% 12/06/2025 GBP 135,531 0.02
423,000 Mondi Finance 3.375% 28/09/2020 EUR 490,205 0.05
100,000 Motability Operations 2.375% 14/03/2032 GBP 130,024 0.01
179,000 NatWest Markets 1% 28/05/2024 EUR 201,781 0.02
221,000 NatWest Markets 3.625% 29/09/2022 USD 224,893 0.03
100,000 NGG Finance 5.625% VRN 18/06/2073 GBP 134,485 0.02
100,000 Peabody Capital 5.25% 17/03/2043 GBP 176,721 0.02
100,000 Places For People Homes 5.875% 23/05/2031 GBP 159,321 0.02
150,000 Prudential Financial 5% VRN 20/07/2055 GBP 199,012 0.02
100,000 Prudential Financial 5.7% VRN 19/12/2063 GBP 140,488 0.02
108,000 Santander UK Group Holdings 3.625% 14/01/2026 GBP 142,737 0.02
100,000 Severn Trent Utilities Finance 6.25% 07/06/2029 GBP 172,295 0.02
100,000 Severn Trent Water Utilities 2.75% 05/12/2031 GBP 134,583 0.02
100,000 Severn Trent Water Utilities 3.625% 16/01/2026 GBP 137,836 0.02
100,000 South Eastern Power Networks 6.375% 12/11/2031 GBP 181,353 0.02
100,000 SSE 3.875% VRN Perp GBP 124,489 0.01
100,000 Tesco Corporate Treasury Service 1.375% 24/10/2023 EUR 115,843 0.01
The accompanying notes form an integral part of these financial statements.
50

Schedule of Investments and Other Net Assets as at 31 July 2019 (continued)
HSBC Portfolios - World Selection 3
Quantity/ Description Security Market Value Market Value as a Percentage
Face Value Currency USD of Net Assets %
United Kingdom (continued)
100,000 Thames Water Utilities Finance 1.875% 24/01/2024 GBP 124,576 0.01
100,000 Thames Water Utilities Finance 2.375% 03/05/2023 GBP 123,746 0.01
100,000 Thames Water Utilities Finance 2.625% 24/01/2032 GBP 126,153 0.01
182,000 UK (Govt) 1% 22/04/2024 GBP 229,237 0.03
395,000 Unilever 1.5% 11/06/2039 EUR 479,849 0.05
475,000 Unilever 1.5% 22/07/2026 GBP 594,494 0.07
187,000 Vodafone Group 7% VRN 04/04/2079 USD 205,094 0.02
100,000 Western Power Distribution 3.5% 16/10/2026 GBP 130,877 0.01
150,000 Western Power Distribution 3.875% 17/10/2024 GBP 205,801 0.02
431,000 WPP Finance 3.75% 19/09/2024 USD 446,494 0.05
70,000 Zurich Finance 6.625% VRN Perp GBP 96,555 0.01
United States 29,459,422 3.29
35,000 Abbott Laboratories 3.75% 30/11/2026 USD 37,707 -
315,000 Air Products And Chemicals 3.35% 31/07/2024 USD 330,077 0.04
100,000 American Honda Finance 1.3% 21/03/2022 GBP 123,508 0.01
100,000 American International Group 5% 26/04/2023 GBP 138,700 0.02
400,000 American Tower 3.55% 15/07/2027 USD 411,620 0.05
452,000 Amgen 3.875% 15/11/2021 USD 465,739 0.05
100,000 Amgen 4% 13/09/2029 GBP 145,581 0.02
255,000 Anheuser-Busch InBev Worldwide 4.15% 23/01/2025 USD 275,192 0.03
111,000 Anheuser-Busch InBev Worldwide 5.55% 23/01/2049 USD 137,572 0.02
150,000 Apple 3.6% 31/07/2042 GBP 240,078 0.03
505,000 AT&T 4.9% 15/08/2037 USD 551,162 0.06
100,000 AT&T 5.2% 18/11/2033 GBP 158,877 0.02
470,000 AT&T 5.35% 01/09/2040 USD 529,688 0.06
85,000 Bank of America 3.419% VRN 20/12/2028 USD 87,530 0.01
67,000 Bank of America 4.2% 26/08/2024 USD 71,211 0.01
150,000 Bank of America 7% 31/07/2028 GBP 262,678 0.03
731,000 Bayer US Finance 4.4% 15/07/2044 USD 691,179 0.08
210,000 Brandywine Operating Partners 4.1% 01/10/2024 USD 218,735 0.02
300,000 Bristol Myers Squibb 1% 15/05/2025 EUR 354,494 0.04
600,000 Burlington Northern Santa 4.55% 01/09/2044 USD 691,383 0.08
290,000 Capital One Financial 1.65% 12/06/2029 EUR 334,563 0.04
430,000 Citigroup Inc 5.5% 13/09/2025 USD 486,106 0.05
84,000 Citigroup Inc 8.125% 15/07/2039 USD 134,960 0.02
190,000 Citigroup Inc 4.75% 18/05/2046 USD 215,657 0.02
395,000 Comcast Corporation 3.95% 15/10/2025 USD 426,000 0.05
500,000 Comerica 3.8% 22/07/2026 USD 523,483 0.06
259,000 Continental Resources 4.9% 01/06/2044 USD 265,563 0.03
373,000 CSX 4.5% 01/08/2054 USD 408,633 0.05
63,000 CVS Health Corp 4.78% 25/03/2038 USD 66,697 0.01
700,000 Dell International 4.9% 01/10/2026 USD 732,463 0.08
185,000 Devon Energy Corporation 5% 15/06/2045 USD 209,627 0.02
350,000 Discovery Communications 1.9% 19/03/2027 EUR 417,783 0.05
243,000 Dominion Resources 5.75% VRN 01/10/2054 USD 253,506 0.03
740,000 Dow Chemical 3.5% 01/10/2024 USD 767,957 0.09
71,000 Duke Energy Pogress 4.15% 01/12/2044 USD 77,985 0.01
438,000 EMD Finance 3.25% 19/03/2025 USD 448,197 0.05
672,000 Energy Transfer Partners 5.15% 01/02/2043 USD 684,220 0.08
229,000 Enlink Midstream Partners 5.05% 01/04/2045 USD 193,701 0.02
200,000 Enterprise Products 5.375% VRN 15/02/2078 USD 191,842 0.02
288,000 EOG Resources 3.15% 01/04/2025 USD 297,933 0.03
149,000 Fiserv 2.25% 01/07/2025 GBP 188,269 0.02
325,000 Ford Motor Credit 3.021% 06/03/2024 EUR 388,046 0.04
487,000 Ford Motor Credit 5.875% 02/08/2021 USD 513,098 0.06
177,000 General Electric 5.875% 14/01/2038 USD 206,538 0.02
120,000 General Motors Financial 4.35% 17/01/2027 USD 122,581 0.01
300,000 General Motors Financial FRN 06/11/2021 USD 300,383 0.03
515,000 Goldman Sachs 3.5% 16/11/2026 USD 528,910 0.06
190,000 Goldman Sachs 4.75% 21/10/2045 USD 221,871 0.02
125,000 HCA 5.25% 15/06/2049 USD 131,347 0.01
738,000 HCP 3.875% 15/08/2024 USD 783,147 0.09
400,000 International Business Machines 0.375% 31/01/2023 EUR 453,477 0.05
87,000 Johnson Controls 4.625% 02/07/2044 USD 90,088 0.01
806,000 JP Morgan Chase 3.875% 10/09/2024 USD 848,750 0.09
125,000 JP Morgan Chase 4.005% VRN 23/04/2029 USD 134,701 0.01
The accompanying notes form an integral part of these financial statements.
51

Schedule of Investments and Other Net Assets as at 31 July 2019 (continued)
HSBC Portfolios - World Selection 3
Quantity/ Description Security Market Value Market Value as a Percentage
Face Value Currency USD of Net Assets %
United States (continued)
377,000 Kilroy Realty 4.25% 15/08/2029 USD 402,376 0.04
169,000 Kinder Morgan 5.55% 01/06/2045 USD 194,550 0.02
450,000 Kinder Morgan Energy 3.95% 01/09/2022 USD 467,444 0.05
70,000 Kinder Morgan Energy Partners 5.4% 01/09/2044 USD 78,281 0.01
284,000 KLA Tencor 5% 15/03/2049 USD 325,153 0.04
83,000 Kroger 3.875% 15/10/2046 USD 75,188 0.01
287,000 Liberty Mutual Group 4.85% 01/08/2044 USD 320,157 0.04
285,000 Lowe's Companies 4.25% 15/09/2044 USD 291,800 0.03
528,000 Marathon Petroleum 3.625% 15/09/2024 USD 549,635 0.06
160,000 Marathon Petroleum 4.75% 15/09/2044 USD 167,286 0.02
47,000 Medtronic 4.625% 15/03/2045 USD 58,163 0.01
422,000 Merck 4% 07/03/2049 USD 469,581 0.05
312,000 Metropolitan Life Global Funding I 3% 10/01/2023 USD 318,477 0.04
158,000 Microsoft 3.45% 08/08/2036 USD 167,335 0.02
167,000 Microsoft 4.2% 03/11/2035 USD 192,145 0.02
167,000 Morgan Stanley 3.125% 27/07/2026 USD 169,668 0.02
317,000 Morgan Stanley 4.35% 08/09/2026 USD 340,046 0.04
467,000 Motorola Solutions 4% 01/09/2024 USD 485,311 0.05
50,000 Mplx LP 5.2% 01/03/2047 USD 53,509 0.01
423,000 Prologis 3.375% 20/02/2024 EUR 542,741 0.06
447,000 Realty Income 4.125% 15/10/2026 USD 485,717 0.05
209,000 Roche Holding 2.875% 29/09/2021 USD 212,041 0.02
205,000 Santander Holdings USA 3.5% 07/06/2024 USD 208,309 0.02
212,000 Simon Property Group 4.25% 01/10/2044 USD 233,860 0.03
320,000 Synchrony Financial 2.85% 25/07/2022 USD 320,669 0.04
34,000 Teachers Insurance & Annuity 6.85% 16/12/2039 USD 48,184 0.01
645,000 Time Warner Cable 4% 01/09/2021 USD 659,906 0.07
100,000 Time Warner Cable 5.25% 15/07/2042 GBP 144,868 0.02
129,000 United Health 3.5% 15/06/2023 USD 134,785 0.01
200,000 United Health 4.25% 15/06/2048 USD 219,578 0.02
217,000 US (Govt) 2.25% 15/11/2024 USD 221,416 0.02
86,000 US (Govt) 3% 15/02/2049 USD 93,753 0.01
515,000 Verizon Communications 5.012% 15/04/2049 USD 609,510 0.07
250,000 Wal-Mart Stores 4.05% 29/06/2048 USD 286,374 0.03
100,000 Wal-Mart Stores 5.625% 27/03/2034 GBP 184,631 0.02
573,000 Wells Fargo 4.1% 03/06/2026 USD 607,254 0.07
100,000 Wells Fargo 4.875% 29/11/2035 GBP 158,437 0.02
597,000 Williams Partners 4.3% 04/03/2024 USD 633,859 0.07
345,000 ZF North America Capital 4.75% 29/04/2025 USD 356,632 0.04
Units of eligible UCITS and UCI's within the meaning of article 41 (1) e
of the Luxembourg Law of 17 December 2010 805,858,254 89.90
Collective Investment Schemes 805,858,254 89.90
Ireland 176,417,680 19.68
2,187,619 HSBC Economic Scale Worldwide Equity UCITS ETF USD 36,892,007 4.12
37,726,750 HSBC Global Liquidity Funds USD 37,726,750 4.21
1,160,652 HSBC Multi Factor Worldwide Equity UCITS ETF USD 22,258,404 2.48
980,723 Ishares Core MSCI Emerging Markets ETF USD 27,293,521 3.04
57,069 Ishares Core MSCI Pacific Ex Japan ETF USD 8,859,392 0.99
75,070 Ishares Core S&P 500 ETF USD 22,313,807 2.49
242,339 Vanguard FTSE All-World ETF USD 21,073,799 2.35
Luxembourg 333,973,749 37.26
134,134 AQR Managed Futures UCITS Fund Acc USD 14,874,119 1.66
177,183 HSBC Global Investment Funds - Global Asset Backed Bond "ZC" USD 26,497,718 2.96
747,799 HSBC Global Investment Funds - Global Corporate Bond "ZQ" USD 8,358,900 0.93
4,417,342 HSBC Global Investment Funds - Global Emerging Markets Bond "ZQ" USD 44,743,257 4.99
7,585,101 HSBC Global Investment Funds - Global Emerging Markets Local Debt "ZQ" USD 71,262,024 7.95
1,402,024 HSBC Global Investment Funds - Global Government Bond "ZQ" USD 15,426,466 1.72
4,800,357 HSBC Global Investment Funds - Global High Yield Bond "ZQ" USD 49,539,688 5.53
4,040,938 HSBC Global Investment Funds - Global Real Estate Equity "ZQ" USD 45,003,924 5.02
928,265 HSBC Global Investment Funds - Global Short Duration High Yeild Bond "ZQ" USD 9,416,320 1.05
404,405 HSBC Global Investment Funds - India Fixed Income "ZD" USD 4,298,421 0.48
733,720 HSBC Global Investment Funds - Multi-Asset Style Factors "ZC" EUR 8,831,762 0.99
The accompanying notes form an integral part of these financial statements.
52
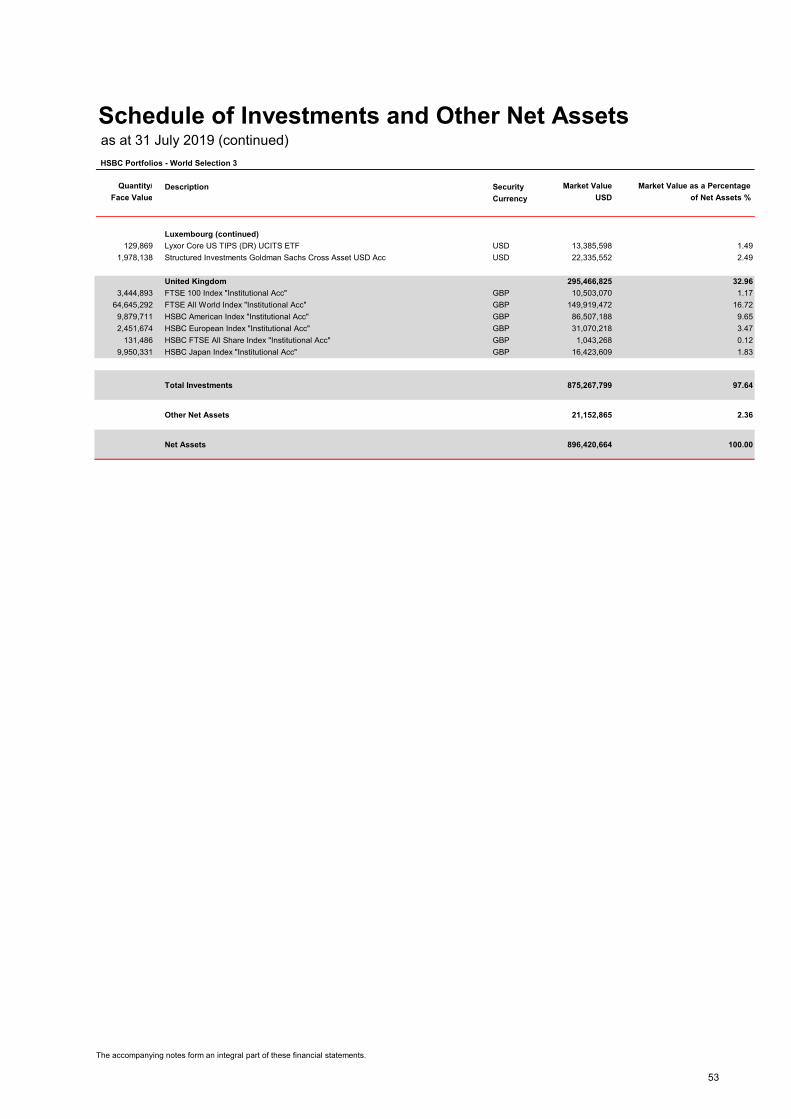
Schedule of Investments and Other Net Assets as at 31 July 2019 (continued)
HSBC Portfolios - World Selection 3
Quantity/ Description Security Market Value Market Value as a Percentage
Face Value Currency USD of Net Assets %
Luxembourg (continued)
129,869 Lyxor Core US TIPS (DR) UCITS ETF USD 13,385,598 1.49
1,978,138 Structured Investments Goldman Sachs Cross Asset USD Acc USD 22,335,552 2.49
United Kingdom 295,466,825 32.96
3,444,893 FTSE 100 Index "Institutional Acc" GBP 10,503,070 1.17
64,645,292 FTSE All World Index "Institutional Acc" GBP 149,919,472 16.72
9,879,711 HSBC American Index "Institutional Acc" GBP 86,507,188 9.65
2,451,674 HSBC European Index "Institutional Acc" GBP 31,070,218 3.47
131,486 HSBC FTSE All Share Index "Institutional Acc" GBP 1,043,268 0.12
9,950,331 HSBC Japan Index "Institutional Acc" GBP 16,423,609 1.83
Total Investments 875,267,799 97.64
Other Net Assets 21,152,865 2.36
Net Assets 896,420,664 100.00
The accompanying notes form an integral part of these financial statements.
53

Schedule of Investments and Other Net Assets as at 31 July 2019 (continued)
HSBC Portfolios - World Selection 4
Quantity Description Security Market Value Market Value as a Percentage
Currency USD of Net Assets %
Units of eligible UCITS and UCI's within the meaning of article 41 (1) e
of the Luxembourg Law of 17 December 2010 718,543,274 98.14
Collective Investment Schemes 718,543,274 98.14
Ireland 243,515,319 33.26
3,062,742 HSBC Economic Scale Worldwide Equity UCITS ETF USD 51,650,081 7.06
20,500,933 HSBC Global Liquidity Funds USD 20,500,933 2.80
1,606,581 HSBC Multi Factor Worldwide Equity UCITS ETF USD 30,810,207 4.21
1,108,368 Ishares Core MSCI Emerging Markets ETF USD 30,845,881 4.21
64,598 Ishares Core MSCI Pacific Ex Japan ETF USD 10,028,193 1.37
69,569 Ishares Core S&P 500 ETF USD 20,678,690 2.82
908,479 Vanguard FTSE All-World ETF USD 79,001,334 10.79
Luxembourg 182,229,298 24.89
134,835 AQR Managed Futures UCITS Fund Acc USD 14,951,853 2.04
363,865 HSBC Global Investment Funds - Global Corporate Bond "ZQ" USD 4,067,287 0.56
1,771,553 HSBC Global Investment Funds - Global Emerging Markets Bond "ZQ" USD 17,944,057 2.45
6,373,108 HSBC Global Investment Funds - Global Emerging Markets Local Debt "ZQ" USD 59,875,350 8.18
1,560,450 HSBC Global Investment Funds - Global High Yield Bond "ZQ" USD 16,103,840 2.20
3,242,757 HSBC Global Investment Funds - Global Real Estate Equity "ZQ" USD 36,114,584 4.93
731,399 HSBC Global Investment Funds - Global Short Duration High Yeild Bond "ZQ" USD 7,419,312 1.01
327,037 HSBC Global Investment Funds - India Fixed Income "ZD" USD 3,476,076 0.48
1,972,947 Structured Investments Goldman Sachs Cross Asset USD Acc USD 22,276,939 3.04
United Kingdom 292,798,657 39.99
3,284,435 FTSE 100 Index "Institutional Acc" GBP 10,013,852 1.37
49,223,286 FTSE All World Index "Institutional Acc" GBP 114,154,161 15.59
12,508,369 HSBC American Index "Institutional Acc" GBP 109,523,829 14.96
2,835,943 HSBC European Index "Institutional Acc" GBP 35,940,074 4.91
483,581 HSBC FTSE All Share Index "Institutional Acc" GBP 3,836,941 0.52
11,711,062 HSBC Japan Index "Institutional Acc" GBP 19,329,800 2.64
Total Investments 718,543,274 98.14
Other Net Assets 13,586,131 1.86
Net Assets 732,129,405 100.00
The accompanying notes form an integral part of these financial statements.
54

Schedule of Investments and Other Net Assets as at 31 July 2019 (continued)
HSBC Portfolios - World Selection 5
Quantity Description Security Market Value Market Value as a Percentage
Currency USD of Net Assets %
Units of eligible UCITS and UCI's within the meaning of article 41 (1) e
of the Luxembourg Law of 17 December 2010 314,933,365 98.43
Collective Investment Schemes 314,933,365 98.43
Ireland 118,453,243 37.02
1,383,977 HSBC Economic Scale Worldwide Equity UCITS ETF USD 23,339,388 7.29
9,323,185 HSBC Global Liquidity Funds USD 9,323,185 2.91
745,276 HSBC Multi Factor Worldwide Equity UCITS ETF USD 14,292,530 4.47
719,721 Ishares Core MSCI Emerging Markets ETF USD 20,029,835 6.26
41,803 Ishares Core MSCI Pacific Ex Japan ETF USD 6,489,498 2.03
121,004 Ishares Core S&P 500 ETF USD 35,967,229 11.24
103,629 Vanguard FTSE All-World ETF USD 9,011,578 2.82
Luxembourg 56,034,673 17.51
58,442 AQR Managed Futures UCITS Fund Acc USD 6,480,633 2.03
331,313 HSBC Global Investment Funds - Global Emerging Markets Bond "ZQ" USD 3,355,869 1.05
1,553,932 HSBC Global Investment Funds - Global Emerging Markets Local Debt "ZQ" USD 14,599,192 4.56
308,280 HSBC Global Investment Funds - Global High Yield Bond "ZQ" USD 3,181,449 0.99
1,436,587 HSBC Global Investment Funds - Global Real Estate Equity "ZQ" USD 15,999,275 5.00
156,046 HSBC Global Investment Funds - Global Short Duration High Yeild Bond "ZQ" USD 1,582,931 0.49
72,627 HSBC Global Investment Funds - India Fixed Income "ZD" USD 771,952 0.24
891,258 Structured Investments Goldman Sachs Cross Asset USD Acc USD 10,063,372 3.15
United Kingdom 140,445,449 43.90
1,919,338 FTSE 100 Index "Institutional Acc" GBP 5,851,834 1.83
21,470,902 FTSE All World Index "Institutional Acc" GBP 49,793,359 15.56
5,150,912 HSBC American Index "Institutional Acc" GBP 45,101,617 14.10
1,874,075 HSBC European Index "Institutional Acc" GBP 23,750,265 7.42
386,367 HSBC FTSE All Share Index "Institutional Acc" GBP 3,065,606 0.96
7,805,094 HSBC Japan Index "Institutional Acc" GBP 12,882,768 4.03
Total Investments 314,933,365 98.43
Other Net Assets 5,029,355 1.57
Net Assets 319,962,720 100.00
The accompanying notes form an integral part of these financial statements.
55

56
Appendix I (Unaudited Additional Disclosures) – Taxation of the Company (foreign countries)
The following summary is based on the Company’s understanding of the law and practice currently in force in the in other jurisdictions and is
subject to changes therein.
Germany
New Investment fund Tax Regime effective as from 1 January 2018.
The Investment Tax Reform Act published in the federal gazette on 26 July 2016 fundamentally changes the German investment taxation. As
from 1 January 2018 the currently known transparent tax regime will be replaced by an opaque tax regime for any investment vehicle within the
meaning of the German Capital Investment Code.
The sub-funds listed below will seek to continuously invest (either directly or indirectly via underlying UCITS or Eligible UCIs) a minimum
percentage of their net assets in equity assets as defined in sec. 2 para 8 German Investment Tax Act (2018).
United Kingdom
On the basis that the Company is not resident in the United Kingdom for tax purposes it should not be subject to United Kingdom corporation tax
on its income and capital gains.
In many markets the Company, as a foreign investment fund, may be subject to non-recoverable tax on income and gains (either by withholding
or direct assessment) in relation to the investment returns it realizes from its holdings of shares and securities in those markets. Where practicable
the Company will make claims under the relevant double tax treaties and domestic law of the countries concerned in order to minimize the impact
of local taxation on the investment return and to obtain the best return for its shareholders. Those claims will be made on the basis of the
Company’s understanding of the validity of such claims given the information available from the Company’s custodians, external advisers and
other sources as` to the interpretation and application of the relevant legal provisions by the tax authorities in the country concerned.
The Company will seek to provide for tax on capital gains where it considers that it is more likely than not that the tax will be payable, given the
advice and information available to the Company at the date concerned. However, any provision held may be insufficient to cover, or be in excess
of, any final liability.
The Company will seek to claim concessionary tax treatment and account for tax on a best efforts basis, given the tax law and practice at that
date. Any change in tax law or practice in any country where the Company is registered, marketed or invested could affect the value of the
Company’s investments in the affected country.
In particular, where retrospective changes to tax law or practice are applied by the legislature or tax authorities in a particular country these may
result in a loss for current Shareholders in the affected sub fund. The Company does not offer any warranty as to the tax position of returns from
investments held in a particular market nor of the risk of a retrospective assessment to tax in a particular market or country.
% of Portfolios' Net Assets Portfolios
At least 51% HSBC Portfolios - World Selection 5
At least 25% HSBC Portfolios - World Selection 3
HSBC Portfolios - World Selection 4

57
Appendix II (Unaudited Additional Disclosures) – UK SORP Disclosure
Investment Risk
Information in relation to certain investment risks are disclosed for selected Portfolios as follows:
Market risk
Market risk is the risk that the fair value or future cash flows of financial instruments will fluctuate due to changes in market variables such as
market prices, foreign exchange rates and interest rates. It comprises of three major types of risks i.e. currency risk, interest rate risk and other
price risk.
As invested in securities and collective investment schemes, the Company is exposed to the risk that the equity and fixed income markets decline.
(i) Currency risk
Currency risk is the risk that the fair value or future cash flows of a financial asset will fluctuate because of changes in foreign exchange rates.
The below table summarises the following Portfolios’ exposure to currency risks.
(ii) Interest rate risk
Interest rate risk is the risk that the fair value or future cash flows of a financial asset will fluctuate because of changes in market interest rates.
The following table details the below Portfolios’ exposure to interest rate risks.
Portfolio Currency
Net currency exposure in
Portfolio currency
HSBC Portfolios - World Selection 1
EUR 200,251,658
GBP 97,789,219
Other 44,260,848
HSBC Portfolios - World Selection 2
EUR 204,001,006
GBP 216,111,722
Other 14,932,770
HSBC Portfolios - World Selection 3
EUR 239,078,511
GBP 463,864,565
Other 33,046,613
HSBC Portfolios - World Selection 4
EUR 436,088,937
GBP 376,146,762
Other 7,223,717
HSBC Portfolios - World Selection 5
EUR 187,575,175
GBP 170,293,560
Other 19,962,475
HSBC Portfolios -
World Selection 1
USD
HSBC Portfolios -
World Selection 2
USD
HSBC Portfolios -
World Selection 3
USD
HSBC Portfolios -
World Selection 4
USD
HSBC Portfolios -
World Selection 5
USD
Cash at bank and at broker 17,566,731 18,620,037 25,645,992 16,440,618 5,133,380
Bank overdraft 2,929,372 125,503 668,805 69,186 64,729
Bonds 170,794,782 139,432,513 69,409,545 - -
Total 191,290,885 158,178,053 95,724,342 16,509,804 5,198,109

58
Appendix II (Unaudited Additional Disclosures) – UK SORP Disclosure (continued)
Investment Risk (continued)
Market risk (continued)
(iii) Credit risk
The Company is subject to credit risk as the Portfolios invest in bonds.
Analysis of direct credit risk
Credit risk arising on bonds is mitigated by investing in government bonds where the credit risk is minimal, or corporate bonds which are rated at
least investment grade. The Portfolios also invest in high yield and emerging market bonds which are non-investment grade. The Portfolios
manage the associated risk by diversifying the portfolio to minimise the impact of default by any one issuer.
(iv) Other price risk
Other price risk is the risk that the fair value or future cash flows of a financial asset will fluctuate because of changes in market prices (other than
those arising from interest rate risk or currency risk), whether those changes are caused by factors specific to the individual financial instrument
or its issuer, or factors affecting all similar financial instruments traded in the market.
Other price risk arises principally in relation to the Portfolios’ return seeking portfolio which includes collective investment scheme.
The Portfolios manage this exposure to other price risk by constructing a diverse portfolio of investments across various markets.
At the year end, the Portfolios’ exposure to investments subject to other price risk was:
Currency Investment grade
Non-investment
grade Unrated Total
HSBC Portfolios - World Selection 1 USD 154,521,102 15,637,581 270,807,081 440,965,764
HSBC Portfolios - World Selection 2 USD 111,558,133 27,322,700 426,665,825 565,546,658
HSBC Portfolios - World Selection 3 USD 55,108,781 14,071,527 806,087,491 875,267,799
HSBC Portfolios - World Selection 4 USD - - 718,543,274 718,543,274
HSBC Portfolios - World Selection 5 USD - - 314,933,365 314,933,365
HSBC Portfolios - World Selection 1
USD
Indirect
Collective Investment Schemes 270,170,982
HSBC Portfolios - World Selection 2
USD
Indirect
Collective Investment Schemes 426,114,145
HSBC Portfolios - World Selection 3
USD
Indirect
Collective Investment Schemes 805,858,254
HSBC Portfolios - World Selection 4
USD
Indirect
Collective Investment Schemes 718,543,274
HSBC Portfolios - World Selection 5
USD
Indirect
Collective Investment Schemes 314,933,365

59
Appendix II (Unaudited Additional Disclosures) – UK SORP Disclosure (continued)
Investment Risk (continued)
Fair value hierarchy
Fair value is the amount for which an asset could be exchanged, a liability settled, or an equity instrument granted could be exchanged, between knowledgeable, willing parties in an arm’s length transaction.
The fair value of financial instruments has been determined using the following fair value hierarchy:
Category (a) The quoted price for an identical asset in an active market.
Category (b) When quoted prices are unavailable, the price of a recent transaction for an identical asset adjusted if necessary.
Category (c) Where a quoted price is not available and recent transactions of an identical asset on their own are not a good estimate of fair value, the fair value is determined by using a valuation technique which uses:
Category (c) (i) observable market data; or
Category (c) (ii) non-observable data.
The Portfolios’ investment assets and liabilities have been fair valued using the above hierarchy categories as follows:
Portfolio Currency Category (a) Category (b) Category c (i) Category c (ii) Total
HSBC Portfolios - World Selection 1 USD 171,150,866 270,754,171 - - 441,905,037
HSBC Portfolios - World Selection 2 USD 139,836,152 424,362,904 - - 564,199,056
HSBC Portfolios - World Selection 3 USD 70,148,957 802,270,551 - - 872,419,508
HSBC Portfolios - World Selection 4 USD 458,805 715,763,717 - - 716,222,522
HSBC Portfolios - World Selection 5 USD 349,815 313,817,784 - - 314,167,599
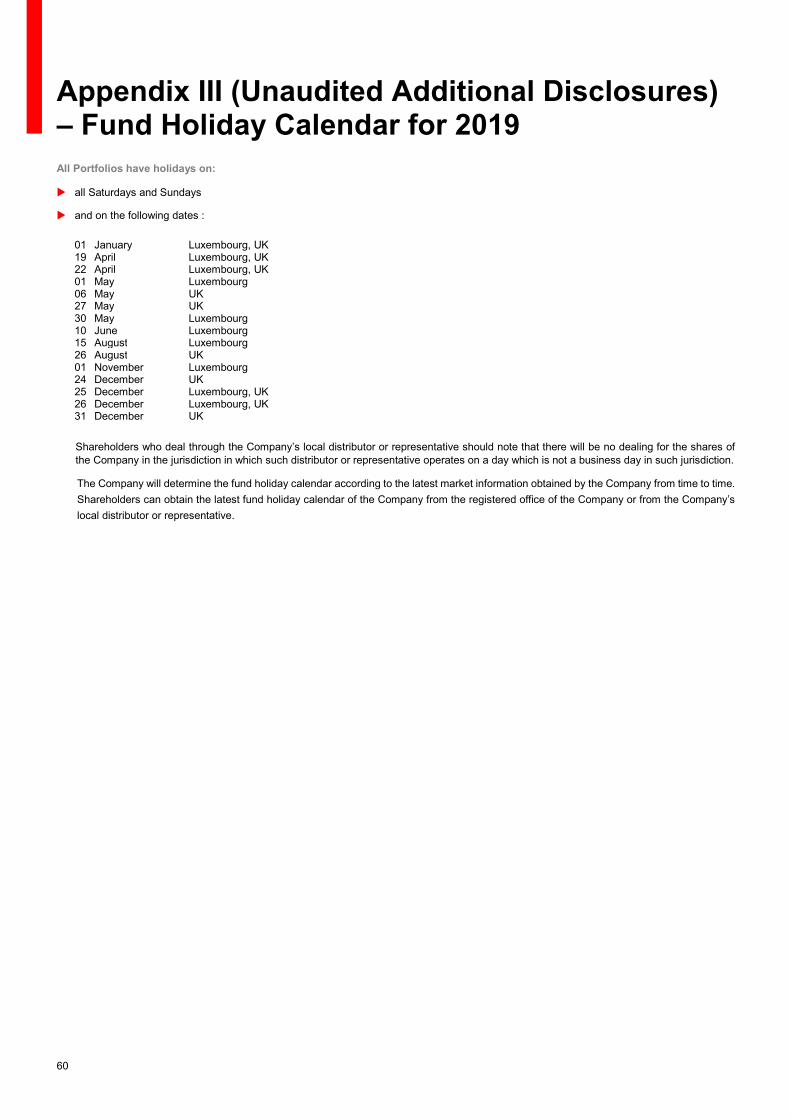
60
Appendix III (Unaudited Additional Disclosures) – Fund Holiday Calendar for 2019
All Portfolios have holidays on:
all Saturdays and Sundays
and on the following dates :
01 January Luxembourg, UK 19 April Luxembourg, UK 22 April Luxembourg, UK 01 May Luxembourg 06 May UK 27 May UK 30 May Luxembourg 10 June Luxembourg 15 August Luxembourg 26 August UK 01 November Luxembourg 24 December UK 25 December Luxembourg, UK 26 December Luxembourg, UK 31 December UK
Shareholders who deal through the Company’s local distributor or representative should note that there will be no dealing for the shares of the Company in the jurisdiction in which such distributor or representative operates on a day which is not a business day in such jurisdiction.
The Company will determine the fund holiday calendar according to the latest market information obtained by the Company from time to time.
Shareholders can obtain the latest fund holiday calendar of the Company from the registered office of the Company or from the Company’s
local distributor or representative.

61
Appendix IV (Unaudited Additional Disclosures) – Publication of TER (Total Expense Ratio)
The Total Expense Ratio (“TER”) has been computed by the Administrator as required per the Swiss Funds & Asset Management Association
guidelines on the calculation and disclosure of the TER of collective investment schemes. The actual expenses incurred during the year are
annualised and calculated as a percentage of the average Asset Under Management of the share class for the year. The TER also includes the
percentage corresponding to passive hedging fees.
Synthetic TER, which includes the TER percentage of the underlying fund of funds held in the Portfolios, is also computed by the Administrator.
Total Expense Ratio (%) for the active Portfolios and share classes for the year ended 31 July 2019:
HSBC Portfolios HSBC Portfolios HSBC Portfolios HSBC Portfolios HSBC Portfolios
World Selection 1 World Selection 2 World Selection 3 World Selection 4 World Selection 5
Class A (C) USD 1.25 1.24 1.44 1.40 1.53
Class A (C) (HAUD) - - 1.58 1.52 1.64
Class A (C) (HEUR) 1.28 1.28 1.48 1.42 1.55
Class A (C) (HGBP) 1.28 1.27 1.47 1.43 1.55
Class A (C) (HSGD) 1.36 1.36 1.53 1.52 1.58
Class A (D) (USD) - 1.34 - - -
Class A (D) (HEUR) - 1.38 1.59 1.54 1.63
Class A (D) (HGBP) - 1.32 - - -
Class A (M) (HKD) 1.25 1.26 1.45 1.45 1.60
Class A (M) (USD) 1.26 1.25 1.45 1.45 1.60
Class A (M) (FLXHKD) - - 1.55 1.50 -
Class A (M) (FLXUSD) - - 1.55 1.50 -
Class A (M) (FLXHAUD) - - 1.57 1.53 -
Class A (M) (FLXHEUR) - - 1.56 1.52 -
Class A (M) (FLXHGBP) - - 1.58 1.54 -
Class A (M) (FLXHRMB) - - 1.57 1.52 -
Class A (M) (FLXHSGD) - - 1.56 1.51 -
Class A (M) (HAUD) 1.33 1.36 1.55 1.54 1.65
Class A (M) (HCNH) 1.40 1.37 1.56 1.51 1.70
Class A (M) (HEUR) 1.38 1.38 1.58 1.54 1.64
Class A (M) (HGBP) 1.35 1.37 1.55 1.54 1.64
Class A (M) (HSGD) 1.38 - 1.59 - 1.64
Class B (C) (USD) 0.82 0.75 0.85 0.80 0.95
Class B (C) (HEUR) 0.86 0.81 0.88 0.87 0.93
Class B (C) (HGBP) 0.77 0.76 0.89 0.83 0.90
Class X (C) (HGBP) - 0.77 - - -
Class X (C) (HJPY) 0.79 - - - -
Class Z (C) (HGBP) - 0.26 - - -
Class Z (D) (HGBP) - 0.33 - - -

62
Appendix V (Unaudited Additional Disclosures) – Securities Financing Transactions Regulation (“SFTR”)
While it is stated in the Prospectus that some sub-funds may invest up to 10% of its net assets in Total Return Swaps, as of the date of this annual report, no sub-fund is currently invested in Total Return Swaps and hence the Fund does not use any instruments falling within the
scope of SFTR.

HSBC Global Asset Management, the sponsor of HSBC Portfolios, is the asset management specialist of the HSBC Group and operates through HSBC Bank plc and its subsidiaries.
HSBC Global Asset Management is the trading name of HSBC Global Asset Management Limited. HSBC Global Asset Management is established at 8 Canada Square, London E14 5HQ, United Kingdom, which is its registered office.
© Copyright. HSBC Global Asset Management Limited 2019. All Rights Reserved 14846/06088


