30
Q4 2020 Quarterly Results and Outlook Conference Call February 25, 2021

Q4 2020Quarterly Results and OutlookConference CallFebruary 25, 2021
ADMINISTRATIVE ITEMSConference Call and Access to InformationMore information on Harsco's quarterly earnings, including the Company’s earnings press release issued today and this presentation, is available on the Investor Relations portion of Harsco’s website. Company management will discuss the Company's financial performance during a conference call today at 9:00 a.m. (ET). Both the presentation and access to the call are available at http://investors.harsco.com. A replay can also be accessed on the site for up to two weeks after the call.
Forward-Looking StatementsThe Company’s presentation contains forward-looking statements based on management’s current expectations, estimates and projections. The nature of the Company's business and the many countries in which it operates subject it to changing economic, competitive, regulatory and technological conditions, risks and uncertainties. In accordance with the "safe harbor" provisions of Section 27A of the Securities Act of 1933 and Section 21E of the Securities Exchange Act of 1934, the Company provides the following cautionary remarks regarding important factors that, among others, could cause future results to differ materially from the results contemplated by forward-looking statements, including the expectations and assumptions expressed or implied herein. Forward-looking statements contained herein could include, among other things, statements about management's confidence in and strategies for performance; expectations for new and existing products, technologies and opportunities; and expectations regarding growth, sales, cash flows, and earnings. Forward-looking statements can be identified by the use of such terms as "may," "could," "expect," "anticipate," "intend," "believe," "likely," "estimate," "outlook," "plan" or other comparable terms.
Factors that could cause actual results to differ, perhaps materially, from those implied by forward-looking statements include, but are not limited to: (1) changes in the worldwide business environment in which the Company operates, including changes in general economic conditions or changes due to COVID-19 and governmental and market reactions to COVID-19; (2) changes in currency exchange rates, interest rates, commodity and fuel costs and capital costs; (3) changes in the performance of equity and bond markets that could affect, among other things, the valuation of the assets in the Company's pension plans and the accounting for pension assets, liabilities and expenses; (4) changes in governmental laws and regulations, including environmental, occupational health and safety, tax and import tariff standards and amounts; (5) market and competitive changes, including pricing pressures, market demand and acceptance for new products, services and technologies; (6) the Company's inability or failure to protect its intellectual property rights from infringement in one or more of the many countries in which the Company operates; (7) failure to effectively prevent, detect or recover from breaches in the Company's cybersecurity infrastructure; (8) unforeseen business disruptions in one or more of the many countries in which the Company operates due to political instability, civil disobedience, armed hostilities, public health issues or other calamities; (9) disruptions associated with labor disputes and increased operating costs associated with union organization; (10) the seasonal nature of the Company's business; (11) the Company's ability to successfully enter into new contracts and complete new acquisitions or strategic ventures in the time-frame contemplated, or at all; (12) the integration of the Company's strategic acquisitions; (13) potential severe volatility in the capital markets; (14) failure to retain key management and employees; (15) the amount and timing of repurchases of the Company's common stock, if any; (16) the outcome of any disputes with customers, contractors and subcontractors; (17) the financial condition of the Company's customers, including the ability of customers (especially those that may be highly leveraged, have inadequate liquidity or whose business is significantly impacted by COVID-19) to maintain their credit availability; (18) implementation of environmental remediation matters; (19) risk and uncertainty associated with intangible assets and (20) other risk factors listed from time to time in the Company's SEC reports. A further discussion of these, along with other potential risk factors, can be found in Part I, Item 1A, "Risk Factors," of the Company's Annual Report on Form 10-K for the year ended December 31, 2019, together with those described in Item 1A, "Risk Factors," of the Company's Quarterly Report on Form 10-Q for the period ended September 30, 2020. The Company cautions that these factors may not be exhaustive and that many of these factors are beyond the Company's ability to control or predict. Accordingly, forward-looking statements should not be relied upon as a prediction of actual results. The Company undertakes no duty to update forward-looking statements except as may be required by law.
Non-GAAP MeasuresThroughout this presentation, the Company refers to certain non-GAAP measures, including without limitation, adjusted EBITDA (Earnings Before Interest Taxes Depreciation and Amortization) from continuing operations, adjusted EBITDA margin, adjusted diluted earnings per share from continuing operations, free cash flow and free cash flow before growth capital. For a reconciliation of non-GAAP measures to GAAP results and the Company’s rationale for its usage of non-GAAP measures, see the Appendix in this presentation.
2

– Resilient performance and continued progress on strategic initiatives
– Consolidated results improved further sequentially◦ Environmental results strong with more favorable market conditions◦ ESOL integration work progressing ahead of plan◦ Contaminated soil and rail market conditions continue to persist
– Harsco Team performed extremely well in 2020; pandemic response reflects safety and customer service culture
– 2021 outlook positive in all segments◦ Anticipate significant ESOL integration benefits◦ Focus on cost and capital discipline to support cash flow and debt reduction
– Strategic focus remains on transformation to a pure-play environmental solutions company
CEO PERSPECTIVE
3

2020 ESG HIGHLIGHTS
82% of revenues in 2020 derived from environmental segments
Achieved 83% participation rate in 2020 Employee Engagement survey
Total Recordable Incident Rate (TRIR) of 1.06, 15% better than our 2020 goal
19 operating sites certified to ISO 14001 environmental management standard in 2020
Clean Earth achieved the Gold Safety Award for the Waste Collection trade for 2020
Harsco upgraded to "BBB" ESG rating by MSCI in 2020
Harsco Rail received Silver CSR rating from EcoVadis in 2020
Named to Newsweek's America's Most Responsible Companies 2021 list
2020 ESG Performance Highlights1
1Complete list of 2020 ESG accomplishments will be available in our 2020 ESG report to be released later this year.
External ESG Recognition
4

KEY PERFORMANCE INDICATORS
(1) Excludes unusual items. Adjusted diluted earnings per share also excludes acquisition amortization.. See tables at end of presentation for GAAP to non-GAAP reconciliations. (2) See tables at end of presentation for GAAP to non-GAAP reconciliations.
$ in millions except EPS; Continuing Operations Q4 2020 Q4 2019 Q3 2020
Revenues, as reported 508 400 509
Operating Income - GAAP 11 20 5
Adjusted EBITDA1 62 61 59
% of Sales1 12.3% 15.2% 11.6%
GAAP Diluted Earnings (Loss) Per Share (0.07) 0.03 (0.10)
Adjusted Diluted Earnings Per Share1 0.12 0.12 0.08
Free Cash Flow2 (8) 28 18
Q4 2020 FINANCIAL SUMMARY
– Q4 2020 Adjusted EBITDA of $62 million near upper-end of guidance ($58 to $63 million)
– Adjusted EBITDA modestly above prior-year despite pandemic; Environmental and Rail improved year-on-year
– Sequential Adjusted EBITDA increase reflects improving economic conditions, particularly within Environmental
– ESOL integration progressing well; market pressures persist in Rail and Contaminated Materials
– Adjusted diluted EPS of $0.12; excludes unusual items related to ESOL integration as well as severance in Environmental
– Free cash flow performance impacted by working capital timing and capital spending
5

SUMMARY RESULTS$ in millions
Q4 2020 ENVIRONMENTALADJUSTED EBITDA BRIDGE1
$ in millionsQ4
2020Q4
2019Q3
2020
Revenues, as reported 246 243 223
Operating Income – GAAP 23 27 12
Adjusted EBITDA1 52 51 40
Adjusted EBITDA Margin1 21.2% 20.9% 17.9%
Free Cash Flow (FY) 69 13 na
51.0
(1.9) (0.6)
1.22.5 52.2
Q4 2019 New-ExitedSites (net)
LST/ServicesLevel
Ni & AppliedProducts
SG&A, FX, &Other
Q4 202035404550556065
– Adjusted EBITDA change Y/Y attributable to higher demand for applied products and lower administrative expenses, partially offset by site exits and a less favorable services mix
– Compared with Q3 20, Adjusted EBITDA increased by ~30%; reflects strong incremental margins on higher steel output and applied products demand
– Free cash flow in 2020 totaled $69 million; reflects reduced capital spending and working capital improvementsna = not applicable.
(1) Excludes unusual items; see tables at end of presentation for GAAP to non-GAAP reconciliations.
6

– Adjusted EBITDA Y/Y comparison driven by ESOL contributions offset by lower volumes / less favorable mix at legacy Clean Earth due to the pandemic and higher administrative costs
– Adjusted EBITDA change Q/Q reflects lower volumes for contaminated / dredged materials and a less favorable business mix
– Free cash flow performance strong; total of $55 million represents ~95% of adjusted EBITDA for the full year
ADJUSTED EBITDA BRIDGE1
$ in millionsSUMMARY RESULTS$ in millions
Q4 2020 CLEAN EARTH
Q4 2020
Q4 2019
Q3 2020
Revenues, as reported 185 82 194
Operating Income – GAAP 3 9 9
Adjusted EBITDA1 16 17 20
Adjusted EBITDA Margin1 8.6% 20.5% 10.4%
Free Cash Flow (FY) 55 29 na
16.8
6.1
(4.6)(2.4)
15.9
Q4 2019 HazardousWaste
ContaminatedMaterials / Dredge
SG&A /Other
Q4 20200
10
20
30
na = not applicable.Note: 2019 information does not include ESOL. (1) Excludes unusual items; see tables at end of presentation for GAAP to non-GAAP reconciliations.
7

– Revenue growth Y/Y attributable to increase in sales related to multi-year equipment projects and contract services
– Adjusted EBITDA change reflects lower manufacturing costs and higher contract services contributions, partially offset by less favorable equipment and aftermarket parts mix
– Sequential change in EBITDA due mainly to volume and mix of aftermarket business related to the pandemic
– Backlog totaled $441 million at year-end
ADJUSTED EBITDA BRIDGE1
$ in millionsSUMMARY RESULTS$ in millions
(1.8) (0.5)(2.6)
0.8
6.6 2.5
Q4 2019 MachineSales
AftermarketParts / Protran
ContractServices
SG&A /Other
Q4 2020-10
-5
0
5
10
Q4 2020 RAIL
Q4 2020
Q4 2019
Q3 2020
Revenues, as reported 77 75 93
Operating Income (Loss) – GAAP 1 (3) 4
Adjusted EBITDA13 (2) 5
Adjusted EBITDA Margin1 3.3% (2.5)% 5.8%
Free Cash Flow (FY) (34) (42) na
na = not applicable.. (1) Excludes unusual items; see tables at end of presentation for GAAP to non-GAAP reconciliations.
8

KEY PERFORMANCE INDICATORS
nmf = not meaningful.(1) Excludes unusual items. Adjusted diluted earnings per share also excludes acquisition amortization. See tables at end of presentation for GAAP to non-GAAP reconciliations. (2) See tables at end of presentation for GAAP to non-GAAP reconciliations.
Change vs 2019
$ in millions except EPS; Continuing Operations 2020 $ % or bps
Revenues, as reported 1,864 360 24%
Operating Income - GAAP 21 (83) nmf
Adjusted EBITDA1 238 (27) (10)%
% of Sales1 12.8% (480)bps
GAAP Diluted Earnings (Loss) Per Share (0.41) (0.76) (217)%
Adjusted Diluted Earnings Per Share1 0.49 (0.41) (46)%
Free Cash Flow2 2 34 nmf
– Revenues of $1.9B reflect acquisition impacts and Rail growth
– Adjusted EBITDA change the result of pandemic, offset by actions to support financial strength
– Aggressive actions included (1) Reduced capital expenditures significantly; (2) Implemented temporary and permanent cost reductions; (3) Funded ESOL acquisition with new debt financing; and (4) Amended credit agreement
– Year-end net leverage totaled 4.6x; liquidity exceeded $300 million
2020 FINANCIAL SUMMARY
9

Excluding unusual items 2021 VERSUS 2020
REVENUES ▲ 10% to 15%, including FX translation impacts
ADJUSTED EBITDA1 ▲ Approximately 20% at mid-point
DRIVERS+-
Services and applied products demand growth, new contracts / sites
Exited sites, SG&A spending
REVENUES ▲ 3% to 5% proforma; ~$790 million at mid-point
ADJUSTED EBITDA1 ▲ $72 to $78 million, net of $3 million additional Corporate allocation
DRIVERS+-
Full-year impact of ESOL, integration benefits, organic growth
SG&A investments, one-time integration costs, corporate allocation
REVENUES ▲ 15% to 20%
ADJUSTED EBITDA1 ▲ Approximately 25% at mid-point
DRIVERS+-
Equipment & Protran Technology growth, contracting volumes
After-market parts, R&D and SG&A investments
CORPORATE COSTS $33 to $34 million for the full-year
2021 SEGMENT OUTLOOK
(1) Excludes unusual items.
10

(1) Excludes unusual items. Adjusted diluted earnings per share exclude acquisition amortization expense. See tables at end of presentation for GAAP to non-GAAP reconciliations(2) See tables at end of presentation for GAAP to non-GAAP reconciliations.
2021 Outlook 2020 Actuals
GAAP OPERATING INCOME $93 - 113M $21M
ADJUSTED EBITDA1 $275 - 295M $238M
GAAP DILUTED EARNINGS PER SHARE $0.26 - $0.42 $(0.41)
ADJUSTED DILUTED EARNINGS PER SHARE1 $0.59 - $0.76 $0.49
FREE CASH FLOW BEFORE GROWTH CAPITAL1 $90 - 110M $42M
FREE CASH FLOW2 $30 - 50M $2M
2021 OUTLOOK - CONSOLIDATED
11

YEAR-OVER-YEAR CONSIDERATIONS INCLUDE:
Lower SG&A spending, more favorable services mix and FX, partially offset by applied
products demand and site exits
ESOL contributions, offset by lower contaminated soil / dredge volumes,
investments and additional Corporate cost allocation
Lower aftermarket parts contributions, partially offset by higher equipment and
technology volumes
Q1 2021 OUTLOOK
Adjusted EBITDA1 is expected to be between$52M –$58M
Corporate costs of$7 - 8 million
Adjusted diluted earnings per share1 of $0.01 –$0.10
(1) Adjusted operating income and adjusted diluted earnings per share are non-GAAP numbers. See tables at end of presentation for GAAP to non-GAAP reconciliations.
12

Q&A
13
Appendix
14

RECONCILIATION OF NON-GAAP MEASURESHARSCO CORPORATIONRECONCILIATION OF ADJUSTED DILUTED EARNINGS PER SHARE FROM CONTINUING OPERATIONS TO DILUTED EARNINGS (LOSS) PER SHARE FROM CONTINUING OPERATIONS AS REPORTED (Unaudited)
Three Months Ended Twelve Months EndedDecember 31 December 31
2020 2019 2020 2019Diluted earnings (loss) per share from continuing operations as reported $ (0.07) $ 0.03 $ (0.41) $ 0.35 Corporate acquisition and integration costs (a) 0.09 0.09 0.61 0.31 Harsco Environmental Segment severance costs (b) 0.03 — 0.09 — Corporate contingent consideration adjustments (c) — — 0.03 — Corporate unused debt commitment and amendment fees (d) — — 0.02 0.09 Harsco Clean Earth Segment integration costs (e) 0.02 — 0.02 — Harsco Environmental Segment contingent consideration adjustments (f) — (0.05) — (0.10) Harsco Environmental Segment provision for doubtful accounts (g) — — — 0.08 Harsco Rail Segment improvement initiative costs (h) — — — 0.06 Harsco Environmental Segment site exit related (i) — — — (0.03) Deferred tax asset valuation allowance adjustment (j) — — — 0.03 Harsco Clean Earth Segment severance costs (k) — 0.01 — 0.02 Harsco Clean Earth Segment contingent consideration adjustments (l) — 0.01 0.01
Corporate acquisition related tax benefit (m) — — (0.03) —
Taxes on above unusual items (n) (0.04) (0.03) (0.16) (0.08)
Adjusted diluted earnings per share from continuing operations, including acquisition amortization expense 0.04 (p) 0.06 0.19 (p) 0.74
Acquisition amortization expense, net of tax (o) 0.08 0.06 0.31 0.16
Adjusted diluted earnings per share from continuing operations $ 0.12 $ 0.12 $ 0.49 (p) $ 0.90
15

RECONCILIATION OF NON-GAAP MEASURES
(a) Costs at Corporate associated with supporting and executing the Company's growth strategy (Q4 2020 $6.9 million pre-tax; Full year 2020 $48.5 million pre-tax; Q4 2019 $7.3 million pre-tax; Full year 2019 $25.2 million pre-tax).
(b) Harsco Environmental Segment severance costs (Q4 2020 $2.2 million pre-tax; Full year 2020 $7.4 million pre-tax).(c) Adjustment to contingent consideration related to the acquisition of Clean Earth recorded on Corporate (Q4 2020 $(0.1) pre-tax; Full year $2.3 million pre-tax). The Company
adjusts operating income and Diluted earnings per share from continuing operations to exclude the impact of the change in fair value to the acquisition-related contingent consideration liability for acquisitions because it believes that the adjustment for this item more closely correlates the reported financial measures with the ordinary and ongoing course of the Company's operations.
(d) Costs at Corporate associated with amending the Company's existing Senior Secured Credit Facilities to increase the net debt to consolidated adjusted EBITDA ratio covenant (Full year 2020 $1.9 million pre-tax; ) and costs at Corporate related to the unused bridge financing commitment and Term Loan B amendment (Full year 2019 $7.4 million pre-tax).
(e) Costs incurred in the Harsco Clean Earth Segment related to the integration of ESOL (Q4 2020 $1.7 million pre-tax; Full year 2020 $1.9 million pre-tax).(f) Fair value adjustment to contingent consideration liability related to the acquisition of Altek (Q4 2019 $4.1 million pre-tax; Full year 2019 $8.5 million pre-tax). (g) Harsco Environmental Segment provision for doubtful accounts related to a customer in the U.K. entering administration (Full year 2019 $6.2 million pre-tax).(h) Costs associated with a productivity improvement initiative in the Harsco Rail Segment (Q4 2019 $0.2 million pre-tax; Full year 2019 $4.8 million pre-tax).(i) Harsco Environmental Segment site exit related (Full year 2019 $2.4 million pre-tax). (j) Adjustment of certain existing deferred tax asset valuation allowances as a result of a site exit in a certain jurisdiction in 2019 (Full year 2019 $2.8 million).(k) Harsco Clean Earth Segment severance costs recognized (Q4 2019 $0.6 million pre-tax; Full year 2019 $1.9 million pre-tax).(l) Fair value adjustment to contingent consideration liability acquired in conjunction with the acquisition of Clean Earth (Q4 and Full year 2019 $0.8 million pre-tax).(m) Acquisition related tax benefit recorded on Corporate assumed as part of the Clean Earth Acquisition (Q4 2020 $(0.1); Full year 2020 $2.7 million).(n) Unusual items are tax-effected at the global effective tax rate, before discrete items, in effect at the time the unusual item is recorded, except for unusual items from countries
where no tax benefit can be realized, in which case a zero percent tax rate is used. (o) Acquisition amortization expense was $8.4 million pre-tax and $31.0 million pre-tax for Q4 and Full year 2020, respectively; and $6.0 million pre-tax and $15.5 million pre-tax for
Q4 and Full year 2019, respectively.(p) Does not total due to rounding.
The Company’s management believes Adjusted diluted earnings per share from continuing operations, which is a non-GAAP financial measure, is useful to investors because it provides an overall understanding of the Company’s historical and future prospects. Exclusion of unusual items permits evaluation and comparison of results for the Company’s core business operations, and it is on this basis that management internally assesses the Company’s performance. Exclusion of acquisition-related intangible asset amortization expense, the amount of which can vary by the timing, size and nature of the Company’s acquisitions, facilitates more consistent internal comparisons of operating results over time between the Company’s newly acquired and long-held businesses, and comparisons with both acquisitive and non-acquisitive peer companies. It is important to note that such intangible assets contribute to revenue generation and that intangible asset amortization related to past acquisitions will recur in future periods until such intangible assets have been fully amortized. This measure should be considered in addition to, rather than as a substitute for, other information provided in accordance with GAAP.
16
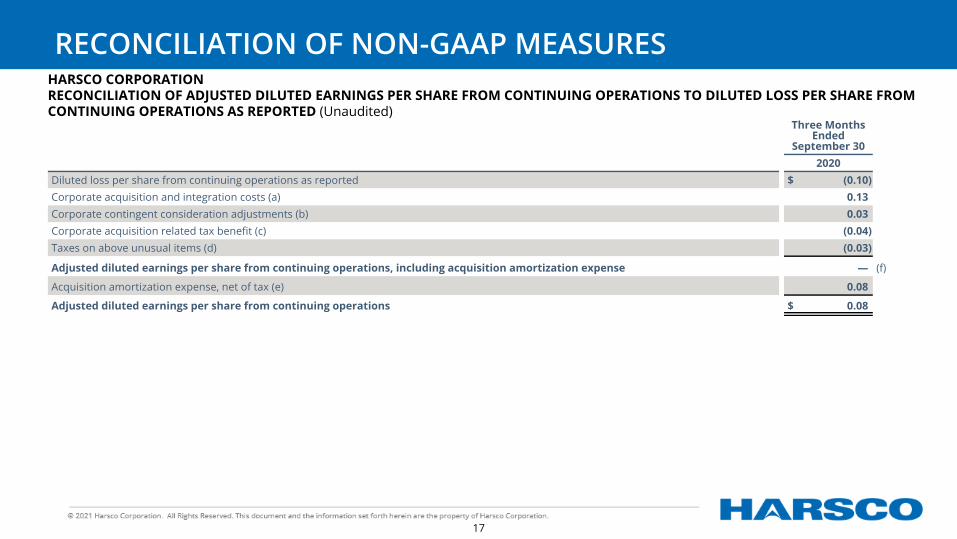
RECONCILIATION OF NON-GAAP MEASURESHARSCO CORPORATIONRECONCILIATION OF ADJUSTED DILUTED EARNINGS PER SHARE FROM CONTINUING OPERATIONS TO DILUTED LOSS PER SHARE FROM CONTINUING OPERATIONS AS REPORTED (Unaudited)
Three Months Ended
September 302020
Diluted loss per share from continuing operations as reported $ (0.10) Corporate acquisition and integration costs (a) 0.13 Corporate contingent consideration adjustments (b) 0.03 Corporate acquisition related tax benefit (c) (0.04) Taxes on above unusual items (d) (0.03)
Adjusted diluted earnings per share from continuing operations, including acquisition amortization expense — (f)
Acquisition amortization expense, net of tax (e) 0.08
Adjusted diluted earnings per share from continuing operations $ 0.08
17

RECONCILIATION OF NON-GAAP MEASURES
(a) Costs at Corporate associated with supporting and executing the Company's growth strategy ($10.6 million pre-tax). (b) Adjustment to contingent consideration related to the acquisition of Clean Earth recorded on Corporate ($2.4 million pre-tax). The Company adjusts operating income
and Diluted earnings per share from continuing operations to exclude the impact of the change in fair value to the acquisition-related contingent consideration liability for acquisitions because it believes that the adjustment for this item more closely correlates the reported financial measures with the ordinary and ongoing course of the Company's operations.
(c) Acquisition related tax benefit recorded on Corporate assumed as part of the Clean Earth Acquisition ($2.8 million).(d) Unusual items are tax-effected at the global effective tax rate, before discrete items, in effect at the time the unusual item is recorded, except for unusual items from
countries where no tax benefit can be realized, in which case a zero percent tax rate is used. (e) Acquisition amortization expense was $8.3 million pre-tax.(f) Does not total due to rounding.
The Company’s management believes Adjusted diluted earnings per share from continuing operations, which is a non-GAAP financial measure, is useful to investors because it provides an overall understanding of the Company’s historical and future prospects. Exclusion of unusual items permits evaluation and comparison of results for the Company’s core business operations, and it is on this basis that management internally assesses the Company’s performance. Exclusion of acquisition-related intangible asset amortization expense, the amount of which can vary by the timing, size and nature of the Company’s acquisitions, facilitates more consistent internal comparisons of operating results over time between the Company’s newly acquired and long-held businesses, and comparisons with both acquisitive and non-acquisitive peer companies. It is important to note that such intangible assets contribute to revenue generation and that intangible asset amortization related to past acquisitions will recur in future periods until such intangible assets have been fully amortized. This measure should be considered in addition to, rather than as a substitute for, other information provided in accordance with GAAP.
18

RECONCILIATION OF NON-GAAP MEASURESHARSCO CORPORATIONRECONCILIATION OF PROJECTED ADJUSTED DILUTED EARNINGS PER SHARE FROM CONTINUING OPERATIONS TO DILUTED EARNINGS PER SHARE FROM CONTINUING OPERATIONS (Unaudited)
Projected Three Months Ending
March 31
Projected Twelve Months Ending
December 312021 2021
Low High Low HighDiluted earnings per share from continuing operations $ (0.08) $ 0.02 $ 0.26 $ 0.42
Estimated acquisition amortization expense, net of tax 0.08 0.08 0.34 0.34
Adjusted diluted earnings per share from continuing operations $ 0.01 (a) $ 0.10 $ 0.59 (a) $ 0.76
19
The Company’s management believes Adjusted diluted earnings per share from continuing operations, which is a non-GAAP financial measure, is useful to investors because it provides an overall understanding of the Company’s historical and future prospects. Exclusion of acquisition-related intangible asset amortization expense, the amount of which can vary by the timing, size and nature of the Company’s acquisitions, facilitates more consistent internal comparisons of operating results over time between the Company’s newly acquired and long-held businesses, and comparisons with both acquisitive and non-acquisitive peer companies. It is important to note that such intangible assets contribute to revenue generation and that intangible asset amortization related to past acquisitions will recur in future periods until such intangible assets have been fully amortized. This measure should be considered in addition to, rather than as a substitute for, other information provided in accordance with GAAP.
(a) Does not total due to rounding.
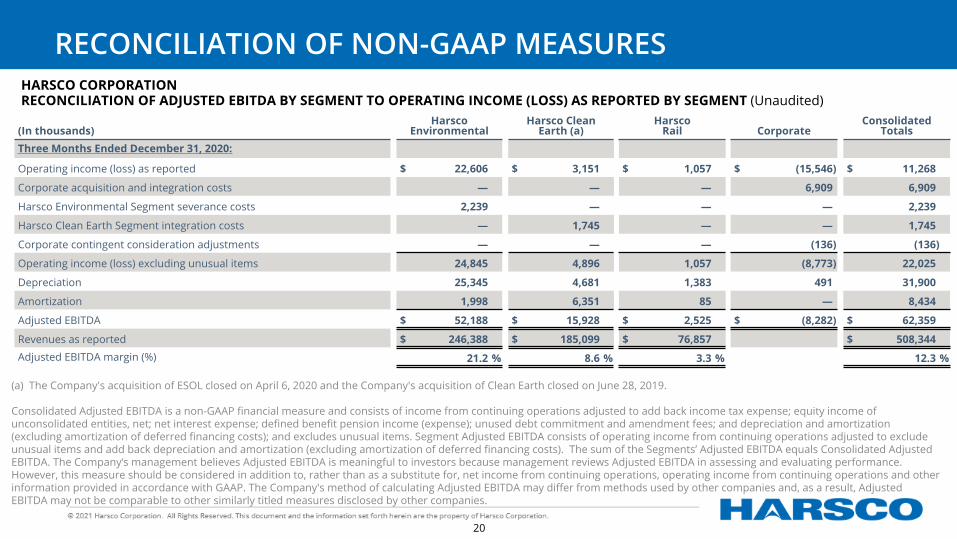
HARSCO CORPORATIONRECONCILIATION OF ADJUSTED EBITDA BY SEGMENT TO OPERATING INCOME (LOSS) AS REPORTED BY SEGMENT (Unaudited)
(In thousands)Harsco
EnvironmentalHarsco Clean
Earth (a)Harsco
Rail CorporateConsolidated
TotalsThree Months Ended December 31, 2020:
Operating income (loss) as reported $ 22,606 $ 3,151 $ 1,057 $ (15,546) $ 11,268
Corporate acquisition and integration costs — — — 6,909 6,909
Harsco Environmental Segment severance costs 2,239 — — — 2,239
Harsco Clean Earth Segment integration costs — 1,745 — — 1,745
Corporate contingent consideration adjustments — — — (136) (136)
Operating income (loss) excluding unusual items 24,845 4,896 1,057 (8,773) 22,025
Depreciation 25,345 4,681 1,383 491 31,900
Amortization 1,998 6,351 85 — 8,434
Adjusted EBITDA $ 52,188 $ 15,928 $ 2,525 $ (8,282) $ 62,359
Revenues as reported $ 246,388 $ 185,099 $ 76,857 $ 508,344 Adjusted EBITDA margin (%) 21.2 % 8.6 % 3.3 % 12.3 %
(a) The Company's acquisition of ESOL closed on April 6, 2020 and the Company's acquisition of Clean Earth closed on June 28, 2019.
Consolidated Adjusted EBITDA is a non-GAAP financial measure and consists of income from continuing operations adjusted to add back income tax expense; equity income of unconsolidated entities, net; net interest expense; defined benefit pension income (expense); unused debt commitment and amendment fees; and depreciation and amortization (excluding amortization of deferred financing costs); and excludes unusual items. Segment Adjusted EBITDA consists of operating income from continuing operations adjusted to exclude unusual items and add back depreciation and amortization (excluding amortization of deferred financing costs). The sum of the Segments’ Adjusted EBITDA equals Consolidated Adjusted EBITDA. The Company‘s management believes Adjusted EBITDA is meaningful to investors because management reviews Adjusted EBITDA in assessing and evaluating performance. However, this measure should be considered in addition to, rather than as a substitute for, net income from continuing operations, operating income from continuing operations and other information provided in accordance with GAAP. The Company's method of calculating Adjusted EBITDA may differ from methods used by other companies and, as a result, Adjusted EBITDA may not be comparable to other similarly titled measures disclosed by other companies.
RECONCILIATION OF NON-GAAP MEASURES
20
HARSCO CORPORATIONRECONCILIATION OF ADJUSTED EBITDA BY SEGMENT TO OPERATING INCOME (LOSS) AS REPORTED BY SEGMENT (Unaudited) (In thousands)
Harsco Environmental
Harsco Clean Earth (a)
Harsco Rail Corporate
Consolidated Totals
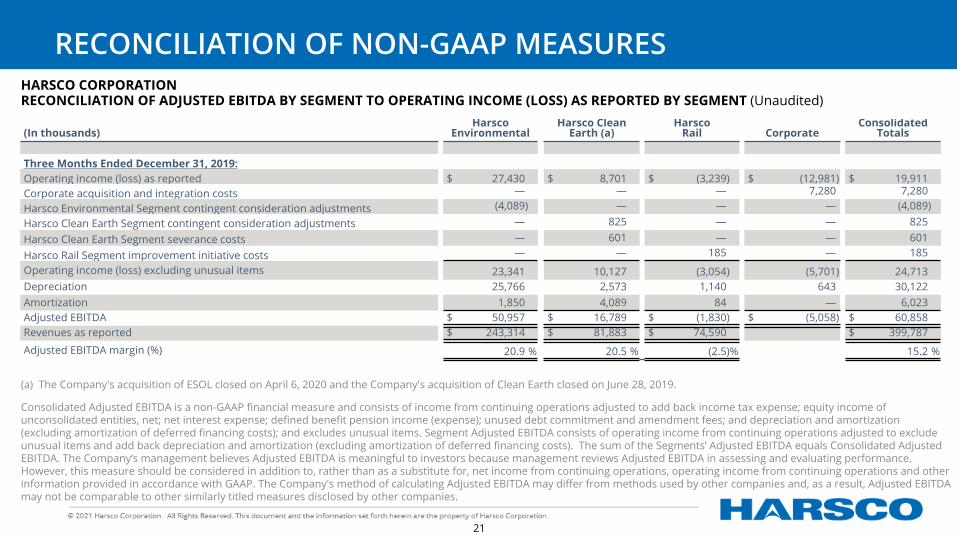
Three Months Ended December 31, 2019:Operating income (loss) as reported $ 27,430 $ 8,701 $ (3,239) $ (12,981) $ 19,911 Corporate acquisition and integration costs — — — 7,280 7,280
Harsco Environmental Segment contingent consideration adjustments (4,089) — — — (4,089)
Harsco Clean Earth Segment contingent consideration adjustments — 825 — — 825
Harsco Clean Earth Segment severance costs — 601 — — 601
Harsco Rail Segment improvement initiative costs — — 185 — 185
Operating income (loss) excluding unusual items 23,341 10,127 (3,054) (5,701) 24,713 Depreciation 25,766 2,573 1,140 643 30,122 Amortization 1,850 4,089 84 — 6,023 Adjusted EBITDA $ 50,957 $ 16,789 $ (1,830) $ (5,058) $ 60,858 Revenues as reported $ 243,314 $ 81,883 $ 74,590 $ 399,787
Adjusted EBITDA margin (%) 20.9 % 20.5 % (2.5) % 15.2 %
Consolidated Adjusted EBITDA is a non-GAAP financial measure and consists of income from continuing operations adjusted to add back income tax expense; equity income of unconsolidated entities, net; net interest expense; defined benefit pension income (expense); unused debt commitment and amendment fees; and depreciation and amortization (excluding amortization of deferred financing costs); and excludes unusual items. Segment Adjusted EBITDA consists of operating income from continuing operations adjusted to exclude unusual items and add back depreciation and amortization (excluding amortization of deferred financing costs). The sum of the Segments’ Adjusted EBITDA equals Consolidated Adjusted EBITDA. The Company‘s management believes Adjusted EBITDA is meaningful to investors because management reviews Adjusted EBITDA in assessing and evaluating performance. However, this measure should be considered in addition to, rather than as a substitute for, net income from continuing operations, operating income from continuing operations and other information provided in accordance with GAAP. The Company's method of calculating Adjusted EBITDA may differ from methods used by other companies and, as a result, Adjusted EBITDA may not be comparable to other similarly titled measures disclosed by other companies.
RECONCILIATION OF NON-GAAP MEASURES
(a) The Company's acquisition of ESOL closed on April 6, 2020 and the Company's acquisition of Clean Earth closed on June 28, 2019.
21

HARSCO CORPORATIONRECONCILIATION OF ADJUSTED EBITDA BY SEGMENT TO OPERATING INCOME (LOSS) AS REPORTED BY SEGMENT (Unaudited) (In thousands)
Harsco Environmental
Harsco Clean Earth (a)
Harsco Rail Corporate
Consolidated Totals
Twelve Months Ended December 31, 2020:
Operating income (loss) as reported $ 59,006 $ 16,096 $ 20,219 $ (74,240) $ 21,081
Corporate acquisition and integration costs — — — 48,493 48,493
Harsco Environmental Segment severance costs 7,399 — — — 7,399
Corporate contingent consideration adjustments — — — 2,301 2,301
Harsco Clean Earth Segment integration costs — 1,859 — — 1,859
Operating income (loss) excluding unusual items 66,405 17,955 20,219 (23,446) 81,133
Depreciation 100,971 17,450 5,113 2,022 125,556
Amortization 7,825 22,814 337 — 30,976
Adjusted EBITDA $ 175,201 $ 58,219 $ 25,669 $ (21,424) $ 237,665
Revenues as reported $ 914,445 $ 619,588 $ 329,831 $ 1,863,864
Adjusted EBITDA margin (%) 19.2 % 9.4 % 7.8 % 12.8 %
Consolidated Adjusted EBITDA is a non-GAAP financial measure and consists of income from continuing operations adjusted to add back income tax expense; equity income of unconsolidated entities, net; net interest expense; defined benefit pension income (expense); unused debt commitment and amendment fees; and depreciation and amortization (excluding amortization of deferred financing costs); and excludes unusual items. Segment Adjusted EBITDA consists of operating income from continuing operations adjusted to exclude unusual items and add back depreciation and amortization (excluding amortization of deferred financing costs). The sum of the Segments’ Adjusted EBITDA equals Consolidated Adjusted EBITDA. The Company‘s management believes Adjusted EBITDA is meaningful to investors because management reviews Adjusted EBITDA in assessing and evaluating performance. However, this measure should be considered in addition to, rather than as a substitute for, net income from continuing operations, operating income from continuing operations and other information provided in accordance with GAAP. The Company's method of calculating Adjusted EBITDA may differ from methods used by other companies and, as a result, Adjusted EBITDA may not be comparable to other similarly titled measures disclosed by other companies.
RECONCILIATION OF NON-GAAP MEASURES
(a) The Company's acquisition of ESOL closed on April 6, 2020 and the Company's acquisition of Clean Earth closed on June 28, 2019.
22
HARSCO CORPORATIONRECONCILIATION OF ADJUSTED EBITDA BY SEGMENT TO OPERATING INCOME (LOSS) AS REPORTED BY SEGMENT (Unaudited) (In thousands)
Harsco Environmental
Harsco Clean Earth (a)
Harsco Rail Corporate
Consolidated Totals
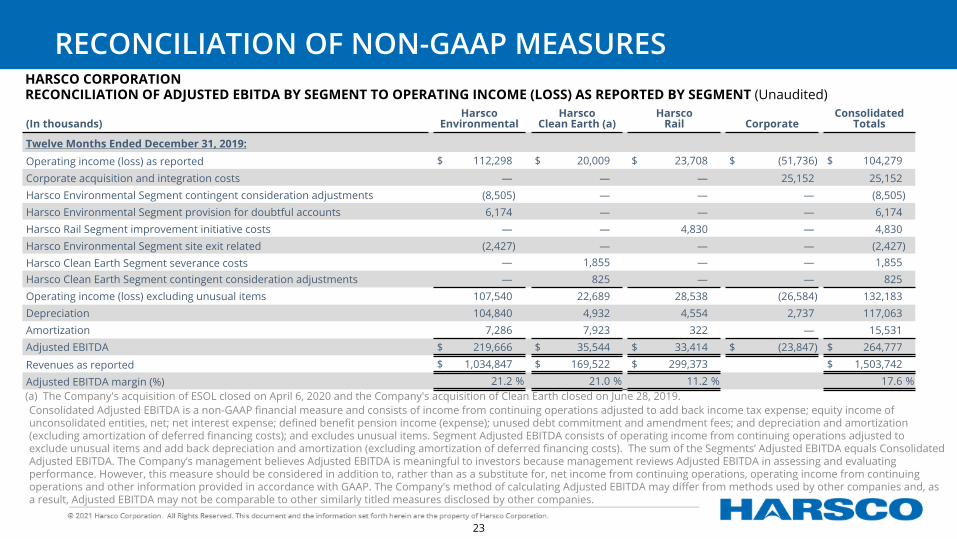
Twelve Months Ended December 31, 2019:Operating income (loss) as reported $ 112,298 $ 20,009 $ 23,708 $ (51,736) $ 104,279
Corporate acquisition and integration costs — — — 25,152 25,152 Harsco Environmental Segment contingent consideration adjustments (8,505) — — — (8,505) Harsco Environmental Segment provision for doubtful accounts 6,174 — — — 6,174 Harsco Rail Segment improvement initiative costs — — 4,830 — 4,830 Harsco Environmental Segment site exit related (2,427) — — — (2,427) Harsco Clean Earth Segment severance costs — 1,855 — — 1,855 Harsco Clean Earth Segment contingent consideration adjustments — 825 — — 825 Operating income (loss) excluding unusual items 107,540 22,689 28,538 (26,584) 132,183 Depreciation 104,840 4,932 4,554 2,737 117,063 Amortization 7,286 7,923 322 — 15,531 Adjusted EBITDA $ 219,666 $ 35,544 $ 33,414 $ (23,847) $ 264,777
Revenues as reported $ 1,034,847 $ 169,522 $ 299,373 $ 1,503,742
Adjusted EBITDA margin (%) 21.2 % 21.0 % 11.2 % 17.6 %
Consolidated Adjusted EBITDA is a non-GAAP financial measure and consists of income from continuing operations adjusted to add back income tax expense; equity income of unconsolidated entities, net; net interest expense; defined benefit pension income (expense); unused debt commitment and amendment fees; and depreciation and amortization (excluding amortization of deferred financing costs); and excludes unusual items. Segment Adjusted EBITDA consists of operating income from continuing operations adjusted to exclude unusual items and add back depreciation and amortization (excluding amortization of deferred financing costs). The sum of the Segments’ Adjusted EBITDA equals Consolidated Adjusted EBITDA. The Company‘s management believes Adjusted EBITDA is meaningful to investors because management reviews Adjusted EBITDA in assessing and evaluating performance. However, this measure should be considered in addition to, rather than as a substitute for, net income from continuing operations, operating income from continuing operations and other information provided in accordance with GAAP. The Company's method of calculating Adjusted EBITDA may differ from methods used by other companies and, as a result, Adjusted EBITDA may not be comparable to other similarly titled measures disclosed by other companies.
RECONCILIATION OF NON-GAAP MEASURES
(a) The Company's acquisition of ESOL closed on April 6, 2020 and the Company's acquisition of Clean Earth closed on June 28, 2019.
23

HARSCO CORPORATIONRECONCILIATION OF ADJUSTED EBITDA BY SEGMENT TO OPERATING INCOME (LOSS) AS REPORTED BY SEGMENT (Unaudited) (In thousands)
Harsco Environmental
Harsco Clean Earth (a)
Harsco Rail Corporate
Consolidated Totals
Three Months Ended September 30, 2020:
Operating income (loss) as reported $ 12,317 $ 8,902 $ 4,059 $ (20,214) $ 5,064
Corporate acquisition and integration costs — — — 10,645 10,645
Corporate contingent consideration adjustments — — — 2,437 2,437
Harsco Clean Earth Segment integration costs — 114 — — 114
Operating income (loss) excluding unusual items 12,317 9,016 4,059 (7,132) 18,260
Depreciation 25,588 5,010 1,258 497 32,353
Amortization 1,970 6,218 85 — 8,273
Adjusted EBITDA $ 39,875 $ 20,244 $ 5,402 $ (6,635) $ 58,886
Revenues as reported $ 222,507 $ 194,098 $ 92,793 $ 509,398
Adjusted EBITDA margin (%) 17.9 % 10.4 % 5.8 % 11.6 %
Consolidated Adjusted EBITDA is a non-GAAP financial measure and consists of income from continuing operations adjusted to add back income tax expense; equity income of unconsolidated entities, net; net interest expense; defined benefit pension income (expense); unused debt commitment and amendment fees; and depreciation and amortization (excluding amortization of deferred financing costs); and excludes unusual items. Segment Adjusted EBITDA consists of operating income from continuing operations adjusted to exclude unusual items and add back depreciation and amortization (excluding amortization of deferred financing costs). The sum of the Segments’ Adjusted EBITDA equals Consolidated Adjusted EBITDA. The Company‘s management believes Adjusted EBITDA is meaningful to investors because management reviews Adjusted EBITDA in assessing and evaluating performance. However, this measure should be considered in addition to, rather than as a substitute for, net income from continuing operations, operating income from continuing operations and other information provided in accordance with GAAP. The Company's method of calculating Adjusted EBITDA may differ from methods used by other companies and, as a result, Adjusted EBITDA may not be comparable to other similarly titled measures disclosed by other companies.
RECONCILIATION OF NON-GAAP MEASURES
(a) The Company's acquisition of ESOL closed on April 6, 2020 and the Company's acquisition of Clean Earth closed on June 28, 2019.
24

Consolidated Adjusted EBITDA is a non-GAAP financial measure and consists of income from continuing operations adjusted to add back income tax expense; equity income of unconsolidated entities, net; net interest expense; defined benefit pension income (expense); unused debt commitment and amendment fees; and depreciation and amortization (excluding amortization of deferred financing costs); and excludes unusual items. Segment Adjusted EBITDA consists of operating income from continuing operations adjusted to exclude unusual items and add back depreciation and amortization (excluding amortization of deferred financing costs). The sum of the Segments’ Adjusted EBITDA equals Consolidated Adjusted EBITDA. The Company‘s management believes Adjusted EBITDA is meaningful to investors because management reviews Adjusted EBITDA in assessing and evaluating performance. However, this measure should be considered in addition to, rather than as a substitute for, net income from continuing operations, operating income from continuing operations and other information provided in accordance with GAAP. The Company's method of calculating Adjusted EBITDA may differ from methods used by other companies and, as a result, Adjusted EBITDA may not be comparable to other similarly titled measures disclosed by other companies.
HARSCO CORPORATIONRECONCILIATION OF PROJECTED CONSOLIDATED ADJUSTED EBITDA TO PROJECTED CONSOLIDATED INCOME (LOSS) FROM CONTINUING OPERATIONS(Unaudited)
Projected Three Months Ending
March 31
Projected Twelve Months Ending
December 312021 2021
(In millions) Low High Low HighConsolidated income (loss) from continuing operations $ (5) $ 3 $ 26 $ 40
Add back:
Income tax expense 1 (2) 15 24 Net interest 15 16 66 63 Defined benefit pension income (3) (3) (14) (14) Depreciation and amortization 44 44 182 182
Consolidated Adjusted EBITDA $ 52 $ 58 $ 275 $ 295
RECONCILIATION OF NON-GAAP MEASURES
25
25

Consolidated Adjusted EBITDA is a non-GAAP financial measure and consists of income from continuing operations adjusted to add back income tax expense; equity income of unconsolidated entities, net; net interest expense; defined benefit pension income (expense); unused debt commitment and amendment fees; and depreciation and amortization (excluding amortization of deferred financing costs); and excludes unusual items. Segment Adjusted EBITDA consists of operating income from continuing operations adjusted to exclude unusual items and add back depreciation and amortization (excluding amortization of deferred financing costs). The sum of the Segments’ Adjusted EBITDA equals Consolidated Adjusted EBITDA. The Company‘s management believes Adjusted EBITDA is meaningful to investors because management reviews Adjusted EBITDA in assessing and evaluating performance. However, this measure should be considered in addition to, rather than as a substitute for, net income from continuing operations, operating income from continuing operations and other information provided in accordance with GAAP. The Company's method of calculating Adjusted EBITDA may differ from methods used by other companies and, as a result, Adjusted EBITDA may not be comparable to other similarly titled measures disclosed by other companies.
HARSCO CORPORATIONRECONCILIATION OF HARSCO CLEAN EARTH PROJECTED ADJUSTED EBITDA TO HARSCO CLEAN EARTH PROJECTED OPERATING INCOME (Unaudited)
Harsco Clean Earth
Projected Twelve Months Ending
December 312021
(In millions) Low HighOperating income $ 26 $ 32 Depreciation and amortization 46 46 Adjusted EBITDA $ 72 $ 78
RECONCILIATION OF NON-GAAP MEASURES
26
26
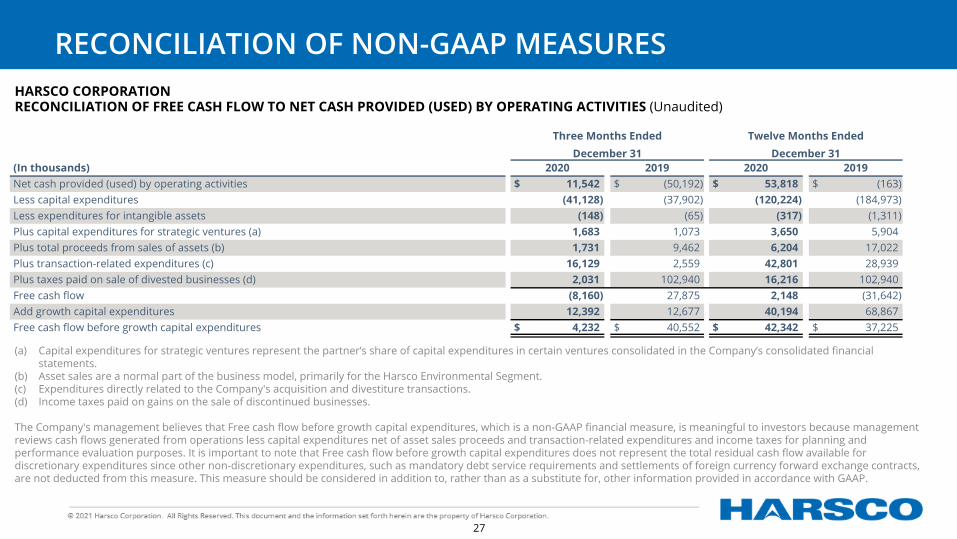
HARSCO CORPORATIONRECONCILIATION OF FREE CASH FLOW TO NET CASH PROVIDED (USED) BY OPERATING ACTIVITIES (Unaudited)
Three Months Ended Twelve Months EndedDecember 31 December 31
(In thousands) 2020 2019 2020 2019Net cash provided (used) by operating activities $ 11,542 $ (50,192) $ 53,818 $ (163) Less capital expenditures (41,128) (37,902) (120,224) (184,973) Less expenditures for intangible assets (148) (65) (317) (1,311) Plus capital expenditures for strategic ventures (a) 1,683 1,073 3,650 5,904 Plus total proceeds from sales of assets (b) 1,731 9,462 6,204 17,022 Plus transaction-related expenditures (c) 16,129 2,559 42,801 28,939 Plus taxes paid on sale of divested businesses (d) 2,031 102,940 16,216 102,940 Free cash flow (8,160) 27,875 2,148 (31,642) Add growth capital expenditures 12,392 12,677 40,194 68,867 Free cash flow before growth capital expenditures $ 4,232 $ 40,552 $ 42,342 $ 37,225
(a) Capital expenditures for strategic ventures represent the partner’s share of capital expenditures in certain ventures consolidated in the Company’s consolidated financial statements.
(b) Asset sales are a normal part of the business model, primarily for the Harsco Environmental Segment. (c) Expenditures directly related to the Company's acquisition and divestiture transactions. (d) Income taxes paid on gains on the sale of discontinued businesses.
The Company's management believes that Free cash flow before growth capital expenditures, which is a non-GAAP financial measure, is meaningful to investors because management reviews cash flows generated from operations less capital expenditures net of asset sales proceeds and transaction-related expenditures and income taxes for planning and performance evaluation purposes. It is important to note that Free cash flow before growth capital expenditures does not represent the total residual cash flow available for discretionary expenditures since other non-discretionary expenditures, such as mandatory debt service requirements and settlements of foreign currency forward exchange contracts, are not deducted from this measure. This measure should be considered in addition to, rather than as a substitute for, other information provided in accordance with GAAP.
RECONCILIATION OF NON-GAAP MEASURES
27
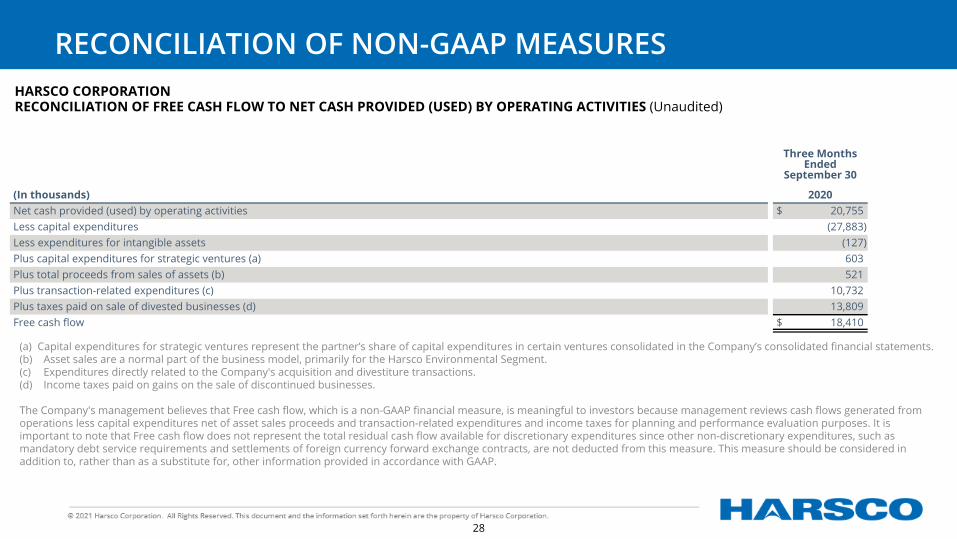
HARSCO CORPORATIONRECONCILIATION OF FREE CASH FLOW TO NET CASH PROVIDED (USED) BY OPERATING ACTIVITIES (Unaudited)
Three Months Ended
September 30
(In thousands) 2020Net cash provided (used) by operating activities $ 20,755 Less capital expenditures (27,883) Less expenditures for intangible assets (127) Plus capital expenditures for strategic ventures (a) 603 Plus total proceeds from sales of assets (b) 521 Plus transaction-related expenditures (c) 10,732 Plus taxes paid on sale of divested businesses (d) 13,809 Free cash flow $ 18,410
(a) Capital expenditures for strategic ventures represent the partner’s share of capital expenditures in certain ventures consolidated in the Company’s consolidated financial statements. (b) Asset sales are a normal part of the business model, primarily for the Harsco Environmental Segment. (c) Expenditures directly related to the Company's acquisition and divestiture transactions. (d) Income taxes paid on gains on the sale of discontinued businesses.
The Company's management believes that Free cash flow, which is a non-GAAP financial measure, is meaningful to investors because management reviews cash flows generated from operations less capital expenditures net of asset sales proceeds and transaction-related expenditures and income taxes for planning and performance evaluation purposes. It is important to note that Free cash flow does not represent the total residual cash flow available for discretionary expenditures since other non-discretionary expenditures, such as mandatory debt service requirements and settlements of foreign currency forward exchange contracts, are not deducted from this measure. This measure should be considered in addition to, rather than as a substitute for, other information provided in accordance with GAAP.
RECONCILIATION OF NON-GAAP MEASURES
28
28

HARSCO CORPORATIONRECONCILIATION OF PROJECTED FREE CASH FLOW TO PROJECTED NET CASH PROVIDED BY OPERATING ACTIVITIES (Unaudited)
Projected Twelve Months Ending
December 312021
(In millions) Low HighNet cash provided by operating activities $ 170 $ 210 Less capital expenditures (160) (178) Plus total proceeds from asset sales and capital expenditures for strategic ventures 5 3 Plus transaction related expenditures 15 15 Free cash flow 30 50 Add growth capital expenditures 60 60 Free cash flow before growth capital expenditures $ 90 $ 110
RECONCILIATION OF NON-GAAP MEASURES
29
The Company's management believes that Free cash flow, which is a non-GAAP financial measure, is meaningful to investors because management reviews cash flows generated from operations less capital expenditures net of asset sales proceeds and transaction-related expenditures and income taxes for planning and performance evaluation purposes. It is important to note that Free cash flow does not represent the total residual cash flow available for discretionary expenditures since other non-discretionary expenditures, such as mandatory debt service requirements and settlements of foreign currency forward exchange contracts, are not deducted from this measure. This measure should be considered in addition to, rather than as a substitute for, other information provided in accordance with GAAP.
29


