Page 1
arX
iv:a
stro
-ph/
0508
222v
2 1
1 A
ug 2
005
Accepted for publication in The Astronomical Journal
HST/ACS Images of the GG Tauri Circumbinary Disk
J.E. Krist1,2, K.R. Stapelfeldt1, D.A. Golimowski3, D.R. Ardila3, M. Clampin4, A.R.
Martel3, H.C. Ford3, G.D. Illingworth5, G.F. Hartig2
ABSTRACT
Hubble Space Telescope Advanced Camera for Surveys images of the young
binary GG Tauri and its circumbinary disk in V and I bandpasses were obtained
in 2002 and are the most detailed of this system to date . They confirm features
previously seen in the disk including: a “gap” apparently caused by shadowing
from circumstellar material; an asymmetrical distribution of light about the line
of sight on the near edge of the disk; enhanced brightness along the near edge of
the disk due to forward scattering; and a compact reflection nebula near the sec-
ondary star. New features are seen in the ACS images: two short filaments along
the disk; localized but strong variations in the disk intensity (“gaplets”); and a
“spur” or filament extending from the reflection nebulosity near the secondary.
The back side of the disk is detected in the V band for the first time. The disk
appears redder than the combined light from the stars, which may be explained
by a varied distribution of grain sizes. The brightness asymmetries along the
disk suggest that it is asymmetrically illuminated by the stars due to extinction
by nonuniform circumstellar material or the illuminated surface of the disk is
warped by tidal effects (or perhaps both). Localized, time-dependent brightness
variations in the disk are also seen.
Subject headings: stars: circumstellar matter — stars: individual (GG Tauri) —
stars: pre-main sequence — stars:binaries
1Jet Propulsion Laboratory, 4800 Oak Grove Dr., Pasadena, CA 91109.
2Space Telescope Science Institute, 3700 San Martin Dr., Baltimore, MD 21218.
3Department of Physics and Astronomy, Johns Hopkins University, 3400 North Charles Street, Baltimore,
MD 21218.
4NASA Goddard Space Flight Center, Code 681, Greenbelt, MD 20771.
5UCO/Lick Observatory, University of California, Santa Cruz, CA 95064.
Page 2
– 2 –
1. Introduction
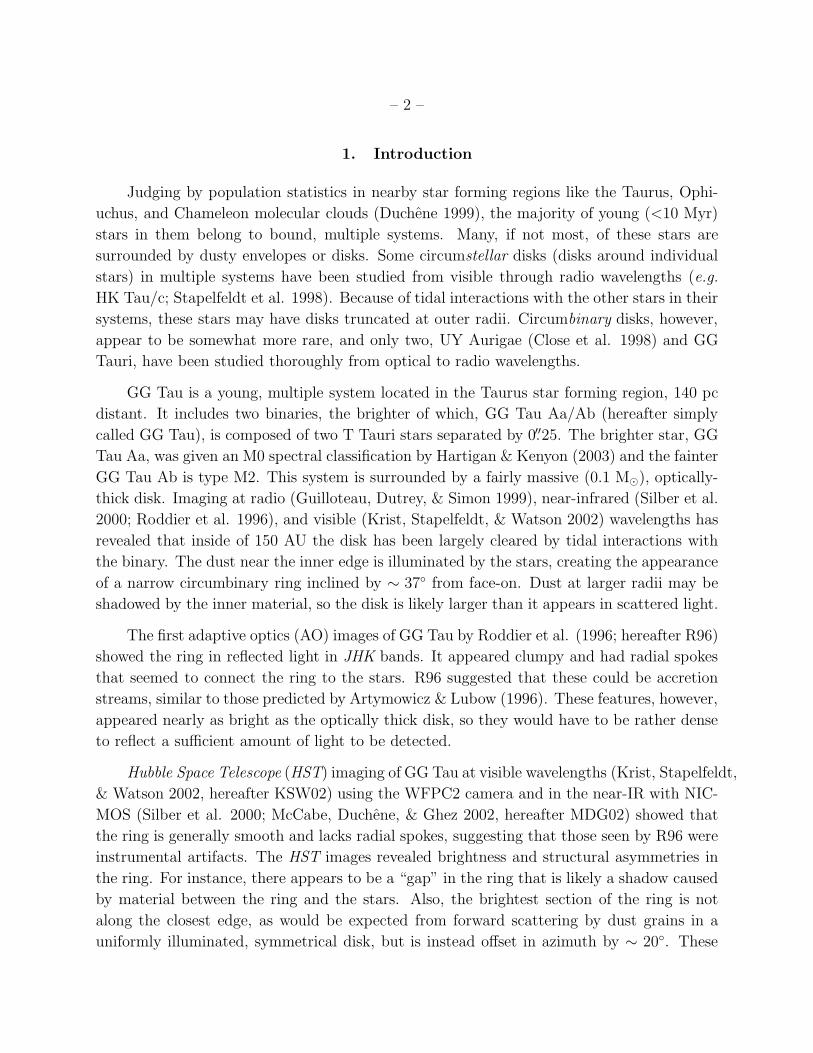
Judging by population statistics in nearby star forming regions like the Taurus, Ophi-
uchus, and Chameleon molecular clouds (Duchene 1999), the majority of young (<10 Myr)
stars in them belong to bound, multiple systems. Many, if not most, of these stars are
surrounded by dusty envelopes or disks. Some circumstellar disks (disks around individual
stars) in multiple systems have been studied from visible through radio wavelengths (e.g.
HK Tau/c; Stapelfeldt et al. 1998). Because of tidal interactions with the other stars in their
systems, these stars may have disks truncated at outer radii. Circumbinary disks, however,
appear to be somewhat more rare, and only two, UY Aurigae (Close et al. 1998) and GG
Tauri, have been studied thoroughly from optical to radio wavelengths.
GG Tau is a young, multiple system located in the Taurus star forming region, 140 pc
distant. It includes two binaries, the brighter of which, GG Tau Aa/Ab (hereafter simply
called GG Tau), is composed of two T Tauri stars separated by 0.′′25. The brighter star, GG
Tau Aa, was given an M0 spectral classification by Hartigan & Kenyon (2003) and the fainter
GG Tau Ab is type M2. This system is surrounded by a fairly massive (0.1 M⊙), optically-
thick disk. Imaging at radio (Guilloteau, Dutrey, & Simon 1999), near-infrared (Silber et al.
2000; Roddier et al. 1996), and visible (Krist, Stapelfeldt, & Watson 2002) wavelengths has
revealed that inside of 150 AU the disk has been largely cleared by tidal interactions with
the binary. The dust near the inner edge is illuminated by the stars, creating the appearance
of a narrow circumbinary ring inclined by ∼ 37◦ from face-on. Dust at larger radii may be
shadowed by the inner material, so the disk is likely larger than it appears in scattered light.
The first adaptive optics (AO) images of GG Tau by Roddier et al. (1996; hereafter R96)
showed the ring in reflected light in JHK bands. It appeared clumpy and had radial spokes
that seemed to connect the ring to the stars. R96 suggested that these could be accretion
streams, similar to those predicted by Artymowicz & Lubow (1996). These features, however,
appeared nearly as bright as the optically thick disk, so they would have to be rather dense
to reflect a sufficient amount of light to be detected.
Hubble Space Telescope (HST) imaging of GG Tau at visible wavelengths (Krist, Stapelfeldt,
& Watson 2002, hereafter KSW02) using the WFPC2 camera and in the near-IR with NIC-
MOS (Silber et al. 2000; McCabe, Duchene, & Ghez 2002, hereafter MDG02) showed that
the ring is generally smooth and lacks radial spokes, suggesting that those seen by R96 were
instrumental artifacts. The HST images revealed brightness and structural asymmetries in
the ring. For instance, there appears to be a “gap” in the ring that is likely a shadow caused
by material between the ring and the stars. Also, the brightest section of the ring is not
along the closest edge, as would be expected from forward scattering by dust grains in a
uniformly illuminated, symmetrical disk, but is instead offset in azimuth by ∼ 20◦. These
Page 3
– 3 –
and other asymmetries suggest that the illuminated surface of the disk is warped and/or
the illumination is shadowed by circumstellar material. The latter case is bolstered by a
compact reflection nebulosity seen near the secondary star in the WFPC2 image. The HST
studies also showed that the ring is redder than the combined observed light from the stars.
Because the ring is optically thick, the dust density distribution and grain properties
cannot be directly derived from the reflected-light images. Three-dimensional, multiple-
scattering models have been used to examine possible dust distributions and grain properties
(Wood, Crosas, & Ghez 1999; Duchene et al. 2004, hereafter D04) with constraints provided
by both the scattered light and thermal emission images. The two important measurements
provided by the visible and near-IR images are the ratio of the forward side to back side
(F/B) brightnesses and the ratio of integrated ring flux to the combined stellar fluxes. The
first ratio sets limits on the degree of forward scattering in the models, which is a function
of particle size. The variation in forward scattering with wavelength can therefore place
constraints on the assumed grain size distribution function. The second ratio can indicate
the amount of light from the stars lost by multiple scattering or extinction by circumstellar
material.
Until now, the only images of the GG Tau ring at visible wavelengths were those from
the WFPC2 camera on HST. However, the F555W (WFPC2 V band) image was neither
deep enough nor sufficiently free of point spread function (PSF) subtraction artifacts to
unambiguously show the back side of the ring, and thus failed to provide a strong constraint
on the variation of forward scattering with wavelength. To remedy this situation, images of
GG Tau have been taken using the Advanced Camera for Surveys (ACS) on HST. Its finer
pixel scale and more stable PSF allows better subtractions of the stellar glare, which are
required to reveal the ring against the background glare from the stars.
2. Observations, Stellar Photometry, and PSF Subtraction
The GG Tau images were taken as part of the ACS Investigation Definition Team’s
circumstellar disk program (HST program 9295) on 12 September 2002. The system was
observed with the ACS High Resolution Camera (HRC), which has a pixel scale of ∼0.′′025
pixel−1 and a PSF FWHM of 50 mas in the V band. Identical sets of exposures were
taken at two orientations with the telescope rolled about its optical axis by 28◦. These
rolls permit improved differentiation of PSF artifacts (which remain static as seen by the
detector regardless of roll) from real disk structures (which change orientation with telescope
roll). They also allow regions of the ring obscured by the diffraction spikes at one roll to be
replaced by unobscured pixels from the other. At each roll, identical sets of short-to-long
Page 4
– 4 –
duration exposures were taken through filters F555W (ACS V band) and F814W (ACS I
band) (Table 1). The data were calibrated by the HST data archive. Duplicate exposures
were combined with cosmic ray rejection and saturated pixels in long exposures were replaced
by scaled values from shorter ones, providing high-dynamic-range images.
Because of the faintness of the GG Tau disk and its proximity to the stars, the stellar
PSFs had to be subtracted using images of another star. HD 260655 (K7V) was chosen as
a reference PSF because its color was similar to that of the brighter binary component, GG
Tau Aa. It was observed in an orbit immediately following the GG Tau observations in order
to reduce the influence of time-dependent focus changes that could lead to PSF mismatches
and increased subtraction residuals. Short-to-long exposures were taken and processed in
the same manner as the GG Tau images. Unfortunately, the short F814W image was slightly
saturated.
2.1. PSF Fitting and Stellar Photometry
Because the separation between the binary components is small and portions of their
PSFs overlap, simple aperture photometry may introduce unacceptable errors. To obtain
accurate positions and flux measurements, simultaneous PSF fitting of both components
was undertaken. For the F555W data, Tiny Tim model PSFs (Krist & Hook 2003) were
matched to the observations, as they were in the WFPC2 study (KSW02). Iterative model-
fitting phase retrieval analysis (Krist & Burrows 1995) was used to determine the aberration
parameters (focus, coma, astigmatism) appropriate for the observations by measuring GG
Tau Aa in the shortest exposure at the first orientation. These values were then used in
Tiny Tim to generate subsampled, geometrically-distorted models with colors similar to
the GG Tau stars. Within an interative optimization routine the models were shifted via
cubic convolution interpolation, rebinned to normal pixel sampling, convolved with a kernel
representing blurring from HRC CCD charge diffusion, and then scaled in intensity to match
the binary components. The HST images were not corrected at this point for geometric
distortion to avoid potential errors caused by interpolation.
PSF fitting photometry in F814W was more complicated because the HRC CCD suffers
from a “red halo” (Sirriani et al. 1998). This appears as a diffuse, smooth halo of light that
can be seen extending out to ∼4” from the stars in the deep F814W exposures. Its surface
brightness decreases with increasing radius. It is caused by red photons that pass completely
through the CCD and are scattered to large angles within the glass mounting substrate and
then back into the detector. The halo begins to appear between 6000−7000A and by 10000A
it can contain more than 30% of the stellar flux. It is seen in the unsubtracted F814W image
Page 5
– 5 –
Table 1. ACS GG Tau and Reference PSF Exposures
Star Filter Exposure
GG Tau1 F555W 2 x 3s
2 x 30s
2 x 1275s
F814W 2 x 1s
1 x 10s
2 x 25s
2 x 250s
HD 260655 F555W 2 x 0.2s
2 x 0.8s
2 x 2s
2 x 10s
2 x 50s
3 x 300s
F814W 2 x 2s
2 x 50s
2 x 200s
3 x 830s
1The listed GG Tau exposures
were duplicated after rolling the
telescope 28◦.
Page 6
– 6 –
in Figure 1, where it washes out the diffraction structure in the wings. The effect is sensitive
to the color of the object over a broad passband, leading to potential mismatches between
target and reference PSFs, even for similar spectral types.
At this time, Tiny Tim does not model the red halo with sufficient accuracy to provide
good subtractions. Rather than fitting the F814W GG Tau binary with PSF models we
instead used an image of HD 17637 that was observed in an HST calibration program (we
could not use HD 260655 as it was saturated in this filter). HD 17637 is a K5V star, so
it is slightly more blue than GG Tau Aa. However, it should be a better match than a
Tiny Tim model. The PSF image, which was not corrected for geometric distortion, was
interpolated to 5× finer sampling (the observed HRC PSF is oversampled by a factor of 1.4 at
λ = 8000A relative to Nyquist sampling). It was then used by the same PSF fitting routine
described previously (excluding charge diffusion blurring, which the observed reference PSF
already contained). The fluxes were aperture corrected. Because the stellar photometry was
obtained in the distorted images, adjustments to the fluxes were required to account for the
difference between the pixel area assumed in the calibrated data and the true area (this is
described in the ACS Data Handbook; Pavlovsky et al. 2004). The average fluxes of the
measurements at each roll were converted to standard V and Ic magnitudes (Table 2) using
the SYNPHOT synthetic photometry package. An M1.5V spectrum was assumed for both
components of GG Tau A. The estimated photometric errors are ±0.03 mag.
The positions of the binary components were corrected for geometric distortion, and the
resulting orientations were converted to position angles based on the telescope orientations
provided in the image file headers. The mean separations are 0.′′251 (F555W) and 0.′′250
(F814W), with errors of ±0.′′002. The mean position angles are 346.3◦ (F555W) and 345.9◦
(F814W), with errors of ±0.5◦.
The flux of the ACS reference star, HD 260655, was also measured in each filter to
derive the normalization factors for PSF subtractions. The F555W flux was obtained by
fitting the Tiny Tim PSF. As with GG Tau, the fit in F814W was done using HD 17637. HD
260655 was saturated in the core in F814W, and those pixels were given zero weight in the
fit. As with GG Tau, the fluxes were converted to standard magnitudes assuming a M1.5V
spectrum. The estimated errors are ±0.03 mag (F555W) and ±0.06 mag (F814W).
Besides GG Tau A, other stars are seen in the HRC field and were measured using
r = 0.′′4 apertures in the distortion-corrected images. The stars’ photometry and positions
relative to GG Tau A are given in Table 2. The fluxes were aperture corrected and converted
to standard magnitudes assuming a M5.5V spectrum for the GG Tau B components and
a K5V spectrum for the others. The estimated photometric errors are ±0.05 for GG Tau
B and ±0.09 for the others. The GG Tau B binary has a separation of ∼1.′′5. The fainter
Page 7
– 7 –
Fig. 1.— ACS images of GG Tau. (Top) Unsubtracted images in filters F555W (V ) and
F814W (I), displayed with logarithmic stretches. (Bottom) Combined first and second
orientation images after subtraction of reference PSFs, displayed with square-root stretches.
The locations of the binary components are marked with crosses. North is up in all of these
images.
Page 8
– 8 –
component, Bb, is very red (V −Ic = 4.55) and was assigned a spectral type of M7 by White
et al. (1999). The brighter star, Ba, was given an M5 type. Designations for the other stars
in the field have not been made in previous studies, so we assign them arbitrary names. The
colors of these stars imply that they are of types earlier than M2. One of them, which we
designate GG Tau 1, was first noted by Silber et al. (2000), and further observations by Itoh
et al. (2002) indicated that its motion relative to GG Tau A is consistent with it being a
background star.
For comparison with the 1997 WFPC2 observations (KSW02) and the new ACS ones,
the 1994 WFPC2 F555W and F814W images of GG Tau Aa/Ab (Ghez et al. 1997) were also
measured by fitting Tiny Tim PSF models using the KSW02 routines. These measurements
are independent of those reported by Ghez et al. (who fitted observed PSFs rather than
models), which were later converted to standard magnitudes by White & Ghez (2001). Our
values for these images for Aa & Ab are V=12.34 ±0.03 & 15.31 ±0.06 and Ic=10.50 ±0.03
& 12.28 ±0.04. These are about 0.05 mag (Aa) and 0.1 mag (Ab) fainter than the values
reported by White & Ghez (2001), due either to the differences in measurement techniques
or assumptions for spectral types used when converting to the standard magnitude system.
For consistency, we use only our photometric measurements and those of KSW02. There
were no differences between our measurements of the position angle and separation and
those reported by Ghez et al. (1997). Comparison of the mean of the F555W and F814W
ACS position angles to the 1994 angle provides an average binary angular motion of −1.52◦
yr−1± 0.1◦. There is no significant change in separation between the two epochs.
2.2. PSF Subtraction
Using the measured photometry and positions, synthetic binaries for each filter at each
orientation were constructed by shifting and intensity-scaling the HD 260655 images. These
images were subtracted from GG Tau, and the resulting images were then corrected for
geometric distortion. The data for each filter from both rolls were combined by rotating the
image from the second roll to match the first, replacing pixels within the diffraction spikes
at one roll with those from the other, and then averaging the two. The results are shown in
Figure 1. Because of the larger mismatch in color between the GG Tau stars and HD 260655
within the F555W passband, the subtraction residuals (radiating streaks and rings around
the stars) are greater in that filter than in F814W.
An initial review of the F814W images revealed significant contamination by residuals
caused by the incomplete subtraction of the red halo (Figures 2a,2b). This remnant halo
may be caused by the color mismatch between GG Tau Ab (V −Ic = 2.79) and the reference
Page 9
– 9 –
Table 2. GG Tauri System Stellar Photometry
Star V Ic V − Ic Sepa P.A.b
GG Tau Aa 12.23 10.43 1.80
GG Tau Ab 15.18 12.37 2.81
GG Tau Ba 17.11 13.41 3.70 10.′′2 185.6◦
GG Tau Bb 19.94 15.39 4.55 11.′′2 179.8◦
GG Tau 1 21.55 19.28 2.27 6.′′2 241.1◦
GG Tau 2 16.90 16.14 0.76 13.′′5 211.5◦
GG Tau 3 25.4 22.6 2.8 11.′′6 7.9◦
GG Tau 4 16.95 16.24 0.71 16.′′7 45.9◦
GG Tau 5 22.45 20.27 2.19 16.′′7 42.2◦
HD 260655 9.53 7.86 1.67
aDistance measured from GG Tau A binary midpoint
bPosition angle measured from GG Tau A binary mid-
point
Page 10
– 10 –
PSF (V −Ic = 1.77). However, given that GG Tau Aa is ∼ 6× brighter than Ab, it may more
likely be the result of small differences between the spectra of Aa and HD 260655 within the
F814W passband, despite their nearly equal V − Ic colors.
When the F814W PSF-subtracted, distortion-corrected images of GG Tau from each
roll are rotated to a common sky orientation and the second is subtracted from the first,
an asymmetry in the halo becomes apparent (Figure 2d). It is clearly instrumental because
the residuals are not confined to the ring. Some of the asymmetry is caused by the distor-
tion correction combined with the different rolls. The HRC detector is tilted relative to the
incident beam to minimize focus variations over the field, resulting in significant geometric
distortion (for instance, the diffraction spikes are 7◦ from being perpendicular in the uncor-
rected images). Assuming the halo is circularly symmetric in detector coordinates, then after
distortion correction it will appear elliptical with the major axis roughly along the (+X,+Y)
diagonal. When the second image is rotated to match the sky orientation of the first, the
angle of the residual halo axis will be different between the two images (compare 2a and 2b).
If the halo was perfectly symmetric on the detector, then the residuals should be symmetric
as well, but they are not, suggesting some intrinsic asymmetry. Given that the detector is
tilted relative to the incoming beam, the halo may be brighter on one side than the other
due to a preferential scattering angle within the mounting substrate. The halo may also be
field-dependent due to changes in the incident beam angle.
In regions where the halo effect is strong, we estimate that the portion of the subtraction
residuals caused by halo mismatches correspond to ∼15% the brightness of the disk.
3. Results
3.1. General Features
The PSF-subtracted ACS images provide the clearest views of the GG Tau disk ob-
tained so far in scattered light. The use of two rolls provides complete images of the ring
and avoids diffraction spike residuals seen in the previous single-roll WFPC2 and NICMOS
images. Excluding the red halo problem, the relatively field-independent ACS PSF provides
somewhat better subtractions than are possible with WFPC2, resulting in higher contrast
views of the disk structure (Figure 3). The finer resolution also permits better registration
of the PSFs with reduced interpolation artifacts. In addition, the deeper exposures allow
the far, southern side of the ring to be unambiguously imaged in V for the first time.
In general, the system looks much as it did in the WFPC2 and NICMOS images, though
more subtle intensity variations are visible. The outer apparent edge measures 3.′′7 by 3.′′0.
Page 11
– 11 –
Fig. 2.— ACS F814W (I) images of GG Tauri demonstrating the impact of the red halo. (a)
PSF-subtracted image from the first orientation with an intensity stretch chosen to highlight
the residual halo, which can be seen outside of the ring. The halo is brighter towards
the upper right. (b) The image from the second orientation. Note that the asymmetry
in the halo is fixed with respect to the detector axes (indicated by the +X,+Y compass).
(c) Square-root stretch of the combined F814W images, for reference. (d) The subtraction
of the second F814W PSF-subtracted image from the first, showing the instrumental halo
asymmetry (linear stretch). All of the images are at the same orientation.
Page 12
– 12 –
The northern side is peak is ∼ 3.3× brighter than the southern. This is expected from
forward scattering by dust grains, as the northern side is closer to us as determined from the
measured rotation of the disk and the motion of the binary (Guilloteau, Dutrey, & Simon
1999). It has maximum surface brightnesses of V ≈ 18.4 and Ic ≈ 15.9 mag arcsec−2. The
southern, more distant side of the ring appears about twice as thick as the nearer one. This
is a projection effect, as both the inner wall and upper surface of the backside of the disk are
seen there while in the north only the illuminated upper surface is visible (see Figure 2 in
Silber et al. 2000). The west side appears thinner, brighter, and more irregular than the east
side. The inner edge of the ring is fairly well defined in the north but is diffuse to the east
and south, and along the west it is highly irregular. The outer edge is fairly smooth except
in the west. Because the disk is optically and geometrically thick, its inclination causes the
midpoint between the stars to appear offset ∼0.′′25 forward from the ring center (as defined
by the center of the ellipse fit to a trace through the ring peak azimuthal isophotes).
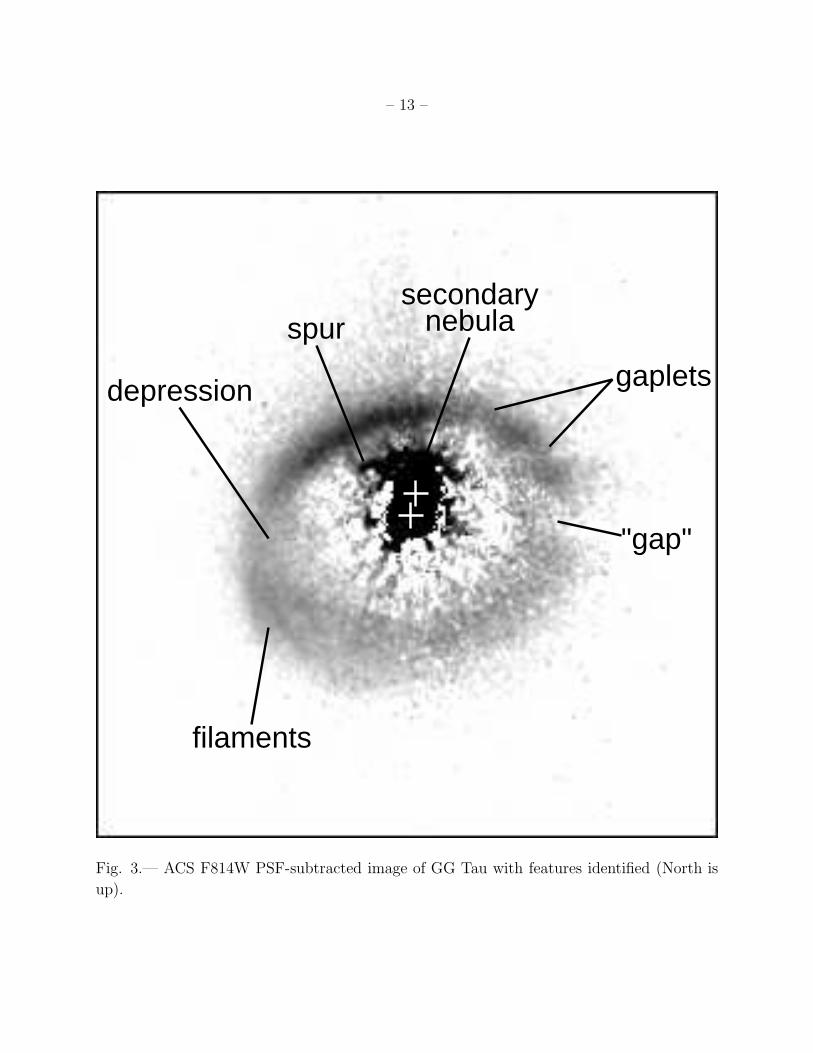
The images clearly show the 0.′′4 wide “gap” in the western section of the ring between
PA=254◦ − 275◦ that was identified in previous studies (Figure 3). Within it the surface
brightness decreases by one-half relative to the adjacent sections of the ring. In V a PSF
subtraction residual passes through the middle of the gap. There are other, less prominent
“gaplets” along the northwest section centered at PA≈ 290◦ and 320◦. There are two thin
filaments along the outer edge of the ring between PA=100◦ − 150◦ in a section previously
called the “kink” (Silber et al. 2000). They overlap with a separation of 0.′′11 and are seen
in both V and I bands as well as in the WFPC2 I band image. They are not resolved in the
NICMOS images. The filaments are better defined in V than I, perhaps due to the higher
resolution or an increase in the opacity at shorter wavelengths in the dust lane separating
them.
There is a “depression” in the surface brightness along the eastern interior edge (PA=
90◦−114◦) relative to the adjacent sections of the ring. The depression seems more defined in
V than I, hinting of a possible increase in extinction at shorter wavelengths by circumstellar
material. However, the red halo residuals prevent any definitive conclusions.
The interior of the ring does not appear to be completely clear, and it is brighter than
the surrounding region immediately outside of the ring. This is especially apparent in the
V image, which is free of any red halo contamination. Excluding any small regions with
significant subtraction residuals near the stars that could bias the flux measurements, the
interior has median surface brightnesses of V = 20.1± 0.4 and Ic = 18.1± 0.4 mag arcsec−2.
Increasing the reference PSF intensity by 10% during PSF subtraction would eliminate this
flux, but would lead to significant oversubtraction outside of the ring. This amount of
adjustment is also greater than the photometric measurement errors allow.
Page 13
– 13 –
"gap"
depression
spursecondary
nebula
filaments
gaplets
Fig. 3.— ACS F814W PSF-subtracted image of GG Tau with features identified (North is
up).
Page 14
– 14 –
As noted by KSW02 from the WFPC2 images, there appears to be a compact region of
reflecting material adjacent to the secondary star on its north side. This “secondary arc” is
clearly seen at the same position angle at both telescope orientations in I, and at nearly the
same position in both V orientations. The greater subtraction residuals at V interfere with
detail near the stars. It therefore appears to be real and is not an instrumental artifact. It
extends out to ∼ 0.′′5 from GG Tau Ab. Its shape and brightness are difficult to accurately
determine given its proximity to the star. At 0.′′3 from GG Tau Ab, its mean I band surface
brightness is 15.5 ± 0.2 mag arcsec−2. This apparent nebulosity can also be seen in the
NICMOS images of Silber et al. (2000), though it was not identified or discussed there. In
the NICMOS images of MDG02 it is located within the region of the diffraction spikes and
is not seen. A short “spur” seems to extend from the nebulosity and runs parallel to the
forward edge. This feature is seen at both orientations at I, though it is more prominent
at the second roll. PSF subtraction artifacts interfere with its detection at V . There is no
sign of it in the WFPC2 images, but the NICMOS image of Silber et al. (2000) does appear
to show a similar feature in the same region. This spur therefore seems to be real and is
probably not a PSF subtraction artifact. The brightness of the secondary nebula suggests
that it is optically thick. As discussed in KSW02, it is too large to be a disk around the
secondary and is too far from the star to be material trapped at the system’s Lagragian
L2 point. Its nature is still unexplained. Its brightness and size makes it a good target
for adaptive optics observations on future very large telescopes. Perhaps with additional
resolution it will be possible to detect features such as spiral arms that could point to a
dynamical cause for its existence.
3.2. Ring Photometry
Azimuthal surface brightness plots for the combined ACS data for each filter are shown
in Figure 4, along with the WFPC2 I band plot. The tracer line used for these was defined
by the peaks of 3rd-order polynomials that were fit to the radial profiles extracted from the
ACS I band image. The tracer was manually adjusted to cross the “gap”, where the fits
failed to converge. The brightness at each azimuth was measured using the median flux
within a 0.′′0752 box centered on line. An ellipse fit through the tracer has a semi-major axis
of 1.′′47, minor axis position angle of 20◦, and eccentricity of 0.63. These values agree well
with those derived by MDG02 using a similar method.
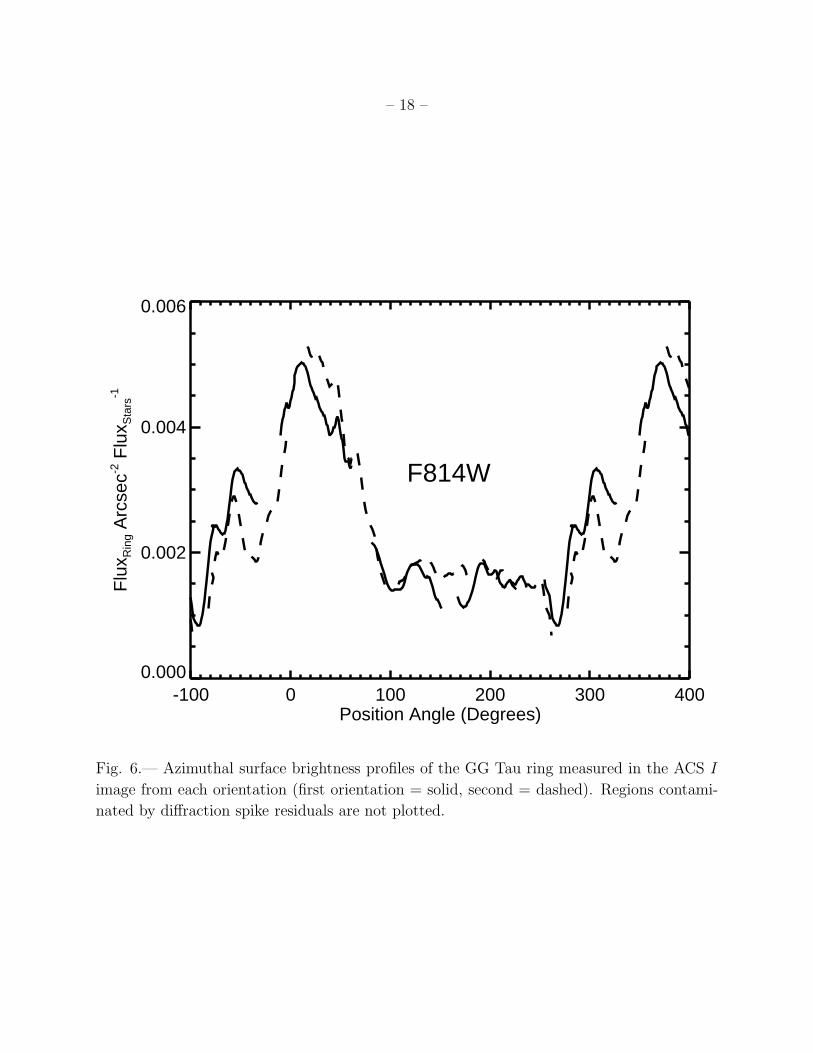
Separate profiles (Figures 5 and 6) were extracted from the ACS images in each filter and
at each orientation to quantify the variations caused by PSF subtraction errors, including
the red halo asymmetry. The V band plots show a ∼ 15% difference along the forward edge
Page 15
– 15 –
-100 0 100 200 300 400Position Angle (Degrees)
0.000
0.002
0.004
0.006
0.008
Flu
x Rin
g A
rcse
c-2 F
lux S
tars
-1
0oWFPC2 F814W
ACS F814W
ACS F555W
Fig. 4.— Azimuthal surface brightness profiles of the GG Tau ring as measured in the ACS
and WFPC2 V and I images. The data from the ACS roll- combined images are shown.
The bold dashed line is WFPC2 V . The values were measured along the line traced along
the ring as shown in the inset image.
Page 16
– 16 –
between the two orientations, which appears to be caused by subtraction residuals, but the
other sections match to better than a few percent. The effects of the red halo asymmetry are
apparent in the I band plots. They show that in the northwest quadrant (PA=250◦ − 350◦)
the ring surface brightness was 20% − 60% greater at the first roll than the second. The
ring is otherwise 10%− 20% brighter in the second-roll image in the north (PA=10◦ − 70◦)
and the south-southeast (PA=110◦ − 180◦). The brightnesses are similar in the southwest
quadrant and in the eastern apex.
To allow quantitative comparisons with the D04 WFPC2 and NICMOS results, fluxes
in the ACS V , ACS I, and WFPC2 I images were measured with the same elliptical annular
aperture that they used. The concentric ellipses defining the annulus had semi-major axes of
0.′′99 and 2.′′2, e = 0.65, minor axis PA=20◦, and were concentric with the ellipse fit through
the tracer line. Fluxes were measured separately in the forward (PA=275◦ − 95◦) and back
(PA=95◦ − 275◦) halves of the annulus.
To exclude any contribution from the “secondary arc”, that region was manually masked
out within the aperture. The same area was essentially masked by the diffraction spikes in
the NICMOS images measured by MDG02 (and used by D04 and so did not contribute to
their values. However, their measurement of the WFPC2 image may be biased by it.
To estimate the photometric errors introduced by the red halo asymmetry, modified
ACS I band images were constructed for each roll. Pixels containing diffraction spikes at
one roll were replaced by the corresponding, uncontaminated pixels from the other roll. This
provided two separate images of the entire ring. Replacing the diffraction spikes with data
from the other roll should not greatly impact the photometry as the spikes cover a small
total area of the ring. The same procedure was applied to the two V images as well. The
ring fluxes from these separate images were used to define the error ranges in the flux ratios
that follow. In addition, for the purposes of the flux ratio measurements only, the diffraction
spike regions in the WFPC2 I image were replaced with the corresponding values from the
roll-combined ACS I image.
The fluxes of the ring (Fring) relative to the combined stellar fluxes (Fstars) are 0.58%
±0.01% (V ) and 1.09%±0.03% (I). The I band value likely represents the upper limit as
the residual red halo would make the ring appear brighter than it actually is. The integrated
forward/backside (F/B) flux ratios are 1.25 ±0.01 (V ) and 1.31±0.10 (I). This measurement
is clearly sensitive to the halo asymmetry. The WFPC2 I band image values are F/B= 1.56±
0.03 and Fring/Fstars=1.23%±0.02%. These can be compared to the measurements of the
same WFPC2 image by D04, who derived F/B=1.80±0.03 and Fring/Fstars=1.30%±0.03%.
These larger values may be due to contamination by the secondary arc, which we avoided.
Page 17
– 17 –
-100 0 100 200 300 400Position Angle (Degrees)
0.000
0.001
0.002
0.003
0.004
Flu
x Rin
g A
rcse
c-2 F
lux S
tars
-1
F555W
Fig. 5.— Azimuthal surface brightness profiles of the GG Tau ring measured in the ACS V
image from each orientation (first orientation = solid, second = dashed). Regions contami-
nated by diffraction spike residuals are not plotted.
Page 18
– 18 –
-100 0 100 200 300 400Position Angle (Degrees)
0.000
0.002
0.004
0.006
Flu
x Rin
g A
rcse
c-2 F
lux S
tars
-1
F814W
Fig. 6.— Azimuthal surface brightness profiles of the GG Tau ring measured in the ACS I
image from each orientation (first orientation = solid, second = dashed). Regions contami-
nated by diffraction spike residuals are not plotted.
Page 19
– 19 –
-100 0 100 200 300 400Position Angle (Degrees)
0.0
0.5
1.0
1.5
2.0
2.5
3.0
Flu
x / M
edia
n F
lux
F555W
F814W
Fig. 7.— Azimuthal surface brightness profiles of the GG Tau ring measured in the roll-
combined ACS V and I images, normalized by the median flux within the ring in each
bandpass.
Page 20
– 20 –
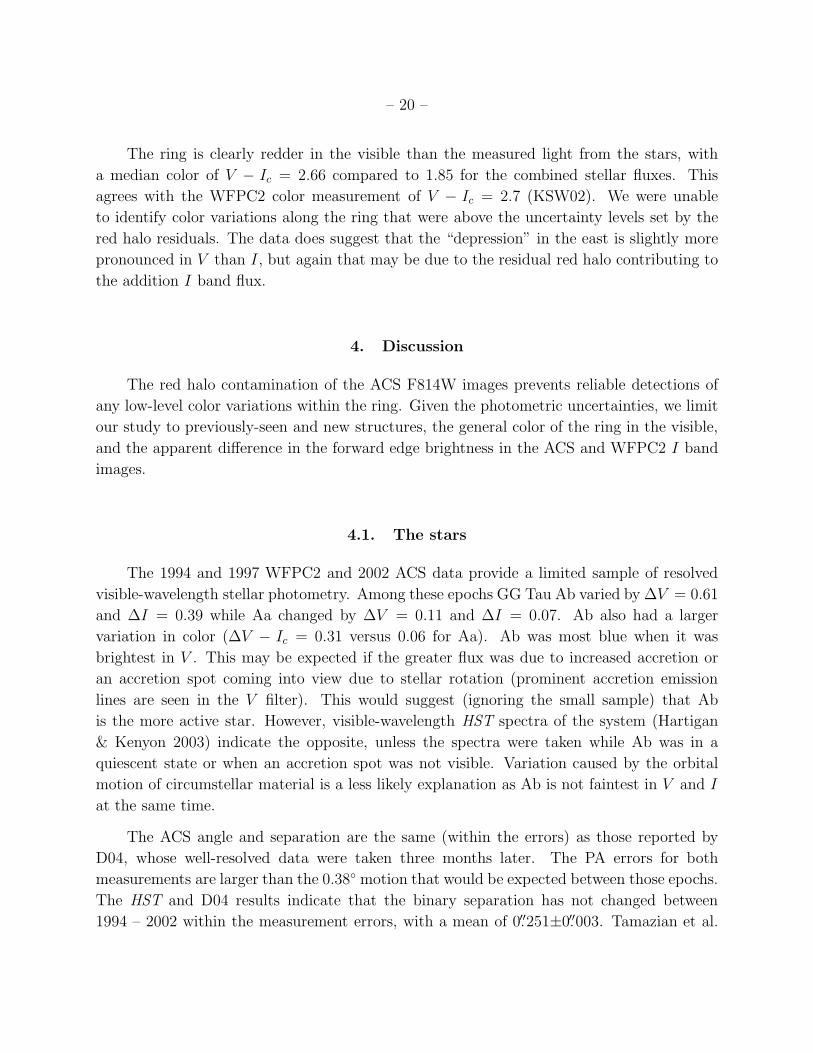
The ring is clearly redder in the visible than the measured light from the stars, with
a median color of V − Ic = 2.66 compared to 1.85 for the combined stellar fluxes. This
agrees with the WFPC2 color measurement of V − Ic = 2.7 (KSW02). We were unable
to identify color variations along the ring that were above the uncertainty levels set by the
red halo residuals. The data does suggest that the “depression” in the east is slightly more
pronounced in V than I, but again that may be due to the residual red halo contributing to
the addition I band flux.
4. Discussion
The red halo contamination of the ACS F814W images prevents reliable detections of
any low-level color variations within the ring. Given the photometric uncertainties, we limit
our study to previously-seen and new structures, the general color of the ring in the visible,
and the apparent difference in the forward edge brightness in the ACS and WFPC2 I band
images.
4.1. The stars
The 1994 and 1997 WFPC2 and 2002 ACS data provide a limited sample of resolved
visible-wavelength stellar photometry. Among these epochs GG Tau Ab varied by ∆V = 0.61
and ∆I = 0.39 while Aa changed by ∆V = 0.11 and ∆I = 0.07. Ab also had a larger
variation in color (∆V − Ic = 0.31 versus 0.06 for Aa). Ab was most blue when it was
brightest in V . This may be expected if the greater flux was due to increased accretion or
an accretion spot coming into view due to stellar rotation (prominent accretion emission
lines are seen in the V filter). This would suggest (ignoring the small sample) that Ab
is the more active star. However, visible-wavelength HST spectra of the system (Hartigan
& Kenyon 2003) indicate the opposite, unless the spectra were taken while Ab was in a
quiescent state or when an accretion spot was not visible. Variation caused by the orbital
motion of circumstellar material is a less likely explanation as Ab is not faintest in V and I
at the same time.
The ACS angle and separation are the same (within the errors) as those reported by
D04, whose well-resolved data were taken three months later. The PA errors for both
measurements are larger than the 0.38◦ motion that would be expected between those epochs.
The HST and D04 results indicate that the binary separation has not changed between
1994 – 2002 within the measurement errors, with a mean of 0.′′251±0.′′003. Tamazian et al.
Page 21
– 21 –
(2002) predicted a separation of 0.′′244 for the epoch of the ACS observations, outside of the
ACS measurement errors. Their predicted position angle is consistent with that observed,
however. Their orbit may be biased by speckle results, which appear to show large and
inconsistent variations in both PA and separation among the various epochs.
4.2. Comparisons with Similar Wavelengths
Comparisons of the ACS andWFPC2 V band images do not reveal significant differences
given the large PSF subtraction residuals and low exposure depth of the WPFC2 data. The
general appearance is similar, but details such as the “depression” are poorly defined.
The ACS and WFPC2 I band images are more comparable, though care must be taken
to identify possible red halo effects. The general appearance is the same between them. The
“gap” and secondary arc are both present, though the “gaplets” are not clearly present in
the WFPC2 image (saturated column bleeding and diffraction spike residuals are present in
the WFPC2 data). The “depression” is seen in the WFPC2 image, but it is not quite as
well defined as it is in the ACS one.
The forward side does appear to be ∼ 20% brighter in WFPC2 than in ACS while the
back sides are fairly equal. The integrated F/B ratios are 1.56 (WFPC2) and 1.31 (ACS), and
the F/B amplitude ratios are ∼ 4 (WFPC2) and ∼ 3.3 (ACS). These discrepancies are above
the uncertainty level expected from the red halo contamination in the ACS images. The back
side of the ring has essentially the same brightness in both ACS and WFPC2 images. We
believe that this is a real effect and indicates that some variability in the illumination pattern
is likely. We note that there does not appear to be any significant changes in the positions
of any features between the epochs, including the “gap”, indicating that any shadowing
material causing it must be further from the stars than whatever is altering the pattern on
the forward side.
Time-dependent variations in the appearances of reflection nebulae (envelopes, disks)
surrounding young stars have been seen in R Mon (Lightfoot 1989), HH 30 (Stapelfeldt et
al. 1999), and others. The timescale of these changes (e.g. 5 years for GG Tau) is too
short to be caused by physical variations in the ring itself – they must be due to irregular
illumination by the stars. Continuum emission from accretion spots on the star could in-
crease the amount of light seen by a particular section of the disk, and as the star rotates
they could vary the illumination pattern. Another possibility is shadowing from irregularly
distributed circumstellar material near enough to the star to have a short orbital period or
be placed where the orbital motion of the stars alters the projected light. The variation in
Page 22
– 22 –
the brightness of the near edge between the two epochs matches the change in the observed
flux from GG Tau Ab. This suggests that if light from Aa was blocked by a circumstellar
disk in the ring plane, Ab could be the primary illumination source for this edge. A final
potential cause is a light echo from an intense, short-term brightening of one of the stars.
Due to the light travel time, the starlight reflected by the back side of the ring is seen about
1.3 days later than that from the forward edge. Differences in the phases of the stellar light
curves might then result in equal backside ring brightnesses at both epochs while the forward
side appears brighter at one of them. This would require either star to vary by more than
twice its observed intensity range over a one day timescale.
4.3. Comparisons with Different Wavelengths
As noted before, direct comparisons of the V and I ACS images are difficult because
of the PSF subtraction residuals in V and the red halo in I. The profiles in Figure 7 would
suggest that the forward edge in V is somewhat brighter than in I, relative to the rest of
the ring. However, this difference is within the range of errors expected from the residuals.
The NICMOS image of Silber et al. (2000) appears very similar to those from ACS. The
“gap” is clearly seen but not the “gaplets.” The “depression” in the east is also apparent, but
the outer edge there is brighter compared to the ACS images. Silber et al. report a ∼ 4.0×
difference between the front and back side surface brightnesses, compared with ∼ 3.3× seen
in the ACS image. They note the presence of two compact features within the clear region
that they suggest may be reflecting material. The first is an elongated streak to the southeast
of the star. A similar feature is not seen in the other images, except perhaps in the MDG02
J one, in which a thin residual streak extends along the same direction. However, this streak
appears sharper than the PSF resolution of the system and is probably a chance subtraction
artifact. The Silber et al. artifact may also be a subtraction residual or polarizer ghost. The
second feature looks very much like the “spur” seen extending from the secondary arc in the
ACS images.
The MDG02 NICMOS F110W (∼ J), F160W (∼ H), and F205W (∼ K) images have
considerably poorer sampling than those from ACS (0.′′076 vs. 0.′′025 pixel−1). The F205W
image was taken at a non-optimal focus position and so is ignored. The residuals from
the diffraction spikes, which appear 2× wider at H than I, block large portions of the
ring including the “gap”, “depression”, and secondary arc. The two “gaplets” are visible,
however. The front/back amplitude ratios are ∼ 4 for both filters, compared to 3.3 for ACS
I. To measure the integrated ring fluxes, they replaced the blocked pixels of the ring with
the mean disk flux per pixel. Their integrated F/B ratios are 1.41±0.03 (J) and 1.39±0.02
Page 23
– 23 –
(H), compared with 1.31 for ACS I. These images were taken only 14 days after those from
WFPC2, but the WFPC2 F/B ratio is considerably higher (1.56 − 1.80, depending on the
study). How much of this difference can be attributed to the longer wavelength is unknown,
but this may be evidence for short-period ring illumination variations.
The Keck 3.8 µm (L′) image (D) has some significant differences in comparison with
those at shorter wavelengths. The distance between the binary’s center of mass and the
forward edge of the ring is 0.′′1 greater than in the HST images. D04 attribute this to the de-
creased opacity at longer wavelengths of the dust along the inner forward edge. The “gap”
is seen, though at reduced contrast relative to the other HST and ground-based images,
perhaps indicating a reduction in the extinction caused by the shadowing circumstellar ma-
terial. There are no signs of the “gaplets.” The eastern side is well defined in L′, while it is
ambiguous in ACS I. This may also point to reduced extinction. The southeast quadrant
is the faintest section in the Keck image, being within the noise; in ACS, this section is
brighter than the eastern extreme, which contains the “depression.” There is no indication
of the “secondary arc” above the level of the residuals near the stars.
The most significant feature of the Keck L′ image is the unexpectedly large amount
of forward scattering. The F/B amplitude ratio is > 5 and the integrated F/B ratio is
∼ 2.5, well above that seen in any of the shorter wavelength images. A single ISM-like grain
size distribution would cause scattering to become more isotropic at longer wavelengths, in
which case the L′ image should show little forward scattering, extrapolating from the shorter
wavelengths. D04 suggest that Keck is seeing larger (> 1µm) particles that are not visible at
shorter wavelengths, thus explaining the increased forward scattering. These larger particles
are located closer to the disk midplane (∼25 AU versus ∼50 AU at shorter wavelengths) and
so could only be seen at longer wavelengths that could penetrate through the thick dust.
That the L′ image is seeing further into the disk is evident by the increase in the separation
of the forward ring edge and the stars. D04 suggest that this vertical stratification of particle
sizes relative to the disk height is evidence for grain growth close to the disk midplane, where
particles have a greater chance of colliding and coagulating.
4.4. Shadows and Warping
The variations along the ring suggest that the illuminated surface of the disk is irregular.
They include:
• The intensity distribution along the forward edge is asymmetric about the line of sight.
• The forward side appears to vary in brightness over time.
Page 24
– 24 –
• The western side contains a series of likely azimuthal shadows (the “gap” and “gaplets”).
• The western side of the ring is brighter, narrower, and has a sharper (though irregular)
inner edge than the eastern side.
• The extreme eastern inner edge has a lower intensity and the outer edge contains
narrow filaments.
The first three of these can be easily explained by shadowing caused by optically thick
(or nearly so) concentrations of dust between the stars and the disk. The asymmetry in
the forward edge could be altered by material very near one of the stars, perhaps associated
with the secondary arc. Orbital motion of the material or the star could then change the
distribution of light along the forward surface over a matter of hours or days.
The gaps along the western side are almost certainly shadows. There is no sign of a
depletion of material in the gap in the millimeter images (Guilloteau, Dutrey, & Simon 1999).
Given the viscosity of the massive, gas-rich disk, it is likely that any resonantly-created gap
would be filled in quickly. The shadowing material must be fairly dense, though, to cause
the most prominent gap to appear even at λ = 3.8µm.
The last two items in the list are more difficult to explain with only shadowing, and
they imply that the ring is intrinsically asymmetrical. Guilloteau, Dutrey, & Simon (1999)
noted that their mm continuum image shows an apparent density enhancement along the
western side, which the scattered light images show is brighter than the opposite side. If
this enhancement is real, then it may indicate that the density distribution of scatterers is
also different around the ring. An azimuthal dependence of the disk flaring or scale height
would alter both the scattering phase angle and the projected surface area. A change in
the flaring function could explain why the east side appears wide and poorly-defined along
its inner edge while the west side is bright, narrow, and has a well-defined edge. It could
also explain the asymmetry along the forward edge. However, the timescale for density
distribution variations is too long to cause the illumination changes seen between the ACS
and WFPC2 images.
Variations in the density distribution would not be surprising, given the strong tidal
influence of the binary. Most circumbinary disk models (Artymowicz & Lubow 1996) show
density asymmetries caused by the orbital eccentricity of the binary, including spiral pat-
terns. These could cause the scattering surface of the disk to be highly variable on small
spatial scales, in effect creating localized flared or self-shadowing regions. Perhaps this is an
explanation for the filaments.
Page 25
– 25 –
4.5. Ring Color
The ring has a significant red excess in the visible (V −Ic = 0.8) while the near-IR colors
are more neutral (J−H = 0.1 andH−K = −0.04; MDG02). The easiest explanation for this
is that increasing extinction from circumstellar material accounts for the lower Fring/Fstars
flux ratio towards shorter wavelengths. KSW02 derived a required extinction of Av=1.2 mag.
This simple solution, however, ignores any color effects caused by the wavelength-dependent
scattering properties of the ring material itself.
Wood et al. (1999) reported the first results of matching multiple scattering models of
GG Tau to multi-color data (the J , H , andK band images of R96), assuming grain properties
that reproduce the ISM extinction curve. Their models resulted in a blue, rather than red,
color excess, even when extinction by a circumstellar disk was added to match Fring/Fstars.
MDG02 later computed models to match their NICMOS images. Using a somewhat similar
disk geometry but different grain properties (though still matching the ISM extinction curve),
they were able to produce a significant red excess without extinction by any circumstellar
material. However, their models differ from their NICMOS data by significant amounts
in terms of Fring/Fstars and F/B ratios. Their results suggest that uncertainties in grain
properties (i.e. scattering phase function, albedo, and size distribution) may be the primary
source of color mismatches between models and observations, rather than geometrical or
possible circumstellar extinction effects.
4.6. Ring Variations and Modeling
D04 have expanded on the work of MDG02 to include models for the WFPC2 I band
and Keck L′ images in addition to those from NICMOS. Rather than simply matching the
integrated F/B ratios, they attempted to find models whose azimuthal brightness profiles
best matched the observed ones. They claim that this provides a more accurate indication
of the grain scattering properties than does the simple F/B contrast ratio. As previously
discussed, they were unable to match the azimuthal profiles at all wavelengths with a single
grain size distribution, requiring instead a separate distribution of larger grains in order to
explain the large amount of forward scattering at L′. Their models, however, are incomplete
as they significantly underestimate the F/B contrast and overestimate the Fring/Fstars ratio
at every wavelength (they do suggest Av=1 mag of extinction between the stars and ring to
reduce the ratio). So far, no one has developed a model that simultaneously reproduces the
ring’s color, forward/backside contrast, and ring-to-stars flux ratio.
The apparent position-and-time-dependent variability in the illumination pattern on the
Page 26
– 26 –
ring may create difficulties for those modeling the dust distribution and grain properties of
the GG Tau disk using non-contemporaneous datasets, especially when comparing images
at multiple wavelengths. The forward/backside contrast is the strongest constraint on the
scattering phase function, and it is now evident that this value can vary over time within
the same passband. Time-resolved imaging of the GG Tau ring is required to verify the
illumination variations and establish the variation timescale. This may be possible in the
future with further improvements to ground-based adaptive optics or in the present with
additional HST observations.
The need obviously exists for integrated modeling that produces a dynamical simulation
of the disk and then shows how it would appear in scattered light for a series of assumed
grain and initial dust and gas distributions. Such models could indicate how much asymmetry
would be expected from disk surface warping.
5. Conclusions
We have have presented HST/ACS V and I band images of the GG Tau binary system
and its disk taken in 2002. They confirm the existence of material near the secondary
component, filamentary or spiral structure along the eastern side of the ring along with a
broad region of low surface brightness (the “depression”), and the “gap” in the west as well
as less prominent gaps toward the northwest. The V image unambiguously shows for the
first time the far side of the circumbinary ring. The ring is redder than the apparent light
from the stars with ∆V − Ic = 0.81. There are no significant color variations within the
disk. The forward edge of the ring in the 1997 WFPC2 I image was ∼ 20% brighter than it
was in the ACS exposure, indicating a time-variable illumination pattern.
The gaps indicate that there is circumstellar material that creates shadows on the cir-
cumbinary disk. The asymmetries in the ring suggest that the illuminated disk surface may
also be warped due to tidal interactions with the binary. There is a need for scattered light
models using dust density distributions derived from dynamical simulation of systems similar
to GG Tau. The models need not exactly match the observed images, but rather indicate
how warping of the disk may affect its appearance, placing some constraints on what fea-
tures may be due to illumination or structural variations. The apparent time variation in
the illumination pattern further complicates the analyses, especially when comparing images
at multiple wavelengths taken at different epochs. Monitoring of GG Tau on short and long
timescales is needed.
Page 27
– 27 –
6. Acknowledgements
ACS was developed under NASA contract NAS 5-32865. This research was supported
by the ACS Science Team under NASA grant NAG5-7697. The authors thank F. Menard
and C. McCabe for discussions concerning these and previous results, and the reviewer for
many useful suggestions.
REFERENCES
Artymowicz, P. & Lubow, S. H. 1996, ApJ, 467, L77
Close, L. M. et al. 1998, ApJ, 499, 883
Duchene, G., McCabe, C., Ghez, A. M., & Macintosh, B. A. 2004, ApJ, 606, 969
Dutrey, A., Guilloteau, S., & Simon, M. 1994, A&A, 286, 149
Guilloteau, S., Dutrey, A., & Simon, M. 1999, A&A, 348, 570
Hartigan, P. & Kenyon, S. J. 2003, ApJ, 583, 334
Itoh, Y. et al. 2002, PASJ, 54, 963
Krist, J. E., Stapelfeldt, K. R., & Watson, A. M. 2002, ApJ, 570, 785
Lightfoot, J. F. 1989, MNRAS, 239, 665
McCabe, C., Duchene, G., & Ghez, A. M. 2002, ApJ, 575, 974
Pavlovsky, C., et al. 2004, ACS Data Handbook Version 3.0 (STScI)
Roddier, C., Roddier, F., Northcott, M. J., Graves, J. E., & Jim, K. 1996, ApJ, 463, 326
Silber, J., Gledhill, T., Duchene, G., & Menard, F. 2000, ApJ, 536, L89
Sirianni, M., et al. 1998, Proc. SPIE, 3355, 608
Stapelfeldt, K. R., Krist, J. E., Menard, F., Bouvier, J., Padgett, D. L., & Burrows, C. J.
1998, ApJ, 502, L65
Stapelfeldt, K. R., et al. 1999, ApJ, 516, L95
Tamazian, V. S., Docobo, J. A., White, R. J., & Woitas, J. 2002, ApJ, 578, 925
Page 28
– 28 –
Wood, K., Crosas, M., & Ghez, A. 1999, ApJ, 516, 335
This preprint was prepared with the AAS LATEX macros v5.2.