35
HST/NICMOS Observations of the Near Infrared Background Rodger Thompson and Richard Donnerstein Steward Observatory University of Arizona
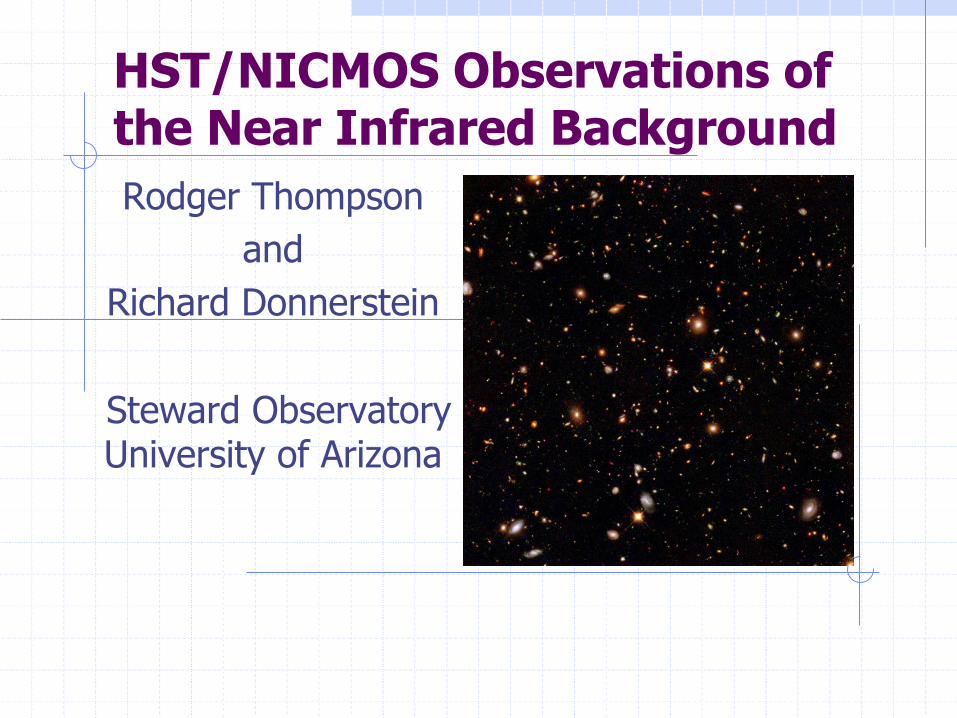
HST/NICMOS Observations of the Near Infrared Background Rodger Thompson
and Richard Donnerstein
Steward Observatory University of Arizona
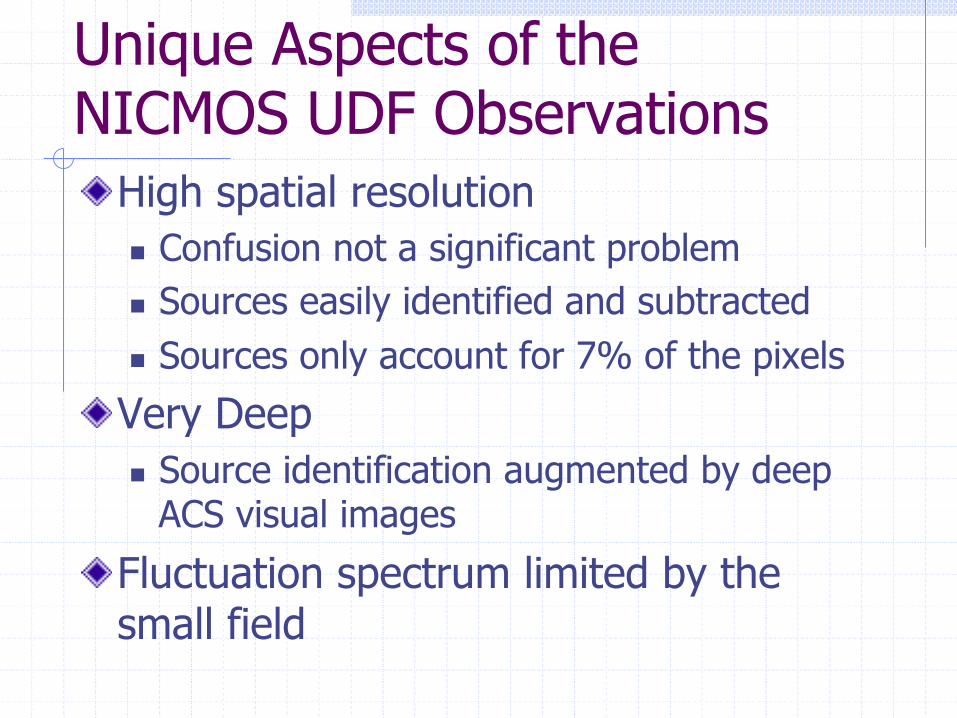
Unique Aspects of the NICMOS UDF Observations ! High spatial resolution
n Confusion not a significant problem n Sources easily identified and subtracted n Sources only account for 7% of the pixels
! Very Deep n Source identification augmented by deep
ACS visual images
! Fluctuation spectrum limited by the small field
Questions For This Conference
! What is the NICMOS measurement of the 1.1 and 1.6 µm background?
! What is the NICMOS measurement of the fluctuation background at 1.1 and 1.6 µm?
! What is the origin of the source subtracted NICMOS measured fluctuations?
! Do the NICMOS observations require a new population of sources?
Previous Issues that are Reappearing in the Literature ! Near Infrared Background Excess
(NIRBE) ! Primary Contributors to the Total NIRB ! The Contributors to the Source
Subtracted NIR Fluctuation Spectrum ! The Contribution of the Sources of
Reionization to the NIR Fluctuation Spectrum
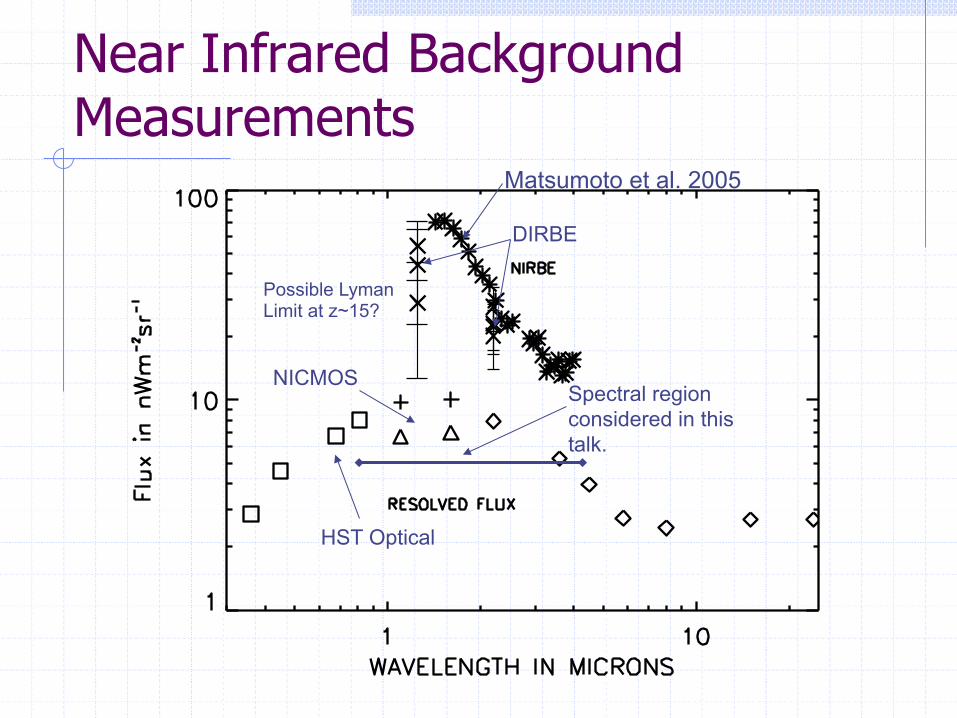
Near Infrared Background Measurements
Matsumoto et al. 2005
NICMOS
DIRBE
HST Optical
Spectral region considered in this talk.
Possible Lyman Limit at z~15?
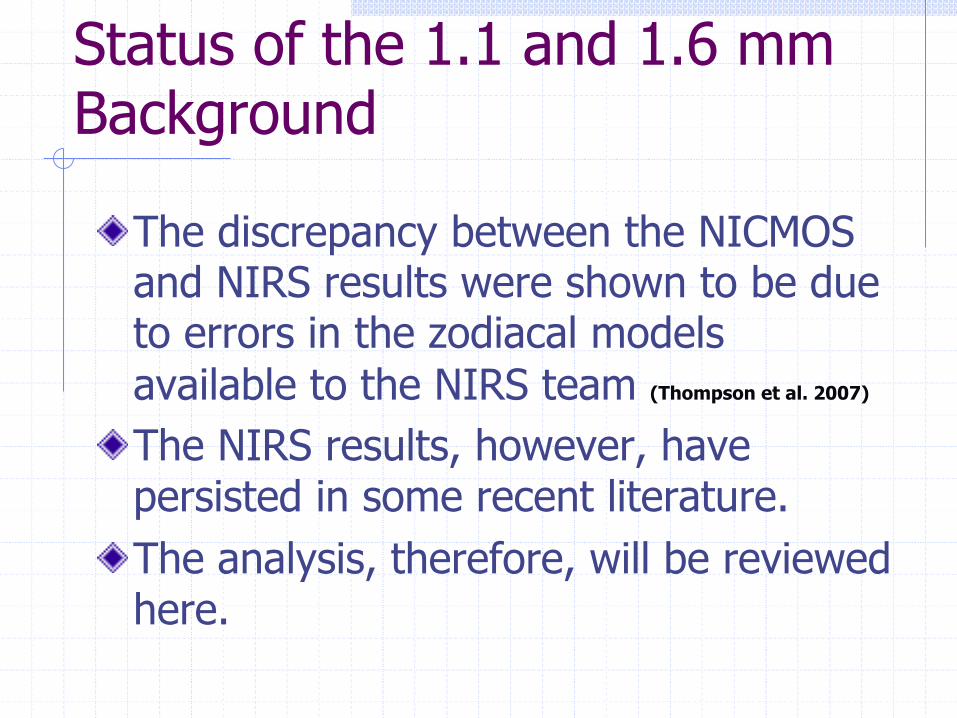
Status of the 1.1 and 1.6 mm Background
! The discrepancy between the NICMOS and NIRS results were shown to be due to errors in the zodiacal models available to the NIRS team (Thompson et al. 2007)
! The NIRS results, however, have persisted in some recent literature.
! The analysis, therefore, will be reviewed here.
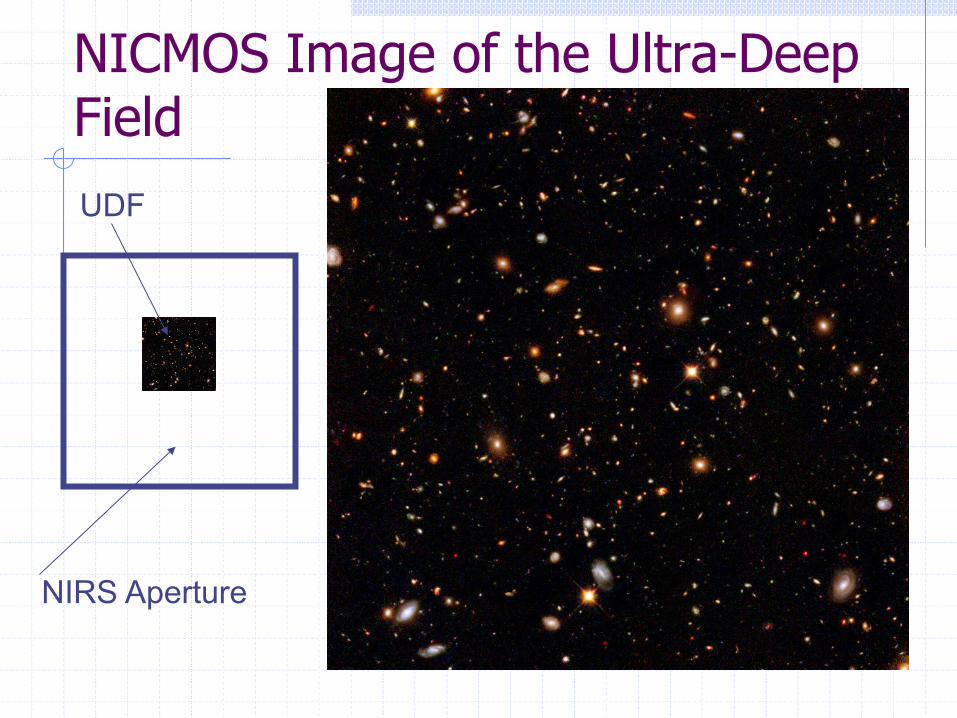
NICMOS Image of the Ultra-Deep Field
NIRS Aperture
UDF
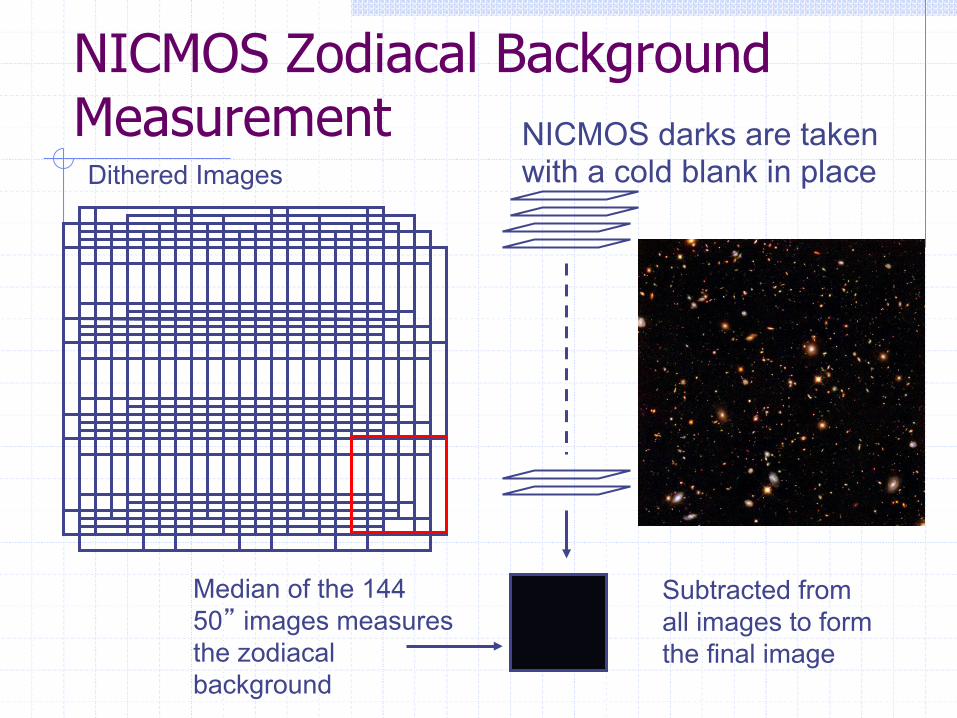
NICMOS Zodiacal Background Measurement
Median of the 144 50” images measures the zodiacal background
Dithered Images
Subtracted from all images to form the final image
NICMOS darks are taken with a cold blank in place
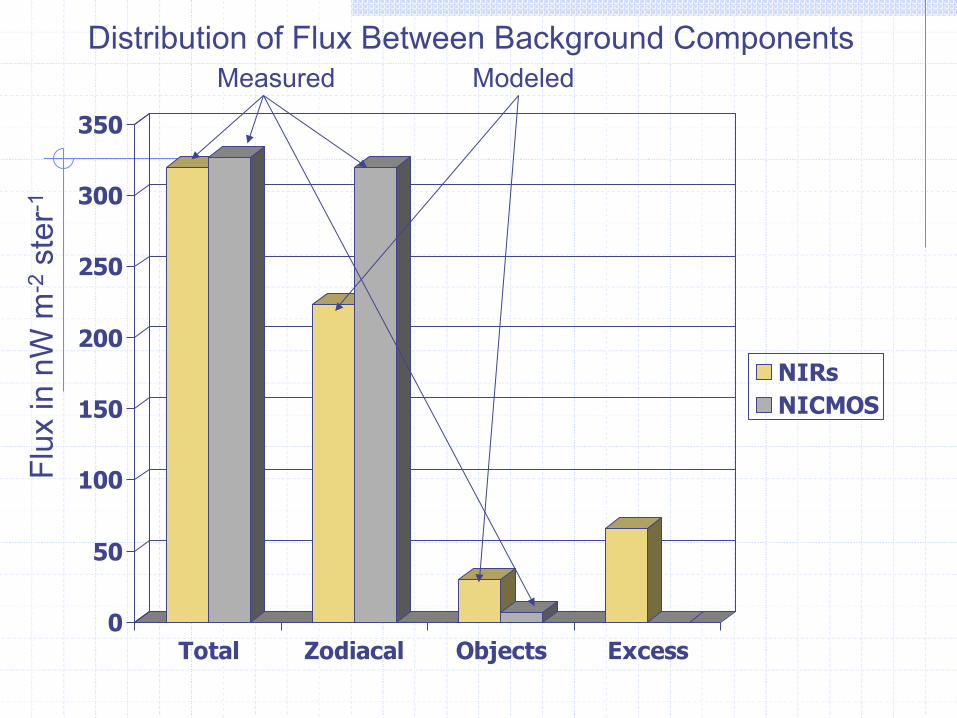
0
50
100
150
200
250
300
350
Total Zodiacal Objects Excess
NIRsNICMOS
Flux
in n
W m
-2 s
ter-1
Distribution of Flux Between Background Components
Measured Modeled
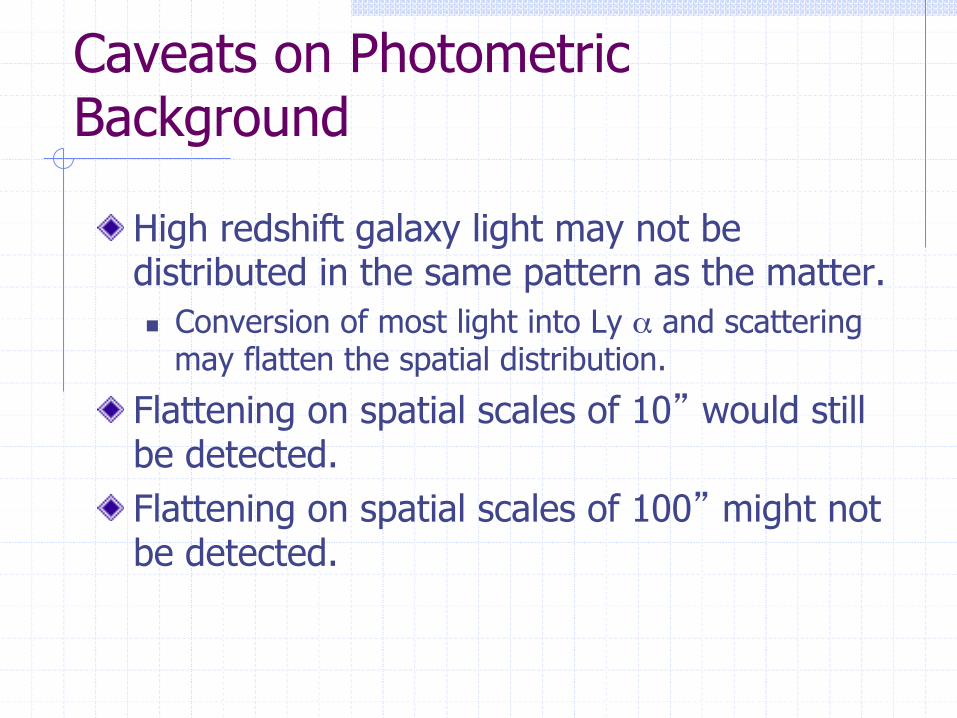
Caveats on Photometric Background
! High redshift galaxy light may not be distributed in the same pattern as the matter. n Conversion of most light into Ly α and scattering
may flatten the spatial distribution.
! Flattening on spatial scales of 10” would still be detected.
! Flattening on spatial scales of 100” might not be detected.
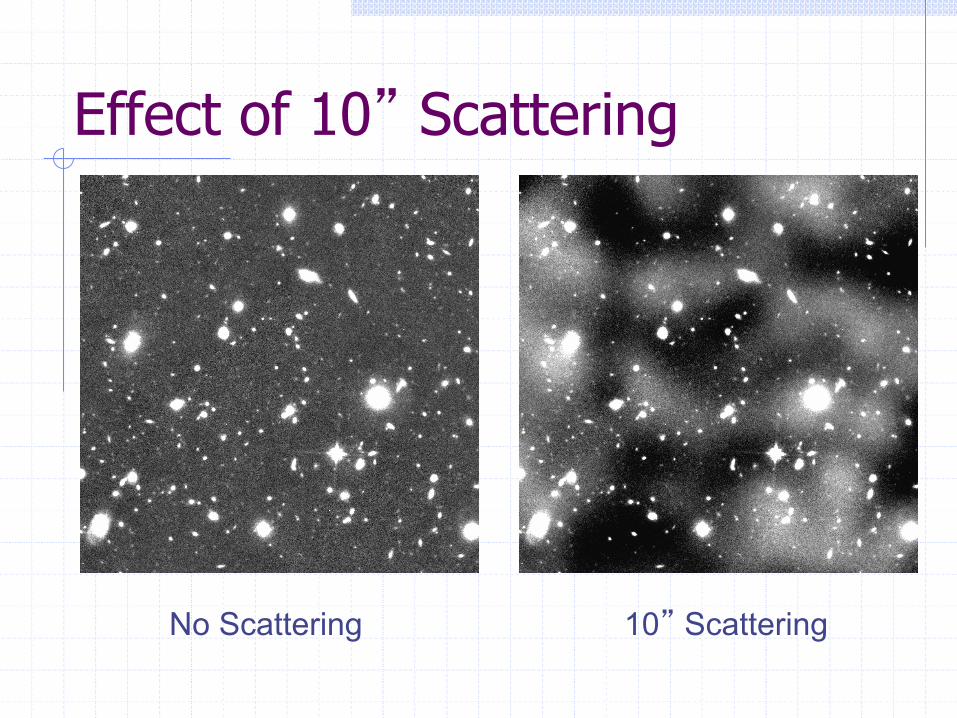
Effect of 10” Scattering
No Scattering 10” Scattering
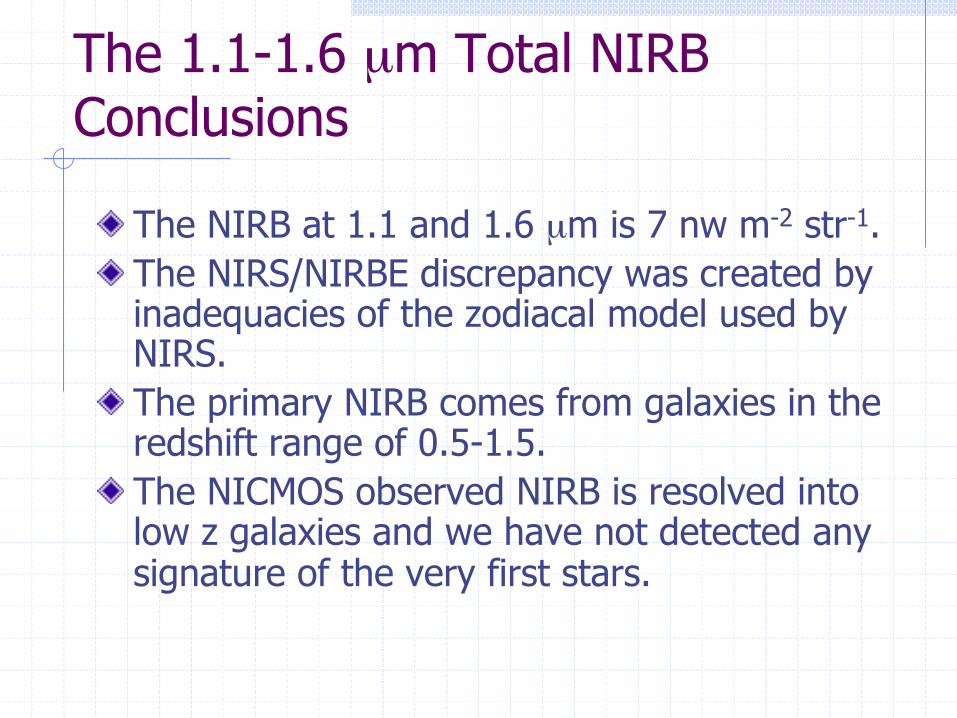
The 1.1-1.6 µm Total NIRB Conclusions
! The NIRB at 1.1 and 1.6 µm is 7 nw m-2 str-1. ! The NIRS/NIRBE discrepancy was created by
inadequacies of the zodiacal model used by NIRS.
! The primary NIRB comes from galaxies in the redshift range of 0.5-1.5.
! The NICMOS observed NIRB is resolved into low z galaxies and we have not detected any signature of the very first stars.
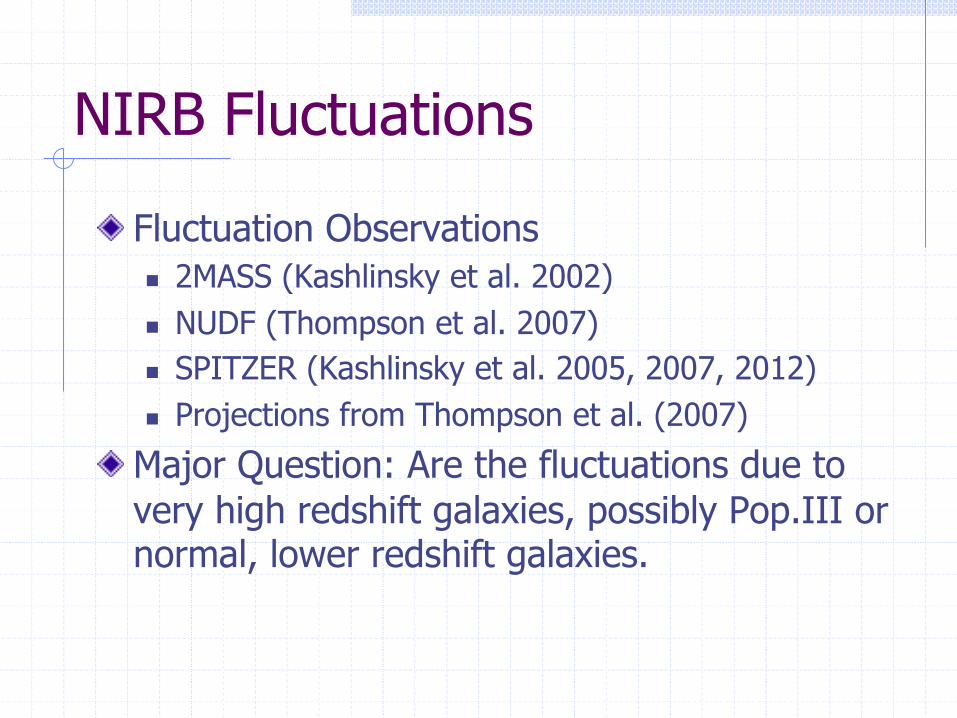
NIRB Fluctuations
! Fluctuation Observations n 2MASS (Kashlinsky et al. 2002) n NUDF (Thompson et al. 2007) n SPITZER (Kashlinsky et al. 2005, 2007, 2012) n Projections from Thompson et al. (2007)
! Major Question: Are the fluctuations due to very high redshift galaxies, possibly Pop.III or normal, lower redshift galaxies.
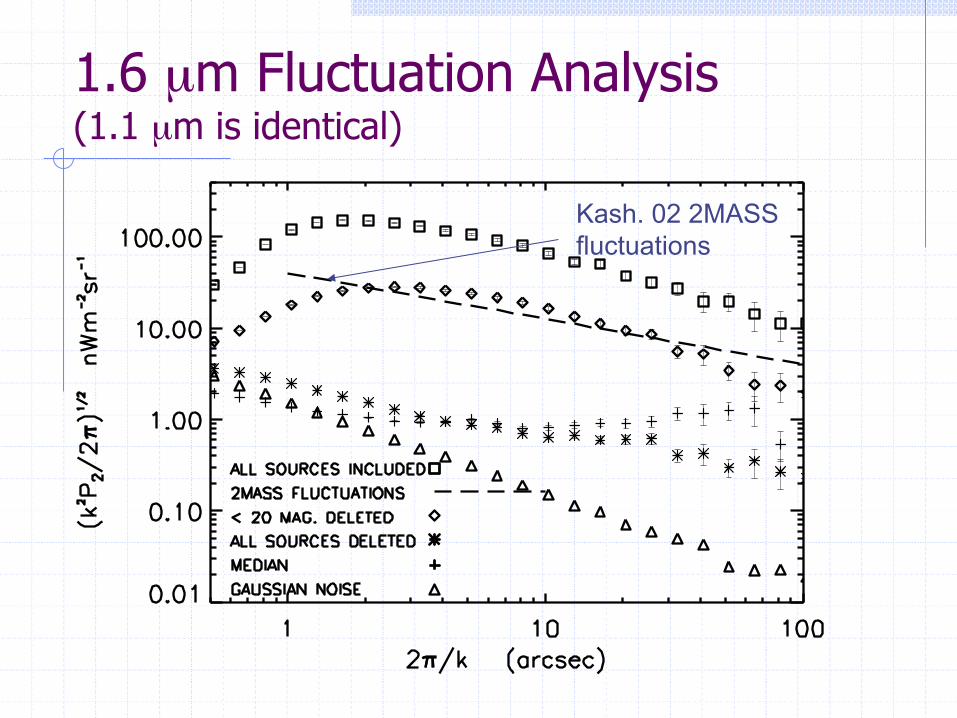
1.6 µm Fluctuation Analysis (1.1 µm is identical)
Kash. 02 2MASS fluctuations
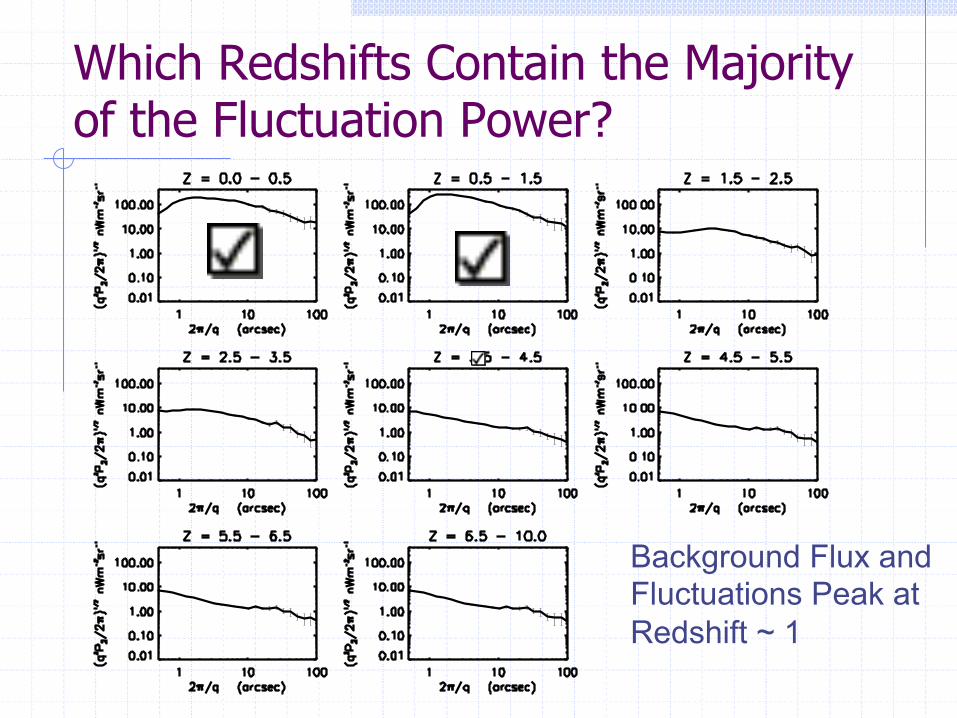
Which Redshifts Contain the Majority of the Fluctuation Power?
Background Flux and Fluctuations Peak at Redshift ~ 1
! The observed sources produce significant fluctuation power at all spatial scales
! The majority of fluctuation power is from galaxies at redshifts between 0.5 and 1.5
! There are small contributions from high redshift sources
NICMOS All Sources Included Fluctuation Conclusions
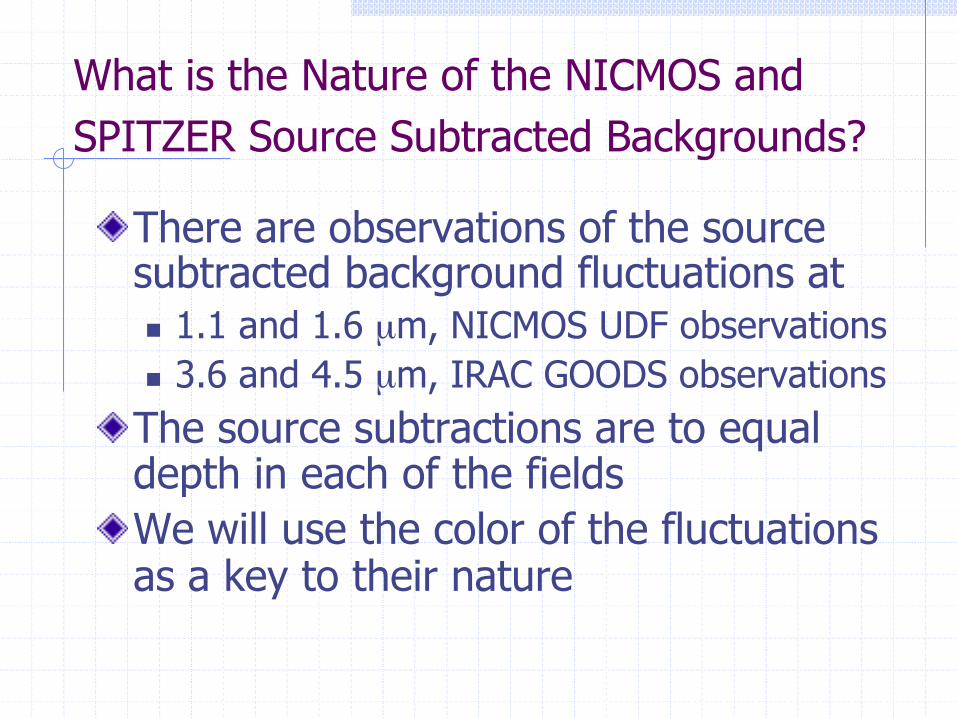
What is the Nature of the NICMOS and SPITZER Source Subtracted Backgrounds?
! There are observations of the source subtracted background fluctuations at n 1.1 and 1.6 µm, NICMOS UDF observations n 3.6 and 4.5 µm, IRAC GOODS observations
! The source subtractions are to equal depth in each of the fields
! We will use the color of the fluctuations as a key to their nature
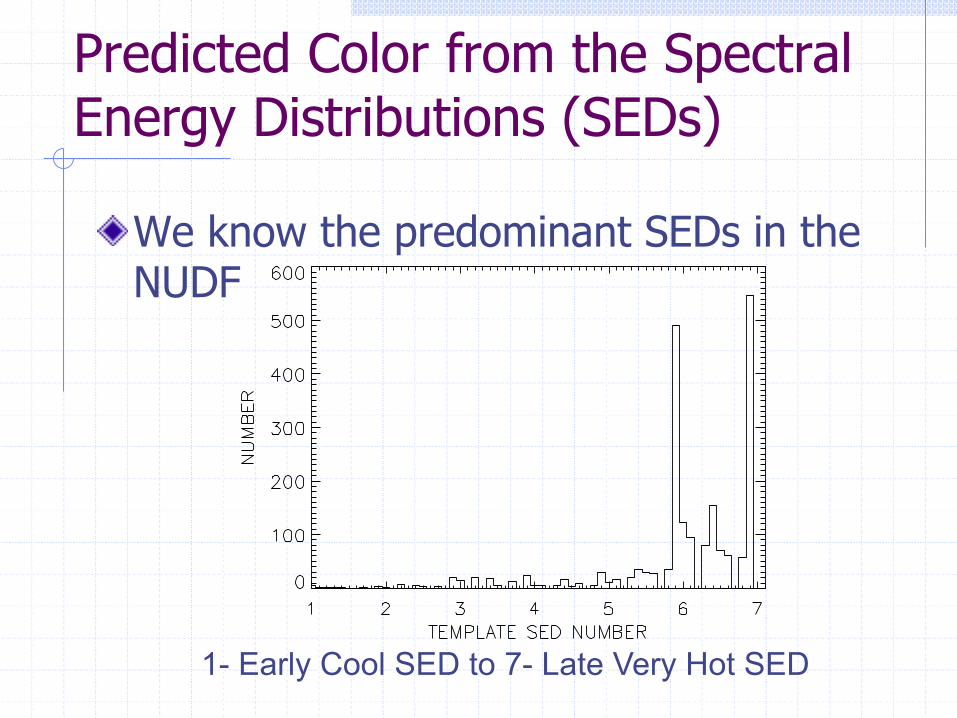
Predicted Color from the Spectral Energy Distributions (SEDs)
! We know the predominant SEDs in the NUDF
1- Early Cool SED to 7- Late Very Hot SED
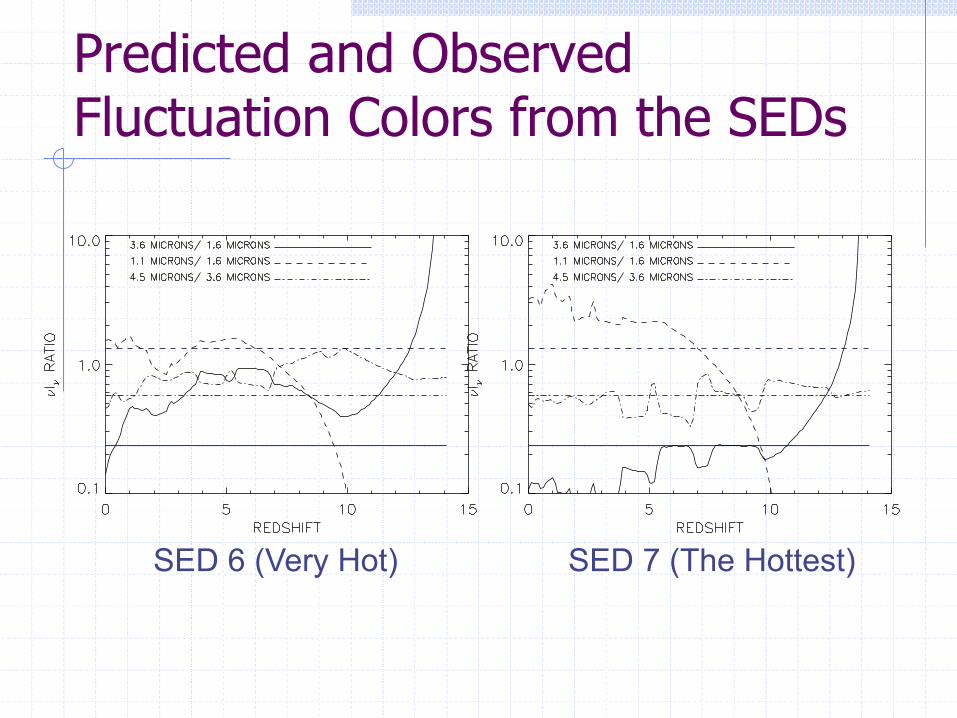
Predicted and Observed Fluctuation Colors from the SEDs
SED 6 (Very Hot) SED 7 (The Hottest)
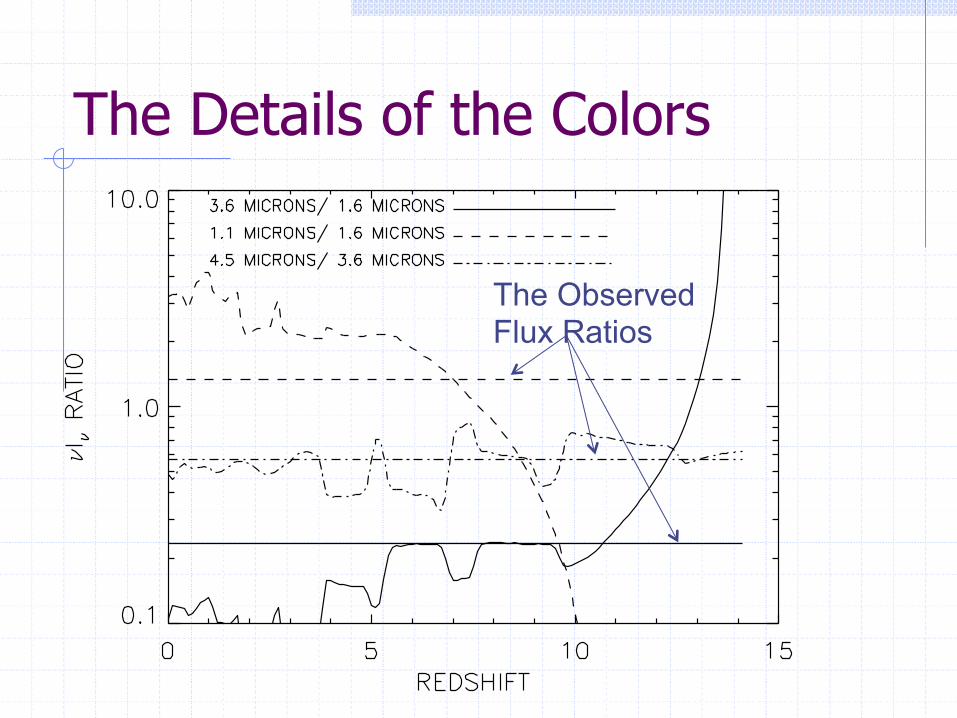
The Details of the Colors
The Observed Flux Ratios
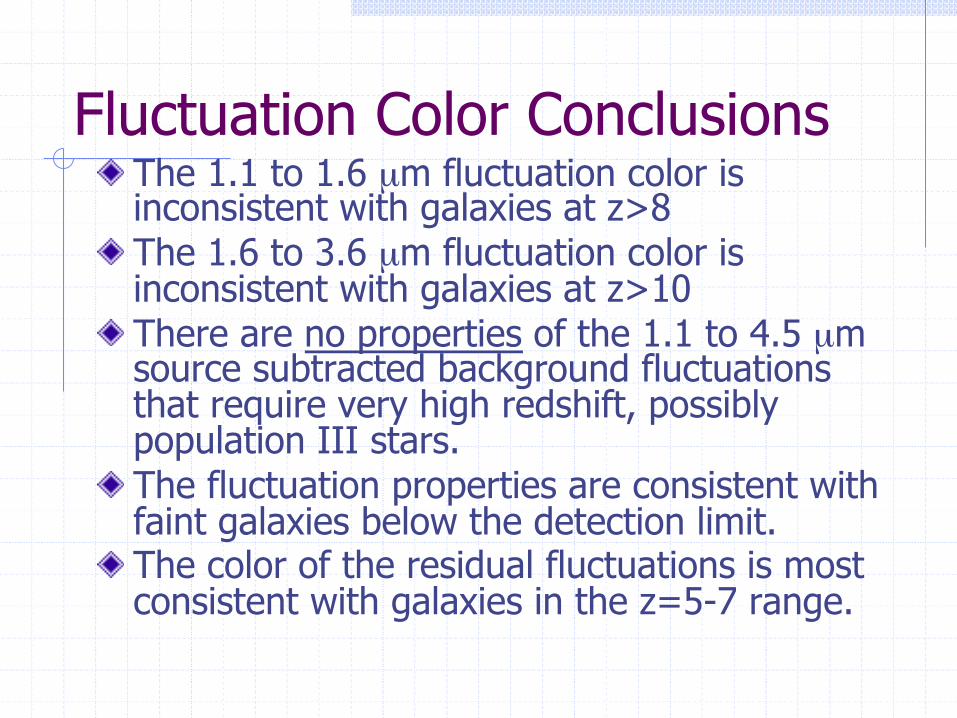
Fluctuation Color Conclusions ! The 1.1 to 1.6 µm fluctuation color is
inconsistent with galaxies at z>8 ! The 1.6 to 3.6 µm fluctuation color is
inconsistent with galaxies at z>10 ! There are no properties of the 1.1 to 4.5 µm
source subtracted background fluctuations that require very high redshift, possibly population III stars.
! The fluctuation properties are consistent with faint galaxies below the detection limit.
! The color of the residual fluctuations is most consistent with galaxies in the z=5-7 range.
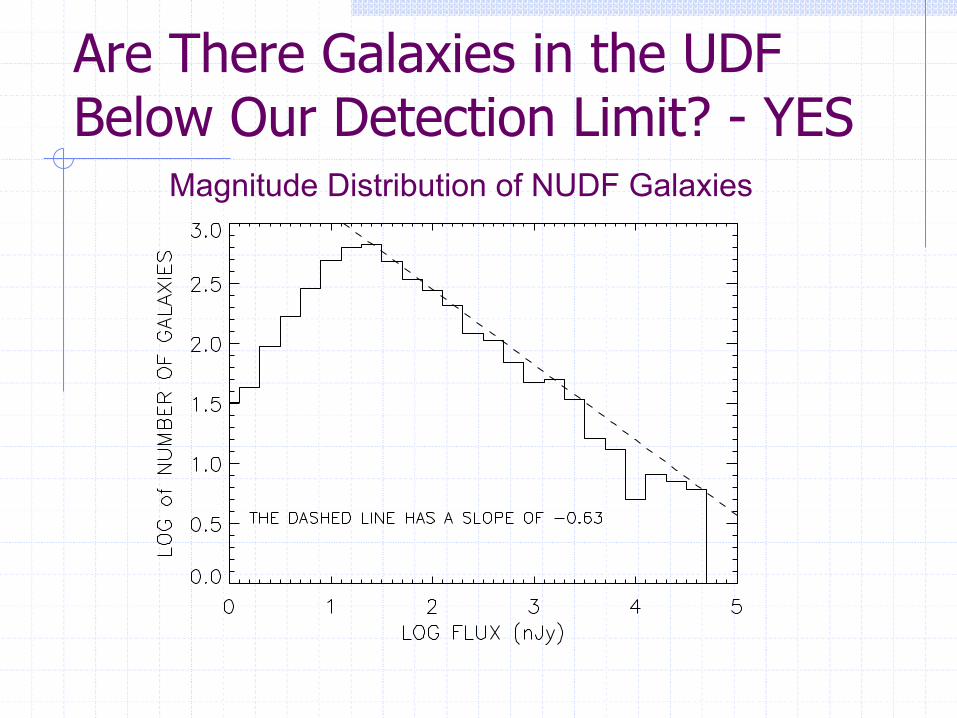
Are There Galaxies in the UDF Below Our Detection Limit? - YES
Magnitude Distribution of NUDF Galaxies
Unknown Background Populations? ! Helgason, Ricotti & Kashlinsky (2012)
claim that the NICMOS 1.6 mm fluctuations are a factor of 2-7 above their calculated fluctuations from known objects with magnitudes greater than our flux limit. n They suggest that perhaps the flux from
outer regions of galaxies beyond our detection limit is the source.
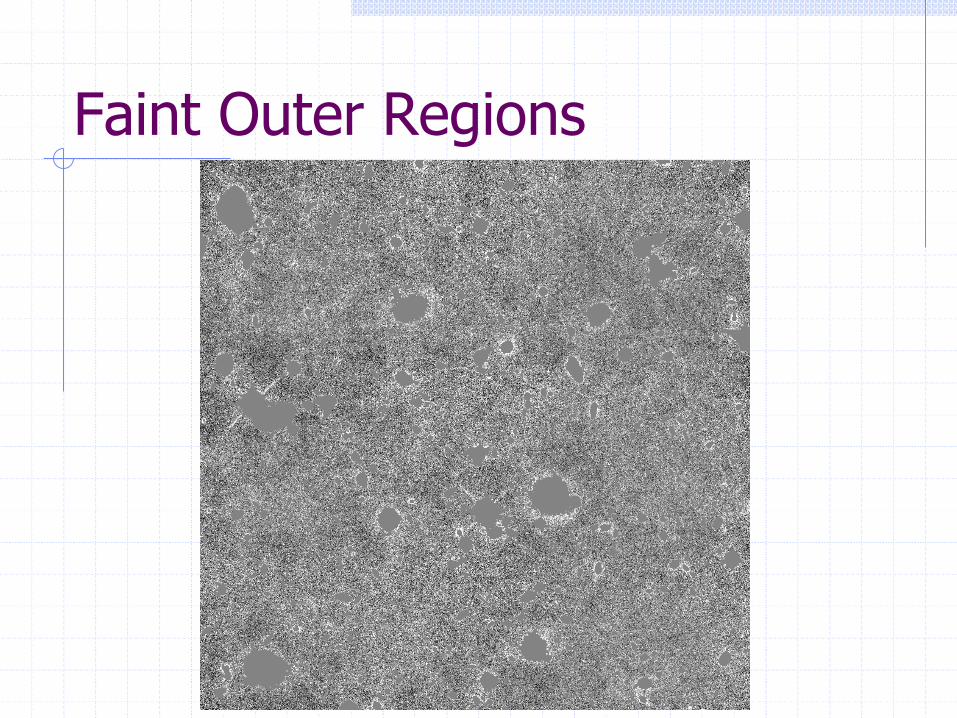
Faint Outer Regions
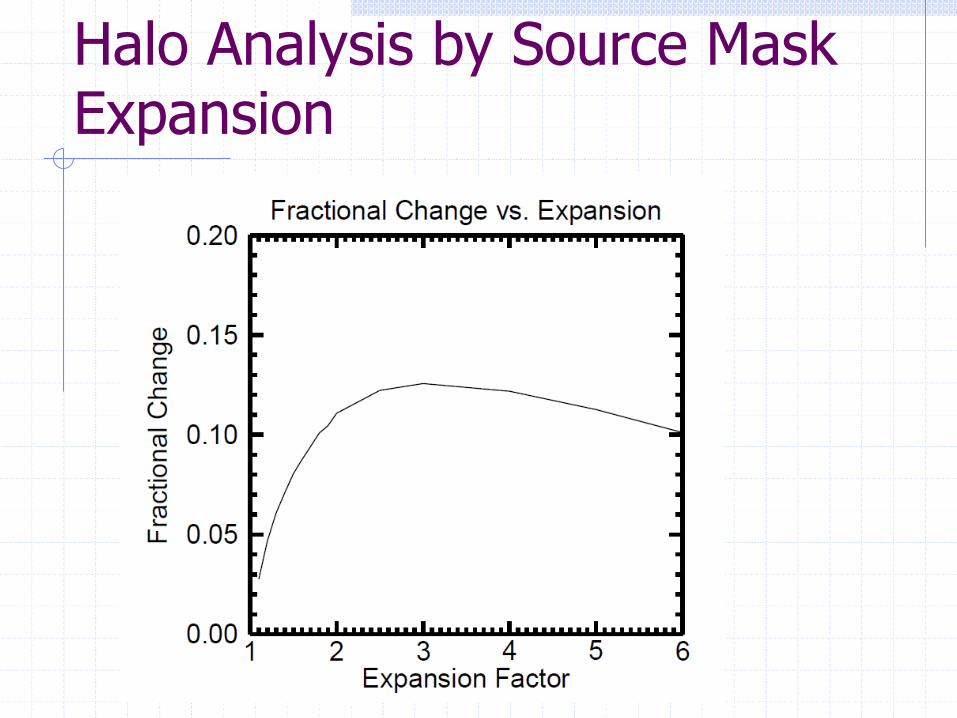
Halo Analysis by Source Mask Expansion
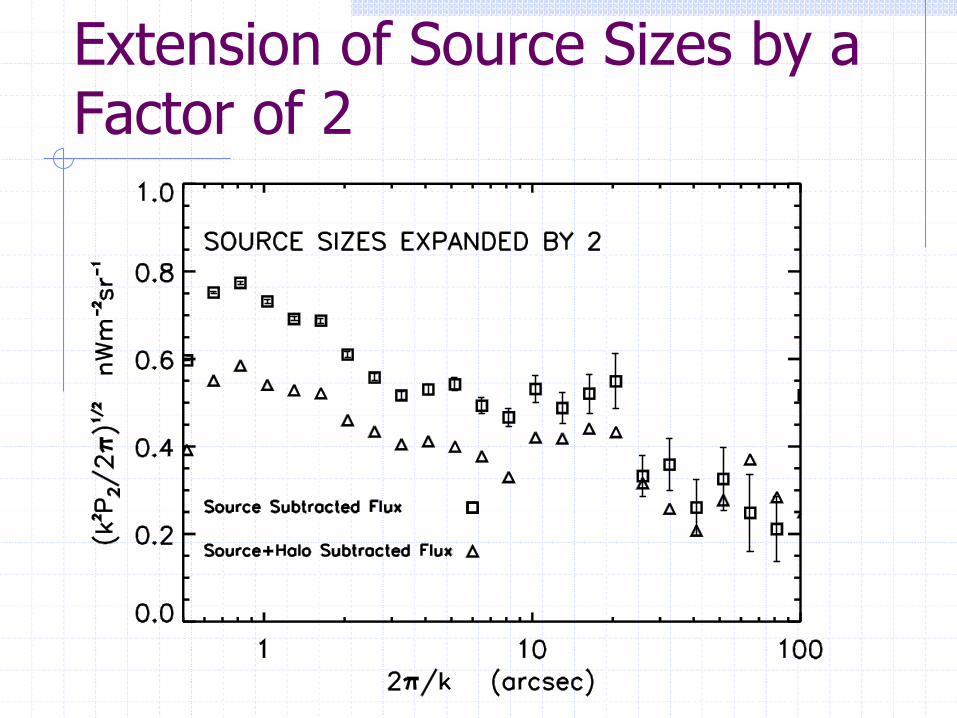
Extension of Source Sizes by a Factor of 2
Comparison with Random Source Subtraction
! Need to compare halo subtraction to subtraction of random sources to reach the same number of deleted pixels.
! Source shapes drawn randomly from detected sources in the field and then randomly placed in the HUDF image.
! Fluctuation spectrum taken as the mean of 1000 realizations of the process
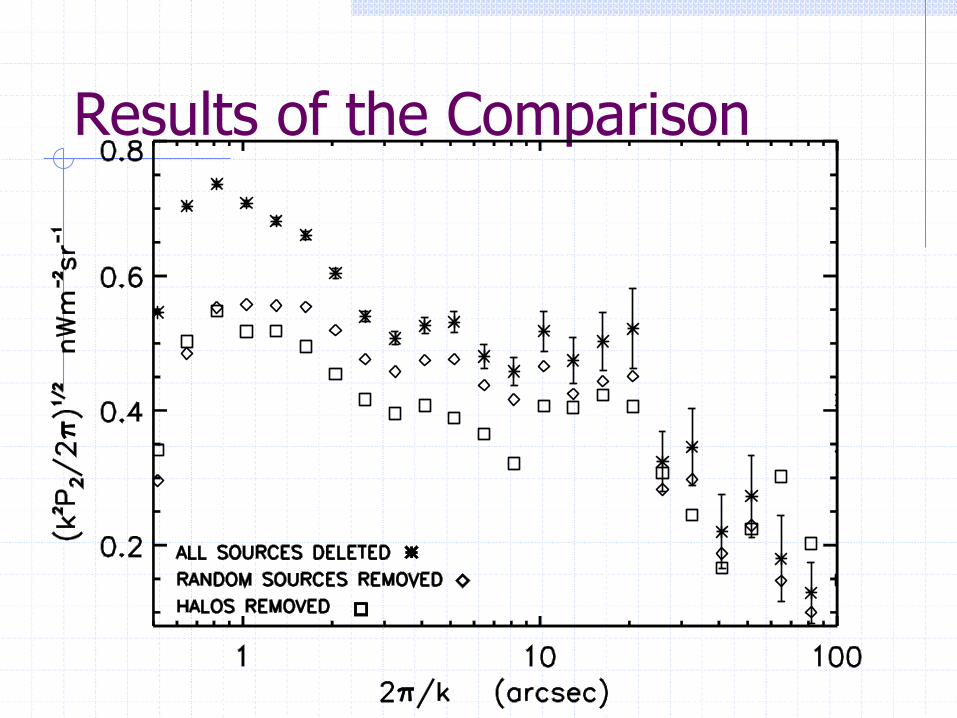
Results of the Comparison
Comparison Results ! Subtraction of flux in halos around
sources reduces fluctuations more than random subtraction throughout the field
! The difference, however, is a small percentage of the source subtracted fluctuations.
! Halo flux is therefore not a large contributor to the source subtracted fluctuations.
Observing the Flux from the Reionizing Sources? ! If the epoch of reionization is earlier
than z = 8 then the color of the source subtacted fluctuations observed by NICMOS is incompatible with the expected color of fluctuations from the reionizing sources.
! Normal galaxies below our detection limit are the most likely source of the residual fluctuations.
Other Existing HST Data ! WF3/IR HUDF and Flanking Fields
Images n Three times deeper than the NICMOS
HUDF images n Three rather than only two bands give
greater redshift discrimination
! CANDLES Field Images n 95 Square Arc Minutes offers opportunities
for large spatial scale analysis
Future Oportunites
! JWST Opportunities n Will probe much fainter populations. n Spatial coverage will depend on the
approved programs. n Should probe the epoch of reionization
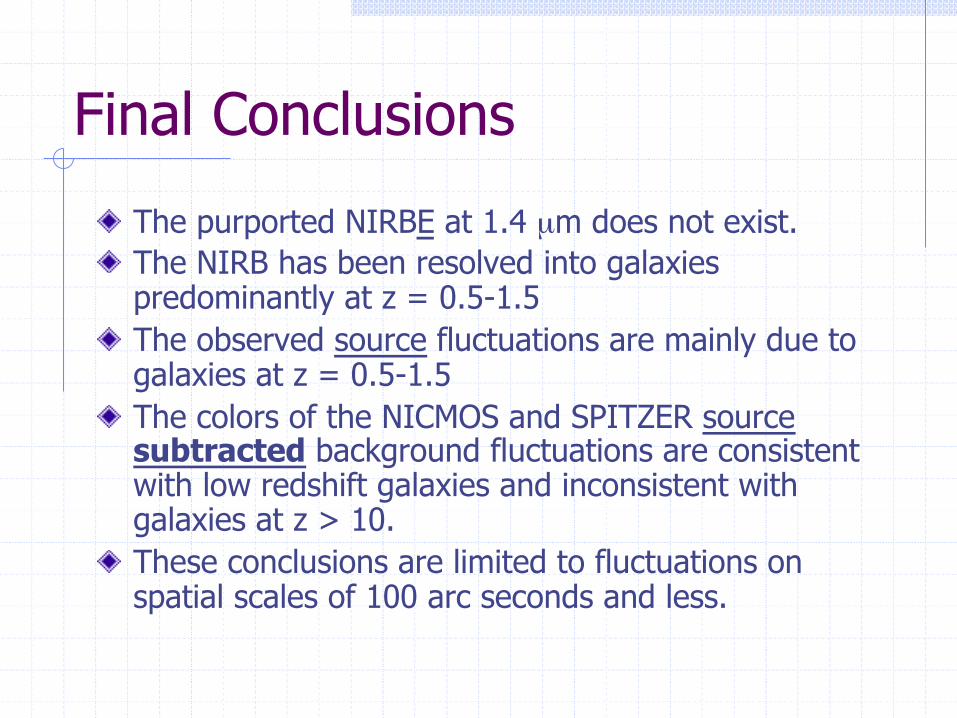
Final Conclusions
! The purported NIRBE at 1.4 µm does not exist. ! The NIRB has been resolved into galaxies
predominantly at z = 0.5-1.5 ! The observed source fluctuations are mainly due to
galaxies at z = 0.5-1.5 ! The colors of the NICMOS and SPITZER source
subtracted background fluctuations are consistent with low redshift galaxies and inconsistent with galaxies at z > 10.
! These conclusions are limited to fluctuations on spatial scales of 100 arc seconds and less.
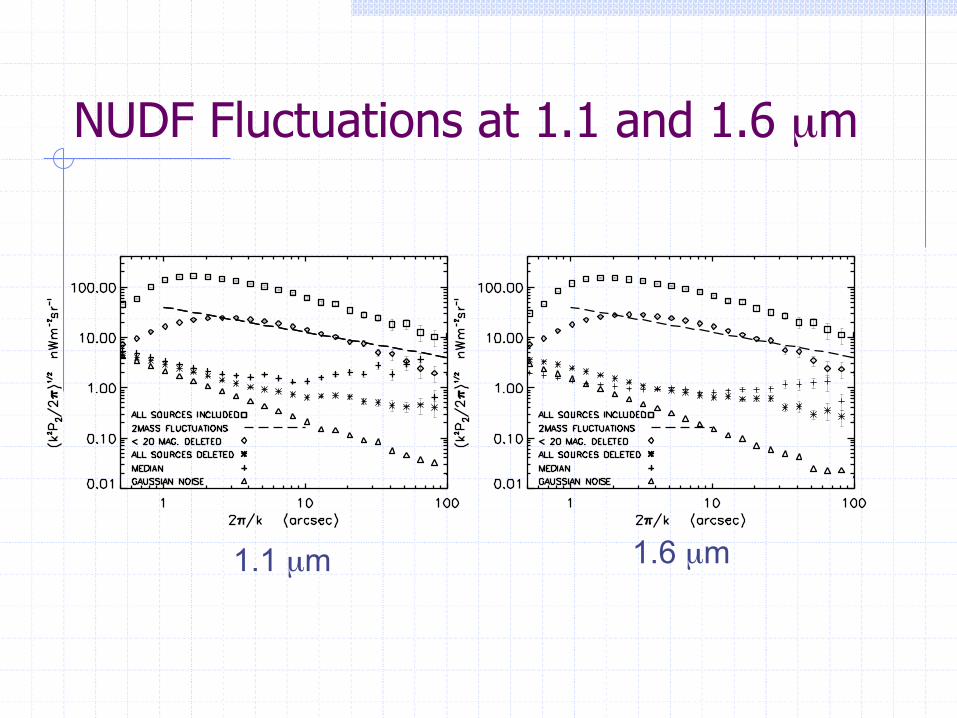
NUDF Fluctuations at 1.1 and 1.6 µm
1.1 µm 1.6 µm
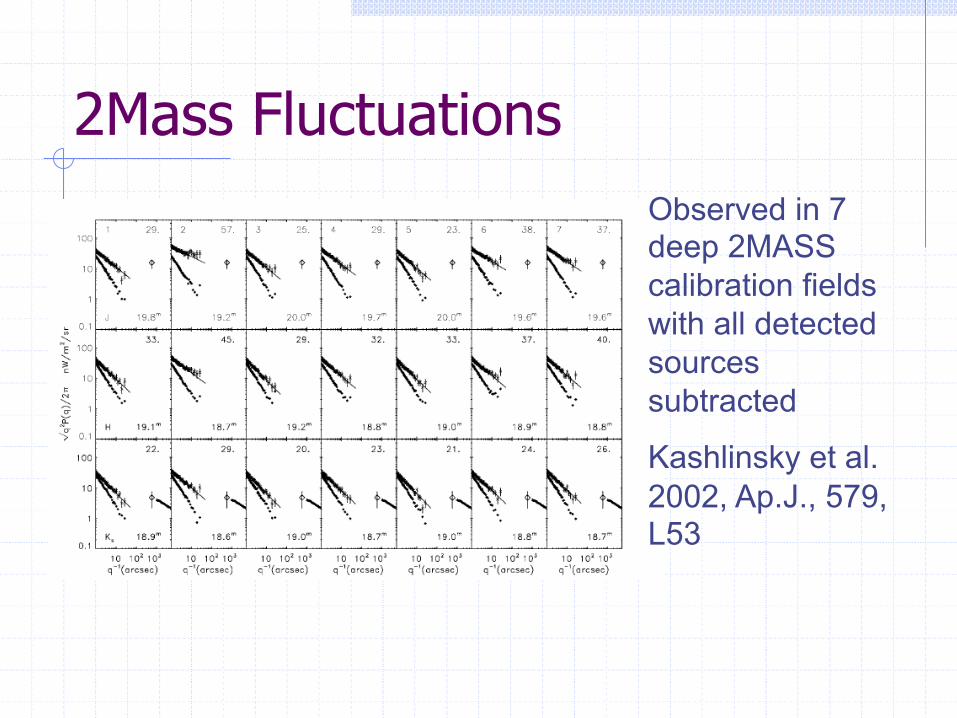
2Mass Fluctuations Observed in 7 deep 2MASS calibration fields with all detected sources subtracted
Kashlinsky et al. 2002, Ap.J., 579, L53


