39
http://creativecommons.org/licenses/by- sa/2.0/
| Date post: | 22-Dec-2015 |
| Category: |
Documents |
| View: | 216 times |
| Download: | 0 times |

http://creativecommons.org/licenses/by-sa/2.0/

CIS786, Lecture 8
Usman Roshan
Some of the slides are based upon material by Dennis Livesay and David La of California StateUniversity at Pomona

Previously…

Evaluation of multiple sequence alignments
• Compare to benchmark “true” alignments
• Use simulation
• Measure conservation of an alignment
• Measure accuracy of phylogenetic trees
• How well does it align motifs?
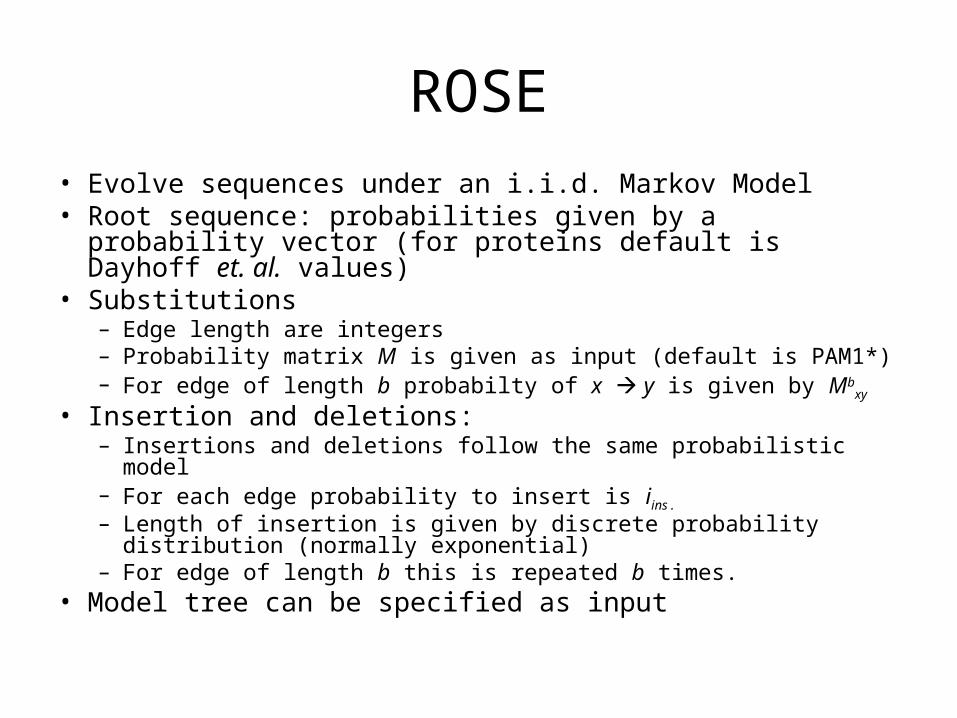
ROSE
• Evolve sequences under an i.i.d. Markov Model• Root sequence: probabilities given by a probability vector
(for proteins default is Dayhoff et. al. values)• Substitutions
– Edge length are integers– Probability matrix M is given as input (default is PAM1*)– For edge of length b probabilty of x y is given by Mb
xy
• Insertion and deletions:– Insertions and deletions follow the same probabilistic model– For each edge probability to insert is iins . – Length of insertion is given by discrete probability distribution
(normally exponential)– For edge of length b this is repeated b times.
• Model tree can be specified as input

Phylogeny accuracy

Running time

Evaluating alignments using motif detection
• Let’s evaluate alignments by searching for motifs
• If alignment X reveals more functional motifs than Y using technique Z then X is better than Y w.r.t. Z
• Motifs could be functional sites in proteins or functional regions in non-coding DNA

What is a “Functional Site”?
• Defining what constitutes a “functional site” is not trivial
• Residues that include and cluster around known functionality are clear candidates for functional sites
• We define a functional site as catalytic residues, binding sites, and regions that clustering around them.

Functional Sites (FS)

Phylogenetic motifs
• PMs are short sequence fragments that conserve the overall familial phylogeny
• Are they functional?
• How do we detect them?

Map PMs to the Map PMs to the StructureStructure
Map
2DBL DVVMTQIPLSLPVNLGDQASISCRSSQSLIHSNGNTYLHWYLQKPGQSPKLLMYKVSNRF 1NCA DIVMTQSPKFMSTSVGDRVTITCKASQ-----DVSTAVVWYQQKPGQSPKLLIYWASTRH 2JEL DVLMTQTPLSLPVSLGDQASISCRSSQSIVHGNGNTYLEWYLQKPGQSPKLLIYKISNRF 2IGF DVLMTQTPLSLPVSLGDQASISCRSNQTILLSDGDTYLEWYLQKPGQSPKLLIYKVSNRF 3HFM DIVLTQSPATLSVTPGNSVSLSCRASQS-----IGNNLHWYQQKSHESPRLLIKYASQSI 3HFL DIVLTQSPAIMSASPGEKVTMTCSASSS------VNYMYWYQQKSGTSPKRWIYDTSKLA 1NGP QAVVTQES-ALTTSPGETVTLTCRSSTG--AVTTSNYANWVQEKPDHLFTGLIGGTNNRA 2DBL YGVPDRFSGSGSGTDFTLKISRVEAEDLGIYFCSQSSHVPPTFGGGTKLEIK-RADAAPT 1NCA IGVPDRFAGSGSGTDYTLTISSVQAEDLALYYCQQHYSPPWTFGGGTKLEIK-RADAAPT 2JEL SGVPDRFSGSGSGTDFTLKISRVEAEDLGVYYCFQGSHVPYTFGGGTKLEIK-RADAAPT 2IGF SGVPDRFSGSGSGTDFTLKISRVEAEDLGVYYCFQGSHVPPTFGGGTKLEIK-RADAAPT 3HFM SGIPSRFSGSGSGTDFTLSINSVETEDFGMYFCQQSNSWPYTFGGGTKLEIK-RADAAPT 3HFL SGVPVRFSGSGSGTSYSLTISSMETEDAATYYCQQWGRNP-TFGGGTKLEIK-RADAAPT 1NGP PGVPARFSGSLIGDKAALTITGAQTEDEAIYFCALWYSNHWVFGGGTKLTVLGQPKSSPS 2DBL MSSTLTLTKDEYERHNSYTCEATHKTSTSPIVKSFNR---QIQLVQSGPELKKPGETVKI 1NCA MSSTLTLTKDEYERHNSYTCEATHKTSTSPIVKSFNRNECQIQLVQSGPELKKPGETVKI 2JEL MSSTLTLTKDEYERHNSYTCEATHKTSDSPIVKSFNRN--QVQLAQSGPELVRPGVSVKI 2IGF MSSTLTLTKDEYERHNSYTCEATHKTSTSPIVKSFNRNECEVQLVESGGDLVKPGGSLKL 3HFM MSSTLTLTKDEYERHNSYTCEATHKTSTSPIVKSFNRNECDVQLQESGPSLVKPSQTLSL 3HFL MSSTLTLTKDEYERHNSYTCEATHKTSTSPIVKSFNRNECXVQLQQSGAELMKPGASVKI 1NGP ASSYLTLTARAWERHSSYSCQVTHEGHT--VEKSLSR---QVQLQQPGAELVKPGASVKL
Set PSZ Threshold

PMs in Various PMs in Various StructuresStructures

PMs and Traditional PMs and Traditional MotifsMotifs

TIMTIM
Phylogenetic Similarity False Positive Expectation

Cytochrome P450Cytochrome P450
Phylogenetic Similarity False Positive Expectation
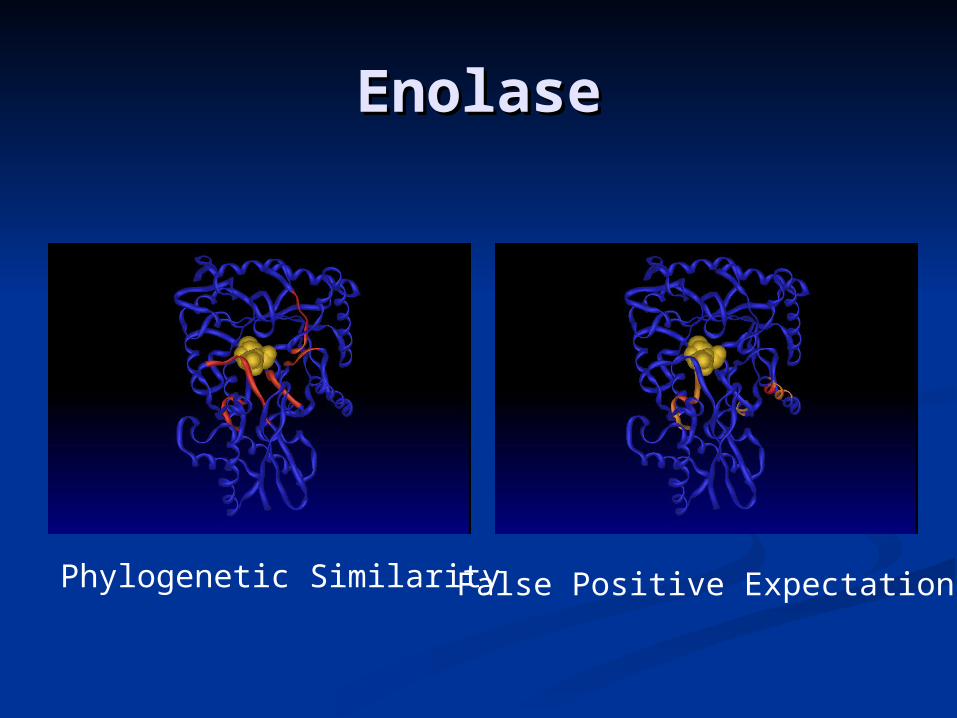
EnolaseEnolase
Phylogenetic Similarity False Positive Expectation

Glycerol KinaseGlycerol Kinase
Phylogenetic Similarity False Positive Expectation

MyoglobinMyoglobin
Phylogenetic Similarity False Positive Expectation

Evaluating alignments
• For a given alignment compute the PMs
• Determine the number of functional PMs
• Those identifying more functional PMs will be classified as better alignments

Running time

Functional PMsPAl=blueMUSCLE=redBoth=green
(a)=enolase, (b)ammonia channel,(c)=tri-isomerase, (d)=permease,(e)=cytochrome

Today
• More simulations…
• Comparison of MP and NJ trees on different protein alignments
• Simultaneous alignment and phylogeny reconstruction– Starting trees for POY– Boosting it with RecIDCM3

NJ vs MP on 50 taxa and 500 mean sequence length
NJ MP

NJ vs MP on 100 taxa and 500 mean sequence length
NJ MP

NJ vs MP on 400 taxa and 500 mean sequence length
NJ MP

MP trees on 800 taxa alignments

Increasing sequence lengths on 50 taxa datasets
200 500 1000

Increasing sequence lengths on 400 taxa datasets
200 500 1000

Simultaneous alignment and phylogeny reconstruction---POY
• Performs TBR through tree space to search for better tree alignments
• Uses variant of progressive alignment without profiles– Assigns ancestral sequences to internal
nodes using MP– Removes gaps in ancestral sequences
• Optional median alignment is possible

Starting trees for POY• Poy-default (greedy method) • Poy-approxbuild (faster greedy method) • Heuristic maximum parsimony trees generated on the following
alignments using the TNT program (TBR search with one saved tree): – ClustalW(fast distance estimation) – Muscle1(default): progressive alignment (BLASTZ scoring matrix) – Muscle2(default): improved iterative progressive alignment (BLASTZ
scoring matrix) – Muscle1MP: progressive alignment (scoring matrix for parsimony:
match=1, mismatch=0, gapopen=gapextend=-1) – Muscle2MP: improved iterative progressive alignment (parsimony
scoring matrix as above) – Muscle1MP(CW-guidetree): Muscle1-MP on the ClustalW guide-tree
(fast distance estimation)

Simulation study parameters
• Model trees: uniform random distribution and uniformly selected random edge lengths
• Model of evolution: HKY95 with insertions and deletions probabilities selected from a gamma distribution (see ROSE software package)
• Generated data: Settings of 250, 500, 1000 taxa, mean sequence lengths of 1000 and 2000, and avg branch lengths of 0.2 were selected. For each setting 1 dataset was produced.
• Criterion for branch length and sequence length selection: Evolutionary rate was selected such that the starting Poy tree was between 20% and 30% error rate---not too hard or easy. Mean sequence lengths of 1000 and 2000 are realistic for protein coding sequences.
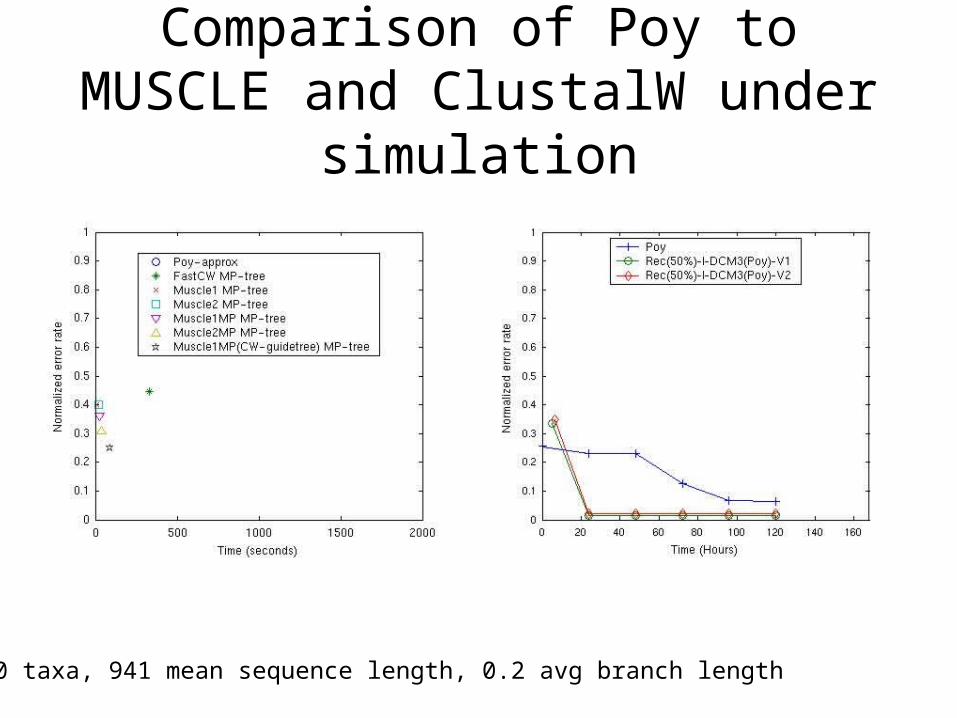
Comparison of Poy to MUSCLE and ClustalW under simulation
250 taxa, 941 mean sequence length, 0.2 avg branch length

Comparison of Poy to MUSCLE and ClustalW under simulation
500 taxa, 981 mean sequence length, 0.2 avg branch length

Comparison of Poy to MUSCLE and ClustalW under simulation
1000 taxa, 993 mean sequence length, 0.2 avg branch length

Comparison of Poy to MUSCLE and ClustalW on real data
218 taxa RNA metazoan dataset

Comparison of Poy to MUSCLE and ClustalW on real data
585 taxa RNA archaea dataset

Comparison of Poy to MUSCLE and ClustalW on real data
1040 taxa RNA mitochondria dataset

Comparison of Poy to MUSCLE and ClustalW on real data
1766 taxa RNA metazoa dataset


