35
AT A CROSSROADS STRENGTHENING THE TORONTO REGION’S RESEARCH AND INNOVATION ECONOMY Lessons from leading high-tech centres around the world
| Date post: | 29-Mar-2016 |
| Category: |
Documents |
| Upload: | toronto-region-research-alliance |
| View: | 212 times |
| Download: | 0 times |

AT A CROSSROADS
STRENGTHENING THE TORONTOREGION’S RESEARCH ANDINNOVATION ECONOMY
Lessons from leading high-tech centresaround the world

1
This Toronto Region Research Alliance
report was prepared by a team of
researchers from the Program on
Globalization and Regional Innovation
Systems at the Munk Centre for
International Studies, University
of Toronto. The lead author is
Tijs Creutzberg, PhD, with support
from Professor David Wolfe, PhD
and Jen Nelles (PhD candidate).
Issued: November 2006Revised: December 2006 to correct figure 2 on page 8
TABLE OF CONTENTS
Preface by the TorontoRegion Research Alliance 2
Executive Summary 4
Introduction 5
Exploiting the Potential of a KnowledgeEconomy: Challenges and opportunities 6
National R&D Systems: A comparative lookat four national R&D systems 8
Regional R&D Systems: Three modelsof strategic investment in city-regions 10
Six case studies 12
Singapore 12
Stockholm 13
Austin 14
Raleigh-Durham 15
Boston 16
San Diego 18
Toronto Region: Past, present and futurecompetitiveness in research and innovation 20
The Way Forward: Lessons forthe Toronto region 22
Appendix A: Facts on national R&D systems 24
United States 24
Canada 26
Singapore 27
Sweden 29
Appendix B: Notes on quick facts sources 30
Notes 31

2
PREFACE FROM THE TORONTOREGION RESEARCH ALLIANCE
Aptly titled At a Crossroads, this report by a team ofleading researchers at the Program on Globalizationand Regional Innovation at the University ofToronto’s Munk Centre for International Studieshighlights the urgency and opportunity for theR&D economy of the broader Toronto region.
The Toronto Region Research Alliance (TRRA) is anot-for-profit catalytic organization dedicated tomaking the Toronto region one of the world’s top10 venues for research and research-driven industry.TRRA commissioned this study of world-leadingR&D centres to better understand how they organizedthemselves to achieve success. Who did it? How didit happen? How long did it take? Are there anycommon factors?
Three of the conclusions are particularly noteworthy.
1. The Toronto region is globally competitive
The study confirms that Toronto and thesurrounding area is a highly competitive, world-classregional R&D economy with strong researchinstitutions, exceptional research talent andimpressive industry clusters. With a population ofalmost seven million and a Gross Regional Product(GRP) of $255.6 billion US, it is home to NorthAmerica’s second-largest automotive and financialservices clusters, the third-largest informationtechnology and telecom equipment cluster and thefourth-largest pharmaceutical and biotechnologycluster. Its institutional research capacity isremarkable, with eight universities, ten colleges,60 hospitals and 37 medical research institutes. Theregion performs 35% of all R&D in Canada, accountsfor 33% of Canada’s most highly cited scientists andis ranked second only to Boston in the number ofscience and engineering articles published.
2.Canada needs to act now to respond to nationalgovernments worldwide that are providingsignificant, predictable and growing investmentin their R&D regions.
The study also finds that Canada’s R&D regionsare at an increasing disadvantage in today’scompetitive global R&D economy, where nationalgovernments are taking a much more proactiverole by making transformational strategicinvestments in their regional R&D economies.Overwhelmingly, this is the key factor that iscommon to all of the regions surveyed in thisreport. In fact, in most of these countries, nationalinvestment in research and innovation is growingby leaps and bounds.
It is true that Canada has made enormous stridesin the past decade — the Canada Foundationfor Innovation, which has funded researchinfrastructure; Genome Canada, which has boot-strapped genetic research; CANARIE, a nationalhigh-bandwidth network for research; the CanadaResearch Chairs program, which has made therecruitment, repatriation and retention of majorresearch talent possible. All have contributed to areal renaissance of research in Canada.
However, as profound as the improvements innational support for research have been, a numberof these key agencies have either reached the endof their terms or have received no word as to theirfuture funding. And, even with these investments,Canada’s overall expenditure on R&D remains lessthan 2% of GDP and the Government of Canada’sexpenditure on R&D is less than 0.7% of GDP —in both cases, this ranks Canada lowest amongstthe countries surveyed in this report and lowerthan the overall OECD average.
Contrast our situation in Canada with PresidentBush’s announcement this year of the AmericanCompetitiveness Initiative, which doubles theUS government’s commitment to research andinnovation by committing an overwhelming$136 billion US over 10 years.
Or Singapore’s new five-year S&T Plan 2010 thatwill invest $13.5 billion US to strengthen its R&Dcapabilities in niche areas while nurturing andrecruiting world-class talent.

Undoubtedly, Canada is at a crossroads. Will ournational government choose to make the dramaticinvestments which will move us into the top tierof innovation-intensive countries in the world? Orwill we be satisfied with the status quo, which willeffectively mean falling behind in the internationalR&D arena?
3.The regional mobilization model offers mostinsights for Canadian R&D regions
This study finds that there are essentially threedifferent models of regional R&D systems —dirigiste, embedded and regional mobilization.The research team concludes that the regionalmobilization model would be most appropriate forCanada. In this model, the national governmentprovides sustained and predictable funding butleaves much of the strategic decision-making tolocal organizations and regional leaders who willcollaboratively invest those resources to grow thestrategically important clusters in their regions.
TRRA will be analyzing in detail all of the report’sconclusions to understand how best to apply them
to our mission in the broader Toronto region. Weoffer this report as one contribution to the growingCanadian dialogue on these important issues as weawait the release of Industry Canada’s new Scienceand Technology Strategy.
We believe this study provides important insights forgovernments and all sectors of the R&D communityin Canada. TRRA and our partners are eager toengage in the national debate on the future ofresearch and innovation in this country and we lookforward to working collaboratively with other regionsin that regard. We believe nothing less than Canada’sfuture depends on it.
Ross McGregorPresident and CEO
Toronto Region Research Alliance
3

4
EXECUTIVE SUMMARY
This study identifies common factors that haveinfluenced the development of the world’s mostsuccessful research and innovation centres. It does sofrom an analysis of six leading regions throughout theworld, with the purpose of drawing out lessons that areapplicable to the Toronto region’s efforts to become anequal to the very best of these centres. There are threekey findings that deserve particular attention.
First, the most common factor shared by all leadingcentres is the very significant levels of strategic publicinvestment, be it in universities, research laboratoriesor through national technology programs.Governments today, far from leaving their capabilitiesto develop through market forces alone, are becomingincreasingly sophisticated at combining andconcentrating national resources with local researchand knowledge strengths to take advantage ofopportunities resulting from market forces and trendsin technology. And in the process, countries andregions are successfully capturing the related economicbenefits of high-tech industries within their borders.
Second, this study finds that the level of nationalinvestments made in support of research andinnovation in key industries is on the increase.The United States, in particular, has made severalsignificant investments in recent years in areas suchas nanotechnology and high-end computing, all withstated goals of developing a competitive industrialcapacity. In the context of these strategic investments,it is readily apparent that Canada is not competingat the same level relative to the size of its economy.And given the lag between investments in researchand economic development, the impact of thisunderinvestment will undoubtedly be felt in the
future. This is especially so for Canada’s leadingresearch and innovation centres such as the Torontoregion, whose firms are increasingly dependent onpublic research infrastructure for their competitiveness.
The third key finding is that there are importantdifferences in the way in which national investmentsare channelled into regional knowledge-basedeconomies. Three such models are identified in thisstudy, all of which have important lessons for theToronto region. The most relevant, however, is theregional mobilization model, best represented by thedevelopment of Austin, Texas and Raleigh-Durham,N.C. This model highlights the importance ofregionally mobilizing and coordinating localresources, such as universities, firms, money andtalent, to leverage additional research investmentfrom upper levels of government and attract firms,so as to develop a globally competitive research andinnovation capacity.
For this approach to work, however, governmentmust provide the flexibility in their support for R&Dsuch that regions across the country can draw downR&D funding according to their own investmentneeds. Be it for a new research institute, specializedtraining programs, or to attract a major R&D firmthat complements local industry strengths, suchtailoring of investments to local needs will provecrucial to sustaining a foothold in rapidly changingglobal technology markets.
This approach would likely benefit not just theToronto region but also all of Canada’s centres ofresearch and innovation, as well as the country’s lessdeveloped urban regions. Exposed to the dynamics ofa global knowledge economy, leading regions requirethe flexibility to help adapt their local economiesand knowledge infrastructure to the ever-changingtechnology markets. The regional mobilization modelof strategic investment can help facilitate this process.For less developed regions, it can offer importantflexibility and resources to guide their own economicdevelopment according to their own aspirations andlocal strengths.
KEY FINDINGS
• The most common factor shared bysuccessful regional innovation systems issignificant, strategic public investment
• Levels of national investment are increasingin size and sophistication
• There are different models of regionalfunding but the most applicable to Torontoregion is one of regional mobilization

INTRODUCTION
– US President George W. Bush, preface to AmericanCompetitiveness Initiative: Leading the World inInnovation (Feb. 2006)
Recognizing that its future prosperity in a globaleconomy will increasingly depend on its competitiveadvantage in science and technology, the Torontoregion has set itself the goal of becoming a world-leading centre for research and innovation. And forgood reason. Advanced technology industries aredriving an ever-growing share of economic activity— not only in the region, which has become amegacentre in life sciences and ICT, but also inCanada and abroad.1,2 By most accounts, this trend islikely to continue unabated as innovations continueto create new markets and new opportunities foremployment. One estimate puts the global forecastedrevenues of nano-based technologies alone at morethan $3 trillion US within a decade — creating twomillion jobs in the process — and providing aneconomic impetus that is expected to drive theworld economy for the next 50 years.3
With these economic prospects, the Toronto region isresolved to becoming a successful competitor to theworld’s premier technology centres. To this end, thisstudy examines six leading and several emerging city-regions, all of whom have built up, or are in theprocess of building, a regional research and industrialcapacity to enable their firms to successfully competein the same global technology markets as do many ofthe Toronto region’s leading-edge technology firms.The purpose is to understand what common factors,if any, account for their success in research andinnovation. Specifically, the key questions are: whatconditions have contributed to the success of science-and technology-based economic development inleading technology centres; and what lessons can bederived from these centres that can help the Torontoregion achieve its stated goal of being an equal to thevery best research and innovation regions of the world?
The six leading centres examined in this studyare: Austin, Texas, Boston, Mass., Raleigh, N.C.,San Diego, Calif., Singapore and Stockholm.4 Thesecase studies are complemented by an overview ofthree emerging centres: Bangalore, Shanghai andAlbany, N.Y. All were selected on the basis of theirestablished and emerging strengths in the sameadvanced technology industries that are prominentin the Toronto region — biosciences, ICT, materials,nanotechnology and advanced manufacturing. Andwhile the regions are by no means equals in any oneindustry, they each have a competitive research andindustrial infrastructure that has either attracted anotable number of research intensive firms or hasenabled existing firms to build a strong globalpresence in leading technology markets.
This study has used the city-region as a unit ofanalysis to account for the fact that this regional levelhas become the focal point of global competitivenessand innovation. The broader national R&D systemdoes, however, continue to play an important role inshaping the research and innovation economy at theregional level. To account for this, the study developsa framework to clarify differences in how nationalinvestments are channelled to urban regions.
The report begins with a review of the key challengesfaced by firms, governments and city-regions alikewhen competing in rapidly changing globaltechnology markets. This provides the context forunderstanding the framework used in analyzing sixleading research and innovation centres from acrossthe world, which highlight the key factors in theirdevelopment. Last is an analysis of the Torontoregion’s research and innovation capacity and anassessment of the region’s effectiveness at securingthe necessary public investments to keep itsknowledge infrastructure globally competitive.
5

6
EXPLOITING THE POTENTIALOF A KNOWLEDGE ECONOMY:CHALLENGES ANDOPPORTUNITIES
– Nandan Nilekani, CEO Infosys, India’s top IT company5
For all of Toronto’s existing strength in researchand knowledge infrastructure that support its high-technology economy, there is no assurance that theToronto region will achieve its goal of becominga leading centre for research and innovation. Inaddition to the intense global competition by firmsand governments alike to capture the economicbenefits of advanced technology industries, thevery nature of these innovation-driven industriesmakes their future unpredictable.
Just as new innovations can create many opportunitiesfor employment and efficiency growth, they can alsodisrupt, if not wipe out, existing markets fortechnologies and methods of production, withconsiderable consequences for the firms and theemployees that produce them. As the computerindustry has demonstrated, products derived frommajor technological advances can become low-pricedcommodities in as little as a decade, whose productionand development is then off-shored to lower-cost regions.
From a geographic standpoint, new innovationsand advances in knowledge can therefore shift theeconomic fortunes of not only firms and industries,but entire regions and countries, in a relatively shorttime span. This dynamic will become all the morepronounced as China and India reach their fullpotential in the global R&D system. China is alreadythe third-largest performer of R&D, behind only theUS and Japan, having registered 24% average annualincreases in R&D expenditures over the past fiveyears. The country has also made significant gainsof late in high-technology manufacturing. This is instrong contrast to Japan and Europe, which haveboth experienced a marked decrease in outputbetween 1990 and 2003 (Figure 1).
In this competitive environment, high technologyfirms are faced with the daunting challenge ofconstantly learning and innovating so as to maintainaccess to the ever-moving frontier of knowledgeand technology. Investing in R&D, accessing newknowledge through collaborations with firms andresearch institutions, and attracting highly skilledpeople are activities that are now essential to thebusiness development strategies of these firms. Infact, to achieve this learning, firms will often establisha presence in, or relocate entirely to, regions wherethe relevant knowledge is located.
Role of government
The challenge for governments in this competitiveclimate is equally great. As firms become moredependent on public research infrastructure,governments are under pressure to maintain, if notincrease, support so as to sustain their economiccompetitiveness. Without continued investment in theR&D infrastructure of its economic regions, countriesrisk losing whatever wealth they may derive from thesehigh-growth and high-wage industries as high-techactivity shifts to regions with more advanced researchinfrastructure. For many governments, who generallyconsider their success as a nation to be defined bytheir relative success in these industries, this is not arisk worth taking.6 Thus, as more and more countriesseek to establish a foothold in these industries, theimperative to invest becomes even stronger. To standstill in these industries is — as many governments nowunderstand — tantamount to moving backwards.
1990 1992 1994 1996 1998 2000 2002
45.0
40.0
35.0
30.0
25.0
20.0
15.0
10.0
5.0
0.0
China
Asia
JapanEU15
United States
%in
crea
se
Source: Science and Engineering Indicators, 2006
Location of world’s high-technology manufacturing output, 1990-2003
Figure 1: Shifting fortunes
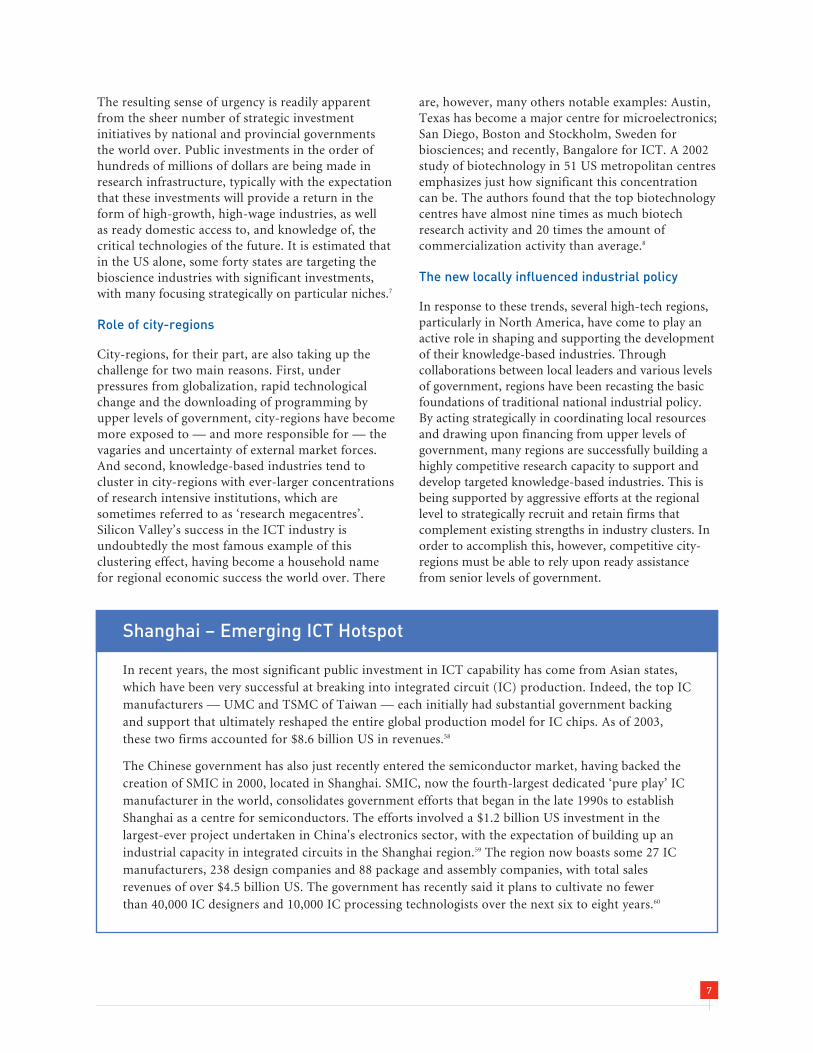
The resulting sense of urgency is readily apparentfrom the sheer number of strategic investmentinitiatives by national and provincial governmentsthe world over. Public investments in the order ofhundreds of millions of dollars are being made inresearch infrastructure, typically with the expectationthat these investments will provide a return in theform of high-growth, high-wage industries, as wellas ready domestic access to, and knowledge of, thecritical technologies of the future. It is estimated thatin the US alone, some forty states are targeting thebioscience industries with significant investments,with many focusing strategically on particular niches.7
Role of city-regions
City-regions, for their part, are also taking up thechallenge for two main reasons. First, underpressures from globalization, rapid technologicalchange and the downloading of programming byupper levels of government, city-regions have becomemore exposed to — and more responsible for — thevagaries and uncertainty of external market forces.And second, knowledge-based industries tend tocluster in city-regions with ever-larger concentrationsof research intensive institutions, which aresometimes referred to as ‘research megacentres’.Silicon Valley’s success in the ICT industry isundoubtedly the most famous example of thisclustering effect, having become a household namefor regional economic success the world over. There
are, however, many others notable examples: Austin,Texas has become a major centre for microelectronics;San Diego, Boston and Stockholm, Sweden forbiosciences; and recently, Bangalore for ICT. A 2002study of biotechnology in 51 US metropolitan centresemphasizes just how significant this concentrationcan be. The authors found that the top biotechnologycentres have almost nine times as much biotechresearch activity and 20 times the amount ofcommercialization activity than average.8
The new locally influenced industrial policy
In response to these trends, several high-tech regions,particularly in North America, have come to play anactive role in shaping and supporting the developmentof their knowledge-based industries. Throughcollaborations between local leaders and various levelsof government, regions have been recasting the basicfoundations of traditional national industrial policy.By acting strategically in coordinating local resourcesand drawing upon financing from upper levels ofgovernment, many regions are successfully building ahighly competitive research capacity to support anddevelop targeted knowledge-based industries. This isbeing supported by aggressive efforts at the regionallevel to strategically recruit and retain firms thatcomplement existing strengths in industry clusters. Inorder to accomplish this, however, competitive city-regions must be able to rely upon ready assistancefrom senior levels of government.
7
Shanghai – Emerging ICT Hotspot
In recent years, the most significant public investment in ICT capability has come from Asian states,which have been very successful at breaking into integrated circuit (IC) production. Indeed, the top ICmanufacturers — UMC and TSMC of Taiwan — each initially had substantial government backingand support that ultimately reshaped the entire global production model for IC chips. As of 2003,these two firms accounted for $8.6 billion US in revenues.58
The Chinese government has also just recently entered the semiconductor market, having backed thecreation of SMIC in 2000, located in Shanghai. SMIC, now the fourth-largest dedicated ‘pure play’ ICmanufacturer in the world, consolidates government efforts that began in the late 1990s to establishShanghai as a centre for semiconductors. The efforts involved a $1.2 billion US investment in thelargest-ever project undertaken in China's electronics sector, with the expectation of building up anindustrial capacity in integrated circuits in the Shanghai region.59 The region now boasts some 27 ICmanufacturers, 238 design companies and 88 package and assembly companies, with total salesrevenues of over $4.5 billion US. The government has recently said it plans to cultivate no fewerthan 40,000 IC designers and 10,000 IC processing technologists over the next six to eight years.60

NATIONAL R&D SYSTEMS
A COMPARATIVE LOOK AT FOUR NATIONALR&D SYSTEMS
The national governments of the six leading urbanregions reviewed in this study all have well establishedroles in supporting research and innovation. Thissupport, however, varies considerably in extent. AsFigure 2 reveals, Sweden has the highest expenditureson R&D as a percentage of GDP, not just among thecountries in this study but also among OECDmembers. The amount that the government spendson R&D is also the highest in the group, reflectinglevels of investment in education that are amongthe highest in the world relative to the size of itseconomy. In absolute terms, however, the UnitedStates government is the single largest supporterof R&D in the world, having committed some$137 billion US to R&D for FY 2007. This amountcontributes to a total gross expenditure on R&Dof $318 billion US or 2.7% of GDP. Canada, havingcommitted just less than 2% of GDP on R&D, ranksthe lowest among the countries in this study andmarginally lower than the OECD average.9
There is also a great deal of variation in whoperforms a country’s R&D, reflecting in partstructural differences in respective national R&Dsystems. Industry, for example, accounts for a farsmaller portion of R&D expenditures in Canada(56% of GERD) as compared to Sweden (74%) or theUS (70%).10 In contrast, the higher education sectoris a much more important R&D performer in Canada(34%), than in the US (14%) or Sweden (22%).
Differences aside, national governments in the pastfew years have shown a marked commitment torevitalizing their R&D systems. As Figure 3 shows,government-financed R&D has been rising in eachof the countries reviewed, with the strongest growthcoming from the US and Singapore. In the US, thisreflects several recent multi-year initiatives aimed atdeveloping research and industrial capacity inpromising technologies, including the NationalNanotechnology Initiative ($6.7 billion US since2001) and the Advanced Energy Initiative ($10 billionUS since 2001). Most recently, the US has announceda 10-year, $136 billion ‘American CompetitivenessInitiative’ aimed at doubling the government’scommitment to critical basic research programsin physical sciences. Similarly, Singapore has spent$6 billion US since 2001 through its S&T Plan 2005,strengthening R&D capabilities in niche areas andnurturing and recruiting talent. According to thegovernment’s new five-year S&T Plan 2010, Singaporewill commit another $13.5 billion US over five years,with the stated goal of doubling the jobs in lifesciences, environmental and water technologiesand digital media by 2015.
8
0 0.5 1 1.5 2 2.5 3 3.5 4
Sweden*
United States
Singapore
Total OECD*
Canada
Gross Expenditures on R&D by funding source, 2004
* 2003. Source: OECD Main Science and Technology Indicators, 2006
% of GDP
Government
Industry
Other
Figure 2: Comparative snapshot of gross expenditures on R&D (GERD), by country

Canada has also shown a recent upswing ingovernment-financed R&D, beginning in 1997 whenthe government committed itself to reinvesting inhigher education. Since then, funding for highereducation research has risen from $747 million Cdnin 1997-98 to $2.7 billion in 2004. A significantportion of this increase stems from several newprograms including the Canadian Foundation forInnovation (est. 1997), the Canada Research ChairsProgram (2000) and Genome Canada (2001), whichtogether have received $5.0 billion Cdn between 1997
and 2005.11 Despite this increase in funding, however,government-financed R&D in Canada continues tolag behind the other countries. Indeed, since thecommitment to reinvest in higher education research,there have been few new initiatives supporting thecountry’s R&D system. Moreover, as of 2006, bothCFI and Genome Canada have essentially committedall their allocated resources and no governmentcommitments have yet been made to furthertheir funding.
9
Figure 3: National commitments to R&D
Albany- Emerging Nanotechnology Hotspot
Though not yet recognized as a high-technology centre, Albany, N.Y. is a very strong contender tobecome one of the world’s leading centres in nanotechnology. The State of New York, through its AlbanyNanotech program61, has committed over $500 million to semiconductor fabrication facilities at the StateUniversity of New York at Albany (SUNY-Albany) and to research and education programs at bothSUNY-Albany and the region’s Rensselaer Polytechnic Institute.
This investment has already begun to pay off, having triggered matching commitments from IBM, TokyoElectron and Sony, as well as SEMATECH. In 2003, Austin-based SEMATECH announced that it wouldestablish a facility in Albany to take advantage of the Albany Nanotech complex, much to the concern ofAustin. And in June 2006, it was reported that AMD was in talks with state officials to build a $3.5 billionchip plant that could receive more than $1 billion in incentives.62
Once these investments establish themselves, Albany will be well positioned to take advantage of thefederal government’s multibillion dollar National Nanotechnology Initiative. This program, which hasdisbursed some $6.5 billion US since 2001, funds leading research, creates multidisciplinary centresof excellence and develops research infrastructure. The initiative also allocates funds to academicinstitutions, departments and agencies and to R&D contracts. Through the Small Business InnovationResearch (SBIR) program, small technology firms receive 2.5% of all funds for competitive R&D contracts.

10
REGIONAL R&D SYSTEMS
THREE MODELS OF STRATEGIC INVESTMENT INCITY-REGIONS
To account for differences in political systems thatarise when comparing sub-national regions acrosscountries, this study identifies important variationsin the way in which regions interface with nationalgovernments in strategically developing their regionalR&D infrastructure. The following section explainsthe structure of this framework, relevant as it is todrawing out lessons for the Toronto region.
Typically, advanced technology industries withina given region are publicly supported by twomechanisms. The first is the nation-wide R&Dsystem, which includes, for example, tax incentivesfor innovation, funding for university-based researchand other nationally oriented R&D institutions. Thesecond mechanism comprises the strategic researchand innovation investments, which are typicallyregion- or industry-specific. These may includeinitiatives that establish a new specialized researchinstitute in nanotechnology, as well as industrysupport or procurement programs aimed atdeveloping industrial capacity in a targetedtechnology field such as advanced manufacturing.
One of the major differences among national R&Dsystems relates to this second aspect, that of strategicpublic investments, an aspect that directly affects aregion’s efforts at science- and technology-basedeconomic development. In particular, the way inwhich national governments decide which strategicinvestments to make, and where they are bestdirected, varies in important ways, which ultimatelyimpact upon the role that a government has insupporting regional research and innovationinfrastructure. The US government, for example,is a significant strategic investor in public R&D buttypically does not concern itself with where theseinvestments ultimately end up. National governmentsin Asia, however, typically do decide which regionsand industries to invest in. To account for thesedifferences in government R&D roles, this studygroups the cases according to how decisions forchannelling national investments in particularregions, and specific sectors, are made. On thiscriteria, regions fall into one of three categories(Figure 4).
The first type is dirigiste, whereby the nationalgovernment plays a strong strategic role in channellinginvestment to the research capacity of particularregions. In this system, the national governmentprovides both the public investment and strategicdecision-making which determines which industriesand regions are targeted and how. Of the regionsreviewed, Singapore and Stockholm are characterizedby the dirigiste system of strategic investment, withSingapore being the stronger of the two.
Second is the regional mobilization model, wherebythe national government provides the resources butleaves the strategic decision-making to the local level.This model responds to the growing sophisticationamong many local governments and civic leaders inNorth America at mobilizing and leveragingresources at the local and national levels tostrategically shape the development of local research-intensive economic activity. In effect, this localmobilizing element strategically enhances andorganizes national and state investments andmobilizes local knowledge resources, such asuniversities, to build a competitive advantagein targeted sectors. Regions with a strong localorganizing component are often less visible throughinternational comparisons, despite the considerablelevel of state and federal investments that supportthese systems. Indeed, many of the high-technologyregions that emerged in the 1980s, including Austinand Raleigh-Durham, have benefited considerablyfrom local action in charting a strategic directionin the knowledge economy.
The third type, known as the embedded model,consists of those regions with a long-established andwell-developed research infrastructure. By virtueof their size, quality or depth of labour pool, theseregions are able to draw in a disproportionate shareof investments, both public and private, to maintainand help adapt their knowledge-based sectors. Theseregions, such as Boston and San Diego, have, in effect,an embedded competitive advantage in research andinnovation. In each case, however, the capabilitiesand infrastructure were originally created, andsubsequently sustained, by major federal investmentsconcerned with national security. Their systemsof strategic investment are thus more in line withnational S&T objectives and typically less strategicallyorganized at the regional level. Given the sheer amountof public and private money invested on an annualbasis, these regions often have the largest and mostdynamic knowledge-based industry clusters.

11
Industry Clusters
Technology Development
KnowledgeGeneration
Firm
Development
Regional Innovation
National
Systems of strategic investment
Public Investment
Public Investment
Dirigiste Regional Mobilization
Austin | Raleigh - Durham Boston | San Diego Singapore | Stockholm
Embedded
Local
ResearchInnovation
Support
Research InstitutesFirms
National R&DPrograms
Strategic Decision Making
Strategic Programs
Industry Clusters
Technology Development
KnowledgeGeneration
Firm
Development
Public Investment
ResearchInnovation
Support
Research InstitutesFirms
National R&DPrograms
Strategic Programs
Industry Clusters
Technology Development
KnowledgeGeneration
Firm
Development
Public Investment
ResearchInnovation
Support
Research Institutes
Firms
National R&DPrograms
Strategic Decision Making
Strategic Programs
StrategicPrograms
StrategicDecision Making
Strategic Infrastructural
Advantages
Figure 4: Three models of strategic public investment

SIX CASE STUDIES
– Speech by Singapore’s President, SR Nathan, July 26, 2006
Singapore
Case study highlights
The Singapore case is an important example of howcompetitive advantage in advanced technologies canbe created. The government has made a long-termcommitment to strategically create national resourcesin research and knowledge, in order to takeadvantage of market force opportunities and trends intechnology. This policy approach is the antithesis of thelaissez-faire economic development approach thatinfluences many Western governments and offers animportant perspective for aspiring research andinnovation centres.
Dirigiste system of strategic investmentin Singapore
Singapore is unique among the regions surveyed,not least because of its status as a city-state. With nonatural resource base or agriculture sector to dependupon for employment, Singapore has been adeptover the last four decades at creating competitive
advantages in key technology industries, frompetrochemicals to electronics and ICT, and nowbiotechnology.12 Behind this successful capacitybuilding have been several ambitious — if notaggressive — policies and several high-riskinvestments that have addressed the critical factorssupporting knowledge intensive sectors, namelyknowledge generation, research infrastructure,workforce development and venture financing.
All these policy elements have come togetherin Singapore’s latest long-term quest to build abiotechnology cluster. With the goal of beingAsia’s ‘premier hub for biomedical sciences’, thegovernment has been steadily investing in researchinfrastructure since 1987, establishing four newresearch institutions since 1996 alone. These newcentres – the Bioinformatics Center, the GenomeInstitute of Singapore, the Bioprocessing TechnologyCentre and the Institute of Bioengineering andNanotechnology — will have received a total of$1.5 billion US in investment come the end of 2006.13
Complementing these investments has been a talentrecruitment strategy which has thus far drawn aNobel Prize winner, a former director of the USNational Cancer Institute and a first-rate cancerresearcher from Japan, all of whom have been offeredgenerous financial packages and research labs. And tobolster this knowledge building effort, the governmentis supporting Singaporeans to train at leadinginternational universities and encouraging thecountry’s research institutions to develop allianceswith top biotechnology centres around the world.
One of the more remarkable components ofSingapore’s biotechnology strategy, however, is anadditional $2 billion US set aside to support industrycapacity development. The government has committedhalf of this amount to three venture funds supportingthe city-state’s biotech start-ups and to providingincentives for recruiting multinationals. The remaining$1 billion has been set aside to attract three to fiveworld-class corporate centres of research.14
Biotechnology is by no means the first to havereceived such aggressive strategic assistance. In fact,these kinds of policies have also been at the core ofits successful efforts in establishing itself as a centrefor semiconductor manufacturing. In the early 1990s,for example, the government played a major role infinancing the establishment of CSM (CharteredSemiconductor Manufacturing). CSM is now thethird-largest contract manufacturer of IC chips in the
12
QUICK FACTS
POPULATION: 4,351,400
GRP: $116.7 BILLION US
GEOGRAPHIC SPAN: SINGAPORE
USTPO PATENT APPLICATIONS: 848
SCIENTIFIC JOURNAL OUTPUT: 7,108
STAR SCIENTISTS: 4
MAJOR PUBLIC RESEARCH INSTITUTIONS: 7
VENTURE CAPITAL: N/A
AVERAGE TECHNOLOGY WAGE: N/A
* See Appendix B for sources

world with a 2004 growth rate of 49% from the yearprior. To further support the sector, the governmentdesignated it as a priority industry, which entitlesfirms to very low tax rates (from 0% to 13%) withthe former rate applied to any chip manufactureremploying the most advanced technology.15
Finally, to address the growing demands for skilledlabour, the government established an ‘extremelyliberal immigration policy’ to assist in recruitingtalent for the industry and launched the InternationalManpower Program to ‘scour foreign universitiesfor talent’.16 CSM itself recruited some 750 peoplethrough this program between 1995 and 2000.
Stockholm
Case study highlights
Stockholm, as with Singapore, has benefited froma national government dedicated to directinginvestments to its knowledge-based industrieswithin specific regions and to assisting with capitalrequirements of technology oriented firms. It offersa good example of a Western country, which typicallyare less interventionist than their Asian counterparts,committing public funds to strategically addressserious market failures in the innovation system.
Dirigiste system of strategic investmentin Stockholm
That Stockholm finds itself in the global spotlightfor science excellence each year with the awardingof the Nobel Prize befits a city whose R&D capacityis among the world’s best. Home to such R&D-intensive multinationals as Erickson and AstraZenecaand to the country’s top universities — including theKarolinska Institute, Stockholm University, the RoyalInstitute of Technology and Uppsala University —the region is the main contributor to Sweden’s statusas the world’s top per capita investor in R&D.
Stockholm’s strength in technology-based industries,notably IT and biosciences, mirrors the country’slong-standing economic prosperity. Indeed, overthe last three decades the country has been a modelof how to balance high rates of growth and socialequity while sustaining large globally competitivetechnology firms. Through heavy taxation of personalincome and consumption, the government has beenable to tax capital income and profits lightly, helpingdirect capital and labour resources into Sweden'slarge globally competitive technology industries andultimately promoting employment.17 Stockholm’sprominent multinationals have been majorbenefactors of this policy environment.
In an effort to ensure continued economic strength, ata time when there is growing evidence of offshoring ofproduction and commercialization18, the governmenthas taken several steps over the past few years tostrengthen research and innovation in the regions. Inthe mid 1990s, for example, the government funded28 Competence Centres at eight universities, manyof which are based in Stockholm. And in 2001, itestablished a new agency for innovation, VINNOVA,which now plays a critical role in setting strategicpriorities and directing resources to support regionalstrengths in knowledge-based sectors.
These regionalized efforts mark a major shift ineconomic development policy away from supportingnational industrial manufacturing and sparselypopulated regions, to one focused on supportingregional strengths. Under what it calls RegionalGrowth Programmes, policies are guided by regionalstrategic action plans, which focus on buildingknowledge resources within regions, ensuring thesupply of qualified workers and enhancing strategiccooperation between firms and universities.
13
QUICK FACTS
POPULATION: 2,968,000
GRP: $123.6 BILLION US
GEOGRAPHIC SPAN: STOCKHOLMUPPSALA
USTPO PATENT APPLICATIONS: 251
SCIENTIFIC JOURNAL OUTPUT: 7,007
STAR SCIENTISTS: 28
MAJOR PUBLIC RESEARCH INSTITUTIONS: 12
VENTURE CAPITAL: $242 MILLION US*
AVERAGE TECHNOLOGY WAGE: N/A
* Life sciences for Sweden as a whole – though mostlyin Stockholm-Uppsala (source: StockholmBusiness Region)

Most recently, the government created the ‘InnovationBridge’ for pre-commercial venture capital, whichallocates $245 million US to knowledge-basedinnovations and early-phase startups. This program,which has two of its seven regional offices in theStockholm region, builds on a much larger governmentVC fund called Industrifonden, which is a majorventure capital investor in advanced technologyfirms in ICT, life sciences and energy. Currently, thisgovernment fund has approximately $436 million US inequity with investment capital of $218 million US. Thefund also supports venture capital companies, includingthose with a regional focus, as well as seed capital firmslinked to the universities and institutes of technology.19
Austin
– Angelos Angelou, CEO AngelouEconomics, Austin, Texas
Case study highlightsThe Austin case study highlights the importance ofstrategic local action in fostering science and technologycapability within a region. Without such strategicplanning and organization, it is unlikely that the regionwould have achieved its current levels of prosperity. Yetthe case study also shows how important resourcesfrom upper levels of government are supporting thislocal effort. By coordinating local resources with thosefrom the state and national government, the region hasbeen able to leverage its infrastructure development to aglobally competitive level.
The regional mobilization of strategic investmentin Austin
In the ever-growing industry of regional performanceindicators, the Austin-San Marcos region has stoodout in more than a few rankings in the last few years.In 2002, it was ranked as having the strongest economyof any US city for the fourth year in a row20 andplaced second only to San Jose in the number ofpatents in 2000. In the following year, it was first ingrowth of patents21 and was ranked third among USregions for the level of education of its work force;and in 2001, Austin was considered among the bestplaces to live in the US by MSN.
Its standing on several fronts, especially on qualityof life factors, can no doubt be partly attributed tothe very pleasing surroundings. Yet much of whatis being captured is the region’s industrial prowessin high-technology, particularly in semiconductorresearch and manufacturing, software, computersand peripherals.
By the mid 1990s, there were some 275 technologymanufacturers in the region, 60% of which were inthe computer and electronics industry. Motorola,Advanced Micro Design, Samsung, Applied Materials,Tokyo Electron and Dell Computer are among themost prominent firms to have significant operationsin Austin. By the late 1990s, they contributed toupwards of 68% of the total manufacturing in theregion. In fact, it has been one of the few regionsin North America that saw its manufacturing baseexpand consistently during the 1980s and 1990s. Itsbase is primarily high-technology related, with someof the larger firms such as Dell employing upwards of20,000 people.22 On the service side, the numbers aresimilar, with employment in software development,computer systems integration and software consultingaccounting for approximately half of the 150,000service employees by the mid-1990s.
It was, of course, not always thus. As the state capitaland home to the University of Texas at Austin, theregion’s economy in the decades following World WarII had been heavily represented by the governmentand education sectors, with agriculture still a majorsource of revenue in the area. Manufacturing isestimated to have been responsible for no morethan 2% of employment in the mid-1950s.23
14
QUICK FACTS
POPULATION: 1,349,291
GRP: N/A
GEOGRAPHIC SPAN: AUSTINROUND ROCKSAN MARCOS
USTPO PATENT APPLICATIONS: 3,188
SCIENTIFIC JOURNAL OUTPUT: 3,659
STAR SCIENTISTS: 29
MAJOR PUBLIC RESEARCH INSTITUTIONS: 2
VENTURE CAPITAL: [# DEALS/TOTAL]80 / $459 MILLION US
AVERAGE TECHNOLOGY WAGE: $45,731 US

Yet following the goals laid out in a strategicplanning report from 1957, local leaders committedthemselves to developing an electronics industry inthe region to diversify the economy. Though thetransition itself spanned decades, the pivotal momentcame in the early 1980s with the successful recruitmentof the first major private sector research consortiain the US, the Microelectronics and ComputerTechnology Corporation (MCC). Five years later, theregion’s leaders made another successful recruitment,this time a major public-private research consortiumcalled SEMATECH (SEMiconductor MAnufacturingTECHnology), which came with $1 billion US infederal support. Together, these two organizationscrystallized the identity of Austin as a mecca forhigh-technology, building on a manufacturing baseestablished by recruited companies such as IBM,Motorola and AMD.
Underpinning these successes was the University ofTexas at Austin, whose expertise and commitment tomicroelectronics and industry outreach was a majordraw for companies looking for knowledge and askilled work force. In recruiting MCC, the universitypromised to triple the size of its microelectronicsresearch program and establish 30 new endowedprofessorships in electrical engineering and computerscience, at a cost of $50 million US.
In 2003, the state of Texas effectively endorsed thislocal system of strategic investment by establishing theTexas Technology Initiative (TTI). Funded through anew $295 million US Texas Enterprise Fund, TTI ispart of a long-term economic development strategyto retain and recruit advanced technology industries,coordinate advanced technology activities throughoutthe state and accelerate commercialization. In thewords of one Texas senator, the state now has an“economic development strike force, led by thegovernor, that will allow us to aggressively pursue thetype of business opportunities that are going to re-ignite our Texas economy.” One initiative funded thusfar is a new $200 million US Texas Advanced MaterialsResearch Centre, based in Austin. Its goal is tocoordinate research between SEMATECH and thestate’s universities in order to establish leadership innew materials and capabilities — critical componentsof next-generation semiconductors, nanotechnologyand biotechnology.
Raleigh-Durham
Case study highlights
As with Austin, Raleigh-Durham’s research capacityhas been enhanced considerably using a bottom-upstrategy. Through effective coordination of theregion’s research institutions, Raleigh-Durhamstrengthened its research capacity in order to drawin both public and private investment and help shapeits growth trajectory in the knowledge economy. Thesuccess of such strategic efforts has been dependenton national programs, such as federally fundedresearch centres, that can be the focal point for localmobilization and coordination.
The regional mobilization of strategicinvestment in Raleigh-Durham
Raleigh-Durham’s rise to technological prominenceis one of the most unambiguous examples of howbuilding a research capacity within a region cangenerate substantial economic benefits in technologysectors. In the early 1950s, at the initiative ofthe region’s academics, a plan was developed incollaboration with state economic developmentofficials that would coordinate the research strengthsof the region’s three main universities in the form ofa research park. The goal was to attract new industriesto the state and thus address the lack of well-paid jobsfor the region’s graduates. The park was called the‘Research Triangle’, a name now synonymous withNorth Carolina’s knowledge economy and whichreflects the fact that it is triangulated by DukeUniversity, North Carolina State University and theUniversity of North Carolina at Chapel Hill.
15
QUICK FACTS
POPULATION: 1,466,593
GRP: N/A
GEOGRAPHIC SPAN: RALEIGHDURHAM
CARYCHAPEL HILL
USTPO PATENT APPLICATIONS: 2,494
SCIENTIFIC JOURNAL OUTPUT: 13,021
STAR SCIENTISTS: 56
MAJOR PUBLIC RESEARCH INSTITUTIONS: 4
VENTURE CAPITAL: [# DEALS/TOTAL]56 / $413 MILLION US
AVERAGE TECHNOLOGY WAGE: $43,795 US
The plan began to have an impact by 1965 withthe decision by the federal government to locate a$70 million US National Environmental HealthScience Centre in the park, followed soon after byan IBM research facility. By 2002, after year-on-yeargrowth of about 35%, 106 research companies arenow based in the park, along with a multitude ofresearch centres.
Indeed, the three universities have been verysuccessful at expanding the region’s research capacity,not only by securing NSF-funded research centres —which help increase the amount of federal R&Ddollars spent in the region — but also by enhancinglocal industry-university collaborations. NorthCarolina State, for example, has since the 1980ssuccessfully competed for roughly a dozenfederally funded research centres, including theMicroelectronics Center of North Carolinaand the Center for Advanced Computing andCommunication.24 This has in turn helped leverageindustry-sponsored R&D, which is now the fifth-highest among land grant universities. DukeUniversity is among the highest-ranked universitiesin terms of federally funded academic R&D, havingreached $307 million US in 2003, a figure that is morethan double 1996 levels.
NC State has recently taken a step further insupporting the local knowledge based economyby establishing another research park, CentennialCampus. To date, some $620 million US has beeninvested in park facilities and infrastructure,successfully luring some 70 companies andgovernment agencies, include Swedish firm ABB,Lucent Technologies and Red Hat. It is expected thatthe campus will improve on this number threefold.25
These efforts have ultimately improved the overallhealth of the state economy. The Raleigh-Durhamregion now has a per capita income roughly equal tothe national average, the effect of which has been tohelp lift the state’s average income up from the third-lowest in the country in the mid-1950s.26 Individualtechnology sectors have fared even better. Between1990 and 1999, the region’s average pharmaceutical /biotechnology wage reached $55,759 with an averageannual growth rate of 6.8%, the eighth highest amongthe nation’s 20 largest regions.27
The Raleigh-Durham region’s strongest offering is inbiotechnology, where it ranks as one of the nine mostsignificant biotechnology centres in the US. Withtwice the research activity of the US biotech average,the region garnered $470 million US in NationalInstitutes of Health funding in 2000. Similarly onthe commercialization side, during the 1990s some$400 million US in venture capital was invested inthe region, resulting in 46 new firms.28
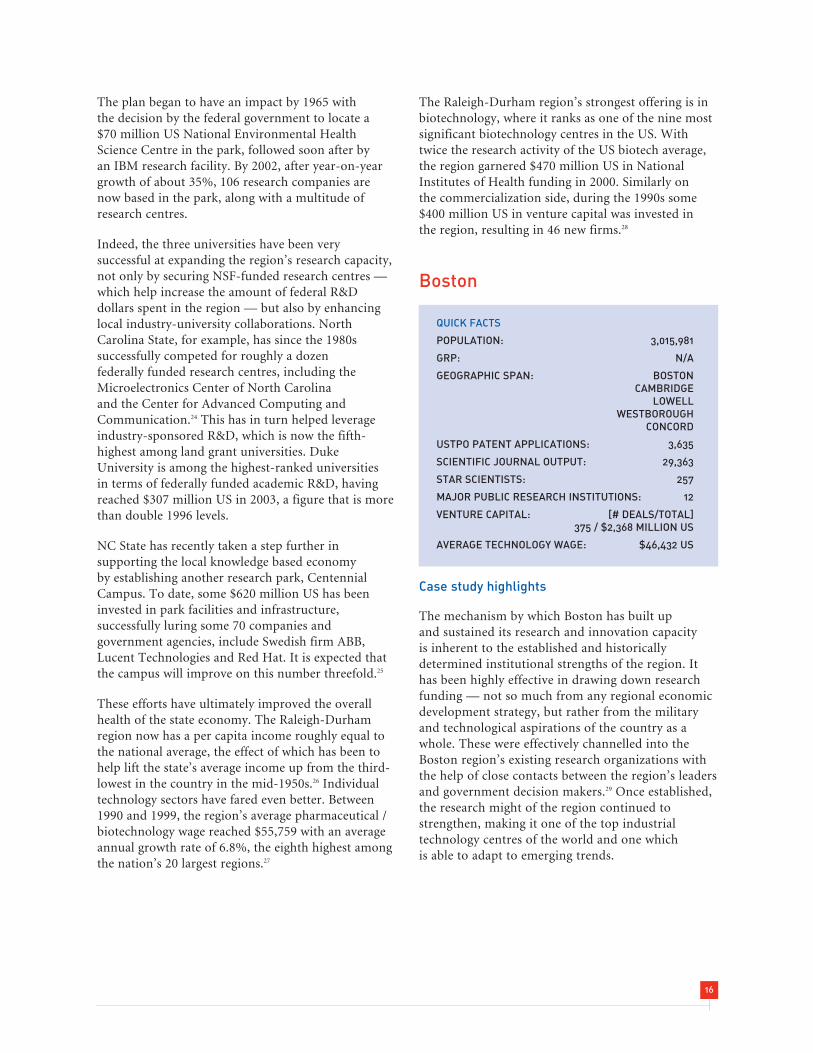
Boston
Case study highlights
The mechanism by which Boston has built upand sustained its research and innovation capacityis inherent to the established and historicallydetermined institutional strengths of the region. Ithas been highly effective in drawing down researchfunding — not so much from any regional economicdevelopment strategy, but rather from the militaryand technological aspirations of the country as awhole. These were effectively channelled into theBoston region’s existing research organizations withthe help of close contacts between the region’s leadersand government decision makers.29 Once established,the research might of the region continued tostrengthen, making it one of the top industrialtechnology centres of the world and one whichis able to adapt to emerging trends.
16
QUICK FACTS
POPULATION: 3,015,981
GRP: N/A
GEOGRAPHIC SPAN: BOSTONCAMBRIDGE
LOWELLWESTBOROUGH
CONCORD
USTPO PATENT APPLICATIONS: 3,635
SCIENTIFIC JOURNAL OUTPUT: 29,363
STAR SCIENTISTS: 257
MAJOR PUBLIC RESEARCH INSTITUTIONS: 12
VENTURE CAPITAL: [# DEALS/TOTAL]375 / $2,368 MILLION US
AVERAGE TECHNOLOGY WAGE: $46,432 US

Embedded system of strategic investmentin Boston
The Boston region is, by most measures, aquintessential knowledge economy. It is endowedwith one of the most extensive educational andresearch systems in the world — some 65 universitiesand colleges across the Greater Boston Region —several of which are world renowned hubs ofscientific and technological excellence, including theMassachusetts Institute of Technology, Harvard,Brandeis and Amherst. It has an extensive base ofhome-grown high technology firms, many of whichwere created by graduates and faculty of localuniversities. And it has the fourth-largestconcentration of venture capital firms in the US,which supports one of the country’s highest rates ofcommercialization from a region’s research base. Inbiotechnology alone, the region accounts for morethan 3,000 patents issued in the last decade and afifth of the country’s venture capital investments inthe sector ($1.9 billion US).30
For a region that lost its industrial base in textiles andapparel in the 1930s and 1940s, these accomplishmentsare all the more remarkable, especially from anemployment standpoint. Between 1968 and 1975 theregion lost some 252,000 manufacturing jobs fromtraditional industries, only to replace them withanother 225,000 manufacturing jobs in emergingsectors from 1975 through to 1980.
This transition to a high-technology researchand industrial centre would not, however, havebeen possible without the vast influx of federalDepartment of Defence (DOD) R&D funds thatpoured into the region over several decades fromWorld War II onwards. Disproportionately directedtowards MIT and the region’s firms, these fundssteadily built up a military-related technologicalcapability, providing seed capital to support many ofthe technological developments on which the region’selectronics, analytical instruments and computerindustries were based.31
In the final decade of the Cold War, from 1980 to1989, New England received more defence spendingper capita than any other region in the United States.Even today, DOD continues to be the dominantsource of federal R&D in the State of Massachusetts,having invested almost $2 billion in 2001, representinga growth rate of almost 20% from five years prior.According to a recent study from the MassachusettsTechnology Collaborative, the DOD is the primarysource of funding for R&D carried out by industry,federal laboratories and federally funded research anddevelopment centres.32
Federal research funds are also a major driver inBoston’s biotechnology industry. In 2000, the regionreceived more research funding than any other regionin the US — over $1.4 billion US in funding fromNational Institutes of Health, or 12.2% of the total.33
In addition to this is the basic research funding fromthe National Science Foundation (NSF), a federalagency supporting basic research in science andengineering. Massachusetts is the fourth-largestrecipient of NSF funds in the country, havingreceived $358 million US in 2005.34 Six new centreprograms have been supported by the agency since1996, including those established under the NationalNanotechnology Initiative and the InformationTechnology Center program.
Although undeniably influential, public fundingon its own does not explain the region’s historicalsuccess. According to Castells and Hall, one ofthe explanations for the region’s strength incommercialization stems from MIT’s enthusiasmfor contract research with government (i.e. DOD)and industry that dates back to the 1930s. With lessmoney than its Ivy League neighbours, MITmade contractual cooperation a university policy,pioneering the trend towards university spin-offs.35
As the authors note, “MIT’s faculty and graduatesused their advanced knowledge in new technologies,as well as their excellent personal contacts with themilitary establishment, to start companies [thatwould later] reproduce the spin-off process, givingbirth to dozens of new companies...”
17
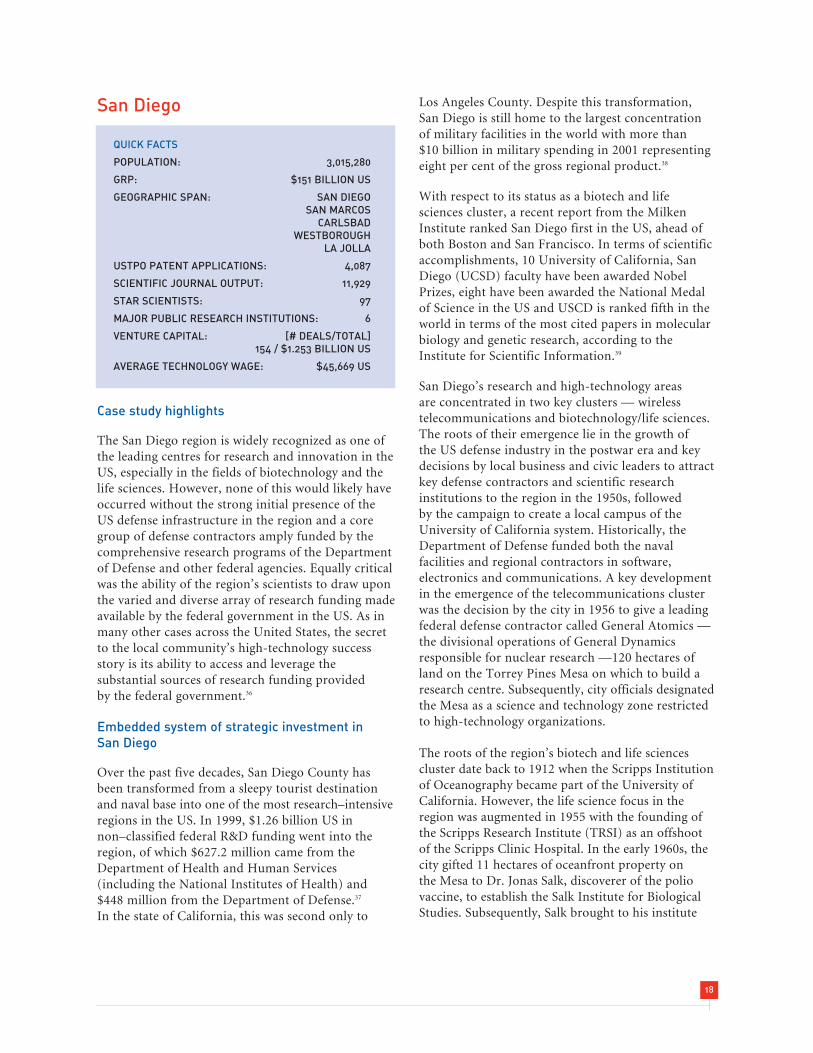
San Diego
Case study highlights
The San Diego region is widely recognized as one ofthe leading centres for research and innovation in theUS, especially in the fields of biotechnology and thelife sciences. However, none of this would likely haveoccurred without the strong initial presence of theUS defense infrastructure in the region and a coregroup of defense contractors amply funded by thecomprehensive research programs of the Departmentof Defense and other federal agencies. Equally criticalwas the ability of the region’s scientists to draw uponthe varied and diverse array of research funding madeavailable by the federal government in the US. As inmany other cases across the United States, the secretto the local community’s high-technology successstory is its ability to access and leverage thesubstantial sources of research funding providedby the federal government.36
Embedded system of strategic investment inSan Diego
Over the past five decades, San Diego County hasbeen transformed from a sleepy tourist destinationand naval base into one of the most research–intensiveregions in the US. In 1999, $1.26 billion US innon–classified federal R&D funding went into theregion, of which $627.2 million came from theDepartment of Health and Human Services(including the National Institutes of Health) and$448 million from the Department of Defense.37
In the state of California, this was second only to
Los Angeles County. Despite this transformation,San Diego is still home to the largest concentrationof military facilities in the world with more than$10 billion in military spending in 2001 representingeight per cent of the gross regional product.38
With respect to its status as a biotech and lifesciences cluster, a recent report from the MilkenInstitute ranked San Diego first in the US, ahead ofboth Boston and San Francisco. In terms of scientificaccomplishments, 10 University of California, SanDiego (UCSD) faculty have been awarded NobelPrizes, eight have been awarded the National Medalof Science in the US and USCD is ranked fifth in theworld in terms of the most cited papers in molecularbiology and genetic research, according to theInstitute for Scientific Information.39
San Diego’s research and high-technology areasare concentrated in two key clusters — wirelesstelecommunications and biotechnology/life sciences.The roots of their emergence lie in the growth ofthe US defense industry in the postwar era and keydecisions by local business and civic leaders to attractkey defense contractors and scientific researchinstitutions to the region in the 1950s, followedby the campaign to create a local campus of theUniversity of California system. Historically, theDepartment of Defense funded both the navalfacilities and regional contractors in software,electronics and communications. A key developmentin the emergence of the telecommunications clusterwas the decision by the city in 1956 to give a leadingfederal defense contractor called General Atomics —the divisional operations of General Dynamicsresponsible for nuclear research —120 hectares ofland on the Torrey Pines Mesa on which to build aresearch centre. Subsequently, city officials designatedthe Mesa as a science and technology zone restrictedto high-technology organizations.
The roots of the region’s biotech and life sciencescluster date back to 1912 when the Scripps Institutionof Oceanography became part of the University ofCalifornia. However, the life science focus in theregion was augmented in 1955 with the founding ofthe Scripps Research Institute (TRSI) as an offshootof the Scripps Clinic Hospital. In the early 1960s, thecity gifted 11 hectares of oceanfront property onthe Mesa to Dr. Jonas Salk, discoverer of the poliovaccine, to establish the Salk Institute for BiologicalStudies. Subsequently, Salk brought to his institute
18
QUICK FACTS
POPULATION: 3,015,280
GRP: $151 BILLION US
GEOGRAPHIC SPAN: SAN DIEGOSAN MARCOS
CARLSBADWESTBOROUGH
LA JOLLA
USTPO PATENT APPLICATIONS: 4,087
SCIENTIFIC JOURNAL OUTPUT: 11,929
STAR SCIENTISTS: 97
MAJOR PUBLIC RESEARCH INSTITUTIONS: 6
VENTURE CAPITAL: [# DEALS/TOTAL]154 / $1.253 BILLION US
AVERAGE TECHNOLOGY WAGE: $45,669 US

some of the world’s leading biological researchers,including Francis Crick, one of the discoverers of thedouble helix structure of DNA.40 The missing piece ofthe region’s research infrastructure was the presenceof a world-class research university. This drew theattention of two of the region’s leaders, Roger Revelle,Director of the Scripps Institute, and John Jay Hopkins,founder of General Atomics, who led the successfulcampaign to found the University of California, SanDiego. The convergence of this core of private andpublic research institutions laid the basis for thegradual emergence and development of the region’sdynamic industrial clusters in wirelesstelecommunications and biotechnology.
By the 1980s, the region of San Diego had clearlyestablished itself as a leading centre for research andinnovation in the US, but like many competitorregions, including Atlanta and Raleigh–Durham, it was
shocked when it lost the national competition for theheadquarters of the Microelectronics and ComputerTechnology Corporation (MCC), the US’s first majorfor–profit R&D consortium, to Austin, Texas. Thelesson of Austin’s success was not lost on RichardAtkinson, the chancellor of UCSD, who moved toestablish closer linkages between the university andthe business community through the creation oforganizations like UCSD CONNECT, designed toleverage the region’s research base to achieve itsinnovation potential. UCSD CONNECT has growninto a major program in the region, promotingnetworking, advocacy, and assistance to high-technology firms. Other leading organizations linkingindividuals in the business, academic and governmentcommunities of the region include the San DiegoRegional Economic Development Corporation, theSan Diego Association of Governments and theSan Diego Regional Technology Alliance.41
19
Bangalore – Emerging ICT Hotspot
Having captured a significant market share in the very IT service sectors once touted as the preserveof developed economies, Bangalore has become both a symbol of globalization and a source of muchanxiety for the countries whose jobs are being outsourced. And by most estimates, this anxiety is wellfounded. It is estimated that 185 Fortune 500 firms have outsourced IT functions to Indiancompanies. In Canada, the phenomenon of outsourcing, which Bangalore has so eagerly benefitedfrom, could potentially eliminate 75,000 Canadian IT jobs — or one in seven by 2010.52
Bangalore’s strengths, however, go much beyond its willingness to be a subcontractor for the routineIT service functions of Western firms.53 Indeed, it has become a dynamic ICT cluster in its own right,with an estimated 1,500 firms supported by 150,000 software engineers, in a state that graduatesno less than 93,000 engineers a year. And the region is attracting a growing number of notablemultinational firms, including Oracle (1987), Hewlett Packard (1989), IBM (1992), CISCO (1995),Intel (1998) and most recently, Google (2005), which has just opened up Google Labs India to supportthe company’s global research efforts.54
Following partition in 1947, the Indian government made a decision to locate strategically sensitiveindustries away from potentially contentious borders.55 Bangalore, safely located in southwesternKarnataka, thus became a ‘city of choice’ to concentrate key public institutions like the Indian AirForce and numerous science and engineering related universities, institutions and colleges, which arenow responsible for producing much of the well-educated workforce that is attracting relatively highlevels of inward investment.56 Starting in the 1950s and 1960s, the Indian government invested heavilyin Bangalore’s electronics, aeronautics and telecommunications industries; the resulting knowledgebase benefited from reduced tariffs and taxes, laxer foreign direct investment rules and later, thedevaluation of the rupee in 1991. Texas Instruments was the first major multinational corporationto take advantage of this new climate, setting up a fully export-oriented, foreign owned and operatedsubsidiary in 1985, which now employs over 1,000 engineers and spent over $20 million US in R&Dover the past 15 years.57

TORONTO REGION
PAST, PRESENT AND FUTURE COMPETITIVENESSIN RESEARCH AND INNOVATION
– Ontario Premier Dalton McGuinty, Minister of Researchand Innovation (October 7, 2005)
Toronto Region
The Toronto region is on the cusp of becoming oneof the world’s true megacentres of research andadvanced technologies. Having successfully builtupon existing strengths in key industry sectors andits extensive research base, the region is now hometo several of North America’s leading knowledge-intensive industry clusters. It has North America’ssecond-largest automotive and financial servicesclusters, the third-largest information technology andtelecom equipment cluster and the fourth-largestpharmaceutical and biotechnology cluster.42 Inemployment terms, these sectors account for over460,000 jobs and drive a significant share of theregional economy, which currently accounts for over
20% of the country’s GDP and contributes annuallysome $3 billion Cdn in tax revenues to the rest ofOntario and $17 billion Cdn to the rest of Canada.43
Supporting this economic activity are numerouspublic institutions in the region, including eightuniversities, ten colleges, 60 hospitals and 37 medicalinstitutions, which together give the region a strongfoundation in knowledge generation, training andtechnology development. These capacities, however,have not developed by chance. Indeed, it has takendecades for this industrial know-how to accumulatewithin the region. Moreover, it has taken a sizeablecommitment by the provincial and federal governmentsto invest in the region’s universities, colleges andpublic research infrastructure that support researchand development in the area’s firms.
For example, the Ministry of National Defence’sinvestments aimed at developing digital electroniccomputing capacity in Canada in the two decadesfollowing World War II, and later by the Departmentof Industry, Trade and Commerce, proved essentialto establishing a globally competitive industrialcapacity in microelectronics in Toronto.44 In thespan of two decades, the Canadian governmenthad collaborated with several multinationals locatedin Toronto, including Ferranti, Westinghouse andControl Data Corporation, with the goal of procuringmilitary technologies and developing the requisiteexpertise in Canada to support science-based defencetechnologies. Later, the federal government alsoestablished critical research infrastructure suchas the Microelectronic Development Centre, theMicronet Centre of Excellence and the CanadianMicroelectronics Corporation. All of theseinvestments ultimately helped position Canada asone of only three countries, after the US and Taiwan,to have microelectronics design firms among the topthirty in the world.45 Two of these, ATI Technologiesand Genesis Microchip, have made importanteconomic contributions to the Toronto region andthe country as a whole.
This regional high-tech strength has been supportedfurther by the region’s prominent research universities.The University of Toronto alone spends an estimated$2 million Cdn a day on research activities.46 In fact,the University of Toronto, having developed aglobally recognized capability in microelectronicsdesign, has drawn several prominent semiconductorfirms to the Toronto region, including Xilinx, of
20
QUICK FACTS
POPULATION: 6,919,000
GRP: $255.6 BILLION US
GEOGRAPHIC SPAN: TORONTOOSHAWA
MARKHAM-MISSISSAUGA-BRAMPTONGUELPH-KITCHENER-WATERLOO
BURLINGTON-HAMILTON
USTPO PATENT APPLICATIONS: 1,615
SCIENTIFIC JOURNAL OUTPUT: 16,265
STAR SCIENTISTS: 52
MAJOR PUBLIC RESEARCH INSTITUTIONS: 16
VENTURE CAPITAL: [# DEALS/TOTAL]101 / $328 MILLION US
AVERAGE TECHNOLOGY WAGE: $32,670 US

San Jose, Calif. (which established the Xilinx TorontoDevelopment Centre), and Altera, which set up theAltera Toronto Technology Centre after acquiring afirm from a University of Toronto professor. Manysuccessful spin-off companies from the region’sresearch institutions exist; among the best knownare Research in Motion and Open Text.
Present challenge
Yet for all its current research and industrialstrengths, it is by no means certain that the Torontoregion can continue to prosper. The remarkablegrowth in global competition in advanced technologyindustries, together with the major investmentsbeing made by governments around the worldto strategically support research and innovation,present a major challenge to the Toronto region.
The region is also faced with a longstanding weaknessin commercialization, which can be a significantbarrier to its ability to capitalize on its research
capacity. As the recent Report of its Expert Panelon Commercialization noted, this problem is notendemic to just Toronto, but to Canada as a whole,where firms have traditionally competed on cost asopposed to excellence and innovation.47
Though commercialization is not readily measuredby any one indicator, Figures 5 and 6 give someindication of this weakness in the Toronto region.The region’s research institutions collectivelycompare very well in terms of knowledge generation,ranking second only to Boston in science andengineering articles published in 2005. Yet when itcomes to transforming such knowledge into newproducts and services, the region fares less well,placing fifth in US patent applications amongcompeting regions. This modest performance is alsoreflected in venture capital investments, which showsToronto receiving the least amount compared tocompeting US regions.
21
0 5000 10000 15000 20000 25000 30000
San Diego
Singapore
Stockholm
Boston
Toronto Region
Raleigh-Durham
Austin
Bangalore
Source: ISI Science Citation Index, 2006
Articles
S&E Related Academic Articles, 2005
Toronto Region
0 1000 2000 3000 4000
Raleigh-Durham
Singapore
San Diego
Boston
Austin
Bangalore
Stockholm
Source: USTPO, 2006
Patents
US Patent Applications, 2005
Figure 5: Commercialization gap
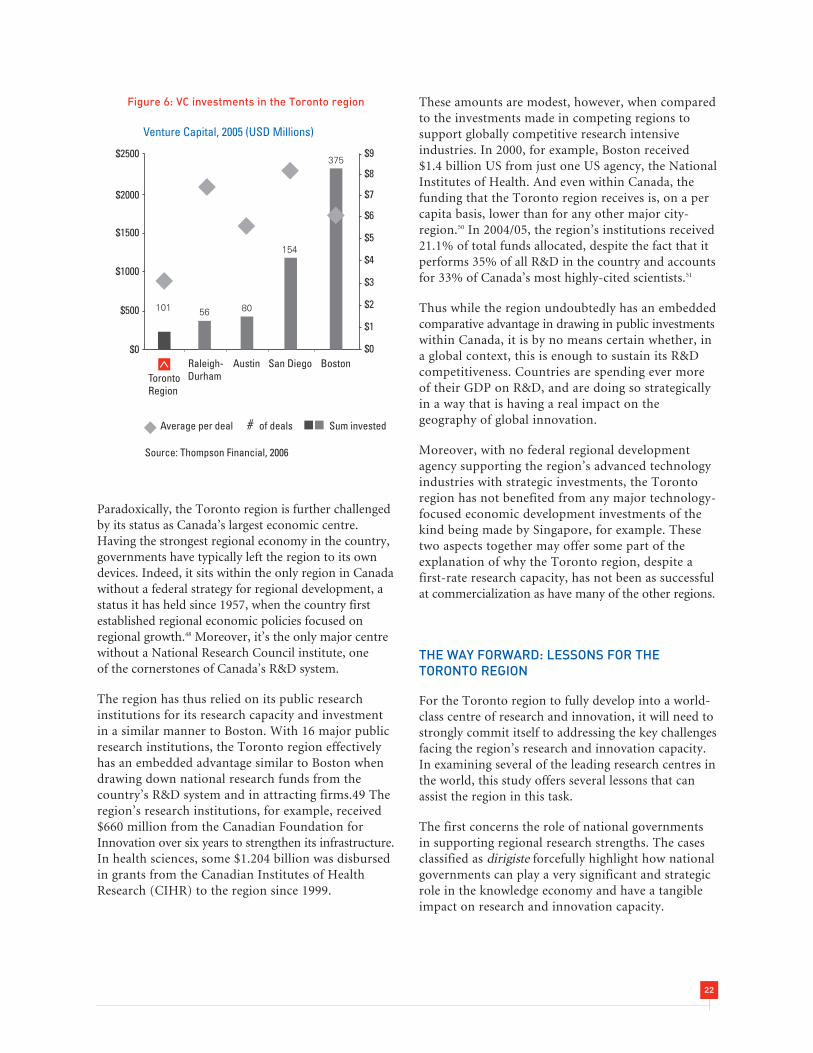
Paradoxically, the Toronto region is further challengedby its status as Canada’s largest economic centre.Having the strongest regional economy in the country,governments have typically left the region to its owndevices. Indeed, it sits within the only region in Canadawithout a federal strategy for regional development, astatus it has held since 1957, when the country firstestablished regional economic policies focused onregional growth.48 Moreover, it’s the only major centrewithout a National Research Council institute, oneof the cornerstones of Canada’s R&D system.
The region has thus relied on its public researchinstitutions for its research capacity and investmentin a similar manner to Boston. With 16 major publicresearch institutions, the Toronto region effectivelyhas an embedded advantage similar to Boston whendrawing down national research funds from thecountry’s R&D system and in attracting firms.49 Theregion’s research institutions, for example, received$660 million from the Canadian Foundation forInnovation over six years to strengthen its infrastructure.In health sciences, some $1.204 billion was disbursedin grants from the Canadian Institutes of HealthResearch (CIHR) to the region since 1999.
These amounts are modest, however, when comparedto the investments made in competing regions tosupport globally competitive research intensiveindustries. In 2000, for example, Boston received$1.4 billion US from just one US agency, the NationalInstitutes of Health. And even within Canada, thefunding that the Toronto region receives is, on a percapita basis, lower than for any other major city-region.50 In 2004/05, the region’s institutions received21.1% of total funds allocated, despite the fact that itperforms 35% of all R&D in the country and accountsfor 33% of Canada’s most highly-cited scientists.51
Thus while the region undoubtedly has an embeddedcomparative advantage in drawing in public investmentswithin Canada, it is by no means certain whether, ina global context, this is enough to sustain its R&Dcompetitiveness. Countries are spending ever moreof their GDP on R&D, and are doing so strategicallyin a way that is having a real impact on thegeography of global innovation.
Moreover, with no federal regional developmentagency supporting the region’s advanced technologyindustries with strategic investments, the Torontoregion has not benefited from any major technology-focused economic development investments of thekind being made by Singapore, for example. Thesetwo aspects together may offer some part of theexplanation of why the Toronto region, despite afirst-rate research capacity, has not been as successfulat commercialization as have many of the other regions.
THE WAY FORWARD: LESSONS FOR THETORONTO REGION
For the Toronto region to fully develop into a world-class centre of research and innovation, it will need tostrongly commit itself to addressing the key challengesfacing the region’s research and innovation capacity.In examining several of the leading research centres inthe world, this study offers several lessons that canassist the region in this task.
The first concerns the role of national governmentsin supporting regional research strengths. The casesclassified as dirigiste forcefully highlight how nationalgovernments can play a very significant and strategicrole in the knowledge economy and have a tangibleimpact on research and innovation capacity.
22
Venture Capital, 2005 (USD Millions)
TorontoRegion
Raleigh-Durham
Austin San Diego Boston
$2000
$2500
$1500
$1000
$500
$0
$1
$2
$3
$4
$5
$6
$7
$8
$9
$0
101 56 80
154
375
Source: Thompson Financial, 2006
Average per deal # of deals Sum invested
Figure 6: VC investments in the Toronto region

Singapore’s talent recruitment efforts and Sweden’spublic venture capital fund are compelling examplesof such roles. Indeed, early on in Toronto’sdevelopment of its technology capabilities, the federalgovernment used similar efforts to build a capacityin electronics and computing. The impacts of theseefforts are still visible today in the Toronto region.The importance of federal investments to buildingscience- and technology-based capabilities, however,is most striking in Boston and San Diego. Theseregions have both been major recipients of defencespending, which helped establish early on much ofthe capabilities that now drive the respective regions’significant competitive advantage in science- andtechnology-based economic development.
Yet in an era of limited Canadian defence R&Dspending and when few strategic efforts are beingmade by the government, the lessons from theregions that have acted locally to secure the necessaryresources to establish their competitiveness areparticularly relevant. Austin and Raleigh-Durhamhave each successfully mobilized and coordinatedlocal resources — such as universities, firms, moneyand talent — to draw in funds from upper levels ofgovernment, attract firms and develop a globallycompetitive research and innovation capacity.
Austin, in particular, highlights the importance ofstrategic local coordination and planning to ensurethat the right people and resources are broughttogether to identify existing strengths and plot acourse of needed investment that develops andsustains these strengths. The case of Raleigh-Durhamreveals how strategically mobilizing the region’sresearch institutes can help regions successfullycompete for more research funding. This enhancedcapacity subsequently became a major draw for high-tech companies seeking to benefit from the proximityto the knowledge base. And finally, San Diego pointsto how an existing research capacity can besuccessfully leveraged by far-sighted civic leaders andentrepreneurs, who emerged from their laboratoriesto found anchor companies.
Given that the Toronto region is similarly situatedwithin a multilevel federal system with devolvedresponsibilities for economic development, suchlessons are all the more relevant. Indeed, there isopportunity now in the Toronto region for thisregional mobilization model to work. With anintimate understanding of its own research strengthsand innovation potential in key advanced technologyindustries, the region is well positioned to takeresponsibility for its science- and technology-basedeconomic development, provided it can effectivelycoordinate its resources to make the neededinvestments. However, without resources madeavailable by the national and provincial governmentsto support the outcomes of local strategies, theregional mobilization model will have its limits.
For this approach to work, therefore, governmentsmust provide the flexibility in their support for R&Dsuch that regions across the country can draw downR&D funding according to their own investmentneeds. Be it for a new research institute, specializedtraining programs or to attract a major R&D firmthat complements local industry strengths, suchtailoring of investments to local needs will provecrucial to sustaining a foothold in rapidly changingglobal technology markets.
This approach would likely benefit not just theToronto region but also all of Canada’s centresof research and innovation, including those lessdeveloped urban regions. Exposed to the dynamicsof a global knowledge economy, leading regionsrequire the flexibility to adapt their local economiesand knowledge infrastructure to the ever-changingtechnology markets. The regional mobilization modelof strategic investment can facilitate this process. Asfor the less developed regions, it can offer importantflexibility and resources to chart their own courseof economic development, according to their ownaspirations and local strengths.
23

APPENDIX A: FACTS ON NATIONAL R&D SYSTEMS
United States
The US is the single largest performer and supporter of R&D in the world, devoting 2.7% of its GDP,or some $318 billion US, to R&D. This amount accounts for approximately 43% of total R&D in OECDcountries. The federal government is responsible for a third of this amount, with expenditures expected toreach $137 billion for 2007, up 50% since 2001.63
Six government bodies are responsible for administering over 95% of government R&D funding. The largest isthe Department of Defence which accounts for just less than half of the total, followed by the Department ofHealth and Human Services (including the National Institutes of Health) at 27% and NASA at 8%.
There are an estimated 16,000 R&D labs in the country, including 12,000 in private industry.64
The United States publishes considerably more scientific and engineering articles than any other country,accounting for 38% of all such articles between 1997 and 2001.65
24
Department of Defence
Department of Agriculture
NationalScienceFoundation
Departmentof Energy
NASA
Department of Health and Human Services
Source: Science and Engineering Indicators, 2006
Top US Federal Funders of R&D, 2005
$102.1 billion US (FY 2005)
Figure 7: Major US Federal R&D Initiatives

Initiative
AmericanCompetitivenessInitiative
NationalNanotechnologyInitiative
Networking andInformationTechnology
AdvancedEnergy Initiative
Hydrogen FuelInitiative
25
Overall budget US$
$136 billion over10 years
2007 allocation:$5.9 billion
$6.7 billion since 2001
2007 allocation:$1.277 billion
$13.7 billion over6 years
2007 allocation:$2.783 billion
$10 billion since 2001through DOE clean-energytechnology research
2007 allocation:$2.146 billion
$1.2 billion overfive years
2007 allocation:$ 289 million
Goals
Double the government’s commitment to criticalbasic research programs in the physical sciencesover the 10 years
Improve environment for additional private-sector investment in innovation
Improve the quality of education especially inmath and science
Support universities that provide world-classeducation and research opportunities
Provide job training for workers andmanufacturers to improve their skills and bettercompete in the 21st century
Attract and retain the best and brightest
Foster a business environment that encouragesentrepreneurship and protects intellectualproperty
Maintain a world-class research anddevelopment program aimed at realizing the fullpotential of nanotechnology
Facilitate transfer of new technologies intoproducts for economic growth, jobs, and otherpublic benefit
Develop educational resources, a skilledworkforce, and the supporting infrastructure andtools to advance nanotechnology
Support responsible development ofnanotechnology
High-end computing (HEC)
Deploy petascale computing systems by theyear 2010
Develop cleaner, cheaper and more reliablealternative energy sources
Break US dependence on foreign sourcesof energy
Scientifically support industry efforts to developpractical and cost-effective technologies forproducing, distributing, and using hydrogen topower automobiles
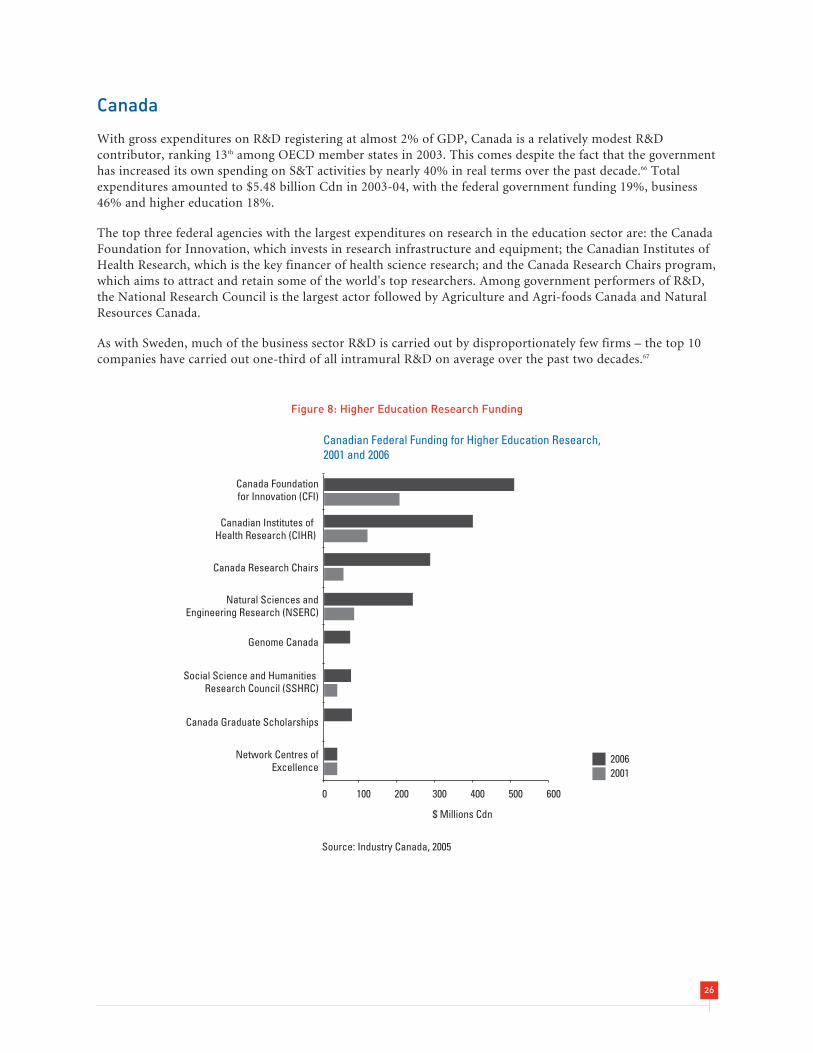
Canada
With gross expenditures on R&D registering at almost 2% of GDP, Canada is a relatively modest R&Dcontributor, ranking 13th among OECD member states in 2003. This comes despite the fact that the governmenthas increased its own spending on S&T activities by nearly 40% in real terms over the past decade.66 Totalexpenditures amounted to $5.48 billion Cdn in 2003-04, with the federal government funding 19%, business46% and higher education 18%.
The top three federal agencies with the largest expenditures on research in the education sector are: the CanadaFoundation for Innovation, which invests in research infrastructure and equipment; the Canadian Institutes ofHealth Research, which is the key financer of health science research; and the Canada Research Chairs program,which aims to attract and retain some of the world's top researchers. Among government performers of R&D,the National Research Council is the largest actor followed by Agriculture and Agri-foods Canada and NaturalResources Canada.
As with Sweden, much of the business sector R&D is carried out by disproportionately few firms – the top 10companies have carried out one-third of all intramural R&D on average over the past two decades.67
26
0 100 200 300 400 500 600
Natural Sciences andEngineering Research (NSERC)
Genome Canada
Social Science and Humanities Research Council (SSHRC)
Canada Foundationfor Innovation (CFI)
Canadian Institutes of Health Research (CIHR)
Canada Research Chairs
Canada Graduate Scholarships
Network Centres ofExcellence
$ Millions Cdn
Canadian Federal Funding for Higher Education Research, 2001 and 2006
Source: Industry Canada, 2005
20062001
Figure 8: Higher Education Research Funding
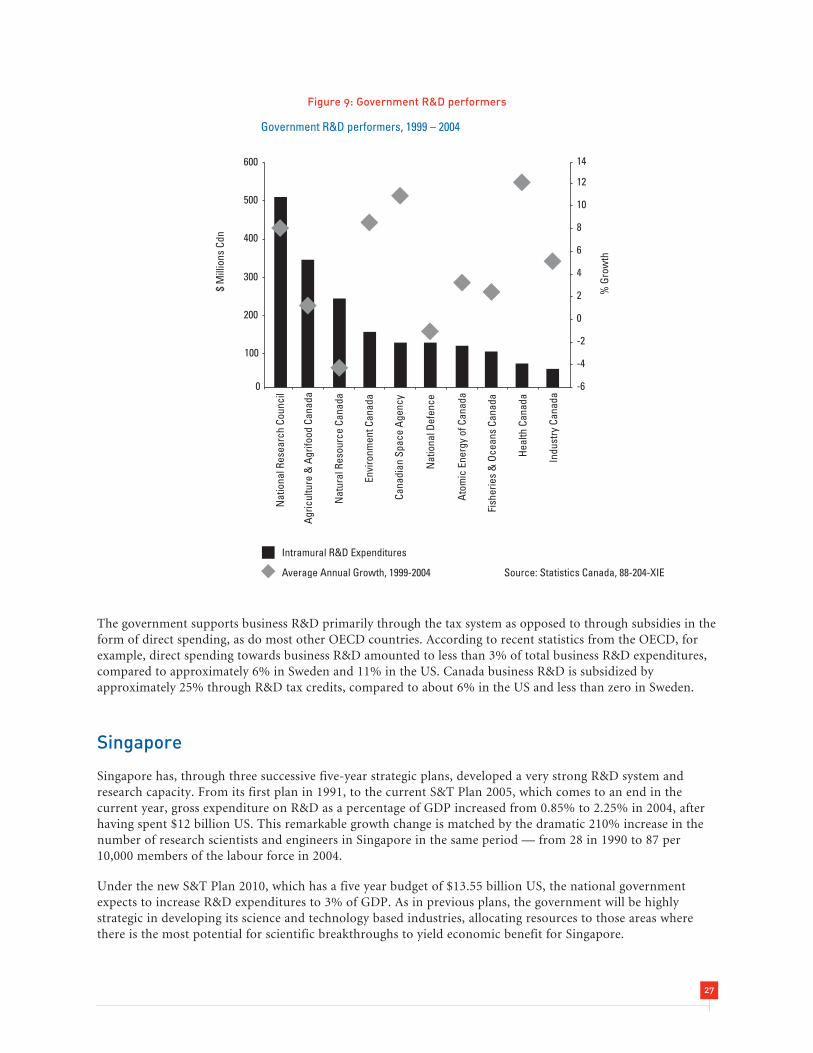
The government supports business R&D primarily through the tax system as opposed to through subsidies in theform of direct spending, as do most other OECD countries. According to recent statistics from the OECD, forexample, direct spending towards business R&D amounted to less than 3% of total business R&D expenditures,compared to approximately 6% in Sweden and 11% in the US. Canada business R&D is subsidized byapproximately 25% through R&D tax credits, compared to about 6% in the US and less than zero in Sweden.
Singapore
Singapore has, through three successive five-year strategic plans, developed a very strong R&D system andresearch capacity. From its first plan in 1991, to the current S&T Plan 2005, which comes to an end in thecurrent year, gross expenditure on R&D as a percentage of GDP increased from 0.85% to 2.25% in 2004, afterhaving spent $12 billion US. This remarkable growth change is matched by the dramatic 210% increase in thenumber of research scientists and engineers in Singapore in the same period — from 28 in 1990 to 87 per10,000 members of the labour force in 2004.
Under the new S&T Plan 2010, which has a five year budget of $13.55 billion US, the national governmentexpects to increase R&D expenditures to 3% of GDP. As in previous plans, the government will be highlystrategic in developing its science and technology based industries, allocating resources to those areas wherethere is the most potential for scientific breakthroughs to yield economic benefit for Singapore.
27
0 -6
100
200
300
400
500
600
-4
-2
0
2
4
6
8
10
12
14
%G
row
th
$M
illio
nsCd
n
Nat
iona
lRes
earc
hCo
unci
l
Agr
icul
ture
&A
grifo
odCa
nada
Nat
ural
Reso
urce
Cana
da
Envi
ronm
entC
anad
a
Cana
dian
Spac
eA
genc
y
Nat
iona
lDef
ence
Ato
mic
Ener
gyof
Cana
da
Fish
erie
s&
Oce
ans
Cana
da
Hea
lthCa
nada
Indu
stry
Cana
daIntramural R&D Expenditures
Average Annual Growth, 1999-2004 Source: Statistics Canada, 88-204-XIE
Government R&D performers, 1999 – 2004
Figure 9: Government R&D performers
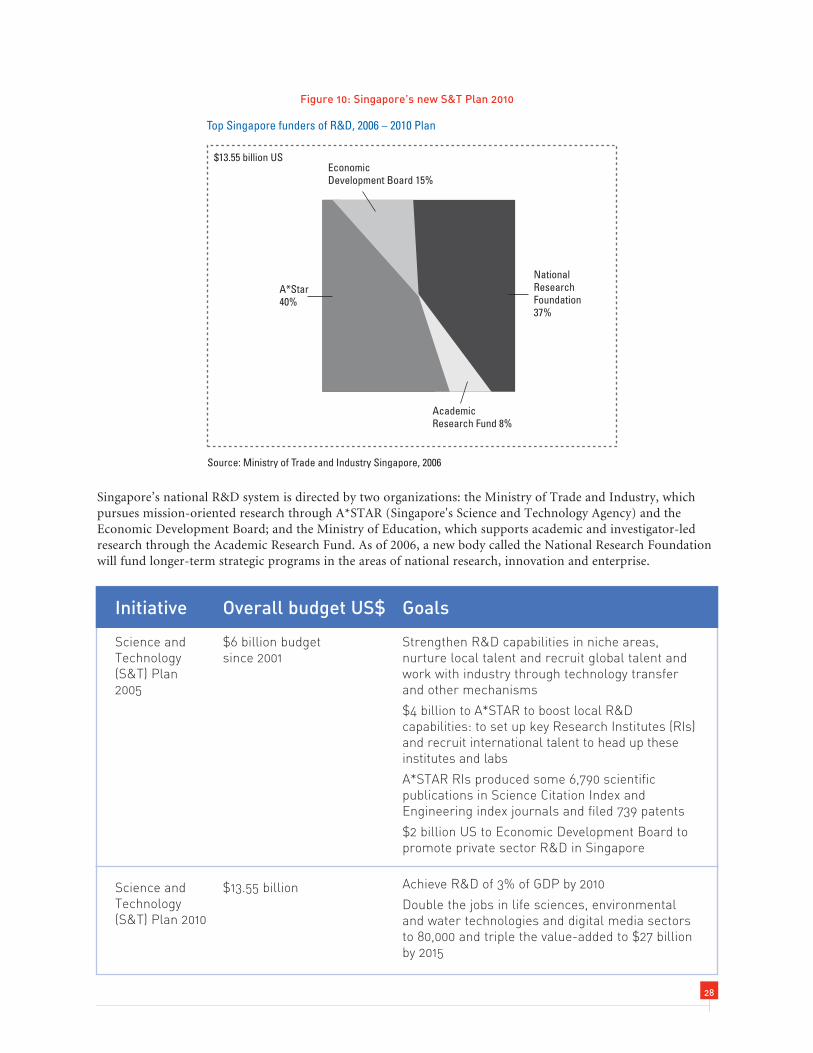
Singapore’s national R&D system is directed by two organizations: the Ministry of Trade and Industry, whichpursues mission-oriented research through A*STAR (Singapore's Science and Technology Agency) and theEconomic Development Board; and the Ministry of Education, which supports academic and investigator-ledresearch through the Academic Research Fund. As of 2006, a new body called the National Research Foundationwill fund longer-term strategic programs in the areas of national research, innovation and enterprise.
28
NationalResearchFoundation37%
Academic Research Fund 8%
Economic Development Board 15%
A*Star40%
Source: Ministry of Trade and Industry Singapore, 2006
$13.55 billion US
Top Singapore funders of R&D, 2006 – 2010 Plan
Initiative
Science andTechnology(S&T) Plan2005
Science andTechnology(S&T) Plan 2010
Overall budget US$
$6 billion budgetsince 2001
$13.55 billion
Goals
Strengthen R&D capabilities in niche areas,nurture local talent and recruit global talent andwork with industry through technology transferand other mechanisms
$4 billion to A*STAR to boost local R&Dcapabilities: to set up key Research Institutes (RIs)and recruit international talent to head up theseinstitutes and labs
A*STAR RIs produced some 6,790 scientificpublications in Science Citation Index andEngineering index journals and filed 739 patents
$2 billion US to Economic Development Board topromote private sector R&D in Singapore
Achieve R&D of 3% of GDP by 2010
Double the jobs in life sciences, environmentaland water technologies and digital media sectorsto 80,000 and triple the value-added to $27 billionby 2015
Figure 10: Singapore’s new S&T Plan 2010

Initiative
Vinnväxt:Regional growththrough dynamicinnovationsystems
The ProVikingprogramme
InstituteExcellenceCentres
IndustrialDevelopmentCentres
Key ActorsProgramme
Overall budget US$
~ $40.74 millionover 10 years
~ $20.50 millionover 5 years
~ $32.3 millionover 10 years
N/A.
~ $41 millionbetween 1997 and 2002
~ $27.2 millionover 12 years
Goals
Stimulate strong systems with qualifiedenvironments for research and development, aswell as regional competitive and dynamic networks,in order to achieve more innovations and lastinggrowth innovation
VINNVÄXT is built around a concept where a fewselected regions receive financing over 10 years andare regularly evaluated in order to secure progress
Support product realization research — productdevelopment, manufacturing, product support andmaintenance in a life-cycle perspective. The mainfocus is on industry with manufacturing and/ordevelopment, operating in Sweden
Create knowledge within areas of strategicimportance to strengthen the competitiveness ofSwedish industry
Exist as the "missing link" that enables co-operationbetween enterprises and other important actors byproviding access to all the resources necessary torun strategic development work
Develop competence, methods, processes andstructures to enhance the professionalism of keyactors in the Swedish innovation system
Increase the amount and efficiency of co-operationbetween research performers, industry and other actors
Activate knowledge (i.e. knowledge transfer andcommercialization of research results)
29
Sweden
Sweden is one of Europe’s innovative leaders, ranking first among the European Union (EU) countries alongwith Finland. In the 2005 European Innovation Survey (EIS), the country displayed above-average performanceon all indicators, with exceptionally strong business R&D expenditures, early stage venture capital and patenting.
Sweden’s investments in education are among the largest in the world relative to the size of the economy. In 2001,total spending on R&D amounted to 4.3% of gross domestic product (GDP), which is the highest level in the OECD.And according to EIS, Sweden continues to pull ahead of the EU trend for public R&D.
The business sector accounts for 78% of total R&D spending, second only to the US. As for research financed by thecentral government, R&D appropriations for the 2003 budget year were kr 23.7 billion SEK ($3.05 billion US).68
The country’s R&D system is dominated by performing sectors, industry and the universities. The extensiveindustry R&D is largely accounted for by the activities of ten multinational industrial groups, led by Ericsson andAstraZeneca. Sweden’s largest and oldest universities are responsible for most of the R&D in the university sector,overseeing various public and private R&D institutions. These universities collectively produce a very highresearch capacity. The country is one of the largest producers of scientific knowledge in the world measured interms of scientific publications per capita. Only Switzerland produced more scientific knowledge per capita thanSweden both in 1986-1990 and in 1991-1995.69
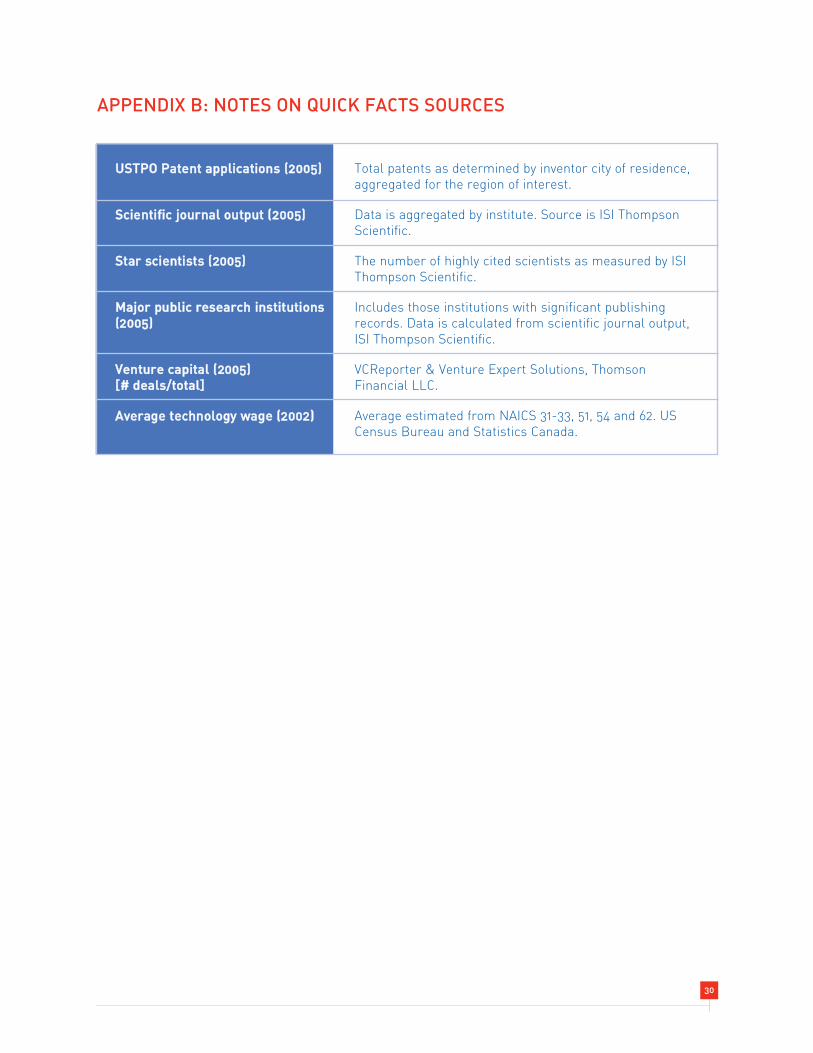
APPENDIX B: NOTES ON QUICK FACTS SOURCES
30
Total patents as determined by inventor city of residence,aggregated for the region of interest.
Data is aggregated by institute. Source is ISI ThompsonScientific.
The number of highly cited scientists as measured by ISIThompson Scientific.
Includes those institutions with significant publishingrecords. Data is calculated from scientific journal output,ISI Thompson Scientific.
VCReporter & Venture Expert Solutions, ThomsonFinancial LLC.
Average estimated from NAICS 31-33, 51, 54 and 62. USCensus Bureau and Statistics Canada.
UUSSTTPPOO PPaatteenntt aapppplliiccaattiioonnss ((22000055))
SScciieennttiiffiicc jjoouurrnnaall oouuttppuutt ((22000055))
SSttaarr sscciieennttiissttss ((22000055))
MMaajjoorr ppuubblliicc rreesseeaarrcchh iinnssttiittuuttiioonnss((22000055))
VVeennttuurree ccaappiittaall ((22000055)) [[## ddeeaallss//ttoottaall]]
AAvveerraaggee tteecchhnnoollooggyy wwaaggee ((22000022))
NOTES1 See N. Low and M. Gertler.2005. ‘Diversity and theEvolution of a Life-Science Innovation System: TheToronto Region in Comparative Perspective’. In D. Wolfeand M. Lucas, Global Networks and Local Linkages.Montreal: McGill-Queen’s University Press, and J.Matuszewski and F. Chevalier (2004) ‘Greater TorontoArea ICT Study’ E&B Data, for discussion of life sciencesand ICT in the Toronto region respectively.
2 ‘Technology intensive industries now account for a fulltwo-thirds of total manufacturing exports among OECDcountries, and in Canada, these industries now account forclose to half. J. Khondaker, 2005. ‘Trends in the technologyintensity of Canadian exports: A comparison with othercountries (III-G)’, Statistics Canada. For internationalstatistics see OECD, STI Outlook 2003. Paris: OECD.
3 Estimate from National Science Foundation. Cited fromSEMATECH News, April 18, 2006. ‘Austin CommunityCollege and SEMATECH Partner with the State of Texas to Launch Nanoelectronics Training Program’.
4 Most of the regions extend beyond any one city, reflectingthe fact that there are often strong functional linkages and interdependencies among firms, institutions andinfrastructure. Stockholm, for example, includes Uppsalaand the surrounding region, Raleigh-Durham includesCary and Chapel Hill, and Toronto includes the GreaterToronto Area, Kitchener-Waterloo, Hamilton andBurlington.
5 Financial Times, July 22/23, 2006. “The great leveler in a rising land”.
6 A. Wolff, T. Howell, Bartlett and R Gadbaw (eds.),Conflict among Nations: Trade Policies in the 1990s, SanFrancisco: Westview Press, 1992, p. 528.
7 Battelle Technology Partnership Practice and SSTI,Laboratories of Innovation, June 2004.
8 According to the study, the top 10 of 51 biotech centersreceived over 60% of NIH funding (2000), 89% of theindustries venture capital (1995 -2001), and 82% of IPOs(1998-2001). J. Cortright and H. Mayer, 2002. Signs of Life:The Growth of Biotechnology Centres in the US, Centre onUrban and Metropolitan Policy, Brookings Institute.
9 This low ranking is partly offset by the fact that Canadaoffers generous R&D support through the tax system asopposed to through subsidies in the form of directspending as do most other OECD. According to recentstatistics from the OECD, for example, direct spendingtowards business R&D amounted to less than 3% of total
business R&D expenditures, compared to approximately6% in Sweden and 11% in the US. Canadian business R&Dis subsidized by approximately 25% through R&D taxcredits, compared to about 6% in the US. Sweden offers no such tax based subsidies to its firms.
10 Research on Canada’s R&D intensity finds three broadfactors influencing relatively low levels of R&D: industrycomposition, and in particular the dependence of Canadaon the resources and automotive sector, the latter of whichis less R&D-intensive; the degree of foreign ownership(foreign subsidiaries typically do not carry out R&Doutside their home markets); and third, the smaller size ofCanadian firms. Smaller firms typically spend less on R&Dthan larger firms. Much of Sweden’s industrial R&D, forexample, is driven by a handful of very large pharmaceuticalfirms. See Aled ab Iorwerth, ‘Canada’s Low Business R&DIntensity: the Role of Industry Composition’, WorkingPaper 2005-03, Department of Finance, Canada.
11 This amount includes allocated funding for CRC. Source:CFI Awards database, CRC and Genome Canadarespectively.
12 See P. K. Wong, 2002. ‘ICT Production and Diffusion inAsia: Digital Dividends or Digital Divide?’, InformationEconomics and Policy, 14 (2): 167-187; and Wong,P.K.(2001), ‘Leveraging Multinational Corporations,Fostering Technopreneurship: The Changing Role of S&TPolicy in Singapore’, International Journal of TechnologyManagement, Vol.22, No. 5/6: 539- 567.
13 D. Finegold, P.K. Wong and T. Cheah. 2004. ‘Adapting a Foreign Direct Investment Strategy to the KnowledgeEconomy: The Case of Singapore’s Emerging BiotechnologyCentre’. European Planning Studies, Vol. 12, No. 7,October 2004.
14 Finegold, et al. 2004.
15 The normal rate is 25.5%. T. Howell. 2003. ‘Competingprograms: Government support for microelectronics’. In C.Wessner (ed.) Securing the Future: Regional and NationalPrograms to Support the Semiconductor Industry, NationalResearch Council, Washington D.C., p. 213.
16 See T. Howell, ‘Competing Programs’, p. 217.
17 S. Steinmo. 2002. ‘Taxation and Globalization:Challenges to the Swedish Welfare State’, ComparativePolitical Studies, Vol. 35, no. 7, pp. 839-862.
31

18 Despite all-time-high profits, the large industrial groupswith activities in Sweden have been reluctant to reinvest in Sweden, which has led to a decline in technologyemployment. See European Commission: Sweden 2004-2005, Annual Innovation Policy Trends and AppraisalReport, European Trend Chart on Innovation.
19 European Commission: Sweden 2004-2005, AnnualInnovation Policy Trends and Appraisal Report, EuropeanTrend Chart on Innovation.
20 POLICOM Corporation, www.policom.com.
21 Ranking from the Centre on Urban and MetropolitanPolicy, Brookings Institute.
22 Angelou Economic Advisors Inc. An Economic Reviewand Forecast 1996-1998, Austin, Texas.
23 An estimate by the Austin Chamber of Commerce citedfrom P. Robbins. 2003. ‘The Town that Won the Pennant: A Short History of Austin’s Economic Development’. TheAustin Environmental Directory.
24 These include Centre for Advanced Computing andCommunications, the Center for Advanced Processing and Packaging Studies, the Center for Integrated PestManagement, Nonwoven Cooperative Research Center, theSilicon Wafer Engineering and Defect Science Center andthe Lymphocite Technology Centre.
25 L. Tornatzky, P. Waugaman, and D. Gray. 2002.Innovation U: New University Roles in a KnowledgeEconomy. Southern Growth Policies Board.
26 US Bureau of Economic Analysis.
27 M. Porter. 2001. Research Triangle, Clusters ofInnovation Initiative, Council on Competitiveness,Washington, D.C.
28 J. Cortright and H. Mayer. 2002. Signs of Life: TheGrowth of Biotechnology Centres in the US, Centre onUrban and Metropolitan Policy, Brookings Institute.
29 See M. Castells and P. Hall. 1994. Technopoles of theWorld: The Making of 21st Century Industrial Complexes.London: Routledge. p. 36, for a discussion on the linksbetween top academics and government officials.
30 J. Cortright and H. Mayer. 2002.
31 R. Kispert. 2004. ‘The R&D Funding Scorecard: FederalInvestments and the Massachusetts Innovation Economy’,Massachusetts Technology Collaborative.
32 R. G. Kispert. 2004. ‘The R&D Funding Scorecard:Federal Investments and the Massachusetts InnovationEconomy’, Massachusetts Technology Collaborative,Innovation Outlook Series.
33 Cortright and Mayer, Table 7.
34 NSF, 2006. Budget Internet Information System.
35 M. Castells and P. Hall. 1994.
36 M. Pugh O’Mara. 2005. Cities of Knowledge: Cold Warscience and the search for the next Silicon Valley, PrincetonUniversity Press, Princeton, NJ.
37 M. Walshok, E. Furtek, C. Lee and P. Windham. 2002.‘Building regional innovation capacity: The San DiegoExperience’, Industry and Higher Education: 27-42.
38 San Diego Regional Economic DevelopmentCorporation, ‘Region needs “grassroots publicity plan”’,Newsletter, June 21, 2006.
39 R. DeVol, P. Wong, K. Junghoon, A. Bedroussian and R. Koepp. 2004. America’s Biotech and Life ScienceClusters: San Diego’s Position and EconomicContributions, Milken Institute, Santa Monica, CA.
40 DeVol et al. 2004.
41 M. Porter. 2001. Council on Competitiveness, MonitorGroup, and On the Frontier, San Diego: Clusters ofInnovation Initiative, Council on Competitiveness,Washington, D.C.
42 Toronto Region Research Alliance, ‘EngagingInnovation’, October 2005.
43 Employment figure from Industry Profiles, GreaterToronto Marketing Alliance. Tax data is from TorontoRegion Research Alliance, ‘Engaging Innovation’.
44 Some of the most important investments were initiallymade by the Department of Defence and later theDepartment of Industry, Trade and Commerce (DITC). See T. Creutzberg 2005. ‘Scalar dimensions of non-market governance in knowledge economies: A look at the microelectronics industry in the Greater TorontoRegion’, Paper from the 2005 CPSA Annual Conference.http://www.cpsa-acsp.ca/papers-2005/Creutzberg.pdf.
45 IC Insights, 2004. ‘Leading Fabless IC Suppliers -2003’.http://www.icinsights.com/news /releases/press20031201.html.
32

46 N. Lowe and M. Gertler. 2005. ‘Diversity and theEvolution of a Life-Science Innovation System: The Toronto Region in Comparative Perspective’. In D. Wolfeand M. Lucas, Global Networks and Local Linkages.Montreal: McGill-Queen’s University Press.
47 Canada. ‘People and Excellence: The Heart of SuccessfulCommercialization’, Volume I: Final Report of the ExpertPanel on Commercialization, 2006. p. 7.
48 See OECD 2002. Territorial Reviews: Canada, Paris:OECD, Chapter 2.
49 Toronto’s major public institutions include those withsignificant scientific publications, and which are recognizedby ISI Thompson Scientific.
50 According to a study by the Boston Consulting Group,the Toronto Region received $69 in per capita fundingfrom the granting councils compared to $95 per capita inVancouver, $85 per capita in Ottawa, $77 per capita inMontreal, and $73 per capita in Calgary. Boston ConsultingGroup. 2005. The Role of the Federal Government in theDevelopment of the Public Research Base in the Toronto Region.
51 Boston Consulting Group. 2005.
52 PriceWaterhouse Coopers. 2004. A Fine Balance: TheImpact of Offshore IT Services on Canada's IT Landscape.
53 Rosenberg D. 2000. Cloning Silicon Valley: the nextgeneration of high-tech hotspots. London: PearsonEducation, p. 129.
54 The New Scientist. ‘India Special: The SiliconSubcontinent’, 15 February 2005.
55 Bangalore’s industrial capabilities actually began todevelop before independence when the British in 1940created Hindustan Aeronautics Limited (HAL) in supportof the war effort. See R. Basant. 2006. ‘Bangalore Cluster:Evolution Growth and Challenges’, Working Paper 2006-05-03. Indian Institute of Management, Ahmedabad, p. 5.
56 A recent empirical study on India’s software sector foundthat the availability of skilled graduates is one of thestrongest factors that accounts for the growth of softwareexports. See A. Arora and S. Bagde ‘The Indian SoftwareIndustry: the Human Capital Story’, DRUID ConferencePaper, May 23, 2006.
57 Basant. 2006, p. 27.
58 T. Howell. 2003. ‘Competing programs: Governmentsupport for microelectronics’. In C Wessner (ed.) Securingthe Future: Regional and National Programs to Support theSemiconductor Industry, National Research Council.
59 E. Schumann. 1997. ‘China on Fast Track For BuildingIC Capacity’, Vol. 10, No. 2, SEMI.
60 Y. Zhongyu. 2005. China Semiconductor IndustryAssociation, November, 2005. http://iisdb.stanford.edu/evnts/4307/Yu_Zhongyu_CSIA_slides.pdf.
61 Albany Nanotech is the name given to describe acoordinated program undertaken by the State of New York to establish the Albany metropolitan area as a globalcenter for the development and production of the nextgenerations of semiconductor devices. Commercialsemiconductor devices are beginning to offer sub-100nanometre feature sizes, and it is generally thought that the semiconductor industry will need to utilize nano-engineering to develop new methods of production thatwill yield even higher levels of performance.
62 M. Johnson, ‘Advanced Micro Devices Is ConsideringBuilding a $3.5 Billion Chip Plant in Upstate New York’Canadian Business Online. June 20, 2006.
63 Office of Science And Technology Policy. 2006. FY 2007Federal Research and Development Budget Presentation,Executive Office of the President, Washington D.C.
64 M. Crow and B. Bozeman. 1998. Limited by Design R & DLaboratories in the U.S. National Innovation System. NewYork: Columbia University Press.
65 K. Hill. 2006. ‘Universities in the U.S. NationalInnovation System’, Arizona State University’s Productivityand Prosperity Project.
66 OECD. 2006. Economic Survey Canada. Paris: OECD.
67 Statistics Canada. 2005. Federal Scientific Activities, 2004 – 2005. Statistics Canada, Ottawa.
68 VINNOVA, The Swedish National Innovation System:1970–2003.
69 VINNOVA. The Swedish National Innovation System:1970–2003.
33

MaRS Centre, Heritage Building 101 College Street, Suite HL30, Toronto ON M5G 1L7,
Tel/ 416 673-6670, Fax/ 416 673-6671
Email/ [email protected] Website/ www.trra.ca
trra.ca Engaging Innovation.


