20
Hugo Denier van der Gon & Jeroen Kuenen With emphasis on recent work @ TNO Improvements to metal emission estimates
| Date post: | 16-Dec-2015 |
| Category: |
Documents |
| Upload: | hope-watkins |
| View: | 216 times |
| Download: | 0 times |

Hugo Denier van der Gon & Jeroen Kuenen
With emphasis on recent work @ TNO
Improvements to metal emission estimates

11 May 2009Improvements to metal emission estimates2
Contents
• Background
• Case I - Metal contents of diesel and petrol fuel
• Conclusions fuel analysis
• Case II - Copper from brake wear
• Implications for EF guidebook?
• Outlook

11 May 2009Improvements to metal emission estimates3
Background (heavy) metals (HM)
• Elevated presence and availability of HM in ecosystems and the urban environment due to human activities
• HM (e.g. lead, cadmium) are toxic causing adverse health effects• Main anthropogenic sources of heavy metals are Industrial
sources (e.g., mining activities, foundries and smelters) & Diffuse sources (e.g., combustion by-products, traffic, etc..)
• Considerable attention over the last decades (Pb, Hg, Cd)
• In recent years two European HM inventories: TNO (Denier van der Gon et al.) and ESPREME (Reiss et al.) – both presented at TFEIP meetings in 2005 & 2006.
11 May 2009Improvements to metal emission estimates4
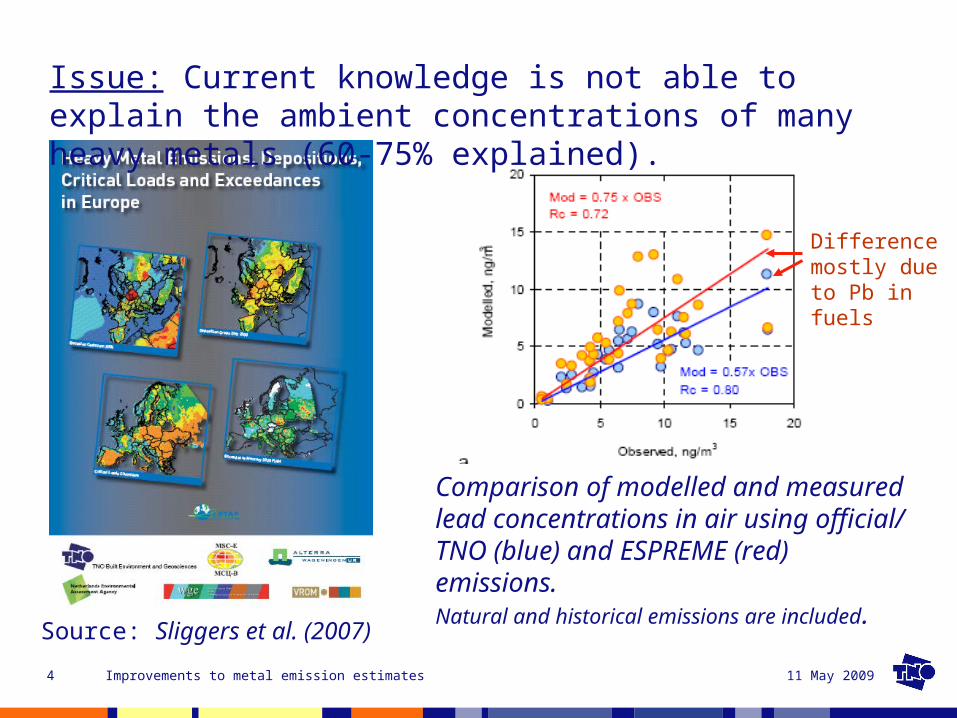
Comparison of modelled and measured lead concentrations in air using official/ TNO (blue) and ESPREME (red) emissions. Natural and historical emissions are included.
Issue: Current knowledge is not able to explain the ambient concentrations of many heavy metals (60-75% explained).
Source: Sliggers et al. (2007)
Difference mostly due to Pb in fuels
11 May 2009Improvements to metal emission estimates5
0
1000
2000
3000
4000
5000
6000
7000
8000
9000
10000
1970 1972 1974 1976 1978 1980 1982 1984 1986 1988 1990 1992 1994 1996 1998 2000 2002 2004
ton
ne
s o
f P
b
OtherCorrectionRoad TransportMSC-E
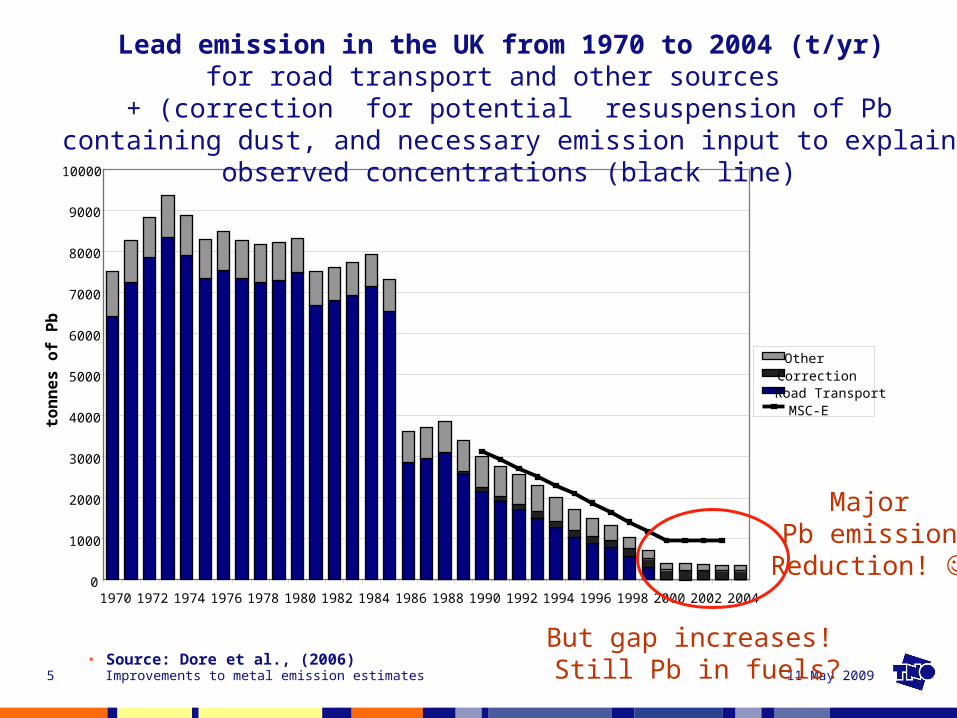
Lead emission in the UK from 1970 to 2004 (t/yr) for road transport and other sources
+ (correction for potential resuspension of Pb containing dust, and necessary emission input to explain observed concentrations (black line)
• Source: Dore et al., (2006)
MajorPb emissionReduction!
But gap increases! Still Pb in fuels?

11 May 2009Improvements to metal emission estimates6
Case I - Pb in petrolThe problem:
• Leaded fuels have been used for a long period, clear adverse health effects have been reported. As a result leaded fuels have been banned in Europe.
• Lead emission from unleaded road transport fuel combustion has been suggested as a missing source to explain the discrepancy between measured and modeled Pb concentration in air (Pacyna et al., Atmospheric Environment 2007, 41: 8557-8566.)
• Reason: Pb is present in the crude and even Pb contents below the EC limit value (<5mg/l) can be a significant source give the large quantities of petrol consumed
• Is this realistic?

11 May 2009Improvements to metal emission estimates7
Study: Metal contents of diesel and petrol fuel sold on the European Market
• Objective: to obtain high quality analytical data on the concentrations of dissolved metals in petrol and diesel as sold in nine European countries.
• Methodology: Fuel samples collected at service stations - The distribution of fuel samples selected by CONCAWE with sensitivity to various issues in different Member States, including:• Petrol and diesel fuel consumption (also as % of EU-27),• Penetration of biofuel components,• Extremes in climactic conditions, and• Supply and distribution logistics.
Reference: Denier van der Gon et al., Metal contents of diesel and petrol fuel sold on the European Market, TNO report 2009 Final draft submitted to CONCAWE, status not final yet.

11 May 2009Improvements to metal emission estimates8
ES5
20
PL55
NL55
DE1020
IT1015
UK1515
FR1020
SE55
FI55
CountryNr. of Petrol samplesNr. Of Diesel samples
ES5
20
PL55
NL55
DE1020
IT1015
UK1515
Fuel consumption in the covered countries represents over 80% of theconsumption in the EU-27.

11 May 2009Improvements to metal emission estimates9
Metals analyzed in transport fuels
• AQ interest defined as – included in UNECE HM Protocol• Metals outside AQ interest not further discussed here • Note: Finnish data not included in presented results due to possible contamination – coverage of EU petrol and diesel still > 80%
Air Quality (AQ) perspective Fuel Quality (FQ) interest 1. As - Arsenic 10. Ag - Silver 2. Cd - Cadmium 11. Al - Aluminium 3. Cr - Chromium 12. B - Boron 4. Cu - Copper 13. Ba - Barium 5. Hg - Mercury 14. Ca - Calcium 6. Ni - Nickel 15. Fe - Iron 7. Pb - Lead 16. K - Potassium 8. Se - Selenium 17. Mg - Magnesium 9. Zn - Zinc 18. Mn - Manganese
19. Mo - Molybdenum 20. Na - Sodium 21. Sn - Tin 22. Ti - Titanium 23. V - Vanadium 24. Ce - Cerium 25. Au – Gold
26. Pt - Platinum

11 May 2009Improvements to metal emission estimates10
Just to prove we do have instruments…
Inductively coupled plasma –mass spectroscopy X2 QAPEX ICP-MS

11 May 2009Improvements to metal emission estimates11
Examples of results - I
• Dot = average value; the bar indicates high-low value (range)• All Pb values in ppb (ug/kg) range!• The Pacyna et al. paper (AE, 2007) used mg/kg range – overestimated!
Petrol 206Pb
0
2
4
6
8
10
12
14
Fr GE IT NL PL SE Sp UK EU total
country
con
cen
trat
ion
(p
pb
)

11 May 2009Improvements to metal emission estimates12
Examples of results - II
• Considerable range in Cu values but average values are below 10 ug/kg
• Note: guidebook EF is currently 1700 ug/kg (to be discussed later)
Petrol 65Cu
0
5
10
15
20
25
30
35
Fr GE IT NL PL SE Sp UK EU total
country
con
cen
trat
ion
(p
pb
)

11 May 2009Improvements to metal emission estimates13
Fr DE IT NL PL SE ESUK
Cd
Pb
CuCr
ZnFe
0
10
20
30
40
50
60
70
80
Co
nce
ntr
atio
n (
pp
b)
Country
Cd
Pb
Cu
Cr
Zn
Fe
Element
Average metal content of transport fuel by country
Fr DE IT NL PL SE ESUK
Cd
Pb
CuCr
ZnFe
0
10
20
30
40
50
60
70
80
Co
nc
entr
atio
n (
pp
b)
Country
Cd
Pb
Cu
Cr
Zn
Fe
Element
Diesel Petrol
- All concentrations in ppb (ug/kg) range- No specific country pattern- Petrol slightly higher than diesel but essentially comparable

11 May 2009Improvements to metal emission estimates14
Summary: Average metal contents in EUMetal Petrol Diesel
µg/kg fuel
Cadmium 0.2 < 0.05
Lead 1.6 0.5
Mercury 8.7 < 5.3
Arsenic 0.3 < 0.1
Copper 4.5 5.7
Chromium 6.3 8.5
Nickel 2.3 0.2
Selenium 0.2 < 0.1
Zinc 33 18
Concentrations of the priority heavy metals (Cd, Hg, Pb) and other metals (As, Cu, Cr, Ni, Se and Zn) listed in the UNECE Heavy metal protocol in road transport fuels are currently low (below 10 ug/kg), Zn
is slightly elevated but still low
Implications?To be discussed…

11 May 2009Improvements to metal emission estimates15
Case II: Brake wear, an important source for particulate copper
Brake wear generates brake lining particles, which were until now not accounted for in emission inventories for copper because EFs were old and based on asbestos brake pads.
• We assessed the importance of brake wear to explain atmospheric copper concentrations.
• We also used preliminary fuel analysis measurements to reassess the EF for transport fuel combustion
• Conclusion: fuel combustion no longer important, brake pads are dominating source in EU
Reference: Denier van der Gon et al., A revised estimate of copper emissions from road transport in UNECE-Europe and its impact on predicted copper concentrations, Atmospheric Environment, Volume 41, 8697-8710, 2007

11 May 2009Improvements to metal emission estimates16
Copper content of brake pads and linings
Copper content(% wt)
Westerlund (2001)
1.5-2.7 HDV- Volvo
0.01 HDV-Scania
11.8 New passenger cars (1997) - front
9.2 New passenger cars (1997) - rear
7.2 Olda) passenger cars-front
5.1 Olda) passenger cars-rear
This type of data combined with brake wear PM emission factors gives the emission of your component of study
(here: copper)
Elevation should be visible in vicinity of the source:

11 May 2009Improvements to metal emission estimates17
Copper concentration of ambient PMconfirms source relevance
Switzerland
0
10
20
30
40
50
60
70
Rural above 1000m Basel, suburban Zürich, courtyard,City centre
Bern, city centrekerbside
Cu
(n
g/m
3)
PM2.5
PM2.5-10
Netherlands
0
5
10
15
20
25
30
35
Coastalbackground
Ruralbackground
AmsterdamUrban
background
RotterdamHighway
AmsterdamStreet
Cu
(n
g/m
3)
PM2.5
PM2.5-10
11 May 2009Improvements to metal emission estimates18
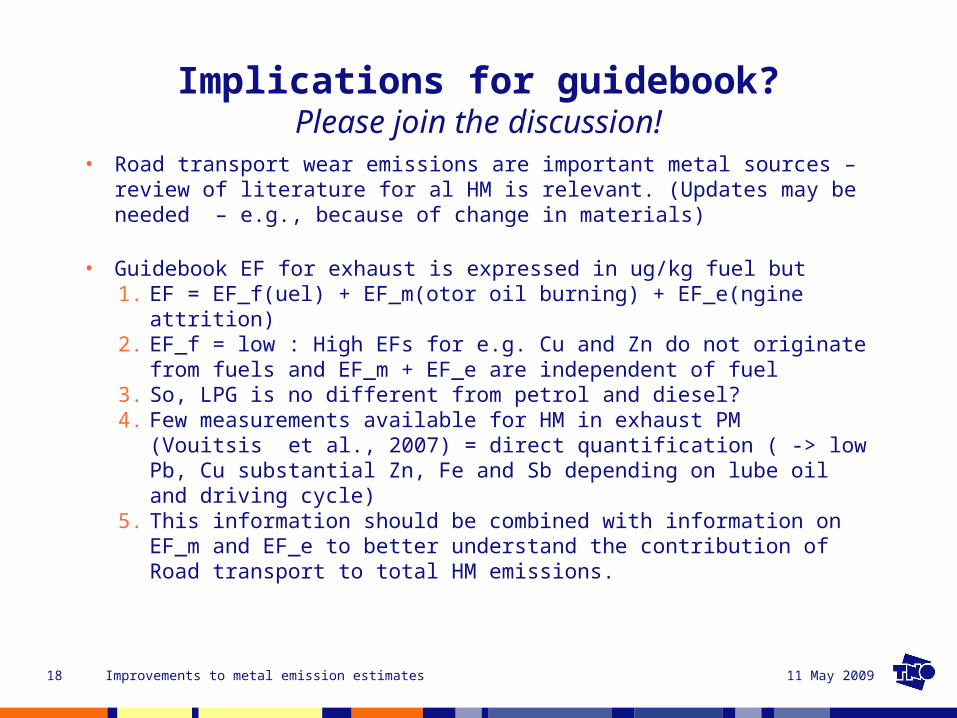
Implications for guidebook?Please join the discussion!
• Road transport wear emissions are important metal sources –review of literature for al HM is relevant. (Updates may be needed – e.g., because of change in materials)
• Guidebook EF for exhaust is expressed in ug/kg fuel but1. EF = EF_f(uel) + EF_m(otor oil burning) + EF_e(ngine attrition)2. EF_f = low : High EFs for e.g. Cu and Zn do not originate from fuels
and EF_m + EF_e are independent of fuel3. So, LPG is no different from petrol and diesel?4. Few measurements available for HM in exhaust PM (Vouitsis et
al., 2007) = direct quantification ( -> low Pb, Cu substantial Zn, Fe and Sb depending on lube oil and driving cycle)
5. This information should be combined with information on EF_m and EF_e to better understand the contribution of Road transport to total HM emissions.

11 May 2009Improvements to metal emission estimates19
Outlook• Through identification of major sources and uncertainties for a particular
metal or source hypothesises can be formulated• These can be verified (e.g. Cu from brake wear) or falsified (e.g., Pb
from unleaded petrol)• This is progress! Accuracy increases, uncertainty reduces.
• Information from emission inventories and model results (regional under- / overestimation) to define the “candidates” for further investigation.
• Ex. 1 - metal contents of representative lube oils used in Europe, lube oil losses during driving and fraction of the lost lube oil burned would be a next step in dissecting the exhaust metal emissions and tracing the origin of measured metals in exhaust PM.
• Ex. 2 – Diffuse industrial emissions?
• Difficult to get on the research agenda….. (Yes, we always complain a bit…..)

11 May 2009Improvements to metal emission estimates20
AcknowledgementsThe project Metal contents of fuels sold on the European market was
funded by CONCAWE.
• Contact: [email protected]@tno.nl


