The Stabilizing Effects of Sesame Oil Extraction Technologies on Seasonal Fluctuations in Food Consumption and Nutritional Status of Rural Farming Households in The Gambia Stephen Gregory Hull Thesis Submitted to the Faculty of the Virginia Polytechnic Institute and State University in partial fulfillment of the requirements for the degree of Master of Science in Human Nutrition, Foods and Exercise William E. Barbeau, Chair Irma Silva-Barbeau Marilyn S. Prehm May 4, 1998 Blacksburg, Virginia Keywords: food security, The Gambia, appropriate technology Copyright 1998, Stephen G. Hull
Transcript
The Stabilizing Effects of Sesame Oil Extraction Technologies on SeasonalFluctuations in Food Consumption and Nutritional Status of Rural Farming
Households in The Gambia
Stephen Gregory Hull
Thesis Submitted to the Faculty of theVirginia Polytechnic Institute and State University
in partial fulfillment of the requirements for the degree of
Master of Sciencein
Human Nutrition, Foods and Exercise
William E. Barbeau, ChairIrma Silva-BarbeauMarilyn S. Prehm
May 4, 1998Blacksburg, Virginia
Keywords: food security, The Gambia, appropriate technology
Copyright 1998, Stephen G. Hull
The Stabilizing Effects of Sesame Oil Extraction Technologies on SeasonalFluctuations in Food Consumption and Nutritional Status of Rural Farming
Households in The Gambia
Stephen Gregory Hull
(ABSTRACT)
It has been well documented that women and children in The Gambia are particularly vulnerableto malnutrition. The combination of heavy labor demands on women and a weaning diet low incalories takes its toll on women and children during the pre-harvest lean season. In 1995, theSmall-Scale Sesame Oil Production project introduced an inexpensive, manual technology foredible oil extraction, called the ram press, to women in The Gambia. The overall aim of theproject was to improve household nutritional security through the adoption of the ram press bywomen sesame growers.
A 13-month study was conducted to evaluate the success of the Small-Scale Sesame OilProduction project. The study involved 120 rural households: 40 households with access tomotorized expeller technology (Expeller group) for sesame oil extraction, 37 households withaccess to manual ram press technology (Press group), and 43 households with access to bothtechnologies (Combination group). Twenty-four hour recalls, food frequency data,anthropometric measurements, and production data were obtained at the baseline and at the post-harvest, peak sesame oil-pressing, and pre-harvest lean seasons.
At the baseline, women in the Expeller group had higher mean intakes of kilocalories than thosein the Press and Combination groups. After introduction of the ram press, the Press andCombination women reported consistently higher intakes of kilocalories than the Expellerwomen at all seasons, with the largest differences at the peak oil-pressing and pre-harvest leanseasons.
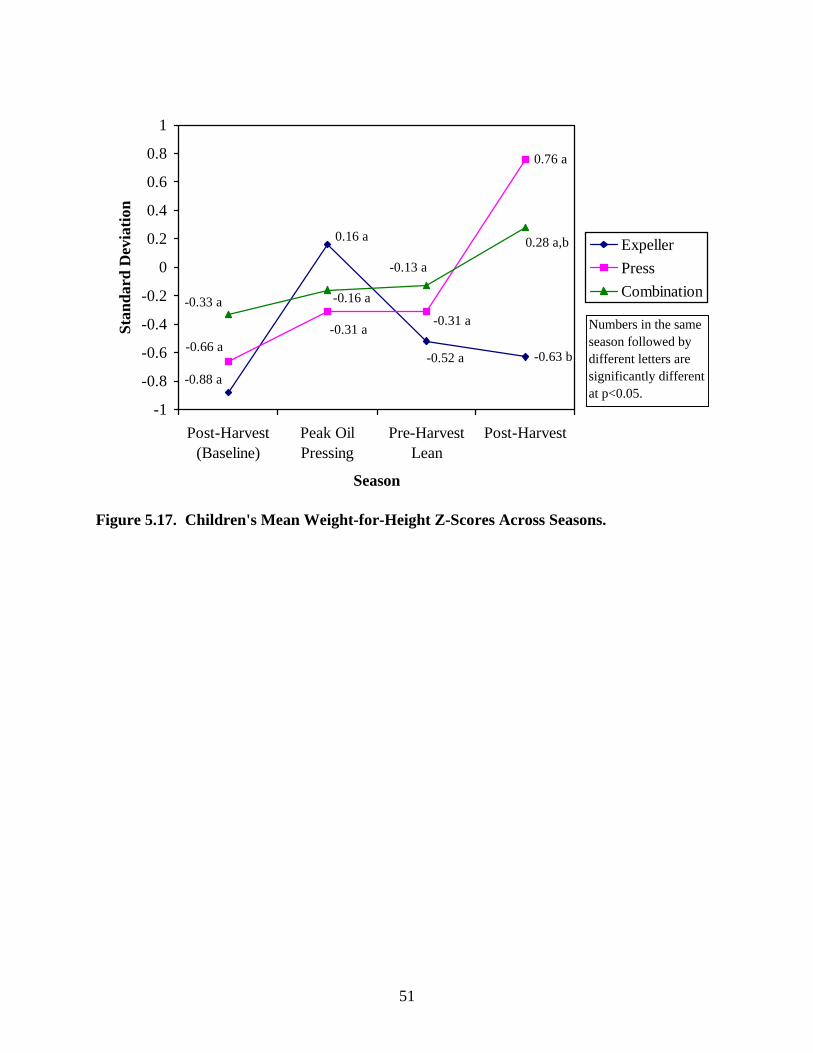
At the baseline, the consumption of kilocalories for Expeller children was greater than that of theCombination and Press children. After introduction of the ram press, this trend was reversed andthe intake of kilocalories for Combination and Press children was greater than that of Expellerchildren at all other seasons. The Expeller children exhibited a marked increase in weight-for-height z-scores at the peak oil-pressing season that decreased to near baseline levels thereafter.The Combination and Press children exhibited a steady increase in weight-for-height z-scoresacross seasons except for the pre-harvest lean season when their scores leveled off.
These results indicate that women and children in households with access to ram presstechnology experience much less of a seasonal fluctuation in food consumption than thosewithout ram press technology. Findings of this study also indicate that when women are givenchoices as to which technology is best for them, they will maximize their benefits from theavailable technologies.
iii
ACKNOWLEDGEMENTS
I would like to gratefully acknowledge the Thrasher Research Fund for their funding of the"Small Scale Sesame Oil Production - A Means To Improved Child Nutrition Security in TheGambia" project (THRASHER AWARD # 02903-4 and US Agency for InternationalDevelopment, Bureau of Global Programs, Field Support and Research, Office of Health andNutrition, Food Security and Nutrition Monitoring Project (IMPACT), Contract No. DAN-5110-C-00-0013-00, TO 417).
I would like to thank each of my committee members for guiding me through this process: Dr.William E. Barbeau for serving as my committee chair, his insight and guidance during all stagesof my thesis was invaluable; Dr. Irma Silva-Barbeau for giving me the opportunity to work withher on this project, her experience and knowledge of international issues has challenged me as astudent and a nutritionist; and Dr. Marilyn Prehm for her guidance as an advisor, her continualencouragement throughout my graduate school experience is greatly appreciated. I would alsolike to thank Dr. Robert Frary for his guidance in statistical analysis.
I am indebted to several members of the department of Human Nutrition, Foods and Exercise:Dr. Eleanor Schlenker, for her continual support of my studies and her genuine interest in mywork; Dr. Ann Hertzler, for treating me as a colleague (not to mention loaning a computer to mefor a year); Dr. Cathy Reynolds, for allowing me to share space in her lab and always beingwilling to help out a student; Ms. Sherry Saville and Ms. Sherry Terry for always being helpfulno matter what time of day or what sort of challenge I brought them; and Lynne Metzler fordoing and excellent job of coding the dietary data.
I would like to thank all members of the Gambia Food and Nutrition Association (GAFNA) whotreated me as one of their own during my stay in The Gambia. I would especially like to thankKinday Samba-Ndure and Kebba Jome for their insight during my time at GAFNA. I wasblessed by spending time with Mrs. Adele Njie who was willing to share her wisdom as a homeeconomist with me during my stay in The Gambia.
I would like to thank my parents, Mr. and Mrs. Eugene H. Hull, who have made real sacrifices inorder for me to attend graduate school. I would not have been able to complete my course ofstudy without their help.
Lastly, I would like to thank the Lord Jesus Christ for providing me with the undeservedopportunity to attend graduate school and for blessing me with a knowledge of himself.
iv
TABLE OF CONTENTS
ACKNOWLEDGEMENTS .............................................................................................................. iiiTABLE OF CONTENTS.................................................................................................................. ivLIST OF TABLES ............................................................................................................................ viLIST OF FIGURES........................................................................................................................... vii
CHAPTER 2 : LITERATURE REVIEW ......................................................................................... 4Food Consumption ...................................................................................................................... 4Availability of Vitamin A ........................................................................................................... 5Agricultural Work ....................................................................................................................... 5Child Care ................................................................................................................................... 6Weight Loss................................................................................................................................. 6Nutritional Status ........................................................................................................................ 7Implications for Well-Being........................................................................................................ 8Potential of Supplementation ...................................................................................................... 9Project Background..................................................................................................................... 9Ram Press Technology................................................................................................................ 10
CHAPTER 3 : PURPOSE AND OBJECTIVES............................................................................... 12
CHAPTER 5 : RESULTS ................................................................................................................. 21Study Population ......................................................................................................................... 21Dietary Intake of Households...................................................................................................... 28Dietary Intake of Women............................................................................................................ 34Dietary Intake of Children........................................................................................................... 40Nutritional Status of Women ...................................................................................................... 49Nutritional Status of Children ..................................................................................................... 50Household Oil Production and Availability................................................................................ 54
APPENDIX A. Standardized Gram Weight Measures of Common Household Cooking andEating Utensils. ........................................................................................................................... 64
APPENDIX B. Standardized Gram Weight Measures of Handful Sizes for Men, Women, andChildren....................................................................................................................................... 65
APPENDIX C. Glossary of Mandinka and Wolof Food Names with Their English Equivalents. .. 66APPENDIX D. Standardized Recipes of All Commonly Consumed Food Mixtures. ..................... 67APPENDIX E. Codebook. ................................................................................................................ 71APPENDIX F. Questionnaire. .......................................................................................................... 74APPENDIX G. Protocol.................................................................................................................... 87APPENDIX H. Adult Equivalents Used to Adjust Household Consumption Measures. ................. 92APPENDIX I. Child Consumption Units Used to Adjust Children's Consumption Measures. ....... 93
VITA ................................................................................................................................................. 94
vi
LIST OF TABLES
Table 5.1 General Characteristics of the Household at the Baseline. ............................................... 21Table 5.2. Marital Status of the Target Women at the Baseline. ..................................................... 21Table 5.3. Head of the Household at the Baseline. .......................................................................... 22Table 5.4. Ethnic Group of the Target Women at the Baseline. ...................................................... 22Table 5.5. General Characteristics of Target Women at the Baseline. ............................................ 23Table 5.6. Water Source for the Household at the Baseline. ........................................................... 23Table 5.7. Crops That Were Grown by Target Women at the Baseline. ......................................... 24Table 5.8. Livestock Production and Income Generation of Target Women at the Baseline.......... 25Table 5.9. General Characteristics of Target Children in the Study Population at the Baseline. .... 26Table 5.10. Frequency of Children's Illnesses During the Last 7 Days at the Baseline................... 27Table 5.11. Mean Household Availability of Kilocalories (per Adult Equivalent) Across
Seasons........................................................................................................................... 28Table 5.12. Mean Household Availability of Protein (grams per Adult Equivalent) Across
Seasons........................................................................................................................... 29Table 5.13. Mean Household Availability of Carbohydrates (grams per Adult Equivalent)
Across Seasons............................................................................................................... 30Table 5.14. Mean Household Availability of Fat (grams per Adult Equivalent) Across Seasons... 31Table 5.15. Mean Household Availability of Vitamin A (Retinol Equivalents per Adult
Equivalent) Across Seasons. .......................................................................................... 32Table 5.16. Mean Household Consumption of Oil (liters per Adult Equivalent) During the Last 7
Days Across Seasons. .................................................................................................... 33Table 5.17. Women's Mean Intake of Kilocalories Across Seasons................................................ 34Table 5.18. Women's Mean Intake of Protein (g) Across Seasons. .................................................. 36Table 5.19. Women's Mean Intake of Carbohydrates (g) Across Seasons. ..................................... 37Table 5.20. Women's Mean Intake of Fat (g) Across Seasons......................................................... 38Table 5.21. Women's Mean Intake of Vitamin A (RE) Across Seasons........................................... 39Table 5.22. Children's Mean Intake of Kilocalories Across Seasons Adjusted for Age and Sex.... 40Table 5.23. Children's Mean Intake of Protein (g) Across Seasons Adjusted for Age and Sex. ...... 42Table 5.24. Children's Mean Intake of Carbohydrates (g) Across Seasons Adjusted for Age and
Sex.................................................................................................................................. 44Table 5.25. Children's Mean Intake of Fat (g) Across Seasons Adjusted for Age and Sex.............. 45Table 5.26. Children's Mean Intake of Vitamin A (RE) Across Seasons Adjusted for Age and
Sex.................................................................................................................................. 47Table 5.27. Mean Body Mass Index (kg/m2) of Non-Pregnant/Lactating Women Across
Seasons........................................................................................................................... 49Table 5.28. Children's Mean Weight-for-Height Z-Scores Across Seasons. ................................... 50Table 5.29. Children's Mean Weight-for-Age Z-Scores Across Seasons. ....................................... 52Table 5.30. Children's Mean Height-for-Age Z-Score Across Seasons............................................ 54Table 5.31. Length of Oil Availability and Time of Initial Purchase in Months in Relation to the
Peak Oil-Pressing Season of March............................................................................... 54
vii
LIST OF FIGURES
Figure 1.1. Map of The Gambia....................................................................................................... 2Figure 4.1. Timeline of Project Implementation. ............................................................................. 14Figure 5.1. Mean Household Availability of Kilocalories Across Seasons. .................................... 28Figure 5.2. Mean Household Availability of Protein Across Seasons. ............................................. 29Figure 5.3. Mean Household Availability of Carbohydrates Across Seasons. ................................ 30Figure 5.4. Mean Household Availability of Fat Across Seasons. .................................................. 31Figure 5.5. Mean Household Availability of Vitamin A Across Seasons........................................ 32Figure 5.6. Mean Household Consumption of Oil During the Last 7 Days Across Seasons............ 33Figure 5.7. Women's Mean Intake of Kilocalories Across Seasons................................................. 35Figure 5.8. Women's Mean Intake of Protein Across Seasons. ....................................................... 36Figure 5.9. Women's Mean Intake of Carbohydrates Across Seasons............................................. 37Figure 5.10. Women's Mean Intake of Fat Across Seasons. ............................................................ 38Figure 5.11. Women's Mean Intake of Vitamin A Across Seasons. ................................................. 39Figure 5.12. Children's Mean Intake of Kilocalories Across Seasons Adjusted for Age and Sex... 41Figure 5.13. Children's Mean Intake of Protein Across Seasons Adjusted for Age and Sex............ 43Figure 5.14. Children's Mean Intake of Carbohydrates Across Seasons Adjusted for Age and
Sex.................................................................................................................................. 44Figure 5.15. Children's Mean Intake of Fat Across Seasons Adjusted for Age and Sex. ................. 46Figure 5.16. Children's Mean Intake of Vitamin A Across Seasons Adjusted for Age and Sex. .... 48Figure 5.17. Children's Mean Weight-for-Height Z-Scores Across Seasons................................... 51Figure 5.18. Children's Mean Weight-for-Age Z-Scores Across Seasons....................................... 53
1
CHAPTER 1: INTRODUCTION
The climate of tropical regions is characterized by dramatic seasonal fluctuations in rainfall. Inmost tropical regions, the year can be described in terms of the rainy season and the dry season.In West Africa, most countries experience a rainy season that lasts about 3 months (beginning inJuly and ending in October) and is followed by a dry season characterized by 9 to 10 months ofless than 4 inches of rain per month. In rural areas, the dependence of agricultural production onthe rainy season results in seasonal fluctuations in agricultural production, the demand for laborin agriculture, and food supply. These factors combine to produce seasonal changes innutritional status, morbidity, and mortality (Chambers et al, 1981)1.
Shortages in food supply occur when food stocks from last year's harvest begin to run out justbefore the current year’s crop is harvested. This is referred to as the pre-harvest lean season. Ina review of studies on seasonal intake (many carried out in West Africa), Annegers (1973)2
found that the highest energy intakes occurred during the November/December post-harvestseason and the lowest intakes occurred during the July/August pre-harvest lean season. Thisyearly cycle of low food intakes in the pre-harvest lean season and high food intakes in the post-harvest season was noted in The Gambia as early as 1953 and has been reported as recently as1992 (ICN Focal Point, 1992)3.
Distinct rainy and dry seasons lead to seasonal variations in labor and energy requirements. Ashort rainy season reduces the optimal time for plant growth and forces farmers to engage inintensive bouts of agricultural labor. In a review by Teokul et al (1986)4, the authors reportedthat in Mali, adult women work in the fields 5 hours per day in the rainy season and not at all inthe dry season. Women in Burkina Faso followed a similar pattern, working 3.7 hours per day inthe rainy season and not at all in the dry season.
The combination of a decreased food supply and an increased labor demand during the pre-harvest lean season results in a decreased nutritional status. Seasonal weight loss during the pre-harvest lean season followed by weight gain in the post-harvest season is the rule for adultsliving in rural areas of developing countries (Teokul et al, 1986)5. Children are also victims ofthe pre-harvest lean season both directly and indirectly. Children may experience growthfaltering during the rainy season and catch-up growth during the dry season. Child mortalityrates may be higher in the rainy season. Children born during the pre-harvest lean season aremore likely to have a low birth weight that those born in the dry season (Prentice and Cole,1994)6.
1 Chambers R, Longhurst R, Pacey A. Seasonal Dimensions to Rural Poverty. Frances Pinter Limited. London,Great Britain. 1981.2 Annegers JF. Seasonal Food Shortages in West Africa. Ecology of Food and Nutrition. 1973;2:251-7.3 ICN Focal Point. The Gambia Nutrition Country Paper for the International Conference on Nutrition. Republic ofThe Gambia, Ministry of Health, Nutrition Unit. 1992.4 Teokul W, Payne P, Dugdale A. Seasonal Variations in Nutritional Status in Rural Areas of Developing Countries:A Review of the Literature. Food and Nutrition Bulletin. 1986;8(4):7-10.5 Teokul W, Payne P, Dugdale A. Seasonal Variations in Nutritional Status in Rural Areas of Developing Countries:A Review of the Literature. Food and Nutrition Bulletin. 1986;8(4):7-10.6 Prentice AM and Cole TJ. Seasonal Changes in Growth and Energy Status in the Third World. Proceedings of theNutrition Society. 1994;53:509-19.
2
The Gambia
The Gambia, one of the smallest countries in West Africa, occupies a narrow strip of land onboth sides of the River Gambia and is bordered on three sides by Senegal (see Figure 1.1). Thenational economy is dominated by agriculture that employs about 85 percent of the activepopulation. Agriculture is based on the cultivation of groundnuts, rice, millet, sorghum, andmaize. Groundnuts are the main agricultural commodity, comprising up to 37 percent of thegross national product (GNP) (Webb, 1989)7. The Gambia is one of the poorest countries inWest Africa with a GNP per capita of US $220 and produces only 70 percent of its own foodrequirements. The per capita caloric intake is estimated at 86 percent of energy requirements,and the per capita protein consumption is estimated at 51 g per day (ICN Focal Point, 1992)8.
Figure 1.1. Map of The Gambia9.
7 Webb P. Intrahousehold Decisionmaking and Resource Control: The Effects of Rice Commercialization in WestAfrica. International Food Policy Research Institute. February, 1989.8 ICN Focal Point. The Gambia Nutrition Country Paper for the International Conference on Nutrition. Republic ofThe Gambia, Ministry of Health, Nutrition Unit. 1992.9 http://www.gambia.com/history/images/gambiamap_big.gif
3
Women in The Gambia have a life expectancy at birth of 43 years and a maternal mortality rateof 10.5 deaths per 1000 deliveries or more than twice the average rate for developing countries(INC Focal Point, 1992)10. With an infant mortality rate (IMR) of 142, The Gambia has childmortality rates that are among the highest in West Africa when compared to other countries ofsimilar size and GNP. Child mortality rates follow seasonal fluctuations with the highest rates ofmortality during the rainy season. In a 1982-1983 study, 71 percent of child deaths in rural areasoccurred during the 6-month rainy season (ICN Focal Point, 1992)11. The National NutritionSurveillance Program of the Nutrition Unit, Ministry of Health of The Gambia estimates that inthe dry and rainy seasons, respectively, 12 and 18 percent of children are malnourished (< 90percent of the median weight-for-height). In a pilot study conducted by the Nutrition Unit of theGambian Ministry of Health, 40 percent of children surveyed were suffering from chronicmalnutrition that is an indicator of chronic dietary energy deficiency (ICN Focal Point, 1992)12.
Growth faltering in Gambian children becomes increasingly evident after 3 months of age whensupplementary foods are introduced (ICN Focal Point, 1992)13. This is partially due to theweaning practices of Gambian mothers. Most children (84.8 percent) are weaned by the age of18-24 months and over half of infants in The Gambia (53.5 percent) are receiving supplementaryfoods by the age of 3 months. The traditional porridge (pap), commonly made from millet, ispopular with most mothers as a child's first food; however, it has a high water content and is lowin calories (Semega-Janneh, 1991)14. Children in rural parts of the country do not fare as well astheir urban counterparts as indicated by a higher infant mortality rate, a lower average dailycaloric consumption, a higher percentage of calories from cereals, and a lower percentage ofcalories from oil (Harpham, 1996)15.
Prentice et al (1981)16 found that during the dry season, infants were born at an average of 89percent of expected weight-for-age. They showed rapid catch up growth until they reached anaverage of 98 percent of expected weight-for-age at 3 months (the mean age for introduction ofweaning foods), and their growth rate decreased slightly thereafter. In the rainy season,however, infants progressed relative to standard growth curves for the first 3 months of life andthen there was a rapid deterioration in nutritional status. This results in high mortality ratesamong children under 5 years of age in rural areas, especially during the rainy season (ICN FocalPoint, 1992)17.
10 ICN Focal Point. The Gambia Nutrition Country Paper for the International Conference on Nutrition. Republic ofThe Gambia, Ministry of Health, Nutrition Unit. 1992.11 ICN Focal Point. The Gambia Nutrition Country Paper for the International Conference on Nutrition. Republic ofThe Gambia, Ministry of Health, Nutrition Unit. 1992.12 ICN Focal Point. The Gambia Nutrition Country Paper for the International Conference on Nutrition. Republic ofThe Gambia, Ministry of Health, Nutrition Unit. 1992.13 ICN Focal Point. The Gambia Nutrition Country Paper for the International Conference on Nutrition. Republic ofThe Gambia, Ministry of Health, Nutrition Unit. 1992.14 Semega-Janneh I. Infant and Young Child Feeding Practices in The Gambia: With Emphasis on Breast-Feeding.Republic of The Gambia, Ministry of Health, Nutrition Unit. June, 1991.15 Harpham T. Urban Health in The Gambia: A Review. Health and Place. 1996;2(1):45-9.16 Prentice AM, Whitehead RG, Roberts SB, Paul AA. Long-Term Energy Balance in Child-Bearing GambianWomen. The American Journal of Clinical Nutrition. 1981;34:2790-99.17 ICN Focal Point. The Gambia Nutrition Country Paper for the International Conference on Nutrition. Republic ofThe Gambia, Ministry of Health, Nutrition Unit. 1992.
4
CHAPTER 2: LITERATURE REVIEW
Food Consumption
A primary constraint on households during the rainy season is the decrease in food consumption.Benefice et al (1984)18 found that the mean daily per capita energy intake of a group of herdersin Senegal fell from 2619 kcal in the dry season to 2005 kcal in the rainy season. The herdersconsumed 100 percent of the FAO recommended intake of kilocalories in the dry season;however, their rainy season intake was only 88.6 percent of the FAO recommendation (WHO,1985)19. In a study conducted in The Gambia, von Braun et al (1989)20 reported mean daily percapita energy intakes of 2522 kcals in the dry season and 2380 kcals in the rainy season. Wandelet al (1992)21 reported similar seasonal fluctuations in the household per capita energy intake ofsubsistence farmers in Tanzania. Household energy intake decreased from 130 percent of theFAO recommendation in the dry season to only 85 percent in the lean season. In a studyconducted by the Medical Research Council of the Dunn Nutrition Unit, researchers found thatpregnant and lactating women in a rural community of The Gambia consumed only 65 percent oftheir recommended dietary allowance (RDA) of energy during the dry season. This figuredropped to only 45 to 50 percent of the RDA during the rainy season (ICN Focal Point, 1992)22.This study did not take into account snacks, such as, groundnuts; however, Prentice et al (1981)23
obtained similar results in The Gambia when snacks were included. They found that during thedry season, from November to June, women’s energy intake was relatively stable at 1483 kcalper day for pregnant women and 1684 kcal per day for lactating women. This represented only56 percent and 59 percent of the FAO RDA for pregnant and lactating women, respectively(WHO, 1985)24. During the rainy season, however, the mean intake of both groups fell to aminimum of 1302 kcal per day for pregnant women and 1203 kcal per day for lactating womenin the month of August. This represented 49 percent and 42 percent of the FAO RDA forpregnant and lactating women, respectively. Geuns et al (1991)25 found that for preschoolchildren in Kenya, the mean intake of energy during the lean season only accounted for 68percent of the FAO RDA.
18 Benefice E, Chevassus-Agnes S, Barral H. Nutritional Situation and Seasonal Variations for PastoralistPopulations of the Sahel (Senegalese Ferlo). Ecology of Food and Nutrition. 1984;14:229-47.19 WHO. Energy and Protein Requirements. Report of a Joint FAO/WHO Expert Consultation. WHO TechnicalReport Series 724. World Health Organization. Geneva, Switzerland. 1985.20 Von Braun J, Puetz D, Webb P. Irrigation Technology and Commercialization of Rice in The Gambia: Effects onIncome and Nutrition. International Food Policy Research Institute. Washington, D.C. Research Report 75, August1989.21 Wandell M, Holmboe-Ottesen G, Manu A. Seasonal Work, Energy Intake and Nutritional Stress: A Case Studyfrom Tanzania. Nutrition Research. 1992;12:1-16.22 ICN Focal Point. The Gambia Nutrition Country Paper for the International Conference on Nutrition. Republic ofThe Gambia, Ministry of Health, Nutrition Unit. 1992.23 Prentice AM, Whitehead RG, Roberts SB, and Paul AA. Long-Term Energy Balance in Child-Bearing GambianWomen. The American Journal of Clinical Nutrition. 1981;34:2790-99.24 WHO. Energy and Protein Requirements. Report of a Joint FAO/WHO Expert Consultation. WHO TechnicalReport Series 724. World Health Organization. Geneva, Switzerland. 1985.25 Geuns M, Niemeijer R, Hoorweg J. Child Nutrition in the Pre-Harvest Season in Kenya. East African MedicalJournal. 1991;68(2):93-105.
5
Availability of Vitamin A
Vitamin A deficiency is also common among women and children in West Africa and mayfollow seasonal patterns. In a study conducted in Senegal, Rankins et al (1993)26 found that 71.5percent of children studied had marginal or deficient serum retinol levels. Villard and Bates(1987)27 found that the maximum vitamin A intake in The Gambia occurred in the mid to latedry season and corresponded to the peak in mango and palm oil consumption (April throughJune) with extremely low intakes generally in the rainy season and early dry season. The majorsources of vitamin A (�-carotene) throughout the year were red palm oil, mangos, leaves,pumpkin, and peppers (Bates et al, 1994)28. The peak in consumption in the latter half of the dryseason seemed to occur every year. Bates et al (1984)29 found that there was a pronounced peakin plasma carotenoid levels for both pregnant and lactating women during the latter part of thedry season and the early rains (May through July) with a maximum in mid June corresponding tothe peak of the mango harvest. Minimum values were observed in the early part of the dryseason (November through February).
Agricultural Work
Another constraint on households during the lean season is the increase in agricultural work witha resulting increase in energy expenditure. Adams (1995)30 found that among agriculturalhouseholds in Central Mali, mean daily energy expenditure for men and women peaked duringthe rainy season. The only significant differences in energy expenditure between seasons werean increase in agricultural work for men and women and a decrease in resting for men. Panter-Brick (1993)31 found that among subsistence farming households in Nepal, women's total energyexpenditure peaked during the rainy season. In the dry season, pregnant and lactating womenhad lower energy expenditures than non-pregnant/non-lactating women; however, during therainy season, all women had similar high energy expenditures due to the long hours of physicalwork necessary during the peak agricultural season. Lawrence and Whitehead (1988)32 foundthat for women in The Gambia, the duration of agricultural work increased from a low of 0.5hours per day in January to 4.5 hours per day in July. From January through March, women didvery little agricultural work averaging only 26 minutes per day. In April and May, women began
26 Rankins J, Green NR, Tremper W, Stacewitcz-Sapuntzakis M, Bowen P. Undernutrition and Vitamin ADeficiency in the Department of Linguere, Louga Region of Senegal. American Journal of Clinical Nutrition.1993;58:91-7.27 Villard L and Bates CJ. Dietary Intake of Vitamin A Precursors by Rural Gambian Pregnant and LactatingWomen. Human Nutrition: Applied Nutrition. 1987;41A:135-45.28 Bates CJ, Prentice AM, Paul AA. Seasonal Variations in Vitamins A, C, Riboflavin and Folate Intakes and Statusof Pregnant and Lactating Women in a Rural Gambian Community: Some Possible Implications. European Journalof Clinical Nutrition. 1994;48:660-8.29 Bates CJ, Villard L, Prentice AM, Paul AA, Whitehead RG. Seasonal Variations in Plasma Retinol andCarotenoid Levels in Rural Gambian Women. Transactions of the Royal Society of Tropical Medicine and Hygiene.1984;78:814-17.30 Adams AM. Seasonal Variations in Energy Balance Among Agriculturalists in Central Mali: Compromise orAdaptation? European Journal of Clinical Nutrition. 1995;49:809-23.31 Panter-Brick C. Seasonality of Energy Expenditure During Pregnancy and Lactation for Rural Nepali Women.American Journal of Clinical Nutrition. 1993;57:620-8.32 Lawrence M and Whitehead RG. Physical Activity and Total Energy Expenditure of Child-Bearing GambianVillage Women. European Journal of Clinical Nutrition. 1988;42:145-60.
6
to prepare for the start of agricultural work in June and worked 1.0 hour per day. In June andJuly, fields were cleared and dug and the rice and groundnut crops were planted. Womenworked an average of 2.5 to 4.5 hours per day during this period. During August and September,women’s agricultural work continued at 3.5 to 4.5 hours per day spent weeding the rice andgroundnut crops. In October through December, women’s work fell to 1.0 to 2.0 hours per day.Lawrence and Whitehead (1988)33 found that the Total Energy Expenditure (TEE) (adjusted forstage of pregnancy or lactation) was lowest in the months of January through March (2300 kcalper day), rose sharply at the beginning of the rains (2700kcal per day), and was intermediateduring the harvest season (2400 kcal per day). During the rainy season, women in latepregnancy or early lactation tended to go to the fields less frequently; however, on field days, theduration of agricultural work was not significantly affected by the stage of pregnancy orlactation.
Child Care
The high labor demands on women during the rainy season may require them to endure longseparations from their children which results in a decrease in the time spend on childcare.Roberts et al (1982)34 found that there was no significant difference in the percentage of timewomen spent caring for their children when they were in the village, but when they went farmingduring the rainy season and left their children behind, they did not compensate by spending moretime with them after returning from farming. For children 7 to 18 months, women spent 56minutes per day caring for their children in the dry season; whereas, in the rainy season, womenthat didn’t take their children to the field with them spent only 34 minutes per day caring fortheir children. The time spent on cooking is at its lowest point at the height of the agriculturalwork season as well. Lawrence and Whitehead (1988)35 found that the total time spent oncooking fell from 2 hours per day in November through January to 1 hour per day in July andAugust. As a result, women usually only prepared one meal for their child which was set asideand eaten throughout the day.
Weight Loss
The seasonal decrease in caloric intake with an accompanying increase in energy expendituremay result in decreased weight gain or weight loss for adult members of the household. Patore etal (1993)36 reported significant seasonal fluctuations in the cumulative weight of subsistencefarming households in Ethiopia. Households in the study lost a significant (p<0.05) amount ofcumulative weight (3.3 percent) between the post-harvest season and the pre-harvest season.The authors also found that the pre-harvest to post-harvest fluctuation in cumulative weight ofpoor households (3.7 percent) was double that of rich households (1.9 percent). Lawrence et al
33 Lawrence M and Whitehead RG. Physical Activity and Total Energy Expenditure of Child-Bearing GambianVillage Women. European Journal of Clinical Nutrition. 1988;42:145-60.34 Roberts SB, Paul AA, Cole TJ, Whitehead RG. Seasonal Changes in Activity, Birth Weight and LactationalPerformance in Rural Gambian Women. Transactions of the Royal Society of Tropical Medicine and Hygiene.1982;76(5):668-78.35 Lawrence M and Whitehead RG. Physical Activity and Total Energy Expenditure of Child-Bearing GambianVillage Women. European Journal of Clinical Nutrition. 1988;42:145-60.36 Patore G, Branca F, Demissie T, Ferro-Luzzi A. Seasonal Energy Stress in an Ethiopian Community: An Analysisof the Impact at the Household Level. European Journal of Clinical Nutrition. 1993;47:851-62.
7
(1987)37 found that for non-pregnant, non-lactating women in The Gambia, weight loss duringthe rainy season averaged 5 kg, most of which was accounted for by changes in maternal adiposetissue stores. Approximately one third of total body fat was mobilized between March andOctober in these women. Lawrence et al (1987)38 concluded that fat loss during the rainy seasonwas almost certainly the result of a declining food intake combined with an increase in totalenergy expenditure associated with agricultural work. Prentice et al (1981)39 found that pregnantwomen in The Gambia gained only 0.4 kg per month during the wet season compared to 1.4 kgper month during the dry season. They also found that lactating women lost weight during thewet season at a rate of 0.74 kg per month. This was not significantly greater than the rate ofweight loss (0.67 kg per month) for non-pregnant, non-lactating women during the same period.During the dry season, lactating and non-pregnant, non-lactating women gained weight at similarrates.
Nutritional Status
The lean season is a time of decreased nutritional status for many household members, especiallywomen and children. In a study conducted among agricultural households in central Mali,Adams et al (1995)40 found that the body mass index (kg/m2) of women farmers decreased froma mean of 19.6 in the dry season to 19.1 in the rainy season. This difference was significant atp<0.01. Adams (1994)41 also found seasonal trends in anthropometric indicators for childrenunder 5 years of age. The author found that weight-for-height and weight-for-age z-scoresreached their lowest point at the beginning of the harvest season, rose gradually throughout theharvest and dry seasons, and then began to deteriorate again with the beginning of the rainyseason. Weight-for-height z-scores decreased from -0.90 in the harvest season to -1.18 in therainy season, and height-for-age z-scores decreased from -1.47 in the harvest season to -1.64 inthe rainy season. These differences were significant at p<0.01 and p<0.05, respectively. Brancaet al (1993)42 reported a similar trend in weight-for-height z-scores of children in a studyconducted among rural subsistence farmers in Ethiopia. The authors found that weight-for-height z-scores of children under 5 years of age improved during the harvest season and thendecreased to their lowest point during the rainy season. Similar trends of seasonal fluctuations inanthropometric indicators have been observed by Rosetta (1986)43 and Benefice et al (1984)44 inSenegal.
37 Lawrence M, Coward WA, Lawrence F, Cole TJ, Whitehead RG. Fat Gain During Pregnancy in Rural AfricanWomen: The Effect of Season and Dietary Status. American Journal of Clinical Nutrition. 1987;45:1442-50.38 Lawrence M, Coward WA, Lawrence F, Cole TJ, Whitehead RG. Fat Gain During Pregnancy in Rural AfricanWomen: The Effect of Season and Dietary Status. American Journal of Clinical Nutrition. 1987;45:1442-50.39 Prentice AM, Whitehead RG, Roberts SB, and Paul AA. Long-Term Energy Balance in Child-Bearing GambianWomen. The American Journal of Clinical Nutrition. 1981;34:2790-99.40 Adams AM. Seasonal Variations in Energy Balance Among Agriculturalists in Central Mali: Compromise orAdaptation? European Journal of Clinical Nutrition. 1995;49:809-23.41 Adams AM. Seasonal Variations in Nutritional Risk Among Children in Central Mali. Ecology of Food andNutrition. 1994;33:93-106.42 Branca F, Pastore G, Demissie T, Ferro-Luzzi A. The Nutritional Impact of Seasonality in Children and Adults ofRural Ethiopia. European Journal of Clinical Nutrition. 1993;47:840-50.43 Rosetta L. Sex Differences in Seasonal Variations of the Nutritional Status of Serere Adults in Senegal. Ecologyof Food and Nutrition. 1986;18:231-44.44 Benefice E, Chevassus-Agnes S, Barral H. Nutritional Situation and Seasonal Variations for PastoralistPopulations of the Sahel (Senegalese Ferlo). Ecology of Food and Nutrition. 1984;14:229-47.
8
Implications for Well-Being
The combined effects of the lean season have serious implications for individuals dependent onagricultural production for their livelihood. Durnin (1994)45 concluded that physical activity isreduced when an individual's body mass index (BMI) falls to 17 kg/m2 or less. The author alsoconcluded it is possible that work capacity may be reduced at a BMI of less than 18.5, and heavyagricultural work imposes greater stress on individuals with a low BMI. In a review of thenutritional links to productivity, Kennedy and Garcia (1994)46 reported that a positive associationexists between BMI and the amount of time devoted to work. The authors concluded that anincreased BMI appears to increase the capacity to carry out work. In a study conducted in thePhilippines to examine the impact of nutritional status on agricultural productivity, Haddad andBouis (1991)47 found that taller workers tend to be involved in tasks that pay higher wages. Theauthors concluded that adults who depend on agricultural wage income and were stunted as aresult of poor nutrition during childhood will earn substantially less over their lifetime thanadults that were not stunted.
Women's and children's health may also be detrimentally affected during the lean season. In astudy conducted in The Gambia, Roberts et al (1982)48 reported that the breast milk output oflactating women decreased during the lean season. For mothers of infants aged 3 to 12 months,breast milk output decreased up to 10 percent per day. In another study in The Gambia, Prenticeet al (1987)49 reported that birth weights vary according to season. The authors found mean birthweights of 3.0 kg during the dry season and 2.8 kg during the rainy season. These differenceswere significant at p<0.01. In a study conducted in The Gambia to examine the outcomes of lowbirth weight infants, Downes et al (1991)50 concluded that low birth weight is a strong risk factorfor infant mortality. The authors also reported that low birth weight infants did not exhibit catch-up growth during the first year of life. In a longitudinal analysis of mortality in The Gambia,Moore et al (1997)51 concluded that people born during the rainy season were up to 10 timesmore likely to die prematurely in young adulthood.
45 Durnin JVGA. Low Body Mass Index, Physical Work Capacity and Physical Activity Levels. European Journal ofClinical Nutrition. 1994;48(Suppl.):S39-S44.46 Kennedy E and Garcia M. Body Mass Index and Economic Productivity. European Journal of Clinical Nutrition.1994;48(Suppl.):S45-S55.47 Haddad LJ and Bouis HE. The Impact of Nutritional Status on Agricultural Productivity: Wage Evidence from thePhilippines. Oxford Bulletin of Economics and Statistics. 1991;53(1):45-68.48 Roberts SB, Paul AA, Cole TJ, Whitehead RG. Seasonal Changes in Activity, Birth Weight and LactationalPerformance in Rural Gambian Women. Transactions of the Royal Society of Tropical Medicine and Hygiene.1982;76(5):668-78.49 Prentice AM, Cole TJ, Foord FA, Lamb WH, Whitehead RG. Increased Birthweight After Prenatal DietarySupplementation of Rural African Women. American Journal of Clinical Nutrition. 1987;46:912-25.50 Downes B, Downes R, Foord F, Weaver L. Outcome of Low Birth Weight Infants in a West African Village.Journal of Tropical Pediatrics. 1991;37:106-10.51 Moore SE, Cole TJ, Poskitt EME, Sonko BJ, Whitehead RG, McGregor IA, Prentice AM. Season of BirthPredicts Mortality in Rural Gambia. Nature. 1997;388:434.
9
Potential of Supplementation
Supplementation or an increase in food consumption during the lean season can have a positiveimpact on all household members. Diaz et al (1991)52 conducted a study in The Gambia to testthe hypothesis that moderate undernutrition causes a reduction in work output that can bereversed by providing a high-energy dietary supplement. The study was carried out for 12 weeksduring the lean season. The authors found that, although there were no significant differences inthe work output between men that received the supplement and men that did not, there weresignificant differences in body weight. Men gained weight during supplementation and lostweight when they were not supplemented. Ceesay et al (1997)53 conducted a study to test theeffects of a dietary supplement on birth weight and infant survival in The Gambia. Thesupplement was a high energy groundnut biscuit and provided a possible daily intake of 1015kilocalories. Since the supplement was only consumed on a mean of 82 out of a possible 135days, its effective contribution to the diet was about 615 kilocalories per day. The authors foundthat the birth weight of infants born to women who received the supplement was 136 g greaterthan that of infants born to women that did not receive the supplement (p<0.001). The increasein birth weight was greatest during the hungry season (201 g) and was significant at p<0.001.The authors concluded that provision of a high-energy supplement to women during the last 20weeks of pregnancy could significantly reduce retardation of intrauterine growth and perinatalmortality. Similar results were obtained in The Gambia by Prentice et al (1983)54 using asupplement that resulted in a net increase in energy intake of 431 kilocalories per day.
Project Background
Catholic Relief Services (CRS) introduced sesame as a crop to women’s groups in The Gambiain 1983 in response to the inadequate nutritional situation. The main purpose of the project wasto improve general nutrition with the idea that sesame oil could provide a much-needed source ofcalories in both the women’s and children’s diets. Sesame production quickly became popularbecause: it required minimal labor as compared to groundnuts; it was drought resistant and couldbe planted if the main crop of groundnuts failed; and it could be planted after early millet andmaize in order to spread out the labor requirements (Galton-Fenzi, 1992)55.
In order to facilitate sesame oil production, CRS installed 16 diesel powered oil expellersbetween 1983 and 1989, and Sesame Growers Associations (SGA’s) were organized to take overmanagement of the expellers from CRS (Galton-Fenzi, 1992)56. Sesame is primarily a woman’scrop with production being driven by an interest in processing the seed to oil that can then be
52 Diaz E, Goldberg GR, Taylor M, Savage JM, Sellen D, Coward WA. Effects of Dietary Supplementation onWork Performance in Gambian Laborers. American Journal of Clinical Nutrition. 1991;53:803-11.53 Ceesay SM, Prentice AM, Cole TJ, Foord F, Weaver LT, Poskitt EME, Whitehead RG. Effects of Birth Weightand Perinatal Mortality of Maternal Dietary Supplements in Rural Gambia: 5 Year Randomized Controlled Trial.British Medical Journal. 1997;315:786-90.54 Prentice AM, Whitehead RG, Watkinson M, Lamb WH, Cole TJ. Prenatal Dietary Supplementation of AfricanWomen and Birth-Weight. The Lancet. 1983:489-92.55 Galton-Fenzi, JD. Project Report to Determine the Potential of Expanding Sesame Production in The Gambia.Labat-Anderson Inc. Unpublished. 1992.56 Galton-Fenzi, JD. Project Report to Determine the Potential of Expanding Sesame Production in The Gambia.Labat-Anderson Inc. Unpublished. 1992.
10
consumed or sold on the local market (ICN Focal Point, 1992)57. Sesame production peakedduring the 1986-87 growing season when approximately 12,000 ha of sesame were planted andapproximately 4000 metric tons of seed were produced. From this harvest, approximately 350metric tons of seed were pressed in the expellers producing 16 metric tons of oil that wasconsumed locally.
By 1993, however, a dramatic reduction in sesame production had occurred and production hadfallen to an estimated 600 to 900 metric tons (Galton-Fenzi, 1992)58. The main reason for thereduction in sesame production was that out of the 16 expellers imported into the country for theSGA’s, by 1994 only 6 were in working order. Consequently, women were too far away fromthe expellers, and the high cost of transporting the seeds, oil, and seed cake reduced theprofitability of processing. The broken expellers had not been repaired due to the high cost ofreplacement parts and because the problems were beyond the repair skills of the local mechanics(Awor, 1994)59. Because of a lack of ongoing maintenance and proper cleaning of the seed, thecurrently operating expellers were reaching the end of their useful life (Galton-Fenzi, 1992)60. Itwas thought that once these expellers stopped working, sesame production would also end. Thebiggest challenge facing the SGA’s was to find a way of providing significant benefits to itsmembers in order to retain their interest and willingness to pay dues (Freudenberger, 1994)61.
Ram Press Technology
One promising solution to that problem was the ram press. The ram press is a small scale,manual technology for edible oil extraction first disseminated in the Arusha region of Tanzaniain 1986. The ram press is inexpensive and can be manufactured and repaired in rural workshopsusing labor intensive methods. Unlike the imported expellers, no special imported componentsare needed and spare parts can be made locally. It was originally designed for soft-shelledvarieties of sunflower seeds, but can be used for a variety of other oilseeds, such as, sesame. Theram press does not require additional preparation (preprocessing) steps for the seed, such as,decorticating or roasting and produces cold pressed oil, which has a longer shelf life and tastesbetter than oil produced by a motorized expeller (Hyman, 1993)62.
Appropriate Technology International (ATI) engineer Carl Bielenberg invented the ram press inNovember of 1985. Since then, several refinements have been made and the current model,developed by Erwin Protzen and L. Manyanga of the Center for Agricultural Mechanization andRural Technology (CAMARTEC) in 1992, is durable, easy to maintain, and portable. Since the 57 ICN Focal Point. The Gambia Nutrition Country Paper for the International Conference on Nutrition. Republic ofThe Gambia, Ministry of Health, Nutrition Unit. 1992.58 Galton-Fenzi, JD. Project Report to Determine the Potential of Expanding Sesame Production in The Gambia.Labat-Anderson Inc. Unpublished. 1992.59 Awor, S. The Training of Technician/Mechanic, Trainers and Users on the Instillation, Operation andmaintenance of the Ram Press at Illiassa and Njau Sesame Growers Associations of the Catholic Relief Services.Appropriate Technology International. Banjul, The Gambia. December, 1994.60 Galton-Fenzi, JD. Project Report to Determine the Potential of Expanding Sesame Production in The Gambia.Labat-Anderson Inc. Unpublished. 1992.61 Freudenberger, KS. Evaluation of the Sesame Growers Association. Banjul, The Gambia. Catholic ReliefServices. Unpublished. January, 1994.62 Hyman, EL. Production of Edible Oils For the Masses and By the Masses: The Impact of the Ram Press inTanzania. World Development. 1993;21(3):429-43.
11
ram press costs only a fraction of the price of an expeller, each kafo (a sub-unit of the SGAs)could potentially own one and women would no longer have to forgo pressing due to hightransportation costs (Hyman, 1993)63.
In 1994, the Thrasher Research Fund funded the Small-Scale Sesame Oil Production project inThe Gambia. The project was designed to test the effect of the adoption of ram press technologyon the nutrition security of women and children. The overall aim of the project was to improvehousehold nutrition security directly and indirectly through the manufacture and use of ram presstechnology in The Gambia (Prehm and Silva-Barbeau, 1994)64.
63 Hyman, EL. Production of Edible Oils For the Masses and By the Masses: The Impact of the Ram Press inTanzania. World Development. 1993;21(3):429-43.64 Prehm MS, Silva-Barbeau I. Thrasher Research Proposal of Ram Press Technology for Sesame Oil Production inThe Gambia. VPI&SU. 1994.
12
CHAPTER 3: PURPOSE AND OBJECTIVES
The purpose of this study was to describe the stabilizing effects of the presence of ram presstechnology on seasonal fluctuations in the food and nutrition security of rural subsistencefarming households in The Gambia.
The objectives of this study were:
1. To determine the effect of ram press technology on the household availability ofmacronutrients across seasons.
2. To determine the effect of ram press technology on the household availability of Vitamin Aacross seasons.
3. To determine the effect of ram press technology on the household consumption of oil acrossseasons.
4. To determine the effect of ram press technology on the household availability of oil duringthe previous year.
5. To determine the effect of ram press technology on women’s intake of macronutrients acrossseasons.
6. To determine the effect of ram press technology on women’s intake of vitamin A acrossseasons.
7. To determine the effect of ram press technology on women’s nutritional status acrossseasons.
8. To determine the effect of ram press technology on children’s intake of macronutrientsacross seasons.
9. To determine the effect of ram press technology on children’s intake of vitamin A acrossseasons.
10. To determine the effect of ram press technology on children’s frequency of intake of selectedfoods across seasons.
11. To determine the effect of ram press technology on children’s nutritional status acrossseasons.
13
CHAPTER 4: MATERIALS AND METHODS
Introduction of Ram Press
The major phases of project implementation are presented in Figure 4.1. In December 1994, aCRS technician trained 4 machine shops in the Gambia on manufacturing of the ram press. Inorder to test the potential of using the ram press for sesame, CRS placed 16 imported Tanzanianpresses with 20 different user groups in 16 villages in The Gambia (Samba-Ndure et al, 1995)65.The participants in this initial field testing were individuals and groups selected in conjunctionwith SGA leadership and CRS. ATI staff made three monitoring trips between February andApril 1995 to oversee press operations and to evaluate the overall functioning of the press. InJuly 1995, through CRS field visits, 40 villages were selected to receive presses. These 40villages were located in the North Bank Division of The Gambia (see Figure 1.1). In October1995, through CRS and GAFNA field visits, 80 women sesame growers with preschool childrenfrom these 40 villages were selected to participate in the study. In February 1996, 40 presseswere placed in the study villages and participants were trained in the use and maintenance of theram press.
Pilot Study
In early 1994, a preliminary questionnaire was developed by the principal investigators of theSmall-Scale Sesame Oil Production project in The Gambia in cooperation with CRS andGAFNA staff. Common household cooking and feeding utensils and handful sizes for womenand children were standardized to gram weight measurements for all types of foods consumed(see Appendices A and B). A list of Mandinka and Wolof food names with their Englishequivalents was developed to facilitate the recording of dietary data (see Appendix C).Standardized recipes were developed for all commonly consumed food mixtures (Samba-Ndureet al, 1995)66 (see Appendix D). A codebook containing local food names, their respective codein the Nutritionist IV Database, and their standardized weight measures was developed tofacilitate coding of the dietary data in the nutritional analysis program Nutritionist IV (N-Squared Computing Incorporated. Salem, OR. 1992.)67 (see Appendix E).
In May 1995, a pilot study was conducted by GAFNA in 10 villages in order to test and refinethe survey instrument and to give the field team the experience necessary to conduct the study.These villages were outside of the actual study area and were divided into two groups: pressvillages, those where the initial testing of the ram press took place, and non-press villages, thosewithout sesame ram presses. A sample of 40 women with preschool children between the agesof 1 and 5 years participated in the pilot study. These women were selected to have a socio-economic status and ethnic background similar to those that would participate in the actual study.
65 Samba-Ndure K, Jawneh A, Jome KM, Prehm MS, Silva-Barbeau I. Small Scale Sesame Oil Production: AMeans of Child Nutrition Security in The Gambia. Semi-Annual Project Progress Report. Thrasher Award #029034.1995.66 Samba-Ndure K, Jawneh A, Jome KM, Prehm MS, Silva-Barbeau I. Small Scale Sesame Oil Production: AMeans of Child Nutrition Security in The Gambia. Semi-Annual Project Progress Report. Thrasher Award #029034.1995.67 N-Squared Computing Incorporated. Nutritionist IV Version 2.0 Users’ Manual for IBM and CompatibleComputers. Salem, OR. 1992.
14
Figure 4.1. Timeline of Project Implementation.
Selection of ProjectParticipants toReceive Presses
Survey InstrumentDevelopment
Observations ofFood ConsumptionPractices
Training ofGambian NutritionSpecialists
Training of PressManufacturers byCRS/ATI
Placement of Pressesand Training of PressUsers by CRS/ATI
Implementationof Pilot Study
Baseline DataCollection
First Sesame PressingSeason After Introductionof the Press
Placement of 40Presses with ProjectParticipants
Dec. 1994
Jan. 1995
Feb.
Mar.
Apr.
May
Jun.
July.
Aug.
Sep.
Oct.
Nov.
Dec.
Jan. 1996
Feb.
Mar.
Apr.
May
Jun.
July.
Aug.
Sep.
Oct.
Nov.
Dec.
Peak Oil PressingSeason Data Collection
Pre-Harvest LeanSeason DataCollection
Post-Harvest SeasonData Collection
Harvesting of Millet,Groundnuts, andSesame
Peak in AgriculturalWork for Men andWomen
Harvesting of Millet,Groundnuts, and Sesame
15
The analysis was conducted by GAFNA and the results were used to refine the finalquestionnaire (Samba-Ndure et al, 1995)68.
Study Design
The research design consisted of an experimental group and a control group. The householdsthat participated in the study were selected from the 32 villages that received ram presses in early1996 and from 20 villages in the same area that had access to motorized expeller technology andno access to ram press technology. In order to ensure the possibility of statistically significantdifferences between groups, sample sizes were determined using power analysis. The results ofa study of preschoolers receiving a home based food supplement in Bogota, Columbia (Mora etal, 1981)69 and the results of a protein fortified weaning foods project in Mali (Silva-Barbeau etal, 1993)70 were used to direct the analysis. The power computations were based on thefollowing assumptions: � = 0.05, �e = �c = 1, �e - �c = 0.4, Ne = 2Nc, where an experimentaleffect of 0.4 of a standard deviation was assumed with twice as many experimental subjects ascontrol. For a one-tailed test, the number of subjects required to attain a power level of 0.7 was44 for control and 88 for experimental for a total of 132 subjects. For this study, a control groupof 40 women with preschool children (aged 1 to 5 years) and an experimental group of 80women with preschool children (aged 1 to 5 years) were selected. Women with preschoolchildren who were domestic sesame growers and were using a motorized expeller for processingwere invited to participate in the study in order to obtain 40 mother/child pairs in the Controlgroup. Women with preschool children who were domestic sesame growers, were members ofan SGA with good management skills, and had been chosen to receive a ram press were invitedto participate in the study in order to obtain 80 mother/child pairs in the Experimental group. Foreach household, the woman that agreed to participate in the study was designated as the 'targetwoman' and her child of preschool age was designated as the 'target child'. If she had more thanone child of preschool age, then one of them was randomly selected to be the 'target child'.Control and Experimental households were matched as closely as possible on farm type, targetchild's age, distance to an expeller, and socioeconomic status (Prehm and Silva-Barbeau,1994)71.
Research Questionnaire
Results from the pilot study were used to revise the questionnaire and update it to its finalversion (see Appendix F). A protocol was developed to guide the data collection and insure thatall data was collected in a precise and similar manner (see Appendix G). The questionnaire was
68 Samba-Ndure K, Jawneh A, Jome KM, Prehm MS, Silva-Barbeau I. Small Scale Sesame Oil Production: AMeans of Child Nutrition Security in The Gambia. Semi-Annual Project Progress Report. Thrasher Award #029034.1995.69 Mora JO, Herrera MG, Suescan J, de Navarro L, Wagner M. The Effects of Nutritional Supplementation onPhysical Growth of Children at Risk of Malnutrition. American Journal of Clinical Nutrition. 1981;34:1885-92.70 Silva-Barbeau I, Haidara M, Sissoko H, Berthe M, Caldwell J, Barbeau WE. Addressing Child Feeding Concernsof Women Farmers in Mali: Composition and Effects on Child Nutrition of a Locally Developed Weaning Food.Ecology of Food and Nutrition. In Press. 1998.71 Prehm MS, Silva-Barbeau I. Thrasher Research Proposal of Ram Press Technology for Sesame Oil Production inThe Gambia. VPI&SU. Blacksburg, VA. 1994.
16
designed to identify key direct benefits of ram press technology at the household, woman, andchild levels and was composed of 7 sections.
Questions in section A were only asked at the baseline and were designed to obtain a basicdescription of the household, target woman and target child. Household questions included: thenumber of households in the compound; the number of individuals in the household; the relativewealth of the household; and the source, quantity and quality of the household's water supply. Adetailed description of each household member was obtained that included their name, age inyears, sex, and relationship to the household head. This profile of the household was updated ateach subsequent data collection. The household's wealth ranking was obtained by convening ameeting of three key informants to determine the criteria for wealth ranking. The criteriaestablished was based on (1) the household's ability to produce enough food for their familiesthroughout the year, (2) the household's access to labor and farm machinery and (3) thehousehold's involvement in non-farm activities, such as, petty trading and salaried employment.The key informants were people who knew the village well and did not come from householdsinvolved in the study. The key informants in each village then ranked each householdparticipating in the study on a scale from 1 (poor) to 5 (rich) relative to all other households inthe village. Information on the target woman included her date of birth or age, marital status,ethnic background, education, use of the nearest health center, and a description of heragricultural activities. Information on the target child included date of birth (from the infantwelfare card), birth weight, and sex.
Questions in section B dealt with the health status of the target woman and target child. Thissection included questions about the child's weaning status, the child's incidence of diarrhea inthe last two weeks, the child's incidence of illness during the last 7 days, the woman's enrollmentin the Health and Nutrition supplementation program, and the woman's reproductive status.
This section also included questions on the anthropometric measurements for the woman andchild. Women were weighed lightly clothed and without shoes on scales accurate to 100g. Thescale was recalibrated at the beginning of each weighing session and weights were recorded tothe nearest 0.1 kg. Children were weighed using the same method. Heights for both women andchildren 24 months of age and greater were measured to the nearest 0.1 cm with the subjectsheels, buttocks, and upper back in contact with a calibrated upright board and a sliding horizontalbar that rested on the vertex. Children less than 24 months of age were measured using similarmethods in a horizontal position (Jelliffe and Jelliffe, 1989)72.
Section C consisted of a food frequency questionnaire for the target child and sought to describethe child's general consumption patterns and consumption of oil rich foods over the last 4 weeks.The target child's primary care giver was asked to report the frequency of foods consumed by thechild in the previous four weeks. The food items included in the food frequency were groupedinto the following categories: high fat/high protein foods, nutrient dense weaning foods, nutrientdense table foods, low calorie weaning foods, and milk and other snack foods.
72 Jelliffe D and Jelliffe EFP. Community Nutritional Assessment: With Special Reference to Less TechnicallyDeveloped Countries. Oxford University Press. Oxford, England. 1989.
17
Sections D, E and F attempted to obtain detailed information on the food availability of thehousehold, and the food consumption of the target woman and target child. Food consumptiondata was collected using two 24-hour recalls conducted on non-consecutive days of the sameweek. In section D, the woman responsible for household food preparation was asked to reportall foods and amounts prepared for the household on the previous day. In sections E and F, thetarget woman was asked to report all foods and amounts consumed by herself and the target childon the previous day. Two non-consecutive 24-hour recalls were used to obtain foodconsumption data because a precision equal to that of a 1-day weighed food intake survey couldbe obtained with two 24-hour recalls at a much lower cost (Dop et al, 1994b)73. Ferguson et al(1993)74 also concluded that a repeated 24-hour recall could be substituted for the weighedrecord for assessing food consumption patterns as long as nutrients contributed by snacks werenot the dietary factors of interest. Dop et al (1994a)75 found that the overly demanding design ofthe weighed food record could cause an instrument effect resulting in decreased consumptionpatterns on days following the first data collection. In a study conducted in The Gambia by theDunn Nutrition Unit, Villard and Bates (1987)76 reported that 24-hour recalls provided similarinformation to direct weighed intakes.
Section D also included questions that sought to describe the household's oil consumption duringthe last 7 days. Section G included questions that sought to describe the household's yearly oilavailability and purchasing patterns.
Data Collection
Enumerators were trained in November 1995 on the proper procedures for collecting the data,and they were closely supervised by a Gambian Nutrition Specialist throughout the datacollection. The baseline data collection was conducted in December 1995 and corresponded tothe post-harvest season of plenty. After the baseline season, data was collected at three timesduring the following year in March, August, and December. These times corresponded to thepeak oil-pressing season, the pre-harvest lean season, and the post-harvest season of plenty,respectively (Prehm, Silva-Barbeau, 1994)77.
73 Dop M-C, Milan Ch, Milan Cl, N’Diaye AM. The 24-Hour Recall for Senegalese Weanlings: A ValidationExercise. European Journal of Clinical Nutrition. 1994;48:643-53.74 Ferguson EL, Gibson RS, Opare-Obisaw C. The Relative Validity of the Repeated 24-Hour Recall for EstimatingEnergy and Selected Nutrient Intakes of Rural Ghanaian Children. European Journal of Clinical Nutrition.1994;48:241-52.75 Dop M-C, Milan Ch, Milan Cl, N’Diaye AM. Use of the Multiple-Day Weighed Record for Senegalese ChildrenDuring the Weaning Period: A Case of the ‘Instrument Effect’. American Journal of Clinical Nutrition.1994;59(suppl):266S-8S.76 Villard L and Bates CJ. Dietary Intake of Vitamin A Precursors by Rural Gambian Pregnant and LactatingWomen. Human Nutrition: Applied Nutrition. 1987;41A:135-45.77 Prehm MS, Silva-Barbeau I. Thrasher Research Proposal of Ram Press Technology for Sesame Oil Production inThe Gambia. VPI&SU. 1994.
18
Data Analysis
The Gambian Nutrition Specialist imputed all data from the questionnaires into Epi Info (Dean etal, 1990)78 and Nutritionist IV (N-Squared Computing Incorporated., 1992)79 using the codebookdeveloped during the pilot study. Weights and heights obtained from each target woman wereused to calculate body mass index (BMI) using the formula: BMI = body weight (kg) / height2
(m2) (Bray, 1992)80. The weight, height, age, and sex obtained for each child were used tocalculate weight-for-height, weight-for-age, and height-for-age using the Epi Info softwarepackage. Since specific standards for height and weight of children have not been set for TheGambia, standards based on the growth reference curves developed by the National Center forHealth Statistics (NCHS) and the Centers for Disease Control (CDC) using data from the FelsResearch Institute and the United States Health Examination Surveys were used as a comparison(Dibley et al, 1987)81. These growth curves are recommended by the World Health Organization(WHO) for international use (WHO, 1986)82. The mean anthropometric indices for childrenwere used to make comparisons of nutritional status between groups as this method can detectdifferences at smaller sample sizes (Briend, 1989)83.
Dietary data were analyzed using Nutritionist IV software to calculate amounts of macronutrients(kcal, protein, carbohydrates, and fat) and micronutrients (vitamin A) in the diet. Gambian foodsthat were not in the Nutritionist IV database were added using values found by USDA (1997)84
and FAO (1968)85. Results obtained by Hudson et al (1980)86 and Hudson and Day (1989)87
were used to calculate nutrient values for millet, sorghum, and maize prepared by the threecooking methods commonly used in The Gambia. Values for the vitamin A (�-carotene) contentof foods were added using results obtained by FAO (1968)88, Villard and Bates (1987)89, McRaeand Paul (1996)90, and King and Burgess (1993)91. 78 Dean AG, Dean JA, Burton AH, Dicker RC. Epi Info Version 5: A Word Processing, Database, and StatisticsProgram for Epidemiology on Microcomputers. Stone Mountain, GA. USD, Incorporated. 1990.79 N-Squared Computing Incorporated. Nutritionist IV Version 2.0 Users’ Manual for IBM and CompatibleComputers. Salem, OR. 1992.80 Bray G. Pathophysiology of Obesity. American Journal of Clinical Nutrition. 1992;55:488S-494S.81 Dibley MJ, Goldsby JB, Staehling NW, Trowbridge FL. Development of normalized curves for the internationalgrowth reference: historical and technical considerations. Am J Clin Nutr 1987;46:736-48.82 WHO, Working Group. Use and Interpretation of Anthropometric Indicators of Nutritional Status. Bulletin of theWorld Health Organization. 1986;64:929-41.83 Briend A, Hasan KZ, Aziz KMA, Hoque BA, Henry FJ. Measuring Change in Nutritional Status: A Comparisonof Different Anthropometric Indices and the Sample Sizes Required. European Journal of Clinical Nutrition.1989;43:769-78.84 U.S. Department of Agriculture, Agricultural Research Service. 1997. USDA Nutrient Database for StandardReference, Release 11-1. Nutrient Data Laboratory Home Page, http://www.nal.usda.gov/fnic/foodcomp85 FAO. Food Composition Table for Use in Africa. Nutrition Division of FAO. Rome, Italy. 1968.86 Hudson GJ, John PMV, Paul AA. Variation in the Composition of Gambian Foods: The Importance of Water inRelation to Energy and Protein Content. Ecology of Food and Nutrition. 1980;10:9-17.87 Hudson GJ and Day KC. Water Content of the Rural Gambian Diet. Nutrition Reports International.1989;400(2):335-9.88 FAO. Food Composition Table for Use in Africa. Nutrition Division of FAO. Rome, Italy. 1968.89 Villard L and Bates CJ. Dietary Intake of Vitamin A Precursors by Rural Gambian Pregnant and LactatingWomen. Human Nutrition: Applied Nutrition. 1987;41A:135-45.90 McCrae JE and Paul AA. Foods of Rural Gambia. Medical Research Council Dunn Nutrition Centre. Cambridge,United Kingdom. 1996.91 King FS and Burgess A. Nutrition for developing countries. Oxford University Press. Oxford, New York. 1993.
19
The household availability of all nutrients and oil was adjusted for age and sex using adultequivalents derived from the daily average energy requirements reported in Energy and ProteinRequirements (WHO, 1985)92. The 'adult equivalent' is a percentage of the daily average energyrequirement of a 65kg male aged 18 to 30 years (see Appendix H). The adult equivalents usedfor this analysis were similar to the results obtained by Hudson (1995)93, in The Gambia, whodeveloped an algorithm based on body weight to estimate the distribution of food within a mixedsex and age group. Hudson (1995)94 concluded that this was likely to be appropriate in mostcircumstances, unless detailed knowledge of local customs suggests otherwise. Adultequivalents have been used extensively to report household measures on a per capita basis that isadjusted for age and sex (Patore et al, 1993; Von Braun et al, 1989; Kennedy, 1989; Kumar andHotchkiss, 1988)95, 96, 97, 98.
In a similar manner, the children's intake of all nutrients was adjusted for age and sex usingconsumption units derived from the daily average energy requirements reported in Energy andProtein Requirements (WHO, 1985)99. The 'child's consumption unit' is a percentage of the dailyaverage energy requirement of a male aged 4 to 5 years (see Appendix I).
A preliminary analysis of the baseline and peak oil-pressing season data revealed that about halfof the experimental group participants were using not only the ram press, but also the motorizedexpeller for extraction of sesame oil. For this reason, this analysis further divided the sampleinto three study groups: the expeller group that used only motorized expeller technology, thepress group that used only ram press technology, and the combination group that used bothexpeller and ram press technology. The SAS software package (SAS Institute Inc, 1988)100 wasused to calculate means and standard deviations for each variable measured. Due to the seasonalnature of the data, statistical significance at p<0.05 was determined by the Repeated MeasuresAnalysis of Variance (ANOVA) method whenever appropriate. Otherwise, statisticalsignificance was determined using the ANOVA method. During the course of the study, 8households dropped out of the study. These dropouts were due to relocation of the family or
92 WHO. Energy and Protein Requirements. Report of a Joint FAO/WHO Expert Consultation. WHO TechnicalReport Series 724. World Health Organization. Geneva, Switzerland. 1985.93 Hudson GJ. Food Intake in a West African Village: Estimation of Food Intake from a Shared Bowl. BritishJournal of Nutrition. 1995;73:551-69.94 Hudson GJ. Food Intake in a West African Village: Estimation of Food Intake from a Shared Bowl. BritishJournal of Nutrition. 1995;73:551-69.95 Patore G, Branca F, Demissie T, Ferro-Luzzi A. Seasonal Energy Stress in an Ethiopian Community: An Analysisof the Impact at the Household Level. European Journal of Clinical Nutrition. 1993;47:851-62.96 Von Braun J, Puetz D, Webb P. Irrigation Technology and Commercialization of Rice in The Gambia: Effects onIncome and Nutrition. International Food Policy Research Institute. Washington, D.C. Research Report 75, August1989.97 Kennedy E. The Effects of Sugarcane Production on Food Security, Health, and Nutrition in Kenya: ALongitudinal Analysis. International Food Policy Research Institute. Washington, D.C. Research Report 78,December 1989.98 Kumar SK and Hotchkiss D. Consequences of Deforestation for Women’s Time Allocation, AgriculturalProduction, and Mutrition in Hill Areas of Nepal. International Food Policy Research Institute. Washington, D.C.Research Report 69. October, 1988.99 WHO. Energy and Protein Requirements. Report of a Joint FAO/WHO Expert Consultation. WHO TechnicalReport Series 724. World Health Organization. Geneva, Switzerland. 1985.100 SAS/STAT Software, Copyright (c) 1998 SAS Institute Inc., SAS Campus Drive, Cary, North Carolina 27513,USA. All rights reserved. http://www.sas.com/rnd/app/stat/sasstat.html
20
death of the target child. These households were not included in the repeated measuresANOVA.
21
CHAPTER 5: RESULTS
Study Population
At the baseline, the study population consisted of 120 households with one mother/child pairfrom each household identified as the 'target woman' and 'target child'. The Expeller groupconsisted of 40 mother/child pairs with the Press and Combination groups containing 37 and 43pairs, respectively (see Table 5.1). The mean size of households in the study was 14.6 persons,and the mean number of households per compound was 1.9 households. There were nosignificant differences between groups for these measures. Press households were assessed amean qualitative wealth ranking of 2.9 (where 5 equals wealthy and 1 equals poor), whereasCombination and Expeller households were assessed rankings of 2.5 and 2.3, respectively.These differences were significant at p<0.03.
Table 5.1. General Characteristics of the Household at the Baseline.
Over 95 percent of the target women were in a polygamous or nuclear marriage as shown inTable 5.2, and in over 85 percent of households, the target woman's husband or father-in-lawwas the household head as shown in Table 5.3.
Table 5.2. Marital Status of the Target Women at the Baseline.
The mean age of women in the study was 28.8 years with a mean height of 161.5 meters and amean weight 55.4 kilograms (see Table 5.5). Only 6.7 percent of women were pregnant, but61.7 percent were lactating. Over 80 percent of women were enrolled in the GAFNA/CRSHealth and Nutrition Program with the mean length of enrollment being 18.9 months. Only 34.2percent of women had attended some type of schooling with the average length of schoolingbeing 3.0 years. Over 85 percent of women that attended school attended a Madrassa (orKoranic) school. There were no significant differences between groups for these measures.
23
Table 5.5. General Characteristics of Target Women at the Baseline.
Expeller(n=40)
Press(n=37)
Combination(n=43)
Woman's Age (years) 29.68 � 6.981 29.24 � 6.64 27.65 � 7.17Woman's Height (cm) 160.69 � 5.26 162.71 � 4.37 161.31 � 4.92Woman's Weight (kg) 55.96 � 9.63 54.79 �6.59 55.51 �8.53Number of Women That Were Pregnant 2(1.7)2 4(3.3) 2(1.7)Number of Women That Were Lactating 20(16.7) 24(20.0) 30(25.0)Number of Women Enrolled in HNP 33(27.5) 31(25.8) 34(28.3)Length of Enrollment in HNP (months) 19.61 � 7.88 18.42 � 6.49 18.71 � 5.49Number of Women That Attended School 13(10.8) 13(10.8) 15(12.5)Length of Schooling (years) 3.46 � 1.81 2.15 � 0.69 3.33 � 2.64
1 Mean � Standard Deviation.2 Frequency (Percentage of Total Reporting).
A hand pump was the main source of water for 71.7 percent of households with the rest using atraditional well (16.7%), piped water (9.2%), or a cement lined well (2.5%) as shown in Table5.6. Nearly 95 percent of women thought their household had a source of good, clean water, andnearly 75 percent of women thought they had enough water to meet their household needs.
Table 5.6. Water Source for the Household at the Baseline.
Expeller Press Combination TotalHand Pump 30(25.0)1 27(22.5) 29(24.2) 86(71.7)Traditional Well 5(4.2) 3(2.5) 12(10.0) 20(16.7)Piped Water 4(3.3) 5(4.2) 2(1.7) 11(9.2)Cement Lined Well 1(0.8) 2(1.7) 0(0.0) 3(2.5)Total 40(33.3) 37(30.8) 43(35.8) 120(100.0)
1 Frequency (Percentage of Total Reporting).
24
Black sesame was grown by 66.7 percent of women, and white sesame was grown by 24.2percent of women. White sesame was grown by 17 women in the Expeller group and only 8 and4 women in the Press and Combination groups, respectively (see Table 5.7). This difference wassignificant at p<0.002. Other crops commonly grown by women included groundnuts (grown by85.0 percent of women), millet (54.2%), maize (30.8%), vegetables (28.3%), and rice (20.0%).
Table 5.7. Crops That Were Grown by Target Women at the Baseline.
1 Frequency (Percentage of Total Reporting).* p<0.002.
25
Nearly 90 percent of the women raised some type of livestock. Women raised, on average, 2.8goats, 1.1 sheep, 2.0 cattle, 8.1 poultry, and 0.1 other livestock (see Table 5.8). The onlysignificant difference between groups was for cattle. Press women raised 3.6 head of cattle,whereas, Expeller and Combination women raised only 1.5 and 1.0 head of cattle, respectively.This difference was significant at p<0.01. Only 32.5 percent (n=39) of women were involved insome type of income generation other than agricultural production. Most of these women (n=22)were in the Expeller group with only 8 and 9 women involved in income generation in the Pressand Combination groups, respectively. This difference was significant at p<0.001.
Table 5.8. Livestock Production and Income Generation of Target Women at the Baseline.
Expeller(n=40)
Press(n=37)
Combination(n=43)
Number of Women Raising Livestock 34(28.3)1 35(29.2) 38(31.7)Number of Goats 2.76 � 3.552 3.06 � 3.61 2.53 � 3.38Number of Sheep 1.06 � 1.59 1.77 � 2.85 0.66 � 1.21Number of Cattle 1.53 � 2.94 3.57 � 5.03* 1.00 � 2.81Number of Poultry 6.65 � 5.91 9.94 � 9.70 7.68 � 7.32Number of Other Livestock 0.21 � 1.20 0.06 � 0.34 0.00 � 0.00Number of Women Involved in IncomeGeneration
22(18.3)** 8(6.7) 9(7.5)
1 Frequency (Percentage of Total Reporting).2 Mean � Standard Deviation.* p<0.01.** p<0.001.
26
At the baseline, the mean age of the children participating in the study was 24.2 months with amean height of 81.2 cm and a mean weight of 10.5 kg (see Table 5.9). The children in the studywere distributed almost equally between sexes with 57 boys and 63 girls. Over 55 percent ofchildren had already been weaned with the rest consuming a mixed diet of breast milk andweaning foods. Women reported breast feeding their children an average of 8.3 times per day.There were no significant differences between groups for any of these measures. Over half (55.8percent) of the women reported that their child had been ill during the last 7 days. Children inthe Expeller group reported being ill more frequently than children in the other two groups. Ofthe 67 children that were reported to have been ill, 43.3 percent of them were in the Expellergroup with 28.4 percent of them in the Press group and 28.4 percent in the Combination group.This difference was significant at p<0.03. The duration of illness was longer for children in theCombination group (3.9 days) than for those in the Press (3.6 days) and Expeller (3.0 days)groups; however, this difference was not statistically significant.
Table 5.9. General Characteristics of Target Children in the Study Population at theBaseline.
Expeller(n=40)
Press(n=37)
Combination(n=43)
Child's Age (months) 25.30 � 9.27 23.87 � 9.99 23.37 � 9.67Child's Height (cm) 82.76 � 7.88 80.21 � 8.72 80.56 � 7.41Child's Weight (kg) 10.68 � 2.59 10.25 � 2.79 10.65 � 2.28Number of Children Weaned 25(20.8) 22(18.3) 20(16.7)Frequency of Breastfeeding (times per day) 7.27 � 3.31 9.56 � 3.60 8.04 � 2.88Number of Children Ill During the Last 7 Days 29(24.2)* 19(15.8) 19(15.8)Duration of Children's Illnesses (days) 3.00 � 1.06 3.64 � 1.43 3.88 � 3.04
1 Mean � Standard Deviation.2 Frequency (Percentage of Total Reporting).* p<0.05.
27
The most common illnesses reported were fever and malaria, reported for 55.2 and 17.9 percentof children reporting illnesses as shown in Table 5.10.
Table 5.10. Frequency of Children's Illnesses During the Last 7 Days at the Baseline.
The mean household availability of kilocalories (per adult equivalent) is presented in Table 5.11and Figure 5.1. Overall, the mean availability of kilocalories was highest at the baseline andpost-harvest seasons, and lowest during the peak oil-pressing season. This seasonal effect wassignificant at p<0.0001. The Combination households consistently reported more caloriesavailable than the Press or Expeller households. This group effect approached significance atp<0.07.
Table 5.11. Mean Household Availability of Kilocalories (per Adult Equivalent) AcrossSeasons.
Repeated measures analysis of variance:I. Group effect: p<0.07.II. Seasonal effect: p<0.0001.III. Season*Group Interaction: not significant.
3399
3619
4214
2859
2286
32622971
2402
3725
3402
2504
4119
2000
2500
3000
3500
4000
4500
Post-Harvest(Baseline)
Peak OilPressing
Pre-HarvestLean
Post-Harvest
Season
Kilo
calo
ries
per
Adu
lt E
quiv
alen
t
Expeller
Press
Combination
Figure 5.1. Mean Household Availability of Kilocalories Across Seasons.
29
The mean household availability of protein (per adult equivalent) is presented in Table 5.12 andFigure 5.2. The mean availability of protein followed a similar pattern to kilocalorie availabilitywith the highest availabilities at the baseline and post-harvest seasons and the lowestavailabilities at the peak oil-pressing and pre-harvest lean seasons. This seasonal effect wassignificant at p<0.0001. The Combination and Press households consistently reported moreprotein available than the Expeller households. This group effect was significant at p<0.02.
Table 5.12. Mean Household Availability of Protein (grams per Adult Equivalent) AcrossSeasons.
Repeated measures analysis of variance:I. Group effect: p<0.02.II. Seasonal effect: p<0.0001.III. Season*Group Interaction: not significant.
127.6
142.2
160.3
102.6
92.2
118.0 110.7112.3
142.5
126.0
102.8
156.9
80
90
100
110
120
130
140
150
160
170
Post-Harvest(Baseline)
Peak OilPressing
Pre-HarvestLean
Post-Harvest
Season
Pro
tein
(g)
per
Adu
lt E
quiv
alen
t
Expeller
Press
Combination
Figure 5.2. Mean Household Availability of Protein Across Seasons.
30
The mean household availability of carbohydrates (per adult equivalent) is presented in Table5.13 and Figure 5.3. Overall, the highest availabilities of carbohydrates were reported during thebaseline and post-harvest seasons and the lowest availabilities were reported during the peak oil-pressing season. This seasonal effect was significant at p<0.0001. The Combination householdsconsistently reported the highest availabilities of carbohydrates. This group effect approachedsignificance at p<0.09.
Table 5.13. Mean Household Availability of Carbohydrates (grams per Adult Equivalent)Across Seasons.
Repeated measures analysis of variance:I. Group effect: p<0.09.II. Seasonal effect: p<0.0001.III. Season*Group Interaction: not significant.
523.5
553.1
442.2
326.7
495.1453.0
314.1
547.5
666.2
532.9
349.4
618.4
275
325
375
425
475
525
575
625
675
Post-Harvest(Baseline)
Peak OilPressing
Pre-HarvestLean
Post-Harvest
Season
Car
bohy
drat
es (
g) p
er A
dult
Equ
ival
ent
Expeller
Press
Combination
Figure 5.3. Mean Household Availability of Carbohydrates Across Seasons.
31
The mean household availability of fat (per adult equivalent) is presented in Table 5.14 andFigure 5.4. Overall, the highest availabilities of fat were reported at the baseline and post-harvest seasons and the lowest were reported at the peak oil-pressing season. This seasonaleffect was significant at p<0.0001. The Combination and Press households consistently reportedhigher availabilities of fat than the Expeller households; however, there was no statisticallysignificant group effect.
Table 5.14. Mean Household Availability of Fat (grams per Adult Equivalent) AcrossSeasons.
Repeated measures analysis of variance:I. Group effect: not significant.II. Seasonal effect: p<0.0001.III. Season*Group Interaction: not significant.
93.2
102.4
90.5
76.2
68.3
91.0
79.878.1
109.0
85.5
77.8
113.5
60
70
80
90
100
110
120
Post-Harvest(Baseline)
Peak OilPressing
Pre-HarvestLean
Post-Harvest
Season
Fat
(g)
per
Adu
lt E
quiv
alen
t
Expeller
Press
Combination
Figure 5.4. Mean Household Availability of Fat Across Seasons.
32
The mean household availability of vitamin A (per adult equivalent) is presented in Table 5.15and Figure 5.5. The only apparent trend in vitamin A intake across seasons was the decrease forall groups at the pre-harvest lean season. Expeller households reported the highest availability atthe baseline, Press households reported the highest availabilities at the peak oil-pressing andpost-harvest seasons, and Combination households reported the highest availability at the pre-harvest lean season. This season*group interaction was significant at p<0.04.
Table 5.15. Mean Household Availability of Vitamin A (Retinol Equivalents per AdultEquivalent) Across Seasons.
Repeated measures analysis of variance:I. Group effect: not significant.II. Seasonal effect: not significant.III. Season*Group Interaction: p<0.04.
350.2
518.4
402.8384.1
609.8
472.6
369.6
523.9517.7
414.8
393.4
474.7
325
375
425
475
525
575
625
Post-Harvest(Baseline)
Peak OilPressing
Pre-HarvestLean
Post-Harvest
Season
Vita
min
A (
RE
) pe
r A
dult
Equ
ival
ent
Expeller
Press
Combination
Figure 5.5. Mean Household Availability of Vitamin A Across Seasons.
33
The mean household consumption of oil (liters) during the last 7 days (per adult equivalent) ispresented in Table 5.16 and Figure 5.6. The major trend in oil consumption was a peak duringthe peak oil-pressing season with a return to near baseline levels during the following seasons.This seasonal effect was significant at p<0.0001. After the baseline, the Press and Combinationhouseholds consumed more oil than the Expeller households at all other seasons. This groupeffect approached significance at p<0.08.
Table 5.16. Mean Household Consumption of Oil (liters per Adult Equivalent) During theLast 7 Days Across Seasons.
Repeated measures analysis of variance:I. Group effect: p<0.08.II. Seasonal effect: p<0.0001.III. Season*Group Interaction: not significant.
0.18
0.21
0.17
0.150.13
0.22
0.20
0.33
0.14
0.23
0.12
0.33
0.10
0.15
0.20
0.25
0.30
0.35
Post-Harvest(Baseline)
Peak OilPressing
Pre-HarvestLean
Post-Harvest
Season
Oil
Con
sum
ptio
n (li
ters
) pe
r A
dult
Equ
ival
ent
Expeller
Press
Combination
Figure 5.6. Mean Household Consumption of Oil During the Last 7 Days Across Seasons.
34
Dietary Intake of Women
The women's mean intake of kilocalories is presented in Table 5.17 and Figure 5.7. The majortrend in women's intake of kilocalories was the decrease during the pre-harvest lean season withsimilar intakes for all other seasons. This seasonal effect was significant at p<0.0008. At thebaseline, the Expeller and Press women consumed more kilocalories than the Combinationwomen. After the baseline, the Press and Combination women consumed more kilocalories thanthe Expeller women at all other seasons, but especially at the pre-harvest lean season. At thepre-harvest lean season the Combination and Press women consumed 27.9 and 25.9 percentmore calories, respectively, than the Expeller women. The large differences between groups atthe peak oil-pressing season and pre-harvest lean season resulted in a season*group interactionthat was significant at p<0.0002. In other words, although women in all groups had similarintakes at the baseline and post-harvest seasons, the Press and Combination women hadsignificantly higher intakes at the peak oil-pressing and pre-harvest lean seasons.
Table 5.17. Women's Mean Intake of Kilocalories Across Seasons.
Repeated measures analysis of variance:I. Group effect: not significant.II. Seasonal effect: p<0.0008.III. Season*Group Interaction: p<0.0002.
35
2065 b
2622 a
1808 b
2441 a
2598 a
2560 a,b
2556 a
2276 a
2398 a
2155 b
2312 a
2469 a
1700
1900
2100
2300
2500
2700
Post-Harvest(Baseline)
Peak OilPressing
Pre-HarvestLean
Post-Harvest
Season
Kilo
calo
ries
Expeller
Press
Combination
Numbers in the same season followed by different letters are significantly different at p<0.05.
Figure 5.7. Women's Mean Intake of Kilocalories Across Seasons.
36
The women's mean intake of protein is presented in Table 5.18 and Figure 5.8. Womenconsumed the greatest amounts of protein during the peak oil-pressing season and the leastamounts during the pre-harvest lean season. This seasonal effect was significant at p<0.0001.At the baseline, the Press and Expeller women consumed more protein than the Combinationwomen. After the baseline, the Press and Combination women consumed more protein than theExpeller women at all other seasons. This group effect was significant at p<0.005. At the peakoil-pressing season, the Press and Combination women consumed 41.3 and 17.5 percent moreprotein than the Expeller women. At the pre-harvest lean season, the Press and Combinationwomen consumed 35.0 and 31.4 percent more protein than the Expeller women. Thisseason*group interaction was significant at p<0.0007.
Table 5.18. Women's Mean Intake of Protein (g) Across Seasons.
Repeated measures analysis of variance:I. Group effect: p<0.005.II. Seasonal effect: p<0.0001.III. Season*Group Interaction: p<0.0007.
97.9 a
67.2 b
97.2 a
86.5 b
107.6 a
122.2 a
90.7 a
98.3 a 98.2 a
88.3 a
84.1 a
101.6 b
65
75
85
95
105
115
125
Post-Harvest(Baseline)
Peak OilPressing
Pre-HarvestLean
Post-Harvest
Season
Pro
tein
(g) Expeller
Press
Combination
Numbers in the same season followed by different letters are significantly different at p<0.05.
Figure 5.8. Women's Mean Intake of Protein Across Seasons.
37
The women's mean intake of carbohydrates is presented in Table 5.19 and Figure 5.9. Womenconsumed the greatest amounts of carbohydrates during the baseline and the least amountsduring the peak oil-pressing season. This seasonal effect approached significance at p<0.06. Atthe baseline, the Press and Expeller women consumed more carbohydrates than the Combinationwomen. After the baseline, the Press and Combination women consumed more carbohydratesthan the Expeller women at all other seasons and especially at the pre-harvest lean season. Atthe pre-harvest lean season, Press and Combination women consumed 19.6 and 19.2 percentmore protein than the Expeller women. This season*group interaction was significant atp<0.003.
Table 5.19. Women's Mean Intake of Carbohydrates (g) Across Seasons.
Repeated measures analysis of variance:I. Group effect: not significant.II. Seasonal effect: p<0.06.III. Season*Group Interaction: p<0.003.
300.4
331.8
318.8
273.3
346.3
266.8
326.8
307.7
345.6
325.8
280.5285.2
260
270
280
290
300
310
320
330
340
350
Post-Harvest(Baseline)
Peak OilPressing
Pre-HarvestLean
Post-Harvest
Season
Car
bohy
drat
es (
g)
Expeller
Press
Combination
Figure 5.9. Women's Mean Intake of Carbohydrates Across Seasons.
38
The women's mean intake of fat is presented in Table 5.20 and Figure 5.10. The intake of fatwas relatively unchanged except for a large decrease at the pre-harvest lean season. Thisseasonal effect was significant at p<0.0001. At the peak oil-pressing season, the Combinationand Press women consumed 31.1 and 27.9 percent more fat than the Expeller women. At thepre-harvest lean season, the Combination and Press women consumed 47.8 and 35.2 percent fatthan the Expeller women. This season*group interaction was significant at p<0.0002.
Table 5.20. Women's Mean Intake of Fat (g) Across Seasons.
Repeated measures analysis of variance:I. Group effect: not significant.II. Seasonal effect: p<0.0001.III. Season*Group Interaction: p<0.0002.
101.1 a
51.0 b
101.2 a
76.5 b
99.8 a
68.9 a
97.9 a94.0 a
95.3 a
75.4 a82.8 a
100.4 a
45
55
65
75
85
95
105
Post-Harvest(Baseline)
Peak OilPressing
Pre-HarvestLean
Post-Harvest
Season
Fat
(g) Expeller
Press
Combination
Numbers in the same season followed by different letters are significantly different at p<0.05.
Figure 5.10. Women's Mean Intake of Fat Across Seasons.
39
The women's mean intake of vitamin A is presented in Table 5.21 and Figure 5.11. Womenconsumed the greatest amounts of vitamin A at the baseline and post-harvest seasons and theleast amounts at the pre-harvest lean season. This seasonal effect was significant at p<0.008. Atthe baseline, the Expeller women had the greatest consumption of vitamin A. After the baseline,the Press women had the greatest consumption of vitamin A at the peak oil-pressing season, andthe Combination women had the greatest consumption of vitamin A at the post-harvest season.This season*group interaction was significant at p<0.003.
Table 5.21. Women's Mean Intake of Vitamin A (RE) Across Seasons.
Repeated measures analysis of variance:I. Group effect: not significant.II. Seasonal effect: p<0.008.III. Season*Group Interaction: p<0.03.
303.5
205.9240.1
880.4
316.2230.0
359.7
409.5 465.2
234.5348.7
402.6
150
250
350
450
550
650
750
850
950
Post-Harvest(Baseline)
Peak OilPressing
Pre-HarvestLean
Post-Harvest
Season
Vita
min
A (
RE
)
Expeller
Press
Combination
Figure 5.11. Women's Mean Intake of Vitamin A Across Seasons.
40
Dietary Intake of Children
The children's mean intake of kilocalories is presented in Table 5.22 and Figure 5.12. Childrenconsumed the most kilocalories during the peak oil-pressing and post-harvest seasons and theleast kilocalories during the baseline and pre-harvest lean seasons. This seasonal effect wassignificant at p<0.0001. At the baseline, the Expeller children consumed 30.6 percent morekilocalories than the Combination children and 35.9 percent more than the Press children. Afterthe baseline, the trend was reversed and the Combination and Press children consumed morekilocalories than the Expeller children at all other seasons. The Combination children consumed43.8, 26.1, and 14.7 percent more kilocalories than the Expeller children at the peak oil-pressing,pre-harvest lean, and post-harvest seasons, respectively. The Press children consumed 30.8,11.7, and 14.4 percent more kilocalories than the Expeller children at the peak oil-pressing, pre-harvest lean, and post-harvest seasons, respectively. This season*group interaction wassignificant at p<0.0001.
Table 5.22. Children's Mean Intake of Kilocalories Across Seasons Adjusted for Age andSex.
Repeated measures analysis of variance:I. Group effect: not significant.II. Seasonal effect: p<0.0001.III. Season*Group Interaction: p<0.0001.
41
1238 a
1322 a
978 b978 a972 b
1279 a,b
1093 a
1417 a
1013 b
1407 a
1233 a
1421 a
950
1050
1150
1250
1350
1450
Post-Harvest(Baseline)
Peak OilPressing
Pre-HarvestLean
Post-Harvest
Season
Kilo
calo
ries
Expeller
Press
Combination
Numbers in the same season followed by different letters are significantly different at p<0.05.
Figure 5.12. Children's Mean Intake of Kilocalories Across Seasons Adjusted for Age andSex.
42
The children's mean intake of protein is presented in Table 5.23 and Figure 5.13. The intake ofprotein followed a similar pattern to the intake of kilocalories. Children consumed the greatestamounts of protein during the peak oil pressing and post-harvest seasons and the least amountsduring the baseline and pre-harvest lean seasons. This seasonal effect was significant atp<0.0001. At the baseline, the Expeller children consumed more protein than the Combinationand Press children. After the baseline, this trend was reversed and the Press and Combinationchildren consumed more protein than the Expeller children at all other seasons. The Press andCombination children consumed 57.3 and 55.9 percent more protein at the peak oil-pressingseason than the Expeller children. At the pre-harvest lean season, the Combination and Presschildren consumed 32.8 and 24.1 percent more protein than the Expeller children. Thisseason*group interaction was significant at p<0.0001 and there was a group effect that wassignificant at p<0.03.
Table 5.23. Children's Mean Intake of Protein (g) Across Seasons Adjusted for Age andSex.
Repeated measures analysis of variance:I. Group effect: p<0.03.II. Seasonal effect: p<0.0001.III. Season*Group Interaction: p<0.0001.
43
44.1 b
32.3 b33.6 b
42.9 a
53.2 a
40.2 a,b
52.9 a
33.1 b
50.7 a,b
43.0 a
52.5 a
35.8 a,b
30
35
40
45
50
55
Post-Harvest(Baseline)
Peak OilPressing
Pre-HarvestLean
Post-Harvest
Season
Pro
tein
(g) Expeller
Press
Combination
Numbers in the same season followed by different letters are significantly different at p<0.05.
Figure 5.13. Children's Mean Intake of Protein Across Seasons Adjusted for Age and Sex.
44
The children's mean intake of carbohydrates is presented in Table 5.24 and Figure 5.14. At thebaseline, the Expeller children consumed about 40 percent more carbohydrates than the Pressand Combination children. After the baseline, the Combination and Press children consumedmore carbohydrates at each season than the Expeller children. This season*group interactionwas significant at p<0.0001. There were no statistically significant seasonal effects or groupeffects.
Table 5.24. Children's Mean Intake of Carbohydrates (g) Across Seasons Adjusted for Ageand Sex.
Repeated measures analysis of variance:I. Group effect: not significant.II. Seasonal effect: not significant.III. Season*Group Interaction: p<0.0001.
168.6 a
162.1 a
151.1 a
201.2 a
186.5 a
169.6 a
164.0 a
145.1 b
196.2 a
187.6 a186.4 a
143.0 b135
145
155
165
175
185
195
205
Post-Harvest(Baseline)
Peak OilPressing
Pre-HarvestLean
Post-Harvest
Season
Car
bohy
drat
es (
g)
Expeller
Press
Combination
Numbers in the same season followed by different letters are significantly different at p<0.05.
Figure 5.14. Children's Mean Intake of Carbohydrates Across Seasons Adjusted for Ageand Sex.
45
The children's mean intake of fat is presented in Table 5.25 and Figure 5.15. Children consumedthe greatest amounts of fat during the peak oil-pressing and the post-harvest seasons with leastamounts during the pre-harvest lean season. This seasonal effect was significant at p<0.0001.At the baseline, the Expeller children consumed more fat than the Combination and Presschildren. After the baseline, the trend had reversed and the Combination and Press childrenconsumed more fat at all other seasons. At the peak oil-pressing season, the Combination andPress children consumed 88.0 and 69.5 percent more fat than the Expeller children. At the pre-harvest lean season, the Combination and Press children consumed 56.1 and 24.8 percent morefat than the Expeller children. This season*group interaction was significant at p<0.0002 andthere was a group effect that was significant at p<0.05.
Table 5.25. Children's Mean Intake of Fat (g) Across Seasons Adjusted for Age and Sex.
Repeated measures analysis of variance:I. Group effect: p<0.05.II. Seasonal effect: p<0.0001.III. Season*Group Interaction: p<0.0001.
46
47.4 a
23.4 b
28.9 b
42.4 a
55.2 a
29.2 a,b
48.9 a
31.8 a
52.7 a
36.5 a
54.3 a
35.9 a
20
25
30
35
40
45
50
55
60
Post-Harvest(Baseline)
Peak OilPressing
Pre-HarvestLean
Post-Harvest
Season
Fat
(g) Expeller
Press
Combination
Numbers in the same season followed by different letters are significantly different at p<0.05.
Figure 5.15. Children's Mean Intake of Fat Across Seasons Adjusted for Age and Sex.
47
The children's mean intake of vitamin A is presented in Table 5.26 and Figure 5.16. The majortrend in children's vitamin A intake was the dip at the pre-harvest lean season; however, thisseasonal effect was not statistically significant. At the baseline, Expeller children consumedmore vitamin A than the Combination and Press children. After the baseline, the trend hadreversed and the Combination and Press children consumed more vitamin A at all other seasons.The Combination and Press children consumed 226.4 and 157.8 percent more vitamin A than theExpeller children at the peak oil-pressing season and 312.6 and 203.5 percent more at the post-harvest season. This season*group interaction was significant at p<0.05.
Table 5.26. Children's Mean Intake of Vitamin A (RE) Across Seasons Adjusted for Ageand Sex.
Repeated measures analysis of variance:I. Group effect: not significant.II. Seasonal effect: not significant.III. Season*Group Interaction: p<0.05.
48
82.3 a88.3 a93.2 b
208.6 a
167.5 a
112.2 a
147.1 a,b146.3 a
257.3 a
108.0 a
211.0 a
174.9 a
70.0
90.0
110.0
130.0
150.0
170.0
190.0
210.0
230.0
250.0
270.0
Post-Harvest(Baseline)
Peak OilPressing
Pre-HarvestLean
Post-Harvest
Season
Vita
min
A (
RE
)
Expeller
Press
Combination
Numbers in the same season followed by different letters are significantly different at p<0.05.
Figure 5.16. Children's Mean Intake of Vitamin A Across Seasons Adjusted for Age andSex.
49
During the pre-harvest lean season, Expeller children consumed 22 out of the 27 foods includedin the food frequency questionnaire less frequently than the Press and Combination children.The Press children had the highest frequency of consumption of 4 out of 6 high fat/high proteinfoods. Those foods were eggs, meat, fish, and butter with the difference for butter beingsignificant at p<0.0002. The Combination children had the highest frequency of consumptionfor the other 2 high fat foods, roasted groundnuts and mafe jaro (dried fish), with the differencesbeing significant at p<0.01 and p<0.003, respectively. The Press children also had the highestfrequency of consumption of 5 out of 5 nutrient dense weaning foods with significant differencesfor churah gerteh (p<0.0009), mono and groundnut paste (p<0.0001), and mono and sesamepaste (p<0.02). The Combination children had the highest frequencies of consumption for 5 of 6nutrient dense table foods with significant differences for benachin (p<0.02), nyakatango(p<0.04), and palm oil fish stew (p<0.006). The Expeller children had the lowest frequencies ofconsumption for all high fat/high protein foods, nutrient dense weaning foods, and nutrient densetable foods. The Expeller children did have the highest frequencies of consumption for 2 of 5high moisture/low calorie weaning foods with the difference for cherreh and water significant atp<0.02.
Nutritional Status of Women
The mean body mass index of non-pregnant/lactating women is presented in Table 5.27. Ageneral trend can be seen for non-pregnant/lactating women as their body mass index decreasedfrom the peak oil-pressing season to the pre-harvest lean season and then returned to nearprevious levels at the post-harvest season. This trend was true for both the Expeller and Presswomen; however, the Combination women did not experience the decrease in body mass indexduring the pre-harvest lean season. The only significant differences were for body mass indexbetween groups at the pre-harvest lean season (p<0.03).
Table 5.27. Mean Body Mass Index (kg/m2) of Non-Pregnant/Lactating Women AcrossSeasons.
Group BaselineMean�S.D.
Peak Oil-PressingMean�S.D.
Pre-HarvestMean�S.D.
Post-HarvestMean�S.D.
Expeller 22.2�4.3(n=20)
22.0�3.7(n=14)
20.9�2.6a
(n=17)21.4�2.8(n=18)
Press 20.4�1.8(n=24)
20.3�1.9(n=18)
19.5�1.8a
(n=14)20.1�2.1(n=11)
Combination 21.5�3.1(n=30)
22.4�3.7(n=20)
22.0�3.3b
(n=25)22.0�3.6(n=21)
a Numbers in the same column followed by different letters are significantly different at p<0.05.
50
Nutritional Status of Children
The children's mean weight-for-height z-scores are presented in Table 5.28 and Figure 5.17.Except for the peak oil-pressing season, the Combination and Press children recorded higherweight-for-height z-scores than the Expeller children. The Expeller children experienced amarked increase in weight-for-height z-scores at the peak oil-pressing season and then decreasedto near previous levels. The Combination and Press children experienced steadily increasingweight-for-height z-scores across seasons except for the pre-harvest lean season when theirscores leveled off. By the post-harvest season, the Press and Combination children were 0.28and 0.76 standard deviations above the reference weight-for-height standard, whereas theExpeller children were 0.63 standard deviations below the standard. The seasonal effect wassignificant at p<0.0009, and the group effect approached significance at p<0.10.
Table 5.28. Children's Mean Weight-for-Height Z-Scores Across Seasons.
Repeated measures analysis of variance:I. Group effect: p<0.10.II. Seasonal effect: p<0.0009.III. Season*Group Interaction: not significant.
51
-0.63 b-0.52 a
0.16 a
-0.88 a
0.76 a
-0.31 a-0.31 a
-0.66 a
0.28 a,b
-0.13 a
-0.16 a-0.33 a
-1
-0.8
-0.6
-0.4
-0.2
0
0.2
0.4
0.6
0.8
1
Post-Harvest(Baseline)
Peak OilPressing
Pre-HarvestLean
Post-Harvest
Season
Sta
ndar
d D
evia
tion
Expeller
Press
Combination
Numbers in the same season followed by different letters are significantly different at p<0.05.
Figure 5.17. Children's Mean Weight-for-Height Z-Scores Across Seasons.
52
The children's mean weight-for-age z-scores are presented in Table 5.29 and Figure 5.18. Theweight-for-age z-scores for Combination and Study children increased steadily across seasonsexcept for a slight leveling off during the pre-harvest lean season. The Expeller children,however, experienced a marked increase in weight-for-age at the peak oil-pressing season andthen returned to previous levels. The seasonal effect was significant at p<0.0001. At the peakoil-pressing season, the Expeller children recorded height-for-age z-scores that were about half astandard deviation higher than the Combination and Press children. By the post-harvest season,the Combination and Press children recorded weight-for-age z-scores that were at least a half astandard deviation higher than the Expeller children. This season*group interaction wassignificant at p<0.005.
Table 5.29. Children's Mean Weight-for-Age Z-Scores Across Seasons.
Repeated measures analysis of variance:I. Group effect: not significant.II. Seasonal effect: p<0.0001.III. Season*Group Interaction: p<0.005.
53
-1.22 b-1.25 a
-0.51 a
-1.40 a
-0.69 a,b
-1.18 a-1.06 a
-1.48 a
-0.50 a
-0.95 a
-1.00 a
-1.33 a
-1.6
-1.4
-1.2
-1.0
-0.8
-0.6
-0.4
-0.2
0.0
Post-Harvest(Baseline)
Peak OilPressing
Pre-HarvestLean
Post-Harvest
Season
Expeller
Press
Combination
Numbers in the same season followed by different letters are significantly different at p<0.05.
Figure 5.18. Children's Mean Weight-for-Age Z-Scores Across Seasons.
54
The children's mean height-for-age z-scores are presented in Table 5.30. There were no readilyapparent trends and no statistically significant differences in children's height-for-age z-scoreseither between groups or across seasons.
Table 5.30. Children's Mean Height-for-Age Z-Score Across Seasons.
Repeated measures analysis of variance:I. Group effect: not significant.II. Seasonal effect: not significant.III. Season*Group Interaction: not significant.
Household Oil Production and Availability
The mean time of oil availability and the mean initial purchasing time of oil for the householdare presented in Table 5.31. The Combination households reported longer times of availabilityand longer times before oil was purchased than either the Press or Expeller households; however,these differences were not statistically significant. The lack of a statistically significantdifference in the time of availability and time of initial purchase of oil could be a result ofhouseholds only growing sufficient quantities of sesame to meet short term oil needs.
Table 5.31. Length of Oil Availability and Time of Initial Purchase in Months in Relationto the Peak Oil-Pressing Season of March.
Time of Initial Oil Purchase After PeakOil-Pressing (March) in Months
Combination (n=41) 3.9(1.7) 0 - 7
55
CHAPTER 6: DISCUSSION
The results of this study clearly show that seasonal fluctuations in household food supply andindividual consumption continue to exist in The Gambia. These seasonal fluctuations follow theexpected trend of highs in the post-harvest season and lows in the pre-harvest lean season.Similarly, the nutritional status of women and children in The Gambia is effected by thisseasonal fluctuation. The trend of women's intake of kilocalories in The Gambia peaking at thepost-harvest season and reaching a low point at the pre-harvest lean season has been welldocumented (Prentice et al, 1981)101. The women's intake of kilocalories closely follows thistrend; however, current intakes are considerably higher than those obtained by Prentice et al(1981)102. This may be due to the high enrollment of women in the GAFNA/CRSsupplementation project. The FAO recommended daily average energy requirement for womenaged 18 to 30 years is 2350 kilocalories (WHO, 1985)103. After the baseline, women in the Pressand Combination groups exceeded this recommendation by 2 to 10 percent at all seasons exceptthe pre-harvest lean season. Even at the pre-harvest lean season, Press and Combination womenconsumed 96.9 and 98.4 percent of the FAO recommendation, respectively. The Expellerwomen, on the other hand, consumed only 87.9 percent of the recommended requirement at thepeak oil-pressing season and only 76.9 percent at the pre-harvest lean season. The mean intakeof protein for women in every group and at every season exceeded the FAO recommended safelevel of protein intake for women aged 18 to 30 years.
As expected, the children's mean intake of kilocalories followed a similar pattern to the women'swith the highest intakes in the post-harvest season and lowest intakes in the pre-harvest leanseason. None of the reported mean intakes met the FAO (WHO, 1985)104 daily average energyrequirement for children aged 3 to 5 years. The Combination and Press children came closest tomeeting the requirement at the post-harvest season with intakes equal to 91.6 and 91.4 percent ofthe recommended. After the baseline, the Expeller children never consumed more than 79.9percent of the recommended intake of kilocalories and only consumed 63.1 percent at both thepeak oil-pressing and pre-harvest lean season. On the other hand, at the pre-harvest lean season,the Combination and Press children consumed 79.5 and 70.1 percent of the recommended intakeof kilocalories, respectively.
Both women and children in the Press and Combination groups derived a greater percentage oftheir caloric intake from protein and fat than Expeller women at both the peak oil-pressingseason and the pre-harvest lean season. This suggests that women and children in the Press andCombination groups were consuming a higher proportion of high protein/high fat foods than theExpeller women. This is supported by both the household oil consumption and the children'sfood frequency. Households in the Press and Combination groups consumed more oil per personat the peak oil-pressing and pre-harvest lean seasons than those in the Expeller group. Children
101 Prentice AM, Whitehead RG, Roberts SB, Paul AA. Long-Term Energy Balance in Child-Bearing GambianWomen. The American Journal of Clinical Nutrition. 1981;34:2790-99.102 Prentice AM, Whitehead RG, Roberts SB, Paul AA. Long-Term Energy Balance in Child-Bearing GambianWomen. The American Journal of Clinical Nutrition. 1981;34:2790-99.103 WHO. Energy and Protein Requirements. Report of a Joint FAO/WHO Expert Consultation. WHO TechnicalReport Series 724. World Health Organization. Geneva, Switzerland. 1985.104 WHO. Energy and Protein Requirements. Report of a Joint FAO/WHO Expert Consultation. WHO TechnicalReport Series 724. World Health Organization. Geneva, Switzerland. 1985.
56
in the Combination and Press groups consumed high fat/high protein foods, nutrient denseweaning foods, and nutrient dense table foods more frequently than children in the Expellergroup during the peak oil-pressing and pre-harvest lean seasons. Women and children in theExpeller group derived a greater percentage of their caloric intake from carbohydrates than thosein the Press or Combination groups at both the peak oil-pressing and pre-harvest lean seasons.This suggests that Expeller women and children were consuming a higher proportion of cerealsand grains during these seasons than the Press and Combination women. For children, this wasalso supported by the food frequency data as the children in the Expeller group consumed lowcalorie weaning foods more frequently than those in the Press and Expeller groups.
For the non-pregnant/lactating women, body mass index followed the expected pattern of adecrease at the pre-harvest lean season and an increase at the post-harvest season. This trend ofseasonal fluctuations in body weight in The Gambia has been well documented and closelyfollows the seasonal fluctuations in intake (Lawrence et al, 1987; Prentice et al, 1981)105,106.
The weight-for-height z-scores of children exhibited seasonal fluctuations similar to thoseobserved by Tomkins et al (1986)107 in urban Gambia, by Adams (1994)108 in Mali, and byBenefice et al (1984)109 in Senegal. Children in the Press and Combination groups made steadygains in weight-for-height throughout the study and surpassed children in the Expeller groups bythe last data collection. The weight-for-age z-scores of children followed a similar trend to theweight-for-height z-scores. The Combination and Press children drew closer to the standardweight-for-age with each season. The Expeller children, on the other hand, remained at nearbaseline levels. These steady gains in nutritional status for the Press and Combination childrenoccurred without the losses incurred by children in the Expeller group during the pre-harvest leanseason. This was likely due to the higher caloric intakes of children in the Press andCombination groups during the peak oil and pre-harvest lean seasons.
Vitamin A availability and intake fluctuated considerably across seasons as expected. Bates et al(1994)110 reported that the intake of vitamin A precursors by women in The Gambia was lowestin December and peaked in June with intermediate intakes in March and August; however,Villard and Bates (1987)111 reported considerable variations in the year to year timing of peaksand troughs in vitamin A intake by Gambian women. Household availability and women'sintakes of vitamin A were similar, if not slightly lower, than those reported for women in the
105 Lawrence M, Coward WA, Lawrence F, Cole TJ, Whitehead RG. Fat Gain During Pregnancy in Rural AfricanWomen: The Effect of Season and Dietary Status. American Journal of Clinical Nutrition. 1987;45:1442-50.106 Prentice AM, Whitehead RG, Roberts SB, Paul AA. Long-Term Energy Balance in Child-Bearing GambianWomen. The American Journal of Clinical Nutrition. 1981;34:2790-99.107 Tompkins AM, Dunn DT, Hayes RJ, Bradley AK. Seasonal Variations in the Nutritional Status of UrbanGambian Children. British Journal of Nutrition. 1986;56:533-43.108 Adams AM. Seasonal Variations in Nutritional Risk Among Children in Central Mali. Ecology of Food andNutrition. 1994;33:93-106.109 Benefice E, Chevassus-Agnes S, Barral H. Nutritional Situation and Seasonal Variations for PastoralistPopulations of the Sahel (Senegalese Ferlo). Ecology of Food and Nutrition. 1984;14:229-47.110 Bates CJ, Prentice AM, Paul AA. Seasonal Variations in Vitamins A, C, Riboflavin and Folate Intakes and Statusof Pregnant and Lactating Women in a Rural Gambian Community: Some Possible Implications. European Journalof Clinical Nutrition. 1994;48:660-8.111 Villard L and Bates CJ. Dietary Intake of Vitamin A Precursors by Rural Gambian Pregnant and LactatingWomen. Human Nutrition: Applied Nutrition. 1987;41A:135-45.
57
Gambia by Bates et al (1994) 112. Overall, the vitamin A availability and intake was highest atthe baseline and post-harvest seasons, intermediate at the peak oil-pressing season, and lowest atthe pre-harvest lean season. The Press and Combination groups seemed to have slightly higherintakes during the peak oil-pressing and post-harvest lean seasons. The decrease during the pre-harvest lean season may simply be due to a decrease in the amount of food consumed. TheFAO/WHO (1988)113 recommended level of daily vitamin A intake for women of 500 RE wasnot met by women in any group except for those in the Expeller group (880.4 RE) at thebaseline. After the baseline, women in the Combination group consumed 69.7 and 93.0 percentof the FAO recommendation at the peak oil-pressing and post-harvest seasons, respectively. Thevitamin A intake of children followed a similar pattern to that of the women. The children neverexceeded more than 64.3 percent of the FAO/WHO (1988)114 recommended safe level of intakefor children aged 1 to 6 years. After the baseline, the Expeller children consumed less than 25percent of the recommended intake of vitamin A during all seasons, whereas the Combinationchildren consumed 52.8 and 64.3 percent of the FAO recommendation at the peak oil-pressingand post-harvest seasons, respectively.
The household trend of highest availabilities of kilocalories during the post-harvest season andlowest intakes during the peak oil-pressing was not expected. The highest availability ofkilocalories was expected to occur in the post-harvest season, and the lowest availability ofkilocalories was expected to occur in the pre-harvest lean season. One possible explanation forthis is that the household dietary data does not include snacks, foods that were eaten outside ofthe household, or foods that were prepared for and eaten solely by the target woman and child.These types of foods would be more readily available during the peak oil-pressing season whengroundnuts and other snack foods are plentiful, and these types of foods would only be evident inthe woman's and the child's dietary recalls.
The peak in oil consumption during the peak oil-pressing season was expected as manyhouseholds press most or all of their sesame immediately following the harvest. The increase inoil consumption by Press and Combination households is evident in their higher availabilities offat per capita than Expeller households at the peak oil-pressing season and in their higher amountof kilocalories derived from fat. The Press households also have a higher availability of proteinper capita than the Combination or Expeller households and a higher percentage of kilocaloriesderived from protein. This could be the result of increased income from access to ram presstechnology.
112 Bates CJ, Prentice AM, Paul AA. Seasonal Variations in Vitamins A, C, Riboflavin and Folate Intakes and Statusof Pregnant and Lactating Women in a Rural Gambian Community: Some Possible Implications. European Journalof Clinical Nutrition. 1994;48:660-8.113 FAO. Requirements of Vitamin A, Iron, Folate and Vitamin B12. Report of a Joint FAO/WHO ExpertConsultation. Food and Agriculture Organization of the United Nations. Rome, Italy. 1988.114 FAO. Requirements of Vitamin A, Iron, Folate and Vitamin B12. Report of a Joint FAO/WHO ExpertConsultation. Food and Agriculture Organization of the United Nations. Rome, Italy. 1988.
58
CHAPTER 7: CONCLUSIONS
Findings of this study indicate that women and children with access to ram press technology(either alone or in combination with motorized expeller technology) experience much less of aseasonal fluctuation in food consumption and nutritional status than those without ram presstechnology. For women, access to ram press technology means a 465 to 500 kilocalorieadvantage during the rainy season over women without ram press technology. This hassignificant implications toward women's weight loss, the birth weight of children, and infantmortality during the rainy season. Children of women with access to ram press technologyenjoyed a 115 to 255 kilocalorie advantage during the rainy season over children of womenwithout access to ram press technology. This results in an increase in nutritional status over thecourse of the year rather than the yearly stagnation experienced by children of women withoutaccess to ram press technology. At the household level, access to ram press technology meansan increase in oil consumption, especially during the peak oil-pressing season. Access to rampress technology seems to have an impact on the vitamin A intake of households, women, andchildren, during the peak oil-pressing and post-harvest seasons.
Findings of this study also indicate that when women are given choices as to which technology isbest for them, they will maximize their benefits from the available technologies. Over half of thehouseholds that were using ram press technology only, started using a combination of ram pressand motorized expeller technology. These households consumed slightly more calories and oilthan those using only ram press technology. Women in these households had similar caloricintakes to those using only ram press technology. Children in these households had slightlygreater caloric intakes and a better nutritional status than those using only ram press technology.These women were able to combine the benefits of both technologies to the advantage of themand their families.
59
CHAPTER 8: RECOMMENDATIONS
1. Further study of the role of ram press technology in stabilizing the seasonal fluctuations infood consumption and nutritional status of women and children in The Gambia.
2. Further development of the ram press to enhance its utilization by women and to exploretechnologies that would allow greater quantities of oil to be pressed manually.
3. Replication of this study in other areas of West Africa where women are growing oil seedsthat would be appropriate for ram press technology.
4. Continued support by Catholic Relief Services in The Gambia to promote manufacturing,utilization, and long term maintenance of ram press technology.
5. Continued support by Catholic Relief Services in The Gambia to maintain the currentmotorized oil expellers in order to prolong their life as long as possible.
60
REFERENCES
1. Adams AM. Seasonal Variations in Energy Balance Among Agriculturalists in Central Mali:Compromise or Adaptation? European Journal of Clinical Nutrition. 1995;49:809-23.
2. Adams AM. Seasonal Variations in Nutritional Risk Among Children in Central Mali.Ecology of Food and Nutrition. 1994;33:93-106.
3. Annegers JF. Seasonal Food Shortages in West Africa. Ecology of Food and Nutrition.1973;2:251-7.
4. Awor, S. The Training of Technician/Mechanic, Trainers and Users on the Instillation,Operation and maintenance of the Ram Press at Illiassa and Njau Sesame GrowersAssociations of the Catholic Relief Services. Appropriate Technology International. Banjul,The Gambia. December, 1994.
5. Bates CJ, Prentice AM, Paul AA. Seasonal Variations in Vitamins A, C, Riboflavin andFolate Intakes and Status of Pregnant and Lactating Women in a Rural Gambian Community:Some Possible Implications. European Journal of Clinical Nutrition. 1994;48:660-8.
6. Bates CJ, Villard L, Prentice AM, Paul AA, Whitehead RG. Seasonal Variations in PlasmaRetinol and Carotenoid Levels in Rural Gambian Women. Transactions of the Royal Societyof Tropical Medicine and Hygiene. 1984;78:814-17.
7. Benefice E, Chevassus-Agnes S, Barral H. Nutritional Situation and Seasonal Variations forPastoralist Populations of the Sahel (Senegalese Ferlo). Ecology of Food and Nutrition.1984;14:229-47.
8. Branca F, Pastore G, Demissie T, Ferro-Luzzi A. The Nutritional Impact of Seasonality inChildren and Adults of Rural Ethiopia. European Journal of Clinical Nutrition. 1993;47:840-50.
9. Bray G. Pathophysiology of Obesity. American Journal of Clinical Nutrition. 1992;55:488S-494S.
10. Briend A, Hasan KZ, Aziz KMA, Hoque BA, Henry FJ. Measuring Change in NutritionalStatus: A Comparison of Different Anthropometric Indices and the Sample Sizes Required.European Journal of Clinical Nutrition. 1989;43:769-78.
11. Ceesay SM, Prentice AM, Cole TJ, Foord F, Weaver LT, Poskitt EME, Whitehead RG.Effects of Birth Weight and Perinatal Mortality of Maternal Dietary Supplements in RuralGambia: 5 Year Randomized Controlled Trial. British Medical Journal. 1997;315:786-90.
12. Chambers R, Longhurst R, Pacey A. Seasonal Dimensions to Rural Poverty. Frances PinterLimited. London, Great Britain. 1981.
13. Dean AG, Dean JA, Burton AH, Dicker RC. Epi Info Version 5: A Word Processing,Database, and Statistics Program for Epidemiology on Microcomputers. Stone Mountain,GA. USD, Incorporated. 1990.
14. Diaz E, Goldberg GR, Taylor M, Savage JM, Sellen D, Coward WA. Effects of DietarySupplementation on Work Performance in Gambian Laborers. American Journal of ClinicalNutrition. 1991;53:803-11.
15. Dop M-C, Milan Ch, Milan Cl, N’Diaye AM. The 24-Hour Recall for Senegalese Weanlings:A Validation Exercise. European Journal of Clinical Nutrition. 1994;48:643-53.
16. Dop M-C, Milan Ch, Milan Cl, N’Diaye AM. Use of the Multiple-Day Weighed Record forSenegalese Children During the Weaning Period: A Case of the ‘Instrument Effect’.American Journal of Clinical Nutrition. 1994;59(suppl):266S-8S.
17. Downes B, Downes R, Foord F, Weaver L. Outcome of Low Birth Weight Infants in a WestAfrican Village. Journal of Tropical Pediatrics. 1991;37:106-10.
61
18. Dugdale AE and Payne PR. A Model of Seasonal Changes in Energy Balance. Ecology ofFood and Nutrition. 1987;19:231-45.
19. Durnin JVGA. Low Body Mass Index, Physical Work Capacity and Physical ActivityLevels. European Journal of Clinical Nutrition. 1994;48(Suppl.):S39-S44.
20. FAO. Food Composition Table for Use in Africa. Nutrition Division of FAO. Rome, Italy.1968.
21. FAO. Requirements of Vitamin A, Iron, Folate and Vitamin B12. Report of a JointFAO/WHO Expert Consultation. Food and Agriculture Organization of the United Nations.Rome, Italy. 1988.
22. Ferguson EL, Gibson RS, Opare-Obisaw C. The Relative Validity of the Repeated 24-HourRecall for Estimating Energy and Selected Nutrient Intakes of Rural Ghanaian Children.European Journal of Clinical Nutrition. 1994;48:241-52.
23. Freudenberger, KS. Evaluation of the Sesame Growers Association. Banjul, The Gambia.Catholic Relief Services. Unpublished. January, 1994.
24. Galton-Fenzi, JD. Project Report to Determine the Potential of Expanding SesameProduction in The Gambia. Labat-Anderson Inc. Unpublished. 1992.
25. Geuns M, Niemeijer R, Hoorweg J. Child Nutrition in the Pre-Harvest Season in Kenya.East African Medical Journal. 1991;68(2):93-105.
26. Haddad LJ and Bouis HE. The Impact of Nutritional Status on Agricultural Productivity:Wage Evidence from the Philippines. Oxford Bulletin of Economics and Statistics.1991;53(1):45-68.
27. Harpham T. Urban Health in The Gambia: A Review. Health and Place. 1996;2(1):45-9.28. Heini AF, Minghelli G, Diaz E, Prentice AM, Schultz Y. Free-Living Energy Expenditure
Assessed by Two Different Methods in Rural Gambian Men. European Journal of ClinicalNutrition. 1996;50:284-9.
29. Hudson GJ and Day KC. Water Content of the Rural Gambian Diet. Nutrition ReportsInternational. 1989;400(2):335-9.
30. Hudson GJ, John PMV, Paul AA. Variation in the Composition of Gambian Foods: TheImportance of Water in Relation to Energy and Protein Content. Ecology of Food andNutrition. 1980;10:9-17.
31. Hudson GJ. Food Intake in a West African Village: Estimation of Food Intake from a SharedBowl. British Journal of Nutrition. 1995;73:551-69.
32. Hyman, EL. Production of Edible Oils For the Masses and By the Masses: The Impact ofthe Ram Press in Tanzania. World Development. 1993;21(3):429-43.
33. ICN Focal Point. The Gambia Nutrition Country Paper for the International Conference onNutrition. Republic of The Gambia, Ministry of Health, Nutrition Unit. 1992.
34. James WPT, Ferro-Luzzi A, Waterlow JC. Definition of Chronic Energy Deficiency inAdults: Report of a Working Party of the International Dietary Energy Consultative Group.European Journal of Clinical Nutrition. 1988;42:969-81.
35. Jelliffe D and Jelliffe EFP. Community Nutritional Assessment: With Special Reference toLess Technically Developed Countries. Oxford University Press. Oxford, England. 1989.
36. Kennedy E and Garcia M. Body Mass Index and Economic Productivity. European Journalof Clinical Nutrition. 1994;48(Suppl.):S45-S55.
37. Kennedy E. The Effects of Sugarcane Production on Food Security, Health, and Nutrition inKenya: A Longitudinal Analysis. International Food Policy Research Institute. Washington,D.C. Research Report 78, December 1989.
62
38. King FS and Burgess A. Nutrition for developing countries. Oxford University Press.Oxford, New York. 1993.
39. Kumar SK and Hotchkiss D. Consequences of Deforestation for Women’s Time Allocation,Agricultural Production, and Mutrition in Hill Areas of Nepal. International Food PolicyResearch Institute. Washington, D.C. Research Report 69. October, 1988.
40. Lawrence M and Whitehead RG. Physical Activity and Total Energy Expenditure of Child-Bearing Gambian Village Women. European Journal of Clinical Nutrition. 1988;42:145-60.
41. Lawrence M, Coward WA, Lawrence F, Cole TJ, Whitehead RG. Fat Gain DuringPregnancy in Rural African Women: The Effect of Season and Dietary Status. AmericanJournal of Clinical Nutrition. 1987;45:1442-50.
42. McCrae JE and Paul AA. Foods of Rural Gambia. Medical Research Council Dunn NutritionCentre. Cambridge, United Kingdom. 1996.
43. Minghelli G, Schultz Y, Whitehead R, Jequier E. Seasonal Changes in 24-h and BasalEnergy Expenditures in Rural Gambian Men as Measured in a Respiration Chamber.American Journal of Clinical Nutrition. 1991;53:114-20.
44. Moore SE, Cole TJ, Poskitt EME, Sonko BJ, Whitehead RG, McGregor IA, Prentice AM.Season of Birth Predicts Mortality in Rural Gambia. Nature. 1997;388:434.
45. Mora JO, Herrera MG, Suescan J, de Navarro L, Wagner M. The Effects of NutritionalSupplementation on Physical Growth of Children at Risk of Malnutrition. American Journalof Clinical Nutrition. 1981;34:1885-92.
46. N-Squared Computing Incorporated. Nutritionist IV Version 2.0 Users’ Manual for IBM andCompatible Computers. Salem, OR. 1992.
47. Panter-Brick C. Seasonality of Energy Expenditure During Pregnancy and Lactation forRural Nepali Women. American Journal of Clinical Nutrition. 1993;57:620-8.
48. Patore G, Branca F, Demissie T, Ferro-Luzzi A. Seasonal Energy Stress in an EthiopianCommunity: An Analysis of the Impact at the Household Level. European Journal of ClinicalNutrition. 1993;47:851-62.
49. Prehm MS, Silva-Barbeau I. Thrasher Research Proposal of Ram Press Technology forSesame Oil Production in The Gambia. VPI&SU. 1994.
50. Prentice AM and Cole TJ. Seasonal Changes in Growth and Energy Status in the ThirdWorld. Proceedings of the Nutrition Society. 1994;53:509-19.
51. Prentice AM, Cole TJ, Foord FA, Lamb WH, Whitehead RG. Increased Birthweight AfterPrenatal Dietary Supplementation of Rural African Women. American Journal of ClinicalNutrition. 1987;46:912-25.
52. Prentice AM, Whitehead RG, Roberts SB, Paul AA. Long-Term Energy Balance in Child-Bearing Gambian Women. The American Journal of Clinical Nutrition. 1981;34:2790-99.
53. Prentice AM, Whitehead RG, Watkinson M, Lamb WH, Cole TJ. Prenatal DietarySupplementation of African Women and Birth-Weight. The Lancet. 1983:489-92.
54. Rankins J, Green NR, Tremper W, Stacewitcz-Sapuntzakis M, Bowen P. Undernutrition andVitamin A Deficiency in the Department of Linguere, Louga Region of Senegal. AmericanJournal of Clinical Nutrition. 1993;58:91-7.
55. Reardon T, Delgado C, Matlon P. Determinants and Effects of Income DiversificationAmongst Farm Households in Burkina Faso. The Journal of Development Studies.1992;28(2):264-96.
63
56. Roberts SB, Paul AA, Cole TJ, Whitehead RG. Seasonal Changes in Activity, Birth Weightand Lactational Performance in Rural Gambian Women. Transactions of the Royal Societyof Tropical Medicine and Hygiene. 1982;76(5):668-78.
57. Rosetta L. Sex Differences in Seasonal Variations of the Nutritional Status of Serere Adultsin Senegal. Ecology of Food and Nutrition. 1986;18:231-44.
58. Samba-Ndure K, Jawneh A, Jome KM, Prehm MS, Silva-Barbeau I. Small Scale Sesame OilProduction: A Means of Child Nutrition Security in The Gambia. Semi-Annual ProjectProgress Report. Thrasher Award #029034. 1995.
59. Semega-Janneh I. Infant and Young Child Feeding Practices in The Gambia: With Emphasison Breast-Feeding. Republic of The Gambia, Ministry of Health, Nutrition Unit. June, 1991.
60. Silva-Barbeau I, Haidara M, Sissoko H, Berthe M, Caldwell J, Barbeau WE. AddressingChild Feeding Concerns of Women Farmers in Mali: Composition and Effects on ChildNutrition of a Locally Developed Weaning Food. Ecology of Food and Nutrition. In Press.1998.
61. Teokul W, Payne P, Dugdale A. Seasonal Variations in Nutritional Status in Rural Areas ofDeveloping Countries: A Review of the Literature. Food and Nutrition Bulletin. 1986;8(4):7-10.
62. Tompkins AM, Dunn DT, Hayes RJ, Bradley AK. Seasonal Variations in the NutritionalStatus of Urban Gambian Children. British Journal of Nutrition. 1986;56:533-43.
63. U.S. Department of Agriculture, Agricultural Research Service. 1997. USDA NutrientDatabase for Standard Reference, Release 11-1. Nutrient Data Laboratory Home Page,http://www.nal.usda.gov/fnic/foodcomp
64. Villard L and Bates CJ. Dietary Intake of Vitamin A Precursors by Rural Gambian Pregnantand Lactating Women. Human Nutrition: Applied Nutrition. 1987;41A:135-45.
65. Von Braun J, Puetz D, Webb P. Irrigation Technology and Commercialization of Rice inThe Gambia: Effects on Income and Nutrition. International Food Policy Research Institute.Washington, D.C. Research Report 75, August 1989.
66. Wandell M, Holmboe-Ottesen G, Manu A. Seasonal Work, Energy Intake and NutritionalStress: A Case Study from Tanzania. Nutrition Research. 1992;12:1-16.
67. Webb P. Intrahousehold Decisionmaking and Resource Control: The Effects of RiceCommercialization in West Africa. International Food Policy Research Institute. February,1989.
68. WHO, Working Group. Use and Interpretation of Anthropometric Indicators of NutritionalStatus. Bulletin of the World Health Organization. 1986;64:929-41.
69. WHO. Energy and Protein Requirements. Report of a Joint FAO/WHO Expert Consultation.WHO Technical Report Series 724. World Health Organization. Geneva, Switzerland. 1985.
64
APPENDIX A. Standardized Gram Weight Measures of Common Household Cooking andEating Utensils.
Local NameWolof/Mandinka
English Name Use of Utensil Capacity
Mbatu/Dosser Big Calabash Measure cherreh,Nyelleng, and rice
720g
Kalera/Kalero Cooking Pot Cooking 3 kg rice
Cork/Calama Wooden/Metal Calabash Eating 40g (mono with orwithout sour milk)
Kudu/Kojaro 5ml Tablespoon Eating 25g (mono with orwithout sour milk)40g (for Nyelleng, OilStew, and Benachin)
Kudu/Kojaro 2ml Teaspoon Feeding Children 10g (mono with orwithout sour milk)
APPENDIX B. Standardized Gram Weight Measures of Handful Sizes for Men, Women,and Children.
Handful Size
Food Male Female Child (2-5) Tablespoon
Nyeleng 40g 30g 10g 40g
Vegetable Oil Stew (with rice) 40g 30g 10g 40g
Palm Oil Stew (with rice) 40g 30g 10g 40g
Nyankatangho/Mbahal 40g 30g 10g 40g
Tia Durangho/Domoda 40g 30g 10g 40g
Benachin 40g 30g 10g 40g
Cherreh 40g 30g 10g 40g
66
APPENDIX C. Glossary of Mandinka and Wolof Food Names with Their EnglishEquivalents.
Local Food Name English EquivalentBenachin (w)* Whole grain rice, cooked with oil and vegetables,
often with fish or meat.Cherreh (w) or Futo (m) Millet flour pellets steamed three times.Churah Gerteh (w) Lumpy gruel of rice and raw groundnuts pounded
together.Mbahal (w) or Nyakatango (m) Whole grain boiled rice with groundnuts or locust
beans.Churo (m) Rice porridge, often eaten with sour milk and sugar.Nyelleng (w) Steamed millet grids, often eaten with groundnut
paste sauce.Serreng (w) Boiled and steamed millet.Mono (m) or Rui (w) Thin porridge of boiled flour pellets.Tia Durango (m) or Domoda (w) Roasted groundnut sauce, often eaten with rice.Tia Yilaringho (m) Roasted groundnuts.Jambo and Tia (m) Leaf sauce with groundnuts.Jambo (m) General term for leaf or leaf sauce.Akara (w) Fried pounded beans.Padan (w) Boiled rice.Mafe Biswap (w) or Kucha (m) Sauce made with leaves.Plasas (b) Palm oil sauce with leaves and groundnuts.Futu Kanya (m) A mixture of dried cherreh, groundnut paste and
sugar.Tia Kere Durango (m) Raw pounded groundnut sauce, often eaten with
CSB Flour 4956 CORN SOY BLEND-DRY 1 small calabash = 60gFutukanya 4957 FUTUKANYA 1 cup = 200gMono with MilkPap with Milk
4958 MONO-WITH MILK
Mono OnlyMono and SugarPap OnlyPap and SugarCherreh and Sugar
4959 MONO-WITHOUT MILK
Nyakatango 4960 NYAKATANGONyelleng 4961 NYELLENG 1 dosser = 775gTia DurangoJambo and Tia Durango
4962 TIA DURANGO
CSB Mono with Milk 4963 CSB MONO-WITH MILKCSB Mono Only 4964 CSB MONO-WITHOUT MILKBread and Tea 4965 BREAD AND TEACherreh and Milk 4967 CHERREH AND MILKCSB Mono (unspecified) 4968 CSB MONO-AVERAGEMono (unspecified)Pap (unspecified)
4969 MONO-AVERAGE
Bread and Milk 4971 BREAD AND MILKBread and Butter 4973 BREAD AND BUTTERCherreh and Fish 4974 CHERREH AND FISHCassava and Sauce 4975 CASSAVA AND SAUCEBread and Sugar 4976 BREAD AND SUGARWonjo DrinkWonjo & Sugar & WaterGreen Leaves Drink
4977 GREEN LEAVES DRINK
Bread and Sauce 4978 BREAD AND SAUCEBread and Mayonnaise 4979 BREAD AND MAYONAISSEMono and Groundnut Paste 4980 MONO AND GROUNDNUT PASTEChurah Gerteh and Milk 4981 CHURAH GERTEH AND MILKCherreh from CSB 4982 CHERREH-CORN SOY BLEND 1 dosser = 720gNyelleng from CSB 4983 NYELLENG-CORN SOY BLEND 1 dosser = 720gMono from CSB 4984 MONO-CORN SOY BLEND 1 dosser = 720g
74
APPENDIX F. Questionnaire.
Small Scale Sesame Production: Evaluating Benefits to Women'sand Children's Nutrition Security in The Gambia
(12-95)
BASELINE STUDY QUESTIONAIRRE - PART 1
A. VILLAGE AND HOUSEHOLD SHEET
Date of Interview (mo/yy/dy):../../../ Interviewer ID#: ../Village name:................ Village #: ../Household ID#: ../../ Target Woman ID#: ../../../
1. How many times in the last 6 months has the target child gone to thehealth center? ....................
2. Where is the nearest Lummo? ....................3. How much does it cost to get there? ....................4. How many households are there in this compound? ...........5. "Target" woman's marital status. (...)
Married/polygamous (p) Married/nuclear (n)Single (s) Widowed/Divorced (w)
6. Ethnic group: (...)Mandinka (m) Wolof (w) Fulani (f) Jola (j) Other (o)
7. Mother's DOB (AGE) (day/month/year) ../../../(Use local calendar of events)
8. Child's DOB (AGE) (day/month/year) ../../../(Use IWC or local calendar of events)
9. Child's Sex: Male (m) Female (f) (...)
10. Child's Birth Weight? (if known) ___.___kg(Ask mother for her ante-natal card or child's infant welfare card)
11. Did target woman attend any schooling? (...)Yes (y) No (n)
11.1 If yes: How many years of schooling? _____yrs
11.2 Madrassa school (m) Primary school (p) Other (o) (...)
12. Who is the head of the household ?Father (f) Father-in-law (i) Husband (h) Target woman (w)Brother-in-law (b) Other specify ...................
13. What is your relationship to the head of household? .........
Directions: This sheet is to be filled out at the baseline. The respondent isthe "target" mother. See protocol for description of "target" mother and
child.
75
14. List all members of your household.
Names Ages in Years Sex Relationship to Head of Household
76
To Be Verified On Seasonal Surveys After Baseline
14.1 Household Profile (for seasonal surveys after baseline)Enumerators - refer to A.14 (List of Household members) and ask if anyone hasjoined or left the household who usually eat there since the last visit. Forchanges list name, sex, age and if persons have left or joined.
NAME SEXM/F
AGE MARK ONE
JOINED LEFT
77
15. Source of your household's potable water: (...)
Piped water (p) Hand pump (h) Cement lined well (c)Traditional well (t) River (r)
16. Do you feel that you have enough water for your household needs throughthe year?
Yes (y) No (n) (...)
16.1 If NO why do you feel that you don't have enough water for yourhousehold needs? .............................................................................................................................
17. Do you feel that the water that you have is good water? (Good in termsof cleanliness)
Yes (y) No (n) (...)
17.1 If NO, why not? .....................................................................................................................................................................................................
QUALITATIVE ASSESSMENT
18. HOUSEHOLD Wealth Rank relative to other households in the compound or(in the village if the compound has only one household).
In a focus group situation determine the basis for wealth in the village (forexample those who grow peanuts and acreage, or number of livestock).Depending on the village definition of wealth, identify someone in thevillage who knows relatively well everyone and have him/her rank thesehouseholds. You can use pieces of paper, stones, peanut grain, etc. The mostwealthy receives 5 pieces and the poorest 1 piece. You can use more than oneinformant and use the average rankings.
Wealth 5------4------3------2------1------Poor.
Ranking for this household. (...)
19. a. Do you grow black sesame? (...)Yes (y) No (n)
b. Do you grow white sesame? (...)Yes (y) No (n)
List crops other than black or white sesame that the target woman grows:
20. List the type and number of livestock the target woman raises:
Type of Livestock Number raised
20. Is target woman involved in any other income generating activity?
Yes (y) No (n) (...)
21. If yes, please list the type of activity woman is involved in?...................................................................................................................................................................................................
79
B. MOTHER AND CHILD HEALTH DATA(Three times per Year)
Date of the Interview (mo/yy/dy):../../../ InterviewerID#: ../Household ID#: ../../ Target Woman ID#: ../../../Target Child ID#: ../../../.../
1. Child's weaning status. (...)
Weaned completely (w) Mixed diet(breast milk and table foods) (m)
If still breast fed, how many times per day does the child breast feed?.........................................................................
3. Has child had diarrhea in the last 2 wks? (...)
Yes (y) No (n)
3.1 If yes, for how many days in the last 2 weeks has the child had diarrhea? ___________days
3.2 Has the child been otherwise ill in the last 7 days? (...)
Yes (y) No (n)
3.3. If yes specify(name of illness).....................................
4.0 Is mother enrolled in the HNP Program (GAFNA/CRS Program)? (...)
Yes (y) No (n)
4.1 If yes, how long have they been enrolled? _________months
4.2 Reproductive Status:
a. Pregnant (trimester? 1, 2 or 3): (p1) (p2) (p3) (...)
C. FREQUENCY OF CONSUMPTION OF SESAME OIL, OIL RICH FOODS AND OF FOODS INFLUENCED BY INCOME (PRESTIGIOUS FOODS, FOODS BOUGHT IN THE MARKET,
SPECIAL SNACKS, ETC.)
TARGET CHILD ONLY!
1. ASK THE MOTHER/FATHER/OR WHOEVER THE CHILD SPENDS MOST TIME WITH. On theaverage, how often did the child eat the following foods in the past 4weeks.
[For foods that have an asterisk (*) mark whether a sesame product was used inthe preparation] Yes (y) No (n)]
Quantity in local measures. How many ladles, handfuls, pieces size, cup size?
PROBES:Was there something (snack, beverage, etc) that you ate between this time andthat time?2. Meats: What part of the meat did you eat?
1See Coding Guide.
I. REFER TO THE PROTOCOL ON HOW TO GATHER THIS INFORMATIONAsk the mother to recall all the foods and beverages that she consumedin the preceding 24 hours (from the time that she got up to the timethat she went to bed yesterday.).
85
F. CHILD DIETARY DATA(24-hour recall)
Date of the Interview (mo/yy/dy):__/__/__/ InterviewerID# __/Village # __/ Household ID#__/__/ Target Child ID# __/__/__/___/
Foods (that youprepared for theHousehold yesterday)
*Quantity in local measures. How many ladles, handfuls, pieces size, cupsize?PROBES:Was there something (snack, beverage, etc) that you ate between this time andthat time?2. Meats: What part of the meat did you eat?
I.ASK THE MOTHER AND FATHER AND WHOEVER ELSE TOOK CARE OF THE CHILD IN THE LAST24-HOURS TO REMEMBER AND REPORT ALL THE FOODS AND BEVERAGES THAT THE CHILDCONSUMED IN THE PRECEDING 24-HOURS. Refer to the protocol on how to gatherthese data.
86
G. HOUSEHOLD STORAGE OF OIL, CAKE, AND SEED.
1. OIL (Control)
How long did the oil you pressed last season last with the household?__________
2. CAKE (Control)
How long did the cake you pressed last season last with the household?__________
3. SEEDS (Study)
When was the last time you pressed for oil the seeds from the last years harvest?__________
4. OIL BUYING (Both)
What time of year do you buy oil? (non-sesame oil)__________
87
APPENDIX G. Protocol.
Small Scale Sesame Production: Evaluating Benefits to Women's and Children's Nutrition Security in TheGambia (11-95)
NOTES TO QUESTIONAIRE
The baseline will be done in two parts: I. Village and Household Information and Women and Children's HealthData; and II. Dietary Data
I. SET UP OF BASE-LINE
SAMPLE
Target woman and childWoman needs to be: growing black sesame, have preschool aged child 1-5 years of age, be willing to participate insurvey and small group discussions during each season.
Target child1-5 years of age; if woman has more than one preschool child 1-5 then randomly select which one will be the targetchild. Could gather age and anthropometrics on all children in case there is a lack of nutritionally vulnerablechildren in the household.
Study and control householdsThey should be similar in size and of lower socio-economic status to ensure that there are nutritionally vulnerablechildren.
II. INFORMATION ON SPECIFIC QUESTIONS
A. Village and Household Sheet
Heading--see categories on coding sheet to fill this in
A.7.: Use local calendar of events as needed to help her identify her birthyear.
A.8.: Use local calendar and get as accurate to the month and day as possible.
A.14.: It is important to distinguish the members of the household who eat together from the same cooking potregardless of how they are related. All the people, their age and gender that eat from the same cooking pot shouldbe listed here. Since this is an important piece of information this will be checked every season when the foodconsumption information is gathered.
A.18.: Household Wealth Ranking - The determination of household’s wealth for the pilot was assessed first byconvening a meeting of three key informants to determine the criteria for wealth ranking. The criteria establishedwas based on (I) the farm families’ ability to produce enough food for their families throughout the year, (ii)households access to labor and farm machinery and (iii) households involvement in non-farm activities such as pettytrading and salaried employment. The key informants were people who knew the village well and did not comefrom households involved in the study.
88
B. Mother and Child Health Data
B.3 and 3.1 - Not sure if this is a problem in translating "the last 2 weeks". The idea here is to ask for the last 14days if the child has been ill and if so how many days.
B.4.3 - Anthropometric Measurements
Technique:
After removing the shoes, the subject should stand up as straight as possible on a flat floor, or board, by the scalewith feet together and with heels, buttocks, shoulders, and back of the head touching the upright. The feet should bebare, flat on the floor, and with the heels almost together. The legs should be straight and the shoulders relaxed.The head should be looking straight forward and held comfortably erect, with the lower border of the orbit in thesame horizontal plane as the external auditory meatus (the 'Frankfort plane'). The arms should be hanging by thesides in a natural manner ('stand tall and look straight ahead').
The headpiece, which can be a metal bar or a wood block, is gently lowered, compressing the hair, and makingcontact with the top of the head. If a child has unusually thick hair, it should be taken into account. When anassistant is available, this person should place one hand against the child's knees to detect any flexion of the lowerlimbs and the other hand on the upper surfaces of his feed to detect any lifting of the heels from firm contact withthe floor or platform. The eyes of the measurer should be as level as possible with the reading to avoid optical errors(parallax).
Length:
In very young children, recumbent length (crown-heel length) has to be employed, as the measurement of standingheight is either impossible or very inaccurate with an uncooperative child. It is usually measured with a length-board, often made of wood.
Recumbent length is usually considered necessary for children up to 2 or 3 years of age or until the child can standunassisted, according to different authorities. Length can be more than standing height by as much as 2 cm (nearly 1in), so that the procedure used has to be reported.
Community Nutritional Assessment by Derrick B. Jelliffe and E. F. Patrice Jelliffe, pages 78 and 81.
C. Frequency of Consumption of Sesame Oil, Oil Rich Foods and Foods Influenced by Income
This is for the target child for the last four weeks. The food frequency should be done with the health data and noton the day that you are doing the 24 hour recall.
89
PART II. PROTOCOL FOR THE COMPLETION OF THE DIETARY DATA COLLECTION
I. Household Data, 24-hour recall, and Food Frequency
D. Household consumption data
The purpose of this is to get accurate measurements of what a household is consuming in a day. From this data, wecan get per capita age adjusted intake.
INTERVIEWERS: Interviewers have to be intimately knowledgeable about the foods, the cooking methods, theutensils used and common household measurements.
BEFORE: Before starting any type of dietary collection you need to:
1. Visit the villages and observe cooking patterns, methods, utensils and common household measures.2. You may need to buy a set of these utensils and measures to carry around as models. For instance, if the
woman say a ladle, a spoon, a can, you should have these to show and ask. Is this the size of the spoon you arereferring to? Or small? Or bigger? Was the ladle or spoon "heaping" full? Or was it "leveled"?
3. Convert these household measures into grams and/or use if you or Dunn have them gram equivalents fromstandard measure.
4. Since people eat in a common bowl by hand, you have to standardize "handfuls". Determine what is the weightof a "woman's handfuls", a "man's handfuls" and small child's handfuls". Preferably of different foods forexample, rice, rice with sauce, etc, etc.
Convert these into grams.
5. Pieces of meat. What is the size normally eaten? Leg or breast of chicken? Etc. Convert these into grams.6. Oil? What is the amount of oil used in different dishes? Convert these into grams or ml.
E and F. The 24-hour recall
The 24-hour recall should be done on two nonconsecutive days. This is to capture more of the variability in anindividual's diet because eating behaviors on consecutive days are correlated.AVOID: holidays and weekends. These days may be special and therefore non-representative.
90
A. Usual problems and how to avoid
want to please enumeratorcan’t rememberhard to know how much they atecan’t remember things that they didn’t eat at homeB. What to keep in mind
1. Order that they do the recall in -? Start from the most recent thing eaten and work backwards.2. Time - ask was there anything else between what they mentioned in one time period and another. Don’s ask
what they had in the morning directly if you think there is a chance they didn’t have anything. Most people willsay what they usually have although they didn’t that particular day.
3. Careful use of questions - not leading ones. Didn’t you have something else? versus Was there anything else?4. Making sure you got it all and understand - women may cook the same dish quite differently or they may say
some type of dish that could have any number of different things in it. If they tell you they made a mixed dishthen ask what it had in it being sure to find out how much oil they used, etc. Spices don’t matter but all theother types of ingredients will.
C. Go through exactly then as it should be done - see below.
91
D. BEGIN:
I would like you to tell me everything (you or the name of child or woman) had to eat and drink all day yesterday(name the day) from midnight to midnight. (You can also use the last full day starting with the last meal andworking backwards, use either approach depending which you think enumerators and village women will understandbetter). Include everything (you or name or child or woman) ate and drank at home and away--even snacks, coffee,etc, etc.
LET THE WOMAN TELL YOU. DO NOT INTERRUPT THE RESPONDENT.
When the respondent stops,
ASK:
Anything else?Give respondent enough time to recall.
SAY:
Now I'm going to ask you specific questions about the foods and beverages we just listed. When you rememberanything else you ate or drank as we go along, please tell me.
SAY:
About what time (or when) did (you or name of child) begin to (eat/drink) the (name the food)? Here we areinterested if the food was eaten as "breakfast", "lunch", "supper" or in between meals "snacks".
ASK:
How much did (you or child's name) eat of the (name the specific food)?How many Ladles or spoons (heaping or leveled)? Handfuls? pieces (size, small, medium, big?), or cup? (half cup,quarter cup, etc.)
AT THE END:
Is there anything else? Do you remember anything else that you (or child's name) ate or drank yesterday?
92
APPENDIX H. Adult Equivalents Used to Adjust Household Consumption Measures.
a WHO. Energy and Protein Requirements. WHO Technical Report Series 724. World Health Organization. Geneva,Switzerland. 1985.
94
VITA
Stephen G. Hull
Current Address Permanent Address1002 Kentwood Dr., Apt. B P.O. Box 243Blacksburg, VA 24060 Goshen, VA 24439(540) 961-7838 (540) 997-0381
Education
Master of Science, Human Nutrition, Foods and Exercise, May 1998Virginia Polytechnic Institute and State University (Virginia Tech), Blacksburg, VAThesis: The Stabilizing Effects of Sesame Oil Extraction Technologies on SeasonalFluctuations in Food Consumption and Nutritional Status of Rural Farming Householdsin The Gambia.Advisor: William E. Barbeau
Bachelor of Science, Forestry, August, 1988Virginia Polytechnic Institute and State University (Virginia Tech), Blacksburg, VA
Experience
Research Assistant, Small Scale Sesame Production in The Gambia, West Africa,Department of Human Nutrition, Foods and Exercise, VA Tech, Blacksburg, VA,August 1996 - Present
- Code 24-hour recalls and food frequency data using Nutritionist IV software.- Perform statistical analysis of dietary data using SAS software.- Travel to The Gambia and train a Gambian nutrition specialist in coding of dietary data.
Research Assistant, Peanut CRSP,Office of International Research and Development, Virginia Tech, Blacksburg,January 1998 - Present
- Identify and contact key informants in order to obtain relevant literature.- Conduct a literature search for relevant research including gray literature.- Write abstracts for all relevant literature and develop a database of resources.
Research Assistant, Child and Adult Care Food Program,Department of Human Nutrition, Foods and Exercise, VA Tech, Blacksburg, VA,August 1997 - Present
- Develop a procedure for nutritional analysis of child care menus.- Train and supervise the dietary data coder in using Food Processor software.- Maintain quality control of dietary data and perform statistical analysis of the data.
95
Abstracts and Papers Published
Hull SG, Silva-Barbeau I, Prehm MS, Barbeau WE. Mitigating Caloric Deficits Duringthe Pre-Harvest Lean Period: Effects of Household Access to Sesame Oil ExtractionTechnologies on Diets of Women and Children in The Gambia. Paper presented atExperimental Biology '98, San Francisco, CA. April, 1998.
Silva-Barbeau I, Prehm MS, Samba-Ndure K, Jome K, Jawneh A, Hull SG. The Directand Indirect Benefits of Sesame Oil Production on the Nutritional Security of Womenand Children: The Experience With Woman-Led Monitoring of a Ram Press Technologyin The Gambia. Paper presented at the 16th International Congress of Nutrition,Montreal, Canada, July 27-August 1, 1997.
Hertzler AA, Bowens J, Hull SG. Developing Methods for Obtaining DietaryInformation from Preschoolers - A Pilot. Journal of the American Dietetic Association.1993;93(10):1159-61.
Reports Published
Silva-Barbeau I, Prehm MS, Hull SG, Samba-Ndure K, Jome K, Jawneh A, Sey A. SmallScale Sesame Oil Production: A Means to Improved Child Nutrition Security in TheGambia. Semi-Annual Project Report (7/1/97-12/31/97). Silva Associates. Blacksburg,VA. March, 1998.
Professional Conferences
"Experimental Biology '98" sponsored by the Federation of American Societies forExperimental Biology at San Franciso, CA. April, 1998.
"Methodology for the Detection of Nutrition Problems" Conference sponsored by theUniversidad Autonoma de Yucatan, Yucatan, Mexico. May, 1992.
Honors
P. Howard Massey "International Nutrition Scholar" Award, 1992