1 Human and Social Capital in Soweto in 1999 Preliminary report on field study: Background and descriptive statistics Barbara Piazza-Georgi ERSA & Department of Economics, University of the Witwatersrand ABSTRACT: This paper summarises data that were gathered in a 1,000-household survey done in Soweto in mid-1999. The purpose of the survey was to test some hypotheses on the interrelationships between certain kinds of human capital and of social capital; information was collected on education as well as other forms of human capital, and on a number of social capital factors under the categories of household composition, group membership, values, and various forms of trust. Household expenditure was also explored in detail, both as a proxy for household income and in order to determine current investment in human and social capital. This paper contains the tabulations of all the information gathered, plus a number of cross- tabulations showing links that are of possible interest. The statistics are adjusted for survey design, thus applicable to Soweto as a whole. KEYWORDS: Human capital, Social capital JEL Classification: A13,O15
Transcript
1
Human and Social Capital in Soweto in 1999
Preliminary report on field study:Background and descriptive statistics
Barbara Piazza-Georgi
ERSA & Department of Economics,
University of the Witwatersrand
ABSTRACT: This paper summarises data that were gathered in a 1,000-household survey donein Soweto in mid-1999. The purpose of the survey was to test some hypotheses on theinterrelationships between certain kinds of human capital and of social capital; information wascollected on education as well as other forms of human capital, and on a number of social capitalfactors under the categories of household composition, group membership, values, and variousforms of trust. Household expenditure was also explored in detail, both as a proxy for householdincome and in order to determine current investment in human and social capital.
This paper contains the tabulations of all the information gathered, plus a number of cross-tabulations showing links that are of possible interest. The statistics are adjusted for surveydesign, thus applicable to Soweto as a whole.KEYWORDS: Human capital, Social capitalJEL Classification: A13,O15
2
1 Description of the Study
1.1 Introduction and objectives
This paper documents the results of a household survey carried out in mid-1999 inSoweto, focusing on human capital and social capital factors. It will describe the samplingprocess and the interviewing stage, and it will aim to provide the basic descriptive statistical dataon income, human capital and social capital aspects as collected in the field study.
The purpose of the study is to understand and assess the implications of social and humancapital accumulation on income generation in households. 1
Classical economics emphasised capital – accumulated physical and financial wealth - asthe engine of the economy. Since then, our definition of capital has expanded to include humancapital; and we are in the process of integrating a third tier, comprising the formal and informalrelationships and institutional structures that make up human societies, under the term of socialcapital. The term, however, is still more comfortable to sociologists and political scientists than toeconomists, probably because of the difficulty in quantifying it. Still, during recent years socialcapital has begun to be integrated into economic growth and development theories, and intoempirical studies. A leadership role has been played in this regard by the World Bank; itproduced the first large-scale empirical study of the effect of social capital on income in adeveloping country setting (rural Tanzania)2.
From the point of view of the economist, an important objective of analysing the differentforms of human and social capital is to throw light on their influence on economic growth andincome distribution, whether directly (generally using macroeconomic tools), or through proxyindicators such as personal income (which allows an analysis at the micro level).
There is an abundance of empirical work, particularly at the macro level, on therelationship between various social, institutional and human capital factors and growthindicators3, mostly in the framework of endogenous growth theory. However, a point is raised byFedderke and Klitgaard (1998) that indicates the need for further empirical study on a differentplane: namely, that the considerable number of institutional and human capital factors identifiedas potentially playing a role in growth, do so within the framework of what the authors call a“web of associations” among themselves, correlations of various kinds, of various degrees ofrobustness and with often undetermined causal directions. Thus there is a very real potential forfinding spurious associations in such empirical growth studies. It may then be useful at this stageto take a step back from integrated growth studies, and instead to focus in detail on the probableloci of such “webs of associations”, to throw light on the actual micro-level mechanisms bywhich the different social indicators might influence growth, directly or indirectly.
1 The field study was financed by the World Bank, on the understanding that some additional questionswould be asked that were needed by the World Bank for a poverty and entrepreneurship survey beingcarried out by them country-wide.2 Narayan and Pritchett (1997).3 Fedderke (1997) gives a useful summary of this work.
3
1.2 Conceptual framework and hypotheses
This study intends to develop the “webs of association” approach mentioned above. Foursubcategories have been identified, two each for human and for social capital, that may haveinteresting implications and that have not been extensively studied so far; however, theinformation collected also allows numerous other subdivisions.
Human capital is divided into two main components, human skills capital andentrepreneurial skills; other elements that can be examined are informally acquired skills, on-the-job experience, and a number of specific aspects of entrepreneurial skills (see below).
Social capital is more difficult to dissect. The conventional distinction between“institutions” (formal organizational structures and legislation) and “social capital” (uncodifiedsocietal norms and values, civil society groups and links) does not seem sufficiently useful, and itwas decided for the purposes of this study (as it is being done increasingly in new research) todefine “social capital” as including both. On a theoretical level, there is still work to be done on abetter understanding of its dimensions, e.g. the measure of “embeddedness” after Granovetter andWoolcock, and “rationalisation” as proposed by Fedderke et al.4 Some useful practical categoriesthat have been used in the literature will be used, e.g. level of social trust, attitude to risk,participation in associational life, and work/leisure tradeoff rates. However, the maindifferentiation that it is intended to make follows Fedderke et al.’s concept of low-rationalisationand high-rationalisation social capital5.
On the basis of these subcategories, two central hypotheses were formulated, which willbe examined at a subsequent stage:
• In addition to operating directly, through lowering transaction costs, social capital alsooperates, to a significant extent, through human capital: it contributes to the latter’s formationby stimulating investment in it. Equally, human capital has an effect on investment in socialcapital.
• There may, on the other hand, be a significant substitution effect between some elements ofhuman and social capital. Specifically, it may be that the more traditional forms of socialcapital (family links, ethnic and religious group links, communitarian values) are negativelycorrelated with human capital. This hypothesis seems likely among other reasons because therelatively large time investment that such social capital needs, acquires a higher opportunitycost as a higher level of human capital is reached. It may be that in such a situation, differentforms of social capital are invested in, forms more suited to “modern” economic interaction.Such forms would be economic and professional associations, information networks, andentrepreneurial values. It is proposed to classify the different manifestations of social capitalinto “low-rationalisation” and “high-rationalisation”, using the word in the sense pioneered
4 Granovetter (1985), Woolcock (1998), Fedderke et al. (1999).5 Fedderke et al. (1999). Very briefly, Rationalisation refers to "the degree to which social capital movesfrom rules and norms that assume substantive content, to rules and norms that are procedural in character."This innovative definition focuses on the logic behind the rules, distinguishing between the simpler but lessflexible substantive rules, and those that focus more “upstream”, closer to the ultimate objectives to beattained – e.g. religious rules on periodic fasting as against modern social norms about healthy eating.Functionally, the rationalization aspect of social capital carries with it the potential of maintainingincreasing returns to scale, i.e. delaying the onset of diminishing returns.
4
by Fedderke et al., 1999. This division is expected to yield additional insights whencorrelated with human capital indicators.
In an attempt to throw light on the direction of causality of the links, the study hasgathered data not only on the present levels of these forms of human and social capital, but, in asmuch detail as possible, on investment in their creation/maintenance. The present levels ofdifferent categories can then be examined against the levels of investment in other categories,under the assumption that a present decision to invest is more likely to be the consequence thanthe cause of a present level of a particular element of human/social capital.
1.3 The sampling process
Soweto was chosen as the survey area. Being almost 100% Black6 , it is an area that isracially as homogeneous as it is possible to obtain in South Africa today, but quite highly diversein most other respects (income levels, social origins, ethnic groups, education); in particular, itallows an examination of both traditional and modern forms of association and of social capital. Itwas felt to be important to conduct the study in a racially homogeneous area, since apartheidpolicies caused significant differences in economic, social and educational conditions among themain racial groups, which would have obscured the human and social capital patterns that it isproposed to study.
It was aimed to capture data from about 1,500 respondents from 1,000 households. The finalnumber was 1,324 respondents from 1,038 households.
The sampling was done on a stratified two-stage cluster basis. The strata were the sixmain categories of residential areas:7
1. Pre-1940 council housing areas, the oldest and presumably containing the mostmature communities, which may make a difference as regards social capital.
2. Post-1945 council housing.3. Council housing built in connection with forced removals.
(Together, these areas account for 78.9% of the population. During the apartheid era withits strict influx control laws, the one-family houses were very frequently overcrowdedwith extended family members and other, often illegal, residents, to a reported average ashigh as 12 persons per home. Today, these areas still contain a high number of “backyardshacks” or permanent add-on structures, sub-let or used by extended family members.)
4. Private sector housing (7.6% of the population), of more recent origin and generallyassociated with higher income categories and younger, more urbanized age groups.5. Informal settlements and site-and-service areas (9.3% of the population).6. Workers’ hostels (4.2% of the population), built in the apartheid era for single men
working on the mines, now increasingly used by newly urbanized, low-incomepersons, and also increasingly by families.
The clustering was carried out as follows: 6 That is, following the South African racial categories of Black/Coloured/Indian/White. These are relevantto a social capital study because of the cultural, historical and community links among members of thesame category.7 This division was based on the Wits Department of Sociology’s “Soweto in Transition” report.
5
• The primary sampling units were identified with the help of the map drawn up by the Wits“Soweto in Transition” project (Annex). The whole territory was divided into 43 main zones(8 pre-1940, 14 post-1945, 5 forced removals era, 4 private sector, 5 informal settlements, 7hostels). Out of these 43, 12 were picked on a random basis, stratified into two per category8.
• On a second level of clustering, 3 clusters9 of 25 sites were picked from each primary cluster,giving a total of 36 clusters, by means of the following system:
- Council and private housing zones: using a large-scale map, three blocks werepicked at random, and an area of suitable size (150-200 sites) was marked off around each onthe basis of some unifying characteristics (e.g. common spatial arrangement, commonservices, common language). Within each of them, a starting site was picked at random andevery 5th to 7th site (depending on the size of the area marked off) interviewed from there, upto a total of 25. (Specific alternate sites were assigned to each chosen site, to cater for casesof absence or refusal.) Where there was more than one household living on a site, theinterviewer was trained to choose one by means of a list of random numbers.
- Informal settlements: in each zone, three starting points were established at random,and each fourth dwelling interviewed from there, forming a total of six clusters of 25 for thetwo areas.
-Hostels: the interviewers were given random number tables, and instructed to choosethree blocks by random, then choose a starting bed number in each block also by random, andinterview the occupant of every second bed, for a total of three clusters per hostel.
In the middle of the interviewing process, it was realized that this clustering methodwould result in excessively wide differences in weighting between the six different strata. It wasthen decided to drop 9 yet unsurveyed clusters in housing types 4,5,6 (private, informal, hostels);instead, a second random pick of 12 was made from the primary units of housing types 1,2 and3.10 One cluster of 25 was then picked from each area, with the same method as above.
Thus, in the end, 38 clusters11 were interviewed: 5 in Moroka, 4 each in Orlando East andMeadowlands, 3 each in Jabavu and Chiawelo, 2 each in Protea North, Diepkloof Ext.,Motsoaledi and Diepkloof, and 1 each in Molapo, Zondi, Naledi, Klipspruit, Jabulani, Moletsane,Zola, Orlando West, the informal settlement south of Orlando East, Lifateng hostel and Jabulanihostel. In addition, there are 130 questionnaires, obtained in the course of the pilot survey and the“training period” of each interviewer, which were not obtained from the clusters defined with thesystem above. These are included in the total sample with another identifying zone code. 12
8 The zones thus chosen were: Orlando East, Jabavu (pre-1945); Moroka, Chiavelo (post-1945); Diepkloof,Meadowlands (forced removals); Diepkloof ext., Protea North (private sector housing); south of OrlandoEast, Motsoaledi (informal settlements); Jabulani and Lifateng hostels.9 The number of clusters was relatively low in order to have larger numbers of units in one cluster, tocapture possible neighbourhood-based social capital aspects.10 The 9 clusters dropped were in Diepkloof ext., Protea North, 2 x Orlando E informal settlement, ISMotsoaledi, 2 x Jabulani hostel, 2 x Lifateng hostel. The 12 new areas picked were: 2 x Moroka,Meadowlands, Orlando East, Molapo, Zondi, Naledi, Klipspruit, Jabulani, Moletsane, Zola, Orlando West.11 One cluster in Diepkloof (forced removals area) was lost and not redone, thus the final figure of 38clusters instead of 39.12 A few clusters were not completed, and a few questionnaires had to be discarded, thus the final size ofthe sample is 1,038 households instead of 1,080.
6
Sampling questions at household level: interviewers were told to interview any one householdmember over 18 present, not necessarily the head of the household. In addition, they were askedto interview a second adult household member if there was one available, trying on an average toget an additional respondent in every third household. In fact, there resulted a sample of 1,038households and 276 additional respondents, for a total of 1,335 individual questionnaires.Lastly, from among individual respondents who had given their activity as “ self-employed orinformal business”, interviewers were asked to complete an additional questionnaire, for a total ofabout one such additional questionnaire for every five main questionnaires. (That is, they werenot asked to administer the additional questionnaire necessarily to every self-employedrespondent.)
1.4 The survey instrument.
The questionnaire was designed in three parts. The first gathered basic demographic,education and expenditure data on the entire household; the second gathered more detailed dataon the human and social capital of the individual respondent; the third part, focusing onentrepreneurial skills and attitudes, was administered only to self-employed and informallyemployed adult respondents who had completed the second part. In the end, 1,335 individualquestionnaires belonging to 1,038 households were returned, as well as 276 additionalquestionnaires on self-employment.
The design of the instrument was partly inspired by the World Bank’s Tanzania SocialCapital study (Narayan and Pritchett 1997). Three other studies were extensively drawn upon,namely Mears, Levine and Pieterse (1993a and b); the “Soweto in Transition” study by the WitsDepartment of Sociology (1997); and Rwigema and Karungu (1999) for the entrepreneurshipaspects.
1.5 The interviewing process.
The assistance of the Department of Economics at Vista University, Soweto, was sought,since their students are mostly from Soweto, thus at considerable advantage for such survey work.
A pilot study of about 25 households was conducted during June 1999, by four students,who then assisted in training the 27 interviewers of the main survey. The latter underwent twohalf-day training sessions, after which they had to fill in five questionnaires from among theirfamilies and neighbours. (These are the 130 questionnaires referred to above, that are not fromthe designated areas). These five returns were checked and problems discussed individually witheach interviewer; frequent mistakes were discussed in a further plenary session. The interviewerswere also given a three-page set of written instructions. They worked in their own time, but theywere told to do the bulk of their work in the evenings and during weekends, so that those withfull-time activities outside home should not be underrepresented among respondents. Thisobjective seems to have been reached, since persons in full-time employment, who constitute33% of all household members over 18, make up 31% of respondents.
All returns were checked by the author or by a senior staff member of Vista university.Occasionally an interviewer was told to redo some interviews. At the end, about one-tenth of thequestionnaires were re-surveyed , by two students chosen from among the best interviewers. Onthe basis of their findings, two batches of 25 questionnaires were re-done.
7
1.6 Presentation of the Data Set.
The Community Agency for Social Enquiry (CASE) (Johannesburg) undertook thecoding (separate coding sheets were filled in) and inputting of the results. CASE used its ownprofessional coders, then subcontracted the inputting; both activities were monitored byprofessional supervisors and appropriate quality control measures taken. A small number ofapparent coding or inputting errors were discovered in the course of data analysis, but they couldbe corrected by referring back to the original questionnaires, which remain available.
The raw data was converted to a single STATA file of 2076 observations by 343variables, from which further datasets are constructed. (The number of observations in theoriginal dataset is double the number of questionnaires, because each questionnaire was inputtedtwice in order to leave room for additional Part 2s.) Data analysis was undertaken with the use ofSTATA and EXCEL.
2 Exploratory Data Analysis
The remainder of this preliminary report will contain a descriptive report of the responsesto the questionnaire. It has been decided to include in this overall descriptive analysis, all the datagathered at the request of the World Bank (see footnote 1) which are not directly related to thecore hypotheses of the study.
As mentioned before, respondents filled in Part 1 on behalf of their household, and Part 2on their own behalf; in a number of cases when an additional adult was present and was willing tobe interviewed, s/he was administered an additional Part 2. Thus the survey includes a total of1,038 Part 1’s and 1,335 Part 2’s, 300 of which are additional individual respondents within thesame household as a previous respondent. There are 276 observations that extend to Part 3(entrepreneurship); however 48 Part 3’s were administered to persons who had not filled in thesecond part, thus they cannot be correlated with individual information on human and socialcapital; leaving 229.
For most of the analysis, however, the 130 questionnaires done during the pilot andtraining phase of the interviewers, are being excluded, since these respondents were not chosenby the same random methodology as the rest. Subtracting these, the final sample used for most ofthe analysis is: 908 Part 1’s, 1186 Part 2’s (278 being additional individual respondents in thesame household); 200 Part 3’s (entrepreneurship).
Whenever the full number of questionnaires is used in a description, it will be specified,and when unweighted results are given (either because weighting is irrelevant, or meaninglessbecause of insufficient observations per cluster), they will also be specified.
Data are weighted and corrected for the effects of stratification and clustering. There are6 strata, with 2 to 8 primary sampling units (PSU)s each, for a total of 20 PSUs (plus a 7th stratumwith a 21st PSU containing the 130 non-random questionnaires, which are excluded from most ofthe analyses); each PSU has 1 to 5 clusters, identified by a separate variable. The probabilityweights were calculated by multiplying the weight of a household within a PSU (using the 1996census data) by the weight of each PSU. Finite population corrections have been applied.
8
[Note: in most tabulations, the total number of responses will come to slightly less than thenumbers mentioned here above. This is because almost every question met with a few non-responses. This fact will not be commented on again, except when the number of missingresponses is of particular significance.]
2.1 Basic demographic data(from Part 1 of questionnaire, referring to all household members)
A. Household size and structure.
The total number of persons listed was 4385 in 908 households, resulting in a meanhousehold size of 4.83. It should be noted that 12th and subsequent household members werenot counted, since earlier studies13 show that only 2.1% of households count more than 11members, and the 12th and subsequent household members are almost invariably smallchildren. Full results are shown in Figure 1.
Figure 1: Household Size
Note that a non-standard definition of a nuclear family has been adopted for this survey:it includes three-generation families, if the middle generation is the head of the household,i.e. aged persons living in their adult children’s households do not make an extended family.This was felt to be more appropriate to the African culture, and to a situation where pensionsare low and old people’s homes are rare. However, grandparents living with theirgrandchildren with the middle generation absent, are not considered nuclear families. Thisconfiguration accounts for about 3% of all households).
Figure 1 shows that there is a preponderance of nuclear households in the sample,obviously the more so, the smaller the household size. In fact, of the 908 householdssurveyed, 398, or 44%, are extended (non-nuclear) households, in the sense that they have atleast one member who is not part of the nuclear family (parents-children of the head/s), but ofthe extended family (grandparents, grandchildren, in-laws, siblings or more distant relatives
13 Mears and Levine, 1994.
19
82 87
134103
5614 9 2 0 0
1331
78
78
76
4029
21 2480
0
50
100
150
200
250
1 pers
on
2 pers
ons
3 pers
ons
4 pers
ons
5 pers
ons
6 pers
ons
7 pers
ons
8 pers
ons
9 pers
ons
10 pe
rsons
more th
an 10
Extended family
Nuclear family (heads,their parents and theirchildren)
9
of the head/s) or unrelated (9 households). There are 82 households (9% of the total) with nonuclear family members (that is, no children or parents of the heads of the household), butonly extended-family relationships.
4385 members of the households surveyed, 1416 (32%) were listed as heads of thehousehold14; 2022 (46%) were either the children or the parents of the head/s. 933 (21%)were extended family members, being the heads’ grandparents, grandchildren, siblings or in-laws; only 14 persons were reported as unrelated to the head/s of the household.
The number of non-nuclear family members per non-nuclear household increases, ofcourse, with overall household size. Although the mean is 2.34 non-nuclear family membersper non-nuclear household, the modal number is one non-nuclear family member (143households), and the median is lower than the mean, approximately 1.5. This indicates thathouseholds in Soweto are nuclear-family-based, with extended family members includedindividually as necessary, probably on the basis of financial need or other forms of mutualhelp. On the other hand, the number of adult children living in the same household, with theirparents still being the household heads, is relatively high, an indication of nuclear-familysolidarity, probably in the face of financial difficulties.
509 households (56%) were headed by a couple (married or not). The number of single-headed households was 384 (42%), of which 101 (26%) by a male and 283 (74%) by afemale. (The missing 2% are households where no head was indicated).
It may be worth reminding at this stage that the units being analysed are not sites, buthouseholds, defined as “a group of people who live together and ‘eat out of the same pot’”.Where there was more than one household living on a site, through subrental or any otherarrangement, the interviewers were trained to recognize this. In this context, it is interestingto notice from the above data that households, i.e. groups ‘eating out of the same pot”, arevery strongly family-based, even when there are other groups living on the same site. Thesedata are an indication of one aspect of “traditional” social capital, i.e. family links.
The composition of non-nuclear households shows the following characteristics:
• firstly, it is strongly kinship-based, as evidenced by the very low numbers of unrelatedpersons living in the same household;
• secondly, it appears functionally based, representing a family support system for (a)persons in full-time education, (b) unemployed family members, whether nuclear orextended. This is shown by the table below, which cross-tabulates activity against statusin the household (persons over 18 only);
• thirdly, the mean age of extended family members is significantly lower (at the 10% LS)than that of nuclear family members, 18 years as against 22.
14 Interviewers were instructed not to differentiate between the two partners when a household was headedby a couple, i.e. to describe them both as heads of the household.
10
Table 1: Activity, by status within household (persons over 18)
(All rows show significant differences between the heads of household and the others.)
On the whole, the household structure indicated by this survey gives a picture of a societyin transition, i.e. no longer a traditional society with a preponderance of large extended familygroups. There is no evidence of a tendency for extended families to live together for otherreasons than economic necessity – or, considering the 3% of families with the middlegeneration missing, possibly already showing the effect of the AIDS epidemic. However, itmust be remembered again that the definition used in this study for a “nuclear” family is itselfnon-standard, since it includes three-generation families.
B. Characteristics of household members
Figure 2: Age distribution
617
929 974
667509
329206
104 51
0
200
400
600
800
1000
0-9 10 19 20-29 30-39 40-49 50-59 60-69 70-79 80+
Figure 2 above shows a distinct narrowing of the population pyramid for persons under20. This finding is confirmed by previous studies15: it is partly due to a decline in the birthrate during the past 15 years. Some underreporting of small children is also usually assumedin surveys of this kind, and the unreported 12th and subsequent household members (possiblyabout 2%, or 100 persons) are also likely to be small children16.
In addition, there are still many households with rural and other outside links, who tendto leave their children in rural areas while they are of school age. This survey confirms thatfact. A total of 146 children under 18 of the heads of the households, are reported to liveoutside Gauteng – 59 under 10 and 87 aged 10-18. (A further 52 live elsewhere in Gauteng).
15 See e.g. Mears and Levin (1994), Soweto in transition project (1997).16 Mears and Levin (1994).
11
The mean age is found to be 29.4 years; the median age, just over 25.
Activities of household members: these are summarized in Figure 3 below.
Figure 3: Activity Profile
Figure 3: Activity profile No activity1% Full-time education
14%
Self-employed11%
Housewife3%
Part-time empl.6%
Unemployed23%
Pensioner10%
Employed 32%
It should be emphasized that this figure shows the activities of adults only, that is, allhousehold members aged 18 and over. Some comments on the distribution:
• Note the percentage of those reported to be in full-time education, 14% of those over 18.(A number of these may still be in school, given the high number of failures and latestarts in the South African school system. For the over-20 age group, the percentage infull-time education drops to 7%.) It should be noted that 71% of respondents who definedtheir main activity as full-time education, also reported spending more than 30 hours aweek working for money.
• The percentage of self-employed is higher than that found in most comparable studies17,and that of the unemployed is lower18. This is partly due to a deliberate slant in thissurvey: the interviewers were instructed to probe all those who were defined asunemployed, to see whether they were exercising a money-making activity to tide themover or fill in their time while looking for work. These were reclassified as self-employed. The definition of self-employed and of the unemployed in this study are thusnon-standard. This was done for the purpose of better capturing the class of smallentrepreneurs in Soweto, of whom it is generally supposed – and this study supports thesupposition, as will be seen later – that many would prefer fixed employment, andconsider themselves unemployed rather than small entrepreneurs.
• These figures match very closely those of the 1995 census. The latter reports 30%employed, 12% in full-time education, 2% homemakers, 8% pensioners and disabled; theother categories used are different from those of this survey but no discrepancy isapparent.
17 E.g. Mears and Levin (1997) show 4.6%; the Soweto in Transition report, 3.3%, of self-employed.18 The same two studies show population unemployment rates of 31% and 32% respectively.
12
• As mentioned above, the above figure refers to persons over 18. It should be noted that,of the 1082 household members aged under 18, only four (all belonging to the samefamily) were described as self-employed, and three listed as employed (one full, two part-time.) This is factually improbable, but it is an interesting indication of attitudes, i.e. thatpeople in Soweto seem unwilling to acknowledge the reality of child labour and theinformal economic activities of children.
The educational levels of all household members aged 20 and over, are given in Figure 4 below.One notes particularly, the very low number of persons with technical college diplomas, i.e.vocational training at sub-Matric level (“Matric” – matriculation – is the South African equivalentof a high school certificate.) This characteristic is typical for South Africa, and derives from thehistory of the educational and training system for the Black population. Since the Whitepopulation was channeled predominantly towards Matric, those Blacks who were able to continuetheir education, were strongly influenced by the same aspiration. At the same time, vocationaleducation as an alternative to high school was institutionally underdeveloped, replaced largely byinternal training programmes within the large companies. In today’s terms, this is in fact ananomaly for an economy like South Africa’s. It may be a priority matter for educational andemployment policy.
Figure 4: Educational levels of adults
0%
5%
10%
15%
20%
25%
30%
No educ.
<std.6
std. 6
-7
Std. 8-9
matric
techn.co
ll.
post-matr
ic
tertia
ry unco
mpl.
tertia
ry co
mpl.
Note that in the past, Standard 6 and Standard 8 were traditional “stopping points” ineducation. “Post-matric” means short technical or clerical training courses, while “tertiary”includes university and technikon studies.
13
It should be noted that, since the data are based on a personal survey, there may be (1) someoverreporting of one’s (and the family’s) educational levels; (2) there is no check on the validityof the qualifications, i.e. a number of them could be from non-accredited institutions.19
The educational level is substantially higher in the younger age cohorts. The percentage ofthose with less than Standard 6 declines from 43% among the over-50%, to 5% among the 20-29group; of those with Matric or higher, it goes up from 15% to 66%. These differences in agecohorts are shown in Figure 5 below.
A comparison with the 1995 census figures show a clear increase in the educational levels.The percentage of matriculants is 6% higher, and the other non-minimum categories (except forvocational diplomas, which have decreased by 0.2%) show increases of 1%-3%.
Close family members living away from the household: Information was sought about closefamily members (non-divorced spouses and own children under 18 of the heads of the household)living away from the household. A total of 24% of households reported having such links, and ofthese, 56% - i.e. 13% of the total – report having family members in rural areas. This matcheswell the data reported in the Soweto in transition study, where only rural-based family memberswere captured, and the percentage of households with such links was found to be 15.8% in 1996.The small decrease might be evidence of a long-term urbanization trend.
Unsurprisingly, by far the highest percentage of persons with family living elsewhere(68%) is among hostel dwellers, since these places are used by migrant, newly arrived orotherwise unsettled persons. One third of these split households include a spouse livingelsewhere (58% in urban and 41% in rural areas) the other two-thirds have some of theirchildren living elsewhere (39% in urban and 61% in rural areas.)
The percentage of households with family members living elsewhere is significantlyhigher among those living in the 1950-60’s forced removals zones (31%). On the other hand, thepercentage among informal settlement dwellers is not significantly different from otherresidential zones (old council housing, private housing).
19 Thanks to my development economics class for alerting me to the latter point.
14
C. Household assets and expenditure patterns.
Although respondents were asked to indicate their household’s monthly income, it wasrealized that this is a notoriously difficult piece of information to obtain. As expected, thequestion about income did not yield useful results: only 20% of respondents answered it.Instrument design had anticipated this standard problem, and therefore it incorporated detailedquestions about expenditure patterns and household assets, to serve as proxies for income. Thesewere answered much more satisfactorily, with only two households declining to give anyinformation at all; although as expected, there was some incompleteness and improbability in theanswers.
Household expenditure: Respondents were asked about their monthly expenditures on rent,maintenance and services, food, transport, clothing, entertainment, remittances to family,contributions to charity/community groups, and other expenses; and about their annualexpenditures on education, travel, repairs/maintenance, major purchases and other items. Most ofthese items are used only to obtain a figure for of total expenses, to use as a proxy for income.However, expenses on education, remittances to family and contributions to the communityrepresent investments in human and social capital, and will be examined separately later.
Monthly and annual expenditures, when summed up and expressed as average monthlyexpenses, yield the results shown in Figures 6a and b below. The sample median expenditure isfound to be R 1,179, with a standard deviation of R2,592; the survey-adjusted mean monthlyexpenditure is R1,689 (standard error R 175).
Figure 6a: Monthly Household Expenditure
14.4%
28.87%
22.29%
11.34%
6.60% 4.95%2.94% 2.63%
5.98%
0%
5%
10%
15%
20%
25%
30%
<500 500-999
1000-1499
1500-1999
2000-2499
2500-2999
3000-3499
3500-4000
>4000
The data of Figure 6a was used to obtain the per capita household expenditure patterns, bydividing by the number of household members. The result is shown in Figure 6b below.
15
Figure 6b: Monthly household expenditure per capita.
61.8%
27.1%
6.3%2.3% 1.0% 0.6% 0.8%
0%
10%
20%
30%
40%
50%
60%
70%
<R500 R500-999 R1000-1499
R1500-1999
R2000-2999
3000-3999 >R4000
Measures of inequality: A Lorenz curve and Gini coefficient were calculated on perhousehold expenditure.
The Lorenz curve is reproduced in Figure 7 below. It shows a marked rightward shift,consistent with an economy where there is relative equality among the lower-income majorityand a sharp differentiation at the top end of the income scale. This rightwards shift is similar tothat found in the majority of developing countries.
The correspondent Gini coefficient is 51.3. This means that Soweto has a level of inequalitywell below the South African figure of 58.4, but still very high in world terms: only 14 countriesout of 90 have higher Gini coefficients than Soweto20. The percentage share in expenditure of thetop 10% of the sample households is 40.3%: this figure is again lower than that for South Africaas a whole (47.3%), and leaves Soweto in exactly the same rank globally as its Gini coefficient,15th out of 90. (South Africa as a whole is in 5th place as regards its Gini coefficient, and in 3rdplace as regards the share of the top 10% of the population.)
20 The South African and world data in this paragraph are drawn from the World Development Report1998/99; they refer to 1993 figures.
16
Figure 7: Lorenz curve for sample household expenditure(cumulative share of total expenditure – on Y axis - by cumulative share of households – on X axis)
0 .25 .5 .75 1 0
.25
.5
.75
1
Basic household assets: As a third alternative indicator of household income, data wereobtained about basic household assets. Of all households, 28% reported owning a car or amotorcycle, and 14% a minibus, truck or bakkie; 44% had a sewing machine or some otherpower tool; 84% had a fridge, 65% a telephone and 94% a radio or TV. 8.2% answeredaffirmatively when asked whether they own a computer used for work or study as well as forgames; and 2.4% have access to email or the Internet.
These data were combined into a single assets index, using the following weights(adapted from the World Bank Tanzania study): car/motorcycle 4, minibus/truck 4, sewingmachine or tool 2, telephone 2, radio 1, fridge 2, computer 4, Email access 2. A number ofdifferent weight combinations were tried, and this one was chosen as the one with the highestcorrelation coefficient with household expenditure (.54), and the highest Cronbach’s alphavalue together with household income and household expenditure (.74).
The distribution of the assets index is shown in Figure 8:
Figure 8: Household assets index
0%
10%
20%
30%
40%
% o
f hou
seho
lds
0 1-4 5-8 9-12 13-16
17-21
Assets index values
17
2.2 Human capital indicators(from Part 2 of the questionnaire, filled in by individual respondents).
• Educational levels. The basic human capital indicator, educational levels of adults, issummarized in Figures 4 and 5 under Section I above.
• Household expenditure on education. One further human capital indicator, which willbe used at later stages in this study, was recorded at the entire household level: annualexpenditures on education and training. 31% of households reported noeducation/schooling expenditures (no confident distinction can be made between genuinenegative responses and simple missing answers). 45% (of the total sample) spend R1,000 per year or less on education and training; 20% between R 1,000 and R 5,000; and3% between R 5,000 and R 10,000. A further 1% indicated expenditure over R 10,000per year on education and training.
In Figure 9 below, household expenditure on schooling and education is expressed as apercentage of total household expenditure. (The X-axis categories are labeled by thehighest value in that class, i.e. 20% means higher than 15% and up to 20%).
Figure 9: Percentage of household expenditure used for schooling
0%
10%
20%
30%
40%
50%
0 10% 20% >25%% of expenditure used for education
Percentage of households
It should be noted that, for household expenditures (=incomes) under R2,000 per month,there is a small but statistically significant correlation (R=.17) between total expenditure(i.e. income) and the percentage of expenditure used for education, suggesting that theincome elasticity of demand for education is above unit for low-income households only.For higher-income households, there is no correlation.
• Additional training. Respondents were asked to list up to four training courses (inaddition to their school and vocational/professional training) that they had taken in theirlifetime. On the basis of the sample of 1,186 individual respondents, it appears that 63%of adults living in Soweto have taken at least one such extra course, 14% at least two,1.5% a third course and 2 persons a fourth course.
The 1114 courses mentioned can be divided into 8 categories: adult literacy or nightschool; technical skills courses (e.g. bricklaying, hairdressing, mechanics); clericalcourses (typing, computer skills etc.); in-service courses of any kind; household-relatedskills (cooking, sewing etc.); business skills (setting up a business, small business
18
accounting, marketing etc.); driving; and normally non-economic skills (art, sports,military) which the respondent uses for profit. The percentage of each category, out of thetotal of courses taken, can be summarized as follows:
Figure 10: additional training courses taken (persons over 20)
Technical21%
Household skills17%
Driving30%
Literacy3%
In-service2%
Business5%
Non-economic1%
Clerical21%
An attempt was made to quantify, in terms of hours, the time that respondents had spentthrough their lives on such additional training, although the responses must be consideredapproximate. On the basis of the survey, it appears that 56% of persons over 18 havereceived some additional training: 24% have totaled less than 160 hours (one month),20% between one and three months, and 8%,between three months and one year. Theremaining 4% have had more than a total of one year’s additional training courses.(Respondents were asked to give the time in hours, and these were converted at the rateof 40 hours=one week and 1,600 hours= one year.)
The costs of these training courses were also surveyed. However, it is obvious that a largenumber of responses regarding costs of courses taken before 1990 are not reliable, thus itis proposed to drop these costs from the analysis altogether. The respondents who havebeen taking courses since 1994, reported paying an average of about R23 per hour forcourses shorter then 6 months. The cost per hour of longer courses appears to be underR3.
• Informal acquisition of skills. There is also a considerable percentage of the population,49.6%, who state that they have learned some additional skill informally, at home or bythemselves. Of these, 48% acquired some kind of a technical skill, 27% literacy skills,10% clerical skills, and 3% small business skills.
• Demand for additional education/training. Information was elicited on people’s plansand attitudes regarding further education/training in the future. The results aresummarized in Figure 11 and Table 2. On the basis of the responses obtained, it appearsthat 58% of the adult population feel they need additional training, while 42% do not,either because of lack of ability (age, capacity) or, in the case of 11%, because they feelthey have all the training they need for the future.
Of those who do wish for additional training, 71% actually plan to do so; among the 29%who do not, almost half gave as reason that courses are too expensive, and a third that
19
they have no time; the rest found available courses inconvenient or of poor quality, orgave other reasons.
Figure 11 gives a graphical representation of the proportion of persons who do not wishfor additional training (first five columns), divided into categories according to the reasongiven, and those who do wish for additional training (last six columns), divided bycategory of training desired and also by whether they are making concrete plans to get thedesired training or not.
Figure 11: Demand for additional training (“technical” here includes driving)
0%
5%
10%
15%
20%
25%
30%
No reas
on
Too old
Difficu
lt
No need
Other
Literac
y
Technica
l
Clerica
l
Entrepr.
Household
Other
Doesn't planPlans
A test was also made of the apparent responsiveness of the demand for further training, to(1) prices, and (2) the perceived quality, of training courses. This question wasadministered only to those who had earlier indicated a demand for further training (i.e.those represented in the last six columns in Figure. 9 above). The results are as follows:
- 68% would increase their demand for training, if all prices for training droppedby half: 72% of those who are planning to take courses anyway, would increasetheir demand; and 55% of those who have no concrete plans at present, wouldthen enter the market.
- 64% would increase their demand for training if the quality of courses wasmuch improved (“so that it has a better chance to lead to good jobs”): 64% ofthose who are planning to take additional courses anyway, and 65% of those whohave no concrete plans at present.
- The kinds of training which people would then demand are:
Although, strictly speaking , these percentages could be seen as referring to the samething – more education for the same price – it was felt useful to put the question twice, to detectpeople’s perceptions about problems with training courses. In fact, no great differences came intoevidence, although one can note that courses in clerical fields (which includes computers) doseem to be perceived as expensive. Household management courses, as expected, were mentionedmostly by women (85% of cases).
3 Social capital indicators (also from part 2 of the questionnaire, filled in by individual respondents)
Social capital was surveyed in five parts: (1) membership of groups and details about thosegroups; (2) personal perceptions and values; (3) level of trust in different persons/groups andsupport/expectations of support to/from them; (4) social safety-nets, and (5) miscellaneousaspects, such as time investment in different activities, income/leisure trade-off, the“internalization” of social capital (i.e. to what extent are individuals’ feelings of obligation, inharmony with their environment’s expectations from them), and perceived social needs. In everycase, an attempt was made to obtain details that would enable a distinction between “low-rationalisation” social capital, comprising traditional, family-based, substantive forms, and “high-rationalisation” social capital, modern, profession- or value-oriented, process-based forms.
3.1 Membership in groups
Categories of groups. Respondents were asked to list up to six groups to which they belong, inorder of importance to them. On the basis of their responses, it appears that 83% of the adultpopulation belong to at least one social group. The first (most important) and second groupmentioned can be tabulated as follows:
21
Table 3: Categories of groups.
Category of first group Most frequent groups mentioned secondChurch or religious group 60% No group (51%), burial society (38%)Burial society 12% No group (54%), church (20%), stokvel (13%)Stokvel 7% No group (84%), church (6%), burial society (4%)Political party 2% No group (57%), church (14%), stokvel (14%)Cultural, sports or other 2% No group (88%)No group 17%
37% are members of a second group also, and 4% mentioned a third group, mostly a burialsociety or another stokvel. No one mentioned more than three groups.
One can set out these data differently, by calculating the number and percentage ofrespondents who belong to a particular kind of group, without regard to priorities. Then thefollowing picture emerges:
Table 4: membership in groups
Total respondents Weighted %Member of a church or a religious group 716 respondents 42%Member of a political party 78 respondents 4%Member of a burial society 431 respondents 25%Member of a stokvel 158 respondents 8%Member of some other economic group 19 respondents 1%Member of a community/charity group 8 respondents 1%Member of a cultural, sports etc. group 48 respondents 2%Member of no group 206 respondents 17%
(It should be mentioned that respondents were asked to give the names of the groups. Thesewere not coded, but they will later allow, if it is felt necessary, to correlate group characteristicswith other human and social capital characteristics much more precisely.)
One notes the clear preponderance of church membership; among those who belong to onegroup only, the percentage of churchgoers rises to 67%. (Burial societies and stokvels follow,with 14% and 12% respectively.)
Some further investigations were made about the likely/unlikely combinations of groups,taking the sample of respondents who belong to more than one group:
• Burial societies and stokvels, being substitutes, are negatively correlated (R = -.47)• Church members are significantly less likely to belong to political parties, stokvels
and other economic groups, leaving burial societies, charity and cultural groups asthe more likely additional affiliations.
An analysis of principal factors reveals four main distinct clusters: church & burialsociety members, church & cultural group members, political party & stokvel members, and
22
cultural & economic group members. (Membership in charity/community groups is of highuniqueness and without clear links.) The first cluster shows a significant negative link with therespondent’s educational level (-.33) and household expenditure (-.35)..
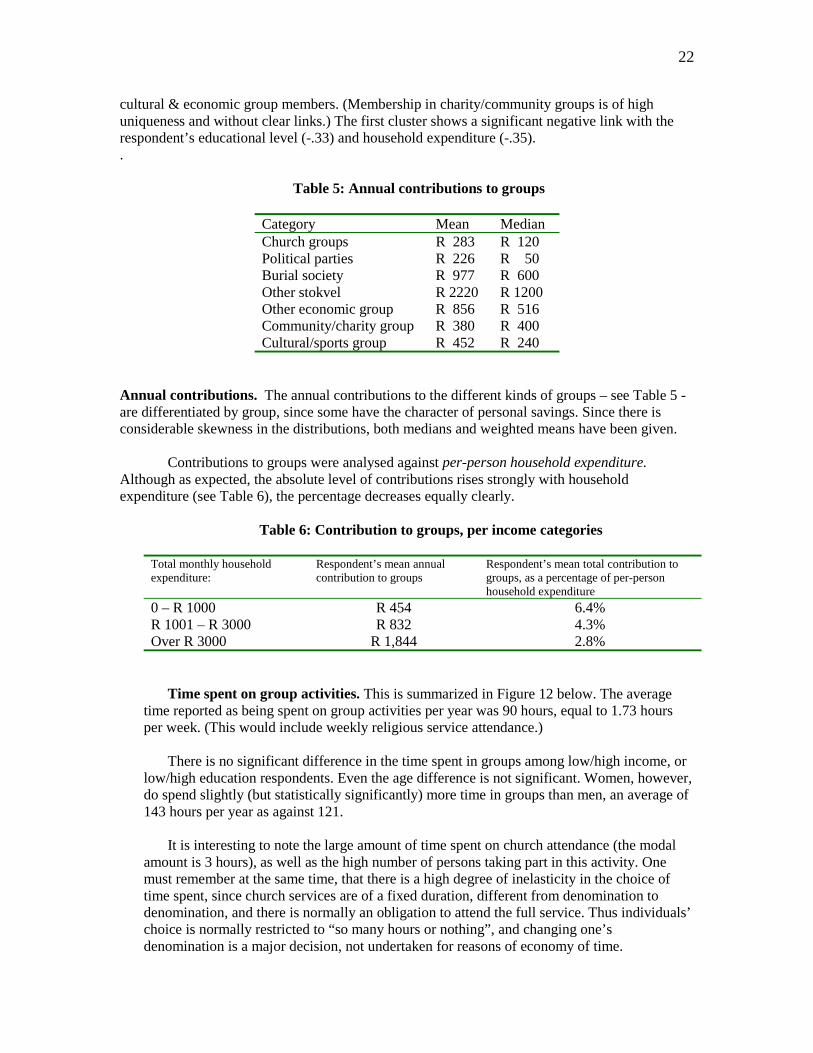
Table 5: Annual contributions to groups
Category Mean MedianChurch groups R 283 R 120Political parties R 226 R 50Burial society R 977 R 600Other stokvel R 2220 R 1200Other economic group R 856 R 516Community/charity group R 380 R 400Cultural/sports group R 452 R 240
Annual contributions. The annual contributions to the different kinds of groups – see Table 5 -are differentiated by group, since some have the character of personal savings. Since there isconsiderable skewness in the distributions, both medians and weighted means have been given.
Contributions to groups were analysed against per-person household expenditure.Although as expected, the absolute level of contributions rises strongly with householdexpenditure (see Table 6), the percentage decreases equally clearly.
Table 6: Contribution to groups, per income categories
Total monthly householdexpenditure:
Respondent’s mean annualcontribution to groups
Respondent’s mean total contribution togroups, as a percentage of per-personhousehold expenditure
0 – R 1000 R 454 6.4%R 1001 – R 3000 R 832 4.3%Over R 3000 R 1,844 2.8%
Time spent on group activities. This is summarized in Figure 12 below. The averagetime reported as being spent on group activities per year was 90 hours, equal to 1.73 hoursper week. (This would include weekly religious service attendance.)
There is no significant difference in the time spent in groups among low/high income, orlow/high education respondents. Even the age difference is not significant. Women, however,do spend slightly (but statistically significantly) more time in groups than men, an average of143 hours per year as against 121.
It is interesting to note the large amount of time spent on church attendance (the modalamount is 3 hours), as well as the high number of persons taking part in this activity. Onemust remember at the same time, that there is a high degree of inelasticity in the choice oftime spent, since church services are of a fixed duration, different from denomination todenomination, and there is normally an obligation to attend the full service. Thus individuals’choice is normally restricted to “so many hours or nothing”, and changing one’sdenomination is a major decision, not undertaken for reasons of economy of time.
23
Also to be noted is frequency and length of burial society and stokvel meetings. There isagain a cautionary point to be made: burial society and stokvel meetings are traditionally asocial occasion, easily lasting a whole evening or more21. Thus the time spent at these“meetings” is not necessarily spent on group business, although there is an element ofobligation to attend them for the full duration. Thus, while the time spent is a necessaryinvestment in maintaining this aspect of social capital and in monitoring group performance,it should also be recognized that it is inflated by an element of “enforced consumption”,considering the positive utility derived from it.
Figure 12: Time spent in regular group activities, per kind of group. Each columnrepresents an hour per week. The first, second, third etc. columns show the frequency of respondentswho spend one, two, three etc. hours per week at that activity. Note that the total area of each diagramis a quick indication of the overall number of people involved in that activity.
Church
0 100 200 300
Political party Burial society
Stokvel
0 100 200 300
Econ. gr. (coop etc.) Community group
Cultural/sports group
0 100 200 300
Other
Group membership, as well as investment in groups in terms of time and money, will beone of the principal subjects for analysis in correlation with human and other social capitalmeasures, to be tackled in a subsequent paper.
Characteristics of groups. Next, respondents were asked about the following characteristicsof the groups that they had mentioned: (a) homogeneity in terms of ethnicity, geographic areaand economic status of members; (b) the existence of formal rules and procedures; (c)perception of whether the group functions well.
According to the answers, groups appear to have the following characteristics:
21 Lukhele, 1990.
24
Table 7: Characteristics of groups
Yes No Sometimes/no replyEthnically homogeneous? 29% 58% 13%Similar economic status 13% 78% 9%Same neighbourhood zone? 28% 58% 14%Formal rules & procedures? 95% 1% 4%Does the group function well? 94% 1% 5%
The answers to the above questions were tabulated by group category. In Table 8 below,the percentages of “yes” answers are tabulated:
Table 8: Homogeneity, by group category
Ethnicallyhomogeneous?
Economicallyhomogeneous?
Geographicallyhomogeneous?
Church 31% 7% 26%Political party 14% 6% 21%Burial society 23% 16% 31%Other stokvel 47% 37% 33%Other economic group 22% 18% 12%Community/civic group 13% 9% 9%Cultural/sports group 28% 3% 27%ALL GROUPS 29% 13% 28%
The figures in Table 8 show a society where homogeneity in one’s groups appears lessimportant than one might have assumed; one notes in particular the ethnical heterogeneity ofburial societies22. (There is, on the other hand ,a high homogeneity from all points of view amongother stokvels.) There are definitely indications of a modernizing society here.
Members appeared to be overwhelmingly positive about the general functioning of theirgroups. This answer is probably influenced to an extent by the leading character of the question,although it is reinforced by a later question (see below) , to which respondents also expressedcomplete trust in their groups more often than in any other aspect of their social milieu, includingtheir families.
Solidarity within neighbourhood. An additional question was asked to find out about group-likecharacteristics of the respondent’s neighbourhood. Do people in their neighbourhood get togetherto solve problems such as security, street cleanup, looking after children etc.? 43% gave anegative answer, another 40% stated that it is done sometimes. 17% said that they do so often.
An interesting picture emerges when one correlates the answers to this question with the kindof neighbourhood that the respondents live in, as shown in table 9.
22 It should be remembered that churches account for over 50% of groups overall, followed by burialsocieties with over 30%. Thus the characteristics of these two groups heavily affect the averages in the lastrow of Table 6.
25
Table 9 : Neighbourhood solidarity, by housing area
Often Sometimes NeverPre-1945 council housing 19% 30% 50%Post – 1945 council housing 16% 36% 48%Forced removals era housing 22% 44% 34%Private housing 12% 48% 39%Informal settlements 0% 69% 31%Workers’ hostels 0% 72% 28%
There are sharp differences at first glance. However: further analysis shows that themean level of solidarity (worked out by giving values of 1,2 and 3 respectively to the threereplies) does not change significantly from area to area except for a slight, though significant,lowering of the rate for workers’ hostels. (This stands to reason: neighbourhood cooperation has amore occasional character in these more transient communities.) The difference is almost all inthe “polarization” of responses from “sometimes” into “often”/”never”.
There may be, in the more established communities, a stronger difference betweenneighbourhoods that have the habit of cooperating and those that do not. But another hypothesisis that the difference is at the household level, resulting from two opposing forces that actdifferently on different households as a neighbourhood gets “established”: mutual familiarity andsense of community on the one hand, and increased security and self-sufficiency on the other.
The above two hypotheses can be tested from the data, since the survey was done on acluster basis, by neighbourhood blocks. 22 clusters, representing the two oldest housing areas,were tested, and significant differences were indeed found in the responses23, leading to theconclusion that the differences in neighbourhood solidarity are found more at the neighbourhoodlevel than at the household level – an indicator of one particular aspect of social capital.
It may also be worth noting that the private housing area – where one may hypothesise alower level of neighbourhood cooperation – is in fact the one that comes closest to the overallmean level for the sample.
There is no significant link between the level of neighbourhood cooperation and the levelof household income (expenditure used as proxy), nor with the educational level of either therespondent or the respondent’s household. A more detailed analysis of correlations with otherforms of social capital, will be done at a later stage.
3.2 Personal perceptions and values
Attitudes to wealth, individualism and risk (representing entrepreneurial values) wereinvestigated by means of two questions on each subject, leading into opposite directions. The
23 A one-way analysis of variance was carried out. The result is highly significant, but caution is indicated,since about a third of the categories contain less than five observations. Also, there appears to be someinterviewer bias – to exclude it, one has to decrease the sample to only three pairs of clusters, of which oneshows significant deviation from the whole-sample mean.
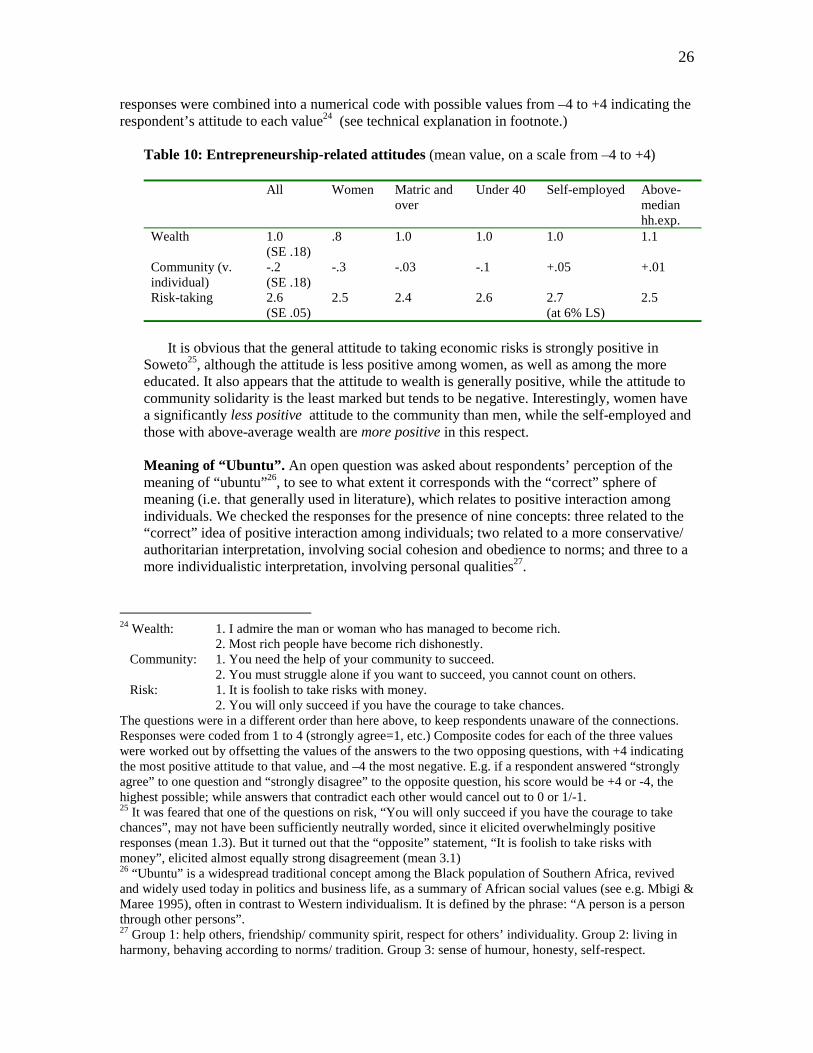
26
responses were combined into a numerical code with possible values from –4 to +4 indicating therespondent’s attitude to each value24 (see technical explanation in footnote.)
Table 10: Entrepreneurship-related attitudes (mean value, on a scale from –4 to +4)
All Women Matric andover
Under 40 Self-employed Above-medianhh.exp.
Wealth 1.0(SE .18)
.8 1.0 1.0 1.0 1.1
Community (v.individual)
-.2(SE .18)
-.3 -.03 -.1 +.05 +.01
Risk-taking 2.6(SE .05)
2.5 2.4 2.6 2.7(at 6% LS)
2.5
It is obvious that the general attitude to taking economic risks is strongly positive inSoweto25, although the attitude is less positive among women, as well as among the moreeducated. It also appears that the attitude to wealth is generally positive, while the attitude tocommunity solidarity is the least marked but tends to be negative. Interestingly, women havea significantly less positive attitude to the community than men, while the self-employed andthose with above-average wealth are more positive in this respect.
Meaning of “Ubuntu”. An open question was asked about respondents’ perception of themeaning of “ubuntu”26, to see to what extent it corresponds with the “correct” sphere ofmeaning (i.e. that generally used in literature), which relates to positive interaction amongindividuals. We checked the responses for the presence of nine concepts: three related to the“correct” idea of positive interaction among individuals; two related to a more conservative/authoritarian interpretation, involving social cohesion and obedience to norms; and three to amore individualistic interpretation, involving personal qualities27.
24 Wealth: 1. I admire the man or woman who has managed to become rich. 2. Most rich people have become rich dishonestly. Community: 1. You need the help of your community to succeed. 2. You must struggle alone if you want to succeed, you cannot count on others. Risk: 1. It is foolish to take risks with money. 2. You will only succeed if you have the courage to take chances.The questions were in a different order than here above, to keep respondents unaware of the connections.Responses were coded from 1 to 4 (strongly agree=1, etc.) Composite codes for each of the three valueswere worked out by offsetting the values of the answers to the two opposing questions, with +4 indicatingthe most positive attitude to that value, and –4 the most negative. E.g. if a respondent answered “stronglyagree” to one question and “strongly disagree” to the opposite question, his score would be +4 or -4, thehighest possible; while answers that contradict each other would cancel out to 0 or 1/-1.25 It was feared that one of the questions on risk, “You will only succeed if you have the courage to takechances”, may not have been sufficiently neutrally worded, since it elicited overwhelmingly positiveresponses (mean 1.3). But it turned out that the “opposite” statement, “It is foolish to take risks withmoney”, elicited almost equally strong disagreement (mean 3.1)26 “Ubuntu” is a widespread traditional concept among the Black population of Southern Africa, revivedand widely used today in politics and business life, as a summary of African social values (see e.g. Mbigi &Maree 1995), often in contrast to Western individualism. It is defined by the phrase: “A person is a personthrough other persons”.27 Group 1: help others, friendship/ community spirit, respect for others’ individuality. Group 2: living inharmony, behaving according to norms/ tradition. Group 3: sense of humour, honesty, self-respect.
27
Responses were heavily focused on the “correct” concepts, relating to interaction amongindividuals (55% mentioned such concepts in first place), the other two groups of conceptsbeing mentioned with equal frequency (22% each). There are weak, but statisticallysignificant, positive links between higher household income and the more individualisticinterpretations of the word ubuntu; and, interestingly, between entrepreneurial skills and themore conservative interpretations of this word.
General values. Lastly, respondents were given four virtues: honesty, generosity, clevernessin business, and family loyalty; and asked to rank them depending on how much they respectthem. The percentages of persons who ranked a particular virtue first, are tabulated below:
Table 11a: Most important values (percentage of respondents)
All Women Matric and over Under 30 Self-employedHonesty 42% 42% 47% 43% 37%Generosity 13% 13% 13% 14% 11%Cleverness in business 19% 18% 16% 16% 30%Family loyalty 26% 27% 24% 27% 22%
The percentages in bold in the second to fifth column are those that show a significantdifference (at least 10% LS) vis-à-vis the rest of the population. As can be seen, there are nosubstantial differences between the sexes or between the younger and older. On the otherhand, it is noteworthy that there is increased respect for honesty among those with at leastsecondary school education; and as expected, there is a strongly increased respect forcleverness in business among the self-employed, offset by less respect for other values.
The above table only shows how often each of the four virtues was mentioned as the mostrespected, but it does not take into account 2nd, 3rd and 4th rankings. A second measurementwas made, assigning each virtue a value of 3 if it was mentioned in first place, 2 if it wasmentioned in second place, and 1 if it was mentioned in third place. On this basis, clevernessin business replaces generosity as the least-respected virtue. Mean values for the four virtuesthen emerge as follows:
Table 11b: Hierarchy of values (mean value, on a scale from 0 to 3)
All Women Matric and over Under 30 Self-employedHonesty 2.0 2.0 2.1 2.0 2.0Generosity 1.3 1.3 1.1 1.3 1.1Cleverness inbusiness
1.1 1.1 (men 1.2) 1.1 1.0 1.5
Family values 1.6 1.7 1.7 1.6 1.5
The four statistically significant differences have been brought out in bold characters.From this analysis, it appears that women give less importance to cleverness in business(offset mostly, though not at a statistically significant level, by family values); there remainsthe clear correlation between education and respect for honesty; and among the self-employed, the greater value placed on cleverness in business, is now offset by less valueattributed to generosity, rather than the other two values as in the first table.
28
3.3 Level of trust in different persons/groups.
Respondents were asked to rate, at a level of 1-5, their trust in various groups andinstitutions. The total level of trust was quite balanced, with a mean of 3.16 in a range of 1-5.The list of these groups, from the most trusted to the least trusted, is as follows:
Table 12: Trust in different groups
Population mean(Standard error of mean)
Members of your groups 3.9 (.12)Extended family 3.7 (.13)Your local school 3.5 (.17)Central/provincial government 3.3 (.17)Professional/working contacts 3.3 (.08)Local government 3.0 (.16)Police 2.9 (.19)Those who earn a living the same way as you 2.9 (.13)Neighbours 2.7 (.12)People in the same income category as you 2.6 (.12)
A further analysis was made of levels of trust in co-members of one’s groups:
• complete trust (index 5) was unanimously expressed in their group co-members by thesmall sample (8 respondents) whose primary group is an economic one (cooperative etc.);
• the next highest level of trust (mean index 4.6) was expressed by members ofcommunity/civic groups;
• church and burial society members came next (mean index 4.0);• co-members of political parties and stokvels each earned levels of trust of 3.7;• cultural and sports group co-members came last with 3.5.
We also looked at the impact of (1) residential zone (council, private, informal, hostel);(2) household income, on trust in one’s neighbours.. No significant differences were found,except for one: hostel dwellers were less trustful of their neighbours than other respondents.
3.4 Social safety nets.
In an urbanized area such as Soweto, the overwhelmingly most important security factor forthe household’s economic status is the employment status of its adult members. Accordingly, itwas decided to make an assessment of the security value of various aspects of social capital byasking about their effects on job-finding. Questions were asked both about the respondent’s lastjob-finding experience and her expectation regarding the next time she may be looking for a job.(The question on future expectations was asked before the one on past experience, in order toavoid influencing the second answer.)
29
Table 14: Job-finding strategies and expectations
How did you get yourpresent job?
How do you think youmight get your next job?
Sub-matric Matric ormore
Sub-matric Matric ormore
Mass media 16% 26% 36% 50%
School or employmentcenter
2% 12% 4% 12%
Family/friends 52% 40% 45% 27%
Schoolmates/ colleagues 1% 3% 1% 1%
Groups to which youbelong
2% 2% 2% 2%
Yourself (set up abusiness)
9% 7% 5% 4%
Going door-to-door 16% 6% 6% 3%
Other 2% 3% 1% 1%
In this question, the most important characteristic with which to cross-tabulate seemed clearlyto be the level of education. It seems plausible that job-finding strategies should differsignificantly between persons with lower educational levels as against those who have completedat least secondary school.
As expected, there are substantial differences between the job-finding networks of the lesseducated and the more highly educated. At the same time, the data seem to support earlierfindings (Wittenberg 1999) that in a situation of extremely high unemployment, formal channels(e.g. mass media) break down, and informal networks (referral by family and friends) take theirplace. This effects seems less strong – but still very much present - at the higher end of the labourmarket, i.e. for workseekers with Matric level or above. One notes the relatively low importanceof “formal” social networks, i.e. groups, colleagues: most of the job-seeking network appears tobe located among “family and friends”.
One also notes the high future expectations placed on mass media, as opposed to their realrole in past jobseeking. Finally, it is worth mentioning the apparent importance, still, of finding ajob by simply “going door-to-door” to prospective employers: although it is interesting that eventhe less-qualified appear to consider it less important as a future strategy.
30
A second aspect of social safety-nets was explored, with a question about the sources of helpthat the respondent’s household could turn to in case of financial trouble. Up to three sourcescould be named. Out of 2695 strategies mentioned by 1186 respondents, the most frequent wasthe extended family (52% of respondents), followed by informal employment (41%). 27%mentioned social welfare, and 22% mentioned the community, including the groups to which theybelong; 19% mentioned loans, and 19% existing savings. (Given the understanding of stokvels inSouth Africa, these three categories can probably be merged to quite an extent.) 22% also countedon help from friends (not family). Only 4% said that household members would disperse, joiningother households; less than 1% chose to mention other sources of help, generally eithertranscendental or very vague (one respondent said openly that he would resort to crime). 31%included “I don’t know” among their choices, and 5% gave this answer in first place, withoutmentioning second or third alternatives, indicating no safety-net whatsoever.
A breakdown of these answers by education, income category, and other social capitalindicators, shows a pattern of links: between having “traditional” sources of help (family,friends) and other “low-rationalisation” social capital aspects such as membership in low-ratgroups; and conversely, between the more modern sources of help (loans, social welfare) andattributes such as higher education, higher income and “high-rationalisation” social capital.
3.5 Miscellaneous.
Use of personal time. One expression of people’s values is the amount of time that they spend ondifferent activities. Although the responses to this question had their limitations – e.g. 58% ofrespondents listed activities for a total of less than 10 hours a day – there is much informationthat can be drawn from this set of answers.
The pattern of time employment differs substantially, of course, between e.g. people whoare employed full-time and who are pensioners. Thus the answers are tabulated by therespondent’s activity – see Table 13a below. As a second step, to break down use of time by othercategories than simply the respondent’s activity, a tabulation was made of the use of time bythose who are employed full-time or self-employed, and they were differentiated according tosex, education level and income level – the results are shown in Table 13b.
Table 13 a : Use of time, by activity. (Shaded cells indicate statistically significant differencesfrom the entire-sample average (but see footnote below) at 1%LS; underlined figures, at 5% LS.
* Note that the average time spent on study was calculated excluding full-time students, so that their substantiallyhigher figure would not skew the picture. The statistically significant differences were – for this line only –calculated not against the overall average, but against this “residual” average.
Table 13b: Breakdown of use of time by fully employed and self-employed adults.Shaded cells indicate statistically significant differences at 5%LS; underlined figures, at 10% LS
ALL Men Women Matric orover
BelowMatric
High-income
Low-income
Work for money 44 43 44 44 43 43 44
Household work (inc.repairs, childcare etc)
12 11 13 13 10 12 11
Study/ training/ self-improvement
8 8 7 7 8 8 8
Work with groups towhich you belong
5 5 5 5 4.5 5 5
Other community work 3 3 3 2.5 3 3 3Help or socialize withextended family
6 6 6 7 6 6 6
Socialize with workcolleagues
9 9 9 9 9 8 9
Other social activities 6 6 5 5 6 5 6
Note: in Tables 13 a and b, figures are rounded off to whole hours, except in one case where such rounding would haveobscured a statistically significant difference. “High-income” means that the respondent belongs to a household having above-median total expenditure.
It is interesting to note that:
• All categories report spending substantial time in working for money, even thosecategories which would not be expected to do so.
• All categories report spending quite a high amount of time for study and self-education;interestingly, the highest amount (except for full-time students) is spent by those in full-time employment.
• Social capital building (group and community activities, socialization) is undertakenfairly equally by the different activity groups – making allowances for those in full-timemoneymaking activities – and by men and women.
• Relatively educated people report spending more time both on household activities andwith some social capital-building activities such as extended family and group activities,but not with other types such as community work and other forms of socialization.
Consumption/leisure trade-off. A further question on values tried to get an idea of the marginalrate of substitution of consumption for leisure, by asking the question: “Would you be willing todo an extra hour’s hard work per day in exchange for R1?” and, in the case of a “no” answer,
32
going up stepwise to higher and higher hourly rates: “And for R3? R5? R10? R20? R30?” –ending with “More than R30?” 28.
The overall distribution is as follows:
Figure 13a: Consumption-leisure trade-off
4% 3%
10%
22%
27%
18%16%
0%
5%
10%
15%
20%
25%
30%
R1 R3 R5 R10 R20 R30 >R30
Would be willing to work an extra hour for...
A more detailed breakdown was made by income category, giving the following picture:
Figure 13b: Consumption-leisure trade-off, by household expenditure
Hh exp.< R1000
0
100
200
300
400 Hh.exp.< R3000
Hh.exp.> 3000
0
100
200
300
400 Total
A preliminary cross-tabulation was also made with sex, education and respondent’s activity..Education and age appear to make no significant difference; the following results were found:
• men demand more than women, by about half a category (women average just underR20, men about R24);
• persons already having a full-time activity demand more than the others (about R 24 asagainst about R 18).
28 This had been a tricky question to administer properly, and interviewer bias was found in 6 out of the 25interviewers, showing that they had not asked the question step by step as required. Their questionnaireswere eliminated from the analysis of this question, leaving a much more plausible response pattern.
33
“Internalisation” of social capital. One further indicator was researched, namely, theexpectations that the social milieu has of the respondents, and the extent to which the respondentsinternalize (agree with, feel at harmony with) these expectations. It is admittedly a complex issuefor sociological research, but it is expected that some useful insights will come out of the onequestion which attempted to summarize it: “Imagine that your personal income has gone up byR1,000. (a) How much of that will you spend on your household; on other family/friends; on thegroups to which you belong; on yourself? (b) If each of these knew by how much your incomehad gone up, how much would each expect to get? Would they give you trouble if they didn’t getit?”
1087 persons out of 1191, or 91.3%, answered this question. None said expressly thatthey would give nothing to any of the three groups mentioned; one can presume that a part of theremaining 8.7% are in fact of this opinion. A further 135 had to be dropped because thearithmetic was wrong, i.e. the R 1,000 was not divided correctly. The rest of this analysis will bedone on the remaining sample of 952 respondents.
- 99% would give something to their households: average R 465.- 61% would give something to family/friends: average R 165.- 66% would give something to their groups; average R 81.(The average contributions are calculated after excluding those who would give nothing.)
Table 15: “internalization” of social capital
To household To family/ friends To groupsI would give the same as they expectfrom me* 54% 58% 64%
I would give more than they expect fromme 20% 18% 14%
I would give less than they expect fromme
- and they would give me trouble if theyknew
26%
22%(of the 26%)
24%
30%(of the 24%)
20%
13%(of the 20%)
* this includes cases where nothing is either expected or given.
These first results do not show any unexpected features. The sense of voluntarycommitment (higher contributions than expected) is quite similar across groups. The level ofinternalization (harmony between expectations and sense of obligation) seems higher forrespondents’ formal groups, giving a sense of a clearer “social contract” with them.
34
Perceptions about public inititatives. Lastly, people were asked to identify up to threecommunity initiatives that (a) had happened in the past five years and had made a positivedifference; (b) that were the most urgently needed in their communities. Figure 14 gives asummary of the perceptions regarding 12 possible initiatives:
1. Government provides water/electricity2. Government provides phone lines3. Public transport is improved4. Crime is decreased5. People get to trust each other more6. Banking and credit are improved7. Laws are better and well-enforced8. Business information centers are established9. There are more business training schemes10. Better nursery school/after-school programmes are introduced11. Schools are improved12. Training facilities are improved.
Each of these initiatives is given two adjacent bars on Figure 14, here below. The first bar(darker) counts the times it was listed as having happened, the second bar (lighter) counts thetimes that it is mentioned as a priority need still to be filled.
Figure 14: perceptions concerning public initiatives
Water &
el.
Phone
s
Transp
ortCrim
eTrus
t
Bankin
g
Laws
Bus.in
fo.
Childc
are
Schoo
lsTrai
ning
Other
0%
10%
20%
30%
40%
50%
60%
70%
80%
90%
Perc
enta
ge m
entio
ning
Crime is by far the greatest concern, with practically every respondent mentioning it. Thesecond biggest concern is to have better laws, and a close third is to build up better trustamong people. Public transport, and all kinds of education and training, are also givenpriority, while the perceived need for services, credit/banking and childcare is relatively low(but might vary strongly depending on the income, education etc. category of the respondent;this will be a subject for further analysis).
One also notes that the provision of water, electricity and telephones is not seen as amajor problem for the future, but is generally perceived as having been carried outsatisfactorily.
35
Bibliography
Only the major sources, and works specifically referred to in the text, are listed here. A full bibliographyof the theoretical and methodological sources is attached to Piazza-Georgi(1999).
Fedderke, J. (1997): “Political and Social Dimensions of Economic Growth”, Theoria, 89, 1-43.
Fedderke, J., De Kadt, R. and Luiz, J. (1999): “Growth and Social Capital: a Critical Reflection”, Theoryand Society.
Fedderke, J. and Luiz, J. (1999): “Production of Educational Output: time series evidence from socio-economically heterogeneous populations – the case of South Africa 19190-1993” ERSA Working Paper no.7, Dept. of Economics, University of the Witwatersrand, South Africa.
Granovetter, M. (1985): “Economic Action and and Social Structure: the Problem of Embeddedness”,American Journal of Sociology, vol.91 no.3 (Nov), pp. 481-510.
Khehla Lukhele, Andrew (1990): Stokvels in South Africa, Amagi Books, Johannesburg.
Mbigi, L. with Maree, J. (1995): Ubuntu: The Spirit of African Transformation Management, KnowledgeResources (Johannesburg).
Mears, R.R. and Levin, M. (1994): “Demographic Characteristics of the Population of Greater Soweto:1993”, research Report no. 42, Dept. of Economics, Vista University, South Africa.
Mears, R.R., Levin, M. and Pieterse, J.W (1994).: “Income and Expenditure Patterns of Households ingreater Soweto: 1993” research Report no. 43, Dept. of Economics, Vista University, South Africa.
Narayan, Deepa and Pritchett, Lant (1997): “Cents and Sociability: Household Income and Social Capitalin Rural Tanzania”, World Bank Economic Growth Project research paper.
Piazza-Georgi, B. (1999): “The role of human and social capital in growth: extending our understanding” –Dept. of Economics, University of the Witwatersrand (unpublished).
Rwigema, H. and Karungu, P. (1999): “SMME development in Johannesburg’s Southern MetropolitanLocal Council: an assessment”, Development Southern Africa, vol.16 no.1.
Sociology Department (1997): “Soweto in Transition Project: Second Preliminary report”, University of theWitwatersrand, Johannesburg.
South African Department of Statistics: 1995 census figures
Wittenberg, M. (1999): “Job Search and Household Structure in an Era of Mass Unemployment: a semi-parametric analysis of the South African labour market”, ERSA Working Paper no.3, Univ. of theWitwatersrand, South Africa.
Woolcock, M. (1998): “Social Capital and Economic Development: Towards a Theoretical Synthesis andPolicy Framework”, Theory and Society, vol. 27 no. 2, pp. 151-208.