1 Project LIFE08 ENV/IT/000423 “WOMENBIOPOP” Linking Environment and Health: a Country-based Human Biomonitoring Study on Persistent Organic Pollutants in Women of Reproductive Age Human Biomonitoring and dietary exposure studies in preventive medicine Gianfranco Brambilla Reparto Chimica Tossicologica Dipartimento Ambiente e connessa Prevenzione Primaria Istituto Superiore di Sanità Results and Evaluations Istituto Superiore di sanità Rome, May 20 - 21, 2013
Transcript
1
Project LIFE08 ENV/IT/000423 “WOMENBIOPOP” Linking Environment and Health:
a Country-based Human Biomonitoring Study on Persistent Organic Pollutants in Women of Reproductive Age
Human Biomonitoring and dietary exposure studies in preventive medicine
Gianfranco Brambilla
Reparto Chimica Tossicologica Dipartimento Ambiente e connessa Prevenzione Primaria
Istituto Superiore di Sanità
Results and Evaluations
Istituto Superiore di sanità Rome, May 20 - 21, 2013
2
Acknowledgements PEOPLE: Stefania Paola De Filippis Elena Dellatte Roberto Miniero and Alessandro di Domenico
GRANTS: MIUR FISR Project (2006-2010) Micropollutants characterisation in Mediterranean fishery products Italian Min of Health grant (2008 – 2010) on emerging POPs in animal food products EU FP7 PERFOOD Project (2009-2012) Perfluorinated compounds in our diet Italian Min of Health RF 2008 Innovative Approaches for POPs dietary risk assessment (2010-2013) Italian Min of Health RF 2008 (2010-2013) Mercury/Methylmercury in fishery products and related risk communication
http://www.iss.it/pbts/
Background information available at:
3
Outline of the presentation: Internal vs external (dietary intake) dose Reliability of POPs and PTSs occurrence in food and food consumption data for the intake estimates to be compared with HBM. Dietary exposure estimates from large-scale food producing systems Modelling food exposure from “low-mileage” foods consumption. Challenges/opportunities for a food safety risk-oriented approach in preventive medicine within an Environment&Health approach
4
Dietary intake estimates of POPs /PTSs
reflecting short-term exposures
Body Burdens reflecting 3 -10 year of aggregate exposure (intake of food, dust, soil, inhalation, dermal absorption) On individual basis, reflecting also occupational exposure, welfare and health status, lifestyle, …
Reliable TKTD correlations between dietary intakes and body burdens could be computed in:
Subjects that show background internal doses (low exposed group).
Subjects highly exposed via food and water till recent past (i.e. PFOA in water – C8 panel).
In EU, the general population seems far from a steady state accounting for the time trends in food exposure
EFSA 2012, PCDD/F+DL-PCBs
5
One-compartment model E = ext dose (pg/kg bw/day) Vd = Volume of distribution (mL/kg) (220 PFOS) (170 PFOA) t half-life (days) (1661 PFOS) (1278 PFOA) Hölzer et al., (2008) Thompson et al. (2010) Olsen et al., (2007).
Concentrations of PFOS-PFOA (ng/mL) in groups of the general population
from European Countries
year Country type PFOS PFOA
Number and
characteristics of
donors
Reference
European Countries
1998-
2000 Belgium serum
10.4 a
17.6 a
2.4 a
4.3 a
4 females
16 males
Kannan et al.,
2004
2002-
2005
Belgium
(Flanders) serum
44.8 a
62.5 a
2.9 a
2.0 a
adolescents (13-14y)
adults (50-65y)
Roosens et al.,
2010
2003 Germany plasma 13 a 2.6 a 11 females, pregnant Midasch et al.,
2007
2003-
2004 Germany plasma
22.3 a
27.1 a
19.9 a
6.8 a
8.3 a
5.8 a
105 adults
51 males
54 females
Midasch et al.,
2006
2001 Italy serum 3.5 a
4.2 a
<3 a
<3 a
8 females
42 males
Kannan et al.,
2004
2008 Italy serum 6.86 d 4.15 d 230 adults Ingelido et al.,
2010
2004 Norway plasma 20 a 4.4 a 326 females Rylander et al.,
2010
2005 Northern
Norway plasmz 29.4 a 3.9 a
60 adults – coastal
population
Rylander et al.,
2009
n.s Poland blood b 10.4-168 c
2.4-
17.4 60 adults
Falandysz et al.,
2006
2003 Poland blood b 67.6 a
81.8 a
46.4 a
36.8 a
15 females
10 males
Kannan et al.,
2004
1997-
2000 Sweden blood b 24.2 a 5 a 66 adults
Karrman et al.,
2004
2003 Sweden serum 32 d 4.1 d 175 adults Haug et al., 2003
pfos pfoa
Results from EU FP7 Perfood project
6
A sound and risk-oriented food exposure assessment may predict body burdens recorded by HBM studies 3 – 10 years later…
Preventive Medicine
7
HBM studies can implement preventive medicine actions, with a focus on most sensitive groups
Risk (re)orientation and cost/
effectiveness assessment of
preventive medicine
8
EXP intake = ---------------
Σ (Ci qi)
M bw
What food items are really consumed ? What is their origin and provenience ? What is their associated contamination after cooking/processing/packaging? What is their amount in the diet ? What is the Consumer’s body weight ?
low contaminated x highly consumed food =
highly contaminated x low consumed food
Occurrence x Consumption
Total Diet Studies
Duplicate
Diets
FOOD EXPOSURE ASSESSMENT
9
Controllo
Farms
Batches of consignment to retailers
Occasional/ Point Source of contamination at farm
Food Processing - Gross Distribution Stores
Example how the intake of a heavily contaminated food could be reduced and mitigated (i.e. by dilution, by a limited time-frame and/or frequency of intakes) within the food supply chain of Gross Distribution Organisations
Food purchase by Consumers >> Intake
Internal
Checks
and
Official
Monitoring
Plans on
Large Scale
production/
distribution
10
Dietary intake estimates from
canteen meals sampled over 5
working days and analysed for
POPs.
Assumption: the contamination
found in canteen meals is that
present in the whole diet, over a
week.
What does it mean in terms of dietary intake assessment the quality of foods from Gross Distribution?
Groups that live on subsistence economy (“Usi Civici”). Groups consuming their own food produces (food not placed on the market). Groups oriented on a low mileage/ sustainable/ solidarity based purchase (Burgeois-boheme farmers) from small scale farms, urban horticulture, …
How to estimate the dietary exposure in:
Possible lack of information about: Kind and amount of food eaten Associated contamination via analytical checks
Can we predict the impact of low mileage (subsistence) food intake on health determinants without HBM studies?
14
IMPACT OF LOW-MILEAGE FOOD (From Farmers to Consumers) on HEALTH DETERMINANTS
The example of raw milk (around 1% of the milk sold in Italy) and Haemolitic Uremic Syndrome outbreaks (intake-effects within 24-48 h), before and after the Dec 2009 legislative endorsement (raw milk should be boiled).
Year HUS cases Consumption
raw milk %
2006 30 0 0
2007 37 3 8.2
2008 24 5 20.8
2009 46 5 10.9
2010 43 2 3.3
2011 31 1 3.2
2012 41 2 4.8
Courtesy of A. Caprioli and G. Scavia, EURL lab for E. Coli, ISS-Rome (I)
1% of the sold milk was responsible of 8-20% of HUS cases between 2007-9
15
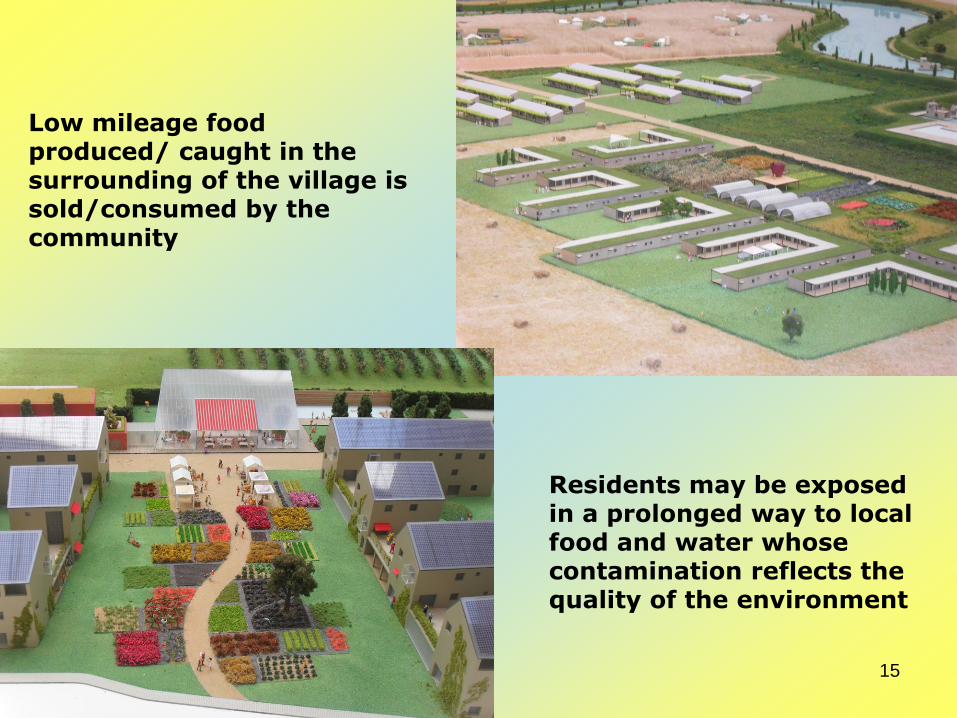
Low mileage food produced/ caught in the surrounding of the village is sold/consumed by the community
Residents may be exposed in a prolonged way to local food and water whose contamination reflects the quality of the environment
16
Po River: 652 km (71 000 km² basin)
Up to 60 kg catches
Nice price
Highly contaminated
17
Dioxin and Total TEQ in Venison liver
FSA, UK
(2007)
pg WHO-TEQ/g,
upper bound, fat
basis
pg WHO-TEQ/g,
upper bound, fresh
basis
Fat content Dioxin Total Dioxin Total
2.6% 109.4 159.4 2.84 4.14
3.8% 98.1 119.9 3.73 4.56
3.7% 92.4 111.7 3.42 4.13
4.0% 64.0 78.0 2.56 3.12
4.1% 45.3 62.1 1.86 2.55
3.3% 31.5 48.0 1.04 1.58
3.4% 24.3 30.2 0.82 1.02
4.5% 23.5 30.7 1.06 1.38
3.7% 19.9 25.3 0.74 0.93
4.1% 12.9 16.6 0.53 0.68
PCDD/F and DL-PCBs in COD LIVER, RASSF Reports 2007
25 – 120 g/person/die intake covers the WHO-TE 2pg/kg/bw TDI
0.1 – 1.2 g/person/die intake covers the WHO-TE 2pg/kg/bw TDI
Recent epidemiological studies (Sentieri project), carried out also in Italian coastal sites under the impact of Cinnabar
settlements ● give contradictory
evidences about the presence of neurological disorders in the populations of Orbetello vs Grado/Marano, addressable to mercury/methylmercury exposure.
NEED OF FOOD EXPOSURE STUDIES COMBINED WITH HBM TO SUPPORT PREVENTIVE MEDICINE ACTIONS.
Available data on sediments, water and seafood from the lagoons, however, indicate a potential overexposure of the MeHg TWI (1.3 µg/kg/bw/week) when local fish is consumed under the Municipal Rights of catches (“Usi Civici”).
Conclusions Food intake assessment is more sensitive to monitor time trends in POPs and PTSs occurrence and food consumption, therefore may address HBM studies in time vs emerging risks and related sensitive groups. Biomonitoring studies may confirm the effectiveness of preventive medicine actions on a medium period (5 years), support food safety advisories, and may suggest a risk-oriented and a more cost-effective approach in the risk management of food exposures (general population vs sensitive groups). Environment monitoring data (soil, water, sediments, air,…), when appropriately modelled, may suggest relevant food exposures in rural farming systems on georeferenced basis, when animals represent both environmental and food matrices.