128
01/2016 UMWELT & GESUNDHEIT Human Biomonitoring of „new“ contaminants: Sub- Project 2 – Screening of target and non-target contaminants in human blood and urine

01/2016 UMWELT & GESUNDHEIT
Human Biomonitoring of „new“ contaminants: Sub-Project 2 – Screening of target and non-target contaminants in human blood and urine


UMWELT & GESUNDHEIT 01/2016
Environmental Research of the Federal Ministry for the Environment, Nature Conservation, Building and Nuclear Safety
Project No. (FKZ) 3710 62 220 2 Report No. (UBA-FB) 002003/E
Human Biomonitoring of „new“ contaminants: Sub-Project 2 – Screening of target and non-target contaminants in human blood and urine
by
Merle Plaßmann, Werner Brack, Martin Krauss Department Effect-Directed Analysis, Helmholtz Centre for Environmental Research – UFZ, Leipzig, Germany
On behalf of the German Environment Agency

Imprint
Publisher: Umweltbundesamt Wörlitzer Platz 1 06844 Dessau-Roßlau Tel: +49 340-2103-0 Fax: +49 340-2103-2285 [email protected] Internet: www.umweltbundesamt.de
/umweltbundesamt.de /umweltbundesamt
Study performed by: Helmholtz Zentrum für Umweltforschung – UFZ Permoserstr. 15 04318 Leipzig
Study completed in: May 2014
Edited by: Section II 1.2 Toxicology , Health-related Environmental Monitoring Christa Schröter-Kermani
Publication as pdf: http://www.umweltbundesamt.de/publikationen/human-biomonitoring-of-new-contaminants-sub-project
ISSN 1862-4340
Dessau-Roßlau, January 2016
The Project underlying this report was supported with funding from the Federal Ministry for the Environment, Nature Conservation, Building and Nuclear safety under project number FKZ 3710 62 220 2. The responsibility for the content of this publication lies with the author(s).


Screening of target and non-target contaminants in human blood and urine
Abstract The development of screening methods has increased over the last years due to the possibility to search
for multiple targets and suspected and so far unknown compounds. Non-target screening has mostly been restricted to water and food samples, only a few studies have shown an application to biological
samples. Thus the objective of this project was to develop and apply a non-target screening method to
human urine and blood samples. The method development was done by using a broad range of target analytes from various chemical groups, like aromatic amines, industrial chemicals, perfluorinated alkyl
acids and UV filters. For sample preparation the QuEChERS (quick, easy, cheap, effective, rugged and
safe) method was tested, samples were extracted using acetonitrile and salts for phase separation, followed by a sample clean-up using dispersive solid phase extraction. Urine samples were also directly
injected into the LC-HRMS. Using these two methods absolute recoveries between 30 and 150% for 38 of
the 40 urine target analytes were achieved. Blood samples were extracted by QuEChERS, resulting in absolute recoveries between 70 and 150% for 43 of the 53 blood target analytes. Using these preparation
methods, 16 urine and blood samples from the German Environmental Specimen Bank were extracted
for subsequent non-target analysis. After the data processing using MZmine for peak deconvolution and alignment 11 of the 15 internal standards could be detected in all samples. After blank subtraction
several targets, suspects and non-targets could be (tentatively) identified. Among these were UV-filters
like benzophenone-3 and several benzophenone metabolites, organophosphate flame retardants like triethylphosphate, 4-hydroxy-chlorothalonil and a bromo-quinolinole.
Kurzbeschreibung Die Anzahl an publizierten Screening-Methoden hat in den letzten Jahren stark zugenommen, da hierbei
nach einer großen Zahl von Ziel oder verdächtigen Analyten („Suspects“) gesucht und auch Unbekannte („Non-targets“) detektiert werden können. Bisherige Studien zu Non-target-Methoden sind weitgehend
auf Wasserproben und Lebensmittel beschränkt, die Analyse von biologischen Proben wurde bisher
kaum durchgeführt. Das Ziel dieses Projektes war es, Non-target-Methoden für humane Urin- und Blutproben zu entwickeln. Die Ziel-Analyten, welche für die Methodenentwicklung herangezogen
wurden, repräsentieren unterschiedlichste chemische Gruppen, z.B. aromatische Amine,
Industriechemikalien, perfluorierte Alkylsäuren und UV-Filter. Für die Analyse der Urinproben wurde neben einer Direktinjektion in das LC-HRMS System auch die QuEChERS Aufarbeitung getestet. Hierbei
wurden die Proben zuerst mittels Acetonitril und Salzen zur Phasentrennung extrahiert und
anschließend mit dispersiver Festphasenextraktion aufgereinigt. Mit einer Kombination von Direktinjektion und QuEChERS konnten für 38 von 40 Urin-Ziel-Analyten absolute Wiederfindungen von
30-150% erzielt werden. Die Blutproben wurden nur mit Acetonitril extrahiert, wobei für 43 von 53 Blut-
Ziel-Analyten absolute Wiederfindungen von 70-150% erreicht wurden. Mit den optimierten Aufarbeitungsmethoden wurden 16 Urin- und Blutproben aus der Umweltprobenbank des Bundes
extrahiert. Für die Non-target Auswertung wurde die Software MZmine herangezogen, welche eine
Peakerkennung und ein Alignment durchführt. 11 der 15 zur Überprüfung der Auswertung dotierten internen Standards wurden in allen Proben detektiert. Nach Blindwertsubtraktion konnten mehrere
Targets, Suspects und Non-targets vorläufig identifiziert werden. Dies waren unter anderem UV-Filter wie
Benzophenon-3 und Benzophenon-Metabolite, Organophosphat Flammschutzmittel wie Triethylphosphat, 4-Hydroxy-Chlorothalonil und ein Brom-Chinolinol.
4

Screening of target and non-target contaminants in human blood and urine
Table of Contents
List of Figures ................................................................................................................................................................. 7
List of Tables ................................................................................................................................................................... 9
List of Abbreviations ................................................................................................................................................... 11
1 Summary ............................................................................................................................................................. 13
2 Zusammenfassung ............................................................................................................................................. 18
3 Introduction ........................................................................................................................................................ 24
4 State of the art in non-target screening ........................................................................................................ 25
4.1 Sample preparation for non-target screening ..................................................................................... 26
4.2 Instrumental analysis................................................................................................................................ 27
4.2.1 GC-MS ..................................................................................................................................................... 28
4.2.2 LC-MS ..................................................................................................................................................... 29
4.3 Data evaluation.......................................................................................................................................... 30
4.3.1 From peak detection to the compound list .................................................................................... 30
4.3.2 From compound list to molecular structure: GC-EI-MS ................................................................ 31
4.3.3 From compound list to molecular structure: LC-MS ..................................................................... 34
4.4 Summary ..................................................................................................................................................... 36
5 Target methods for human samples .............................................................................................................. 38
5.1 Substances analysed in human matrices .............................................................................................. 38
5.2 Sample preparation and analysis ........................................................................................................... 39
6 Establishment of a suspect compound list .................................................................................................... 39
6.1 Target analytes for method development ............................................................................................ 41
7 Method development ........................................................................................................................................ 55
7.1 Concept for method development ......................................................................................................... 55
7.1.1 Urine ...................................................................................................................................................... 55
7.1.2 Blood ...................................................................................................................................................... 55
7.1.3 Extraction method .............................................................................................................................. 55
7.2 Materials and methods ............................................................................................................................. 56
7.2.1 Chemicals .............................................................................................................................................. 56
7.2.2 Sample material ................................................................................................................................... 56
7.2.3 Instrumental analysis .......................................................................................................................... 57
7.2.4 Sample preparation ............................................................................................................................ 64
7.3 Results and discussion of method development ................................................................................. 64
7.3.1 Urine ...................................................................................................................................................... 64
5

Screening of target and non-target contaminants in human blood and urine
7.3.2 Blood ...................................................................................................................................................... 74
8 Data evaluation (suspect + non-target) .......................................................................................................... 79
8.1 LC-MS ........................................................................................................................................................... 79
8.2 GC-MS ........................................................................................................................................................... 83
9 Analysis of real samples ................................................................................................................................... 83
9.1 Target analysis ........................................................................................................................................... 84
9.1.1 LC-MS ..................................................................................................................................................... 84
9.1.2 GC-MS ..................................................................................................................................................... 86
9.2 Non-target analysis – LC-MS .................................................................................................................... 87
9.2.1 Suspects ................................................................................................................................................. 87
9.2.2 Non-targets ........................................................................................................................................... 97
9.3 Non-target analysis – GC-MS ................................................................................................................... 99
10 Summary and outlook .................................................................................................................................... 103
11 References ......................................................................................................................................................... 105
12 Annex ................................................................................................................................................................. 115
6

Screening of target and non-target contaminants in human blood and urine
List of Figures
Figure 1: Comparison of systematic workflows for (i) quantitative target analysis
with reference standards, (ii) suspect screening without reference standards, and (iii) non-target screening of unknowns in environmental
samples by using LC–high resolution (tandem) mass spectrometry.
According to [3]. ....................................................................................................................... 26
Figure 2: Distribution of sample matrices investigated by the reviewed suspect
and non-target screening methods, showing the highest percentage
(>50%) for water analysis. ........................................................................................................ 27
Figure 3: Histograms of logKOW values and Henry constants (atm*m3/mol) of
substances detected in blood, urine and all suspects in the suspect list;
predicted using EpiSuite. ........................................................................................................ 42
Figure 4: Number of target substances for method development in the two
matrices and their method of analysis. ................................................................................ 43
Figure 5: Chemical space plot; distribution of logKOW and Henry constants of the selected target substances for blood and urine compared to all 1500
suspects. ...................................................................................................................................... 43
Figure 6: Peak heights of DI tests with urine at different dilutions (diluted with water:MeOH 9:1). Note the logarithmic scale. .................................................................... 67
Figure 7: DI average recoveries at 5 different concentrations in urine compared to
standard injections in water, error bars represent the maximum and minimum values (n=3). ............................................................................................................ 68
Figure 8: Matrix spike recoveries for QuEChERS LLE and dSPE extractions, error
bars represent the maximum and minimum values (n=3). .............................................. 69
Figure 9: Relative recoveries compared to matrix spikes of the LLE fraction for 3
spiked concentrations, error bars represent the maximum and
minimum values (n=3). ............................................................................................................ 70
Figure 10: Relative recoveries compared to matrix spikes of the dSPE fraction for 3
spiked concentrations, error bars represent the maximum and
minimum values (n=3). ............................................................................................................ 70
Figure 11: Peak areas for conjugates (4-MeUmb-glucurunide and –sulfate, estrone-
glucuronide and sulfate) and the unconjugated 4-MeUmb in samples
without and with deconjugation by β-glucuronidase. ...................................................... 73
Figure 12: TIC of DI LC-MS analysis in ESI positive mode, comparing the
deconjugated and not-deconjugated samples. TICs for negative mode
and QuEChERS dSPE extracts can be found in the Annex. ............................................... 74
Figure 13: Extraction of whole blood samples. Left side: LLE; right side: dSPE. The
three tubes from left to right: with normal procedure according to [27],
with DIN EN 15662:2008 procedure, with addition of buffer. ........................................ 74
Figure 14: LC-MS analysis: absolute recoveries of target analytes spiked into
different blood sample types (50 ng/mL) and extracted by LLE and dSPE:
WB – whole blood, HpB – heparin blood, plasma. ........................................................... 75
7

Screening of target and non-target contaminants in human blood and urine
Figure 15: GC-MS analysis: absolute recoveries of target analytes spiked into
different blood sample types (50 ng/mL) and extracted by LLE and dSPE: WB – whole blood, HpB – heparin blood, plasma. ........................................................... 75
Figure 16: Relative recoveries compared to a matrix spike of LC blood targets
spiked into heparin blood at different concentrations – LLE fraction. .......................... 76
Figure 17: Relative recoveries compared to a matrix spike of GC blood targets
spiked into heparin blood at different concentrations – LLE fraction. .......................... 77
Figure 18: LC-LTQ-Orbitrap TICs of heparin blood extracted with LLE and after dSPE. ............................................................................................................................................ 77
Figure 19: GC-TICs of heparin blood extracted with LLE (black line) and after dSPE
(red line). .................................................................................................................................... 78
Figure 20: Scheme of data evaluation for LC-MS analysis. ................................................................... 79
Figure 21: Extracted chromatograms of the four detected parabens (methyl, ethyl,
propyl and butyl paraben) in the sample W17 (deconjugated extract) and a standard, showing matching RTs. .............................................................................. 90
Figure 22: HR-MS/MS spectra of 181.05, left: HCD 50, right: CID 35 with tentatively
identified fragment ions for homovanillic acid. ................................................................. 91
Figure 23: HR-MS/MS spectra of m/z 307.03 in the blood sample W17 (first row)
and a reference standard containing benzophenone-4 (second row). Left:
HCD 90, right: CID 35. ............................................................................................................. 92
Figure 24: HR-MS/MS spectra of 183.08 in the blood sample W17, tentatively
identified as triethylphosphate, left: HCD 90, right: CID 35. ........................................... 93
Figure 25: Chromatograms of cotinine and cotinine-d3 in a urine sample of a smoker, conjugated extract (left) and deconjugated extract (right),
showing the same RT of the compound and the IS and lower peak
height in the conjugated sample extract. ............................................................................ 95
Figure 26: Extracted ion chromatograms of tentatively identified perfluorinated
carboxylic acids in sample 14, showing matching RTs of the homologues
row of C8 to C14 carbon chain lengths. .............................................................................. 96
Figure 27: Extracted ion chromatograms of tentatively identified perfluorinated
sulfonic acids in sample M14 showing matching RTs of the homologues
row of C6 to C8 carbon chain lengths. ................................................................................. 97
Figure 28: HR-MS/MS spectra of the blood sample W17 (first row) and a reference
standard containing 4-hydroxy-chlorothalonil (second row). Left side:
HCD 120, right side: CID 35. .................................................................................................. 98
Figure 29: Possible structures of the non-target peak detected with Br isotope
pattern. ....................................................................................................................................... 99
Figure 30: Peak areas of the two detected phthalates in the 16 blood samples. .......................... 100
Figure 31: Peak areas of the four different tentatively identified di-tert-
butylbenzenes. ........................................................................................................................ 101
Figure 32: Peak areas of tetragylme tentatively identified by GC-MS in all blood samples. .................................................................................................................................... 101
8

Screening of target and non-target contaminants in human blood and urine
List of Tables
Table 1: Comparison of commercial mass spectrometers; values usually refer to a
mass range of 300-400, special equipment or configurations can have better values. See [3]. ............................................................................................................... 28
Table 2: Software for peak detection and data processing. ............................................................. 31
Table 3: Mass spectra databases, partly covering the range of organic pollutants. .................... 33
Table 4: Commercial and freely available substance databases. .................................................... 35
Table 5: Commercial and freely available software for the prediction of EI-MS
and MS/MS spectra. .................................................................................................................. 36
Table 6: Target analytes for the method development of urine samples. .................................... 44
Table 7: Target analytes for the method development of blood samples. .................................... 48
Table 8: Ionization methods and m/z values for the urine target analytes analysed by LC-HRMS. .............................................................................................................. 58
Table 9: Ionization methods and m/z values for the blood target analytes
analysed by LC-HRMS. .............................................................................................................. 59
Table 10: Ionization mode and m/z values for the internal standards used during
non-target screening. ............................................................................................................... 61
Table 11: Qualifier, quantifier and retention times of target analytes and IS analysed by GC-EI-MS (in SIM mode). .................................................................................... 63
Table 12: Instrumental and method lowest detectable concentrations (LDCs) and
retention times (RT) of all urine target analytes. ............................................................... 65
Table 13: Summary of recovery tests with DI and QuEChERS LLE and dSPE extracts;
x: absolute recoveries 50-150%, (x): absolute recoveries 30-50%, -:
absolute recoveries outside of 30-150%, nd: not detected ................................................ 72
Table 14: Internal standards detected after MZmine peak list alignment. ..................................... 81
Table 15: Number of peaks present after MZmine and after each removal step
using the R script for the analysis of a standard and a blood sample (W17) in ESI positive and negative mode. ........................................................................... 82
Table 16: AMDIS analysis settings for non-target analysis of GC-MS data. ...................................... 83
Table 17: LC-MS target analytes detected in blood and urine samples, with approximate concentrations in ng/mL; nd: not detected. ................................................ 85
Table 18: Concentrations of detected target analytes in human blood samples in
ng/mL, analysed by the LC-QTrap MRM method. Values in brackets are below the lowest calibration level, but showed good peak shapes. ............................... 86
Table 19: Number of suspects detected by MZmine, with recorded MS/MS spectra,
and tentatively identified ones. ............................................................................................. 87
Table 20: Suspect chemicals tentatively identified in urine and blood samples. .......................... 88
Table 21: Numbers of detected peaks in the samples W17 and M14 with a Cl or Br
pattern. ....................................................................................................................................... 97
9

Screening of target and non-target contaminants in human blood and urine
Table 22: Di-tert-butylbenzene compounds detected in blood samples by GC-MS
analysis. .................................................................................................................................... 100
10

Screening of target and non-target contaminants in human blood and urine
List of Abbreviations
ACN acetonitrile
APCI atmospheric pressure chemical ionization
APPI atmospheric pressure photon ionization
BMUB Federal Ministry for the Environment, Nature Conservation, Building and Nuclear
Safety
CID collision induced dissociation
DI direct injection
dSPE dispersive solid phase extraction
ECNI electron capture negative ionization
EI electron ionization
ESI electrospray ionization
GC gas chromatography
HCD higher-induced collision dissociation
HMDB Human Metabolite Database
HpB heparin blood
HRMS high resolution mass spectrometry
IS internal standard
KOW distribution coefficient between octanol and water
LC liquid chromatography
LDC lowest detectable concentrations
LLE liquid liquid extraction
MeOH methanol
MRM multiple reaction monitoring
MS mass spectrometry
NCI negative chemical ionization
PAHs polyaromatic hydrocarbons
PCBs polychlorinated biphenyls
PCI positive chemical ionization
PFASs polyfluorinated alkyl substances
PSA primary-secondary amine
QqQMS triple quadrupole MS
QuEChERS quick easy cheap rugged and safe (extraction method)
RT retention time
SIM single ion monitoring
11

Screening of target and non-target contaminants in human blood and urine
SRM selected reaction monitoring
TIC total ion chromatogram
TOF time-of-flight
VCI German Chemical Industry Association
VOCs volatile substances
WB whole blood
12

Screening of target and non-target contaminants in human blood and urine
1 Summary
During the last decades an increasing number of chemicals has been used in various applications and
consequently been released to the environment. Some chemicals can reach human body tissues via direct usage in consumer products or uptake via the environment and food. Human biomonitoring
programs in several countries monitor human body fluids such as urine and blood for a limited number
of compounds and biomarkers. This project was set up to support the German human biomonitoring program with a method to allow the detection and identification of so far unknown compounds in
human samples. Therefore a non-target method for the analysis of human urine and blood samples was
developed.
In general target, suspect and non-target screening methods can be distinguished. Target screening is a
(semi-) quantitative or qualitative screening for known compounds with reference standards. The aim is
often to obtain a fast overview of a large number of (regulated) contaminants. Such methods are often used in food monitoring and residue analysis to quickly distinguish positive from negative findings
below a certain detection limit. Afterwards the concentration of the detected contaminants can be
quantified. Suspect screening aims to confirm suspected compounds ("suspects"), for example known or predicted degradation products or compounds for which no reference standards are available. There is
no analytical information on the substances (retention time, mass spectrum), but the structures and often
other properties are known. From the list of the compounds relevant properties can be calculated (octanol-water partition coefficient, pKa values, mono-isotopic mass, isotope ratios, etc.). On the basis of
this information the chromatograms are searched for the "suspects" which are verified if detected peaks
and mass spectra coincide with the calculated properties and the structure. During a non-target screening, also called unknown screening, no information on the pollutants present in a sample is
available. The information about the substances is derived solely from the chromatograms and mass
spectra. Therefore, the first step is a manual or automatic peak search, which results in a list of detected ions. For each detected ion, lists of possible candidate structures are created based on the mass spectra.
As for the suspect screening, inappropriate candidates are filtered by comparison of properties predicted
from the structure and properties derived from the chromatogram. A final confirmation of tentatively identified substances is only possible with other spectroscopic techniques or a comparison with a
reference standard.
A literature review was conducted regarding non-target methods. Existing methods are mostly focusing on the analysis of water and sediment samples. Only a few studies analyse human tissues. Strategies
regarding method development and data evaluation were often not well documented; in most cases
simply the highest peaks found in the chromatograms were identified. Some studies describe the usage of software for peak deconvolution, alignment and blank subtraction. We developed a concept for data
evaluation, which was to be tested using internal standards (IS) and target analytes.
For the development of sample extraction, target analytes from diverse chemical groups were used. For their selection existing target methods for human samples were reviewed and essentially 12 chemical
groups were extracted, being:
• Aromatic amines (blood and urine),
• Fragrances (blood),
• Flame retardants (blood, novel and phosphate-esters in urine),
• Parabens (blood and urine),
• Pesticides (blood and urine),
• Phenols (blood and urine),
13

Screening of target and non-target contaminants in human blood and urine
• Phthalates (as metabolites in urine),
• Polyaromatic hydrocarbons - PAHs (blood, metabolites in urine),
• Polychlorinated biphenyls – PCBs (blood, metabolites in urine),
• Polyfluorinated alkyl substances - PFASs (blood, short-chain compounds also in urine),
• UV filters (blood and urine),
• Volatile substances - VOC (blood and urine).
A suspect list of 1500 chemicals was set up using information about these already detected compounds
in human matrices, but also those that could be relevant due to high production volumes, their occurrence in household products, food and environmental samples, as well as due to their persistency
and bioaccumulation potential. The suspect list served as the basis for the suspect screening of blood and
urine samples and for the selection of relevant and representative target analytes for the method development.
Target analytes for method development selected from the suspect list were chosen to cover a wide
range of functional groups and physicochemical properties ("substance domain"), representing both gas chromatography (GC) as well as liquid chromatography (LC) amenable substances, and represent both
new as well as methodically well-established substances to compare the method with already published
(standard) methods. 47 analytes were chosen for urine and 56 for blood extraction.
Both LC and GC coupled to mass spectrometry (MS) were to be applied during instrumental analysis of
the sample extracts. Urine samples were only analysed by LC-MS, as these contained more polar
compounds than blood, for which both LC-MS and GC-MS were applied.
For LC-MS, extracts were injected onto a Kinetex C18 column (100 mm x 3 mm, 2.6 µm, Phenomenex)
controlled by an Agilent 1200 LC system. A gradient with a flow rate of 0.2 mL/min was run using water
and methanol, both containing 0.1% of formic acid. The LC-system was coupled to an ion trap-Orbitrap hybrid instrument (LTQ Orbitrap XL, Thermo), and separate runs were conducted for positive and
negative mode using electrospray ionization (ESI). Detection was conducted with the Orbitrap operating
in high resolution (HR) MS full scan mode (m/z 100-1000) using a nominal resolving power of 100,000. For the non-target screening an additional run was conducted where data-dependent HRMS/MS spectra
with a resolving power of 30,000 were recorded using five different collision energies for the masses of
detected suspects and non-targets showing isotopic patterns in the full scan spectra.
A GC-MS (Agilent Technologies) with electron ionization (EI) was operated in single ion monitoring (SIM)
mode for the detection of 27 of the blood targets. A HP-5MS capillary column (30m x 0.25 mm I.D., 0.25
µm film thickness, Agilent Technologies) run with a temperature gradient was used for separation.
Target analytes were optimized using the LC and GC methods. Some targets were not ionisable with the
ionization methods used (ESI and EI) or did not show any retention on the selected columns. Thus the
number of targets had to be reduced to 40 for urine and 53 for blood.
For method development a pooled urine sample collected from members of the department was used.
Pig blood supplied by a local slaughterhouse was used due to its similarity to human blood. Whole
blood, heparin blood and plasma were tested during method development.
For the sample preparation the QuEChERS (quick, easy, cheap, effective, rugged and safe) method was
tested. This method had been reported to obtain good recoveries for a broad range of pesticides in
different food matrices, as well as for pharmaceuticals in whole blood samples. Thus it seemed promising for the extraction of compounds with a broad range of physico-chemical properties. The method uses in
a first step a liquid liquid extraction (LLE) with acetonitrile and addition of salts for phase separation. In
a second step the supernatant is cleaned-up with dispersive solid phase extraction (dSPE) using primary
14

Screening of target and non-target contaminants in human blood and urine
secondary amine. This procedure was tested both for the extraction of urine and blood samples. For
urine additionally a direct injection (DI) into the LC-HRMS system was tested. Applying both the DI and the QuEChERS extraction 38 of the 40 urine target analytes showed absolute recoveries between 30-
150%. Although this meant that the target analytes were prone to matrix effects, the absolute recoveries
were acceptable for the intended use, as during a non-target screening no quantification but rather a qualitative detection was intended. The QuEChERS method applied to blood samples resulted in good
recoveries, which were similar for all three blood types tested. Differences between LLE and the
subsequent dSPE step were only discovered for the perfluorinated carboxylic acids and tetrabromobisphenol A, which were retained by the dSPE material. As the background signal in LC and
GC-MS analysis was not substantially higher in the LLE fraction, for the non-target screening a simple LLE
extraction of the blood samples was conducted. The recoveries for 43 of 53 analytes were between 70 to 150% for spiked heparin blood. Thus the QuEChERS method is a very promising extraction method for
the analysis of diverse chemical groups from blood samples.
For the non-target analysis the developed extraction methods were applied to 16 human urine and blood samples. These samples were supplied by the German Environmental Specimen Bank and were taken in
2013 from 8 female and 8 male students in Greifswald. All samples were spiked with 15 internal
standards (IS) used for evaluation of the data processing and for retention time normalization. Following a deconjugation step using β-glucuronidase, urine samples were analysed by direct injection as well as
after QuEChERS extraction with LC-HRMS, while blood samples were extracted with LLE and then both
LC-HRMS and GC-MS measurements were conducted.
For LC analysis the raw data from 16 samples, 3 method blanks and 2 external standards were imported
into the open access program MZmine 2.10. Peaks were deconvoluted and aligned, and six aligned peak
lists were obtained, for DI-urine, QuEChERS-urine and blood, each for positive and negative ion mode. On average the lists contained about 33 000 peaks. These lists were compared with the internal standard
list, the target list, the suspect list and a HMDB suspect list (all small molecule metabolites detected in
urine or blood extracted from the Human Metabolite Database www.hmdb.ca/). These final lists, however, contained many peaks that resulted from the integration of background noise. To eliminate
these peaks and to filter out the peaks which are also present in the method blanks an R script was
written. In a first step peaks with bad peak shapes defined as having an area to height ratio of > 100 were deleted from the lists. In a second step all peaks in the samples being < 2 times the peak intensity
and/or area of the method blank were deleted. In a final step all masses with unreasonable mass defects
were filtered out. On average about 10 000 peaks were deleted from the peak lists, leaving about 23 000 peaks in the aligned lists.
By application of the data processing method, all IS were detected in all analysed external standards.
Only 4 of the 15 IS were not detected in all analysed samples. Also all target analytes were found in the external standards. Some of the target analytes were additionally detected in a few samples.
Perfluorooctanoic acid (PFOA) and perfluorooctanesulfonic acid (PFOS) were detected in all blood
samples. Other targets detected in only a few samples were trichloroethylphosphate, perfluorotetradecanoic acid (PFTDA) and tetrachlorosalicylanilide in blood and 2-ethoxyethyl acetate,
hydroxyethyl-mercapturic acid, diphenyl phosphate, mono-ethyl-phthalate, mono-benzyl-phthalate,
triclosan, ethyl paraben, butyl paraben and benzophenone-3 in urine samples. These results show that the data processing method could successfully be used to detect target analytes. Therefore it should also
be possible to detect other compounds present in the samples.
First a suspect search was conducted. The suspects identified by MZmine were visually inspected and those with good peak shapes and present in at least 5 of the 16 samples were selected for further
processing. For these MS/MS product ion spectra were recorded. The program MetFrag was used for in-
silico fragmentation of the detected suspect and comparison with the recorded MS/MS spectra. If the main fragment ions could be explained by the in-silico fragmentation, the suspect was reported as
15

Screening of target and non-target contaminants in human blood and urine
tentatively identified. For final identification reference standards were purchased and analysed together
with the samples.
Several compounds could be tentatively identified. Compounds such as cotinine, aminophenol and
dihydroxychlorobenzene were detected besides several endogenous compounds like isoflavones in many
samples. Additionally four compound groups seemed to be interesting. The first being parabens, where ethyl- and butyl-paraben were detected during target analysis, while methyl- and propyl-paraben were
additionally detected during suspect analysis and could be verified based on RTs. Parabens are widely
used in personal care products and have been analysed in human samples in several studies. The second group, which is also present in personal care products and where at least a few compounds have been
detected in human samples before are the UV-filters. Next to benzophenone-3 that has been detected as
target analyte, also di-, tri- and tetrahydroxybenzophenone were detected in several urine samples. They could only be tentatively identified by matching their RTs with each other. A third compound group
already being analysed for in several human biomonitoring studies are the perfluorinated alkyl acids. As
mentioned before, PFOA and PFOS were detected in all blood samples, while PFTDA was detected in only one. The suspect search could additionally detect perfluorinated carboxylic acids with chain lengths of 9
to 13 carbons and perfluorinated sulfonic acids with 6 and 7 carbon chain lengths in some samples. The
last compound group are the organophosphate flame retardants (OP-FR). Triethylphosphate, diethylhexylphosphate and dicresylphosphate were the ones detected in many or all blood samples. Due
to the phase out of brominated flame retardants the OP-FR are being used in larger quantities and thus it
is not surprising for them to be present in human samples.
For the detection of unknowns, the aligned peak lists were separated into individual lists for each
sample. Lists for two samples were then imported into the R script “nontarget”, where a pattern search
was conducted. The resulting lists contain information about peaks showing isotopic patterns for Cl, Br, N and S. For m/z values of peaks containing isotopes and showing intensities >100 000 a data-dependent
HR-MS/MS scan was conducted. The peaks were looked up in the raw files again, where molecular
formulas were calculated from the exact mass with a mass tolerance of 10 ppm. For masses with Cl or Br isotope pattern this resulted in 2 up to 400 generated molecular formulas. These were checked for
plausibility by application of the Seven-Golden-Rules software, reducing the number to mostly 1-2. The
remaining molecular formulas were then searched for in ChemSpider. For most of the compounds found in ChemSpider less than 5 references were listed. One compound detected in blood samples having 19
references in ChemSpider was 4-hydroxy chlorothalonil, a metabolite of the fungicide chlorothalonil.
This metabolite could be identified by comparison to a reference standard. Only one peak with a bromine pattern was detected in all urine and all blood samples, both in positive and negative mode.
The only possible molecular formula for the detected mass and the bromine pattern was C9H6NOBr. A
search for this formula in the compound database ChemSpider resulted in 123 hits, which could be reduced to 34 possible ones being analysable both in positive and negative ion mode. 31 of these are
bromo-quinolinoles, which are used amongst others for the production of dyes for textiles. This usage
could make the presence of these chemicals in human samples likely; however, a final identification using a reference standard is necessary.
By GC-MS analysis of blood sample extracts the target analytes dibutylhydroxytoluene and naphthalene
were detected in 13 and 3 samples with approximate concentrations of 10 and 2-3 ng/mL, respectively. Using AMDIS for the deconvolution of the chromatograms and a search in the mass spectra databases
NIST and Wiley several non-target compounds could be tentatively identified. Besides some compounds
present in food items like caffeine and theobromine, niacidamine (vitamin B3) could be tentatively identified being widely used in personal care products. Other substances of interest were the two
phthalates dibutyl- and bis-(2-ethylhexyl) phthalate. Phthalates are known to be present in human
samples, however, they are commonly analysed in urine as their mono-phthalate metabolites. Additionally to dibutylhydroxytoluene, which had been detected already during the target analysis, di-
16

Screening of target and non-target contaminants in human blood and urine
tert-butylbenzene, di-tert-butylphenol and 7,9-di-tert-butyl-1-oxaspiro[4,5]deca-6,9-diene-2,8-dione could
tentatively be identified. These substances are used as antioxidation compounds in plastic material, for example in tubes for drinking water supply. Di-tert-butylphenol could be verified using a reference
standard and has been calculated to be present at approximately 170 ng/mL. Except for
dibutylhydroxytoluene, none of the others has previously been analysed in human blood samples from the general population. The presence of these compounds, however, might need some further
investigation.
The detected targets, suspects and non-targets showed the applicability of the developed non-target screening method to human samples. Some suspects and non-targets could tentatively be identified and
a few could finally be identified by reference standards. Thus with the application of a non-target
screening method new emerging contaminants can be detected, as long as they are present in databases like ChemSpider or PubChem or local databases generated for suspect search. As the suspect search is
less time consuming than the search for non-targets, the suspect lists should include all relevant
compounds and should be continuously updated. It is also helpful if the information on each suspect is very detailed in regards of additional information such as detections in different matrices, production
volumes and usages.
The general data processing during non-target screening is quite laborious and requires manual work. There is thus a lot of potential for software development that could help with the huge amount of data
that needs to be handled. The suspect and non-target compounds found are only a small portion of the
peaks detected in the human blood and urine samples. Thus with additional time and work there is a potential to detect even more contaminants.
An aspect that has to be taken into account during non-target screening of biological samples is the
occurrence of natural substances and metabolites. To the best of our knowledge there is no way to generally distinguish between endogenic and exogenic substances. We tried to take this aspect into
account by referring to the Human Metabolome Database, which contains data about small molecule
metabolites found in the human body, thus also many naturally occurring substances.
For future non-target screening in human tissues, one should regard different ways to handle the large
amount of detected peaks in the samples. One idea could be the examination of time trends using
samples from the German Environmental Specimen Bank taken over a time span of several years. By only identifying peaks showing a trend (increasing, decreasing or both), especially compounds with
increasing levels becoming interesting for inclusion into human biomonitoring studies could be
identified. This would thus reduce the amount of peaks for identification and at the same time filter out the compounds becoming interesting for future studies. Another way to reduce the amount of peaks
would be the comparison of different cohorts, for example with and without a certain disease or specific
exposure groups such as occupational exposure. Using statistical tools one could determine peaks which occur predominantly in one of the cohorts and try to identify solely these ones.
A third way to reduce the number of relevant peaks is to determine the compounds being of
toxicological relevance. Here an effect directed analysis of human blood and urine samples could be developed. A fractionation with a subsequent toxicological test like for example on endocrine disruption
could be applied, where the fractions showing effects are filtered out. In these fractions a non-target
analysis can then try to identify the compounds responsible for the detected effects. This way the several hundred to thousand peaks found in a sample can be reduced to the relevant ones regarding effects on
human health.
17
Screening of target and non-target contaminants in human blood and urine
2 Zusammenfassung
Während der letzten Jahrzehnte wurde eine zunehmende Anzahl an Chemikalien produziert, welche
durch verschiedenste Anwendungen in die Umwelt gelangen können. Einige dieser Chemikalien können entweder durch direkte Verwendung in verbrauchernahen Produkten oder durch die Umwelt bzw.
Lebensmittel in den menschlichen Körper gelangen. In einigen Ländern existieren Humanbiomonitoring
Programme, die Konzentrationen einer begrenzten Anzahl an Chemikalien und Biomarkern in Körperflüssigkeiten wie Urin und Blut überwachen. Dieses Projekt hat zum Ziel das deutsche
Humanbiomonitoring-Programm mit einer Methode zur Bestimmung von relevanten und bisher noch
nicht analysierten Chemikalien in menschlichen Proben zu unterstützen. Hierzu wurde eine Non-target Screening Methode für die Analyse von menschlichen Urin- und Blutproben entwickelt.
Generell können Screening Methoden in Target, Suspect und Non-target Methoden unterteilt werden.
Das Target Screening ist eine qualitative bzw. (semi)quantitative Screening Methode für bekannte Verbindungen mit Referenzstandards. Ziel ist es hierbei einen schnellen Überblick über eine große Zahl
an (regulierten) Kontaminanten zu erhalten. Häufig werden solche Methoden in der
Lebensmittelüberwachung und Rückstandsanalytik eingesetzt, um schnell positive von den häufig überwiegend negativen Befunden unterhalb eines bekannten Detektionslimits zu unterscheiden. Die
Konzentration der gefundenen Kontaminanten kann anschließend selektiv quantifiziert werden. Ziel des
Suspect Screenings ist es, vermutete Verbindungen („Suspects“) zu bestätigen, z.B. vorhergesagte Abbauprodukte oder Substanzen, für die kein Referenzstandard erhältlich ist. Hierbei gibt es zwar keine
analytischen Informationen über die Verbindungen (Retentionszeit, Massenspektrum), jedoch sind die
Strukturen und eventuell weitere Eigenschaften bekannt. Aus der Liste der Substanzen selbst können für die Analytik relevante Eigenschaften abgeschätzt oder mit Hilfe von Programmen berechnet werden
(Oktanol-Wasser-Verteilungskoeffizient, pKa-Werte, monoisotopische Massen, Isotopenverhältnisse, usw.).
Anhand dieser Angaben können die Chromatogramme nach den „Suspects“ durchsucht werden und es kann geprüft werden, ob die gefundenen Peaks und Massenspektren mit den aus der Struktur
abgeleiteten Eigenschaften in Einklang stehen. Beim Non-target oder unknown Screening liegen keine
Informationen über die vorhandenen oder erwarteten Spurenschadstoffe in einer Probe vor. Die Information über die Substanzen wird allein aus dem Chromatogramm abgeleitet. Folglich ist der erste
Schritt eine manuelle oder automatische Peak Suche, die zu einer Liste gefundener Ionen führt. Zu
jedem Ion dieser Liste werden basierend auf den Massenspektren Listen mit möglichen Kandidatenstrukturen erstellt. Ein schrittweises Herausfiltern unpassender Kandidaten erfolgt wie beim
Suspect-Screening aus dem Vergleich von aus der Struktur vorhergesagten und den aus dem
Chromatogramm abgeleiteten Eigenschaften. Wie auch beim Suspect-Screening ist eine endgültige Bestätigung der vorläufig identifizierten Substanzen jedoch nur mit weiteren spektroskopischen
Verfahren oder letztlich einem authentischen Referenzstandard möglich.
Zu Beginn des Projektes wurde eine Literaturrecherche in Bezug auf Non-target Screening-Methoden durchgeführt. Vorhandene Methoden konzentrieren sich bisher meist auf die Analyse von Wasser,
Sediment und Lebensmitteln. Es gibt nur wenige Studien zur Analyse menschlicher Proben. Die
Strategien hinsichtlich Methodenentwicklung und Auswertung der Daten waren oft nicht nachvollziehbar dokumentiert, in den meisten Fällen wurde lediglich eine Auswertung der größten oder
gut chromatographisch getrennten Peaks vorgenommen. Einige Studien beschreiben die Verwendung
von Software für Peak Erkennung, Alignement und Blindwert Korrektur. Somit wurde in diesem Projekt ein Konzept für die Datenauswertung entwickelt, was anhand von internen Standards (IS) und Target
Analyten getestet wurde.
Für eine Selektion der Target Analyten wurden bestehende Analyse-Methoden von menschlichen Proben nach Analyten und ihren Substanzgruppen durchsucht. Resultierend wurden vor allem folgende 12
Substanzklassen gemessen:
18

Screening of target and non-target contaminants in human blood and urine
• Aromatische Amine (Blut und Urin),
• Duftstoffe (Blut),
• Flammschutzmittel (Blut, Neuartige und Phosphat-Ester in Urin),
• Parabene (Blut und Urin),
• Pestizide (Blut und Urin),
• Phenole (Blut und Urin),
• Phthalate (Metabolite in Urin),
• Polyaromatische Kohlenwasserstoffe - PAKs (Blut, Metabolite in Urin),
• Polychlorierte Biphenyle – PCBs (Blut, Metabolite in Urin),
• Polyfluorierte Alkyl Verbindungen - PFASs (Blut, Kurzkettige auch in Urin),
• UV Filter (Blut und Urin),
• Volatile Verbindungen - VOC (Blut und Urin).
Eine Suspect Liste mit über 1500 Chemikalien wurde aus diesen schon in Humanproben gemessenen
Analyten, aber auch aus sonstigen relevanten (auf Grund hoher Produktionsmengen, Vorkommen in Haushaltsprodukten, Lebensmitteln und Umweltproben, als auch Persistenz und Bioakkumulierungs
Potential) Verbindungen zusammengestellt. Diese Liste wurde als Basis eines Suspect Screenings für die
Urin- und Blutproben verwendet und aus ihr wurden auch repräsentative Target-Analyten für die Methodenentwicklung ausgewählt.
Die ausgewählten Target-Analyten sollten ein großes Substanzspektrum erfassen, sowohl
Gaschromatographie (GC)- als auch Flüssigchromatographie (LC)-gängige Analyten beinhalten und sowohl neuartige als auch schon methodisch etablierte Substanzen enthalten. Für die
Methodenentwicklung von Urinproben wurden 47 und für Blutproben 56 Analyten ausgewählt.
Für die instrumentelle Analyse wurden sowohl LC als auch GC gekoppelt mit Massenspektrometern (MS) verwendet. Urinproben wurden nur mittels LC-MS analysiert, da sie eher polare Verbindungen enthalten,
während Blutproben mit beiden Methoden gemessen wurden. Die instrumentellen Methoden wurden
aus schon bestehenden Methoden entwickelt.
Während der LC-MS Analyse wurden Proben auf eine Kinetex C18 Säule (100 mm x 3 mm, 2,6 µm,
Phenomenex) injiziert. Ein Gradient aus Wasser und Methanol (beides mit 0,1% Ameisensäure versetzt)
wurde mit einer Flussrate von 0,2 mL/min gefahren. Das LC-System war mit einem Iontrap-Orbitrap Instrument (LTQ Orbitrap XL, Thermo) gekoppelt, welches mittels separaten Messungen in positiv und
negativ Modus im Elektrospray (ESI) ionisierte. Zur Detektion wurde eine Full Scan Messung (m/z 100-
1000) mit einer nominalen Auflösung von 100 000 durchgeführt. Für die Non-target Analyse wurden für detektierte Suspects und Non-targets mit Isotopenmustern zusätzlich MS/MS Spektren mittels fünf
verschiedener Kollisionsenergien und einer nominalen Auflösung von 30 000 aufgenommen.
Ein GC-MS (Model 6890 N, MSD 5973, Agilent Technologies) mit Elektronenionisation (EI) wurde im Single Ion Monitoring (SIM) Modus für die Detektion der GC-Target Analyten verwendet. Ein µL Probe
wurde auf eine HP-5MS Kapillarsäule (30m x 0,25 mm ID, 0,25 µm Filmdicke, Agilent Technologies)
injiziert und mittels eines Temperaturprogramms aufgetrennt.
Mittels dieser LC und GC Methoden wurden die Target-Analyten optimiert. Einige der Targets waren mit
den gewählten Ionisierungsmethoden (ESI und EI) nicht ionisierbar oder wurden auf den gewählten
Säulen nicht zurückgehalten. Somit reduzierte sich die Anzahl der Target Analyten auf 40 für die Urinproben und auf 53 für die Blutproben.
19

Screening of target and non-target contaminants in human blood and urine
Für die Methodenentwicklung wurden Urinproben von Mitarbeitern des Departments gesammelt und
homogenisiert. Für die Blutproben wurde Schweineblut von einem lokalen Schlachter verwendet, da Schweineblut dem menschlichen sehr ähnlich ist. Hier wurden sowohl Vollblut, Heparin-Blut als auch
Plasma getestet.
Für die Probenaufarbeitung sollte die QuEChERS (quick, easy, cheap, effective, rugged and safe) Methode herangezogen werden, welche bisher vor allem zur Analyse von Pestiziden in Lebensmitteln zum Einsatz
kommt, aber auch schon zur Analyse von Arzneimitteln in Vollblutproben getestet wurde. Somit schien
diese Methode gut geeignet zu sein, um ein breites Substanzspektrum aus diversen Probenarten zu extrahieren. In einem ersten Schritt wird eine Flüssig-Flüssig-Extraktion (LLE) mittels Acetonitril-Zugabe
und Salzen zur Phasentrennung durchgeführt, gefolgt von einer Aufreinigung mittels dispersiver
Festphasenextraktion (dSPE). Diese Herangehensweise wurde sowohl für Urin- als auch für Blutproben getestet. Für Urinproben wurde zusätzlich eine Direktinjektion (DI) in das LC-MS System getestet. Bei
einer Kombination von QuEChERS und DI konnten für 38 der 40 Target Analyten absolute
Wiederfindungen von 30-150% erreicht werden. Trotz z.T. hoher Matrixeffekte, sind diese absoluten Wiederfindungen ausreichend für ein Non-target Screening, weil es hier vor allem um die Detektion,
nicht aber die Quantifizierung der Substanzen geht. Bei der Anwendung der QuEChERS Methode zur
Extraktion der Blutproben konnten für alle drei Blutarten ähnliche Wiederfindungen erzielt werden. Gemessene LLE und dSPE Extrakte unterschieden sich nur bei wenigen Analyten, z.B. werden bei der
dSPE Aufreinigung die Perfluorierten Carbonsäuren und Tetrabromobisphenol A zurückgehalten und
zeigen somit geringe Wiederfindungsraten. Da der Hintergrund weder bei LC noch GC Messungen wesentlich höher für die LLE Extrakte im Vergleich zu den dSPE Extrakten war, wurde für das Non-target
Screening nur eine Extraktion mittels LLE durchgeführt. Bei der LLE Extraktion von dotierten Heparin-
Blutproben lagen die Wiederfindungen von 43 der 53 Target Analyten zwischen 70-150%. Somit zeigte sich die QuEChERS Extraktionsmethode als sehr vielversprechend für die Analyse diverser
Substanzgruppen vor allem in Blutproben.
Zur Non-target Analyse wurden die entwickelten Extraktionsmethoden auf 16 humane Urin- und Blutproben angewandt. Die Proben wurden von der Umweltprobenbank bereitgestellt und stammten aus
dem Jahr 2013 von acht weiblichen und acht männlichen Studenten aus Greifswald. Alle Proben wurden
mit internen Standards dotiert, welche zur Evaluierung der Datenauswertung und Retentionszeit-Normierung herangezogen wurden. Nach einer Dekonjugation der Metabolite in Urinproben mittels β-
Glucuronidase wurden die Urinproben sowohl mittels QuEChERS extrahiert und analysiert als auch
mittels DI gemessen. Die Blutproben wurden mittels LLE extrahiert und anschließend sowohl mit LC-HRMS als auch GC-MS analysiert.
Zur Datenauswertung wurden die Rohdaten der LC Analyse der 16 Proben, drei Methoden-Blindwerten
und zwei externen Standards in das open-access-Programm MZmine 2.10 importiert. Hier wurden die Peaks herausgefiltert und anschließend zu einer großen Liste zusammengestellt. Daraus resultierten 6
Peak Listen: für DI-Urin, QuEChERS-Urin und Blut, jeweils im positiven und negativen Modus. Die Listen
enthielten im Durchschnitt ca. 33 000 Peaks. Diese Peak Listen wurden mit Listen der internen Standards, Target Analyten, Suspects und Suspects aus der HMDB Liste (alle niedermolekularen
Metabolite, welche in Urin- oder Blutproben detektiert wurden, aufgelistet in der Human Metabolite
Database www.hmdb.ca/) verglichen und die Ergebnisse wurden den Peak Listen hinzugefügt. Die resultierenden Listen enthalten jedoch viele Peaks, die sich aus der Integration von Hintergrundrauschen
ergeben. Um diese Peaks zu beseitigen und Peaks herauszufiltern, die auch in den Methoden-
Blindwerten vorhanden sind, wurde ein R-Skript geschrieben. In diesem wurden in einem ersten Schritt Peaks mit schlechten Peak Formen, definiert durch ein Fläche zu Höhenverhältnis > 100, aus den Listen
gelöscht. In einem zweiten Schritt wurden alle Peaks aussortiert, deren Intensitäten < 2x der Intensität
im Methodenblindwert bzw. deren Flächen < 2x der Fläche im Methodenblindwert waren. Und in einem
20
Screening of target and non-target contaminants in human blood and urine
letzten Schritt wurden alle Massen mit unangemessenem Massendefekt herausgefiltert. Durchschnittlich
wurden so ca. 10 000 Peaks aus den Listen herausgelöscht, so dass ca. 23 000 Peaks übrig blieben.
Durch die Anwendung von MZmine und dem R Skript wurden 11 der 15 internen Standards in allen
Proben detektiert. In den externen Standards wurden außerdem alle Target Analyten und internen
Standards detektiert. Zusätzlich wurden einige der Target Analyten in ein paar der Proben entdeckt. Perfluoroktansäure (PFOA) und Perfluoroktansulfonsäure (PFOS) wurden in allen Blutproben gefunden.
Andere detektierte Target Analyten waren Trichlorethylphosphat, Perfluortetradecansäure (PFTDA) und
Tetrachlorosalicylanilide in Blut und 2-Ethoxyethyl-Acetat, Hydroxyethyl-Merkaptursäure, Diphenyl-Phosphat, Mono-Ethyl-Phthalat, Mono-Benzyl-Phthalat, Triclosan, Ethylparaben, Butylparaben und
Benzophenon-3 in Urinproben. Diese Ergebnisse zeigen, dass die Datenauswertungs-Methode erfolgreich
dazu eingesetzt werden konnte, um Target-Analyten zu detektieren. Daher war es auch möglich, andere vorhandene Verbindungen in den Proben zu identifizieren.
Hierzu wurde zunächst eine Suspect-Suche durchgeführt. Die von MZmine erkannten Suspects wurden
bei guten Peak Formen und Detektionen in mindestens 5 der 16 Proben weiter bearbeitet. Für diese wurde eine Fragmentierung mittels datenabhängigem MS/MS-Scan durchgeführt. Das Programm
MetFrag wurde anschließend für eine in-silico-Fragmentierung der Suspects und Abgleich mit den
aufgezeichneten MS/MS-Spektren verwendet. Wenn die wichtigsten Fragment-Ionen durch die in-silico-Fragmentierung erklärt werden konnten, wurden die Suspects als vorläufig identifiziert betrachtet.
Außerdem konnte für einige Substanzen eine endgültige Identifizierung mittels Referenzstandards
durchgeführt werden.
Auf diesem Weg konnten einige Suspects vorläufig identifiziert werden. Substanzen wie Cotinin,
Aminophenol und Dihydroxychlorbenzol wurden neben mehr endogenen Substanzen wie Isoflavonen in
vielen Proben detektiert. Zusätzlich konnten vier interessante Substanzklassen herausgefiltert werden. Die erste Klasse waren die Parabene, von denen Ethyl- und Butylparaben schon während der Target
Analyse in Urinproben identifiziert werden konnten. Während der Suspect Suche wurden zusätzlich
Methyl- und Propylparaben gefunden, deren Retentionszeiten in homologer Reihe mit den anderen Parabenen waren. Parabene werden weitläufig in Körperpflegeprodukten benutzt und wurden schon in
vielen Studien in Urinproben analysiert. Die zweite Klasse sind die UV-Filter, welche auch vorwiegend in
Körperpflegeprodukten verwendet werden und von denen einige bereits in anderen Studien analysiert worden sind. Neben Benzophenon-3, welches als Ziel Analyt detektiert wurde, konnten Di-, Tri- und
Tetrahydroxybenzophenon in mehreren Urinproben durch ihre zueinander passenden Retentionszeiten
vorläufig identifiziert werden. Die dritte Substanzklasse sind die Perfluorierten Alkylsäuren, von denen schon mehrere in diversen Humanbiomonitoring Programmen routinemäßig analysiert werden. Neben
PFOA, PFOS und PFTDA, die während der Target Analyse detektiert wurden, konnten aufgrund passender
Retentionszeiten auch die Perfluorierten Carbonsäuren mit 9 bis 13 Kohlenstoffatomen und die Perfluorierten Sulfonsäuren mit 6 und 7 Kohlenstoffatomen vorläufig identifiziert werden. Die letzte und
vielleicht interessanteste Substanzklasse sind die Organophosphor-Flammschutzmittel. Hier wurden
Triethylphosphat, Diethylhexylphosphat und Dicresylphosphat in vielen oder allen Blutproben detektiert. Durch das Phase Out der bromierten Flammschutzmittel, werden zunehmend Flammschutzmittel auf
Organophosphat Basis verwendet. Es ist also nicht verwunderlich, diese in menschlichen Proben zu
finden.
Für den Nachweis von Non-targets wurden die Peak Listen in einzelne Peak Listen pro Probe unterteilt.
Die Listen von zwei Proben wurden dann in das R Skript "nontarget" importiert, wo eine Isotopensuche
durchgeführt wurde. Die Ergebnislisten enthalten Informationen über Peaks mit Isotopenmustern für Cl, Br, N und S. Für m/z-Werte der Peaks, die Isotope enthalten und Intensitäten > 100 000 aufweisen wurde
ein datenabhängiger MS/MS-Scan durchgeführt. Die Peaks wurden in den Rohdateien überprüft und
Molekülformeln wurden für die genaue Masse mit einer Massentoleranz von 10 ppm berechnet. Dies führte für Massen mit Cl oder Br Isotopen zu zwei bis 400 generierten Molekülformeln. Diese wurden
21

Screening of target and non-target contaminants in human blood and urine
durch die Anwendung einer Plausibilitätsprüfung mittels der Software Seven-Golden-Rules auf meist 1-2
reduziert. Nach den verbleibenden Molekülformeln wurde anschließend in der Chemikaliendatenbank ChemSpider gesucht. Für den Großteil der Molekülformeln waren in ChemSpider nur Verbindungen
gelistet, die weniger als fünf Referenzen aufwiesen. Eine Substanz, welche 19 Referenzen aufwies, war
4-Hydroxy-Chlorthalonil, ein Metabolit des Fungizides Chlorthalonil. Dieses wurde mittels Referenzstandards und Abgleich von Retentionszeit und MS/MS-Spektrum identifiziert. Nur ein Peak mit
einem Br-Isotopenmuster wurde in allen Blut- und Urinproben detektiert, wobei die Substanz sowohl im
positiven als auch im negativen Modus messbar war. Für die exakte Masse und das Isotopenmuster gab es nur eine passende Molekülformel: C9H6NOBr. Bei der Suche nach dieser Molekülformel in ChemSpider
resultierte eine Liste von 123 passenden Strukturen. 34 von diesen waren sowohl im positiven als auch
negativen Modus messbar. 31 von diesen Strukturen waren Bromo-Chinolinole, welche unter anderem in der Produktion von Textilfarbstoffen zur Anwendung kommen. Diese Verwendung würde das
Vorkommen dieser Substanzen in menschlichen Proben erklären, jedoch ist eine finale Identifizierung
mittels Referenzstandard notwendig.
Mittels der GC-MS Target Analyse der Blutprobenextrakte konnten Dibutylhydroxytoluene (BHT) in 13
und Naphthalen in 3 Proben detektiert werden. Ungefähre Konzentrationen lagen bei 10 ng/mL für BHT
und bei 2-3 ng/mL für Naphthalen. Mit dem Programm AMDIS wurden die Peaks mit den zugehörigen Massenspektren aus den Chromatogrammen herausgefiltert und anschließend mit den Spektren der
Datenbanken NIST und Wiley abgeglichen. Auf diesem Wege konnten diverse Non-targets vorläufig
identifiziert werden. Neben Substanzen, welche von Lebensmitteln stammen wie Kaffein und Theobromine, wurde auch Niacidamine (Vitamin B3) detektiert, welches breite Anwendung in
Körperpflegeprodukten findet. Andere interessante Substanzen waren die zwei Phthalate Dibutyl- und
Bis-(2-ethylhexyl) Phthalat. Das verbreitete Vorkommen von Phthalaten in menschlichen Proben ist bekannt, jedoch werden meist die Mono-Phthalat Metabolite in Urinproben gemessen. Zusätzlich zu dem
Target BHT wurden Di-tert-butylbenzol, Di-tert-butylphenol und 7,9-di-tertbutyl-1-oxaspiro[4,5]deca-6,9-
diene-2,8-dione vorläufig identifiziert. Diese Substanzen werden als Antioxidationsmittel in Plastikmaterialien, wie z.B. Rohren für Trinkwasser verwendet. Di-tert-butylphenol wurde außerdem
mittels Referenzstandards verifiziert und die ungefähr berechnete Konzentration in zwei der Proben
betrug 170 ng/mL. Außer BHT wurde von diesen Antioxidantien noch keins in menschlichen Proben der generellen Bevölkerung detektiert.
Die detektierten Targets, Suspects und Non-targets zeigen die Anwendbarkeit der entwickelten Non-
target Screening Methode auf menschliche Proben. Einige Suspects und Non-targets konnten vorläufig identifiziert und einige konnten sogar abschließend durch Referenzstandards identifiziert werden. So
können durch die Anwendung eines Non-target Screenings neue Schadstoffe nachgewiesen werden,
solange sie in Datenbanken wie ChemSpider oder PubChem oder lokalen Suspect-Datenbanken vorhanden sind. Da die Suspect Suche weniger zeitaufwendig ist als die Suche nach Non-targets, sollten
die Suspect Listen alle relevanten Verbindungen enthalten und kontinuierlich aktualisiert werden.
Hierbei ist es sinnvoll, möglichst viele vorhandene Informationen zu den Suspects zu sammeln, wie z.B. Zusatzinformationen wie Detektionen in diversen Proben, Produktionsvolumen und
Anwendungsgebiete.
Die allgemeine Datenverarbeitung während einer Non-target Suche ist mühsam und erfordert manuelle Arbeit. Neue Software Entwicklungen könnten es erleichtern, mit den großen Datenmengen zu arbeiten.
Die hier gefundenen Suspect und Non-target-Verbindungen sind nur ein kleiner Teil der Peaks, die in
den menschlichen Urin- und Blutproben entdeckt wurden. Durch zusätzliche Zeit und Arbeit könnten hier potenziell weitere Verbindungen identifiziert werden.
Ein Aspekt, der beim Non-target Screening von biologischen Proben berücksichtigt werden muss, ist das
Auftreten von körpereigenen Stoffen und dessen Metaboliten. Momentan gibt es keine generelle Vorgehensweise, wie diese von den Umweltschadstoffen unterschieden werden können. Wir haben
22

Screening of target and non-target contaminants in human blood and urine
versucht, diesen Aspekt zu integrieren, indem auch nach Verbindungen gesucht wurde, die in der
Human Metabolite Database (HMDB) vorhanden sind.
Für zukünftige Non-target Screening Studien in menschlichen Proben sollten verschiedene Möglichkeiten
betrachtet werden, um die große Menge an vorhandenen Peaks in den Proben zu bearbeiten. Eine Idee
wäre die Suche nach zeitlichen Konzentrationsverläufen anhand von Proben aus der Umweltprobenbank, welche sich über mehrere Jahre erstrecken. Durch die Identifizierung von
Substanzen, welche einen ansteigenden Trend zeigen, könnten vor allem Verbindungen welche für
zukünftige Humanbiomonitoring Studien interessant wären, herausgesucht werden. Eine weitere Möglichkeit, die zu identifizierenden Peaks zu reduzieren wäre der Vergleich von verschiedenen
Kohorten, z. B. mit und ohne Vorkommen einer bestimmten Krankheit oder mit einer bestimmten
Exposition. Mithilfe von statistischen Methoden könnten diejenigen Peaks identifiziert werden, welche überwiegend in nur einer der Kohorten auftreten.
Ein Dritter Weg zur Reduzierung der zu identifizierenden Peaks wäre eine Bestimmung der
toxikologisch Relevanten. Hierzu könnte eine wirkungsorientierte Analyse von menschlichen Urin- und Blutproben entwickelt werden. Eine Fraktionierung mit einem nachfolgenden toxikologischen Test wie
zum Beispiel auf hormonelle Wirksamkeit, würde die Fraktionen herausfiltern, in denen Effekte
auftreten. In diesen Fraktionen kann dann eine Non-target Analyse versuchen, die Verbindungen, die für die gefundenen Effekte verantwortlich sind, zu identifizieren. Auf diese Weise könnten mehrere hundert
bis tausend in einer Probe gefunden Peaks auf die für die menschliche Gesundheit relevanten reduziert
werden.
23
Screening of target and non-target contaminants in human blood and urine
3 Introduction
Over the last decades an increasing number of chemicals have been produced. Via usage in a wide range
of products some of them will reach the environment as contaminants. By an uptake through skin, food, water and air either through direct usage of consumer products or through the environment these
chemicals can reach human tissues. After the uptake of chemicals they can be stored in tissues such as
fat or blood, or they can be metabolized and excreted via the urine. Today only a small part of the chemicals produced are being analysed in human biomonitoring studies or other smaller scientific
projects. Beside the American and Canadian human biomonitoring projects, the German biomonitoring
program is one of the most extensive worldwide. Currently the fifth German Environmental Survey is being conducted, in which next to other factors blood and urine samples are analysed for selected
contaminants like bisphenol A, phthalates and perfluoroalkyl acids.
A joint initiative of the Federal Ministry for the Environment, Nature Conservation, Building and Nuclear Safety (BMUB) and the German Chemical Industry Association (VCI) was started in 2010 to develop
further target methods for possible contaminants of interest regarding human biomonitoring
(www.vci.de/Presse/Pressemitteilungen/). The goal is to develop target methods for 50 new substances until 2020. A group of experts from industry, academia and government is deciding on which chemicals
to include in these 50.
In this context the German Environmental Agency decided to go beyond target analysis with the development of non-target screening methods for human blood and urine samples. The objective of this
project was hence to support the German human biomonitoring program with additional methods and
substances of interest, which might in the future be included into human biomonitoring programs. To achieve this, non-target screening methods which are currently focusing on the analysis of
environmental samples like water and sediment were adapted to the analysis of human blood and urine
samples. The sample preparation and analysis methods were first tested with a set of target chemicals. The developed methods were subsequently used for the non-target analysis of 16 human blood and urine
samples from the German Environmental Specimen Bank.
After a review of non-target screening methods for environmental samples and target methods for the analysis of human blood and urine samples, this report describes the method development by usage of
target analytes. Following the description and validation of the data evaluation process, the
identification of both target and non-target chemicals is reported.
24

Screening of target and non-target contaminants in human blood and urine
4 State of the art in non-target screening
To detect and quantify contaminants in environmental and human samples usually target methods are
applied. A relatively small number of target analytes is quantified in the samples using reference standards. This type of analysis is necessary when determining low concentrations in samples, however,
this way only a small part of the contaminants present in a sample can be detected.
In the literature, there is no generally applicable definition for screening methods, their categorization is based on different criteria [1-4]. We will apply the definitions by Krauss et al. [3], where screening is
divided into target, suspect and unknown screening, see Figure 1.
Target screening: (Semi-) quantitative or qualitative screening methods for known compounds with reference standards. The aim is often to obtain a fast overview of a large number of (regulated)
contaminants [5, 6]. Such methods are often used in food monitoring and residue analysis, to quickly
distinguish positive from negative findings below a certain detection limit. Afterwards the concentration of the detected contaminants can be quantified, which can be done using the same measurement or in a
subsequent measurement, if necessary with an additional instrument [7].
Suspect screening: Aims to confirm suspected compounds ("suspects"), for example known or predicted degradation products or compounds for which no reference standards are available. There is no
analytical information on the substances (retention time, mass spectrum), but the structures and often
other properties are known. From the list of the compounds relevant properties can be calculated (octanol-water partition coefficient, pKa values, mono-isotopic mass, isotope ratios, etc.). On the basis of
this information the chromatograms can be searched by the "suspects" and it can be checked if detected
peaks and mass spectra coincide with the properties derived from the structure. A similar approach is defined by García-Reyes et al. [2] as "non-target screening", where samples are screened for known
substances, which are not analysed in the routine target method, and positive findings are being
confirmed with an existing reference standard.
Non-target screening: In this approach, also called "unknown screening", no information on the
pollutants present in a sample is available. The information about the substances is derived solely from
the chromatograms and mass spectra. Therefore, the first step is a manual or automatic peak search, which leads to a list of detected ions. For each detected ion, lists of possible candidate structures are
created based on the mass spectra. As also for the suspect screening, inappropriate candidates are
filtered by comparison of properties predicted from the structure and properties derived from the chromatogram. A final confirmation of tentatively identified substances is only possible with other
spectroscopic techniques or a comparison with a reference standard. Sancho et al. [4] refer to this
approach as "elucidation methods". A structure elucidation of unknowns based on gas chromatography-mass spectrometry (GC-MS) or liquid chromatography (LC)-MS is also carried out in the context of
controlled degradation experiments (in vivo, in vitro, or in environmental media). However, in contrast
to a real unknown screening, a number of preliminary information such as structural similarity to the initial substance and fundamental degradation mechanisms exist. Also, the detection of substances is
facilitated by the existence of a time series or control samples [8]. These studies can therefore
conceptually be placed between unknown and suspect screening.
25

Screening of target and non-target contaminants in human blood and urine
Figure 1: Comparison of systematic workflows for (i) quantitative target analysis with reference standards, (ii) suspect screening without reference standards, and (iii) non-target screening of unknowns in environmental samples by using LC–high resolution (tandem) mass spectrometry. According to [3].
For both target and screening methods instruments like GC and LC coupled to MS are being used, as
they possess the required selectivity and sensitivity. For non-target screening methods it is an advantage to use high resolution mass spectrometers, especially when coupled to LC, as there are no large mass
spectra libraries available, as it is the case for GC-MS.
4.1 Sample preparation for non-target screening The literature was searched for existing suspect and non-target screening methods. A significant focus of the reviewed literature was on aquatic ecosystems, with about 60% of the studies analysing water
samples (groundwater, surface water, sewage, seawater) and 10% sediments (Figure 2). However, so far
almost no methods for air samples (gas phase, aerosols) or soil samples exist. The number of publications on biota and human samples with a share of 5% each is also low, which stands in contrast to the large
number of target methods developed for these matrices. Thus, there is a considerable need for the
development of non-target screening methods in human samples, which is in agreement with the overall objective of this project. Food is present with a share of approximately 10%, while the remaining studies
are on different matrices such as cosmetics or house dust.
26
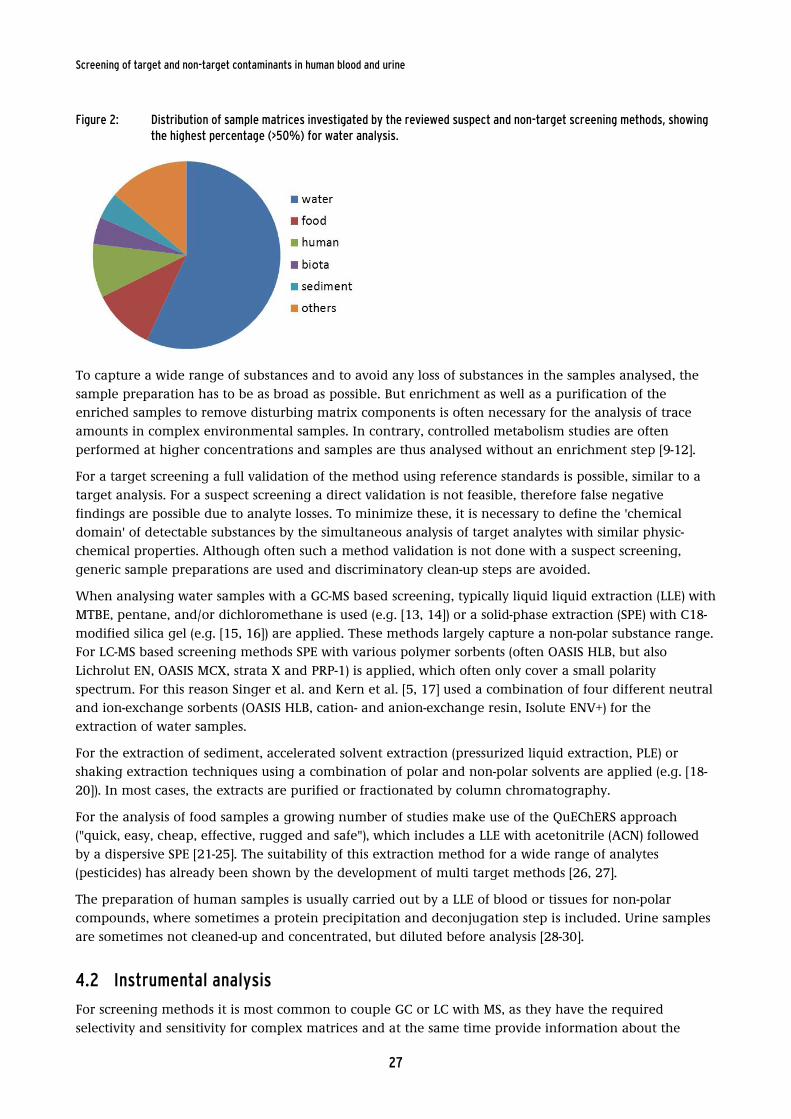
Screening of target and non-target contaminants in human blood and urine
Figure 2: Distribution of sample matrices investigated by the reviewed suspect and non-target screening methods, showing the highest percentage (>50%) for water analysis.
To capture a wide range of substances and to avoid any loss of substances in the samples analysed, the
sample preparation has to be as broad as possible. But enrichment as well as a purification of the enriched samples to remove disturbing matrix components is often necessary for the analysis of trace
amounts in complex environmental samples. In contrary, controlled metabolism studies are often
performed at higher concentrations and samples are thus analysed without an enrichment step [9-12].
For a target screening a full validation of the method using reference standards is possible, similar to a
target analysis. For a suspect screening a direct validation is not feasible, therefore false negative
findings are possible due to analyte losses. To minimize these, it is necessary to define the 'chemical domain' of detectable substances by the simultaneous analysis of target analytes with similar physic-
chemical properties. Although often such a method validation is not done with a suspect screening,
generic sample preparations are used and discriminatory clean-up steps are avoided.
When analysing water samples with a GC-MS based screening, typically liquid liquid extraction (LLE) with
MTBE, pentane, and/or dichloromethane is used (e.g. [13, 14]) or a solid-phase extraction (SPE) with C18-
modified silica gel (e.g. [15, 16]) are applied. These methods largely capture a non-polar substance range. For LC-MS based screening methods SPE with various polymer sorbents (often OASIS HLB, but also
Lichrolut EN, OASIS MCX, strata X and PRP-1) is applied, which often only cover a small polarity
spectrum. For this reason Singer et al. and Kern et al. [5, 17] used a combination of four different neutral and ion-exchange sorbents (OASIS HLB, cation- and anion-exchange resin, Isolute ENV+) for the
extraction of water samples.
For the extraction of sediment, accelerated solvent extraction (pressurized liquid extraction, PLE) or shaking extraction techniques using a combination of polar and non-polar solvents are applied (e.g. [18-
20]). In most cases, the extracts are purified or fractionated by column chromatography.
For the analysis of food samples a growing number of studies make use of the QuEChERS approach ("quick, easy, cheap, effective, rugged and safe"), which includes a LLE with acetonitrile (ACN) followed
by a dispersive SPE [21-25]. The suitability of this extraction method for a wide range of analytes
(pesticides) has already been shown by the development of multi target methods [26, 27].
The preparation of human samples is usually carried out by a LLE of blood or tissues for non-polar
compounds, where sometimes a protein precipitation and deconjugation step is included. Urine samples
are sometimes not cleaned-up and concentrated, but diluted before analysis [28-30].
4.2 Instrumental analysis For screening methods it is most common to couple GC or LC with MS, as they have the required
selectivity and sensitivity for complex matrices and at the same time provide information about the
27

Screening of target and non-target contaminants in human blood and urine
chemical composition and structure. Table 1 gives an overview of the types of mass spectrometers. In
some individual studies also detectors with low selectivity are used to capture all halogenated compounds in a sample, e.g. GC-ECD or AED [13, 14, 31-33] or LC-UV [34]. An application of NMR or the
direct coupling of LC and NMR is possible only in a few cases with high concentrations of the analytes at
contaminated sites [35, 36]. For analytes in the ng to µg/kg or ng/L range the sensitivity of NMR is not sufficient, or no sufficient purity of the analyte can be achieved despite previous fractionation and
chromatographic separation. An interesting combination of elemental analysis using LC-ICP-AES
(inductive coupled plasma – atomic emission spectroscopy) and organic mass spectrometry using LC-MS/MS is described by de Brabandere et al. [37] for the identification of organic phosphorus substances,
which can in principle also be applied to organometallic compounds.
Table 1: Comparison of commercial mass spectrometers; values usually refer to a mass range of 300-400, special equipment or configurations can have better values. See [3].
Mass spectrometer
Ion trap Single quadrupole
Triple quadrupole
Double-focussing magnetic sector
(Quadrupol)-Time-of-flight (Q)TOF
Orbitrap Fourier transform ion cyclotron resonance (FTICR)
resolving powera unita unita unita 60 000 20 000 (40 000)
100 000 (250 000)
400 000 (1 000 000)
precision (ppm) 50 50 50 5 3 2 <1 linear range 103 104 104 >104 102-103 103-104 104 sensitivity full scan (absolute mass)b
fg-pg (SRM, full scan)
fg-pg (SIM) ng (full scan)
ag-pg (SRM) ng (full scan)
fg-pg fg-pg (full scan)
fg-pg (full scan)
pg (full scan)
scan rate fast average average average very fast slow-fast slow frequency of application in screening-methods
rarely common rarely rarely common common rarely
price low low average high high high very high coupled to GC, LC GC GC, LC GC GC, LC LC LC a The resolution is dependent on mass range and scan rate; standard quadrupol- and ion trap-instruments work with unit resolution, but specific configurations can reach resolutions of 5 000 with a precision < 10 ppm. b The sensitivity is strongly dependent on the ionization efficiency of each substance.
4.2.1 GC-MS
For GC substances most methods use a quadrupole MS, less often an ion trap MS, applying electron
ionization (EI), a technology established since over 40 years. EI is a widely standardized, reproducible ionization method that is little prone to matrix effects. A "harmonized" standard ionization energy of 70
eV is commonly used, which results in a good fragmentation and thus delivers often a good structural
information. Thus mass spectra are relatively comparable across devices from various manufacturers, which has led to the development of large spectrum databases, intensively used for comparison with
unknown peaks in a sample. However, the strong fragmentation can also be a disadvantage of EI as the
intensity of the molecular ion (M+) often is low or missing completely, making it impossible to identify the substance. Softer ionization techniques can provide complementary information; here the positive
28

Screening of target and non-target contaminants in human blood and urine
chemical ionization (PCI) and negative chemical ionization (NCI) are the most widespread. They generate
a lower internal energy of the molecules, resulting in less fragmentation and thus a higher intensity of molecular ions (typically [M+H]+ in PCI and [M]- in NCI). With PCI adducts are generated depending on
the reaction gas used, while with NCI especially halogenated compounds are ionized, which can form a
stable anion by thermal electron capture. Despite the fact that PCI and NCI have been established for many years in commercial devices, they so far have been little used in screening methods. Only the study
by Portoles et al. [15] shows how a combination of EI, PCI and NCI can lead to complementary
information from EI and CI spectra, which contribute to the structure elucidation of unknown compounds.
For unstable or non-volatile compounds derivatization has been applied with target methods and within
metabolomics prior to the development of LC-MS, but is still used today [38]. For non-target substances a review of the derivatization efficiency and optimization of conditions is not possible, making it unclear
whether all functional groups possibly prone to derivatization are actually collected. In several screening
methods of polar unknowns [14, 32, 33, 39] silylation or methylation with diazomethane were used as relatively non-specific reactions covering a large number of functional groups.
Recent developments in the area of GC-MS techniques aim at improving the selectivity both for detection
and separation. In the former case, this means the application of high-resolution mass spectrometers (HRMS). Some older studies already used sector field mass spectrometers [40-42], while more recent
studies use time-of-flight (TOF)-instruments (e.g. [15, 29, 43-45]). A better chromatographic separation of
the peaks in complex mixtures is possible by two-dimensional GC (comprehensive GCxGC). As a faster detector is required to achieve a good resolution for the narrow peaks, GCxGC is coupled to a fast
quadrupole MS or more frequently to a (low resolution) TOF [45-49].
4.2.2 LC-MS
For non-GC-amendable, more polar substances analysed in screening methods LC is coupled with different mass spectrometers using atmospheric pressure ionization (API) techniques. The most common
ionization technique is electrospray ionization (ESI), followed by atmospheric pressure chemical
ionization (APCI). With both techniques, a large number of polar molecules can be ionized. Through the relatively soft ESI resulting in a low amount of fragmentation usually protonated ([M+H]+ in positive
mode) or deprotonated ([M-H]- in negative mode) molecular ions are generated, thus the molecular
weight can easily be determined. The harder APCI often results in a stronger fragmentation, and through charge transfer reactions also positively or negatively charged molecular ions can occur (M+ or
M-). This way also molecules showing a low tendency to (de)protonate can be ionized, e.g. S- and O-
heterocycles, nitriles and pyrroles. Matrix effects often pose problems during LC ionization, which can lead to ion suppression [50, 51] and the formation of adducts with alkali metals or other small ions
(ammonium, formiate). This makes it difficult to identify the molecular ions in the mass spectrum. A
further ionization technique is atmospheric pressure photon ionization (APPI; [52]), with which also highly non-polar, "typical" GC-MS analytes such as polycyclic aromatic hydrocarbons [53] can be detected.
In contrast to ESI and APCI, which provide good ionization efficiencies for a wide range of substances,
the ionization by APPI is more selective for individual substance groups and more dependent on the ionization conditions such as flow rate, type and quantity of the non-polar dopant (e.g. toluene, acetone)
responsible for the charge or proton transfer. Therefore, APPI seems currently less well suited than ESI or
APCI for a wide substance screening and has previously only been used for target analysis.
While for most target methods triple quadrupole MS (QqQMS) in selected reaction monitoring (SRM)
mode is used, its use for screening methods is possible only to a limited extent. For a target screening in
the sensitive SRM mode, the number of identifiable substances with sufficient dwell time for the individual ions is limited, and the sensitivity in full scan mode is several orders of magnitude lower [3].
29

Screening of target and non-target contaminants in human blood and urine
For ion trap instruments these two disadvantages are not true, since the entire mass range can be
analysed with sufficient sensitivity using full scan. However, full scan-LC-MS spectra of complex matrices often show a high ion background and a large number of peaks, which complicates the peak detection.
Therefore, the vast majority of the LC-MS screening methods uses HRMS in the form of TOF, quadrupole
TOF (QTOF), quadrupole Orbitrap or ion trap Orbitrap to achieve the required selectivity (see Table 1 and [3, 7]). The use of very expensive Fourier transform ion cyclotron resonance-MS (FTICRMS), which achieve
the highest mass resolution, is limited to a few studies. Next to the higher selectivity, a second advantage
of HRMS is the opportunity to derive the empirical formula of the molecular ions from the exact mass, which in addition to the resolution also requires a high mass accuracy. Because the API itself results in
no or only low fragmentation further structural information has to be gained by in-source fragmentation
or real tandem mass spectrometry. Only with the latter a clear assignment of fragment and precursor ions is possible. HRMS such as ion trap Orbitrap, quadrupole Orbitrap or QTOF also allow determining
accurate mass-MS/MS spectra and currently represent the most commonly used instruments for screening
methods. In particular a data-dependent MS/MS, where the recording of an MS/MS spectrum is triggered by occurrence of specific ions in the full scan, allows for an efficient extraction of MS/MS spectra for a
large number of substances in a chromatographic run. The resolution and accuracy required for a
unique assignment of molecular formulas and a separation of ions depends on the complexity of the matrix and the mass. The number of meaningful sum formula is greatly increasing with increasing mass.
Previous experiences show that for a suspect and non-target screening of pollutants in environmental
and food samples a resolution of 20,000 to 60,000 in full scan and a mass accuracy of 2 ppm is sufficient in most cases [3, 54].
4.3 Data evaluation In addition to the analysis itself, the data evaluation for screening methods is an important and usually
the most time consuming step in the identification of substances. While in older studies often a manual evaluation of the data was carried out, the large amount of data obtained from GCxGC-MS, GC-HRMS or
LC-HRMS makes an automatic data evaluation necessary. Chromatograms from complex sample matrices
typically contain between 1000 and 10,000 peaks. Therefore, many steps of the data analysis have been automated in recent studies, and a large amount of different commercial and freely accessible software
has been developed (overviews in references [55, 56]).
The steps of data analysis in target screening largely correspond to those of the target analysis (peak search and integration on the basis of known mass and retention time, confirmation by well-known
fragmentation and isotopic peaks if necessary, quantification of calibration standards; see Figure 1) and
will not be described in detail. The approaches and procedures for suspect and non-target screening are described in the following sections.
4.3.1 From peak detection to the compound list
In a suspect screening, similar to target screening, chromatograms can be searched directly for a peak
with a known mass from a suspect list (e.g. [17]), however, due to an unknown retention time in the entire chromatogram. Subsequently one (or several) peaks found for each suspect must be confirmed. In
some studies automatic peak detection is carried out as for a non-target screening, and the detected
peaks are compared to the masses in a suspect list (e.g. [25]).
In a non-target screening ideally all peaks in a chromatogram are detected and identified. In older GC-EI-
MS methods, but also recent studies, a visual peak search in the total ion chromatogram and manual
extraction of the mass spectra was carried out [39, 57]. Thus, only an analysis of the largest or chromatographically well resolved peaks is possible. In most of the studies, however, only insufficient
30

Screening of target and non-target contaminants in human blood and urine
information is given about the peak detection and criteria on which peaks are picked for further
identification or on how many peaks were found in total.
Different algorithms that are implemented in a number of software tools are available for automated
peak detection in chromatograms and subsequent data processing (Table 2, as described in [55, 58]). The
peak detection is facilitated by a baseline correction in the chromatogram and filtering of background noise, which are implemented in some of the tools. A distinction of real substance peaks from those
resulting from contamination of reagents or instruments requires the simultaneous analysis of blank and
control samples. Blank and control chromatograms can then be "subtracted" from those of the samples. The chromatographically separated substances always comprise a number of individual masses resulting
(i) from isotopic distribution, (ii) from the fragmentation of molecules, and (iii) from formation of
adducts in LC-MS analysis (see section 4.3.3). To assign each of these mass peaks to one compound, further data processing steps are necessary: for GC-EI-MS data, typically showing pronounced
fragmentation, "clean" mass spectra are extracted from the chromatograms by spectra deconvolution,
which are used for the identification usually by comparison with mass spectra databases [59]. For LC-HRMS data, however, the isotope peaks as well as the adduct peaks can due to the exact mass difference,
relative signal intensities and matching peak forms be recognized by algorithms and associated with the
substances ("de-isotoping").
Table 2: Software for peak detection and data processing.
software data type
filte-ring
peak-detection
align-ment
comparison to reference samples
de-isotoping
adduct search
availability
MetAlign
MS, HRMS yes yes yes yes - -
open source www.metalign.wur.nl/UK/
XCMS MS, HRMS yes yes yes yes - yes open source
metlin.scripps.edu/xcms/
Decon2LS HRMS yes yes - - yes - open source omics.pnl.gov/software/ Decon2LS.php
MZmine2 MS, HRMS yes yes yes yes yes yes open source
mzmine.sourceforge.net/ ACD/ IntelliXtract
MS, HRMS - yes - - yes yes commercial (ACDLabs)
AMDIS GC-EI-MS yes yes yes yes - -
open source chemdata.nist.gov/mass-spc/amdis/
4.3.2 From compound list to molecular structure: GC-EI-MS
The methods described in section 4.3.1 results in a list of (unknown or suspected) substances detected in the sample with their retention time and the corresponding mass spectra. In most studies, a search in
spectrum databases is done (see Table 3), where the measured spectra are compared with those in the
database and a match value is calculated. Databases most often used are the NIST Mass Spectral Library and the Wiley Registry of Mass Spectral Data, which together contain about 870,000 spectra of 736,000
substances. In addition, there are some smaller databases, specialized on individual substance groups
such as pesticides or drugs, containing from 100 to more than 10,000 spectra. For a large number of
31

Screening of target and non-target contaminants in human blood and urine
substances in the databases also GC retention time indices (Kovats RI) exist, which can easily be
determined by comparing the retention time to RI calibration standards (homologues series of n-alkanes). These criteria can without much additional effort be implemented into a screening method [46,
60]. A good correlation of measured and database-spectra does not necessarily mean the actual
occurrence of a substance, as many structural isomers result in similar spectra. A confirmation of mass spectrum and retention time with the help of a reference standard is therefore always necessary. Despite
the large number of stored spectra, often only a portion of the existing unknowns in a sample can be
identified, although in most studies no further details are given on the numbers of detected peaks and percentage of identified substances.
An alternative approach to capture all theoretically possible molecular structures of a substance, and
thus not to exclude any possible structures is in-silico structure generation. Here the molecular formula of the substance has to be known. Schymanski et al. presented an approach that combines a structure
generation and the use of sub structure information from EI-MS spectra by means of the MOLGEN-MS
software [61]. For many substances, this method results in a large number of possible candidate structures, which can be restricted by using more information such as predicted vs. measured RIs, and
predicted steric energy of candidates [62]. Based on this method, it was possible to identify a set of
ground water contaminants [63].
32

Screening of target and non-target contaminants in human blood and urine
Table 3: Mass spectra databases, partly covering the range of organic pollutants.
Name type substance groups
spectra substances
availability
Wiley 10th edition EI-MS all 719.000 638.000 commercial NIST `11 EI-MS all 243.893 212.961 commercial
EI-MS/MS (2012) all 121.586 6.999 346.757
Kovats RI 70.835 Kovats RI
Massbank all kind of MS und MSn spectra
metabolomics and environmental pollutants
40.064 no information
open source www.massbank.jp
ReSpect (RIKEN MSn spectral database for phytochemicals)
MSn metabolomics in plants
8.649 3.595 open source spectra.psc.riken.jp
METLIN LC-MS/MS high resolution
metabolomics 26.640 no information
open source metlin.scripps.edu
Mass Spectra of Physiologically Active Substances
GC-MS drugs, steroids, endocrine substances
4.182 no information
commercial (Wiley)
Mass Spectra of Designer Drugs GC-EI-MS drugs >14.000 >6.000 Kovats RI
>12.000 commercial (Wiley)
LC-ESI-MS/MS >10.000 750 Mass Spectra of Pesticides pesticides 1238 no
information commercial (Wiley)
FFNSC 1.3 GC-EI-MS essences and fragrances
1831 (+ Linear RI)
1831 commercial (Wiley)
Mass Spectra of Androgens, Estrogens and other Steroids
EI-MS androgens, estrogens and other steroids
3.722 no information
commercial (Wiley)
Mass Spectral and GC Data of Drugs, Poisons, Pesticides, Pollutants and their Metabolites
EI-MS drugs, poisons, pesticides, pollutants and their metabolites
13.640 7.500 commercial (Wiley)
Mass Spectra of Pharmaceuticals and Agrochemicals 2006
EI-MS pharmaceuticals and agrochemicals
4.563 no information
commercial (Wiley)
Mass Spectra of Organic Compounds 2004
EI-MS all 37.055 no information
commercial (Wiley)
Golm Metabolome Database GC-EI-TOFMS (plus RT index)
metabolomics 6.205 no information
open source gmd.mpimp-golm.mpg.de
ESI-MS/MS (QqITMS) library for forensic and clinical toxicology
ESI-MS/MS toxicology 5.600 1.253 open source (pdf) www.chemicalsoft.de
ESI-MSn spectra library ESI-MSn 3.766 1.743 [64] Mass Spectra of Geochemicals, Petrochemicals and Biomarkers
EI-MS geochemicals, petrochemicals and biomarkers
1.100 no information
commercial (Wiley)
33

Screening of target and non-target contaminants in human blood and urine
4.3.3 From compound list to molecular structure: LC-MS
Compared to EI-MS spectra databases, API-MS/MS spectra databases are small (see Table 4). This is due to
the shorter usage time of API-MS techniques as well as the fact that the MS/MS fragmentation is difficult to standardize and differs significantly between fragmentation techniques, collision gases used and
instrument types. Therefore in many studies only in-house databases are used [1, 24, 30] or EI-MS
databases are consulted despite the limited comparability due to different fragmentation mechanisms [18, 65, 66]. In larger, commercial or freely available LC-MS/MS databases, however, spectra at various
collision energies are recorded, which improves the comparability between MS/MS techniques and
devices [67, 68]. The currently most comprehensive LC-MS/MS databases exist in the field of metabolomics with METLIN (Scripps Research Institute in San Diego, California, United States), as well as
MassBank, which is operated by a worldwide consortium and is open to LC-MS and GC-MS spectra [69].
Despite a significant progress in the establishment of LC-MS/MS databases, their application for suspect and non-target screening of trace contaminants is currently still fairly limited.
Therefore the most widely used approach in a non-target screening is to determine the exact mass with
HRMS devices and to generate molecular formula for the detected substances. For low molecular weight compounds (< 200 Da) the accurate measurement by itself is often sufficient to determine the empirical
formula, however, with increasing mass the number of possible sum formula is increasing significantly.
Even with a resolution >100,000, sum formula for masses > 400 containing only C, H, and O cannot be clearly determined [70]. Therefore, taking into account the relative intensities of isotopic peaks is
essential for the determination of the sum formula, in most cases the relatively common isotopes 13C, 34S
and especially 37Cl and 81Br are applicable. Thus, also the accuracy of the measurement of the isotope distribution ("spectral accuracy") plays an important role. For intense peaks also 15N, 18O, 33S-isotope
peaks may be visible. The number of probable sum formula can also be limited by more heuristic
filtering rules ("Seven Golden Rules [71]"), which allow only "meaningful" or probable element ratios for organic molecules, for example a H/C ratio < 3, N/C < 2 or Cl/C < 1.
After determination of the sum formula possible structural formulas can be derived. A search in large
online substance databases such as SciFinder, PubChem, ChemSpider or smaller databases (see Table 4) can be processed. The number of hits can vary between several thousands and zero. For example, several
well-known transformation products of pesticides that are relevant to a screening of food or
environmental samples currently cannot be found among the millions of substances. An alternative is the structure generation as described above (see section 4.3.2), but so far no substructure classifiers are
available for LC-MS/MS data, so that a reduction in the candidate list is not possible.
34

Screening of target and non-target contaminants in human blood and urine
Table 4: Commercial and freely available substance databases.
name substances availability
ChemSpider >30.000.000 open source www.chemspider.com
PubChem >48.800.000 open source pubchem.ncbi.nlm.nih.gov
SciFinder / CAS >61.000.000 commercial (Chemical Abstracts Services)
Reaxys (before: Beilstein/Crossfire DB) >19.500.000 commercial (Elsevier) ChemBioFinder >2.000.000 commercial
(Cambridgesoft/PerkinElmer) Chemindex ca. 75.000 commercial (Cambridgesoft) Kyoto Encyclopedia of Genes and Genomes (KEGG)
16.181 (small molecules) open source www.genome.jp/kegg
Merck Index >10.000 commercial Human Metabolome Database (HMDB) 7.900 open source
www.hmdb.ca Chemical Entities of Biological Interest (ChEBI)
26.091 open source www.ebi.ac.uk/chebi
DrugBank 6.796 open source www.drugbank.ca
Chemical structure lookup service >74.000.000 from >100 dababases (metasearch)
open source cactus.nci.nih.gov/cgi-bin/lookup/search
ChemIDplus 380.000 open source sis.nlm.nih.gov/chemical.html
Combined Chemical Dictionary >500.000 commercial (Taylor & Francis Group)
ChemExper >200.000 open source www.chemexper.com
To further limit the resulting candidate list for a substance peak, manual data processing and expert
knowledge as well as automated procedures and software tools are needed. This has to be done not only
for a non-target but also for a suspect screening, to check whether a peak found first exclusively due to its mass could actually match the suspect. This is commonly done by (i) MS fragmentation prediction and
(ii) prediction of retention time or retention time indices.
Most published studies conduct a manual interpretation of the measured MS/MS data (e.g. [36]). The prediction of mass spectra from the candidate structures followed by a comparison with the measured
spectra is so far rarely used [17, 72]. Table 5 contains software programs, which are based on different
methodological approaches. While the commercial MassFrontier and ACD/MS Fragmenter programmes are based on fragmentation rules derived from the literature and databases, the programs FiD [73] and
MetFrag [74] predict the likely bond dissociation, which excludes possible rearrangement reactions.
MetFrag combines the fragmentation prediction directly with a substance database search. Based on exact masses and molecular formulas, candidates are extracted from substance databases, fragmented in
silico, and sorted according to their similarity with the appropriate MS/MS spectrum. However, both for
35

Screening of target and non-target contaminants in human blood and urine
MS/MS spectra as well as for EI-MS spectra, case studies often showed no good agreement between
simulated and measured spectra [75, 76], requiring additional methods regarding candidate selection.
Table 5: Commercial and freely available software for the prediction of EI-MS and MS/MS spectra.
Software mass spectra method availability
ACD/MS Fragmenter
EI-MS, API-MS/MS rules commercial (ACD/Labs)
MassFrontier EI-MS, API-MS/MS rules, databases commercial (Hichem/Thermo)
MetFrag API-MS/MS EI-MS
bond-dissociation open source msbi.ipb-halle.de/MetFrag
Fragment Identificator (FiD)
API-MS/MS bond-dissociation open source www.cs.helsinki.fi/group/sysfys/software/fragid
A number of models have been developed for the prediction of retention times or retention indices from
chemical structures (quantitative structure-retention relationships QSRR; overview in [77]). These can be used for further selection of candidate structures. Such approaches, however, have so far rarely been
used. While for the GC-MS Kovats and Lee retention indices can be predicted quite well with existing
models [78], the retention index forecast for LC-MS is more difficult. For the latter there is no universal index system and existing QSRRs can only be applied to a relatively narrow substance spectrum due to
the more complex interactions. However, also simple logKOW-retention time models can be used to
reduce candidate lists [17].
More information about the limitation of candidate structures can be drawn from the preceding
analysis. Meinert et al. [79] defines KOW ranges for RP-HPLC fractions derived from standard runs, which
are then used for reduction of candidate lists from groundwater analysis. In the studies by Kern et al. [17] and Hug et al. [80] candidate structures are confirmed by a plausibility check of their ionization in
positive or negative mode.
4.4 Summary Non-target screening methods based on GC-EI-MS represent an approved method for non-polar compounds. Developments on the analytical side as GC-EI-TOF devices offer improved resolution of co-
eluting peaks and determination of the sum formula. In terms of data analysis the (manual or
automated) peak detection dominates. So far data evaluation includes manual search in spectrum databases or spectra interpretation, sometimes also retention indices are used for the preliminary
identification of unknown compounds.
For LC-MS-based methods, tandem-HRMS devices like QTOF or ion trap Orbitrap with a data-dependent MSn spectrum acquisition have become the standard technique. The small size of existing MS/MS spectra
libraries and larger device variations so far only lead to circumstantial hits in the identification of peaks.
Thus methodological approaches primarily go via the determination of the empirical formula and the search for appropriate candidate structures in substance databases. In most cases only the MS/MS
spectrum is used for the restriction of the surviving candidates.
Further methods to limit the candidate structures or to confirm suspects (in silico prediction of fragmentation, retention time forecasts) have been used very little so far. Other approaches such as
prediction of ionization behaviour in different modes/sources or adduct formations in API sources are
used only as expert knowledge; however, there are no quantitative methods to predict them from the structure for a large number of candidates.
36

Screening of target and non-target contaminants in human blood and urine
For a comprehensive screening it appears appropriate to combine GC-MS and LC-MS/HRMS methods,
because this way a wide range of substances can be covered, and the identification can benefit from complementary information of both techniques.
37

Screening of target and non-target contaminants in human blood and urine
5 Target methods for human samples
As a basis for a strategic method development, an inventory of target methods for the analysis of trace
pollutants in human samples was conducted. Additionally, a list of chemicals which are or might be relevant for human exposure was created, so called suspect chemicals. Based on this a selection of
sample preparation steps and representative target substances for the development of a non-target
screening method for human urine and blood was made.
5.1 Substances analysed in human matrices Whether and how trace pollutants can be measured in any matrix, depends on their metabolism and
toxicokinetics in the human body. A determination in urine is meaningful for polar and ionic
substances, as the renal clearance is high. An analysis of more lipophilic substances is meaningful in blood samples, because these bind stronger to plasma proteins and are hardly renally excreted. For
substances that are biologically transformed to a large extent, it is more meaningful to analyse
metabolites in urine samples, due to their usually high polarity.
For the analysis of metabolites it should be distinguished between phase I and phase II metabolites.
Phase I metabolites are particularly formed from non-polar compounds, which have only few functional
groups. Metabolism takes places by oxidation, reduction and hydrolysis, primarily through cytochrome P450 monooxygenases. These metabolites are mostly analysed directly using LC-MS or more seldom GC-
MS. Phase II metabolites result from conjugation of trace pollutants or their phase I metabolites with
glucuronic acid, sulfate, acetyl moieties, amino acids, methyl groups or glutathione. This results in increase of water solubility and thus renal excretion. Phase II metabolites are analysed only in a few
cases directly by LC-MS (for example [81-83]), mostly the conjugates in the sample are cleaved, thus only
the deconjugated substance is being analysed. In addition to the application in urine samples, a deconjugation step is included for example in the analysis of phenols and phthalates in blood and breast
milk samples [84-86]. If both free and total (including the conjugated) fractions of a substance are of
interest, two analyses are necessary, one without and one with a deconjugation step. The deconjugation takes place either by adding enzymes or acid. The latter required that the substance to be analysed is
acid resistant.
These fundamental considerations are reflected in the target methods previously developed for trace pollutants and their metabolites in various human matrices. Substance classes such as the classical POPs
are only found in blood (or adipose tissue and breast milk) due to their hydrophobic properties. Other
substance classes, e.g. different pesticides and UV filters, can be detected in blood as well as urine, whereas e.g. PAHs are analysed in blood as the parent compound and in urine as metabolites.
For following substance classes a number of target methods has been previously published, the
approximate number of methods is specified:
• Aromatic amines (blood and urine), > 10 methods
• Fragrances (blood), > 10 methods
• Polybrominated flame retardants (blood, novel and phosphate-esters in urine), > 10 methods
• Parabens (blood and urine) > 5 methods
• Pesticides (blood and urine), > 30 methods
• Phenols (blood and urine), > 10 methods
• Phthalates (as metabolites in urine), > 5 methods
• Polyaromatic hydrocarbons - PAHs (blood, metabolites in urine), > 30 methods
38

Screening of target and non-target contaminants in human blood and urine
• Polychlorinated biphenyls – PCBs (blood, metabolites in urine), > 10 methods
• Polyfluorinated alkyl substances - PFASs (blood, shorter chains also in urine), > 10 methods
• UV filters (blood and urine), > 10 methods
• Volatile substances - VOC (blood and urine), > 30 methods
Most of the published methods are specialized target methods for a certain substance class. There are only a few publications describing the simultaneous analysis of various – mostly quite similar - substance
classes (e.g. polybrominated flame retardants, organochlorine pesticides and PCBs [29, 87]).
5.2 Sample preparation and analysis Blood: Analyses of blood samples can be carried out in whole blood, plasma or serum. Whole blood samples are instable at room temperature due to coagulation, but can be stored deep frozen for a long
period of time. However, hemolysis of the cellular constituents in whole blood takes place upon freezing.
Alternatively, anticoagulants (usually EDTA or heparin) are added, however, this could possibly lead to interferences in the analysis of pollutants due to the relatively high concentrations of the anticoagulants.
A sorption of trace pollutants to cellular components or the clotted blood can occur both during plasma
and serum production. This way substances such as aromatic amines which are bound to the cellular components are removed from the sample [88].
Different amounts of blood samples are taken for analysis, depending on the required concentration
factor and expected matrix effects. The quantities used in the reviewed methods range from 50 µL of plasma for the analysis of warfarin [89] and 10 g of serum for the analysis of PCBs and dioxins [90].
Concentration factors are often between 10 to 40, only in a few methods factors as high as 250 to 400
are reached [91-93].
Before the extraction of analytes, plasma proteins are precipitated. For persistent chemicals like PCBs,
PFCs and some pesticides this is done by the addition of acids, while for acid-labile substances it is done
by the addition of solvents such as acetonitrile and ethanol [94, 95]. Extraction is then usually done by LLE with non-polar solvents or SPE with modified silica gel (usually C18) or polymers such as ENV + and
OASIS HLB. If the extracts after LLE or SPE require further purification, in many cases silica gel is used for
lipophilic analytes to remove polar constituents.
Urine: For the analysis of trace pollutants in urine samples varying amounts are extracted, 10 µl for the
analysis of bisphenol A [85] and up to 80 mL for the analysis of UV filters [96]. The concentration factors
vary between 0.1 (i.e. dilution) and 250 [97, 98].
In most methods, the first sample preparation step is the hydrolysis of conjugates, as discussed above.
This step is not carried out, if the target analytes are not conjugated or only the free fraction is of
interest. Mercapturic acids of the precursor targets were analysed directly in only two studies [81, 83]. For the subsequent extraction also for urine samples SPE or LLE are preferred, only two methods
described the analysis of organophosphates and bisphenol A where the samples were simply diluted,
filtered and directly injected into the LC-MS [85, 99]. Rarely a clean-up is performed following SPE or LLE using silica gel or florisil [100-102].
6 Establishment of a suspect compound list The suspect compound list serves as the basis for the suspect screening of blood and urine samples and
for the selection of relevant and representative target analytes for the method development. Thus, this list should contain as many trace pollutants as possible, which already have been measured in human
blood and urine samples, or could be relevant due to high production volumes, their occurrence in
39

Screening of target and non-target contaminants in human blood and urine
household products, food and environmental samples, as well as due to persistent and bioaccumulative
properties.
The list includes:
1. Substances, which have been detected or for which target methods are described in (i) the
monitoring program of the “centers for disease control and prevention” (CDC), United States [103], (ii) the method collection "Analytical test methods for hazardous materials - analysis in
biological materials" [104] and (iii) the homepage of the “Institut für Arbeits-, Sozial- und
Umweltmedizin” of the University of Erlangen (www.arbeitsmedizin.uni-erlangen.de/biomonitoring/).
2. Substances that have been identified by the BfR in collaboration with the UBA and the BAuA as
priority substances for human biomonitoring [105].
3. Substances from the report "Carcinogenic, mutagenic, (CMR toxic for reproduction) and other
problematic substances in products" by the UBA [106].
4. Approved substances in cosmetics regulation 2010 (www.gesetze-im-internet.de/bundesrecht/kosmetikv/gesamt.pdf).
5. Due to their approved applications (e.g. disinfectants, biocides for human hygiene, wood
preservatives) for human exposure-relevant substances, old biocides as they are listed in the European chemical substances information system (ESIS)
(esis.jrc.ec.europa.eu/index.php?PGM=bpd).
6. Substances from various publications:
a) probably persistent and bio-accumulating substances, which were derived on the basis of
predicted properties from a list of 22,263 trading chemicals by Howard & Muir [107], based
among others on the Canadian Domestic Substance List and the Toxic Substances Control Act Inventory update rule database by the U.S. EPA;
b) list of per- and polyfluorinated substances which have been detected in the environment, or
their homologues and structurally similar per- and poly-fluorinated substances [108];
c) new trace pollutants, which have been measured in environmental samples for the first time
during the years 2008-2011 [109, 110].
This resulted in a list of 1510 chemicals. For 357 of these chemicals methods for the analysis of blood are described, and for 332 methods in urine. In addition, 222 of these substances were detected in human
blood samples and 120 in human urine samples, 39 in both matrices.
For all substances SMILES codes (simplified molecular input line entry system) were retrieved based on their CAS numbers and/or names using the program chemical translation service
(cts.fiehnlab.ucdavis.edu/) or the substance databases ChemSpider (www.chemspider.com/Search.aspx)
and PubChem (pubchem.ncbi.nlm.nih.gov/). For the chlorinated paraffins, it seemed unreasonable to generate unique SMILES codes because this substance class is a mixture of congeners with different chain
lengths, degree of branching and degree and position of chlorination. This results in a large number of
chlorinated paraffins with the same mass and structural formula, which complicates the analysis by MS. Generally this substance group is however quite relevant to the human biomonitoring, because until
now only a few data exist for breast milk [111]. For other substances that have branched chains such as
nonylphenol or perfluorinated sulfonic acids, only the unbranched chains were considered for the generation of SMILES. Using these generated SMILES the molecular structures were imported into a
database in the program InstantJChem (ChemAxon, Budapest, www.chemaxon.com). Here, using the
ChemAxon calculator plugins, IUPAC names, mono-isotopic masses and substance properties were
40

Screening of target and non-target contaminants in human blood and urine
calculated (logKOW, logD at pH 7.4, pKa- and pKb values and topological polar surface area). The EPI
SuiteTM v4.10 by the US EPA (www.epa.gov/oppt/exposure/pubs/episuitedl.htm) was applied as a second program to predict logKOA, logKOW, bio-concentration factors (BCF) and Henry constants.
6.1 Target analytes for method development Target analytes for method development were selected from the suspect list of 1510 substances. The
group of target analytes was supposed to:
• cover of a wide range of functional groups and physicochemical properties ("substance domain"),
• represent both GC as well as LC amenable substances,
• represent both new as well as methodically well-established substances to compare the method with already published (standard) methods. The substance selection of “new” analytes does not
consider whether they would be detectable as the analyte in its original form or as a metabolite
in blood and urine.
In a first step substances beyond the mass range of Orbitrap MS and GC-MS (60-2000 u) were removed.
The substance domain was derived by the collection of calculated logKOW and Henry constants of the
compounds detected in blood or urine, which can be found in Figure 3. In blood samples the majority (> 90%) of the detected substances have logKOW values between 0 and 10 and Henry constants of 10-12 to
100 atm ⋅ m3/mol, in urine > 90% are between logKOW 1 and 6, and Henry constants 10-16 to 0.01 atm ⋅ m3/mol. For the substances measured in urine, only the unconjugated analytes are included, as they were mostly measured in this form. In general, conjugates would show lower logKOW values. Compared
to the substance domain of all 1510 suspects the largest part is covered by the substances that so far
have been detected in human samples.
41

Screening of target and non-target contaminants in human blood and urine
Figure 3: Histograms of logKOW values and Henry constants (atm*m3/mol) of substances detected in blood, urine and all suspects in the suspect list; predicted using EpiSuite.
In a second step, representative substances were selected from the different compound classes; mostly one or two substances per class, sometimes more if the classes contained substances with very different
functional groups or properties (e.g. in the case of flame retardants). The selected target substances for
blood and urine samples are listed in Table 6 and Table 7. Table A 1 and Table A 2 in the Annex also include the calculated properties of the chosen target analytes. Not all substances are within the logKOW
and Henry constant range covered by > 90% of the substances detected so far in blood or urine. They
therefore represent extreme properties that will help to determine the substance domain of the method. Not considered were siloxanes, as these are relatively volatile and thus purge and trap - headspace
extraction methods [112] have been used so far. Siloxanes additionally show high background levels due
to their usage in most cosmetics such as hand soaps and deodorants.
In total 65 substances for the determination in blood and 42 for the determination in urine were chosen.
Three target compounds had to be removed from the list, as they were not commercially available. For
method development in urine also four selected commercially available phase II metabolites (glucuronide and sulfate of methylumbelliferone and estrone, respectively) were chosen to test a
42

Screening of target and non-target contaminants in human blood and urine
deconjugation step during sample preparation and/or to check whether also conjugates can be detected.
Additionally creatinine was selected, which is used frequently for the standardization of the detected concentrations or as a measure of the dilution of the urine. In total, 92 target analytes were selected,
where all substances for urine method development should be analysable by LC-MS, see Figure 4.
Figure 4: Number of target substances for method development in the two matrices and their method of analysis.
These substances cover a wide range of suspect substances with respect to their physico-chemical
properties, as can be seen for logKOW and Henry constants in Figure 5.
Figure 5: Chemical space plot; distribution of logKOW and Henry constants of the selected target substances for blood and urine compared to all 1500 suspects.
43

Screening of target and non-target contaminants in human blood and urine
Table 6: Target analytes for the method development of urine samples.
Compound name CAS No compound group
Matrix1 Method source Detected, listed2
Molecular weight
Formula Comment LC/GC
4-methyl-m-phenylene diisocyanate (2,4-TDI)
26471-62-5, 1321-38-6, 26006-20-2, 584-84-9
allergenic substance
BfR 174.16 C9H6N2O2 LC
5-chloro-2-methyl-4-isothiazolin-3-one (CMIT)
26172-55-4 allergenic substance
BfR, KosmVer
149.60 C4H4ClNOS present in household and cosmetic products
LC
citronellal 106-23-0 allergenic substance
BfR 154.25 C10H18O LC
geraniol 624-15-7, 68311-14-8, 106-24-1, 106-25-2
allergenic substance
BfR, KosmVer
154.25 C10H18O contact allergen, fragrance LC
resorcinol 108-46-3 allergenic substance
BfR 110.11 C6H6O2 LC
2,4-diaminoanisole 615-05-4 aromatic amine
BfR 138.17 C7H10N2O LC
4,4'-thiodianiline 139-65-1 aromatic amine
BfR 216.30 C12H12N2S release from azodyes, which are used for dying clothing and paper, other aromatic amines are being analysed as Hb adduct in blood, BfR suggests detection in urine
LC
4,4'-methylendi-o-toluidine 838-88-0 aromatic amine
BfR 226.32 C15H18N2 LC
4-aminoazobenzene (solvent yellow)
60-09-3 aromatic amine, azodye
BfR, UBA-WF, UBA-T
197.24 C12H11N3 LC
o-dianisidine 20325-40-0, 119-90-4
aromatic amine
BfR 244.29 C14H16N2O2 LC
mercaptobenzothiazole 149-30-4 industrial chemical
BfR 167.25 C7H5NS2 benzothiazoles, used as anticorrosives, likely ubiquitous environmental contaminants, vulcanization accelerators
LC
2-(methylthio)benzothiazole 615-22-5 industrial chemical
BfR 181.28 C8H7NS2 LC
44

Screening of target and non-target contaminants in human blood and urine
Compound name CAS No compound group
Matrix1 Method source Detected, listed2
Molecular weight
Formula Comment LC/GC
8-octyl-4-isothiazolin-3-one (octhilinone)
26530-20-1 industrial chemical
BfR, BPD 213.34 C11H19NOS LC
4-hydroxybenzotriazole 26725-51-9 industrial chemical
BfR 135.12 C6H5N3O metabolite of benzotriazole, used as anticorrosive, likely ubiquitous environmental contaminant
LC
p-toluene-sulfonamide 70-55-3 industrial chemical, benzosulfon-amide
BfR 171.22 C7H9NO2S used as anticorrosive, likely ubiquitous environmental contaminant
LC
5-methylbenzotriazole 136-85-6 industrial chemical, benzotriazole
BfR 133.15 C7H7N3 used as anticorrosives, likely ubiquitous environmental contaminants
LC
ethyltosylamide 80-39-7 industrial chemical, benzene-sulfonamide
BfR 199.27 C9H13NO2S LC
dibutylhydroxytoluene 128-37-0 industrial chemical
u AMBM, UBA-T
164.24 C11H16O widely used as antioxidant in food, cosmetics, rubber etc.
LC
2-ethoxyethyl acetate 111-15-9 industrial chemical
UBA-T 132.16 C6H12O3 HPV, solvent in production of other chemicals, monitoring data indicate that the general population may be exposed via inhalation of ambient air, but degradation might be fast
LC
hydroxyethyl mercapturic acid (HEMA)
15060-26-1, 19179-72-7, 97170-09-7
industrial chemical
u urine [113] detect 207.25 C7H13NO4S metabolite (of glycidol, 1,3-butadiene, acrolein, ethylene oxide and propylene oxide)
LC
2,4,7,9-tetramethyl-5-decyne-4,7-diol (TMDD)
126-86-3 industrial chemical
226.36 C14H26O2 surfactant, antifoaming agent LC
3-aminomethyl-3,5,5-trimethylcyclohexyl-amine (isophorone diamine)
2855-13-2 industrial chemical
170.30 C10H22N2 LC
45

Screening of target and non-target contaminants in human blood and urine
Compound name CAS No compound group
Matrix1 Method source Detected, listed2
Molecular weight
Formula Comment LC/GC
1-hydroxypyrene 5315-79-7, 63021-84-1
OH-PAH u urine [114, 115] TM,CDC detect, AMBM
218.25 C16H10O metabolite of pyrene LC
1-naphthol 90-15-3 OH-PAH p,u,hair urine [115] detect, CDC, AMBM
144.17 C10H8O metabolite of naphthalene LC
3-OH-4,4'-dichloro-biphenyl (3-OH-PCB)
53459-39-5 OH-PCB u [116] TM 239.10 C12H8Cl2O metabolite of PCB LC
4-OH-3,4',5-trichloro-biphenyl (4-OH-PCB)
4400-06-0 OH-PCB u [116] TM 273.54 C12H7Cl3O metabolite of PCB LC
2-isopropyl-6-methyl-pyrimidin-4-ol (IMPY)
2814-20-2 pesticide u urine [117] detect, CDC 152.19 C8H12N2O OP, metabolite of diazinon LC
diazinon 333-41-5 pesticide s,b [118] TM, AMBM 304.35 C12H21N2O3PS
OP, insecticide LC
dimethylthiophosphate (DMTP) 1112-38-5, (salts: 23754-87-2, 40633-14-5)
pesticide u urine [119] detect, CDC, AMBM
142.11 C2H7O3PS OP metabolite (unspecific) LC
diphenyl phosphate 53396-64-8, 838-85-7
pesticide, flame retardant
u urine [120, 121] detect 250.19 C12H11O4P OP metabolite (unspecific) LC
perfluorobutanoic acid (PFBA) 375-22-4 PFC 214.04 C4HF7O2 short chain carboxylic acid, replacement for longer chains
LC
bisphenol A 27100-33-0, 80-05-7
plasticizer s, u serum [122], urine [82, 123, 124]
detect, CDC, AMBM, UBA-T
228.29 C15H16O2 LC
monoethyl-phthalate (MEP) 2306-33-4 plasticizer u urine [125] detect, CDC 194.18 C10H10O4 phthalate metabolite LC mono-iso-butyl-phthalate (MBP) 30833-53-5 plasticizer u, breast
milk urine [125], breast milk [86]
detect, CDC 222.24 C12H14O4 phthalate metabolite LC
monobenzyl-phthalate (MBzP) 2528-16-7 plasticizer u urine [125] detect, CDC 256.25 C15H12O4 phthalate metabolite LC
triethylcitrate 77-93-0 plasticizer 273.26 C12H17O7 LC
46
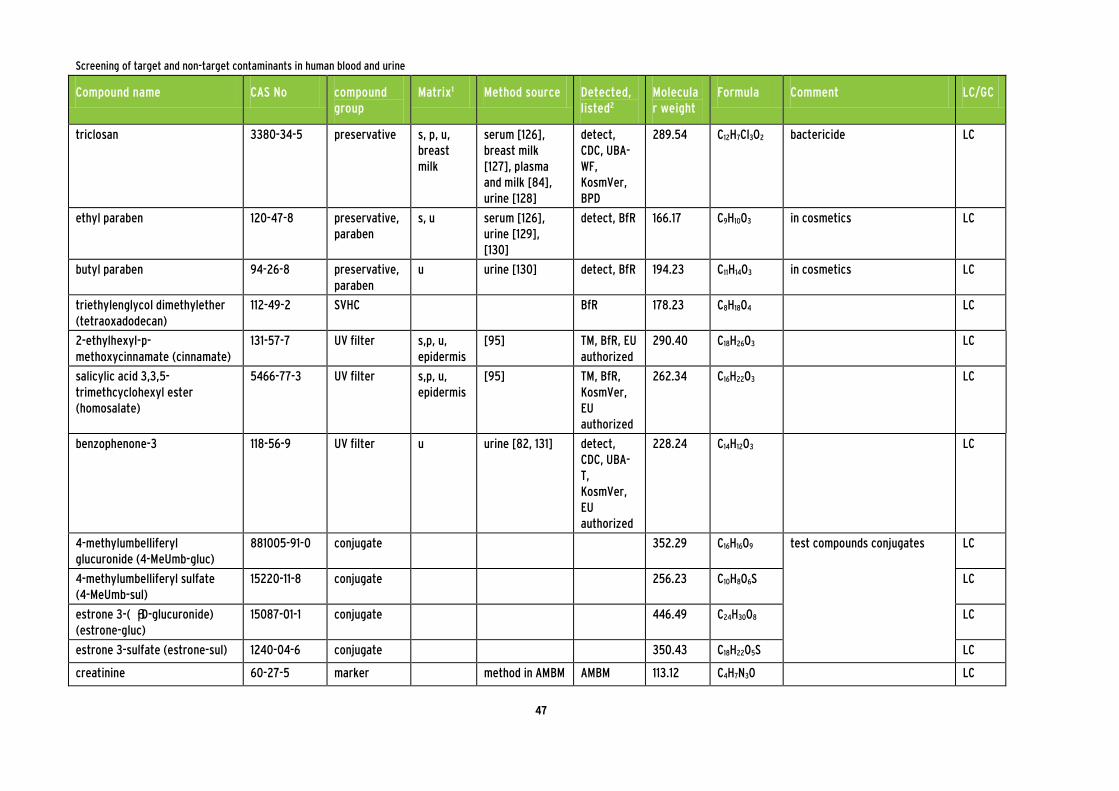
Screening of target and non-target contaminants in human blood and urine
Compound name CAS No compound group
Matrix1 Method source Detected, listed2
Molecular weight
Formula Comment LC/GC
triclosan 3380-34-5 preservative s, p, u, breast milk
serum [126], breast milk [127], plasma and milk [84], urine [128]
detect, CDC, UBA-WF, KosmVer, BPD
289.54 C12H7Cl3O2 bactericide LC
ethyl paraben 120-47-8 preservative, paraben
s, u serum [126], urine [129], [130]
detect, BfR 166.17 C9H10O3 in cosmetics LC
butyl paraben 94-26-8 preservative, paraben
u urine [130] detect, BfR 194.23 C11H14O3 in cosmetics LC
triethylenglycol dimethylether (tetraoxadodecan)
112-49-2 SVHC BfR 178.23 C8H18O4 LC
2-ethylhexyl-p-methoxycinnamate (cinnamate)
131-57-7 UV filter s,p, u, epidermis
[95] TM, BfR, EU authorized
290.40 C18H26O3 LC
salicylic acid 3,3,5-trimethcyclohexyl ester (homosalate)
5466-77-3 UV filter s,p, u, epidermis
[95] TM, BfR, KosmVer, EU authorized
262.34 C16H22O3 LC
benzophenone-3 118-56-9 UV filter u urine [82, 131] detect, CDC, UBA-T, KosmVer, EU authorized
228.24 C14H12O3 LC
4-methylumbelliferyl glucuronide (4-MeUmb-gluc)
881005-91-0 conjugate 352.29 C16H16O9 test compounds conjugates LC
4-methylumbelliferyl sulfate (4-MeUmb-sul)
15220-11-8 conjugate 256.23 C10H8O6S LC
estrone 3-( β-D-glucuronide) (estrone-gluc)
15087-01-1 conjugate 446.49 C24H30O8 LC
estrone 3-sulfate (estrone-sul) 1240-04-6 conjugate 350.43 C18H22O5S LC
creatinine 60-27-5 marker method in AMBM AMBM 113.12 C4H7N3O LC
47
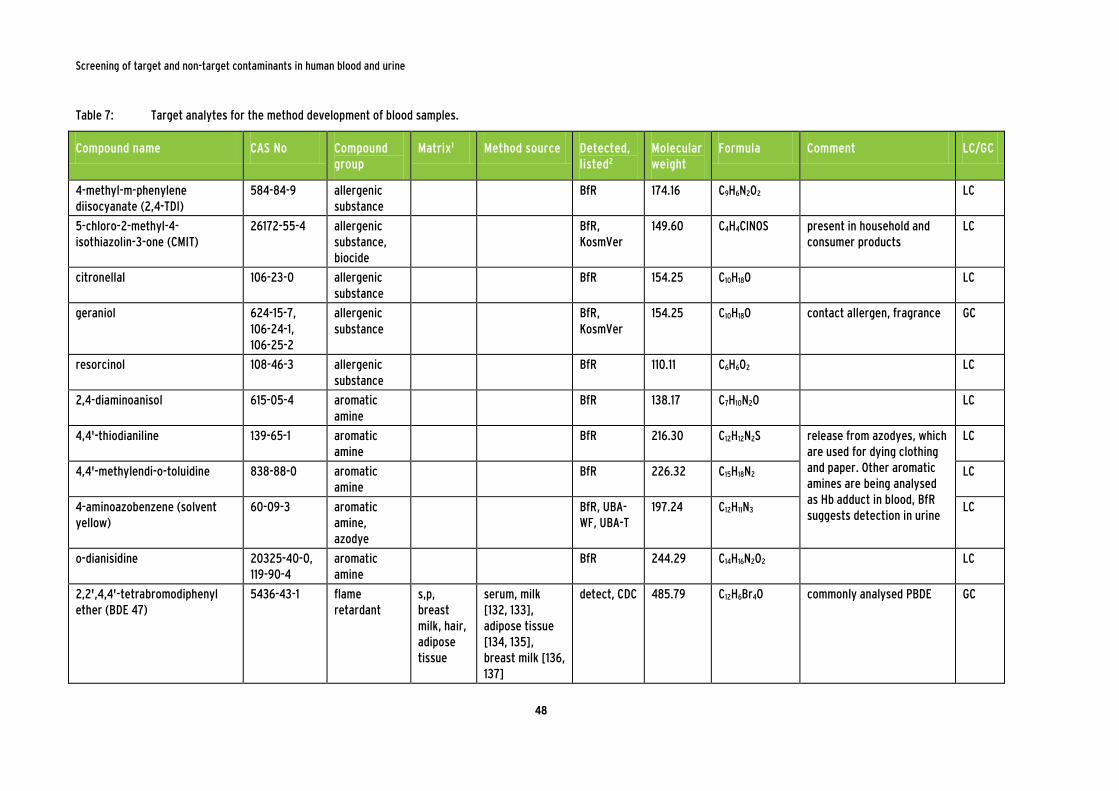
Screening of target and non-target contaminants in human blood and urine
Table 7: Target analytes for the method development of blood samples.
Compound name CAS No Compound group
Matrix1 Method source Detected, listed2
Molecular weight
Formula Comment LC/GC
4-methyl-m-phenylene diisocyanate (2,4-TDI)
584-84-9 allergenic substance
BfR 174.16 C9H6N2O2 LC
5-chloro-2-methyl-4-isothiazolin-3-one (CMIT)
26172-55-4 allergenic substance, biocide
BfR, KosmVer
149.60 C4H4ClNOS present in household and consumer products
LC
citronellal 106-23-0 allergenic substance
BfR 154.25 C10H18O LC
geraniol 624-15-7, 106-24-1, 106-25-2
allergenic substance
BfR, KosmVer
154.25 C10H18O contact allergen, fragrance GC
resorcinol 108-46-3 allergenic substance
BfR 110.11 C6H6O2 LC
2,4-diaminoanisol 615-05-4 aromatic amine
BfR 138.17 C7H10N2O LC
4,4'-thiodianiline 139-65-1 aromatic amine
BfR 216.30 C12H12N2S release from azodyes, which are used for dying clothing and paper. Other aromatic amines are being analysed as Hb adduct in blood, BfR suggests detection in urine
LC
4,4'-methylendi-o-toluidine 838-88-0 aromatic amine
BfR 226.32 C15H18N2 LC
4-aminoazobenzene (solvent yellow)
60-09-3 aromatic amine, azodye
BfR, UBA-WF, UBA-T
197.24 C12H11N3 LC
o-dianisidine 20325-40-0, 119-90-4
aromatic amine
BfR 244.29 C14H16N2O2 LC
2,2',4,4'-tetrabromodiphenyl ether (BDE 47)
5436-43-1 flame retardant
s,p, breast milk, hair, adipose tissue
serum, milk [132, 133], adipose tissue [134, 135], breast milk [136, 137]
detect, CDC 485.79 C12H6Br4O commonly analysed PBDE GC
48

Screening of target and non-target contaminants in human blood and urine
Compound name CAS No Compound group
Matrix1 Method source Detected, listed2
Molecular weight
Formula Comment LC/GC
2,2',4,4',5-pentabromodiphenyl ether (BDE 99)
32534-81-9
flame retardant
s,p, breast milk, hair, adipose tissue
serum, milk [132, 133], adipose tissue [134, 135], breast milk [136, 137]
detect, CDC 564.69 C12H5Br5O commonly analysed PBDE GC
2,2',3,3',4,4',5,5',6,6'-decabromodiphenyl ether (BDE 209)
1163-19-5 flame retardant
s, breast milk, hair
serum [138], breast milk [136, 137]
detect, BfR, UBA-WF,E
959.17 C12Br10O commonly analysed PBDE, still used
GC
hexabromocyclodo-decane (HBCDD)
3194-55-6, 25637-99-4
flame retardant
UBA-T 641.70 C12H18Br6 commonly analysed brominated flame retardant
LC/GC
syn and anti dechlorane plus (DP)
13560-89-9 flame retardant
s, hair serum [93], hair [139]
detect 653.72 C18H12Cl12 chlorinated flame retardant GC
tris(2-chloroethyl)phosphate (TCEP)
29716-44-7, 68411-66-5, 115-96-8
flame retardant
BfR, UBA-T,WF
285.49 C6H12Cl3O4P phosphate flame retardant LC
tetrabromobisphenol A (TBBPA) 79-94-7 flame retardant
UBA-E 543.87 C15H12Br4O2 GC
decabromodiphenyl ethane (DBDPE)
84852-53-9 flame retardant
[107, 109] 971.22 C14H4Br10 GC
2-amino-1-methyl-6-phenylimidazo[4,5-b]pyridine (PhIP)
105650-23-5 food -grill product, heterocyclic aromatic amine
u [140-142] TM 224.26 C13H12N4 LC
mercaptobenzothiazole 149-30-4 industrial chemical, benzothia-zole
BfR 167.25 C7H5NS2 used as anticorrosives, likely ubiquitous environmental contaminant, high water solubility; vulcanization accelerators
LC
49

Screening of target and non-target contaminants in human blood and urine
Compound name CAS No Compound group
Matrix1 Method source Detected, listed2
Molecular weight
Formula Comment LC/GC
2-(methylthio)benzothiazole 64036-43-7, 31621-01-9, 615-22-5
industrial chemical, benzothia-zole
BfR 181.28 C8H7NS2 used as anticorrosives, likely ubiquitous environmental contaminant, high water solubility; vulcanization accelerators
LC
p-toluene-sulfonamide 70-55-3 industrial chemical, benzosul-fonamide
BfR 171.22 C7H9NO2S used as anticorrosives, likely ubiquitous environmental contaminant, high water solubility
LC
dibutylhydroxytoluene 128-37-0 industrial chemical, antioxidant
u AMBM, UBA-T
164.24 C11H16O widely used as antioxidant in cosmetics, rubber etc.
GC
2,4,7,9-tetramethyl-5-decyne-4,7-diol (TMDD)
126-86-3 industrial chemical
226.36 C14H26O2 surfactant, antifoaming agent
LC
4-methylanisole 104-93-8 fragrance BfR 122.16 C8H10O GC ambrettolide 123-69-3 musk -
fragrance (macrocyclic)
BfR 252.39 C16H28O2 GC
cashmeran 33704-61-9 musk – fragrance (polycyclic)
b [143, 144] TM, BfR 206.32 C14H22O GC
celestolide 88401-65-4 musk – fragrance (polycyclic)
b, u [127, 143, 144] TM, BfR, AMBM
244.37 C17H24O GC
galaxolide 1222-05-5 musk – fragrance (polycyclic)
b, u blood [144] TM, BfR, AMBM
258.40 C18H26O GC
1,2-bis(2-ethylhexyl) 3,4,5,6-tetrabromobenzene-1,2-dicarboxylate (pyronil 45)
26040-51-7 P&B chemical [107] 706.14 C24H34Br4O4 likely penta- and octa-BDE replacement, listed as P&B substance by the European Union, high logKOW
LC
50

Screening of target and non-target contaminants in human blood and urine
Compound name CAS No Compound group
Matrix1 Method source Detected, listed2
Molecular weight
Formula Comment LC/GC
N,N-ethylene-bis(tetrabromophthalimide) (saytex BT 93)
32588-76-4 P&B chemical [107] 951.47 C18H4Br8N2O4 likely penta- and octa-BDE replacement, listed as P&B substance by the European Union, high logKow
GC
hexachlorocyclopenta-1,3-diene (HCCPD)
77-47-4 P&B chemical [107] 272.77 C5Cl6 used as intermediate in production of chlorinated cyclodiene pesticides, also DP, detected in atmosphere above the Great Lakes
GC
naphthalene 91-20-3 PAH p plasma [145] detect, UBA-WF
128.17 C10H8 GC
acenaphthylene 208-96-8 PAH p plasma [145] detect 152.19 C12H8 GC pyrene 129-00-0 PAH p plasma [145] detect 202.25 C16H10 GC 2,2',5,5'-tetrachlorobiphenyl (PCB 52)
35693-99-3 PCB p,s, adipose tissue
adipose tissue [134]
detect, CDC, AMBM
291.99 C12H6Cl4 PCB routinely analysed GC
2,2',4,5,5'-pentachlorobiphenyl (PCB 101)
37680-73-2 PCB p,s, adipose tissue
adipose tissue [134]
detect, CDC, AMBM
326.43 C12H5Cl5 PCB routinely analysed GC
2,2',3,4,4',5,5'-heptachlorobiphenyl (PCB 180)
35065-29-3 PCB p, adipose tissue
adipose tissue [134]
detect, CDC, AMBM
395.32 C12H3Cl7 PCB routinely analysed GC
carbendazim 37953-07-4, 10605-21-7
pesticide, carbamate
s [146] TM, BPD 191.19 C9H9N3O2 biocide/fungicide, some usage has been banned by the EU
LC
diazinon 333-41-5 pesticide, OP s,b, u [118] TM, AMBM 304.35 C12H21N2O3PS biocide/insecticide LC/GC thiabendazole 148-79-8 pesticide BPD 201.25 C10H7N3S fungicide, used as food
preservative (on banana peel and citrus fruits)
LC
perfluorobutanoic acid (PFBA) 375-22-4 PFC 214.04 C4HF7O2 short chain carboxylic acid, replacement for longer chains
LC
51

Screening of target and non-target contaminants in human blood and urine
Compound name CAS No Compound group
Matrix1 Method source Detected, listed2
Molecular weight
Formula Comment LC/GC
perfluorooctanoic acid (PFOA) 335-67-1 PFC s,b, breast milk
serum [147], whole blood [148], serum and milk [132]
detect, AMBM
414.07 C8HF15O2 LC
perfluorotetradecanoic acid (PFTDA)
376-06-7 PFC b whole blood [148]
detect, BfR 714.11 C14HF27O2 long chain carboxylic acid, bioaccumulative
LC
perfluorooctane sulfonic acid (PFOS)
1763-23-1 PFC s,b, breast milk
serum [147], whole blood [148], serum and milk [132]
detect, AMBM
500.13 C8HF17O3S LC
2-N-methylperfluoro-octanesulfonamide (MeFOSA)
31506-32-8 PFC s serum [147] detect, BfR 513.17 C9H4F17NO2S precursor of PFOS LC
perfluorooctyl phosphonic acid (C8-PFPA)
40143-78-0 PFC [108] 500.05 C8H2F17O3P used in food package material
LC
8:2 fluorotelomer alcohol (8:2 FTOH)
678-39-7 PFC BfR 464.12 C10H5F17O precursor of perfluoro carboxylic acids
(GC)
10:2 fluorotelomer alcohol (10:2 FTOH)
865-86-1 PFC BfR 564.13 C12H5F21O precursor of perfluoro carboxylic acids
(GC)
4-nonylphenol (4-NP) 25154-52-3, 104-40-5, 68081-86-7
phenol BfR, UBA-T,WF,E
220.35 C15H24O GC
bisphenol A 80-05-7 plasticiser s, u serum [122], urine [82, 123, 124]
detect, CDC, AMBM (urine), UBA-T
228.29 C15H16O2 LC
bis(4-chlorophenyl) sulfone 80-07-9 plasticiser [107] 287.16 C12H8Cl2O2S GC triclosan 3380-34-5 preservative,
bactericide s, p, u, breast milk
serum [126], breast milk [127], plasma and milk [84], urine [128]
detect, CDC, UBA-WF, KosmVer, BPD
289.54 C12H7Cl3O2 bactericide LC
52

Screening of target and non-target contaminants in human blood and urine
Compound name CAS No Compound group
Matrix1 Method source Detected, listed2
Molecular weight
Formula Comment LC/GC
ethyl paraben 120-47-8 preservative, paraben
s, u serum [126], urine [129],[130]
detect, BfR 166.17 C9H10O3 in cosmetics LC
butyl paraben 94-26-8 preservative, paraben
u urine [130] detect, BfR 194.23 C11H14O3 in cosmetics LC
3,5-dichloro-N-(3,4-dichlorophenyl)-2-hydroxybenzamide (tetrachlorosalicylanilide)
1154-59-2 preservative [107] 351.01 C13H7Cl4NO2 LC
quaternium 15 4080-31-3 QUAT, biocide, allergenic substance
BfR, BPD 251.16 C9H16Cl2N4 strongly allergenic, used in household- and consumer products
LC
benzyldimethyldodecyl-ammonium chloride (benzylQUAT)
139-07-1 QUAT 304.53 C21H38N biocide, surfactant LC
trimethyloctyl-ammonium bromide (trimethylQUAT)
2083-68-3 QUAT 172.33 C11H26N biocide, surfactant LC
michlers ketone 90-94-8 SVHC BfR 268.35 C17H20N2O LC phenolphthalein 77-09-8 SVHC BfR 318.32 C20H14O4 LC 2-ethylhexyl-p-methoxycinnamate (cinnamate)
5466-77-3 UV filter s,p, u, epidermis
[95] TM, BfR, EU authorized
290.40 C18H26O3 in sunscreens, cosmetics LC/GC
salicylic acid 3,3,5-trimethcyclohexyl ester (homosalate)
118-56-9, 52253-93-7
UV filter s,p, u, epidermis
[95] TM, BfR, KosmVer, EU authorized
262.34 C16H22O3 in sunscreens, cosmetics LC/GC
4-methyl-benzylidene camphor (4-MBC)
36861-47-9 UV filter BfR, KosmVer, EU authorized
254.37 C18H22O in sunscreens, cosmetics GC
octocrylene (OC) 6197-30-4 UV filter BfR, EU authorized
361.48 C24H27NO2 in sunscreens, cosmetics GC
53

Screening of target and non-target contaminants in human blood and urine 1 s=serum, p=plasma, b=whole blood, u=urine; 2 TM (target method exists), AMBM (methods described in [104]), BDP (listed in Biocidal Products Directive), CDC (detected in American human biomonitoring surveys), detect (detect reported in any literature), BfR (recommended to look for in human biomonitoring studies by the BfR), UBA-WF/T/E (listed in [106]), EU-authorized (listed in [149])
54

Screening of target and non-target contaminants in human blood and urine
7 Method development
7.1 Concept for method development
7.1.1 Urine
For a comprehensive screening of trace contaminants, phase I and phase II metabolites can both be
analysed directly or as the deconjugated substances after cleavage. To enable a targeted search for conjugates, some samples were to be analysed with and without a deconjugation step, enabling the
search for relevant peaks based on the comparison of these two analyses. Therefore, during method
development the deconjugation step was to be tested by spiking two sulfate and two glucuronide conjugates listed in Table 6. The enzymatic hydrolysis was preferred over an acidic one to avoid a
transformation of acid-labile compounds.
7.1.2 Blood
The extraction procedure was tested particularly for whole blood, as compounds absorbed to cellular components were not a priori excluded. To prevent clotting often anticoagulants such as EDTA or
heparin are added to whole blood directly after withdrawal [94, 143, 150, 151]. However, there is also
the possibility to freeze the blood at -20°C after sampling and to homogenize after thawing [148, 152-154]. For a non-target screening, it would be generally preferable to freeze the blood without the
addition of an anticoagulant, as the addition introduces a risk of contamination of the sample, and an
increase of matrix effects. However, the samples from the environmental specimen bank are processed by the addition of heparin (approx. 1 drop of heparin/1% benzyl alcohol per 15 mL of sample) [155],
before being stored at -150°C. As the final non-target screening of these samples was an objective of this
project, both the analysis of whole blood with and without the addition of heparin was tested regarding recoveries for the target analytes. Additionally also the analysis of plasma samples was tested.
Pig blood was used for the method development, as its matrix is similar to human blood and it could
easily be obtained from a local slaughterhouse.
7.1.3 Extraction method
As a general extraction method applicable for a wide range of substances the QuEChERS approach
(quick, easy, cheap, effective, robust and save) developed in 2003 for the extraction of pesticides in foods
appeared interesting [88, 89]. This approach combines a liquid-liquid-extraction of analytes in aqueous (homogenized) samples with a fairly polar solvent (mostly acetonitrile, occasionally acetone). Phase
separation is induced by the addition of desiccant (Na2SO4, anhydrous MgSO4) and salt (NaCl). At the
same time, the addition of acetone and acetonitrile results in a precipitation of proteins that remain in the aqueous phase and can thus be separated. Removal of matrix components from the solvent phase is
subsequently possible with dispersive SPE (dSPE) using different sorbents before the extract is dried and
evaporated or a change of solvent for the GC-MS and LC-MS analysis is performed. This method uses low amounts of solvents and materials, is not very time consuming and can thus be viewed as an
"environmentally friendly" extraction method. The work on pesticides shows that a very wide range of
substances can be extracted (very good recoveries for substances with a logKOW between 0.6 and 4.9 [89]). This method was used so far mainly for the analysis of pesticides in food, but also the extraction of a
wide range of drugs in human whole blood samples and the application to forensic cases have been
described [156-159].
55

Screening of target and non-target contaminants in human blood and urine
Therefore the QuEChERS extraction method was tested both for urine and blood samples. For urine
samples additionally the direct injection into the LC-MS system was tested, which is not possible for the analysis of blood samples.
In the context of method development, the recoveries of target substances for the QuEChERS method
were optimized regarding salt concentrations for phase separation and composition of the dSPE sorbents, based on previously published methods [90-94]. For the dSPE step in food analysis mainly PSA
(primary-secondary amines) has been used for the removal of fatty acids and sugars, C18-modified silica
gel for the removal of lipids and GBC (graphitized black carbon) for the removal of carotenoids and chlorophyll [1, 90, 93, 94]. Since all sorbents also remove some of the target analytes, it is necessary to
balance between matrix removal and loss of analytes. In this project only PSA was tested, as C18 and
GBC were expected to remove too many environmental pollutants and the matrix constituents removed were not relevant for urine and blood.
After method development internal standards (IS) were used for the non-target analysis of human
samples. The IS were not used to correct for matrix effects and losses during sample preparation as done during quantitative analysis, but were used as a quality control of the data evaluation procedure.
Additionally during the data evaluation they were taken for a retention time normalization of the
standard and sample measurements.
7.2 Materials and methods
7.2.1 Chemicals
Stock solutions of each target analyte (1 mg/mL) were prepared in MeOH, ACN or toluene, depending on
the solubility of the compound. Spike standards, one for urine and one for blood, were prepared by
mixing of stock solutions. Compounds were contained at different concentrations in the standard mixtures, depending on their sensitivity at the MS instruments concentrations of each analyte are listed
in Table 8 and Table 9.
7.2.2 Sample material
A pooled urine sample was collected from members in the department. Morning urine was mixed in a 5 L aluminium bottle and subsequently portioned into 5, 10 and 20 mL aliquots in 50 mL PP tubes. These
were frozen at -20°C until usage.
Pig blood samples were obtained from organically grown up pigs from the Vorwerk Podemus slaughterhouse in Dresden (www.vorwerkpodemus.de). Whole blood was collected in 125 mL Nalgene
bottles. A portion of the blood was directly mixed with a heparin solution (about 7300 units heparin
dissolved in 5 mL of bidistilled water for 100 mL of blood) and shaken. The sampled blood was put on ice and transported to the laboratory. The whole blood samples were homogenized using an Ultra Turrax
homogenizer. To obtain plasma samples part of the whole blood was centrifuged (15 min at 4000 x g).
All samples were thoroughly mixed and 5 mL aliquots were collected into 15 mL PP tubes, followed by deep freezing at -80°C.
56

Screening of target and non-target contaminants in human blood and urine
7.2.3 Instrumental analysis
7.2.3.1 LC-MS
To determine the detectability and ionization behaviour the target analytes listed in Table 6 and 7 were
injected separately into the Orbitrap for determination of their ionization behaviour. 40 µL of solutions with 5 ng/µL in MeOH were injected directly into the ion trap-Orbitrap hybrid instrument (LTQ-Orbitrap
XL, Thermo Scientific) by an autosampler, using electrospray ionization (ESI) and atmospheric pressure
chemical ionization (APCI) in positive and negative mode. The masses and MS/MS ions (if present) were extracted manually from the resulting spectra. Afterwards a standard mixture containing all target
analytes was injected into the LC-Orbitrap system to check whether the compounds also elute from the
chosen column and if they are still ionisable under the conditions of the LC eluent.
The LC-Orbitrap method was adopted from an established method for the screening of water samples
[80]. Extracts were injected onto a Kinetex C18 column (100 mm x 3 mm, 2.6 µm, Phenomenex)
controlled by an Agilent 1200 LC system. A gradient with a flow rate of 0.2 mL/min was run using LC-MS grade water (A) and LC-MS grade methanol (B), both containing 0.1% of formic acid. The initial content
of 95% A was held for 3.2 minutes and increased to 95% B during 17.8 min. After 20 min at 95% B the
column was equilibrated for 9 min to the initial composition. The LC-system was coupled to the ion trap-Orbitrap hybrid instrument, and separate runs were conducted for positive and negative mode using ESI.
Detection was conducted with the Orbitrap operating in HRMS full scan mode (m/z 100-1000) using a
nominal resolving power of 100 000. For the non-target screening an additional run was conducted where data-dependent HRMS/MS spectra with a resolving power of 30 000 were recorded for selected
masses. Dissociation was achieved using collision induced dissociation (CID) at normalized collision
energies of 35 and 50% and higher-energy collisional dissociation (HCD) at 50, 90 and 120%.
Table 8 shows the results for the compound optimization of the urine target analytes. Geraniol was not
detected; it is probably too volatile and was thus deleted from the list. Resorcinol, dibutylhydroxytoluene
and 1-naphthol were not detectable with ESI, only using APCI. For a non-target screening ESI would be the ionization method to choose, as here mostly molecular ions are formed and can thus be identified.
APCI is a “harder” ionization method and thus often no molecular ion is found in the spectra, making
the identification more difficult. Therefore ESI was the method of choice for the target analytes, reducing their number to 43. Two more compounds posed problems. Bisphenol A is only detectable at very high
concentrations with the Orbitrap system and 2,4-diaminoanisole proved to be instable in solution.
Creatinine was only monitored as a marker compound and was not used for the recovery experiments during method development. Thus these targets were excluded from the urine target list, reducing the
number further to 40 urine targets for method development.
57

Screening of target and non-target contaminants in human blood and urine
Table 8: Ionization methods and m/z values for the urine target analytes analysed by LC-HRMS.
compound name monoisotopic mass
formula ESI APCI final method
target m/z
urine spike std [µg/mL]
2,4-TDI 174.0429 C9H6N2O2 + +/- ESI+ 175.0502 10 CMIT 148.9702 C4H4ClNOS +/(-) + ESI+ 149.9775 5 citronellal 154.1358 C10H18O + + ESI+ 155.1430 10 (geraniol) 154.1358 C10H18O - (resorcinol) 110.0368 C6H6O2 +/- APCI+ 50 (2,4-diaminoanisol) 138.0793 C7H10N2O + + ESI+ 139.0866 10 4,4'-thiodianiline 216.0721 C12H12N2S + +/- ESI+ 217.0794 5 4,4'-methylendi-o-toluidine 226.1470 C15H18N2 + + ESI+ 227.1543 5 solvent yellow 197.0953 C12H11N3 +/(-) +/- ESI+ 198.1026 5 o-dianisidine 244.1212 C14H16N2O2 + + ESI+ 245.1285 50 mercaptobenzothiazole 166.9863 C7H5NS2 +/- +/- ESI+ 167.9936 5 2-(methylthio)benzothiazole 181.0020 C8H7NS2 +/- +/(-) ESI+ 182.0093 5 octhilinone 213.1187 C11H19NOS + +/- ESI+ 214.1260 5 4-hydroxybenzotriazole 135.0433 C6H5N3O +/- +/- ESI- 134.0360 5 p-toluene-sulfonamide 171.0354 C7H9NO2S +/- +/- ESI+ 172.0427 50 5-methylbenzotriazole 133.0640 C7H7N3 - +/- ESI+ 134.0713 5 ethyltosylamide 199.0667 C9H13NO2S + +/- ESI+ 200.0740 5 (dibutylhydroxytoluene) 220.1827 C11H16O - APCI- 5 2-ethoxyethyl acetate 132.0786 C6H12O3 +/(-) ESI+ 133.0859 50 HEMA 207.0565 C7H13NO4S +/- +/(-) ESI- 206.0493 50 TMDD 226.1933 C14H26O2 + + ESI+ 227.2006 10 isophorone diamine 170.1783 C10H22N2 + + ESI+ 171.1856 5 1-hydroxy-pyrene 218.0732 C16H10O - +/- ESI- 217.0659 5 (1-naphthol) 144.0575 C10H8O (-) +/- APCI+ 5 3-OH-PCB 237.9952 C12H8Cl2O - - ESI- 236.9879 5 4-OH-PCB 271.9562 C12H7Cl3O - - ESI- 270.9490 5 IMPY 152.0950 C8H12N2O +/- +/- ESI+ 153.1022 5 diazinon 304.1010 C12H21N2O3PS + +/(-) ESI+ 305.1083 5 diphenyl phosphate 250.0395 C12H11O4P +/- +/- ESI- 249.0322 5 PFBA 213.9865 C4HF7O2 - - ESI- 212.9792 5 (bisphenol A) 228.1150 C15H16O2 - - ESI- 227.1078 250 MEP 194.0579 C10H10O4 +/- +/- ESI+ 195.0652 5 MBP 222.0892 C12H14O4 +/- +/- ESI+ 223.0965 5 MBzP 256.0736 C15H12O4 +/- - ESI+ 257.0808 5 triethylcitrate 276.1209 C12H17O7 + (+) ESI+ 277.1282 5 triclosan 287.9512 C12H7Cl3O2 - ESI- 286.9439 5 ethyl paraben 166.0630 C9H10O3 +/- +/- ESI- 167.0703 5 butyl paraben 194.0943 C11H14O3 +/- (+)/- ESI- 193.0870 5 tetraoxadodecan 178.1205 C8H18O4 + (+) ESI+ 179.1278 5 cinnamate 290.1882 C18H26O3 + (+) ESI+ 291.1955 5
58

Screening of target and non-target contaminants in human blood and urine
compound name monoisotopic mass
formula ESI APCI final method
target m/z
urine spike std [µg/mL]
homosalate 262.1569 C16H22O3 + - ESI+ 263.1642 100 benzophenone-3 228.0786 C14H12O3 +/- +/- ESI+ 229.0859 5 4-MeUmb-gluc 352.0794 C16H16O9 +/- +/- ESI- 351.0722 5 4-MeUmb-sul 256.0042 C10H8O6S - +/- ESI- 254.9969 5 estrone-gluc 446.1941 C24H30O8 - +/- ESI- 445.1868 10 estrone-sul 350.1188 C18H22O5S - +/- ESI- 349.1115 5 (creatinine) 113.0589 C4H7N3O +/- +/- ESI+ 114.0662 -
Table 9 shows the results for the blood target compounds. Substances which were not detectable with LC-MS were tested on the GC-MS, see chapter 7.2.3.2. As mentioned above, bisphenol A and resorcinol were
only analysable at very high concentrations with the instrument used and 2,4-diaminoanisole was
unstable when in contact with water. They thus had to be excluded. 36 blood targets were suitable for analysis by LC-LTQ-Orbitrap.
Table 9: Ionization methods and m/z values for the blood target analytes analysed by LC-HRMS.
compound name monoisotopic mass
formula ESI APCI final method
target m/z
QTrap blood spike std [µg/mL]
2,4-TDI 174.0429 C9H6N2O2 + +/- ESI+ 175.0502 x 5 CMIT 148.9702 C4H4ClNOS +/(-) + ESI+ 149.9775 x 5 citronellal 154.1358 C10H18O + + ESI+ 155.1430 (x) 5 geraniol 154.1358 C10H18O GC 50 (resorcinol) 110.0368 C6H6O2 +/- - (x) 5 (2,4-diaminoanisol) 138.0793 C7H10N2O + + ESI+ 139.0866 x 5 4,4'-thiodianiline 216.0721 C12H12N2S + +/- ESI+ 217.0794 x 5 4,4'-methylendi-o-toluidine 226.1470 C15H18N2 + + ESI+ 227.1543 x 5 solvent yellow 197.0953 C12H11N3 +/(-) +/- ESI+ 198.1026 x 5 o-dianisidine 244.1212 C14H16N2O2 + + ESI+ 245.1285 x 10 BDE 47 481.7152 C12H6Br4O (+) GC - BDE 99 559.6257 C12H5Br5O (+) GC - (BDE 209) 949.1783 C12Br10O + - 5 HBCDD 635.6509 C12H18Br6 - ESI-/GC 634.6436 10 DP 647.7201 C18H12Cl12 GC 5 TCEP 283.9539 C6H12Cl3O4P + + ESI+ 284.9612 x 5 TBBPA 539.7571 C15H12Br4O2 - - GC x 50 (DBDPE) 961.2147 C14H4Br10 (-) - 5 PhIP 224.1062 C13H12N4 +/(-) +/- ESI+ 225.1135 x 5 mercaptobenzothiazole 166.9863 C7H5NS2 +/- +/- ESI+ 167.9936 (x) 5 2-(methylthio)benzothiazole 181.0020 C8H7NS2 +/(-) +/- ESI+ 182.0093 x 5 p-toluene-sulfonamide 171.0354 C7H9NO2S +/- +/- ESI+ 172.0427 x 50 dibutylhydroxytoluene 220.1827 C11H16O - GC 5 TMDD 226.1933 C14H26O2 + + ESI+ 227.2006 x 5
59

Screening of target and non-target contaminants in human blood and urine
compound name monoisotopic mass
formula ESI APCI final method
target m/z
QTrap blood spike std [µg/mL]
4-methylanisole 122.0732 C8H10O + GC 5 ambrettolide 252.2089 C16H28O2 GC 5 cashmeran 206.1671 C14H22O GC 5 celestolide 244.1827 C17H24O GC 5 galaxolide 258.1984 C18H26O GC 5 pyronil 45 701.9191 C24H34Br4O4 + +/- ESI+ 702.9263 50 saytex BT 93 943.3638 C18H4Br8N2O4 - GC 50 HCCPD 269.8131 C5Cl6 GC 10 naphthalene 128.0626 C10H8 GC 5 acenaphthylene 152.0626 C12H8 GC 5 pyrene 202.0783 C16H10 GC 5 PCB 52 289.9224 C12H6Cl4 GC 5 PCB 101 323.8834 C12H5Cl5 GC 5 PCB 180 391.8054 C12H3Cl7 GC 5 carbendazim 191.0695 C9H9N3O2 +/- + ESI+ 192.0768 x 5 diazinon 304.1010 C12H21N2O3PS + +/- ESI+/GC 305.1083 x 5 thiabendazole 201.0361 C10H7N3S +/- +/- ESI+ 202.0433 x 5 PFBA 213.9865 C4HF7O2 - - ESI- 212.9792 x 5 PFOA 413.9737 C8HF15O2 - (-) ESI- 412.9664 x 5 PFTDA 713.9545 C14HF27O2 - (-) ESI- 712.9473 x 50 PFOS 499.9375 C8HF17O3S - (-) ESI- 498.9302 x 5 MeFOSA 512.9691 C9H4F17NO2S - - ESI- 511.9619 x - C8-PFPA 499.9470 C8H2F17O3P ESI- 498.9328 (x) - (8:2 FTOH) 464.0069 C10H5F17O - - 5 (10:2 FTOH) 564.0005 C12H5F21O - - 5 4-NP 220.1827 C15H24O - - GC 5 (bisphenol A) 228.1150 C15H16O2 - - - x 50 bis(4-chlorophenyl) sulfone 285.9622 C12H8Cl2O2S GC 5 triclosan 287.9512 C12H7Cl3O2 - (-) ESI- 286.9439 x 5 ethyl paraben 166.0630 C9H10O3 +/- +/- ESI- 167.0703 x 5 butyl paraben 194.0943 C11H14O3 +/- +/- ESI- 193.0870 x 5 tetrachlorosalicylanilide 348.9231 C13H7Cl4NO2 - +/- ESI- 347.9158 x 5 quaternium 15 215.1058 C9H16Cl2N4 + ESI+ 215.1058 x 50 benzylQUAT 304.2999 C21H38N + + ESI+ 304.2999 x 5 trimethylQUAT 172.2060 C11H26N + + ESI+ 172.2060 x 5 michlers ketone 268.1576 C17H20N2O + + ESI+ 269.1648 x 5 phenolphthalein 318.0892 C20H14O4 +/- +/- ESI+ 319.0965 x 5 cinnamate 290.1882 C18H26O3 + (+/-) ESI+/GC 291.1955 x 10 homosalate 262.1569 C16H22O3 + (+)/- ESI+/GC 263.1642 x 50 4-MBC 254.1671 C18H22O GC 10 octocrylene 361.2042 C24H27NO2 GC 10
60

Screening of target and non-target contaminants in human blood and urine
Table 10 shows the results for IS which were analysed by LC-MS. They were spiked both into the urine
and blood samples for the non-target analysis. They were, however, not used during method development.
Table 10: Ionization mode and m/z values for the internal standards used during non-target screening.
compound name monoisotopic mass ESI mass
analysed
IS spike std conc [µg/mL]
PFOS-13C4 502.9434 - 501.9371 5 PFBA-13C3 216.9964 - 215.9901 5 triclosan-d3 290.9701 - 289.9638 27 MBP-d4 226.1144 + 227.1207 10 chlormequat-d9 131.1298 + 132.1361 10 p-toluene-sulfonamide-d4 175.0605 + 176.0668 100 carbendazim-d4 195.0947 + 196.1010 7 creatinine-d3 116.0778 + 117.0841 10 benzophenone-3-d5 233.1101 + 234.1164 10 PhIP-d3 227.1251 + 228.1314 10 cotinine-d3 179.1139 + 180.1202 10 benzotriazole-d4 123.0735 + 124.0798 10 tri-butyl-d27-phosphate 293.3348 + 294.3411 10 tonalide-d3 261.2173 + 262.2236 8 diazinon-d10 314.1640 + 315.1703 10 atrazine-13C3 218.1037 + 219.1100 10
An additional LC-MS instrument was used during method development for the analysis of blood samples.
A liquid chromatograph (Agilent 1260 Infinity) was coupled to a quadrupole-iontrap system (QTrap 6500 from ABSciex). This was used due to faster data processing procedures and time limitations at the LC-
Orbitrap. The same Kinetex C18 LC column as mentioned above was used with a slightly shortened LC
gradient program of 35 min. A flow rate of 0.2 mL/min was run using LC-MS grade water (A) and LC-MS grade methanol (B), both containing 2 mM ammonium acetate. The initial content of 95% A was held for
5 min and increased to 95% B over 5 min. After 15 min with 95% B, it was equilibrated for 10 min to the
initial composition. The QTrap instrument was run in scheduled MRM mode. The advantage was that the QTrap could analyse positive and negative ionization in one run, while with the Orbitrap one run each
for negative and positive mode was necessary. However, the QTrap could only be run in low resolution,
making the instrument unsuitable for the non-target screening. Therefore, during method development also a few extracts were injected into the Orbitrap to check for matrix effects and to test the data
evaluation, see chapter 8.1. Table A 3 in the Annex shows the MRM transitions for the blood LC target
analytes and the IS.
In total 36 blood targets were detectable with the LC-QTrap. These targets included two analytes not
detectable with the LC-Orbitrap system: BPA and TBBPA were analysable probably due to a different ESI
source and application of ammonium-containing LC-solvents. On the other hand, HBCDD and pyronil 45, which were analysable with the Orbitrap were not analysable with the LC-QTrap. Citronellal, resorcinol
and mercaptobenzothiazole posed another problem as they were analysable by direct injection into the
61

Screening of target and non-target contaminants in human blood and urine
MS, but not when using the LC system. Tetrachlorosalicylanilide and PFOPA were ionisable, but their
calibration curves were not useable. Therefore the total LC blood targets were reduced to 31.
7.2.3.2 GC-MS
A gas chromatograph coupled to a mass spectrometer (Model 6890 N, MSD 5973, Agilent Technologies)
was used in single ion monitoring (SIM) mode for the detection of blood targets. One µL was injected in
splitless mode at 250°C. A HP-5MS capillary column (30m x 0.25 mm I.D., 0.25 µm film thickness, Agilent Technologies) was used for separation with a temperature program starting at 60°C, held for 1 min,
ramped with 30°C/min until 90°C, held for 3 min, ramped with 6°C/min to 280°C and held for 16.5 min.
The auxiliary line was kept at 280°C and the ion source temperature at 230°C. For the non-target screening the temperature program was started at 60°C, held for 3 min and then ramped at 3°C/min to
300°C (held for 20 min). During method development while analysing extracts in SIM mode, a GC with
hydrogen as carrier gas was applied. For the screening helium was used as carrier gas, as hydrogen might result in different fragmentation compared to the EI spectra present in the databases used for
identification and might react with unsaturated compounds.
Target analytes from Table 7 that were considered ionisable by GC-EI-MS were injected at concentrations of about 5 ng/µL into the GC-MS system. Scans (m/z 50-600) were conducted and qualifier and quantifier
ions were taken to establish a final SIM method for further analysis during method development. LDCs in
the standard runs (analytes solved in ACN, with addition of analyte protectant, according to [160]) and in spiked samples were determined for each substance. This information is summarized in Table 11. A few
target analytes could not be covered by the GC-EI-MS method. One group were the highly brominated
flame retardants BDE 209 and DBDPE. These would be ionisable either by injection on column or by electron capture negative ionization (ECNI), where the Br- isotopes 79 and 81 would be analysed [161].
Thus highly brominated flame retardants fall outside the range for a non-target screening with GC-EI-MS.
Also FTOHs fall outside the range, which commonly are analysed with positive or negative chemical ionization and due to their high volatility are injected at lower temperatures [162, 163]. Integrating
lower injection temperatures into the method would however result in bad peak shapes for later eluting
compounds. Thus they also needed to be excluded from the final target list, leaving 27 GC-blood-targets for method development, 4 of which are also analysed by LC-QTrap. 56 blood targets remained for
method development analysable with LC and GC-MS.
62

Screening of target and non-target contaminants in human blood and urine
Table 11: Qualifier, quantifier and retention times of target analytes and IS analysed by GC-EI-MS (in SIM mode).
compound name LC/GC qualifier quantifier RT [min] instr. LDC [ng/mL extract]
method LDC [ng/mL blood]
geraniol GC 69 41 / 123 9.2 20.5 10 BDE 47 GC 486 326 / 484 31.2 10 10 BDE 99 GC 566 404 / 406 34.5 10 10 BDE 209 (GC) - HBCDD LC/GC 239 319 / 401 32.5 51.2 blank DP GC 272 49.6 20.5 10 TBBPA GC 529 544 / 527 36.4 20.5 blank DBDPE (GC) - dibutylhydroxytoluene GC 205 220 14.8 <8.2 blank 4-methylanisole GC 112 77 / 107 3.9 20.5 10 ambrettolide GC 67 82 / 252 22.6 51.2 10 cashmeran GC 191 206 / 135 14.7 20.5 2 celestolide GC 229 244 / 173 18.9 <8.2 blank galaxolide GC 243 258 / 213 21.2 8.2 blank saytex BT 93 GC 463 420 / 232 46.0 51.2 10 HCCPD GC 237 272 / 203 10.9 128 - naphthalene GC 128 102 / 64 7.6 <8.2 <2 acenaphthylene GC 152 76 13.8 20.5 <2 pyrene GC 202 101 25.9 20.5 <2 PCB 52 GC 292 220 / 255 22.9 <8.2 blank PCB 101 GC 356 254 / 291 25.6 <8.2 blank PCB 180 GC 394 324 / 252 30.9 <8.2 blank diazinon LC/GC 179 137 / 304 20.4 20.5 2 8:2 FTOH (GC) - 10:2 FTOH (GC) - 4-NP GC 107 220 / 77 21.7 128 blank bis(4-chlorophenyl) sulfone GC 159 286 / 111 27.5 20.5 2 cinnamate LC/GC 178 161 / 290 28.7 <8.2 2 homosalate LC/GC 138 109 / 262 21.5 + 22.0 8.2 blank 4-MBC GC 254 221 / 128 24.7 20.5 blank octocrylene GC 249 360 / 204 32.9 8.2 blank Internal standards tonalide-d3 GC 261.1 246.2 21.3 pyrene-d10 GC 212.1 106 26.0 hexachlorobenzene-13C6 GC 289.9 254.8 18.7 diazinon-d10 LC/GC 314 183 / 138 20.4 4-NP-d4 GC 224.2 111.1 21.8 blank: detections already in the not spiked samples, thus no method LDC could be derived
63

Screening of target and non-target contaminants in human blood and urine
7.2.4 Sample preparation
7.2.4.1 Urine
Urine samples were thawed at room temperature. Following homogenization by vortexing aliquots were
taken for the different types of sample preparation.
For a direct injection the urine was centrifuged for 10 min at 4000 x g and 10% of MeOH was added. For
spike experiments the urine standard mixture was spiked at different concentrations. Spikes into
bidistilled water mixed with 10% of MeOH were used for the calculation of recoveries due to matrix effects.
For the QuEChERS extraction 10 mL of urine were thoroughly mixed with 10 mL of ACN. Addition of 4 g
of MgSO4 and 1 g of NaCl was followed by vortexing and centrifugation (10 min at 4000 x g). The supernatant was divided. 3 mL supernatant were taken and concentrated to 300 µL under a N2 stream
(called LLE fraction). 5 mL were mixed with 125 mg of PSA (primary secondary amine) and 750 mg of
MgSO4 for clean-up (called dSPE fraction). This fraction was again vortexed and centrifuged (10 min at 4000 x g). The supernatant (3 mL) was concentrated to 300 µL under a N2 stream.
Spike experiments for method development were conducted by spiking the urine standard mixture at
different concentrations into 10 mL of urine before addition of ACN. Matrix spikes were prepared by spiking into the final extracts before concentration under N2. External standards (urine-standard-mixture
diluted in ACN) were used for the calculation of absolute recoveries.
7.2.4.2 Blood
Blood samples were thawed at room temperature. Following homogenization by vortexing, samples were extracted using the QuEChERS method as described for the urine samples. 5 mL of blood was taken
and thoroughly mixed with 5 mL of ACN. Addition of 2 g of MgSO4 and 0.5 g of NaCl was followed by
vortexing and centrifugation (10 min at 3913 x g). The supernatant was divided. 1.5 mL supernatant were taken for the LLE fraction and concentrated to 150 µL under a N2 stream. 2.5 mL were mixed with
75.5 mg of PSA (primary secondary amine) and 375 mg of MgSO4 for the dSPE fraction. This was again
vortexed and centrifuged (10 min at 3913 x g). The supernatant (1.5 mL) was concentrated to 150 µL under a N2 stream. For analysis with the QTrap no concentration step (neither for LLE nor dSPE) was
necessary due to the high sensitivity of the instrument.
Spike experiments for method development were conducted by spiking the blood standard mixture at different concentrations into the 5 mL of blood before addition of ACN. Matrix spikes were done by
spiking into the final extracts before concentration under a N2 stream. External standards (blood
standard mixture diluted in ACN) were used for the calculation of absolute recoveries.
7.3 Results and discussion of method development
7.3.1 Urine
7.3.1.1 Instrumental method
Instrumental lowest detectable concentrations (instrLDCs) and retention times (RT) can be found in Table
12. They were determined both for 100 µL injections of standard solutions in water:MeOH (90:10) and for
10 µL injections of standard solutions in acetonitrile, to compare them to the direct injections and the QuEChERS extract injections, respectively. Some compounds showed high LDCs with the instrument used,
thus they were spiked at higher concentrations when doing the recovery experiments (concentrations of
64

Screening of target and non-target contaminants in human blood and urine
each analyte in the spike standards are listed in Table 8 and Table 9). Peak shapes of all compounds were
good, except for the aromatic amines, which showed two peaks. A fraction was not retained and eluted at the dead time. The second peak was taken for quantification.
Table 12: Instrumental and method lowest detectable concentrations (LDCs) and retention times (RT) of all urine target analytes.
instr. LDC [ng/mL] method LDC [ng/mL] RT [min]
DI Q DI Q LLE Q dSPE DI Q 2,4-TDI 10 100 20 200 50* 19.33 18.97 CMIT 1 5 - 25 25 13.69 12.97 citronellal 20 200 - 50* 50* 23.14 22.74 4,4-thiodianiline 1 5 5 100 5 15.21 14.38 4,4-methylendi-o-toluidine 1 10 5 100 5* 11.59 10.72 solvent yellow <1 1 1 <5 <5 23.84 23.48 o-dianisidine <10 50 10 1000 250 8.46 7.57 mercaptobenzothiazole 25 50 100 100 - 20.89 20.60 2-(methylthio)benzothiazole 1 5 5 5 5 24.47 24.11 octhilinone <1 1 1 <5 <5 25.20 24.86 4-hydroxybenzotriazole 1 25 5 25 25 12.54 11.60 p-toluene-sulfonamide 50 50 - 1000 - (P) 16.12 15.64 5-methylbenzotriazole <1 1 1 <5 5 19.03 18.69 ethylosylamide 1 1 5 5 blank 20.58 20.26 2-ethoxyethyl acetate 10 50 - 250 50 15.21 14.66 HEMA 10 250 1000 1000 - (P) 3.94 2.84 TMDD 2 2 20 10 10 25.69 25.28 isophorone diamine 5 25 25 100 - (P) 2.14 2.02 1-hydroxypyrene 1 5 1 25 5 26.19 25.83 3-OH-PCB 5 5 10 100 5 26.28 25.98 4-OH-PCB <1 <1 5 25 <5 27.34 26.99 pyrimidinol 1 5 5 25 5 12.01 10.95 diazinon <1 1 1 <5 <5 26.06 25.68 diphenyl phosphate 1 5 blank blank 5 23.23 22.42 PFBA <1 5 1 5 5 18.53 17.98 MEP 5 1 blank blank 5 19.94 19.60 MBP <1 1 blank blank blank 22.89 22.51 MBzP 1 1 5 5 5 23.17 22.80 triethylcitrate <1 1 25 25 <5 21.04 20.68 triclosan <1 5 5 25 <5* 26.98 26.62 ethyl paraben 1 25 25 100 5* 21.38 21.08 butyl paraben 1 5 10 25 5 24.31 23.94 tetraoxadodecan 1 5 5 5 blank 14.54 13.86 cinnamate 5 10 - 25 5* 29.74 29.06
65
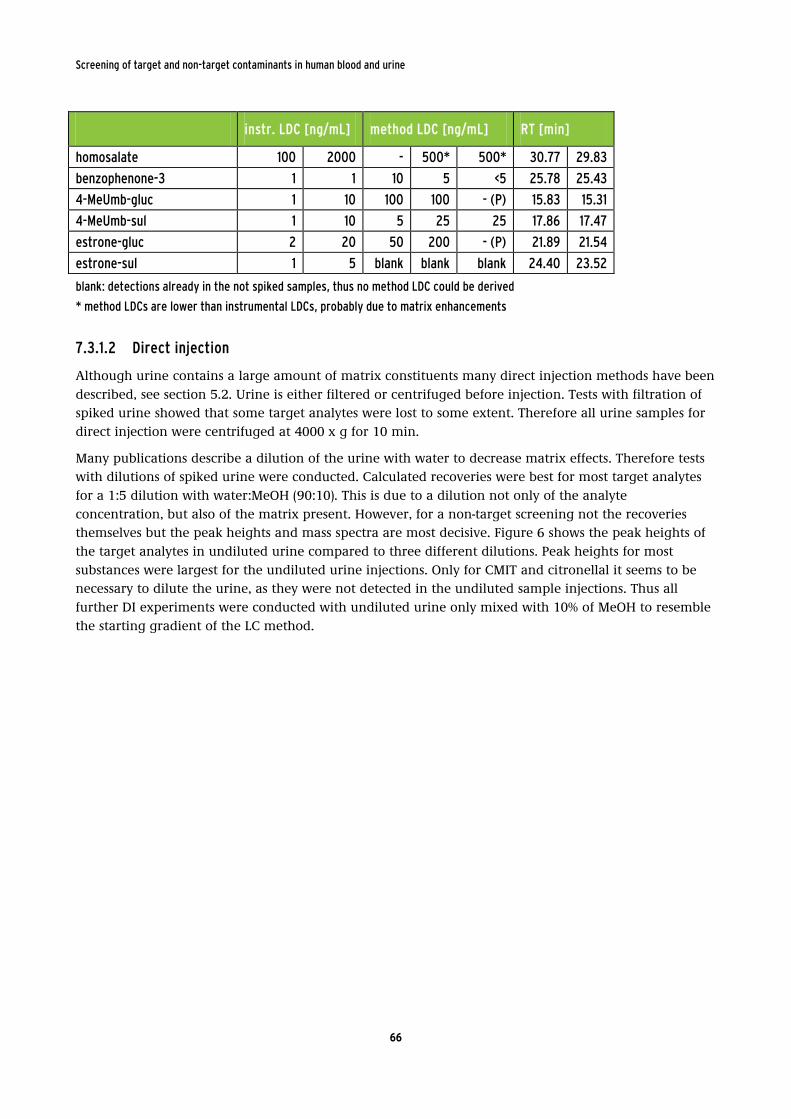
Screening of target and non-target contaminants in human blood and urine
instr. LDC [ng/mL] method LDC [ng/mL] RT [min]
homosalate 100 2000 - 500* 500* 30.77 29.83 benzophenone-3 1 1 10 5 <5 25.78 25.43 4-MeUmb-gluc 1 10 100 100 - (P) 15.83 15.31 4-MeUmb-sul 1 10 5 25 25 17.86 17.47 estrone-gluc 2 20 50 200 - (P) 21.89 21.54 estrone-sul 1 5 blank blank blank 24.40 23.52
blank: detections already in the not spiked samples, thus no method LDC could be derived
* method LDCs are lower than instrumental LDCs, probably due to matrix enhancements
7.3.1.2 Direct injection
Although urine contains a large amount of matrix constituents many direct injection methods have been
described, see section 5.2. Urine is either filtered or centrifuged before injection. Tests with filtration of spiked urine showed that some target analytes were lost to some extent. Therefore all urine samples for
direct injection were centrifuged at 4000 x g for 10 min.
Many publications describe a dilution of the urine with water to decrease matrix effects. Therefore tests with dilutions of spiked urine were conducted. Calculated recoveries were best for most target analytes
for a 1:5 dilution with water:MeOH (90:10). This is due to a dilution not only of the analyte
concentration, but also of the matrix present. However, for a non-target screening not the recoveries themselves but the peak heights and mass spectra are most decisive. Figure 6 shows the peak heights of
the target analytes in undiluted urine compared to three different dilutions. Peak heights for most
substances were largest for the undiluted urine injections. Only for CMIT and citronellal it seems to be necessary to dilute the urine, as they were not detected in the undiluted sample injections. Thus all
further DI experiments were conducted with undiluted urine only mixed with 10% of MeOH to resemble
the starting gradient of the LC method.
66

Screening of target and non-target contaminants in human blood and urine
Figure 6: Peak heights of DI tests with urine at different dilutions (diluted with water:MeOH 9:1). Note the logarithmic scale.
To determine the connection between injection volumes and matrix effects, tests with different volumes (10, 40, 100 and 200 µL) and different concentrations were conducted. Stronger matrix effects were
detected for larger injection volumes when injecting the same on-column concentration of 1 ng (peak
heights were lower the higher the injection volume). However, when injecting different volumes of the same 5 ng/mL concentration (thus having different on-column concentrations), higher peaks were
observed for larger injection volumes. As mentioned above, for a non-target screening the peak height is
a determining factor, thus an injection volume of 100 µL was chosen for all further tests.
Recoveries due to matrix effects of 3 spiked concentrations compared to spiked water samples are
illustrated in Figure 7. For many analytes the highest concentration of 100 ng/mL shows best and higher
recoveries than the lower concentrations (it should be noted here that the mentioned concentrations arethe ones of most target analytes, however, some are higher, see Table 8 and Table 9). This could be
due to stronger ion suppression for the lower concentrations. 19 analytes show recoveries of ≥ 50% for
the injection of 100 ng/mL spikes. Six analytes could not be detected at all (CMIT, 2-ethoxyethyl-acetate, p-toluene-sulfonamide, citronellal, cinnamate and homosalate), HEMA and 4-MeUmb-gluc showed very
low recoveries only for the 100 ng/mL level. LDCs of spiked urine samples can be found in Table 12 and
are ≤ 5 ng/mL for 21 of the 40 target analytes. Diphenyl phosphate, MEP, MBP and estrone-sulfate were already present in the pooled urine and thus no method LDC could be determined. This demonstrates
that with a simple DI several analytes if present at 5 ng/mL or more would be detectable in human
urine.
67

Screening of target and non-target contaminants in human blood and urine
Figure 7: DI average recoveries at 5 different concentrations in urine compared to standard injections in water, error bars represent the maximum and minimum values (n=3).
7.3.1.3 QuEChERS extraction
LDCs of spiked urine samples can be found in Table 12. Often method LDCs were lower in dSPE extracts
than in LLE extracts, showing the effectiveness of the additional clean-up step. Method LDCs were ≤5
ng/mL for 24 of the 40 analytes for dSPE extracts.
Matrix spike recoveries shown in Figure 8 showed still quite some suppression for most analytes, which
was more pronounced in the LLE extracts. Thus the clean-up step proved to be an advantage for all
analytes except mercaptobenzothiazole, which could not be found when spiked into a dSPE extract. Also p-toluene-sulfonamide was prone to huge matrix suppression, it could only be found with a recovery of
7.3% in a spiked dSPE matrix extract. However, 28 of all analytes showed satisfactory matrix effects (≥50%
recoveries of matrix spikes) spiked into a dSPE extract.
68

Screening of target and non-target contaminants in human blood and urine
Figure 8: Matrix spike recoveries for QuEChERS LLE and dSPE extractions, error bars represent the maximum and minimum values (n=3).
Relative recoveries, describing the sample preparation step, of LLE extracts (Figure 9) were only between
75 – 140% for all 3 spiked concentrations for the target analytes 5-methylbenzotriazole, 2-methylthiobenzothiazole and PFBA. Many other analytes could only be detected at the 25 and 100
ng/mL concentrations, 19 analytes showed recoveries between 50 -150% for the 100 ng/mL level. As the
LLE extracts also showed fairly large standard deviations, this step did not result in any improvement compared to the simple DI.
Comparing the additional dSPE step (relative recoveries in Figure 10) to the LLE, the picture looked
better. The only substances with no or very low recoveries were the glucuronides, HEMA, phthalates, isophorone diamine, p-toluene-sulfonamide and mercaptobenzothiazole. Relative recoveries of the lowest
spiked concentration of 5 ng/mL were very high with large standard deviations for many analytes, which
is due to uncertainties resulting from levels close to the LDCs. However, for most analytes the clean-up step proved to be important to determine them without any major matrix suppression.
Experiments with the addition of a buffer (addition of NaCOOH and HCOOH instead of NaCl) during the
first step of ACN extraction showed lower recoveries for most of the analytes, however, for a few ones like HEMA and the phthalates recoveries were improved. However, the improved recoveries were still
not very good, thus the buffer addition did not result in an overall improvement of the extraction
method and was therefore not applied any during the non-target screening.
69

Screening of target and non-target contaminants in human blood and urine
Figure 9: Relative recoveries compared to matrix spikes of the LLE fraction for 3 spiked concentrations, error bars represent the maximum and minimum values (n=3).
Figure 10: Relative recoveries compared to matrix spikes of the dSPE fraction for 3 spiked concentrations, error bars represent the maximum and minimum values (n=3).
70

Screening of target and non-target contaminants in human blood and urine
7.3.1.4 Comparison of DI and QuEChERS
A summary over which target analytes could be found in which extracts (DI, LLE or dSPE) can be found
in Table 13. Substances adsorbing to the dSPE material like glucuronides and phthalates were not present in the dSPE extracts, but could be detected with the DI. Considering only the DI and dSPE
extracts 38 of the 40 target analytes were present with absolute recoveries between 30 - 150%. Only
citronellal and p-toluene-sulfonamide could not be found. These however, could neither be found in the LLE fraction. Overall recoveries for many target analytes were in the range of 30 - 50%, which was due to
matrix effects. However, further clean-up would result in losses of several targets, as could already be
seen for the phthalates during the dSPE step.
A combination of DI and dSPE resulting in satisfactory recoveries of most compounds was to be applied
for the non-target screening. The analysis of the LLE extract was not necessary, as it did not improve
recoveries compared to the DI. Also no addition of a buffer was included in the method.
Comparing only DI and dSPE two targets could only be detected in the dSPE extracts, the UV-filters
cinnamate and homosalate. Their calculated logKOW seemed to be out of the application range of the DI
method. Benzophenone-3 (also a UV-filter) was detectable during DI of a spiked sample, as it has a lower calculated logKOW value of 3.52. Thus the logKOW range for compounds detectable with a DI of urine lies
between -1 and 5.2. On the other hand there were some very hydrophilic compounds (the glucuronides
and HEMA), which could not be detected in the spiked dSPE extracts. However, by a combination of DI and dSPE the property ranges are very broad with calculated logKOW values between -0.9 and 6.2 and
Henry constants between 8*10-22 and 2.5*10-2 atm*m3/mol. These ranges seemed to be sufficiently broad
for a general non-target screening.
71

Screening of target and non-target contaminants in human blood and urine
Table 13: Summary of recovery tests with DI and QuEChERS LLE and dSPE extracts; x: absolute recoveries 50-150%, (x): absolute recoveries 30-50%, -: absolute recoveries outside of 30-150%, nd: not detected
target analyte DI LLE dSPE
2,4-TDI x - x CMIT nd - - citronellal nd - - 4,4'-thiodianiline (x) - x 4,4'-methylendi-o-toluidine x x x solvent yellow x (x) x o-dianisidine x - (x) mercaptobenzothiazole (x) - nd 2-(methylthio)benzothiazole x x x octhilinone (x) x x 4-hydroxybenzotriazole (x) - - p-toluene-sulfonamide nd - - 5-methylbenzotriazole x x x ethyltosylamide (x) (x) x 2-ethoxyethyl acetate (x) x x HEMA (x) - nd TMDD (x) x x isophorone diamine x - nd 1-hydroxypyrene x - (x) 3-OH-PCB (x) nd x 4-OH-PCB x - - pyrimidinol x x x diazinon x (x) x diphenyl phosphate x (x) - PFBA x (x) - MEP x (x) - MBP x (x) - MBzP (x) - - triethylcitrate (x) - (x) triclosan x - (x) ethyl paraben x - (x) butyl paraben x - (x) tetraoxadodecan x x (x) cinnamate nd - (x) homosalate nd (x) x benzophenone-3 (x) - x 4-MeUmb-gluc (x) - nd
72

Screening of target and non-target contaminants in human blood and urine
target analyte DI LLE dSPE
4-MeUmb-sul x - - estrone-gluc (x) (x) nd estrone-sul x - (x)
7.3.1.5 Deconjugation step
The deconjugation of glucuronides and sulfates was tested with the 4-methyl umbelliferyl and estrone
metabolites. Different amounts of β-glucuronidase addition were tested, ~300 units/mL and ~600
units/mL (β-glucuronidase dissolved in 1 M ammonium acetate buffer), followed by incubation at 37°C over night (19 hours). For comparison one sample was analysed without the deconjugation step. In
addition 3 blanks were analysed (without conjugation step, and with the two different β-glucuronidase
amounts). During analysis also the formation of 4-methyl-umbelliferyl from the deconjugation of 4-MeUmb-gluc and –sul was monitored. Estrone formed from the other two conjugates was not detectable
with the LC method used.
In all extracts incubated with β-glucuronidase, none of the four metabolites was found, except for a very small fraction of estrone-sul in the dSPE extract when using 300 units/mL β-glucuronidase, see Figure 11.
The formation of 4-methyl-umbelliferyl has been detected in the incubated samples. This shows that the
deconjugation step worked with both the low and high amounts of β-glucuronidase.
Figure 11: Peak areas for conjugates (4-MeUmb-glucurunide and –sulfate, estrone-glucuronide and sulfate) and the unconjugated 4-MeUmb in samples without and with deconjugation by β-glucuronidase.
To check whether the addition of the β-glucuronidase-buffer solution led to an increase in matrix, the TICs of the samples were compared. Figure 12 and Figure A 1 in the Annex show the TICs of the DI and
QuEChERS, where the runs do look very similar. However, the background of the dSPE extract was higher
for the analysis of the deconjugated samples. Thus the addition of the β-glucuronidase buffer does not add anything to the background of the DI, however, it adds some matrix to the dSPE extracts.
For the non-target screening we concluded that a deconjugation step had to be included in the sample
preparation. The main reason was that it is simpler to identify the original substances compared to their metabolites. Due to the good results regarding matrix, it was decided to apply the deconjugation to all
73

Screening of target and non-target contaminants in human blood and urine
samples for the non-target screening, with some samples additionally without a deconjugation step for
comparison.
Figure 12: TIC of DI LC-MS analysis in ESI positive mode, comparing the deconjugated and not-deconjugated samples. TICs for negative mode and QuEChERS dSPE extracts can be found in the Annex.
7.3.2 Blood
Initial tests with whole blood samples were conducted to test the phase separation using the QuEChERS
method and applying different amounts of salts and dSPE sorbent. By using the same method as for the urine samples (described by Anastassiades 2003 [27]), clean extracts were produced. One essential
addition to the method was the usage of stainless steel beads (8 mm) during the first extraction step. This
was necessary to improve mixing and phase separation by destroying the blood clog formed upon ACN and salt addition. Taking higher amounts of salt resulted in very low amounts of supernatants and was
thus not applicable. A test with the addition of a buffer (2 g of MgSO4, 0.5 g of NaCOOH and 340 mg of
HCOOH after ACN addition) and one with the addition of salts listed in the DIN EN 15662:2008 (2 g of MgSO4, 0.5 g of NaCl, 0.5 g of trisodium-citrate-dihydrate and 0.25g of disodium-hydrogencitrate-
sesquihydrate after the addition of ACN) resulted in coloured and turbid extracts, see Figure 13. Thus the
original method was kept for tests with different blood types (whole blood, heparin blood and plasma). Absolute recoveries for the three blood types spiked with the target analytes at a concentration of 50
ng/mL can be found in Figure 14 for LC and in Figure 15 for GC substances.
Figure 13: Extraction of whole blood samples. Left side: LLE; right side: dSPE. The three tubes from left to right: with normal procedure according to [27], with DIN EN 15662:2008 procedure, with addition of buffer.
74

Screening of target and non-target contaminants in human blood and urine
Figure 14: LC-MS analysis: absolute recoveries of target analytes spiked into different blood sample types (50 ng/mL) and extracted by LLE and dSPE: WB – whole blood, HpB – heparin blood, plasma.
Figure 15: GC-MS analysis: absolute recoveries of target analytes spiked into different blood sample types (50 ng/mL) and extracted by LLE and dSPE: WB – whole blood, HpB – heparin blood, plasma.
Most compounds showed absolute recoveries above 70%, which was similar for all three blood samples types. CMIT, quaternium 15 and HCCPD were not detected. This was due to losses during the extraction,
as matrix spikes (spike into the final extract) showed good recoveries. The absolute recoveries were
similar for most compounds comparing LLE and dSPE fractions. A few compounds were lost during the dSPE clean-up, due to sorption to the PSA sorbents. These are the perfluorinated carboxylates (PFBA,
PFOA and PFTDA) and TBBPA.
Comparing the LC and GC-MS analysis for the 4 analytes that were determined with both instruments, the results look a bit different. TBBPA shows matrix enhancement during GC analysis, while recoveries
for LC analysis were around 60 %. Recoveries of diazinon and cinnamate were similar with both
methods. Homosalate was not found during LC analysis of the dSPE extracts, while during GC analysis
75
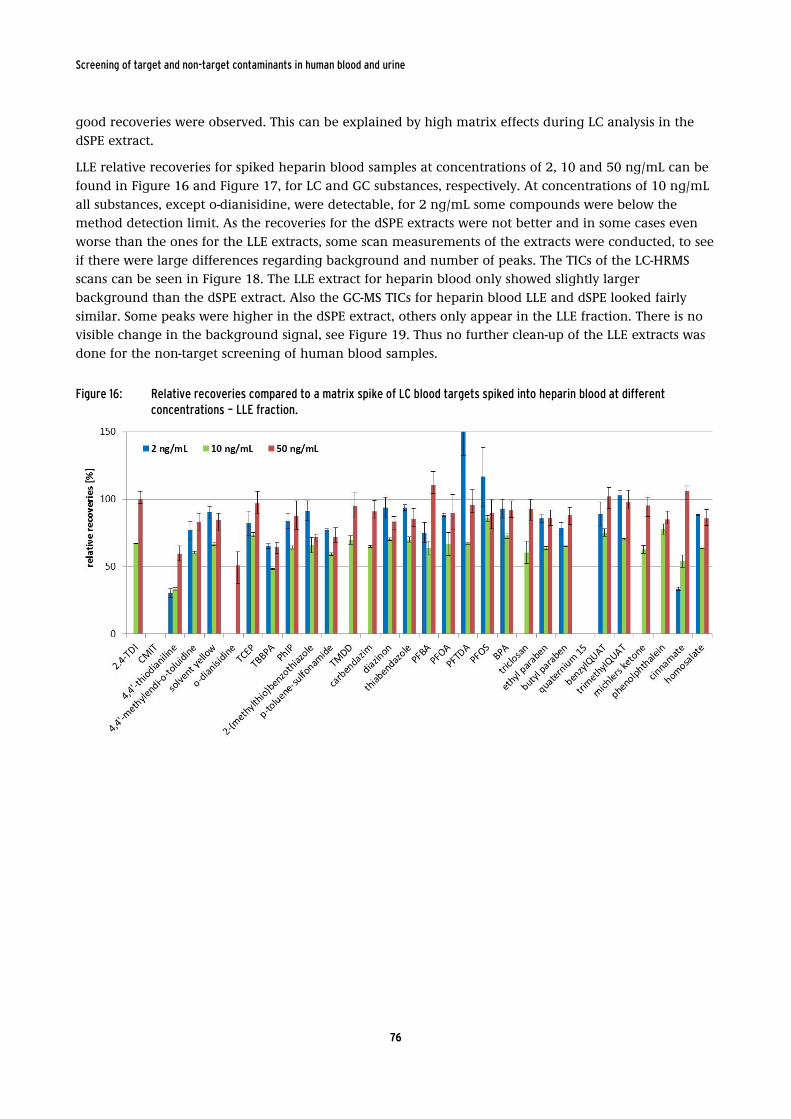
Screening of target and non-target contaminants in human blood and urine
good recoveries were observed. This can be explained by high matrix effects during LC analysis in the
dSPE extract.
LLE relative recoveries for spiked heparin blood samples at concentrations of 2, 10 and 50 ng/mL can be
found in Figure 16 and Figure 17, for LC and GC substances, respectively. At concentrations of 10 ng/mL
all substances, except o-dianisidine, were detectable, for 2 ng/mL some compounds were below the method detection limit. As the recoveries for the dSPE extracts were not better and in some cases even
worse than the ones for the LLE extracts, some scan measurements of the extracts were conducted, to see
if there were large differences regarding background and number of peaks. The TICs of the LC-HRMS scans can be seen in Figure 18. The LLE extract for heparin blood only showed slightly larger
background than the dSPE extract. Also the GC-MS TICs for heparin blood LLE and dSPE looked fairly
similar. Some peaks were higher in the dSPE extract, others only appear in the LLE fraction. There is no visible change in the background signal, see Figure 19. Thus no further clean-up of the LLE extracts was
done for the non-target screening of human blood samples.
Figure 16: Relative recoveries compared to a matrix spike of LC blood targets spiked into heparin blood at different concentrations – LLE fraction.
76
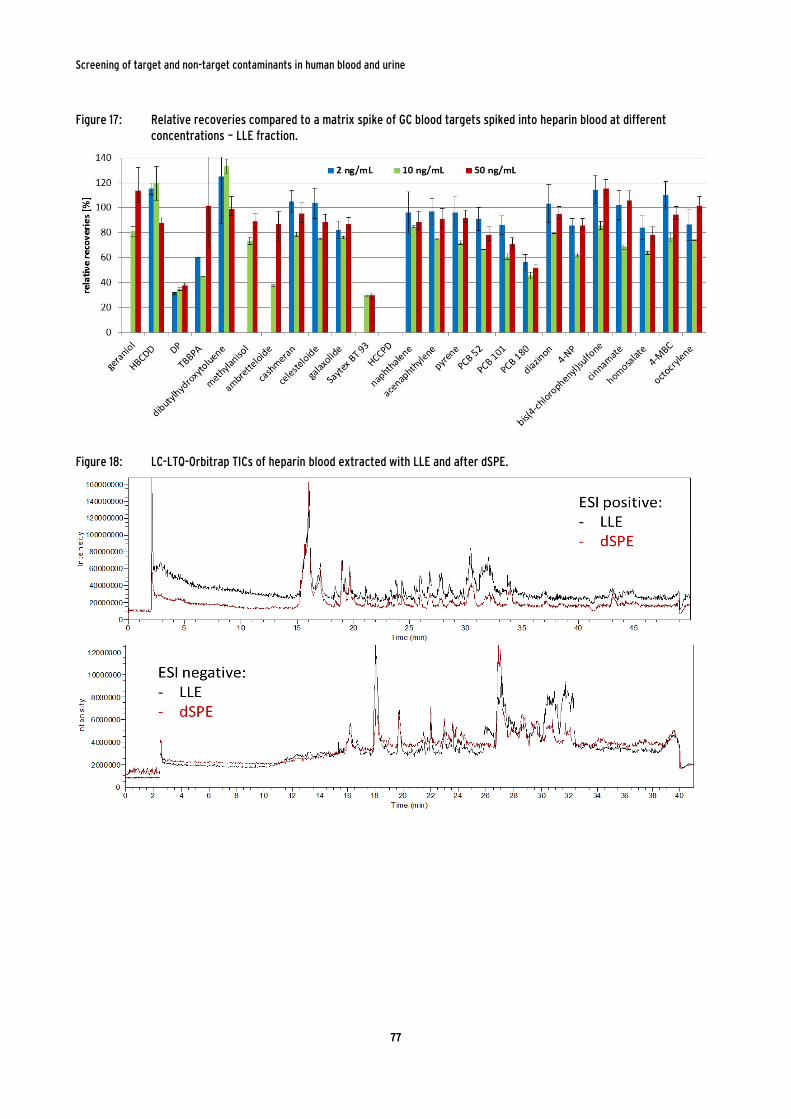
Screening of target and non-target contaminants in human blood and urine
Figure 17: Relative recoveries compared to a matrix spike of GC blood targets spiked into heparin blood at different concentrations – LLE fraction.
Figure 18: LC-LTQ-Orbitrap TICs of heparin blood extracted with LLE and after dSPE.
77

Screening of target and non-target contaminants in human blood and urine
Figure 19: GC-TICs of heparin blood extracted with LLE (black line) and after dSPE (red line).
78

Screening of target and non-target contaminants in human blood and urine
8 Data evaluation (suspect + non-target)
8.1 LC-MS This chapter describes the software and parameters applied and to implement some quality control by
reviewing the results of the target compounds analysed in the external standards and the IS spiked into all samples, all processed by the same methods.
Figure 20: Scheme of data evaluation for LC-MS analysis.
79

Screening of target and non-target contaminants in human blood and urine
The evaluation scheme applied in this project is given in Figure 20 and was adapted from Hug et al. [80]
with some changes. Exact mass chromatogram files from the full scan analysis with the LC-Orbitrap system of samples, standards and method blanks were imported into the open access program MZmine
2.10 [164] for the generation of peak lists. Mass detection with a noise cut-off of 200 was followed by a
FTMS shoulder peak detection assuming a mass resolution of 100 000 (the actual resolution depends strongly on the mass). Chromatograms were build using a minimum time span of 0.1 minutes for blood
samples and 0.2 minutes for urine samples (higher values tested took away too many isotopic peaks that
were very narrow), a minimum height of 5000 a.u. and a mass tolerance of 0.002 m/z. Resulting peaks were smoothed with a filter width of 7 and deconvoluted using the local minimum search
(chromatographic threshold 30%, search minimum in retention time range 0.2 min, minimum relative
height 5%, minimum absolute height 5000, minimum ratio of peak top/edge 2 and retention duration range 0.1 to 10 minutes). Using the retention normalization the retention times of all samples were
normalized against each other taking a mass tolerance of 0.001 m/z, retention time tolerance of 0.2 and
a minimum standard intensity of 500,000 and 100,000 for positive and negative mode, respectively. The resulting peak lists were aligned by the join aligner, setting the mass tolerance to 0.002 m/z and the
retention time tolerance to 0.5 min. The weighing did not play any role as no differences in results were
observed with tests of 1:1 and 100:1. Six aligned peak lists were conducted, for urine DI, urine QuEChERS and blood sample extracts, each in negative and positive mode. The aligned peak lists contained from 11
300 up to 39 000 peaks.
In MZmine the aligned peak lists were searched for the IS list, the target list and the suspect list, each contained in a separate csv file, using the “compare against custom database” option. The results were
added into the “identity” column of the aligned peak list. One problem here is that if the identity is
already defined as being a target or an IS, a possible suspect with the same mass will not be listed (as the peak is already defined). Thus each time 3 aligned lists were build, each searched for IS+targets, suspects
and HMDB suspects (human metabolite database suspects – extracted from the Human Metabolite
Database: www.hmdb.ca/). The lists were then copied into excel files and the identity columns were combined into one, containing all information from the three lists.
The number of detected IS and target compounds in the aligned lists is given in Table 14. All IS were
detected in all analysed external standards. Only 4 of the 15 IS were not detected in all analysed samples. Chlormequat-d9 was not found in some of the urine samples due to the low retention time and possible
ion suppression. For the other 3 it might have been a shift in retention time or mass, so that MZmine did
not find them, or they were suppressed by matrix effects. Average recoveries with standard deviations in the different matrices are depicted in the Annex in Figure A 2. All target analytes were found in the
external standards. Detections of target analytes in the samples are described in section 9.1.
80

Screening of target and non-target contaminants in human blood and urine
Table 14: Internal standards detected after MZmine peak list alignment.
compound ESI mode
blood
RT / detected
urine: DI
RT / detected
urine: QuEChERS
RT / detected
PFOS-13C4 -
27.5 all samples + stds 27.5-29
all samples + stds 30 all samples + stds
PFBA-13C3 - 16.3 all samples + stds 16-19 all samples + stds 17-19 all samples + stds triclosan-d3 - 26.8 all samples + stds 27.3 all samples + stds 26.9 all samples + stds benzotriazole-d4 +/- 15.9 all samples + stds 16.1 all samples + stds 15.9 all samples + stds MBP-d4 +/- 22.9 all samples + stds 23.3 all samples + stds 23 all samples + stds chlormequat-d9 + 2.3 all samples + stds 2.4 4 samples (1 con+
3 decon) + stds 2.3 all samples (except
5) + stds p-toluene-sulfonamide-d4
+ 16.1 all samples (except 3) + stds
16.3 only stds 16.1 all samples + stds
carbendazim-d4 + 13.3 all samples + stds 13.4 all samples + stds 13.2 all samples + stds benzophenone-3-d5 + 25.6 all samples + stds 26.1 all samples
(except 5) + stds 25.7 all samples + stds
PhIP-d3 + 17.4 all samples + stds 17.6 all samples + stds 17.4 all samples + stds cotinine-d3 + 2.5 all samples + stds 3.7 all samples + stds 2.4 all samples + stds tri-butyl-d27-phosphate
+ 26.5 all samples + stds 27.0 all samples + stds 26.6 all samples + stds
tonalide-d3 + 28.6 all samples + stds 29.3 only stds 28.7 all samples (except 2) + stds
diazinon-d10 + 25.9 all samples + stds 26.4 all samples + stds 26 all samples + stds atrazine-13C3 + 22.7 all samples + stds 23.1 all samples + stds 22.8 all samples + stds
The aligned lists were imported into an R script designed for further processing. In a first step peaks
showing a peak shape resulting from integration of background noise were filtered out if their area/height ratio was above 100. In a second step blank peaks were subtracted from the peak lists, if the
intensity in a sample was lower than 2 times the blank intensity and if the area was lower than 2 times
the blank area. In a final step peaks with an unreasonable mass defect for singly charged ions were deleted. The mass defect describes the difference between the monoisotopic mass of a compound and its
nominal mass [165, 166].
Table 15 shows the number of peaks deleted for the different samples in each step, taken the blood analysis in ESI positive and negative mode as an example. From the R script peak lists for each sample
and standard run were generated and additionally one peak list with all samples still aligned. The
aligned list containing all 16 samples and two standards included 36 702 and 11 830 peaks after MZmine and 23 323 and 9 037 peaks after peak removal using the R script, for the positive and negative
mode, respectively.
81

Screening of target and non-target contaminants in human blood and urine
Table 15: Number of peaks present after MZmine and after each removal step using the R script for the analysis of a standard and a blood sample (W17) in ESI positive and negative mode.
standard ESI pos
standard ESI neg
sample W17 ESI pos
sample W17 ESI neg
after MZmine 4813 1180 7790 3290 area/height ratio
4400 1097 7448 3237
intensity blank
3347 776 5678 2642
area blank 3347 776 5678 2642 mass defect 2919 714 5010 2557
A suspect search was conducted using the aligned peak lists. Suspects identified by MZmine were further
processed if they were detected in at least 5 of the 16 samples and if they showed a reasonable peak shape.
The R package “nontarget” was used to search for isotope patterns. Here, each sample has to be
processed separately; therefore this was only done for two samples, namely W17 and M14. Peaks showing Cl, Br, N and S isotopes and being present with intensities above 100,000 (for urine samples in
negative mode peaks with intensities above 500,000) were further processed.
m/z values for the suspects and the peaks with Cl, Br, N and S isotopes were taken to conduct MS/MS fragmentation measurements, details see section 7.2.3.1. Samples W17 and M14 were analysed again
using the LC-Orbitrap in HR-MS/MS mode. All suspects and peaks with Cl or Br isotope pattern of which
HR-MS/MS spectra could be recorded were processed further. Peaks were looked up in the original chromatogram again and the relative intensities of the isotopic peaks were determined.
All suspects for which the fragmentation could not be explained by the structure were sorted out. Here
MetFrag was applied for the in-silico generation of mass spectra. This software calculates mass spectra from structures and compares them to measured ones [74]. Thus the input parameters were the analysed
molecular m/z value and the fragment ions detected at different collision energies. MetFrag searches for
compounds with the given molecular mass in different databases. The first one is KEGG (Kyoto Encyclopedia of Genes and Genomes - http://www.genome.jp/kegg/ - which, amongst others lists small
molecules with biological roles like organic acids, lipids, carbohydrates etc.), representing naturally
occurring compounds. This one was used first for the in-silico fragmentation to rule out the possibility of the suspect rather being a natural product. However, some of the suspects were already included in the
KEGG database. The second option was the search in PubChem, which mostly results in very large
numbers of compounds fitting the molecular masses. These were then all in-silico fragmented and the results are listed as matching scores and fragment peaks identified. For the remaining suspects that
seemed interesting reference standards were obtained if available. Results from the suspect search can
be found in section 9.2.1.
In the non-target analysis possible molecular formula for the m/z values were determined allowing the
elements C, H, O, P, N, S and Cl or Br depending on the isotope pattern in Xcalibur (analysis software
from Thermo) with a 7 ppm mass tolerance. The resulting molecular formula were put into the program Seven-Golden-Rules, which tests for plausible molecular formulas according to [71]. The remaining
molecular formulas were searched in the database ChemSpider and if interesting structures were found,
it was further investigated, results see section 9.2.2.
82

Screening of target and non-target contaminants in human blood and urine
8.2 GC-MS For the non-target evaluation of GC-MS data the open access program AMDIS was used for deconvolution
of mass spectra and search in the commercial NIST (version 11) and WILEY (version 9) spectral libraries. First chromatograms were deconvoluted and searched against the target and internal standard library.
Settings used can be found in Table 16. All five IS were found in all standards and samples with two
exceptions. 13C6-hexachlorobenzene was not detected by AMDIS in sample W79, although it was found by manual search. The peak shape however was not good, which might be the reason why AMDIS did
not deconvolute the peak. The other exception is 4-NP-d4, which was not found in the last standard run
for the same reason as for 13C6-hexachlorobenzene. Section 9.1.2 shows the results for the detection of target analytes in the samples. The target search was followed by a search in the NIST library of the
peaks not yet identified by the target search (parameters for this are also listed in Table 16). The results
were checked and can be found in section 9.3.
Table 16: AMDIS analysis settings for non-target analysis of GC-MS data.
Parameter group Parameter Settings
Identification Minumum match factor 80 Multiple idendifications On Show standards Off Only reverse search Off Type of analysis Use RI Calibr. Data + Internal Std. RI window 10 + 0 x 0.01 RI Match factor penalties Average Maximum penalty 25
Deconvolution Component width 20 Omit m/z On, 0 Adjacent peak subtraction Two Resolution High Sensitivity Low Shape requirements Medium
Search NIST library parameters Hits reported per search Min match factor: 80 Use instrument m/z limits On Build combined results On Libraries NIST and Wiley Select from Only unidentified components
Consider all models: On Number of components searched All above threshold: 0% Search mode Normal identity
9 Analysis of real samples
Human urine and blood samples for non-target screening were kindly provided by the German
Environmental Specimen Bank. Urine and blood samples were collected from students in Greifswald in
2013. Eight samples from male and eight samples from female students were supplied on dry ice, urine
83

Screening of target and non-target contaminants in human blood and urine
and blood stemming from the same persons. Upon arrival samples were frozen at -80°C. For sample
preparation they were thawed at room temperature, aliquots were taken and directly extracted.
For the non-target screening 5 µL of IS mixture was added for DI of 1 mL of urine and 50 µL before the
ACN addition during QuEChERS extraction of 10 mL of urine. Of the 16 samples, 4 were processed
without a deconjugation step (con samples) and 16 samples with a deconjugation step (decon samples). The 16 samples processed with a deconjugation step were spiked with the IS and also with 4-MeUmb-
glucuronide and 4-MeUmb-sulfate. Additionally one method blank (consisting of bidistilled water) was
processed without and three method blanks were processed with a deconjugation step. 5 mL of the blood samples were spiked with 50 µL of IS mixture. Additionally three method blanks (consisting of
bidistilled water) were processed. The extraction procedures were described in section 7.2.4.
9.1 Target analysis
9.1.1 LC-MS
The target analytes were qualitatively detected using MZmine 2.10. Only an approximate quantification was conducted using a single point calibration in Xcalibur, results are listed in Table 17. Compounds
detected in some or all urine samples were 2-ethoxyethyl acetate, HEMA, diphenyl phosphate, the
phthalate metabolites, triclosan, ethyl paraben, benzophenone-3 and estrone-sulfate. All of these compounds have been detected in urine previously.
84

Screening of target and non-target contaminants in human blood and urine
Table 17: LC-MS target analytes detected in blood and urine samples, with approximate concentrations in ng/mL; nd: not detected.
compound detected blood detected urine DI detected urine QuEChERS
2-ethoxyethyl acetate - 3 samples: M14, Md28, Md125*: 1.6 – 15.3 ng/mL
nd
HEMA - 1 sample: M14: 9.6 ng/mL nd TCEP 1 sample (peak height >2x
method blank peak height): M125: 0.23 ng/mL
- -
PhIP blank - - pyrimidinol - blank blank diphenyl phosphate - 7 samples: W17, W38, Wd17,
Wd38, Wd46, Wd57, Wd 84, Wd122, Md21: 0.1-0.3 ng/mL
1 sample: Md21: 0.4 ng/mL
PFOA all samples: 0.6 – 4.4 ng/mL - - PFTDA sample M 14: 0.8 ng/mL - - PFOS all samples: 0.9 – 7 ng/mL - - MEP - all samples (except Md118): 2.3
- 163 ng/mL all samples (except Wd121, Md118, Md125): 2.5 – 57 ng/mL
MBzP - 4 samples: Wd17, Wd38, Md21, Md55: 0.5 – 9.5 ng/mL
1 sample: Wd17: 2.1 ng/mL
MBP - blank blank
triclosan nd 3 samples: W17, Wd17, Md14,
Md105: 3.3 – 145 ng/mL 3 samples: W17, Wd17, Md14, Md105: 1.6 – 62 ng/mL
ethyl paraben
nd 5 samples: Wd17, Wd38, Wd121, Wd129, Md21: 11 – 310 ng/mL
samples: M21, Wd17, Wd38, Wd57, Wd121, Wd129, Md21: 6.6 – 316 ng/mL
butyl paraben nd 2 samples: Wd17, Wd121: 4.4 –
11 ng/mL 2 samples: Wd17, Wd121: 6.3 – 13 ng/mL
tetrachlorosalicylanilide sample M 14: 0.3 ng/mL - - benzylQUAT blank - -
tetraoxadodecan - blank nd benzophenone-3 - 1 sample: Md21: 272 ng/mL 2 decon samples: Wd129, Md21:
0.8 – 111 ng/mL estrone-sul - 2 samples: W38, M14: 0.4 – 0.7
ng/mL 2 samples: M14, M21: 1 – 2.2 ng/mL
estrone-gluc - 1 sample: W38: 99 ng/mL nd
* W stands for samples from women, M for samples from men. An additional d behind it means that the sample has been analysed after a deconjugation step.
Compounds detected in some or all blood samples were TCEP, PFOA, PFTDA, PFOS and
tetrachlorosalicylanilide. Results from the quantitative analysis of blood samples by MRM measurements using the LC-QTrap showed detections below the quantification limit for cinnamate, ethyl paraben and
MeFOSA. The perfluorinated compounds PFOS and PFOA, however, were detected in all samples and
could be quantified, see Table 18. The concentrations are in general agreement with the concentrations derived by the one-point calibration using HR-MS analysis. A recent analysis of samples from the
Environmental specimen bank from 2001-2010 showed concentrations of PFOS with 4 ng/mL in plasma
85

Screening of target and non-target contaminants in human blood and urine
and PFOA with concentrations of 4.8 – 6.3 ng/mL in plasma with a decreasing trend [167]. The levels
found here in whole blood from 2013 are thus in agreement with the ones from earlier years.
Table 18: Concentrations of detected target analytes in human blood samples in ng/mL, analysed by the LC-QTrap MRM method. Values in brackets are below the lowest calibration level, but showed good peak shapes.
sample PFOA PFOS
W 17 2.8 3.4 W 38 2.0 14 W 46 2.8 3.1 W 57 3.3 4.8 W 84 (0.3) 2.6 W 121 (0.9) 2.5 W 122 1.1 2.8 W 129 1.5 4.1 M 14 0.5 1.8 M 21 (0.9) 3.0 M 28 (0.5) 2.1 M 55 1.3 4.7 M 79 1.4 3.6 M 105 1.1 3.2 M 118 1.3 6.9 M 125 (0.8) 5.7
9.1.2 GC-MS
Qualitative results from the GC-MS measurements detected only two compounds in the blood samples,
namely dibutylhydroxytoluene and naphthalene. Dibutylhydroxytoluene was detected in 13 of 16
samples. This compound is widely used as antioxidant in food, plastics and cosmetics and has been monitored in occupational monitoring [104]. It has been detected in human breast adipose tissue during
a non-target screening by Hernandez et al. [29]. Its approximate concentration calculated by one-point-
calibration ranges from 6.9 to 15 ng/mL in the 13 samples. It is discussed further in section 9.3. Naphthalene was detected in 3 samples (W17, M14, M125) with low abundances, calculated
concentrations were about 2-3 ng/mL. It has also been detected as the most abundant PAH in blood
samples by Pleil et al. 2010 [145].
86

Screening of target and non-target contaminants in human blood and urine
9.2 Non-target analysis – LC-MS
9.2.1 Suspects
The numbers of suspects identified by exact mass search in MZmine and present in 5 or more samples
are listed in Table 19. From these suspects those with a recorded MS/MS fragment spectrum and additionally interesting ones like the perfluorinated carboxylates were picked out and processed further.
Table 20 lists the tentatively identified suspects. Those that might have environmental and health
relevance will be discussed more detailed in the following chapters, while the others are mostly endogenous compounds or stem from food consumption.
Table 19: Number of suspects detected by MZmine, with recorded MS/MS spectra, and tentatively identified ones.
Number detected
recorded MSMS
tentatively identified
Urine ESIpos 112 36 6 Urine ESIneg 64 44 11 Blood ESIpos 20 13 6 Blood ESIneg 43 29 11
87

Screening of target and non-target contaminants in human blood and urine
Table 20: Suspect chemicals tentatively identified in urine and blood samples.
mode suspect m/z comment Urine
- methyl paraben 151.0401 see discussion in section 9.2.1.1 - propyl paraben 179.0712 see discussion in section 9.2.1.1 - enterodiol 301.1446 MetFrag: explains 9 fragment ions, thus tentatively identified - phenylglyoxylic acid 149.0246 MetFrag: ranked first (KEGG 3 hits, PC 167 hits), explaining 2
main fragment ions, thus tentatively identified - dihydroxybenzophenone 213.0556 see discussion in section 9.2.1.2 - trihydroxybenzophenone 229.0503 see discussion in section 9.2.1.2 - tetrahydroxybenzophenone 245.0452 see discussion in section 9.2.1.2 - 3,4-dihydroxy-
chlorobenzene 142.9906
see discussion in section 0
+/- hippuric acid 180.0651 / 178.0511
MetFrag: pos: 4 hits in KEGG, ranked first, explains 3 main fragment ions; neg: 4 hits in KEGG, ranked first, explains all 4 fragment ions, thus tentatively identified
+/- daidzein 255.0649 / 253.0508
MetFrag: pos: the first 5 ranks are dihydroxyflavones (one of them being daidzein), explaining 5/6 fragment ions (most of the major ones); neg: 7 explained fragment ions
+/- enterolactone 299.1275 / 297.1133
MetFrag: pos: first hit in KEGG with 6 main fragment ions explained, listed in HMDB and detected in urine; neg: explains 12 fragment ions
+ triethyl phosphate 183.0779 see discussion in section 9.2.1.4 + p-aminophenol 110.0596 see discussion in section 9.2.1.5 + cotinine 177.1019 see discussion in section 9.2.1.6
Blood - (benzophenone-4 ) 307.0273 see discussion in section 9.2.1.2 - salicylic acid 137.0245 RT: 19.9 - hippuric acid 178.0507 RT: 13.9 - estrone 3-sulfate 349.1105 MetFrag: 2 hits in KEGG, estrone-sul explains the fragment ion
269.1545 with 0.7 ppm, the other does not explain it; RT: 22.5 (in urine DI/Q: 24.6)
- estrone 3-glucuronide 445.1891 RT: 20.6 (in urine DI/Q: 22) - perfluorohexanesulfonic
acid 398.9355 see discussion in section 9.2.1.7
- perfluoroheptanesulfonic acid
448.9321 see discussion in section 9.2.1.7
- perfluorononanoic acid 462.9623 see discussion in section 9.2.1.7 - plus other PFCAs: C10-C13 see discussion in section 9.2.1.7 + triethyl phosphate 183.0781 see discussion in section 9.2.1.4 + di-cresyl phosphate 278.0699 see discussion in section 9.2.1.4 + diethylhexyl phosphate 323.2347 see discussion in section 9.2.1.4 + 2-amino-1-methyl-6-(4-
hydroxyphenyl)imidazo[4,5-b]pyridine
241.1072 MetFrag: both the 4-OH-PhIP and 2-Hydroxyamino-PhIP explain the fragment ion 209.0923
88

Screening of target and non-target contaminants in human blood and urine
mode suspect m/z comment + N,N'-diacetylbenzidine 269.1288 MetFrag: 3 hits in KEGG, all explain the 3 main fragments (the
other compounds were N-butyl-beta-carboline-3-carboxylate and lysergic acid)
+ oleic acid 283.2635 MetFrag: 5 hits in KEGG, oleic acid explains 3 main fragment ions
9.2.1.1 Parabens
Both ethyl and butyl paraben were detected and quantified in urine samples during the target analysis. Additionally by the suspect screening methyl and propyl paraben were likely detected in urine samples.
Their RTs fit very well to the ones of ethyl and butyl paraben, see Figure 21. There were, however, also
many other peaks present with the same masses in the chromatogram. Thus it would be hard to determine parabens without knowing the exact RTs during a suspect screening of urine. For propyl
paraben also an MS/MS spectrum could be recorded. Applying the in-silico fragmentation with MetFrag
isopropyl paraben is ranked first of 3 compounds listed in KEGG, explaining 4 of the 5 fragment ions (the other two compounds explain 3 and 2 fragment ions). By using PubChem as database, iso- and n-propyl
paraben are on rank 5 and 6 (of 1655 compounds). Methyl paraben was detected in 10 samples, while
propyl paraben was detected in 12 samples. For a quantification and final identification reference standards would be necessary. However, their peak heights compared to ethyl and butyl paraben suggest
similar concentrations around a few ng/mL. Parabens are widely used as preservatives in cosmetics,
pharmaceuticals and food and concentrations in 2500 samples from US citizens showed concentrations in the low ng/mL range [130].
89

Screening of target and non-target contaminants in human blood and urine
Figure 21: Extracted chromatograms of the four detected parabens (methyl, ethyl, propyl and butyl paraben) in the sample W17 (deconjugated extract) and a standard, showing matching RTs.
Another suspect detected in urine samples by MZmine was ethyl-protocatechuate, a metabolite of ethyl paraben. The m/z value of 181.0505 was found in all urine extracts analysed in ESI negative mode. Due
to the detection of ethyl paraben the presence of its metabolite might be reasonable. However, MZmine
also defined the peak as being the metabolite homovanillic acid listed in the Human Metabolite Database. This metabolite stems from human dopamine and is released via the urine.
90

Screening of target and non-target contaminants in human blood and urine
Figure 22: HR-MS/MS spectra of 181.05, left: HCD 50, right: CID 35 with tentatively identified fragment ions for homovanillic acid.
Using MetFrag the fragmentation of these two compounds was compared by taking the recorded HR-
MS/MS spectra of this compound (see Figure 22). For the parent mass 182.0574 and PubChem as database reference 867 hits resulted. MetFrag was set to [M-H] mode and negative charge, applying a
m/z variation of 0.005 absolute and 10 ppm. For the merged spectrum homovanillic acid had a score of
0.971 and 4 explained fragments, while ethyl protocatechuate had a score of 0.784 with 2 explained fragments. Looking at the MetFrag results the peak with m/z value of 181.0505 is more likely to be
homovanillic acid than ethyl protocatechuate.
This example shows the importance to consider naturally occurring substances and their metabolites during non-target screening of biological samples. One solution might be to take the HMDB as a
reference and to include the in-silico fragmentation of compounds listed in the KEGG database. In the
above example 8 compounds with the m/z 181.0505 are listed in the KEGG database, and homovanillic acid is one of them. This at least gives a hint about the presence of endogenous substances with
matching exact masses.
9.2.1.2 UV-filters
Benzophenone-4 was identified as a suspect by MZmine analysed in ESI negative mode. It was detected in 5 blood samples, W17, W46, M14, M105 and M118. MetFrag counts 598 hits for the parent mass using
PubChem as reference database. Benzophenone-4 had a score of 0.863 with 1 explained fragment
(227.0710) for the CID 35 spectrum of the sample. There were, however, 130 additional compounds explaining this one fragment ion resulting from a loss of SO3. As benzophenone-4 was available as a
reference standard, it was analysed in data-dependent HR-MS/MS mode together with one sample to
check the RT and fragmentation pattern. The RT was 21.57 and 21.66 min in the reference standard and the sample, respectively. The intensity of the m/z value 307.0273 was 100-fold lower in the sample
compared to the standard (5 µg/mL). A HR-MS/MS spectra containing several fragment ions was observed
for the reference standard, while in the sample the only fragment ion was 227.0710, see Figure 23. As neither of the other fragment ions nor the molecular ion observed in the standard was visible in the
sample, we cannot identify the peak as being benzophenone-4.
91

Screening of target and non-target contaminants in human blood and urine
Figure 23: HR-MS/MS spectra of m/z 307.03 in the blood sample W17 (first row) and a reference standard containing benzophenone-4 (second row). Left: HCD 90, right: CID 35.
Due to the detection of benzophenone-3 in urine during the target analysis, we also checked the urine samples again for any UV-filters and their metabolites. Some of them were detected as suspects in less
than 5 samples, thus they did not appear in the original search when setting the limit to detections in at
least 5 samples. However, after checking the raw data again, di-, tri- and tetrahydroxybenzophenone could all be tentatively identified in the sample Md21. The RTs for the three compounds fitted very well
with each other, tetrahydroxybenzophenone eluting first with 19.6 and 21 minutes (probably 2 isomers),
trihydroxybenzophenone with a RT of 21.66 min and dihydroxybenzophenone with 23.6 min. Tetrahydroxybenzophenone was detected in several samples, where the first peak was found in 7
samples and the second peak only in 3 samples. Dihydroxybenzophenone was detected both in the
conjugated and the deconjugated analysis of sample M21, however, the intensity in the still conjugated extract was about 50 fold lower than the one in the deconjugated sample. Thus it seemed that the
hydroxybenzophenones are most probably present as conjugated forms in the samples. Therefore the
sulfate and glucuronide metabolites of the di-, tri- and tetrahydroxybenzophenones were calculated and searched for in the raw data of the unconjugated extracts. This way, both the sulfate and the
glucuronide metabolite of dihydroxybenzophenone were detected in the sample M21 when analysed by
DI (no detection during QuEChERS extraction, as expected from method development results), with RTs
92
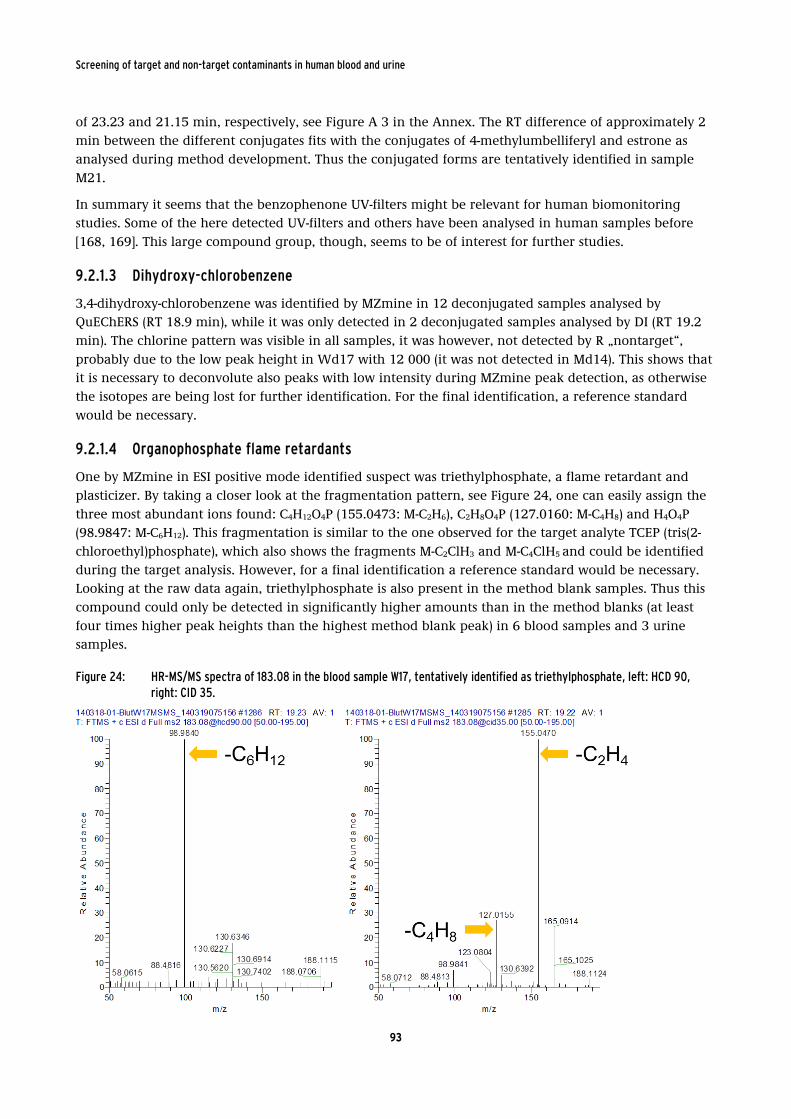
Screening of target and non-target contaminants in human blood and urine
of 23.23 and 21.15 min, respectively, see Figure A 3 in the Annex. The RT difference of approximately 2
min between the different conjugates fits with the conjugates of 4-methylumbelliferyl and estrone as analysed during method development. Thus the conjugated forms are tentatively identified in sample
M21.
In summary it seems that the benzophenone UV-filters might be relevant for human biomonitoring studies. Some of the here detected UV-filters and others have been analysed in human samples before
[168, 169]. This large compound group, though, seems to be of interest for further studies.
9.2.1.3 Dihydroxy-chlorobenzene
3,4-dihydroxy-chlorobenzene was identified by MZmine in 12 deconjugated samples analysed by QuEChERS (RT 18.9 min), while it was only detected in 2 deconjugated samples analysed by DI (RT 19.2
min). The chlorine pattern was visible in all samples, it was however, not detected by R „nontarget“,
probably due to the low peak height in Wd17 with 12 000 (it was not detected in Md14). This shows that it is necessary to deconvolute also peaks with low intensity during MZmine peak detection, as otherwise
the isotopes are being lost for further identification. For the final identification, a reference standard
would be necessary.
9.2.1.4 Organophosphate flame retardants
One by MZmine in ESI positive mode identified suspect was triethylphosphate, a flame retardant and
plasticizer. By taking a closer look at the fragmentation pattern, see Figure 24, one can easily assign the
three most abundant ions found: C4H12O4P (155.0473: M-C2H6), C2H8O4P (127.0160: M-C4H8) and H4O4P (98.9847: M-C6H12). This fragmentation is similar to the one observed for the target analyte TCEP (tris(2-
chloroethyl)phosphate), which also shows the fragments M-C2ClH3 and M-C4ClH5 and could be identified
during the target analysis. However, for a final identification a reference standard would be necessary. Looking at the raw data again, triethylphosphate is also present in the method blank samples. Thus this
compound could only be detected in significantly higher amounts than in the method blanks (at least
four times higher peak heights than the highest method blank peak) in 6 blood samples and 3 urine samples.
Figure 24: HR-MS/MS spectra of 183.08 in the blood sample W17, tentatively identified as triethylphosphate, left: HCD 90, right: CID 35.
93

Screening of target and non-target contaminants in human blood and urine
Another suspect identified by MZmine is diethylhexylphosphate detected in all blood samples, but not in
any method blanks. The recorded MS/MS spectra did not contain any fragment ions, probably due to too low concentrations. However, the 13C isotope peak was present at about 14% of the molecular ion and
the RT at 27.5 min is much later than the one of triethylphosphate with 19.5 min due to its longer
carbon chains.
Due to the detection of three phosphate flame retardants during target and suspect search we looked for
further compounds only present in less than 5 samples. Tributylphosphate was detected in all samples,
but was also present in all method blanks. Only two samples showed 2 times higher peak heights than the highest peak in the method blanks. Also TCPP (or tris(2-chloro-1-methylethyl)phosphate) was present
in all method blanks. Thus during the analysis of phosphate flame retardants care has to be taken
regarding blank concentrations. At least for TCPP and tributylphosphate the blank contamination seemed to stem mostly from the LC system and the solvents used, as already high peaks were detected in
simple solvent injections.
One additional in blood tentatively identified compound is dicresylphosphate, where no detections were present in the method blanks. A peak at 19.5 minutes was detected in two samples (W121 and M28),
while another peak at 20.6 min was detected in M79. These different RTs could be due to the different
isomers of this compound (di-m-, di-o- and di-p-cresylphosphate). The 13C isomer was detected with about 13% and the mass deviation was -1.25 ppm. No MS/MS spectrum could be obtained due to low peak
heights of 23 000 to 84 000.
In summary many different organophosphate flame retardants seem to be present in human blood samples, which might be reasonable due to their intense use after phasing out the brominated flame
retardants. So far, mostly the diester metabolites have been analysed in human urine samples [170-172],
to the best of our knowledge no flame retardants have been analysed so far in human blood samples.
9.2.1.5 Aminophenol
Aminophenol was identified by MZmine in all urine samples and the peaks were less intense in the still
conjugated samples than in the deconjugated ones. When looking at the MS/MS fragments and using
MetFrag for in-silico fragmentation, 4 hits appear when using KEGG as the database. Of these 4 three are the different isomers, p-, m- and o-aminophenol, which all explain 5 of the 8 detected fragments, while
the other compound only explains 2 fragments. Due to the wide usage of aminophenols as hair dye, in
the production of dyes for textiles and constituents in pharmaceuticals and due to them being metabolites of anilin, anisidin, nitrobenzol and degradation products of paracetamol it seems likely for
them to be present in human urine samples. However, for the final identification, reference standards
are necessary.
9.2.1.6 Cotinine
Cotinine was detected in 9 urine samples analysed by the QuEChERS method. It showed the same RT as
cotinine-d3 and showed higher peaks in the deconjugated extracts compared to the still conjugated
extracts, Figure 25. The highest values were found in samples M14, 118 and 125, which were the smokers. Peak heights in non-smokers were between a factor 2 and 20 lower than in the samples from
smokers.
94

Screening of target and non-target contaminants in human blood and urine
Figure 25: Chromatograms of cotinine and cotinine-d3 in a urine sample of a smoker, conjugated extract (left) and deconjugated extract (right), showing the same RT of the compound and the IS and lower peak height in the conjugated sample extract.
9.2.1.7 PFSAs
Perfluorononanoic acid was identified in blood samples as a suspect by MZmine in ESI negative mode, however, due to relatively low abundance in the samples, no MS/MS spectra could be recorded with the
method used. As PFNA and other homologues have already been detected in human blood samples (e.g.
[173]) and the RT fits well into the homologues row of other perfluorinated alkyl acids, it was next to the other homologues tentatively identified. PFOA and PFTDA were as targets also analysed in the external
standards and their RT is the same as in the samples. Thus in sample M14 perfluorocarboxylic acids with
chain length of C8 to C14 could be tentatively identified, see Figure 26.
95

Screening of target and non-target contaminants in human blood and urine
Figure 26: Extracted ion chromatograms of tentatively identified perfluorinated carboxylic acids in sample 14, showing matching RTs of the homologues row of C8 to C14 carbon chain lengths.
The same can be applied to the perfluorinated sulfonic acids, where perfluorohexane sulfonic acid and
perfluoroheptane sulfonic acid have been identified by MZmine as suspects. Looking at the target perfluorooctane sulfonic acid (see Figure 27), one can conclude the same as for the perfluorocarboxylic
acids.
96

Screening of target and non-target contaminants in human blood and urine
Figure 27: Extracted ion chromatograms of tentatively identified perfluorinated sulfonic acids in sample M14 showing matching RTs of the homologues row of C6 to C8 carbon chain lengths.
9.2.2 Non-targets
Numbers of non-target peaks in the two with R nontarget processed samples W17 and M14 showing a Cl
or Br isotope pattern and intensities >100,000 are listed in Table 21. For these ions molecular formulas were generated in Xcalibur and between 2 and more than 400 formula were obtained using a 10 ppm
mass tolerance. By application of the Seven-Golden-Rules software these were reduced to mostly 1 or 2
plausible ones. The resulting formulas were searched for in ChemSpider. Lists of 1 up to several hundred structures resulted. Many structures could be sorted out due to their non-ionisability in the respective ion
mode. Additionally, most of the structures had less than 5 references, thus it was not possible to retrieve
any further information about their production and usage. One explanation for this is that the detected peaks are metabolites that have not been described or are simply not present in the database
ChemSpider. Thus only two compounds could be identified further, as described below. To be able to
identify more of the detected peaks, it would be necessary to go back to the suspect list and calculate metabolites of the compounds containing Cl or Br. The resulting masses could then be compared to the
m/z values detected. This, however, was beyond the scope of this project.
Table 21: Numbers of detected peaks in the samples W17 and M14 with a Cl or Br pattern.
Urine Blood DI QuEChERS ESIpos 11 6 12 ESIneg 32 20 24
One search in ChemSpider resulting in a plausible hit was the chlorothalonil metabolite
4-hydroxy-chlorothalonil with 18 references. A reference standard of this compound was available and
97

Screening of target and non-target contaminants in human blood and urine
thus the RTs, isotope pattern and MS/MS spectra were compared. The RTs were similar with 25.7 and
25.9 min in a solvent standard and in the blood extract, respectively. The RT shift of 0.2 minutes is due to a broad peak and a different maximum. The isotope pattern in the standard and the blood extract
were identical, showing the distinctive isotope pattern of 3 Cl ions. The HR-MS/MS spectra in the sample
did not show extensive fragmentation of the molecular ion, except with the highest collision energy HCD 120, see Figure 28. However, in the sample the MS/MS spectra contained only background noise, due to
the lower abundance of the molecular ion. Due to the matching RT and isotope pattern, we consider this
non-target as identified. The peak was observed in all blood samples and a rough quantification using a one-point-calibration resulted in amounts of about 12 and 17 ng/mL in M14 and W17, respectively.
Figure 28: HR-MS/MS spectra of the blood sample W17 (first row) and a reference standard containing 4-hydroxy-chlorothalonil (second row). Left side: HCD 120, right side: CID 35.
One peak was detected in the urine sample M14 in negative mode with a m/z of 221.9557 and a Br isotope pattern. By taking the exact mass and the isotope pattern the only possible molecular formula
could be identified as C9H6ONBr (mass deviation of -1.35 ppm). By visual inspection a peak with the same
RT and Br isotope pattern was found in positive mode with a m/z of 223.9703. Thus the compound was ionisable both in positive and negative mode. When searching in ChemSpider for the molecular formula
98

Screening of target and non-target contaminants in human blood and urine
123 substances were listed. This list could be reduced to 34 substances by deleting all compounds that
were most probably not ionisable in both positive and negative mode (for example by sorting out all compounds where the O was present in the ring system, as an OH group is necessary for the compound
to be ionized in negative mode). From these 34 substances all except 3 were bromo-quinolinoles, see
Figure 29. The other three were listed with only 1, 4 or 8 references compared to up to 109 references for the bromo-quinolinoles. Possible precursors to the bromo-quinolinoles, bromo-quinolines are used as
intermediates in the production of pharmaceutical compounds [174], while derivatives of bromo-
quinolinoles are also applied as dyes for jeans and other cotton textiles [175]. Thus it seems reasonable that these compounds occur in human samples. However, a final identification by a reference standard is
necessary to confirm the finding. By checking the other samples the same peak was found in all urine
and also all blood samples, but it was not present in any of the blank samples.
Figure 29: Possible structures of the non-target peak detected with Br isotope pattern.
N
OHBr
NBr
OH
9.3 Non-target analysis – GC-MS Several non-target compounds could be tentatively identified using the program AMDIS. Seven of the detected compounds showed very good matches with their recorded mass spectra in NIST and their
occurrence in human blood samples was reasonable due to their usages.
The two phthalates dibutylphthalate and di(2-ethylhexyl)phthalate were detected in all samples, see Figure 30. In most studies phthalates metabolites are analysed in human urine and not in blood samples.
Their metabolites are also routinely analysed in the samples from the environmental specimen bank and
metabolites of both of these compounds are found in all samples; detailed concentrations can be searched for at the homepage of the German Environmental Specimen Bank:
www.umweltprobenbank.de. During the target analysis of the urine samples MBP - the metabolite of
dibutylphthalate - could not be analysed due to blank detections.
99
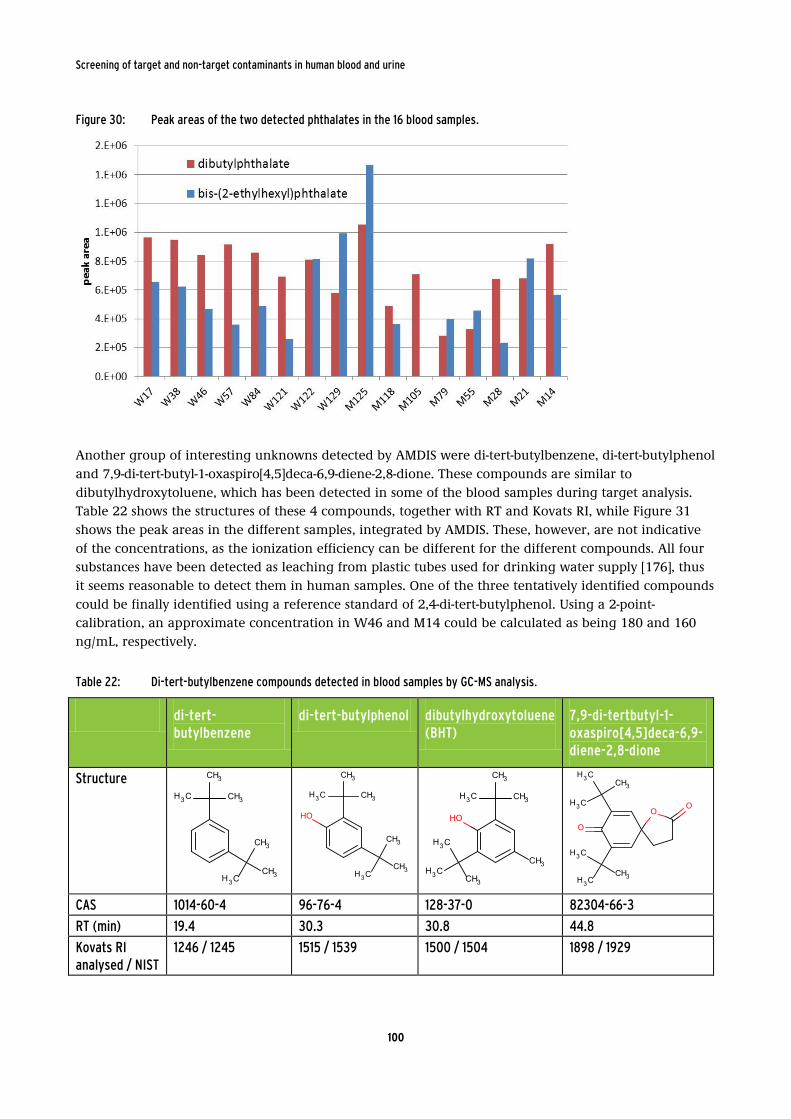
Screening of target and non-target contaminants in human blood and urine
Figure 30: Peak areas of the two detected phthalates in the 16 blood samples.
Another group of interesting unknowns detected by AMDIS were di-tert-butylbenzene, di-tert-butylphenol
and 7,9-di-tert-butyl-1-oxaspiro[4,5]deca-6,9-diene-2,8-dione. These compounds are similar to
dibutylhydroxytoluene, which has been detected in some of the blood samples during target analysis. Table 22 shows the structures of these 4 compounds, together with RT and Kovats RI, while Figure 31
shows the peak areas in the different samples, integrated by AMDIS. These, however, are not indicative
of the concentrations, as the ionization efficiency can be different for the different compounds. All four substances have been detected as leaching from plastic tubes used for drinking water supply [176], thus
it seems reasonable to detect them in human samples. One of the three tentatively identified compounds
could be finally identified using a reference standard of 2,4-di-tert-butylphenol. Using a 2-point-calibration, an approximate concentration in W46 and M14 could be calculated as being 180 and 160
ng/mL, respectively.
Table 22: Di-tert-butylbenzene compounds detected in blood samples by GC-MS analysis.
di-tert-butylbenzene
di-tert-butylphenol dibutylhydroxytoluene (BHT)
7,9-di-tertbutyl-1-oxaspiro[4,5]deca-6,9-diene-2,8-dione
Structure CH3
H3C CH3
CH3H3C
CH3
CH3
H3C CH3
CH3H3C
CH3
HO
CH3
H3C CH3
CH3
HO
H3C
H3C
CH3
H3C
H3C
CH3
H3C
H3C
CH3
O
OO
CAS 1014-60-4 96-76-4 128-37-0 82304-66-3 RT (min) 19.4 30.3 30.8 44.8 Kovats RI analysed / NIST
1246 / 1245 1515 / 1539 1500 / 1504 1898 / 1929
100

Screening of target and non-target contaminants in human blood and urine
Figure 31: Peak areas of the four different tentatively identified di-tert-butylbenzenes.
Furthermore, tetraglyme was detected in all samples, see Figure 32. The substance triglyme or triethylenglycol dimethylether (tetraoxadodecan) (CAS: 112-49-2) has only been analysed for in the urine
samples during LC-MS analysis, where it could not be detected due to blank detections. A final
identification of tetraglyme was possible by the repeated analysis of W46 and M14 and a reference standard of tetraglyme. The approximate concentration calculated by one point calibration in both
samples was 300 ng/mL.
Figure 32: Peak areas of tetragylme tentatively identified by GC-MS in all blood samples.
One more interesting tentatively identified substance is niacidamine (CAS: 98-92-0) or Vitamin B3 (listed
in the HMDB ID: 01406), which is present in some food items, but also widely used in cosmetics [177].
101

Screening of target and non-target contaminants in human blood and urine
The peak shape of this compound was not very good, thus AMDIS was not able to detect it in all samples,
although a manual check revealed the presence in all blood samples.
Additionally other substances resulting from food consumption have been tentatively identified, namely
benzaldehyde (HMDB ID: 06115, listed as additive in cosmetics and also food, used as denaturant,
flavoring agent, and as fragrance; expected in blood, but so far not quanitfied), hydroxy-benzaldehyde (HMDB ID: 11718, found in the benzoate degradation via hydroxylation, bisphenol A degradation,
toluene and xylene degradation, and biosynthesis of phenylpropanoids pathways), caffeine, theobromine
(cocoa consumption) and methyl salicylate (HMDB ID: 34172, present in beverages and used as artificial flavouring agent). As these compounds are not relevant in the context of environmental pollutants we
will not go into their detection in detail. However, the detections show that the developed method is
able to detect a wide range of compounds. On the other hand we are not able to distinguish between endogenous and exogenous compounds, making the data processing and identification process tedious.
102

Screening of target and non-target contaminants in human blood and urine
10 Summary and outlook
Within this project we developed and evaluated a non-target screening approach for human samples.
The sample preparation method QuEChERS was for the first time tested for the extraction of a wide range of environmental pollutants and metabolites from human urine and blood. This extraction
method together with a direct injection of urine was able to detect most of the tested target analytes.
Especially for the extraction of blood samples the recoveries were very good. Also the non-target measurement and data processing was able to detect all target analytes if present above certain
concentrations (typically in the low ng/mL range). Some of the target analytes could also be detected in
the human urine and blood samples from the German Environmental Specimen Bank. Both in blood and urine several suspect chemicals were tentatively identified by taking MS/MS spectra into account and in a
few cases even a final identification using reference standards was possible. Among the (tentatively)
identified compounds were four parabens, the UV-filter benzophenone-3 and three benzophenone metabolites, five organophosphate flame retardants, ten perfluoroalkyl acids, two phthalates and some
phthalate metabolites, four antioxidants used in plastic materials similar to dibutylhydroxytoluene (BHT),
and tetraglyme. It was further shown that using the isotopic information one non-target peak could be tentatively identified as 4-hydroxy-chlorothalonil and afterwards be verified using a reference standard.
Another peak showing a Br-pattern could be tentatively identified as being a bromo-quinolinole isomer.
The data evaluation process for the non-targets however, is very laborious. Therefore the preparation of suspect lists can be suggested as an important part of a non-target or suspect screening. Here it is an
advantage to collect additional information about the suspects like reports of previous detections,
production and application data besides the chemical information about structure and mass. After a positive detection due to peak findings for the exact mass this additional information can be used to
plausibilize the presence of the suspect. Using measured and in-silico generated MS/MS spectra (MetFrag)
the identified suspects can further be compared to other chemicals listed in databases.
With a further development of software, the data processing workflow will become more efficient. The
suspect and non-target compounds found are only a small portion of the peaks detected in the human
blood and urine samples. During this project it was only possible to look for suspects present in 5 or more samples, however, there are many more peaks present in less than 5 samples. Thus with additional
time and work there is a potential to detect more contaminants. This also implies for a non-target
screening used in a broader application during human biomonitoring studies, that it is important to analyse individual rather than pooled samples.
An aspect that has to be taken into account during non-target screening of biological samples is the
occurrence of natural substances and endogenous metabolites. To the best of our knowledge there is no way to generally distinguish between endogenic and exogenic substances. We tried to take this aspect
into account by including a search for endogenous substances listed in the Human Metabolome
Database, containing data about small molecules detected in the human body.
To decrease the amount of data and peaks that need to be identified, there might be interesting follow-
up studies. One could be the examination of time trends using samples from the German Environmental
Specimen Bank stemming from several years. By identifying peaks showing a significant time trend (increasing or decreasing), especially compounds with increasing levels becoming interesting for
inclusion into human biomonitoring studies could be identified. Another way to reduce the amount of
peaks would be the comparison of different cohorts, for example with and without a certain disease or certain exposure groups. The latter could include occupational exposure, leading to the identification of
peaks that could subsequently be searched for in the general population. By statistical methods one
103

Screening of target and non-target contaminants in human blood and urine
could determine peaks which occur predominantly in one of the cohorts and subsequently identify solely
these compounds. This would help to handle the large amount of peaks present in the samples.
A third way to reduce the number of relevant peaks is to determine compounds being of toxicological
relevance. Here an effect directed analysis (EDA) [178] of human blood and urine samples could be
developed. A fractionation with a subsequent toxicological test like for example on endocrine disruption could be applied, where the fractions showing effects are filtered out. In these fractions a non-target
analysis could be used to identify the compounds responsible for the detected effects. This way the
several hundred to thousand peaks found in a sample can be reduced to the relevant ones regarding effects on human health. One study on polar bear blood already showed the applicability of EDA to
blood [179], which suggests also an application to human blood.
104
Screening of target and non-target contaminants in human blood and urine
11 References
1. Ibanez, M., et al., Rapid non-target screening of organic pollutants in water by ultraperformance liquid chromatography coupled to time-of-light mass spectrometry. Trac-Trends in Analytical Chemistry, 2008. 27 (5): p. 481-489.
2. Garcia-Reyes, J.F., et al., Comprehensive screening of target, non-target and unknown pesticides in food by LC-TOF-MS. Trac-Trends in Analytical Chemistry, 2007. 26 (8): p. 828-841.
3. Krauss, M., H. Singer, and J. Hollender, LC–high resolution MS in environmental analysis: from target screening to the identification of unknowns. Analytical and Bioanalytical Chemistry, 2010. 397 (3): p. 943-951.
4. Sancho, J.V., et al., Potential of liquid chromatography/time-of-flight mass spectrometry for the determination of pesticides and transformation products in water. Analytical and Bioanalytical Chemistry, 2006. 386 (4): p. 987-997.
5. Singer, H.H., et al., Multikomponenten-Screening für den Rhein bei Basel, 2009, Eawag: Dübendorf.
6. Portolés, T., et al., Methodical approach for the use of GC-TOF MS for screening and confirmation of organic pollutants in environmental water. Journal of Mass Spectrometry, 2007. 42 (9): p. 1175-1185.
7. Grimalt, S., et al., Quantification, confirmation and screening capability of UHPLC coupled to triple quadrupole and hybrid quadrupole time-of-flight mass spectrometry in pesticide residue analysis. Journal of Mass Spectrometry, 2010. 45 (4): p. 421-436.
8. Li, Z., M.P. Maier, and M. Radke, Screening for pharmaceutical transformation products formed in river sediment by combining ultra high performance liquid chromatography/high resolution mass spectrometry with a rapid data-processing method. Analytica Chimica Acta, 2014. 810 (0): p. 61-70.
9. Ibanez, M., et al., Use of quadrupole time-of-flight mass spectrometry in environmental analysis: Elucidation of transformation products of triazine herbicides in water after UV exposure. Analytical Chemistry, 2004. 76 (5): p. 1328-1335.
10. Detomaso, A., G. Mascolo, and A. Lopez, Characterization of carbofuran photodegradation by-products by liquid chromatography/hybrid quadrupole time-of-flight mass spectrometry. Rapid Communications in Mass Spectrometry, 2005. 19 (15): p. 2193-2202.
11. Durand, S., et al., Biotransformation of the triketone herbicide mesotrione by a Bacillus strain. Metabolite profiling using liquid chromatography/electrospray ionization quadrupole time-of-flight mass spectrometry. Rapid Communications in Mass Spectrometry, 2006. 20 (17): p. 2603-2613.
12. Helbling, D.E., et al., High-Throughput Identification of Microbial Transformation Products of Organic Micropollutants. Environmental Science & Technology, 2010. 44 (17): p. 6621-6627.
13. Theobald, N., et al., Mass-spectrometric investigations of water extracts of the river Elbe for the determination of potential inputs of pollutants into the North-Sea. Fresenius Journal of Analytical Chemistry, 1995. 353 (1): p. 50-56.
14. Schwarzbauer, J., R. Littke, and V. Weigelt, Identification of specific organic contaminants for estimating the contribution of the Elbe river to the pollution of the German Bight. Organic Geochemistry, 2000. 31 (12): p. 1713-1731.
15. Portoles, T., et al., Use of soft and hard ionization techniques for elucidation of unknown compounds by gas chromatography/time-of-flight mass spectrometry. Rapid Communications in Mass Spectrometry, 2011. 25 (11): p. 1589-1599.
16. Björklund, K.S., A-M. Strömvall; P-A. Malmqvist, Screening of organic contaminants in urban snow. Water Science & Technology, 2011. 64 (1): p. 206-213.
17. Kern, S., et al., Identification of Transformation Products of Organic Contaminants in Natural Waters by Computer-Aided Prediction and High-Resolution Mass Spectrometry. Environmental Science & Technology, 2009. 43 (18): p. 7039-7046.
105

Screening of target and non-target contaminants in human blood and urine
18. Weiss, J.M., et al., Identification strategy for unknown pollutants using high-resolution mass spectrometry: Androgen-disrupting compounds identified through effect-directed analysis. Analytical and Bioanalytical Chemistry, 2011. 400 (9): p. 3141-3149.
19. Terzic, S. and M. Ahel, Nontarget analysis of polar contaminants in freshwater sediments influenced by pharmaceutical industry using ultra-high-pressure liquid chromatography-quadrupole time-of-flight mass spectrometry. Environmental Pollution, 2011. 159 (2): p. 557-566.
20. Lacorte, S., M.G. Ikonomou, and M. Fischer, A comprehensive gas chromatography coupled to high resolution mass spectrometry based method for the determination of polybrominated diphenyl ethers and their hydroxylated and methoxylated metabolites in environmental samples. Journal of Chromatography A, 2010. 1217 (3): p. 337-347.
21. Garcia-Reyes, J.F., et al., Large scale pesticide multiresidue methods in food combining liquid chromatography-time-of-flight mass spectrometry and tandem mass Spectrometry. Analytical Chemistry, 2007. 79 (19): p. 7308-7323.
22. Garcia-Reyes, J.F., et al., Searching for non-target chlorinated pesticides in food by liquid chromatography/time-of-flight mass spectrometry. Rapid Communications in Mass Spectrometry, 2005. 19 (19): p. 2780-2788.
23. Garcia-Reyes, J.F., A. Molina-Diaz, and A.R. Fernandez-Alba, Identification of pesticide transformation products in food by liquid chromatography/time-of-flight mass spectrometry via "fragmentation-degradation" relationships. Analytical Chemistry, 2007. 79 (1): p. 307-321.
24. Ferrer, I., et al., Exact-mass library for pesticides using a molecular-feature database. Rapid Communications in Mass Spectrometry, 2006. 20 (24): p. 3659-3668.
25. Mezcua, M., et al., Accurate-Mass Databases for Comprehensive Screening of Pesticide Residues in Food by Fast Liquid Chromatography Time-of-Flight Mass Spectrometry. Analytical Chemistry, 2009. 81 (3): p. 913-929.
26. Lehotay, S.J., et al., Validation of a Fast and Easy Method for the Determination of Residues from 229 Pesticides in Fruits and Vegetables Using Gas and Liquid Chromatography and Mass Spectrometric Detection. Journal of Aoac International, 2005. 88 (2): p. 595-614.
27. Anastassiades, M., et al., Fast and Easy Multiresidue Method Employing Acetonitrile Extraction/Partitioning and Dispersive Solid-Phase Extraction for the Determination of Pesticide Residues in Produce. Journal of Aoac International, 2003. 86 (2): p. 412-431.
28. Liotta, E., et al., Screening for pharmaco-toxicologically relevant compounds in biosamples using high-resolution mass spectrometry: a 'metabolomic' approach to the discrimination between isomers. Journal of Mass Spectrometry, 2010. 45 (3): p. 261-271.
29. Hernández, F., et al., Searching for anthropogenic contaminants in human breast adipose tissues using gas chromatography-time-of-flight mass spectrometry. Journal of Mass Spectrometry, 2009. 44 (1): p. 1-11.
30. Pelander, A., et al., Toxicological Screening with Formula-Based Metabolite Identification by Liquid Chromatography/Time-of-Flight Mass Spectrometry. Analytical Chemistry, 2003. 75 (21): p. 5710-5718.
31. van Stee, L.L.P., et al., Identification of non-target compounds using gas chromatography with simultaneous atomic emission and mass spectrometric detection (GC-AED/MS): analysis of municipal wastewater. Analyst, 1999. 124 (11): p. 1547-1552.
32. Franke, S., et al., Identification of organic pollutants in waters and sediments from the Lower Mulde river area. Acta Hydrochimica Et Hydrobiologica, 2005. 33 (5): p. 519-542.
33. Botalova, O., et al., Identification and chemical characterization of specific organic constituents of petrochemical effluents. Water Research, 2009. 43 (15): p. 3797-3812.
34. de Hoogh, C.J., et al., HPLC-DAD and Q-TOF MS Techniques Identify Cause of Daphnia Biomonitor Alarms in the River Meuse. Environmental Science & Technology, 2006. 40 (8): p. 2678-2685.
35. Godejohann, M., et al., Comprehensive Non-Targeted Analysis of Contaminated Groundwater of a Former Ammunition Destruction Site using 1H-NMR and HPLC-SPE-NMR/TOF-MS. Environmental Science & Technology, 2009. 43 (18): p. 7055-7061.
106

Screening of target and non-target contaminants in human blood and urine
36. Preiss, A., et al., Characterization of dyes and other pollutants in the effluent of a textile company by LC/NMR and LC/MS. Analytical Chemistry, 2000. 72 (5): p. 992-998.
37. De Brabandere, H., et al., Screening for Organic Phosphorus Compounds in Aquatic Sediments by Liquid Chromatography Coupled to ICP-AES and ESI-MS/MS. Analytical Chemistry, 2008. 80 (17): p. 6689-6697.
38. Abate, S., et al., Determination of elemental compositions by gas chromatography/time-of-flight mass spectrometry using chemical and electron ionization. Rapid Communications in Mass Spectrometry, 2010. 24 (8): p. 1172-1180.
39. Knepper, T.P., Mass spectrometric strategies for the analysis of polar industrial chemicals and their by-products in wastewater and surface water. Journal of Chromatography A, 2002. 974 (1-2): p. 111-121.
40. Grange, A.H., et al., Determination of elemental compositions from mass peak profiles of the molecular ion (M) and the M+1 and M+2 ions. Analytical Chemistry, 1996. 68 (3): p. 553-560.
41. Grange, A.H., et al., Identification of pollutants in a municipal well using high resolution mass spectrometry (vol 12, pg 1161, 1998). Rapid Communications in Mass Spectrometry, 1998. 12 (23): p. 1978-1978.
42. Bester, K., et al., Results of non-target screening of lipophilic organic pollutants in the German Bight - I: Benzothiazoles. Science of the Total Environment, 1997. 207 (2-3): p. 111-118.
43. Wanying, Y., et al., Confirmation and identification of the impurities in metolachlor using gas chromatography interfaced with orthogonal acceleration time-of-flight mass spectrometry (GC-oaTOFMS). Talanta, 2005. 65 (1): p. 172-178.
44. Hernandez, F., et al., Target and nontarget screening of organic micropollutants in water by solid-phase microextraction combined with gas chromatography/high-resolution time-of-flight mass spectrometry. Analytical Chemistry, 2007. 79 (24): p. 9494-9504.
45. Hilton, D.C., R.S. Jones, and A. Sjödin, A method for rapid, non-targeted screening for environmental contaminants in household dust. Journal of Chromatography A, 2010. 1217 (44): p. 6851-6856.
46. Robinson, A.L., et al., Development of a sensitive non-targeted method for characterizing the wine volatile profile using headspace solid-phase microextraction comprehensive two-dimensional gas chromatography time-of-flight mass spectrometry. Journal of Chromatography A, 2011. 1218 (3): p. 504-517.
47. Rowland, S.J., et al., Identification of individual tetra- and pentacyclic naphthenic acids in oil sands process water by comprehensive two-dimensional gas chromatography/mass spectrometry. Rapid Communications in Mass Spectrometry, 2011. 25 (9): p. 1198-1204.
48. Rowland, S.J.R.S.J., et al., Diamonds in the Rough: Identification of Individual Naphthenic Acids in Oil Sands Process Water. Environmental Science & Technology, 2011. 45 (7): p. 3154-3159.
49. Gomez, M.J., et al., Automatic Searching and Evaluation of Priority and Emerging Contaminants in Wastewater and River Water by Stir Bar Sorptive Extraction followed by Comprehensive Two-Dimensional Gas Chromatography-Time-of-Flight Mass Spectrometry. Analytical Chemistry, 2011. 83 (7): p. 2638-2647.
50. Niessen, W.M.A., P. Manini, and R. Andreoli, Matrix effects in quantitative pesticide analysis using liquid chromatography-mass spectrometry. Mass Spectrometry Reviews, 2006. 25 (6): p. 881-899.
51. Trufelli, H., et al., An overview of matrix effects in liquid chromatography–mass spectrometry. Mass Spectrometry Reviews, 2011. 30 (3): p. 491-509.
52. Marchi, I., S. Rudaz, and J.-L. Veuthey, Atmospheric pressure photoionization for coupling liquid-chromatography to mass spectrometry: A review. Talanta, 2009. 78 (1): p. 1-18.
53. Cai, S.-S., et al., Ultra Performance Liquid Chromatography −A tm ospheric Pressure Photoionization-Tandem Mass Spectrometry for High-Sensitivity and High-Throughput Analysis of U.S. Environmental Protection Agency 16 Priority Pollutants Polynuclear Aromatic Hydrocarbons. Analytical Chemistry, 2009. 81 (6): p. 2123-2128.
107

Screening of target and non-target contaminants in human blood and urine
54. Kellmann, M., et al., Full scan MS in comprehensive qualitative and quantitative residue analysis in food and feed matrices: How much resolving power is required? Journal of the American Society for Mass Spectrometry, 2009. 20 (8): p. 1464-1476.
55. Castillo, S., et al., Algorithms and tools for the preprocessing of LC-MS metabolomics data. Chemometrics and Intelligent Laboratory Systems, 2011. 108 (1): p. 23-32.
56. Kind, T. and O. Fiehn, Advances in structure elucidation of small molecules using mass spectrometry. Bioanalytical Reviews, 2010. 2 (1): p. 23-60.
57. Louter, A.J.H., et al., Analysis of microcontaminants in aqueous samples by fully automated on-line solid-phase extraction gas chromatography mass selective detection. Journal of Chromatography A, 1996. 725 (1): p. 67-83.
58. Zhang, J.Q., et al., Review of Peak Detection Algorithms in Liquid-Chromatography-Mass Spectrometry. Current Genomics, 2009. 10 (6): p. 388-401.
59. Stein, S.E., An integrated method for spectrum extraction and compound identification from gas chromatography/mass spectrometry data. Journal of the American Society for Mass Spectrometry, 1999. 10 (8): p. 770-781.
60. Steinemann, A.C., et al., Fragranced consumer products: Chemicals emitted, ingredients unlisted. Environmental Impact Assessment Review, 2011. 31 (3): p. 328-333.
61. Schymanski, E.L., et al., The use of MS classifiers and structure generation to assist in the identification of unknowns in effect-directed analysis. Analytica Chimica Acta, 2008. 615 (2): p. 136-147.
62. Schymanski, E.L., M. Meringer, and W. Brack, Automated Strategies To Identify Compounds on the Basis of GC/EI-MS and Calculated Properties. Analytical Chemistry, 2011. 83 (3): p. 903-912.
63. Meinert, C., et al., Application of preparative capillary gas chromatography (pcGC), automated structure generation and mutagenicity prediction to improve effect-directed analysis of genotoxicants in a contaminated groundwater. Environmental Science and Pollution Research, 2010. 17 (4): p. 885-897.
64. Milman, B.L., Towards a full reference library of MSn spectra. Testing of a library containing 3126 MS2 spectra of 1743 compounds. Rapid Communications in Mass Spectrometry, 2005. 19 (19): p. 2833-2839.
65. Bobeldijk, I., et al., Screening and identification of unknown contaminants in water with liquid chromatography and quadrupole-orthogonal acceleration-time-of-flight tandem mass spectrometry. Journal of Chromatography A, 2001. 929 (1-2): p. 63-74.
66. Ibanez, M., et al., Use of quadrupole time-of-flight mass spectrometry in the elucidation of unknown compounds present in environmental water. Rapid Communications in Mass Spectrometry, 2005. 19 (2): p. 169-178.
67. Oberacher, H., et al., On the inter-instrument and inter-laboratory transferability of a tandem mass spectral reference library: 1. Results of an Austrian multicenter study. Journal of Mass Spectrometry, 2009. 44 (4): p. 485-493.
68. Oberacher, H., et al., On the inter-instrument and the inter-laboratory transferability of a tandem mass spectral reference library: 2. Optimization and characterization of the search algorithm. Journal of Mass Spectrometry, 2009. 44 (4): p. 494-502.
69. Horai, H., et al., MassBank: a public repository for sharing mass spectral data for life sciences. Journal of Mass Spectrometry, 2010. 45 (7): p. 703-714.
70. Kind, T. and O. Fiehn, Metabolomic database annotations via query of elemental compositions: Mass accuracy is insufficient even at less than 1 ppm. Bmc Bioinformatics, 2006. 7
71. Kind, T. and O. Fiehn, Seven Golden Rules for heuristic filtering of molecular formulas obtained by accurate mass spectrometry. Bmc Bioinformatics, 2007. 8
72. Lim, H.K., et al., Metabolite identification by data-dependent accurate mass spectrometric analysis at resolving power of 60,000 in external calibration mode using an LTQ/Orbitrap. Rapid Communications in Mass Spectrometry, 2007. 21 (12): p. 1821-1832.
108

Screening of target and non-target contaminants in human blood and urine
73. Heinonen, M., et al., FiD: a software for ab initio structural identification of product ions from tandem mass spectrometric data. Rapid Communications in Mass Spectrometry, 2008. 22 (19): p. 3043-3052.
74. Wolf, S., et al., In silico fragmentation for computer assisted identification of metabolite mass spectra. BMC Bioinformatics, 2010. 11 (1): p. 148.
75. Schymanski, E.L., M. Meringer, and W. Brack, Matching Structures to Mass Spectra Using Fragmentation Patterns: Are the Results As Good As They Look? Analytical Chemistry, 2009. 81 (9): p. 3608-3617.
76. Hill, D.W., et al., Mass spectral metabonomics beyond elemental formula: Chemical database querying by matching experimental with computational fragmentation spectra. Analytical Chemistry, 2008. 80 (14): p. 5574-5582.
77. Héberger, K., Quantitative structure-(chromatographic) retention relationships. Journal of Chromatography A, 2007. 1158 (1-2): p. 273-305.
78. Eckel, W.P. and T. Kind, Use of boiling point-Lee retention index correlation for rapid review of gas chromatography-mass spectrometry data. Analytica Chimica Acta, 2003. 494 (1-2): p. 235-243.
79. Meinert, C., et al., Application of preparative capillary gas chromatography (pcGC), automated structure generation and mutagenicity prediction to improve effect-directed analysis of genotoxicants in a contaminated groundwater. Environmental Science and Pollution Research, 2010. 17 (4): p. 885-897.
80. Hug, C., et al., Identification of novel micropollutants in wastewater by a combination of suspect and nontarget screening. Environmental Pollution, 2014. 184 (0): p. 25-32.
81. Panuwet, P., et al., Quantification of atrazine and its metabolites in urine by on-line solid-phase extraction–high-performance liquid chromatography–tandem mass spectrometry. Analytical and Bioanalytical Chemistry, 2008. 391 (5): p. 1931-1939.
82. Ye, X., et al., Quantification of urinary conjugates of bisphenol A, 2,5-dichlorophenol, and 2-hydroxy-4-methoxybenzophenone in humans by online solid phase extraction–high performance liquid chromatography–tandem mass spectrometry. Analytical and Bioanalytical Chemistry, 2005. 383 (4): p. 638-644.
83. Eckert, E., H. Drexler, and T. Göen, Determination of six hydroxyalkyl mercapturic acids in human urine using hydrophilic interaction liquid chromatography with tandem mass spectrometry (HILIC–ESI-MS/MS). Journal of Chromatography B, 2010. 878 (27): p. 2506-2514.
84. Allmyr, M., et al., Determination of Triclosan as Its Pentafluorobenzoyl Ester in Human Plasma and Milk Using Electron Capture Negative Ionization Mass Spectrometry. Analytical Chemistry, 2006. 78 (18): p. 6542-6546.
85. Völkel, W., et al., Metabolism and Kinetics of Bisphenol A in Humans at Low Doses Following Oral Administration. Chemical Research in Toxicology, 2002. 15 (10): p. 1281-1287.
86. Fromme, H., et al., Phthalates and their metabolites in breast milk - Results from the Bavarian Monitoring of Breast Milk (BAMBI). Environment International, 2011. 37 (4): p. 715-722.
87. Rogers, E., et al., Evaluation of four capillary columns for the analysis of organochlorine pesticides, polychlorinated biphenyls, and polybrominated diphenyl ethers in human serum for epidemiologic studies. Journal of Chromatography B, 2004. 813 (1-2): p. 269-285.
88. Richter, E. and B. Branner, Biomonitoring of exposure to aromatic amines: haemoglobin adducts in humans. Journal of Chromatography B, 2002. 778 (1-2): p. 49-62.
89. Jensen, B., P. Chin, and E. Begg, Quantification of total and free concentrations of R- and S-warfarin in human plasma by ultrafiltration and LC-MS/MS. Analytical and Bioanalytical Chemistry, 2011. 401 (7): p. 2187-2193.
90. Focant, J.-F., et al., High-throughput biomonitoring of dioxins and polychlorinated biphenyls at the sub-picogram level in human serum. Journal of Chromatography A, 2006. 1130 (1): p. 97-107.
109
Screening of target and non-target contaminants in human blood and urine
91. Sandau, C.D., et al., Comprehensive Solid-Phase Extraction Method for Persistent Organic Pollutants. Validation and Application to the Analysis of Persistent Chlorinated Pesticides. Analytical Chemistry, 2003. 75 (1): p. 71-77.
92. Karlsson, M., et al., Solid-Phase Extraction of Polybrominated Diphenyl Ethers in Human Plasma – Comparison with an Open Column Extraction Method. Chromatographia, 2005. 61 (1): p. 67-73.
93. Ren, G., et al., Determination of Dechlorane Plus in Serum from Electronics Dismantling Workers in South China. Environmental Science & Technology, 2009. 43 (24): p. 9453-9457.
94. Hu, Z., et al., Occurrence of synthetic musk fragrances in human blood from 11 cities in China. Environmental Toxicology and Chemistry, 2010. 29 (9): p. 1877-1882.
95. Sarveiya, V., S. Risk, and H.A.E. Benson, Liquid chromatographic assay for common sunscreen agents: application to in vivo assessment of skin penetration and systemic absorption in human volunteers. Journal of Chromatography B, 2004. 803 (2): p. 225-231.
96. Balaguer, A., et al., A solid-phase extraction and size-exclusion liquid chromatographic method for polyethylene glycol 25 p-aminobenzoic acid determination in urine: Validation for urinary excretion studies of users of sunscreens. Analytica Chimica Acta, 2008. 611 (2): p. 220-225.
97. Xia, Y., et al., Analysis of the Tobacco-Specific Nitrosamine 4-(Methylnitrosamino)-1-(3-pyridyl)-1-butanol in Urine by Extraction on a Molecularly Imprinted Polymer Column and Liquid Chromatography/Atmospheric Pressure Ionization Tandem Mass Spectrometry. Analytical Chemistry, 2005. 77 (23): p. 7639-7645.
98. Lindh, C.H., et al., Analysis of chlormequat in human urine as a biomarker of exposure using liquid chromatography triple quadrupole mass spectrometry. Journal of Chromatography B, 2011. 879 (19): p. 1551-1556.
99. Inoue, S., et al., A simple method for detecting fenitrothion, its metabolite 3-methyl-4-nitrophenol, and other organophosphorus pesticides in human urine by LC-MS. Forensic Toxicology, 2009. 27 (1): p. 32-36.
100. Colosio, C., et al., Ethylenethiourea in urine as an indicator of exposure to mancozeb in vineyard workers. Toxicology Letters, 2002. 134 (1-3): p. 133-140.
101. Wilson, N.K., et al., An observational study of the potential exposures of preschool children to pentachlorophenol, bisphenol-A, and nonylphenol at home and daycare. Environmental Research, 2007. 103 (1): p. 9-20.
102. Kondo, F., et al., Determination of Five Phthalate Monoesters in Human Urine Using Gas Chromatography-Mass Spectrometry. Bulletin of Environmental Contamination and Toxicology, 2010. 85 (1): p. 92-96.
103. Fourth National Report on Human Exposure to Environmental Chemicals, 2009, Department of Health and Human Services - Centers for Disease Control and Prevention.
104. Forschungsgemeinschaft, S.z.P.g.A.d.D., Analytische Methoden zur Prüfung gesundheitsschädlicher Arbeitsstoffe - Analysen in biologischem Material. Vol. 7. Lieferung, Ausgabe 1983. 2010: Wiley-VCH.
105. Bericht zur Entwicklung neuer HBM Analysemethoden für Chemikalien, 2010, Bundesinstitut für Risikobewertung.
106. Karzinogene, mutagene, reproduktionstoxische (CMR) und andere problematische Stoffe in Produkten - Identifikation relevanter Stoffe und Erzeugnisse, Überprüfung durch Messung, Regelungsbedarf im Chemikalienrecht, 2011, Umweltbundesamt: Dessau-Roßlau.
107. Howard, P.H. and D.C.G. Muir, Identifying New Persistent and Bioaccumulative Organics Among Chemicals in Commerce. Environmental Science & Technology, 2010. 44 (7): p. 2277-2285.
108. Buck, R.C., et al., Perfluoroalkyl and polyfluoroalkyl substances in the environment: Terminology, classification, and origins. Integrated Environmental Assessment and Management, 2011. 7 (4): p. 513-541.
109. Richardson, S.D., Environmental Mass Spectrometry: Emerging Contaminants and Current Issues. Analytical Chemistry, 2010. 82 (12): p. 4742-4774.
110

Screening of target and non-target contaminants in human blood and urine
110. Richardson, S.D. and T.A. Ternes, Water Analysis: Emerging Contaminants and Current Issues. Analytical Chemistry, 2011. 83 (12): p. 4614-4648.
111. Thomas, G.O., et al., Short and medium chain length chlorinated paraffins in UK human milk fat. Environment International, 2006. 32 (1): p. 34-40.
112. Kaj, L.A., Jeanette; Palm Cousins, Anna; Remberger, Mikael; Brorström-Lundén, Eva Results from the Swedish National Screening Programme 2004 - Subreport 4: Siloxanes, 2005, IVL - Swedish Environmental Research Institute.
113. Eckert, E., et al., Mercapturic acids as metabolites of alkylating substances in urine samples of German inhabitants. International Journal of Hygiene and Environmental Health, 2011. 214 (3): p. 196-204.
114. Lintelmann, J., C. Hellemann, and A. Kettrup, Coupled-column high-performance liquid chromatographic method for the determination of four metabolites of polycyclic aromatic hydrocarbons, 1-, 4- and 9-hydroxyphenanthrene and 1-hydroxypyrene, in urine. Journal of Chromatography B: Biomedical Sciences and Applications, 1994. 660 (1): p. 67-73.
115. Campo, L., F. Rossella, and S. Fustinoni, Development of a gas chromatography/mass spectrometry method to quantify several urinary monohydroxy metabolites of polycyclic aromatic hydrocarbons in occupationally exposed subjects. Journal of Chromatography B, 2008. 875 (2): p. 531-540.
116. Hong, J.E., et al., Solid-phase microextraction with on-fiber derivatization for the determination of hydroxy-polychlorinated biphenyl compounds in urine. Analytica Chimica Acta, 2005. 539 (1-2): p. 55-60.
117. Olsson, A., et al., A liquid chromatography/electrospray ionization–tandem mass spectrometry method for quantification of specific organophosphorus pesticide biomarkers in human urine. Analytical and Bioanalytical Chemistry, 2003. 376 (6): p. 808-815.
118. López, F.J., et al., Gas chromatographic determination of organochlorine and organophosphorus pesticides in human fluids using solid phase microextraction. Analytica Chimica Acta, 2001. 433 (2): p. 217-226.
119. Bravo, R., et al., Measurement of dialkyl phosphate metabolites of organophosphorus pesticides in human urine using lyophilization with gas chromatography-tandem mass spectrometry and isotope dilution quantification. J Expo Anal Environ Epidemiol, 2004. 14 (3): p. 249-259.
120. Reemtsma, T., J. Lingott, and S. Roegler, Determination of 14 monoalkyl phosphates, dialkyl phosphates and dialkyl thiophosphates by LC-MS/MS in human urinary samples. Science of the Total Environment, 2011. 409 (10): p. 1990-1993.
121. Cooper, E., et al., Analysis of the flame retardant metabolites bis(1,3-dichloro-2-propyl) phosphate (BDCPP) and diphenyl phosphate (DPP) in urine using liquid chromatography–tandem mass spectrometry. Analytical and Bioanalytical Chemistry, 2011. 401 (7): p. 2123-2132.
122. Yoshimura, Y., et al., Measurement of bisphenol A in human serum by gas chromatography/mass spectrometry. Analytica Chimica Acta, 2002. 458 (2): p. 331-336.
123. Völkel, W., M. Kiranoglu, and H. Fromme, Determination of free and total bisphenol A in human urine to assess daily uptake as a basis for a valid risk assessment. Toxicology Letters, 2008. 179 (3): p. 155-162.
124. Völkel, W., M. Kiranoglu, and H. Fromme, Determination of free and total bisphenol A in urine of infants. Environmental Research, 2011. 111 (1): p. 143-148.
125. Blount, B.C., et al., Levels of Seven Urinary Phthalate Metabolites in a Human Reference Population. Environ Health Perspect, 2000. 108 (10)
126. Ye, X., et al., Automated on-line column-switching HPLC-MS/MS method for measuring environmental phenols and parabens in serum. Talanta, 2008. 76 (4): p. 865-871.
127. Wang, H., et al., Simultaneous analysis of synthetic musks and triclosan in human breast milk by gas chromatography tandem mass spectrometry. Journal of Chromatography B, 2011. 879 (21): p. 1861-1869.
111

Screening of target and non-target contaminants in human blood and urine
128. Ye, X., et al., Automated On-Line Column-Switching HPLC-MS/MS Method with Peak Focusing for the Determination of Nine Environmental Phenols in Urine. Analytical Chemistry, 2005. 77 (16): p. 5407-5413.
129. Ye, X., et al., Quantification of the urinary concentrations of parabens in humans by on-line solid phase extraction-high performance liquid chromatography-isotope dilution tandem mass spectrometry. Journal of Chromatography B, 2006. 844 (1): p. 53-59.
130. Calafat, A.M., et al., Urinary Concentrations of Four Parabens in the U.S. Population: NHANES 2005–2006. Environ Health Perspect, 2010. 118 (5)
131. Calafat, A.M., et al., Concentrations of the sunscreen agent benzophenone-3 in residents of the United States: National Health and Nutrition Examination Survey 2003-2004. Environmental Health Perspectives, 2008. 116 (7): p. 893-897.
132. Roosens, L., et al., Brominated flame retardants and perfluorinated chemicals, two groups of persistent contaminants in Belgian human blood and milk. Environmental Pollution, 2010. 158 (8): p. 2546-2552.
133. Toms, L.-M.L., et al., Serum Polybrominated Diphenyl Ether (PBDE) Levels Are Higher in Children (2–5 Years of Age) than in Infants and Adults. Environ Health Perspect, 2009. 117 (9)
134. Naert, C., S.D. Saeger, and C. Van Peteghem, Development of a gas chromatography/ion trap mass spectrometry based method for the quantification of polybrominated diphenyl ethers and polychlorinated biphenyls in adipose tissue. Rapid Communications in Mass Spectrometry, 2004. 18 (19): p. 2317-2322.
135. Johnson-Restrepo, B., et al., Polybrominated Diphenyl Ethers and Polychlorinated Biphenyls in Human Adipose Tissue from New York. Environmental Science & Technology, 2005. 39 (14): p. 5177-5182.
136. Johnson-Restrepo, B., et al., Polybrominated diphenyl ethers and organochlorine pesticides in human breast milk from Massachusetts, USA. Journal of Environmental Monitoring, 2007. 9 (11): p. 1205-1212.
137. Vieth, B.R., Thomas; Ostermann, Barbara; Mielke, Hans Rückstände von Flammschutzmitteln in Frauenmilch aus Deutschland unter besonderer Berücksichtigung von polybromierten Diphenylethern (PBDE), 2005, Bundesinstitut für Risikobewertung: Berlin.
138. Covaci, A. and S. Voorspoels, Optimization of the determination of polybrominated diphenyl ethers in human serum using solid-phase extraction and gas chromatography-electron capture negative ionization mass spectrometry. Journal of Chromatography B, 2005. 827 (2): p. 216-223.
139. Zheng, J., et al., Dechlorane Plus in Human Hair from an E-Waste Recycling Area in South China: Comparison with Dust. Environmental Science & Technology, 2010. 44 (24): p. 9298-9303.
140. Gu, D., et al., Ultraperformance Liquid Chromatography-Tandem Mass Spectrometry Method for Biomonitoring Cooked Meat Carcinogens and Their Metabolites in Human Urine. Analytical Chemistry, 2011. 83 (3): p. 1093-1101.
141. Holland, R.D., et al., Rapid Biomonitoring of Heterocyclic Aromatic Amines in Human Urine by Tandem Solvent Solid Phase Extraction Liquid Chromatography Electrospray Ionization Mass Spectrometry. Chemical Research in Toxicology, 2004. 17 (8): p. 1121-1136.
142. Fede, J.-M., et al., Biomonitoring of 2-Amino-1-methyl-6-phenylimidazo[4,5-b]pyridine (PhIP) and Its Carcinogenic Metabolites in Urine. Chemical Research in Toxicology, 2009. 22 (6): p. 1096-1105.
143. Hutter, H.P., et al., Blood concentrations of polycyclic musks in healthy young adults. Chemosphere, 2005. 59 (4): p. 487-492.
144. Hutter, H.P., et al., Synthetic musks in blood of healthy young adults: Relationship to cosmetics use. Science of the Total Environment, 2009. 407 (17): p. 4821-4825.
145. Pleil, J.D., et al., Cumulative exposure assessment for trace-level polycyclic aromatic hydrocarbons (PAHs) using human blood and plasma analysis. Journal of Chromatography B, 2010. 878 (21): p. 1753-1760.
112

Screening of target and non-target contaminants in human blood and urine
146. Araoud, M., et al., Simple analytical method for determination of pesticide residues in human serum by liquid chromatography tandem mass spectrometry. Journal of Environmental Science and Health, Part B, 2010. 45 (3): p. 242-248.
147. Kuklenyik, Z., et al., Automated Solid-Phase Extraction and Measurement of Perfluorinated Organic Acids and Amides in Human Serum and Milk. Environmental Science & Technology, 2004. 38 (13): p. 3698-3704.
148. Kärrman, A., et al., Development of a Solid-Phase Extraction-HPLC/Single Quadrupole MS Method for Quantification of Perfluorochemicals in Whole Blood. Analytical Chemistry, 2005. 77 (3): p. 864-870.
149. Silvia Díaz-Cruz, M., M. Llorca, and D. Barceló, Organic UV filters and their photodegradates, metabolites and disinfection by-products in the aquatic environment. TrAC Trends in Analytical Chemistry, 2008. 27 (10): p. 873-887.
150. Janák, K., E. Jensen, and G. Becher, Determination of polychlorinated biphenyls in human blood by solid-phase extraction including on-column lipid decomposition. Journal of Chromatography B: Biomedical Sciences and Applications, 1999. 734 (2): p. 219-227.
151. Ehresman, D.J., et al., Comparison of human whole blood, plasma, and serum matrices for the determination of perfluorooctanesulfonate (PFOS), perfluorooctanoate (PFOA), and other fluorochemicals. Environmental Research, 2007. 103 (2): p. 176-184.
152. Schecter, A., et al., The use of potassium dichromate and ethyl alcohol as blood preservatives for analysis of organochlorine contaminants. Chemosphere, 2004. 57 (1): p. 1-7.
153. Flassbeck, D., et al., Determination of Low Molecular Weight Silicones in Plasma and Blood of Women after Exposure to Silicone Breast Implants by GC/MS. Analytical Chemistry, 2001. 73 (3): p. 606-611.
154. Plössl, F., M. Giera, and F. Bracher, Multiresidue analytical method using dispersive solid-phase extraction and gas chromatography/ion trap mass spectrometry to determine pharmaceuticals in whole blood. Journal of Chromatography A, 2006. 1135 (1): p. 19-26.
155. Eckard, R.G., Andreas; Dobler, Lorenz; Wiesmüller, Gerhard Richtlinie zur Probenahme und Probenbearbeitung, 2011, Umweltprobenbank des Bundes.
156. Usui, K., et al., Rapid drug extraction from human whole blood using a modified QuEChERS extraction method. Legal Medicine, 2012. 14 (6): p. 286-296.
157. Usui, K., et al., Rapid determination of disulfoton and its oxidative metabolites in human whole blood and urine using QuEChERS extraction and liquid chromatography-tandem mass spectrometry. Legal Medicine, 2012. 14 (6): p. 309-316.
158. Kudo, K., et al., Rapid and simultaneous extraction of acidic and basic drugs from human whole blood for reliable semi-quantitative NAGINATA drug screening by GC-MS. Forensic Toxicology, 2014. 32 (1): p. 97-104.
159. Matsuta, S., et al., Development of a simple one-pot extraction method for various drugs and metabolites of forensic interest in blood by modifying the QuEChERS method. Forensic Science International, 2013. 232 (1-3): p. 40-45.
160. Anastassiades, M., K. Mastovska, and S.J. Lehotay, Evaluation of analyte protectants to improve gas chromatographic analysis of pesticides. Journal of Chromatography A, 2003. 1015 (1-2): p. 163-184.
161. Kierkegaard, A., J. Björklund, and U. Friden, Identification of the flame retardant decabromodiphenyl ethane in the environment. Environmental Science & Technology, 2004. 38 (12): p. 3247-3253.
162. Barber, J.L., et al., Analysis of per- and polyfluorinated alkyl substances in air samples from Northwest Europe. Journal of Environmental Monitoring, 2007. 9 (6): p. 530-541.
163. Dreyer, A., et al., Optimized method avoiding solvent-induced response enhancement in the analysis of volatile and semi-volatile polyfluorinated alkylated compounds using gas chromatography-mass spectrometry. Journal of Chromatography A, 2008. 1178 (1-2): p. 199-205.
113
Screening of target and non-target contaminants in human blood and urine
164. Pluskal, T., et al., MZmine 2: Modular framework for processing, visualizing, and analyzing mass spectrometry-based molecular profile data. Bmc Bioinformatics, 2010. 11 (1): p. 395.
165. Li, X.L. and B.J. Brownawell, Analysis of Quaternary Ammonium Compounds in Estuarine Sediments by LC-ToF-MS: Very High Positive Mass Defects of Alkylamine Ions as Powerful Diagnostic Tools for Identification and Structural Elucidation. Analytical Chemistry, 2009. 81 (19): p. 7926-7935.
166. Thurman, E. and I. Ferrer, The isotopic mass defect: a tool for limiting molecular formulas by accurate mass. Analytical and Bioanalytical Chemistry, 2010. 397 (7): p. 2807-2816.
167. Schröter-Kermani, C., et al., Retrospective monitoring of perfluorocarboxylates and perfluorosulfonates in human plasma archived by the German Environmental Specimen Bank. International Journal of Hygiene and Environmental Health, 2013. 216 (6): p. 633-640.
168. Kunisue, T., et al., Analysis of five benzophenone-type UV filters in human urine by liquid chromatography-tandem mass spectrometry. Analytical Methods, 2010. 2 (6): p. 707-713.
169. León, Z., et al., Solid-phase extraction liquid chromatography–tandem mass spectrometry analytical method for the determination of 2-hydroxy-4-methoxybenzophenone and its metabolites in both human urine and semen. Analytical and Bioanalytical Chemistry, 2010. 398 (2): p. 831-843.
170. Hoffman, K., J.L. Daniels, and H.M. Stapleton, Urinary metabolites of organophosphate flame retardants and their variability in pregnant women. Environment International, 2014. 63: p. 169-172.
171. Meeker, J.D., et al., Urinary Metabolites of Organophosphate Flame Retardants: Temporal Variability and Correlations with House Dust Concentrations. Environmental Health Perspectives, 2013. 121 (5): p. 580-585.
172. Van den Eede, N., et al., Analysis of organophosphate flame retardant diester metabolites in human urine by liquid chromatography electrospray ionisation tandem mass spectrometry. Journal of Chromatography A, 2013. 1303: p. 48-53.
173. Kärrman, A., et al., Perfluorinated chemicals in relation to other persistent organic pollutants in human blood. Chemosphere, 2006. 64 (9): p. 1582-1591.
174. Brown, W.D. and A.H. Gouliaev, Method of preparing 5- or 8-bromoisoquinoline derivatives, 2003, Patent No: WO1999067218 A3.
175. Kunihiro, H., T. Sakagawa, and T. Nakayama, Dye for denim cotton yarns, 1994, Patent No: EP0455266 B1.
176. Löschner, D., et al., Experience with the application of the draft European Standard prEN 15768 to the identification of leachable organic substances from materials in contact with drinking water by GC-MS. Analytical Methods, 2011. 3 (11): p. 2547-2556.
177. Final report of the safety assessment of niacinamide and niacin. International Journal of Toxicology, 2005. 24: p. 1-31.
178. Brack, W., et al., How to confirm identified toxicants in effect-directed analysis. Analytical and Bioanalytical Chemistry, 2008. 390 (8): p. 1959-1973.
179. Simon, E., et al., Effect-Directed Analysis To Explore the Polar Bear Exposome: Identification of Thyroid Hormone Disrupting Compounds in Plasma. Environmental Science & Technology, 2013. 47 (15): p. 8902-8912.
114
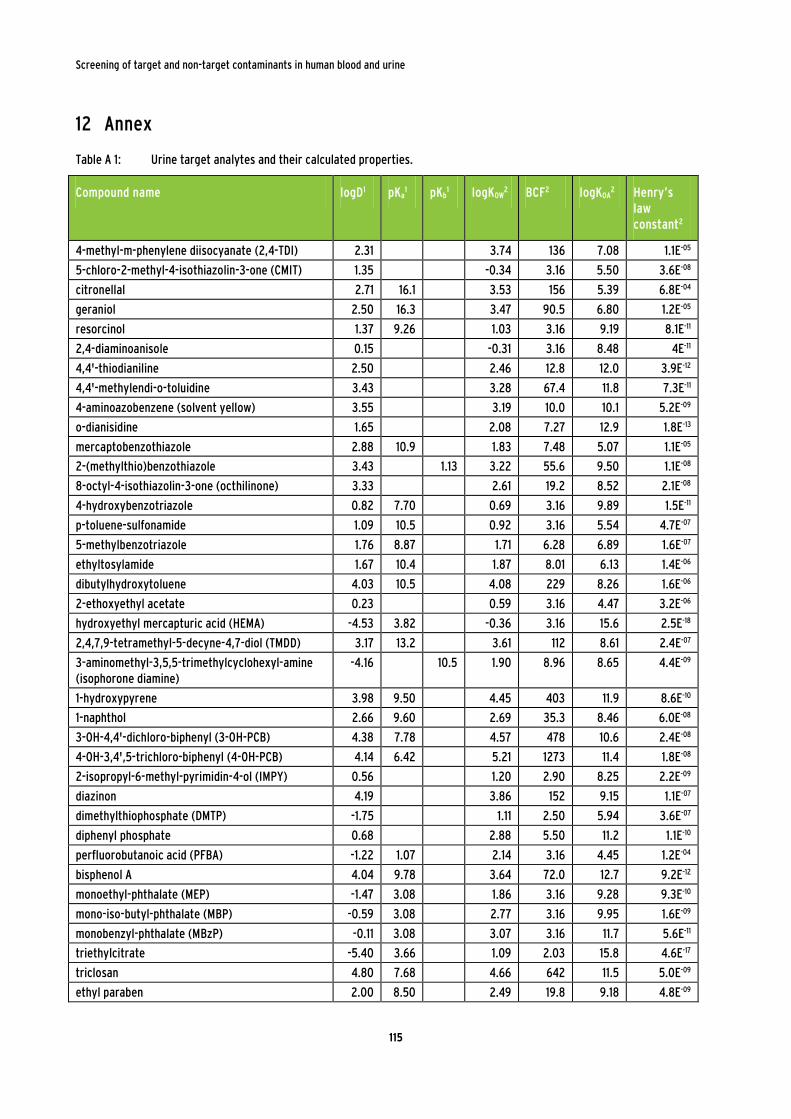
Screening of target and non-target contaminants in human blood and urine
12 Annex
Table A 1: Urine target analytes and their calculated properties.
Compound name logD1 pKa1 pKb
1 logKOW2 BCF2 logKOA
2 Henry’s law constant2
4-methyl-m-phenylene diisocyanate (2,4-TDI) 2.31 3.74 136 7.08 1.1E-05 5-chloro-2-methyl-4-isothiazolin-3-one (CMIT) 1.35 -0.34 3.16 5.50 3.6E-08 citronellal 2.71 16.1 3.53 156 5.39 6.8E-04 geraniol 2.50 16.3 3.47 90.5 6.80 1.2E-05 resorcinol 1.37 9.26 1.03 3.16 9.19 8.1E-11 2,4-diaminoanisole 0.15 -0.31 3.16 8.48 4E-11 4,4'-thiodianiline 2.50 2.46 12.8 12.0 3.9E-12 4,4'-methylendi-o-toluidine 3.43 3.28 67.4 11.8 7.3E-11 4-aminoazobenzene (solvent yellow) 3.55 3.19 10.0 10.1 5.2E-09 o-dianisidine 1.65 2.08 7.27 12.9 1.8E-13 mercaptobenzothiazole 2.88 10.9 1.83 7.48 5.07 1.1E-05 2-(methylthio)benzothiazole 3.43 1.13 3.22 55.6 9.50 1.1E-08 8-octyl-4-isothiazolin-3-one (octhilinone) 3.33 2.61 19.2 8.52 2.1E-08 4-hydroxybenzotriazole 0.82 7.70 0.69 3.16 9.89 1.5E-11 p-toluene-sulfonamide 1.09 10.5 0.92 3.16 5.54 4.7E-07 5-methylbenzotriazole 1.76 8.87 1.71 6.28 6.89 1.6E-07 ethyltosylamide 1.67 10.4 1.87 8.01 6.13 1.4E-06 dibutylhydroxytoluene 4.03 10.5 4.08 229 8.26 1.6E-06 2-ethoxyethyl acetate 0.23 0.59 3.16 4.47 3.2E-06 hydroxyethyl mercapturic acid (HEMA) -4.53 3.82 -0.36 3.16 15.6 2.5E-18 2,4,7,9-tetramethyl-5-decyne-4,7-diol (TMDD) 3.17 13.2 3.61 112 8.61 2.4E-07 3-aminomethyl-3,5,5-trimethylcyclohexyl-amine (isophorone diamine)
-4.16 10.5 1.90 8.96 8.65 4.4E-09
1-hydroxypyrene 3.98 9.50 4.45 403 11.9 8.6E-10 1-naphthol 2.66 9.60 2.69 35.3 8.46 6.0E-08 3-OH-4,4'-dichloro-biphenyl (3-OH-PCB) 4.38 7.78 4.57 478 10.6 2.4E-08 4-OH-3,4',5-trichloro-biphenyl (4-OH-PCB) 4.14 6.42 5.21 1273 11.4 1.8E-08 2-isopropyl-6-methyl-pyrimidin-4-ol (IMPY) 0.56 1.20 2.90 8.25 2.2E-09 diazinon 4.19 3.86 152 9.15 1.1E-07 dimethylthiophosphate (DMTP) -1.75 1.11 2.50 5.94 3.6E-07 diphenyl phosphate 0.68 2.88 5.50 11.2 1.1E-10 perfluorobutanoic acid (PFBA) -1.22 1.07 2.14 3.16 4.45 1.2E-04 bisphenol A 4.04 9.78 3.64 72.0 12.7 9.2E-12 monoethyl-phthalate (MEP) -1.47 3.08 1.86 3.16 9.28 9.3E-10 mono-iso-butyl-phthalate (MBP) -0.59 3.08 2.77 3.16 9.95 1.6E-09 monobenzyl-phthalate (MBzP) -0.11 3.08 3.07 3.16 11.7 5.6E-11 triethylcitrate -5.40 3.66 1.09 2.03 15.8 4.6E-17 triclosan 4.80 7.68 4.66 642 11.5 5.0E-09 ethyl paraben 2.00 8.50 2.49 19.8 9.18 4.8E-09
115

Screening of target and non-target contaminants in human blood and urine
Compound name logD1 pKa1 pKb
1 logKOW2 BCF2 logKOA
2 Henry’s law constant2
butyl paraben 2.96 8.50 3.47 105 10.0 8.5E-09 triethylenglycol dimethylether (tetraoxadodecan) -0.02 -0.76 3.16 6.12 3.2E-09 2-ethylhexyl-p-methoxycinnamate (cinnamate) 5.38 8.07 5.80 3128 9.94 1.5E-08 salicylic acid 3,3,5-trimethcyclohexyl ester (homosalate)
4.99 6.16 5403 9.26 1.8E-06
benzophenone-3 3.54 9.72 3.52 38.2 10.0 1.9E-05 4-methylumbelliferyl glucuronide (4-MeUmb-gluc) -3.65 2.97 -0.267 0.50 18.7 2.5E-21 4-methylumbelliferyl sulfate (4-MeUmb-sul) -1.07 -2.32 -0.903 0.50 8.70 6.1E-12 estrone 3-( β-D-glucuronide) (estrone-gluc) -1.06 3.30 1.58 3.16 21.0 8.5E-22 estrone 3-sulfate (estrone-sul) 1.46 -1.75 0.95 3.16 11.03 2.0E-12 creatinine -3.26 5.58 -1.77 3.16 8.24 2.4E-12 1 calculated with JChem: logD (partition coefficient between octanol and water at the pysiological pH of 7.4), pKa and pKb (acidic and basic dissociation constants); 2 calculated with EPIWIN: logKOW (partition coefficient between octanol and water), BCF (bioconcentration factor), logKOA (partition coefficient between octanol and air)
116

Screening of target and non-target contaminants in human blood and urine
Table A 2: Blood target analytes and their calculated properties.
Compound name logD1 pKa1 pKb
1 logKOW2 BCF2 logKOA
2 Henry’s law constant2
4-methyl-m-phenylene diisocyanate (2,4-TDI) 2.31 3.74 136 7.08 1.1E-05 5-chloro-2-methyl-4-isothiazolin-3-one (CMIT) 1.35 -0.34 3.16 5.50 3.6E-08 citronellal 2.71 16.1 3.53 156 5.39 6.8E-04 geraniol 2.50 16.3 3.47 90.5 6.80 1.2E-05 resorcinol 1.37 9.26 1.03 3.16 9.19 8.1E-11 2,4-diaminoanisol 0.15 5.71 -0.31 3.16 8.48 4E-11 4,4'-thiodianiline 2.50 4.24 2.46 12.8 12.0 3.9E-12 4,4'-methylendi-o-toluidine 3.43 4.68 3.28 67.4 11.8 7.3E-11 4-aminoazobenzene (solvent yellow) 3.55 3.06 3.19 10.0 10.1 5.2E-09 o-dianisidine 1.65 4.55 2.08 7.27 12.9 1.8E-13 2,2',4,4'-tetrabromodiphenyl ether (BDE 47) 6.55 6.77 14000 10.7 3E-06 2,2',4,4',5-pentabromodiphenyl ether (BDE 99) 7.32 7.66 15000 11.2 1.2E-06 2,2',3,3',4,4',5,5',6,6'-decabromodiphenyl ether (BDE 209)
11.2 12.11 41.7 18.4 1.2E-08
hexabromocyclodo-decane (HBCDD) 7.21 7.86 5019 12.0 1.7E-06 syn and anti dechlorane plus (DP) 9.07 11.3 108 14.8 7.4E-06 tris(2-chloroethyl)phosphate (TCEP) 2.11 1.63 0.62 5.31 3.3E-06 tetrabromobisphenol A (TBBPA) 5.87 6.57 7.20 10000 18.2 2.3E-13 decabromodiphenyl ethane (DBDPE) 12.2 13.64 7.43 19.2 6.4E-08 2-amino-1-methyl-6-phenylimidazo[4,5-b]pyridine (PhIP)
2.09 5.43 2.16 13.8 13.2 2.8E-13
mercaptobenzothiazole 2.88 10.9 1.83 7.48 5.07 1.2E-05 2-(methylthio)benzothiazole 3.43 1.13 3.22 55.6 9.50 1.1E-08 p-toluene-sulfonamide 1.09 10.5 0.92 3.16 5.54 4.7E-07 dibutylhydroxytoluene 4.03 10.4 4.08 229 8.26 1.6E-06 2,4,7,9-tetramethyl-5-decyne-4,7-diol (TMDD) 3.17 13.2 3.61 112 8.61 2.4E-07 4-methylanisole 2.33 2.62 26.4 4.50 4.7E-03 ambrettolide 5.12 5.37 1628 6.33 2.7E-03 cashmeran 3.57 4.49 426.4 6.73 1.4E-04 celestolide 4.67 16.2 5.93 983.7 8.82 3.2E-05 galaxolide 4.72 6.26 3629 8.17 1.3E-04 1,2-bis(2-ethylhexyl) 3,4,5,6-tetrabromobenzene-1,2-dicarboxylate (pyronil 45)
11.1 11.95 12.6 16.9 3E-07
N,N-ethylene-bis(tetrabromophthalimide) (saytex BT 93)
7.81 9.80 567 28.6 3.6E-21
hexachlorocyclopenta-1,3-diene (HCCPD) 3.57 4.63 983 5.00 2.7E-02 naphthalene 2.96 3.17 69.9 5.05 4.4E-04 acenaphthylene 3.33 3.94 184.8 6.27 1.1E-04 pyrene 4.28 4.93 770.6 8.19 1.2E-05 2,2',5,5'-tetrachlorobiphenyl (PCB 52) 6.04 6.34 18700 8.18 2.0E-04 2,2',4,5,5'-pentachlorobiphenyl (PCB 101) 6.64 6.98 54900 9.23 9.0E-05 2,2',3,4,4',5,5'-heptachlorobiphenyl (PCB 180) 7.85 8.27 12300 11.7 1.0E-05
117

Screening of target and non-target contaminants in human blood and urine
Compound name logD1 pKa1 pKb
1 logKOW2 BCF2 logKOA
2 Henry’s law constant2
carbendazim 1.80 9.70 4.28 1.55 4.68 10.6 2.1E-11 diazinon 4.19 4.19 3.86 152 9.15 1.1E-07 thiabendazole 2.33 10.3 4.08 2.00 19.8 11.5 2.1E-11 perfluorobutanoic acid (PFBA) -1.22 1.07 2.14 3.16 4.45 1.2E-04 perfluorooctanoic acid (PFOA) 5.11 4.81 3.16 4.24 9.1E-02 perfluorotetradecanoic acid (PFTDA) 5.79 8.83 10.0 3.94 1.9E+03 perfluorooctane sulfonic acid (PFOS) 5.43 4.49 3.16 4.84 1.1E-02 2-N-methylperfluoro-octanesulfonamide (MeFOSA) 4.14 3.47 6.27 6345 4.05 4.04 perfluorooctyl phosphonic acid (C8-PFPA)
2.33 0.46 4.40 371 7.76 1.1E-05
8:2 fluorotelomer alcohol (8:2 FTOH) 5.61 15.8 5.75 2232 3.35 4.14 10:2 fluorotelomer alcohol (10:2 FTOH) 7.01 15.8 7.08 12100 3.41 114 4-nonylphenol (4-NP) 5.74 10.3 5.99 123.9 8.62 3.4E-05 bisphenol A 4.04 9.78 3.64 72.0 12.7 9.2E-12 bis(4-chlorophenyl) sulfone 4.14 3.90 173 9.15 1.4E-07 triclosan 4.80 7.68 4.66 642 11.5 5E-09 ethyl paraben 2.00 8.50 2.49 19.8 9.18 4.8E-09 butyl paraben 2.96 8.50 3.47 105 10.0 8.5E-09 3,5-dichloro-N-(3,4-dichlorophenyl)-2-hydroxybenzamide (tetrachlorosalicylanilide)
3.81 5.95 5.87 3492 14.6 4.8E-11
quaternium 15 -2.72 3.70 -5.92 3.16 6.04 1.8E-08 benzyldimethyldodecylammonium chloride (benzylQUAT)
2.63 18.1 4.93 70.8 15.6 4.8E-13
trimethyloctyl-ammonium bromide (trimethylQUAT)
-0.87 1.26 3.16 11.3 1.9E-12
michlers ketone 3.65 3.73 3.50 43.2 11.6 4.9E-10 phenolphthalein 4.35 9.16 3.06 18.1 15.8 9E-16 2-ethylhexyl-p-methoxycinnamate (cinnamate) 5.38 5.80 3128 9.94 1.8E-06 salicylic acid 3,3,5-trimethcyclohexyl ester (homosalate)
4.99 9.72 6.16 5403 9.26 1.9E-05
4-methyl-benzylidene camphor (4-MBC) 5.12 5.92 3744 9.97 2.2E-06 octocrylene (OC) 6.78 6.88 16100 13.8 3.0E-09 1 calculated with JChem: logD (partition coefficient between octanol and water at the pysiological pH of 7.4), pKa and pKb (acidic and basic dissociation constants); 2 calculated with EPIWIN: logKOW (partition coefficient between octanol and water), BCF (bioconcentration factor), logKOA (partition coefficient between octanol and air)
118

Screening of target and non-target contaminants in human blood and urine
Figure A 1: TICs of DI and QdSPE extracts, comparing the deconjugated and not-deconjugated samples.
119

Screening of target and non-target contaminants in human blood and urine
Table A 3: MRM transitions and instrument parameters for blood target analytes analysed on the LC-QTrap system.
Compound name modus Q1 (Da) > Q3 (Da) DP (volts)
CE (volts)
CXP (volts)
instr LDC [ng/mL extract]
2,4-TDI pos 175.0 > 147.0 161 17 16
< 1 175.0 > 77.0 161 37 10 175.0 > 131.9 161 21 14
CMIT pos 149.9 > 86.9 81 51 10
5 149.9 > 134.9 81 31 14 149.9 > 114.9 81 27 12
(citronellal) pos 155.0 > 113.8 1 11 18
155.0 > 72.8 1 25 20 155.0 > 109.0 1 15 12
(resorcinol) pos 111.0 > 55.0 1 21 14
111.0 > 68.8 1 13 18 111.0 > 92.9 1 21 28
4,4'-thiodianiline pos 217.0 > 123.9 1 29 16
< 1 217.0 > 200.0 1 25 22 217.0 > 79.9 1 57 18
4,4'-methylendi-o-toluidine pos 227.1 > 120.0 126 33 12
< 1 227.1 > 77.0 126 73 10 227.1 > 178.0 126 35 10
solvent yellow pos 198.1 > 77.0 101 25 12
< 1 198.1 > 50.9 101 67 12 198.1 > 104.9 101 19 12
o-dianisidine pos 245.0 > 230.0 156 25 12
< 1 245.0 > 187.0 156 43 10 245.0 > 213.0 156 25 10
TCEP pos 284.8 > 222.9 91 17 26
< 1 284.8 > 98.9 91 29 16 284.8 > 160.9 91 21 18
TBBPA neg 540.6 > 417.6 -125 -54 -19
10 540.6 > 445.7 -125 -46 -19 540.6 > 443.7 -125 -46 -21
PhIP pos 224.8 > 115.0 161 65 22
< 1 224.8 > 113.9 161 63 22 224.8 > 112.9 161 87 24
(mercaptobenzothiazol) neg 165.8 > 133.8 -85 -28 -11
165.8 > 57.9 -85 -54 -7 165.8 > 101.9 -85 -28 -11
2-(methylthio)benzothiazole pos 181.9 > 166.9 91 31 20 < 1
120

Screening of target and non-target contaminants in human blood and urine
Compound name modus Q1 (Da) > Q3 (Da) DP (volts)
CE (volts)
CXP (volts)
instr LDC [ng/mL extract]
181.9 > 122.9 91 45 14 181.9 > 108.9 91 47 12
p-toluene-sulfonamide neg 169.8 > 106.0 -75 -24 -5
< 10 169.8 > 78.9 -75 -34 -11 169.8 > 79.9 -75 -28 -9
TMDD pos 224.9 > 98.9 146 25 16
1 224.9 > 160.9 146 15 8 224.9 > 162.9 146 15 16
carbendazim pos 192.0 > 159.9 61 27 8
< 1 192.0 > 131.9 61 41 14 192.0 > 105.0 61 49 12
diazinon pos 305.0 > 169.0 136 29 8
< 1 305.0 > 153.0 136 29 16 305.0 > 96.9 136 45 12
thiabendazole neg 199.8 > 172.8 -85 -30 -21
1 199.8 > 140.9 -85 -48 -9 199.8 > 171.8 -85 -46 -17
PFBA neg 212.8 > 168.9 -10 -12 -11
5 212.8 > 168.3 -10 -16 -55
PFOA neg 412.9 > 368.8 -10 -14 -47
1 412.9 > 168.8 -10 -24 -19 412.9 > 218.8 -10 -22 -27
PFTDA neg 712.8 > 668.8 -35 -20 -29
< 10 712.8 > 218.9 -35 -34 -13 712.8 > 268.8 -35 -32 -15
PFOS neg 498.6 > 79.7 -90 -130 -9
1 498.6 > 229.8 -90 -50 -13 498.6 > 98.7 -90 -130 -11
MeFOSA neg 511.9 > 218.8 -200 -38 -21
1 511.9 > 169.0 -200 -38 -21 511.9 > 268.8 -200 -38 -21
(PFOPA) neg 498.8 > 78.8 -200 -38 -21
1 498.8 > 62.9 -200 -38 -21
BPA neg 227.0 > 212.0 -90 -24 -7
< 10 227.0 > 132.9 -90 -32 -15 227.0 > 211.0 -90 -38 -15
triclosan neg 286.9 > 35.0 -60 -8 -18
10 288.8 > 141.7 -60 -44 -17
ethyl paraben neg 164.9 > 91.9 -70 -28 -11 1
121

Screening of target and non-target contaminants in human blood and urine
Compound name modus Q1 (Da) > Q3 (Da) DP (volts)
CE (volts)
CXP (volts)
instr LDC [ng/mL extract]
164.9 > 136.9 -70 -20 -7 164.9 > 92.8 -70 -26 -9
butyl paraben neg 193.0 > 91.8 -80 -32 -11
< 1 193.0 > 135.8 -80 -22 -15 193.0 > 136.9 -80 -22 -13
(tetrachlorosalicylanilide) pos 348.9 > 272.8 76 21 14
348.9 > 139.0 76 29 6
quaternium 15 pos 215.0 > 172.0 26 17 20
< 10 215.0 > 101.9 26 29 12 215.0 > 42.0 26 53 10
benzylQUAT pos 303.9 > 90.9 96 53 10
< 1 303.9 > 212.2 96 29 10 303.9 > 65.0 96 97 8
trimethylQUAT pos 171.9 > 60.0 81 27 16
< 1 171.9 > 43.0 81 41 12 171.9 > 41.0 81 51 10
michlers ketone pos 269.0 > 148.0 151 29 14
< 1 269.0 > 76.9 151 75 14 269.0 > 120.0 151 41 12
phenolphthalein pos 318.9 > 225.0 -75 -18 -11
< 1 318.9 > 114.9 -75 -24 -11 318.9 > 141.0 -75 -32 -17
cinnamate pos 291.0 > 161.0 101 25 20
2 291.0 > 179.0 101 11 10 291.0 > 133.0 101 43 16
homosalate pos 263.0 > 230.9 26 19 12
< 10 263.0 > 74.9 26 43 10 263.0 > 155.0 26 31 18
Internal Standards BPA-d16 neg 242.2 > 224.2 -200 -38 -21
PFOS-13C4 neg 502.9 > 79.7 -200 -38 -21 502.9 > 98.7 -200 -38 -21
PFBA-13C3 neg 215.8 > 171.9 -200 -38 -21
chlormequat-d9 pos 131.1 > 68.1 130 44 10 131.1 > 95.1 130 44 10
p-toluene-sulfonamide-d4 neg 174.1 > 110.0 -200 -38 -21 174.1 > 79.9 -200 -38 -21 174.1 > 78.9 -200 -38 -21
carbendazim-d4 pos 196.0 > 163.9 130 44 10
122

Screening of target and non-target contaminants in human blood and urine
Compound name modus Q1 (Da) > Q3 (Da) DP (volts)
CE (volts)
CXP (volts)
instr LDC [ng/mL extract]
196.0 > 135.9 130 44 10 DEET-d3 pos 195.2 > 93.0 130 44 10
PhIP-d3 pos 227.8 > 115.0 130 44 10 227.8 > 113.9 130 44 10 227.8 > 112.9 130 44 10
diazinon-d10 pos 315.0 > 163.0 130 44 10 315.0 > 96.9 130 44 10 315.0 > 169.0 130 44 10
123

Screening of target and non-target contaminants in human blood and urine
Figure A 2: Recoveries of internal standards in blood and urine samples (error bars represent the standard deviation).
124

Screening of target and non-target contaminants in human blood and urine
Figure A 3: Extracted ion chromatograms of the calculated m/z values for dihydroxy-benzophenone-sulfate and glucuronide analysed by DI in the still conjugated extract of sample 21.
125


