Human-caused mortality influences spatial population dynamics: Pumas in landscapes with varying mortality risks Jesse R. Newby a,b,⇑ , L. Scott Mills a , Toni K. Ruth c,1 , Daniel H. Pletscher a , Michael S. Mitchell d , Howard B. Quigley b,e , Kerry M. Murphy f , Rich DeSimone g a Wildlife Biology Program, Department of Ecosystem and Conservation Sciences, University of Montana, Missoula, MT 59812, USA b Craighead Beringia South, 6955 E 3rd St., Kelly, WY 83011, USA c Hornocker Wildlife Institute/Wildlife Conservation Society, 301 N Wilson Avenue, Bozeman, MT 59715, USA d Wildlife Biology Program, U.S. Geological Survey, Montana Cooperative Wildlife Research Unit, University of Montana, Missoula, MT 59812, USA e Panthera, 8 W 40th St., 18th Floor, New York, NY 10018, USA f Bridger-Teton National Forest, 340 N Cache, Jackson, WY 83001, USA g Montana Fish, Wildlife and Parks, Helena, MT 59620, USA article info Article history: Received 27 March 2012 Received in revised form 31 August 2012 Accepted 22 October 2012 Available online 22 January 2013 Keywords: Dispersal Population contribution Puma concolor Source–sink Spatially structured populations abstract An understanding of how stressors affect dispersal attributes and the contribution of local populations to multi-population dynamics are of immediate value to basic and applied ecology. Puma (Puma concolor) populations are expected to be influenced by inter-population movements and susceptible to human- induced source–sink dynamics. Using long-term datasets we quantified the contribution of two puma populations to operationally define them as sources or sinks. The puma population in the Northern Greater Yellowstone Ecosystem (NGYE) was largely insulated from human-induced mortality by Yellow- stone National Park. Pumas in the western Montana Garnet Mountain system were exposed to greater human-induced mortality, which changed over the study due to the closure of a 915 km 2 area to hunting. The NGYE’s population growth depended on inter-population movements, as did its ability to act as a source to the larger region. The heavily hunted Garnet area was a sink with a declining population until the hunting closure, after which it became a source with positive intrinsic growth and a 16increase in emigration. We also examined the spatial and temporal characteristics of individual dispersal attributes (emigration, dispersal distance, establishment success) of subadult pumas (N = 126). Human-caused mor- tality was found to negatively impact all three dispersal components. Our results demonstrate the influ- ence of human-induced mortality on not only within population vital rates, but also inter-population vital rates, affecting the magnitude and mechanisms of local population’s contribution to the larger metapopulation. Ó 2012 Elsevier Ltd. All rights reserved. 1. Introduction An understanding of how human-induced mortality affects dis- persal characteristics and the role of local populations on the land- scape is of immediate value to conservation (Braunisch et al., 2012). Recognizing that populations interact across heterogeneous environments (Revilla et al., 2004; Small et al., 1991; Thomas and Kunin, 1999), wildlife and fisheries managers are increasingly incorporating population spatial structure into conservation efforts (Botsford et al., 2009; McCullough, 1996; Rabinowitz and Zeller, 2010). Spatial management approaches are especially applicable when mortality operates differentially across the landscape (e.g. in and around protected areas) (Balme et al., 2010; Novaro et al., 2005; Woodroffe and Ginsberg, 1998) and for highly vagile and cryptic species (Joshi and Gadgil, 1991; McCullough, 1996). Our understanding of stage-specific mortality effects on local population dynamics in vertebrates is well developed, with strong links between conceptual models and field data (Gaillard et al., 2000; Johnson et al., 2010; Oli and Dobson, 2003; Saether and Bakke, 2000). By contrast, few studies have explicitly linked field data to models of landscape population dynamics that account for influences of mortality on both within and among-population vital rates (Griffin and Mills, 2009; Runge et al., 2006). Dispersal involves three distinct components: emigration from the natal range, movement between natal and breeding range, and successful establishment into that breeding range (Bowler 0006-3207/$ - see front matter Ó 2012 Elsevier Ltd. All rights reserved. http://dx.doi.org/10.1016/j.biocon.2012.10.018 ⇑ Corresponding author. Address: Craighead Beringia South, Teton Cougar Project, 1495 Riverbend Road, Superior, MT 59872, USA. Tel.: +1 406 822 0781; fax: +1 866 521 8358. E-mail address: [email protected](J.R. Newby). 1 Present address: Selway Institute, PO Box 92940, Heronwood Lane, Bellevue, ID 83313, USA Biological Conservation 159 (2013) 230–239 Contents lists available at SciVerse ScienceDirect Biological Conservation journal homepage: www.elsevier.com/locate/biocon
Transcript
Biological Conservation 159 (2013) 230–239
Contents lists available at SciVerse ScienceDirect
E-mail address: [email protected] (J.R. Newby).1 Present address: Selway Institute, PO Box 92940, Heronwood Lane, Bellevue, ID
83313, USA
Jesse R. Newby a,b,⇑, L. Scott Mills a, Toni K. Ruth c,1, Daniel H. Pletscher a, Michael S. Mitchell d,Howard B. Quigley b,e, Kerry M. Murphy f, Rich DeSimone g
a Wildlife Biology Program, Department of Ecosystem and Conservation Sciences, University of Montana, Missoula, MT 59812, USAb Craighead Beringia South, 6955 E 3rd St., Kelly, WY 83011, USAc Hornocker Wildlife Institute/Wildlife Conservation Society, 301 N Wilson Avenue, Bozeman, MT 59715, USAd Wildlife Biology Program, U.S. Geological Survey, Montana Cooperative Wildlife Research Unit, University of Montana, Missoula, MT 59812, USAe Panthera, 8 W 40th St., 18th Floor, New York, NY 10018, USAf Bridger-Teton National Forest, 340 N Cache, Jackson, WY 83001, USAg Montana Fish, Wildlife and Parks, Helena, MT 59620, USA
a r t i c l e i n f o
Article history:Received 27 March 2012Received in revised form 31 August 2012Accepted 22 October 2012Available online 22 January 2013
An understanding of how stressors affect dispersal attributes and the contribution of local populations tomulti-population dynamics are of immediate value to basic and applied ecology. Puma (Puma concolor)populations are expected to be influenced by inter-population movements and susceptible to human-induced source–sink dynamics. Using long-term datasets we quantified the contribution of two pumapopulations to operationally define them as sources or sinks. The puma population in the NorthernGreater Yellowstone Ecosystem (NGYE) was largely insulated from human-induced mortality by Yellow-stone National Park. Pumas in the western Montana Garnet Mountain system were exposed to greaterhuman-induced mortality, which changed over the study due to the closure of a 915 km2 area to hunting.The NGYE’s population growth depended on inter-population movements, as did its ability to act as asource to the larger region. The heavily hunted Garnet area was a sink with a declining population untilthe hunting closure, after which it became a source with positive intrinsic growth and a 16� increase inemigration. We also examined the spatial and temporal characteristics of individual dispersal attributes(emigration, dispersal distance, establishment success) of subadult pumas (N = 126). Human-caused mor-tality was found to negatively impact all three dispersal components. Our results demonstrate the influ-ence of human-induced mortality on not only within population vital rates, but also inter-populationvital rates, affecting the magnitude and mechanisms of local population’s contribution to the largermetapopulation.
� 2012 Elsevier Ltd. All rights reserved.
1. Introduction
An understanding of how human-induced mortality affects dis-persal characteristics and the role of local populations on the land-scape is of immediate value to conservation (Braunisch et al.,2012). Recognizing that populations interact across heterogeneousenvironments (Revilla et al., 2004; Small et al., 1991; Thomas andKunin, 1999), wildlife and fisheries managers are increasinglyincorporating population spatial structure into conservation efforts(Botsford et al., 2009; McCullough, 1996; Rabinowitz and Zeller,
2010). Spatial management approaches are especially applicablewhen mortality operates differentially across the landscape (e.g.in and around protected areas) (Balme et al., 2010; Novaro et al.,2005; Woodroffe and Ginsberg, 1998) and for highly vagile andcryptic species (Joshi and Gadgil, 1991; McCullough, 1996).
Our understanding of stage-specific mortality effects on localpopulation dynamics in vertebrates is well developed, with stronglinks between conceptual models and field data (Gaillard et al.,2000; Johnson et al., 2010; Oli and Dobson, 2003; Saether andBakke, 2000). By contrast, few studies have explicitly linked fielddata to models of landscape population dynamics that accountfor influences of mortality on both within and among-populationvital rates (Griffin and Mills, 2009; Runge et al., 2006).
Dispersal involves three distinct components: emigration fromthe natal range, movement between natal and breeding range,and successful establishment into that breeding range (Bowler
and Benton, 2005; Howard, 1960). Due to the long and unpredict-able movements inherent in dispersal events, estimating thesecomponents can be difficult (Cooper et al., 2008; Koenig et al.,1996; Morrison and Wood, 2009). If among and within-populationvital rates can be derived from the field, however, the role of a localpopulation within the multi-population context can be quantifiedand source and sink areas operationally identified (Griffin andMills, 2009; Runge et al., 2006).
Pumas provide an example of the importance of inter-popula-tion processes and spatial structure for population ecology andmanagement. Dispersal can have a prominent effect on puma pop-ulation dynamics. For example, emigration can lead to local popu-lations exhibiting lower growth rates than those expected frompositive intrinsic vital rates (Cooley et al., 2009a; Robinson andDeSimone, 2011). Conversely, immigration can offset the popula-tion declines expected from negative intrinsic growth (Robinsonet al., 2008). Pumas are also subject to mortality from hunting, dep-redation removals, and other conflicts with humans which can cre-ate source–sink dynamics (Cooley et al., 2009b; Robinson et al.,2008; Stoner et al., 2006; Thompson and Jenks, 2005).
We used long-term, large-scale demographic data from twopuma populations with varying levels of human-induced mortalityto determine how mortality affects spatial population dynamics.Specifically, we operationally defined the populations as sourcesand sinks based on within-population growth and between popu-lation exchange, and determined how these varied temporally.Additionally, we examined the effects of human-caused mortalityon individual dispersal components (emigration, dispersal move-ment, and establishment success).
The Northern Greater Yellowstone Ecosystem (NGYE) pumapopulation was largely insulated from anthropogenic risks. Weused NGYE puma data from 2 periods. From 1987 to 1993 (hereaf-ter ‘‘phase I’’) the puma population was increasing after control ef-forts within Yellowstone National Park (early 20th century) andpersecution as a predator in surrounding areas (up to 1971) ceased(Murphy et al., 1999). During phase II (1998–2005) of NGYE re-search, the puma population was relatively stable and at a higherdensity (Ruth and Buotte, 2007).
In contrast to the NGYE, our second population in the GarnetMountains of Montana was exposed to higher human-caused mor-tality. In the first 3 years of Garnet research (1997–2000), pumaswere heavily hunted throughout the study area, but in subsequentyears (2001–2006) hunting was restricted (Robinson andDeSimone, 2011). However, human-induced mortality remainedrelatively high over all years of Garnet research compared to theNGYE (Montana Fish, Wildlife and Parks hunt reports 1988–2007; (DeSimone and Semmens, 2005; Ruth et al., 2011). Wehypothesized that after puma hunting was restricted in the Garnetarea the population’s per capita contribution to the region wouldincrease in part due to higher levels of dispersal into surroundingsubpopulations.
To help interpret changes in source–sink dynamics, we devel-oped regression models of emigration, dispersal distance andestablishment success to assess the influence of human-causedmortality. We tested the following predictions for how human-caused mortality could affect these three dispersal components:
(1) Emigration: Increases in the human-caused mortality ratewould reduce the probability of subadults emigrating. Thereduction of emigration could result from direct mortalityon subadults or by opening up adult territories, thus encour-aging philopatry (Cooley et al., 2009b).
(2) Dispersal distances: Dispersal distances would be shorterunder higher levels of puma harvest. Harvest could influencedispersal distances directly by killing individuals as they dis-persed and ending their movements. Heavy harvest could
also create population turnover and open territories for set-tlement (Kluyver and Tinbergen, 1970; Waser, 1985) leadingto settlement closer to natal areas.
(3) Establishment success: Dispersers in areas with heavy harvestwould have a reduced probability of successfully survivingto establish an adult home range, due to direct mortalityfrom harvest.
We assessed the influence of human-caused mortality on dis-persal components by developing and testing competing modelswhich also included effects of spatial/temporal variation, sex, andthe presence of wolves.
2. Study areas and methods
2.1. Study areas
2.1.1. Northern Greater Yellowstone Ecosystem (NGYE)The primary study area covered 3779 km2, including the north-
ern range of Yellowstone National Park, the adjoining Absorka-Beartooth Wilderness, and private and public lands in the Gardinerbasin (Murphy, 1998; Ruth et al., 2011). Terrain is mountainouswith steep broken canyons along the Yellowstone River and eleva-tions ranging from 1500 to 2900 m. Documentation of dispersalmovements extended out 200 km from the study area across theGreater Yellowstone Ecosystem.
Wolves were reintroduced to Yellowstone’s northern range in1995 and increased over much of the phase II study (Smith et al.,2010). Pumas were displaced from their kills and occasionallykilled by wolves (Ruth et al., 2008, 2011).
Pumas occupy the northern range of YNP year round but in win-ter the surrounding population is restricted to low elevation elkwintering range, making home ranges largely seasonal (Murphy,1998). Minimum estimated annual density of independent adultand subadult pumas ranged from 3.0 to 10.7/1000 km2 over bothstudy phases based on annual number observed via capture, telem-etry, and snow tracking for the extent of area covered by all esti-mated adult home ranges combined (Murphy, 1998; Ruth andBuotte, 2007; Ruth et al., 2011).
Approximately 58% of the study area (2224 km2) was withinpark boundaries where hunting of pumas was not allowed, and26% (974 km2) was within Wilderness areas from which no pumaswere harvested (Ruth et al., 2011). As pumas dispersed, theyencountered primarily public lands, in Yellowstone and GrandTeton National Parks and National Forests and Wilderness (84.2%public land).
2.1.2. Garnet Mountains, MontanaThe study area was situated in 2500 km2 of the mountainous
Blackfoot River Drainage, with elevations from 1160 to 2156 m.Wolves also occurred rarely in the area, but no resident populationwas documented during the study period (Harris, 2007). Dispersalof individuals from the core Garnet study area extended the studyarea radius 80 km throughout the Blackfoot drainage. The Black-foot drainage was comprised of 48% private lands with the re-mained made up of state and federal lands. Estimated minimumdensities of independent pumas in the Garnet study area was4.8–11.7/1000 km2, based on the number of observed individualsin the area covered by all adult home ranges combined (DeSimoneand Semmens, 2005; Robinson and DeSimone, 2011).
In the Garnet study area, liberal hunting of pumas was permit-ted from 1997 to 2000 (pre-closure). Hunting was then prohibitedin a 915-km2 area until 2006 (closure), but continued throughoutthe surrounding Blackfoot Drainage (DeSimone and Semmens,2005; Robinson and DeSimone, 2011). While individuals were
more protected from hunting in the core study area, they could stillbe exposed to hunting outside of the closure.
Overall human-caused mortality was higher in the Garnet sys-tem than in NGYE. The proportion of the estimated independentpuma population killed annually by humans in the Garnet studyarea (%mortality mean = 20.7%, 95% CI = 9.5–31.9) was significantlyhigher than in the NGYE (%mortality mean = 3.9%, 95% CI = 0.8–6.9)(Robinson and DeSimone, 2011; Ruth et al., 2008, 2011). Similarly,harvest of pumas was greater in the hunt districts adjacent to theGarnet study area (annual puma harvest mean = 4.3/1000 km2;95% CI = 1.5–7.2) compared to areas adjacent to the NGYE studyarea (annual puma harvest mean = 0.6/1000 km2; 95% CI = 0.4–0.8) (Robinson and DeSimone, 2011; Ruth et al., 2008, 2011).
2.2. Field sampling
Pumas >3 months of age were captured and immobilized usinghounds. Kittens were captured in the den by hand at 5–8 weeks oldor with hounds the following winter. All pumas were permanentlymarked and fitted with a VHF or GPS radio-collar with mortalityswitches (Murphy, 1998; Ruth et al., 2008, 2010). VHF collaredindividuals were relocated at 1–14 day intervals from the groundand the air. A subset of adult and subadult individuals were fittedwith GPS collars beginning in 2001. All captures and handling pro-tocols accorded with the University of Montana Institutional Ani-mal Care and Use Committee standards (protocol #040-05SMWB-030106).
Minimum numbers of adult and subadult pumas were docu-mented annually during winter through telemetry marking incombination with extensive snow track transects (1200–2850 km/winter) to detect unmarked individuals (DeSimone andSemmens, 2005; Murphy, 1998; Ruth and Buotte, 2007). Additionaldocumentation of pumas in the study areas was gathered from re-source management personnel, hound hunters, and state harvestrecords.
Detectability of independent pumas was assessed by back-cal-culating individuals captured as adults into the population basedon their age, with the assumption females were philopatric andmales entered the population at 2 years old. This allowed estimatesof the proportion of independent pumas marked to the total num-ber assumed to be in the population for all study years, excludingthe last. This method may have underestimated detectablity assome individuals may have entered the population later than as-sumed. See Logan and Sweanor (2001; pp. 65–68), for additionaldetails.
Using the back-calculating estimate, the study areas had similardetectability (NGYE mean = 73.4% SE = 8.56%; Garnet mean = 82.1%SE = 6.16%). Despite the estimated accuracy of annual populationestimates, we consider population estimates to be minimums be-cause undocumented pumas may have used areas overlappingthe study areas and transients may have passed throughundetected.
2.3. Emigration
Dispersers are subadults, independent from their mothers butnot yet established as breeding adults at approximately 24 monthsof age (Cooley et al., 2009b; Logan and Sweanor, 2001; Murphy,1998). We censored from the dataset subadult pumas that diedwithin their natal home ranges before 24 months old, and classi-fied remaining subadults born in the study area as emigrants orphilopatric. Emigrants were those that left their natal home rangewithout returning. Philopatric individuals were those that survivedto 24 months old and whose movements overlapped their natalrange by 5% or more (95% fixed kernel home range estimates;Logan and Sweanor, 2001).
The influence of covariates on the probability of subadult pu-mas emigrating was examined using generalized linear modelswith a binomial error structure. The influence of human-causedmortality was modeled using the proportion of the independentpuma population killed by humans in the winter preceding indi-viduals entering the subadult age class. Population density was in-cluded as a covariate using annual minimum estimates of theindependent puma population for the year an individual becamea subadult. The sex of the disperser was included because dispersalin pumas is typically male biased. Interaction terms between sexand human-caused mortality along with sex and density were in-cluded because harvest tends to be male biased and the sexesmay respond differently to density (Cougar Management Guide-lines Working Group, 2005; Ruth et al., 2011; Sweanor et al.,2000). Spatio-temporal effects were included in models as site spe-cific change over time in emigration. Finally, the presence of a res-ident wolf population was included as a categorical variable(present vs. absent).
2.4. Dispersal distance
Post-emigration monitoring was conducted through aerialtelemetry with approximately bi-monthly flights. Flights rangedup to a maximum of 200 km from the primary study area. Informa-tion for dispersal distance and fates were also supplied by huntertag returns (41 of 125 dispersers), which sometimes provided doc-umentation years after the disperser was lost to radio tracking.
Dispersal distance was measured as the Euclidean distance be-tween a disperser’s origin and final dispersal location. We fixed theorigin of the dispersal event as the median location of the emi-grant’s natal range prior to dispersal. In the absence of adequaterelocation data to determine a natal range (N = 5 of 86 pumas),the individual’s pre-dispersal capture site was considered the ori-gin. The final dispersal location was the median location of theindividual’s established adult home range post-dispersal, or in 44out of 86 cases the individual’s mortality site was used. In casesof lost contact, we used the last location obtained for the individualas a final dispersal location (N = 22). Estimates of dispersal distanceshould be considered minimums as individuals may have dis-persed further than documented.
Differences in dispersal distance between study areas may re-flect differences in the distribution of resources, conspecifics, com-petitors, and anthropogenic development all of which may act ondisperser space use. To account for the area specific differencesin space use we scaled dispersal distance by average home rangediameter, which is also expected to vary with these factors(Labonte et al., 1998; Ruth and Buotte, 2007; Trewhella et al.,1988; Waser, 1985). Adult lifetime home ranges for each sex inboth study areas were estimated using a 95% fixed kernel and con-verted to represent an equivalently sized circular home range:
2ðffiffið
phome range areaÞ=pÞ ð1Þ
Linear dispersal distances were then divided by this diameter todetermine number of average home ranges traversed (Dhrd).
We modeled covariate effects on Dhrd using linear regression.The influence of human-caused mortality was assessed by includ-ing a categorical term indexing the level of harvest mortality in thearea during the study (high >1.4 pumas/1000 km2/year; low<1.4 pumas/1000 km2/year) (Robinson and DeSimone, 2011). Thiscorresponded to our two study systems with the region surround-ing the Garnet study area exhibiting high harvest mortality(mean = 4.3 pumas/1000 km2/year; 95% CI = 1.5–7.2) and the re-gion around the NGYE study area low (mean = 0.6 pumas/1000 km2/year; 95% CI = 0.4–0.8). Harvest level was used as an in-dex of human-caused mortality because detailed population and
mortality data were unavailable outside the primary study areas.The amount of harvest was considered a suitable proxy becauseit is the primary source of human-caused mortality in both areas(Robinson and DeSimone, 2011; Ruth et al., 2011).
Models also included variables for study area specific changeover time, sex, wolf presence, and individual’s fate. The fate ofthe disperser, whether it was killed, survived, or was lost duringdispersal, was included because early mortality or loss of contactcould reduce distance estimates.
2.5. Disperser success
Each disperser was classified as successfully establishing ahome range, mortality while transient, or as contact lost. Becausefemale pumas typically establish an adult home range by24 months old, we assumed successful dispersal of radio-collaredfemales when movement localized and remained stable until theywere >24 months old (Cooley et al., 2009b; Logan and Sweanor,2001; Murphy, 1998).
The completion of male dispersal was complicated by a ten-dency to restrict movements during their first winter after leavingtheir natal range, and then abandoning these temporary homeranges to continue dispersal (Beier, 1995). Therefore, males werenot assumed to have ended their transient movements until thebeginning of autumn (September 23rd) following their first winterindependent from their mothers. Cats that could not be reliablyrelocated using radio-telemetry but were later relocated from tagreturns (19 of 86 dispersers) were considered successful dispersalsif they reached adulthood. Dispersers that died before reachingadulthood were considered to have failed to successfully establish.
Dispersal success was modeled using generalized linear regres-sion models with a binomial error structure. Variables examinedincluded harvest level, study area specific change over time, sex,and the presence of wolves as described above.
2.6. Model fitting and selection
Models examining the influence of covariates on dispersal com-ponents were evaluated in an AIC framework. Prior to multivariatemodel fitting, variables were tested to ensure independence (60.6correlation). Univariate models were fit to assess assumptions ofnormality and linearity through inspection of residual plots, andtransformations were explored to assess their ability to improvemodel fit.
Akaike’s information criterion corrected for small sample sizes(AICc) was used in model selection. Models within 2 DAIC unitswere considered strongly supported. Explanatory variables identi-fied in these models were ranked in importance based on the sumof AIC weights (wj) and estimates of parameters and variance weremade using full multimodal inference (MMI) (Burnham andAnderson, 1998).
All data summations and statistical analyses were performedusing R, version 2.9.1 (The R Foundation for Statistical Computing,2009).
2.7. Population contribution
We estimated annual per capita contribution of each populationto metapopulation growth (Cr), accounting for both recruitment ofphilopatric individuals into the population (Rr), as well as recruitsprovided to other subpopulations via successful emigration (Er)(Runge et al., 2006). The annual self-recruitment rate (R) of the lo-cal population (r), was estimated by the annual observed growth(minus immigration) in the independent age class (subadults andadults). Thus,
Rr ¼ kr � Ir ð2Þ
where kr is the annual observed proportionate change in populationsize of independent pumas from December to December. The termIr denotes the annual per capita rate of immigration into the popu-lation. Although abundance and immigration rates were derivedfrom the annual near-complete census surveys described above,the expected minor sampling variance could not be separated fromprocess variance.
We estimated the contribution made by the local population viasuccessful dispersal to other subpopulations, (Er) with:
Er ¼ erj �X
Ursj ð3Þ
where erj is the proportion of independent pumas emigrating from
the study area (r) annually, Ursj is the average successful immigra-
tion of a disperser from (r) into other subpopulations (s) and thesubscript j denotes that individuals are independent subadults(the dispersal age class). Emigration was obtained through radio-telemetry and tag return data on the number of individuals emi-grating from their natal range (and from the study area) dividedby the number of independent pumas estimated in the populationthat year. Successful immigration into another subpopulation wasestimated based on the proportion of all emigrants with knownfates that survived to establish an adult home range outside thestudy area. The average success of individuals of known fates acrossthe study period was used in each annual calculation.
The average annual per capita contribution Cr of a populationwas thus estimated over ‘‘t’’ years of study:
Cr ¼ ððkr � IrÞ þ ðerj �X
Ursj ÞÞ=t ¼ ðRr þ ErÞ=t ð4Þ
Annual Cr > 1 indicates that the local population was a net con-tributor to the metapopulation and acting as a source, while aCr < 1 indicates the population acted as a sink (Runge et al.,2006). Note that a local population that is not maintaining itselfby self-recruitment (Rr < 1) can still act as a source via dispersalto other subpopulations.
The contribution of the NGYE was estimated separately forphase I (1987–1992), while the population was expanding, andin phase II (1999–2003) after wolves were reintroduced and thepuma population plateaued (Ruth and Buotte, 2007). The contribu-tion of the Garnet study area was also examined over two timeperiods, when hunting was permitted in the core of the study area(pre-closure: 1997–2000) and after hunting was restricted to areasoutside of the core study area (closure: 2000–2006).
3. Results
3.1. Field sampling
Dependent kittens marked during research totaled 200 (NGYEn = 116; Garnet n = 84) and 113 of these kittens were monitoredto subadult age (NGYE n = 61; Garnet n = 52). Additional pumasborn on the study areas initially captured as subadults increasedthe total number of marked subadults to 126 (NGYE n = 68; Garnetn = 58). Of these marked individuals, 104 (83%) were monitoreduntil their fate (death or successful establishment as adults) couldbe determined (NGYE n = 53; Garnet n = 51).
3.2. Emigration
NGYE showed no sex differences in the proportion of males andfemales emigrating (27/33 for males; 26/35 for females), but in theGarnet system a greater proportion of males (19/26) than females(14/32) emigrated. Whereas a higher proportion of males than fe-males emigrated in the Garnet study overall, in years when hunt-ing occurred in the core study area no males dispersed (0/4) and25% of females dispersed (1/4). Thus, during years hunting was
Table 1Modeled effects on dispersal components (emigration rate, distance dispersed, and success in establishing adult home ranges). Models are ranked by AIC weights, with only thebest supported models (<2 DAIC) shown.
Rank Emigration model n df AICc DAIC Weight (wi)
1 Density + HC Morta + Sex 119 115 124.28 0 0.1432 Density + HC Mort + Sex + HC Mort:Sex + Study Area 119 113 124.35 0.069 0.1383 Density + HC Mort + Sex + Study Area 119 114 124.84 0.56 0.1084 Density + HC Mort + Sex + Density:Sex + HC Mort:Sex 119 113 125.27 0.989 0.0875 Density + HC Mort + Sex + Density:Sex + HC Mort:Sex + Study Area 119 112 125.56 1.278 0.0756 Density + HC Mort + Sex + HC Mort:Sex 119 113 125.58 1.299 0.0757 Density + HC Mort + Sex + Wolvesb 119 114 125.76 1.48 0.068
1 Hunt Level + Sex 64 61 79.32 0 0.1932 Hunt Level + Sex + Wolves 64 60 80.14 0.83 0.1283 Sex + Wolves 64 61 80.25 0.935 0.1214 Sex + Study Area:Time 64 60 80.57 1.258 0.1035 Hunt Level + Sex + Study Area:Time 64 58 80.81 1.499 0.0916 Hunt Level + Sex + Harvest Level:Sex 64 60 80.97 1.658 0.084
a HC Mort = Annual proportion of population killed from human-causes.b Wolves = Catagorical variable indicating presence of a resident wolf population.c Dispersal distance measured as number of average home range diameters crossed (Dhrd).d Hunt Level = Level of puma harvest in an area categorized as (high >1.4 pumas/1000 km2/year).
permitted throughout the core Garnet area only one emigrationwas documented in 3 years. After hunting was restricted annualemigration increased to 2–8 emigrants per year.
The best supported model of puma emigration included termsfor puma density, human-caused mortality, and subadult’s sex(AIC weight = 0.143). Six other models were within 2 DAIC unitsof the top model and were considered strongly supported (Table 1).These models also included effects of study area, wolf presence,and interaction terms between sex and human-caused mortalityand density. Based on multi-model inference (MMI) across allmodels, variables ranked in importance as: density (wj = 1.0), hu-man-caused mortality (wj = 0.995), sex (wj = 0.988), study area(wj = 0.541), human-caused mortality:sex (wj = 0.479), density:sex(0.33), wolves (wj = 0.313) (Appendix A).
Parameter estimates from MMI showed emigration was nega-tively associated with both density (b = �0.147, SE = 0.106) andhuman-caused mortality (b = �3.902, SE = 1.755). Emigration wasgreater for males (b = 1.83, SE = 0.9) and for individuals in theNGYE (b = 0.323, SE = 0.238). Male were especially influenced byhuman-caused mortality and density (male:human-caused mor-tality: b = �2.829, SE = 1.795; male:density: b = �0.056,SE = 0.057). Some models indicated greater emigration tendenciesin the presence of a resident wolf population (b = 0.075, SE = 0.09).
3.3. Dispersal distance
Absolute dispersal distances for males and females in the NGYEwere similar, with mean Euclidean dispersal distance of 67.4 km(SE = 3.9, N = 24) for females and 62 km (SE = 7.1, N = 25) for males.However, NGYE females dispersed more of their respective homerange diameters than males (females 3.08Dhrd, SE = 0.43; males1.81Dhrd, SE = 0.21) (Fig. 1). Garnet area males dispersed furtherthan females in absolute distance (males 42.6 km, SE = 2.6,N = 18; females 24.2 km, SE = 2.6, N = 14). However, after scalingfor home range size there was little difference (male Dhrd = 1.44,SE = 0.13; female Dhrd = 1.3, SE = 0.14). In terms of Dhrd, females inthe NGYE dispersed further than any other group (all two-tailedt-test between NGYE females and other groups, p < 0.013).
The top model of dispersal distances scaled by home range size(Dhrd) included effects for disperser sex, harvest level, and the
presence of wolves (AIC weight = 0.223). Two models were within2 DAIC units of the top model and included the additional factor ofdisperser fate and an interaction between sex and harvest level(Table 1). Variables were ranked by importance as sex(wj = 0.931), harvest level (wj = 0.871), sex:harvest level (wj = 0.7),wolves (wj = 0.597), and disperser’s fate (wj = 0.417) (Appendix A).
Parameter estimates indicated a negative association betweenmales and Dhrd (b = �0.576, SE = 0.181) as well harvest level andDhrd (b = �0.682, SE = 0.227). An interaction between sex and har-vest level indicated dispersal distance for males was higher thanexpected given high harvest levels (b = 0.67, SE = 0.283). Therewas evidence that dispersal distances were greater in the presenceof a resident wolf population (b = 0.262, SE = 0.139). Individualsthat died before completing dispersal had shorter dispersal dis-tances (b = �0.637, SE = 0.028), as did individuals for which contactwas lost (b = �0.554, SE = 0.03).
3.4. Disperser success
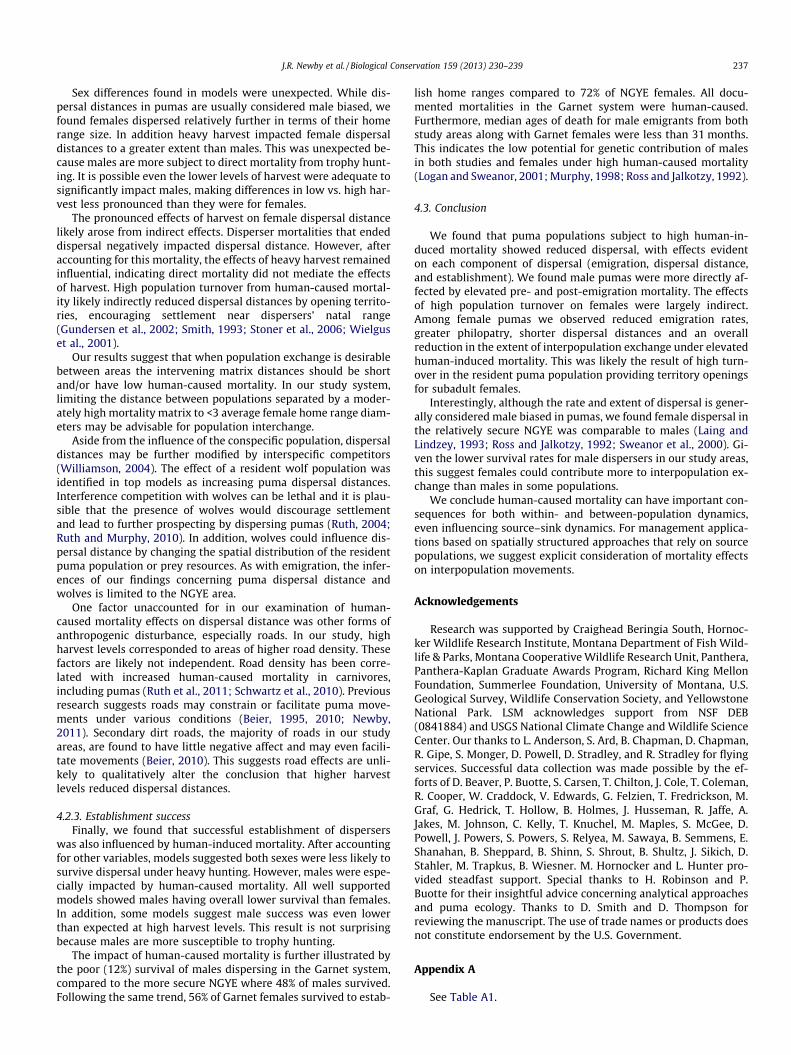
Females were more successful in surviving dispersal to estab-lish an adult home range than males (Fig. 2). In addition, individu-als dispersing in the NGYE were more likely to successfullydisperse than their same sex counterparts in the higher mortalityGarnet area. This pattern was also observed in the median agesat death for all individuals with known fates, inclusive of those thatestablished. Median age at death for females after they dispersedwas 55.8 and 30.8 months in the NGYE and Garnet areas, respec-tively. For male dispersers, the median age at death was 30.5 and21.6 months in the NGYE and Garnets, respectively.
In the Garnet system all known mortalities of dispersing males(17 mortalities) and females (6 mortalities) were human-caused.Of the 21 documented mortalities of males dispersing from theNGYE study area, 16 were killed by hunters. Of 13 NGYE femalemortalities 8 were human-caused. The remaining NGYE dispersermortalities were from natural causes such as fights with conspecif-ics and infections.
The top model examining the success of dispersers in survivingto establish home ranges included terms for disperser’s sex andharvest level (AIC weight = 0.193). Five competing models werewithin 2 DAIC units and included effects for wolves, study area
Fig. 1. Number of dispersing pumas whose final locations were at different distances (scaled by home range diameter) from natal ranges in the Northern Greater Yellowstone(NGYE) and Garnet study areas. Home range diameters were estimated separately for male and female adult pumas in both study areas using mean 95% fixed kernelestimates.
Fig. 2. Percent of dispersing male and female subadult pumas from the Northern Greater Yellowstone (NGYE) and Garnet Mountain study areas that successfully surviveddispersal to establish territories. Individuals that reached the adult age class were assumed to have established. Individuals lost to monitoring efforts and with unknown fateshave been omitted. Error bars represent standard error.
specific changes over time, and an interaction between sex andharvest level (Table 1 and Appendix A). Variables were ranked byimportance as sex (wj = 0.969), harvest level (wj = 0.703), wolves(wj = 0.505), time:study (wj = 0.384), and sex:harvest level(0.217). Males were less likely to survive dispersal as were individ-uals in the high harvest level area (Sex(male) b = �1.18, SE = 0.378;Harvest Level(high) b = �139.3, SE = 85.77). Models indicated a posi-tive association between disperser success and areas with a resi-dent wolf population (b = 0.817, SE = 0.472). An increase indisperser success over time was suggested for the Garnet study
0.2
0.4
0.6
0.8
1.2
1.4
0
1
NGYE phase I NGYE phase II Garnet (p
Fig. 3. Mean estimated contribution (C) of study areas. Contributions >1 indicate populinternal growth, gray bars the contribution through dispersal into other areas. Estimategrowth or positively contribute regionally. However, it could still act as a net source viadeclining with little dispersal. After the closure it contributed both through its own gro
(b = 0.036, SE = 0.34), as was a decrease in success in the NGYE overtime (b = �0.034, SE = 0.033). Dispersers sex appeared to interactwith harvest such that male success was especially impacted underhigh harvest (b = �0.375, SE = 0.105).
3.5. Population contribution
The estimated mean annual growth rate of the NGYE indepen-dent puma population during Phase I (from 1987 to 1992) wask = 1.11 (95% CI 1.03–1.18), subsidized by a high average per capita
re-closure) Garnet (closure)
DispersalSelf-recruitment
ation is a source, C < 1 is a sink. Black bars show population’s contribution throughs of self-recruitment in the NGYE indicate it was insufficient to maintain its owndispersal. The Garnet population before a 915 km2 area was closed to hunting was
annual immigration rate of 0.14 (SE = 0.03). Removing the popula-tion growth attributable to immigration provided a mean annualself-recruitment rate of R = 0.98, (95% CI = 0.92–1.03). Afteraccounting for subadults emigrating from the NGYE (e = 0.17,SE = 0.07) and the probability of surviving to establish in a newarea ð
PUrs
j ¼ 0:59; SE ¼ 0:08Þ, the net annual contribution rateof the NGYE averaged C = 1.1 (95% CI 0.96–1.23). Assuming a nor-mal distribution, 98% of estimates give C > 1 in phase I of NGYE re-search. In Phase II of NGYE research (1999–2003) puma populationgrowth appeared to be stationary to slightly negative, k = 0.95 (95%CI 0.84–1.06), with low per capita immigration rate of 0.05(SE = 0.02). Per capita emigration rate remained high (e = 0.23,SE = 0.05) and after accounting for disperser successðP
Ursj ¼ 0:59; SE ¼ 0:08Þ the population remained a source
[(C = 1.05; 95% CI 0.95–1.15); (C > 1 in 95% of estimates)] (Fig. 3).During pre-closure years of Garnet research (1997–2000), esti-
mates indicated a declining puma population (k = 0.75; 95% CI0.46–1.04). Little emigration from the study area occurred duringthis period (e = 0.01, SE = 0.01) and disperser survival was lowðP
Ursj ¼ 0:27; SE ¼ 0:09Þ, resulting in a population sink with
C = 0.76 (95% CI 0.47–1.0). However, when hunting was restricted(between 2000 and 2006) the population grew (k = 1.12; 95% CI0.91–1.34), per capita emigration rate increased (e = 0.27,SE = 0.09), and after accounting for disperser survivalððP
Ursj ¼ 0:27; SE ¼ 0:09Þ, the population became a source
(C = 1.21; 95% CI 1.02–1.39) (Fig. 3).We did not confirm any immigration into the Garnet population
during the years the population was studied. Any undetectedimmigrants would positively bias estimates of contribution as in-creases would be attributed to within population recruitment.However, undetected immigrants were unlikely to have qualita-tively changed Garnet’s post-closure source designation, becauseto cause C < 1 would require an unlikely high undetected immigra-tion rate (I > 0.18).
4. Discussion
We brought together extensive field datasets from 2 study areasto quantify puma dispersal characteristics and explore the land-scape-level effects of human-induced mortality on these character-istics. Furthermore, we used inter-population vital rate estimates,coupled with estimated within-population growth, to quantifyeach population’s contribution to landscape-level dynamics andoperationally define them as sources or sinks (Griffin and Mills,2009).
4.1. Population contribution
In both study areas we found that inter-population movementslargely modulated both local population growth and the popula-tion’s contribution to the surrounding region. For example, the ob-served self-recruitment rate in the NGYE was not sufficient tomaintain positive population growth and was supported by immi-gration. Despite this, the population was a net source because itconsistently exported large numbers of recruits to other subpopu-lations. This illustrates how a failure to account for dispersal canlead to faulty conclusions about the role a population plays in itsregional context (Figueira and Crowder, 2006; Griffin and Mills,2009; Gundersen et al., 2001). In the case of the NGYE, ignoringthe contribution via dispersal would suggest the population wasa sink, whereas not accounting for immigration would fail to showits own dependence on immigration. Indeed, the NGYE may be a‘‘dependent source’’ which acts as a source of recruits for surround-ing areas, but relies on immigration for its own growth (Franklinet al., 2004; Hixon et al., 2002). Therefore, to retain natural popu-lation processes it may be advisable to conserve multiple, mutually
supportive source areas, especially when annual contribution isvariable as in our study populations.
The potential effects of elevated human-induced mortality onwithin-population effects are well established. We found human-induced mortality can also affect interpopulation vital rates withconsequences for local and regional populations. Under heavyhunting pressure, the Garnet puma population was acting as a sinkwith a declining population and little emigration. After the creationof a small refuge (915 km2), and reduced hunting in the surround-ing area, it quickly became a source. The increased contributionwas due to both internal growth and an increase in per capita emi-gration leading to a 16-fold increase in absolute number of emi-grants/year. Our findings support Robinson and DeSimone (2011)conclusion that even a relatively small area (1000 km2) with ade-quate habitat quality may act as a source for large felids, providedmortality is minimized.
4.2. Emigration, dispersal distance and establishment success
Interpopulation dynamics, and their population consequences,will depend on the characteristics of dispersal including emigra-tion, dispersal distance, and establishment success (Bowler andBenton, 2005; Howard, 1960). Human-caused mortality was foundto reduce all three of these dispersal components.
4.2.1. EmigrationAfter accounting for other explanatory variables, we found an-
nual emigration rates were reduced by the amount of human-caused mortality in the population. Despite the strong emigrationtendencies exhibited by males, human-caused mortality was foundto especially impact male emigration. This is likely the result ofmales being more heavily targeted by trophy hunting, the primarysource of human-caused mortality. Human-caused mortality di-rectly altered male emigration by killing males before they couldemigrate from their natal area. For example, when heavy huntingwas allowed throughout the Garnet study area all males were killedimmediately after becoming independent from their mothers.
Female emigration appeared to be influenced more indirectlyby human-caused mortality. Whereas females in the more secureNGYE emigrated at high rates, females in the higher mortality Gar-nets had much lower emigration rates. Higher population turnoverin the Garnet area appeared to provide available territories nearthe natal area, which reduced female emigration rates by encour-aging philopatry (Matthysen, 2005; Sutherland et al., 2002; Wolff,1997).
In addition to the negative effects of human-caused mortality,some models suggested emigration may increase in the presenceof a resident wolf population. Emigration in the NGYE study areadid show an increase after wolves were reintroduced to the area.The presence of wolves may have encouraged subadult pumas toemigrate from the area directly or through this change in the spa-tial distribution of conspecifics. Ruth and Buotte (2007) foundNGYE pumas altered space use towards more steep, rugged terrainsuch as canyon areas after wolf reintroduction. These changes inspace use may have influenced emigration. However, we cautionthat the generalities of our finding are limited because we onlyexamined one system where wolves had become reestablished.In addition, the association between puma emigration and wolveswas not strongly supported after accounting for other explanatoryvariables.
4.2.2. Dispersal distanceThe second dispersal component, dispersal distance, was also
influenced by human-induced mortality. After accounting for sexand site specific differences in space use, we found dispersal dis-tances were reduced under heavy harvest.
Sex differences found in models were unexpected. While dis-persal distances in pumas are usually considered male biased, wefound females dispersed relatively further in terms of their homerange size. In addition heavy harvest impacted female dispersaldistances to a greater extent than males. This was unexpected be-cause males are more subject to direct mortality from trophy hunt-ing. It is possible even the lower levels of harvest were adequate tosignificantly impact males, making differences in low vs. high har-vest less pronounced than they were for females.
The pronounced effects of harvest on female dispersal distancelikely arose from indirect effects. Disperser mortalities that endeddispersal negatively impacted dispersal distance. However, afteraccounting for this mortality, the effects of heavy harvest remainedinfluential, indicating direct mortality did not mediate the effectsof harvest. High population turnover from human-caused mortal-ity likely indirectly reduced dispersal distances by opening territo-ries, encouraging settlement near dispersers’ natal range(Gundersen et al., 2002; Smith, 1993; Stoner et al., 2006; Wielguset al., 2001).
Our results suggest that when population exchange is desirablebetween areas the intervening matrix distances should be shortand/or have low human-caused mortality. In our study system,limiting the distance between populations separated by a moder-ately high mortality matrix to <3 average female home range diam-eters may be advisable for population interchange.
Aside from the influence of the conspecific population, dispersaldistances may be further modified by interspecific competitors(Williamson, 2004). The effect of a resident wolf population wasidentified in top models as increasing puma dispersal distances.Interference competition with wolves can be lethal and it is plau-sible that the presence of wolves would discourage settlementand lead to further prospecting by dispersing pumas (Ruth, 2004;Ruth and Murphy, 2010). In addition, wolves could influence dis-persal distance by changing the spatial distribution of the residentpuma population or prey resources. As with emigration, the infer-ences of our findings concerning puma dispersal distance andwolves is limited to the NGYE area.
One factor unaccounted for in our examination of human-caused mortality effects on dispersal distance was other forms ofanthropogenic disturbance, especially roads. In our study, highharvest levels corresponded to areas of higher road density. Thesefactors are likely not independent. Road density has been corre-lated with increased human-caused mortality in carnivores,including pumas (Ruth et al., 2011; Schwartz et al., 2010). Previousresearch suggests roads may constrain or facilitate puma move-ments under various conditions (Beier, 1995, 2010; Newby,2011). Secondary dirt roads, the majority of roads in our studyareas, are found to have little negative affect and may even facili-tate movements (Beier, 2010). This suggests road effects are unli-kely to qualitatively alter the conclusion that higher harvestlevels reduced dispersal distances.
4.2.3. Establishment successFinally, we found that successful establishment of dispersers
was also influenced by human-induced mortality. After accountingfor other variables, models suggested both sexes were less likely tosurvive dispersal under heavy hunting. However, males were espe-cially impacted by human-caused mortality. All well supportedmodels showed males having overall lower survival than females.In addition, some models suggest male success was even lowerthan expected at high harvest levels. This result is not surprisingbecause males are more susceptible to trophy hunting.
The impact of human-caused mortality is further illustrated bythe poor (12%) survival of males dispersing in the Garnet system,compared to the more secure NGYE where 48% of males survived.Following the same trend, 56% of Garnet females survived to estab-
lish home ranges compared to 72% of NGYE females. All docu-mented mortalities in the Garnet system were human-caused.Furthermore, median ages of death for male emigrants from bothstudy areas along with Garnet females were less than 31 months.This indicates the low potential for genetic contribution of malesin both studies and females under high human-caused mortality(Logan and Sweanor, 2001; Murphy, 1998; Ross and Jalkotzy, 1992).
4.3. Conclusion
We found that puma populations subject to high human-in-duced mortality showed reduced dispersal, with effects evidenton each component of dispersal (emigration, dispersal distance,and establishment). We found male pumas were more directly af-fected by elevated pre- and post-emigration mortality. The effectsof high population turnover on females were largely indirect.Among female pumas we observed reduced emigration rates,greater philopatry, shorter dispersal distances and an overallreduction in the extent of interpopulation exchange under elevatedhuman-induced mortality. This was likely the result of high turn-over in the resident puma population providing territory openingsfor subadult females.
Interestingly, although the rate and extent of dispersal is gener-ally considered male biased in pumas, we found female dispersal inthe relatively secure NGYE was comparable to males (Laing andLindzey, 1993; Ross and Jalkotzy, 1992; Sweanor et al., 2000). Gi-ven the lower survival rates for male dispersers in our study areas,this suggest females could contribute more to interpopulation ex-change than males in some populations.
We conclude human-caused mortality can have important con-sequences for both within- and between-population dynamics,even influencing source–sink dynamics. For management applica-tions based on spatially structured approaches that rely on sourcepopulations, we suggest explicit consideration of mortality effectson interpopulation movements.
Acknowledgements
Research was supported by Craighead Beringia South, Hornoc-ker Wildlife Research Institute, Montana Department of Fish Wild-life & Parks, Montana Cooperative Wildlife Research Unit, Panthera,Panthera-Kaplan Graduate Awards Program, Richard King MellonFoundation, Summerlee Foundation, University of Montana, U.S.Geological Survey, Wildlife Conservation Society, and YellowstoneNational Park. LSM acknowledges support from NSF DEB(0841884) and USGS National Climate Change and Wildlife ScienceCenter. Our thanks to L. Anderson, S. Ard, B. Chapman, D. Chapman,R. Gipe, S. Monger, D. Powell, D. Stradley, and R. Stradley for flyingservices. Successful data collection was made possible by the ef-forts of D. Beaver, P. Buotte, S. Carsen, T. Chilton, J. Cole, T. Coleman,R. Cooper, W. Craddock, V. Edwards, G. Felzien, T. Fredrickson, M.Graf, G. Hedrick, T. Hollow, B. Holmes, J. Husseman, R. Jaffe, A.Jakes, M. Johnson, C. Kelly, T. Knuchel, M. Maples, S. McGee, D.Powell, J. Powers, S. Powers, S. Relyea, M. Sawaya, B. Semmens, E.Shanahan, B. Sheppard, B. Shinn, S. Shrout, B. Shultz, J. Sikich, D.Stahler, M. Trapkus, B. Wiesner. M. Hornocker and L. Hunter pro-vided steadfast support. Special thanks to H. Robinson and P.Buotte for their insightful advice concerning analytical approachesand puma ecology. Thanks to D. Smith and D. Thompson forreviewing the manuscript. The use of trade names or products doesnot constitute endorsement by the U.S. Government.
Appendix A
See Table A1.
Table A1Variables included in all top models (DAIC < 2) of dispersal components (emigration,dispersal distance, and successful establishment). Variables are ranked based on AICweights and parameter estimates with standard errors are provided based on fullmulti-model estimates. Only variables and their interactions included in top modelsare shown.
a HC Mort = Annual proportion of population killed from human-causes.b Wolves = Catagorical variable indicating presence of a resident wolf population.c Dispersal distance measured as number of average home range diameters
crossed (Dhrd).d Hunt Lvl = Level of puma harvest in an area categorized as (high >1.4 pumas/
Balme, G.A., Slotow, R., Hunter, L.T.B., 2010. Edge effects and the impact of non-protected areas in carnivore conservation: leopards in the Phinda-MkhuzeComplex, South Africa. Anim. Conserv. 13, 315–323.
Beier, P., 1995. Dispersal of juvenile cougars in fragmented habitat. J. WildlifeManage. 59, 228–237.
Beier, P., 2010. A focal species for conservation planning. In: Hornocker, S.N.M. (Ed.),Cougar Ecology and Conservation. The University of Chicago Press, Chicago,USA, pp. 177–189.
Botsford, L.W., Brumbaugh, D.R., Grimes, C., Kellner, J.B., Largier, J., O’Farrell, M.R.,Ralston, S., Soulanille, E., Wespestad, V., 2009. Connectivity, sustainability, andyield: bridging the gap between conventional fisheries management andmarine protected areas. Rev. Fish Biol. Fisheries 19, 1573–5184.
Bowler, D.E., Benton, T.G., 2005. Causes and consequences of animal dispersalstrategies: relating individual behaviour to spatial dynamics. Biol. Rev. 80, 205–225.
Braunisch, V., Home, R., Pellet, J., Arlettaz, R., 2012. Conservation science relevant toaction: a research agenda identified and prioritized by practitioners. Biol.Conserv. 153, 201–210.
Burnham, K.P., Anderson, D.R., 1998. Model Selection and Inference: A PracticalInformation-Theoretic Approach. Springer-Verlag, New York.
Cooley, H., Wielgus, R., Koehler, G., Robinson, H., Maletzke, B., 2009a. Does huntingregulate cougar populations? A test of the compensatory mortality hypothesis.Ecology 90, 2913–2921.
Cooley, H.S., Wielgus, R.B., Koehler, G., Maletzke, B., 2009b. Source populations incarnivore management: cougar demography and emigration in a lightly huntedpopulation. Anim. Conserv. 12, 321–328.
Cooper, C.B., Daniels, S.J., Walters, J.R., 2008. Can we improve estimates of juveniledispersal distance and survival? Ecology 89, 3349–3361.
Cougar Management Guidelines Working Group, 2005. Cougar ManagementGuidelines. WildFutures, Bainbridge Island, Washington.
DeSimone, R., Semmens, B., 2005. Garnet Mountans Mountain Lion ResearchProgress Report. Montana Fish, Wildlife and Parks, Helena, MT.
Figueira, W.F., Crowder, L.B., 2006. Defining patch contribution in source–sinkmetapopulations: the importance of including dispersal and its relevance tomarine systems. Popul. Ecol. 48, 215–224.
Franklin, A.B., Gutierrez, R.J., Nichols, J.D., 2004. Population dynamics of theCalifornia spotted owl (Strix occidentalis occidentalis): a meta-analysis. Ornithol.Monogr. 54, 1–55.
Gaillard, J.M., Festa-Bianchet, M., Yoccoz, N.G., Loison, A., Toigo, C., 2000. Temporalvariation in fitness components and population dynamics of large herbivores.Annu. Rev. Ecol. Syst. 31, 367–393.
Griffin, P.C., Mills, L.S., 2009. Sinks without borders: snowshoe hare dynamics in acomplex landscape. Oikos.
Gundersen, G., Andreassen, H.P., Ims, R.A., 2002. Individual and population leveldeterminants of immigration success on local habitat patches: an experimentalapproach. Ecol. Lett. 5, 294–301.
Gundersen, G., Johannesen, E., Andreassen, H.P., Ims, R.A., 2001. Source–sinkdynamics: how sinks affect demography of sources. Ecol. Lett. 4, 14–21.
Harris, N.C., 2007. Monitoring survival of young in ungulates: a case study withRocky Mountain elk. Wildlife Biology. University of Montana, Missoula, MT, 71.
Hixon, M.A., Pacala, S.W., Sandin, S.A., 2002. Population regulation: historicalcontext and contemporary challenges of open vs. closed systems. Ecology 83,1490–1508.
Howard, W.E., 1960. Innate and environmental dispersal of individual vertebrates.Am. Midl. Nat. 63, 152–161.
Joshi, N.V., Gadgil, M., 1991. On the role of refugia in promoting prudent use ofbiological resources. Theor. Popul. Biol. 40, 211–229.
Kluyver, H.N., Tinbergen, 1970. Territory and the regulation of density in titmice. In:Klopfer, P.H. (Ed.), Behavioral Ecology. Dickenson Publishing, Belmont, pp. 112–135.
Koenig, W.D., Van Vuren, D., Hooge, P.N., 1996. Detectability, philopatry, and thedistribution of dispersal distances in vertebrates. Trends Ecol. Evol. 11, 514–517.
Labonte, J., Ouellet, J., Courtois, R., Belisle, F., 1998. Moose dispersal and its role inthe maintenance of harvested populations. J. Wildlife Manage. 62, 225–235.
Laing, S.P., Lindzey, F.G., 1993. Patterns of replacement of resident cougars inSouthern Utah. J. Mammal. 74, 1056–1058.
Logan, K.A., Sweanor, L.L., 2001. Desert Puma: Evolutionary Ecology andConservation of an Enduring Carnivore. Island Press, Washington, DC.
Matthysen, E., 2005. Density-dependent dispersal in birds and mammals.Ecography 28, 403–416.
Morrison, J.L., Wood, P.B., 2009. Broadening our approaches to studying dispersal inraptors. J. Raptor Res. 43, 81–89.
Murphy, K.M., 1998. The Ecology of the Cougar (Puma concolor) in the NorthernYellowstone Ecosystem: Interactions with Prey, Bears, and Humans. Universityof Idaho, Moscow, Idaho, p. 147.
Murphy, K.M., Ross, P.I., Hornocker, M.G., 1999. The ecology of anthropogenicinfluences on cougars. In: Clark, A.P.C.T.W., Minta, S.C., Kareiva, P.M. (Eds.),Carnivores in Ecosystems. Yale University Press, New Haven, Connecticut, pp.77–101.
Newby, J.R., 2011. Puma dispersal ecology in the Central Rocky Mountains. WildlifeBiology. University of Montana, Missoula, Montana, i-104.
Novaro, A.J., Funes, M.C., Walker, R.S., 2005. An empirical test of source–sinkdynamics induced by hunting. J. Appl. Ecol. 42, 910–920.
Oli, M.K., Dobson, F.S., 2003. The relative importance of life-history variables topopulation growth rate in mammals: Cole’s prediction revisited. Am. Nat. 161,423–440.
Rabinowitz, A., Zeller, K.A., 2010. A range-wide model of landscape connectivity andconservation for the jaguar, Panthera onca. Biol. Conserv. 143, 939–945.
Revilla, E., Palomares, F., Wiegand, T., Ferreras, P., Delibes, M., 2004. Effects of matrixheterogeneity on animal dispersal: from individual behavior tometapopulation-level parameters. Am. Nat., 164.
Robinson, H., DeSimone, R., 2011. The Garnet Range Mountain Lion Study:Characteristics of a Hunted Population in West-Central Montana. MontanaDepartment of Fish, Wildlife & Parks, Helena, MT, p. 102.
Robinson, H.S., Wielgus, R.B., Cooley, H.S., Cooley, S.W., 2008. Sink populations incarnivore management: cougar demography and immigration in a huntedpopulation. Ecol. Appl. 18, 1028–1037.
Ross, P.I., Jalkotzy, M.G., 1992. Characteristics of a hunted population of cougars inSouthwestern Alberta. J. Wildlife Manage. 56, 417–426.
Runge, J.P., Runge, M.C., Nichols, J.D., 2006. The role of local populations within alandscape context: defining and classifying sources and sinks. Am. Nat. 167,925–938.
Ruth, T.K., 2004. Patterns of Resource Use among Cougars and Wolves inNorthwestern Montana and British Columbia. University of Idaho,Department of Natural Resources, Moscow, ID.
Ruth, T.K., Buotte, P., Haroldson, M., Murphy, K., Hornocker, M., Quigley, H., 2008.Cougar reproduction and survival pre- and post-wolf reintroduction inYellowstone National Park. In: Nadeau, S. (Ed.), Proceedings of the NinthMountain Lion Workshop. Idaho Department of Fish and Game, Sun Valley,Idaho, p. 61.
Ruth, T.K., Buotte, P.C., 2007. Cougar ecology and cougar-carnivore interactions inYellowstone National Park. Final Technical Report. Hornocker Wildlife Institute/Wildlife Conservation Society, Bozeman, Montana.
Ruth, T.K., Buotte, P.C., Quigley, H.B., 2010. Comparing ground telemetry and globalpositioning system methods to determine cougar kill rates. J. Wildlife Manage.74, 1123–1133.
Ruth, T.K., Haroldson, M.A., Murphy, K.M., Buotte, P.C., Hornocker, M.G., Quigley,H.B., 2011. Cougar survival and source–sink structure on the greaterYellowstone northern range. J. Wildlife Manage. 75, 1381–1398.
Ruth, T.K., Murphy, K., 2010. Competition with other carnivores for prey. In:Hornocker, M., Negri, S. (Eds.), Cougar Ecology and Conservation. University ofChicago Press, Chicago, pp. 163–172.
Saether, B.E., Bakke, O., 2000. Avian life history variation and contribution ofdemographic traits to the population growth rate. Ecology 81, 642–653.
Schwartz, C.C., Haroldson, M.A., White, G.C., 2010. Hazards affecting grizzly bearsurvival in the Greater Yellowstone Ecosystem. J. Wildlife Manage. 74, 654–667.
Small, R.J., Holzwart, J.C., Rusch, D.H., 1991. Predation and hunting mortality ofruffed grouse in central Wisconsin. J. Wildlife Manage. 55, 512–520.
Smith, D.W., Bangs, E.E., Oakleaf, J.M., Mack, C., Foantaine, J., Boyd, D.K.,Jimenez, M., Pletscher, D.H., Niemeyer, C.C., Meier, T.J., Stahler, D.R., Hoyan,J., Asher, V.J., Murray, D.L., 2010. Survival of colonizing wolves in thenorthern Rocky Mountains of the United States, 1982–2004. J. WildlifeManage. 74, 620–634.
Smith, J.L.D., 1993. The role of dispersal in structuring the Chitwan tiger population.Behaviour 124, 165–195.
Stoner, D.C., Wolfe, M.L., Choate, D.M., 2006. Cougar exploitation levels in Utah:implications for demographic structure, population recovery, andmetapopulation dynamics. J. Wildlife Manage. 70, 1588.
Sutherland, W.J., Gill, J.A., Norris, K., 2002. Density-dependent dispersal in animals:concepts, evidence, mechanisms and consequences. In: Bullock, R.E.K.J.M., Hails,R.S. (Eds.), Dispersal Ecology. Blackwell Science, Ltd., Oxford, UK, pp. 134–153.
Thomas, C.D., Kunin, W.E., 1999. The spatial structure of populations. J. Anim. Ecol.68, 647–657.
Thompson, D.J., Jenks, J.A., 2005. Long-distance dispersal by a subadult male cougarfrom the Black Hills, South Dakota. J. Wildlife Manage. 69, 818–820.
Trewhella, W.J., Harris, S., McAllister, F.E., 1988. Dispersal distance, home-range sizeand population density in the red fox (Vulpes vulpes): a quantitative analysis. J.Appl. Ecol. 25, 423–434.
Waser, P.M., 1985. Does competition drive dispersal? Ecology 66, 1170–1175.Wielgus, R.B., Sarrazin, F., Ferriere, R., Clobert, J., 2001. Estimating effects of adult
male mortality on grizzly bear population growth and persistence using matrixmodels. Biol. Conserv. 98, 293–303.
Williamson, 2004. Overview and synthesis: the tale of the tail. In: Bullock,R.E.K.J.M., Hails, R.S. (Eds.), Dispersal Ecology. Blackwell Science Limited,Oxford, pp. 431–444.
Wolff, J.O., 1997. Population regulation in mammals: an evoloutionary perspective.J. Anim. Ecol. 66, 1–13.
Woodroffe, R., Ginsberg, J.R., 1998. Edge effects and the extinction of populationsinside protected areas. Science 280, 2126–2128.