Human Chromosome Variation: The DiscriminatoryPower of Q-band Heteromorphism (Variant) Analysisin Distinguishing between Individuals, with Specific
Application to Cases of Questionable Paternity
SUSAN B. OLSON,' R. ELLEN MAGENIS, AND EVERETT W. LOVRIEN
SUMMARY
The chromosomes from 57 persons were analyzed by means of quina-crine fluorescent staining in order to assess the amount of variationand the discriminatory power of Q-band heteromorphism analysis.Chromosomes 3, 4, 13, 14, 15, 21, 22, and Y of each person werevisually compared to those of 56 others, for a total of 1,596 compari-sons. No two persons were found to have the same set of variants.The number of differences between chromosomes for each compari-son ranged from 2 to 12 out of a possible total of 14 for females and 15for males. Relatives were also distinguishable, and differences rangedfrom two to seven. We used the frequency with which each chromo-some was useful for telling two people apart, and estimated the proba-bility of finding two persons with the same set of quinacrine variantsas .0003. Distinctly different heteromorphisms were found in the 39unrelated persons for each of the chromosomes examined. In thissmall population, the number of different sets of variants observed forchromosomes 3, 4, 13, 14, 15, 21, 22, and Y were six, seven, 27, 16,20, 15, 24, and five, respectively, for a total number of possible combi-nations of 1.14 x 10¹⁵.As a test of the usefulness of chromosome heteromorphisms in
paternity cases, 12 father-mother-child trios of virtually certain pater-nity, owing to the father-child segregation of a rare structural rear-rangement, were coded and recombined at random to produce 120cases of uncertain paternity. When the code was broken, 108 "allegedfathers" had been excluded correctly and the 12 biological fathers hadbeen included correctly.
Received March 15, 1984; revised July 12, 1985.This research was supported in part by grants from Maternal and Child Health Services 920, and
the N. L. Tartar Trust, Medical Research Foundation of Oregon.l All authors: Crippled Children's Division, Department of Medical Genetics, Oregon Health
Variants for the 39 unrelated persons were scored according to amodified version of the system proposed at the Paris Conference. Wecalculated the probability of excluding the wrongfully accused man foreach chromosome based on the frequencies of specific variants foundin this population. The calculations took into consideration not onlythe observed sets of variants, but also all possible combinations of thespecific variants. The individual probability of exclusion for eachchromosome was then used to calculate a cumulative probability ofexclusion for all of these chromosomes of 1.0000.
INTRODUCTION
Chromosome variability among normal people has been acknowledged andexamined by many investigators [1-7]. With improved methods for chromo-some preparation and the availability of multiple staining techniques, it seemslikely that each person will prove to be unique [3]. Differences in the hetero-chromatic regions as distinguished through specific stains have been utilized toidentify chromosomes for several purposes. These include establishing paren-tal origin of chromosome abnormalities [8-15], establishing the parthenoge-netic origin of an ovarian teratoma [16], and distinguishing maternal from fetalcells in amniotic fluid cultures [17] and donor from recipient cells in bonemarrow transplants [18, 19].
Recently, this cytogenetic technology has proved useful in excluding wrong-fully accused men in paternity disputes [20-24]. Other polymorphic systemsthat are routinely tested are red cell enzymes and antigens, serum proteins, andHLA. The first three are often referred to as extended red cell testing. Themore systems that are examined, the greater the chances are of excluding afalsely accused man. Using a combination of extended red cell and HLA test-ing, there is the potential for excluding a wrongfully accused man approxi-mately 99% of the time [25]. The addition of chromosome heteromorphismanalysis is making it possible to achieve a higher probability of exclusion.As with routine paternity testing involving blood groups and HLA,
chromosomal exclusions are fairly straightforward. There is difficulty, how-ever, in drawing conclusions in a case when there is no exclusion. In evaluatingextended red cell and HLA testing results to estimate a probability of paternitywhen there is no exclusion, one must rely on gene frequencies in the popula-tion. Adequate frequency data are not available for chromosome variants.We have sampled a small population and have analyzed each individual by
means of quinacrine banding to reveal as much information as possible with thetechnology now available. This procedure has enabled us to draw some conclu-sions about the amount of variation in this population, as well as to assess thediscriminatory capacity of Q-banded chromosomes in distinguishing betweenindividuals. In addition, we have tested the system on cases of known paternityand nonpaternity. Finally, we have calculated the probability of excluding a
236 OLSON ET AL.
HUMAN CHROMOSOME VARIATION
wrongfully accused man with Q-banded chromosomes on the basis of frequen-cies of specific variants in this population.
MATERIALS AND METHODS
Three approaches were used to assess the amount of variation in a population, thedegree of ability to distinguish between individuals, and the probability of exclusion incases of disputed paternity: (1) visual comparison of chromosome variants from 57people and calculation, based on the ability to distinguish between them, of the chanceof finding two people with the same set of variants; (2) creation of paternity cases byrandomly recombining fathers from trios of near-certain paternity (due to the presencein father and child of a rare chromosome translocation) with all mother-child pairs, andblindly assessing paternity; and (3) compilation of frequencies of all quinacrine variantsin a population of 39 unrelated people and subsequent calculation of probability ofexclusion using all combinations of these variants.
Identification of Subjects
Two groups of subjects were examined chromosomally. The first group comprised 57Caucasian persons, 39 of whom were unrelated, from three laboratories at the OregonHealth Sciences University (OHSU): clinical cytogenetics, paternity testing, and infer-tility. Families were chosen at random from the first two laboratories, and individualpatients were chosen at random from the latter. This group was used to examine thedegree of chromosome variability between individuals and to estimate a cumulativeprobability of exclusion (CPE) on the basis of the variability within this population.The second group included 12 father-mother-child trios from 10 families in which a
paternal translocation was segregating. These families, in which father and child had thesame rare translocation, constituted a group of virtually certain paternities. They wereselected from patients studied in the Clinical Cytogenetics Laboratory, OHSU.
Methods
Peripheral blood was cultured according to standard methods. Slides were prepared,stained with quinacrine [26], and examined under a Zeiss photoscope III. Ten to 14 well-spread, well-stained metaphases were photographed. One full karyotype and two toeight serially printed composites [27] of chromosomes 3, 4, 13, 14, 15, 21, 22, and Y (inmales) were prepared for each of the 57 persons.The heteromorphic regions of the chromosomes of each person were compared to
those of the other 56. A conservative approach was taken in designating two variantregions as different. When a question arose as to the similarity between variants, thevariants were considered the same. In an actual paternity case, further serially printedcells would be examined that would give a more accurate representation of the variantsand possibly allow a distinction between the two. The number of differences present ineach comparison and the range of variation for each of the seven chromosomes analyzedin this population were determined.The 12 translocation families were examined for consistent Mendelian inheritance of
variant chromosomes. The rearrangements did not involve chromosome regions con-taining the variants being compared. The partial karyotypes of the translocation fatherswere changed at random and coded by a cytogeneticist not involved in the study, whokept the proper mother-child pairs together so that the paternity in the 120 resultingtriads was in question. Cases were independently analyzed by two cytogeneticists. Theaccuracy of the chromosome analysis results was then confirmed by examination of therecords, which indicated whether the alleged father and child in each triad were carriersof the same translocation.
Fluorescent chromosome variants in the group of unrelated persons were scoredaccording to a modified version of the system proposed in 1971 at the Paris Conference
237
TABLE I
SCORING OF HUMAN CHROMOSOME HETEROMORPHISMS STAINED WITH QUINACRINE
Score Satellite Stalk Internal standard
Size:o ......... Absent Absent ...
I .......... Very small Very short ...
2 ......... Small Short ...
3 ......... Intermediate Intermediate Yp4 ......... Large Long 18p5 ......... Very large Very long ...
Intensity:o ......... No fluorescence ... ...
I ......... Almost no fluorescence ... Distal lp2 ......... Pale ... ...
3 ......... Medium ... Two broad bands, 9q4 ......... Intense ... ...
5 ......... Brilliant ... Yq6 ......... Visible by serials only ... ...
NOTE: Scoring was modified from Paris Conference, 1971.
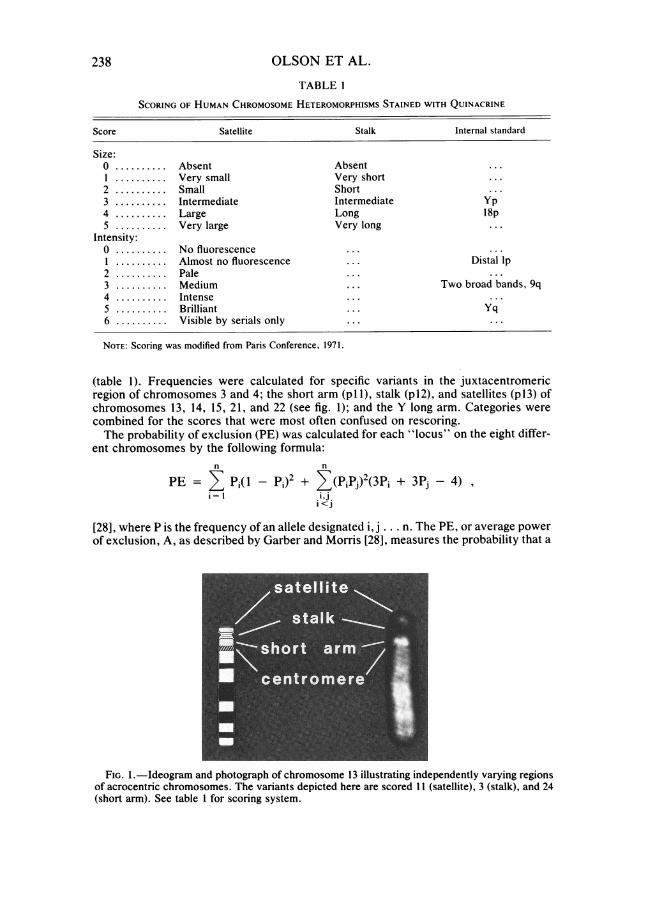
(table 1). Frequencies were calculated for specific variants in the juxtacentromericregion of chromosomes 3 and 4; the short arm (p 11), stalk (p12), and satellites (p13) ofchromosomes 13, 14, 15, 21, and 22 (see fig. 1); and the Y long arm. Categories werecombined for the scores that were most often confused on rescoring.The probability of exclusion (PE) was calculated for each "locus" on the eight differ-
ent chromosomes by the following formula:n n
PE = 3, Pj(1 _ pi)2 + 3(pipj)2(3Pj + 3Pj - 4)i I ij
i<j
[28], where P is the frequency of an allele designated i, j ... n. The PE, or average powerof exclusion, A, as described by Garber and Morris [28], measures the probability that a
FIG. 1.-Ideogram and photograph of chromosome 13 illustrating independently varying regionsof acrocentric chromosomes. The variants depicted here are scored 11 (satellite), 3 (stalk), and 24(short arm). See table I for scoring system.
238 OLSON ET AL.
HUMAN CHROMOSOME VARIATION
polymorphic locus will exclude a wrongfully accused man, and, therefore, indicates theusefulness of the system. It is dependent only on the allele frequencies in a populationand not on the specific information in any given paternity case. (For derivation offormula, see [28]).
Using each independently varying polymorphic segment as a locus, the cumulativeprobability of exclusion (CPE) for each chromosome, as well as for all eight chromo-somes, was then calculated with the formula: CPE = PEI + PE2 - (PEI x PE2). Thisrepresents the probability of excluding a man at locus I or locus 2, subtracting thechance of excluding at both loci. The CPE for an individual chromosome indicates theprobability of excluding a falsely accused man by using the variants present on thatchromosome alone. The CPE for all chromosomes examined demonstrates the likeli-hood of excluding a falsely accused man by considering all variant regions on thosechromosomes.
RESULTS
Population DataIn this study, 57 persons (39 unrelated) were compared with one another for a
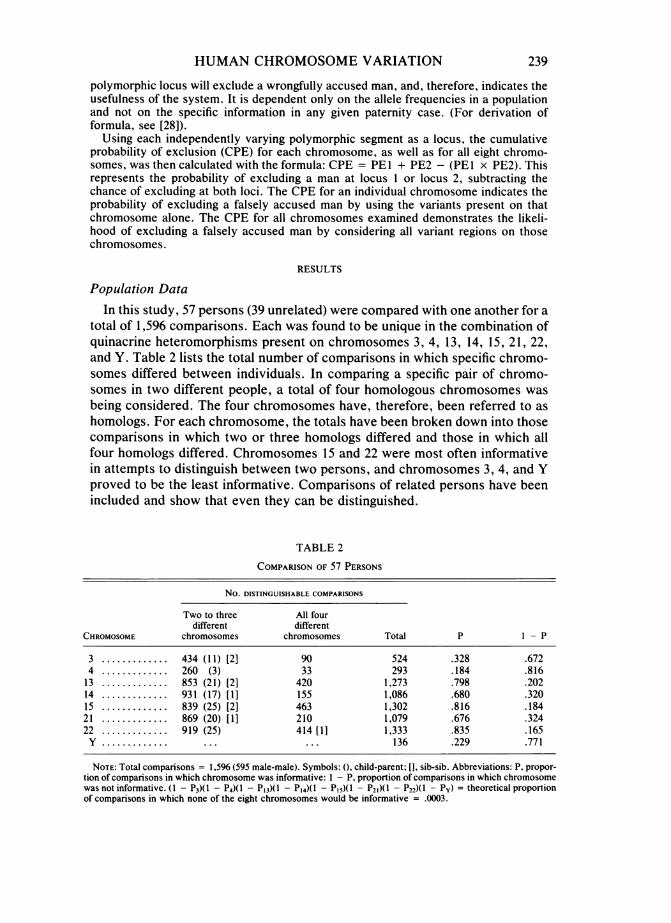
total of 1,596 comparisons. Each was found to be unique in the combination ofquinacrine heteromorphisms present on chromosomes 3, 4, 13, 14, 15, 21, 22,and Y. Table 2 lists the total number of comparisons in which specific chromo-somes differed between individuals. In comparing a specific pair of chromo-somes in two different people, a total of four homologous chromosomes wasbeing considered. The four chromosomes have, therefore, been referred to ashomologs. For each chromosome, the totals have been broken down into thosecomparisons in which two or three homologs differed and those in which allfour homologs differed. Chromosomes 15 and 22 were most often informativein attempts to distinguish between two persons, and chromosomes 3, 4, and Yproved to be the least informative. Comparisons of related persons have beenincluded and show that even they can be distinguished.
NOTE: Total comparisons = 1,596 (595 male-male). Symbols: (. child-parent; [], sib-sib. Abbreviations: P. propor-tion of comparisons in which chromosome was informative: I - P. proportion of comparisons in which chromosomewas not informative. (I - P3)(1 - P4)(1 - P13)(l - P14)(1 - P,,)(1 - P21)(1 - P22)(1 - Py) = theoretical proportionof comparisons in which none of the eight chromosomes would be informative = .0003.
239
240 OLSON ET AL.
The number of informative chromosomes per comparison between individ-uals differed from one comparison to another. Table 3 illustrates the distribu-tion of the number of informative chromosomes per comparison. No compari-son had less than two informative chromosomes. The range was 2 to 12differences out of a possible 14 in females and 15 in males. Even though no twopersons were identical, we were interested in estimating the frequency withwhich two persons might possess the same set of quinacrine variants. Wearrived at this frequency by using the figures for the frequency with which eachchromosome distinguished between two persons. We designated P as the pro-portion of comparisons out of 1,596 in which a specific chromosome was infor-mative, and 1 - P as the frequency of its being noninformative. On this basis,(1 - P3)(1 - P4)(1 - P13)(1 - P14)(1 - P15)(1 - P21)(1 - P22)(1 - Py) equaledthe expected frequency of no informative chromosomes. In this population, theexpected frequency of zero differences was .0003 (table 2).For each acrocentric chromosome, there are four independent regions of
continual variation: the centromere, short arm, stalk, and satellite. These re-gions may vary in size, shape, and intensity (fig. 1). The different variants ineach of these regions can be considered comparable to alleles at each of fourloci. Similarly, the juxtacentromeric regions of chromosomes 3 and 4 and the Ylong arm may be considered alleles of varying size and intensity. Figures 2-7illustrate distinct heteromorphisms in the population of 39 unrelated persons.By noting the number of different "alleles" in this population, we were able toestimate a possible number of combinations. To calculate a minimum estimatefor quinacrine variants, we treated each set of four variable regions for eachacrocentric as a whole. Table 4 lists the number of observed variants. Thepossible number of combinations for each chromosome was then calculated by
FIG. 2.-Variants of chromosomes 3 (A), 4 (B), and Y (C) from a population of 39 unrelatedindividuals. Chromosomes 3 and 4 vary in the juxtacentromeric region. A-6, B-6, and B-7 havebrightly fluorescing heterochromatin inverted into the short arm. The scores range from 00 (A-i) toinv 25 (A-6) for chromosome 3 and from 00 (B-1) to 24 (B-7) for chromosome 4. The fluorescentportion of the Y long arm varies between males, with scores ranging from I (C-1) to 5 (C-5).
the formula [N(N - 1)/2] + N, where N equals the number of different variantsfor a particular chromosome. (Note: N must be added to the general formulafor ordered combinations to account for those instances in which bothhomologs appear to have the same variants.) By multiplying the latter together,we arrived at a conservative estimate of 1.14 x 10i5 possible combinations. Wealso calculated a theoretical number of possible combinations using the scoringcategories from table 1. This figure was 6.76 x 1042, treating each of the fourvariable regions in the acrocentric chromosomes independently.The translocation families we studied demonstrated Mendelian inheritance of
all chromosome variants, with one exception. The child in one family had onechromosome 14 variant consistent with inheritance of this homolog from hisfather. The other homolog had a large, bright satellite that was inconsistentwith inheritance of either of the mother's chromosomes 14. The mother had achromosome 14 with a satellite that was as bright, but only half the size. Newslides stained with quinacrine produced the same results. All other variants inthe child were consistent with Mendelian inheritance of chromosomes fromboth parents. We postulated that the child's large, bright satellite was a newheteromorphism resulting from duplication of the mother's heterochromatin.
Cases of Unknown PaternityOne hundred twenty cases of unknown paternity were created by assorting
chromosome sets of the translocation fathers with all 12 mother-child pairs, sothat all possible combinations were represented. Cases were coded so that the
241
OLSON ET AL.
FIG. 3.-Twenty-six different variants of chromosome 13 from a population of 39 unrelatedpeople. Each chromosome is serially printed to reveal heteromorphisms not visible at an exposuregenerally chosen to define the overall banding pattern. A-l-A-7 have satellites that would not havebeen observed at a routine exposure. Scores are determined by comparisons of serial prints againststandards, including an internal standard. Very short, medium to intense short arms (scored 13, 14,and 15) as in C-lI or D-3 are relatively common on chromosomes 13, whereas bright short arms onchromosomes 14 and 15 are less frequent.
identities of the persons were unknown. Two cytogeneticists independentlydecided whether or not a particular man was the biological father of a child andagreed upon 108 exclusions and 12 inclusions. The code was broken to revealthat all conclusions were correct.
Heteromorphism Frequency Data
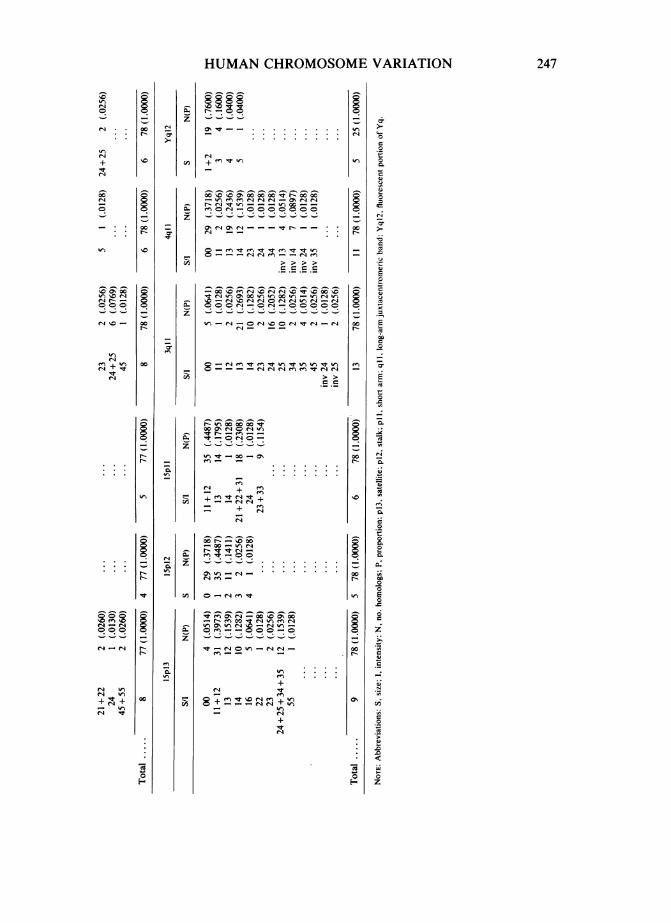
Frequency results for each "allele," or variable region, observed in the 39unrelated persons are listed in table 5. The first number is the score for size, thesecond is for intensity. For example, a satellite with a score of 23 is small (2) insize and of medium (3) intensity. Variants that were relatively more commonincluded very short, intermediate to bright intensity short arms on chromosome13 (scored 13, 14, and 15) and intense (4) to brilliant (5) intensity satellites onchromosome 15. Bright heterochromatin was more often inverted into the shortarm in chromosome 4 (13 of 39 people) than in chromosome 3 (three of 39people). Large to very large (4-5) and intense to brilliant intensity (4-5) satel-lites were uncommon for any acrocentric chromosome. Serial printing revealedsatellites on acrocentrics that would otherwise have gone undetected in 6% ofthe acrocentric homologs.The frequency data was used to calculate the PB for each chromosome.
Table 6 lists these figures, as well as the CPE of 1.0000 for all seven (female)
242
HUMAN CHROMOSOME VARIATION
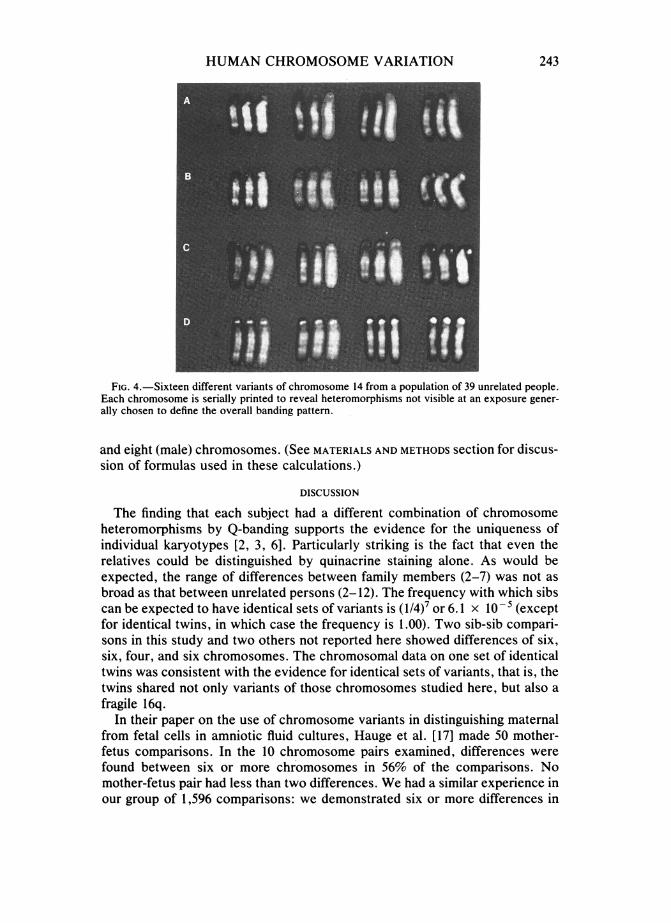
FIG. 4.-Sixteen different variants of chromosome 14 from a population of 39 unrelated people.Each chromosome is serially printed to reveal heteromorphisms not visible at an exposure gener-ally chosen to define the overall banding pattern.
and eight (male) chromosomes. (See MATERIALS AND METHODS section for discus-sion of formulas used in these calculations.)
DISCUSSION
The finding that each subject had a different combination of chromosomeheteromorphisms by Q-banding supports the evidence for the uniqueness ofindividual karyotypes [2, 3, 6]. Particularly striking is the fact that even therelatives could be distinguished by quinacrine staining alone. As would beexpected, the range of differences between family members (2-7) was not asbroad as that between unrelated persons (2-12). The frequency with which sibscan be expected to have identical sets of variants is (1/4)7 or 6.1 x 10- 5 (exceptfor identical twins, in which case the frequency is 1.00). Two sib-sib compari-sons in this study and two others not reported here showed differences of six,six, four, and six chromosomes. The chromosomal data on one set of identicaltwins was consistent with the evidence for identical sets of variants, that is, thetwins shared not only variants of those chromosomes studied here, but also afragile 16q.
In their paper on the use of chromosome variants in distinguishing maternalfrom fetal cells in amniotic fluid cultures, Hauge et al. [17] made 50 mother-fetus comparisons. In the 10 chromosome pairs examined, differences werefound between six or more chromosomes in 56% of the comparisons. Nomother-fetus pair had less than two differences. We had a similar experience inour group of 1,596 comparisons: we demonstrated six or more differences in
243
OLSON ET AL.
FIG. 5.-Twenty different variants of chromosome 15 from a population of 39 unrelated people.Each chromosome is serially printed to reveal heteromorphisms not visible at an exposure gener-ally chosen to define the overall banding pattern. The large, bright satellites in D-5 (scored 55) arerelatively uncommon and were present in only one person in the population studied.
51% of the comparisons and no less than two differences between individuals.In the subset of parent-child comparisons, 10 of 21 (48%) had six or moredifferences and none showed less than two.
Despite the fact that no less than two differences were observed per compari-son, the chance of finding two randomly selected persons with an identical setof quinacrine variants was calculated to be .0003 by means of our data on howoften each chromosome was useful in distinguishing between two persons in
_ _ | A.~~~~~~~~~~~~~~~~~~~~f
FIG.z_.Ffte difrn1ains fcrmsm1 from a ouato f3 neaeepeEach~~choosm is seial prne orva e orpim not viil ata xouegnrallychse to dein th vrlanigpte
244
HUMAN CHROMOSOME VARIATION 245
FIG. 7.-Twenty-four different variants of chromosome 22 from a population of 39 unrelatedpeople. Each chromosome is senially printed to reveal heteromorphisms not visible at an exposuregenerally chosen to define the overall banding pattern. The large, bright satellites in D-6 (scored 45)are relatively uncommon and were present in only one person in the population studied.
this study. This means that even with a conservative estimate of the amount ofvariation, one would expect to distinguish between two persons at least 99.97%of the time. This figure would most likely be higher had more analysis of thevariants been undertaken in cases where questions arose as to the similarity oftwo specific variants, rather than calling them the same.There is evidence that there is a difference in proportion of specific chromo-
some variants between populations [29-36]. For example, Lubs et al. [3 1]found that the U.S. black population that they studied had a greater prepon-derance of bright Q-band heteromorphisms than did their white population.
TABLE 4
PossIBLE COMBINATIONS OF HETEROMORPHISMSOBSERVED IN A POPULATION OF 39 PERSONS
NOTE: The four variant regions of chromosomes 13, 14,15, 21, and 22 were treated as a whole. Abbreviations: N,number of different variants; PC, possible combinations.PC = [N(N - 1)/2 + N. PCTotal = (PC3)(PC4)(PC13)(PC14)(PC15)(PCI1)(PCI,,)(PCY) = 1.14 x 10¹⁵.
OLSON ET AL.
'I 00 00I0oO -
C00c
00 W- _Co 'I rN 00 rq
N
00 r- a. r
C-,
.00.N
W'
ON, (ON tO 'C 20 N 00'C k -00 )N ) ONN rt ee N
oi
oi 00-o
ON N 'C 0 ON ON 0
_ -000
+_T
tN 00 ON ON,, 00 'C -
ri C'i -
0 - - - - --_
O N'C 000 ON ON ON 00
ON ri 1 riN^ t r'Nm
__T q N} 'Teq "
- ri r'
b +Fz +g ±c
246
g
r-
a-,
00
(A
0C
00
a
W.
0s
z-
z
0r
4
ci)
(AW
2
0
z
(A0
0
;>
00 i N rA
_'IT C14 m
# ONUn0
- O
00 00r)c
ON N .- N r
0 ONe -)
-0
N _~ N NO
00 ON 00 00 r0r rI 0 0A
N - riN ri
000 ON ONOn N ~O
.i
O T ri -
W) WI ' _t
-0cF
00 N N ON ONoo0. 00
ent- ONSO
O-rNri0
_ N
UH
m
ciCL
&7
_
CdE
&1e.
iz
Ci,(A,
NO.N
NN
0
0OO~_
0
1)
R
r
HUMAN CHROMOSOME VARIATION
--"----..-4) _
700 XD £ 0% 0000X N 0000X
C- -
> > > >.C .9 5.9 .
-x 0eo ec 0 "ec -ow 0
O- 0o
0 0o N -
o oo - o s--ooo
O - m "Iknn tn W) Wtz ~~~~~00N'
N- W 00 00 00 'I00 O e" 0 e" W'- N - - --0_oN 0 -
w' T 00 0%O.
M -
- - - " "en_
-z~00 N- %~0 00
00- ) eNt- 4 110*q'to. en - 0.
n (eNZ ,___
cn 0e _n'
-~-%-- - 00 -
t en 00tv-)ON V) 0 -e-o m - - o o C-. .- .: .~ -._,~ _ _ _ _~ _
NOTE: Abbreviations and formulas: PE, probability ofexclusion; CPE, cumulative probability of exclusion;
n n
PE = Pj( _ p)2 + i, (pipj)2(3Pj + 3Pj - 4)
i<j
[261; CPE = PEI + PE2 - (PEI x PE2).
Ibraimov and Mirrakhimov [35] found differences in the frequency of the brightinverted Q-heterochromatin band in chromosome 3 between Russian (6.0%)and Asian Mongoloid (0.3%-3.0%) populations. The significance of these dif-ferences, as well as the role of heterochromatin in general, is unknown.Our second approach to assessing the usefulness of chromosome analysis as
a discriminatory tool was to create 120 cases of questionable paternity fromfamilies of known paternity. The problem of defining such families was ac-knowledged as early as 1922 by Ottenberg in the second of a series of papers onblood testing and its application to answering medicolegal questions [37]. Heemphasized the dangers of "secret illegitimacy" in any study of human hered-ity. The estimated rate of illegitimate births in the U.S. is 17% (National Centerfor Health Statistics, DHHS, 1978). In addressing this problem, we have re-stricted our families to those in which paternity was virtually certain due to thefather-child transmission of a rare chromosome translocation. One hundredeight alleged fathers were correctly excluded, and 12 were correctly includedfor a 100% accuracy. The probability of arriving at these conclusions by chancealone is 1/10! or 2.8 x 10⁻⁷ (two pairs of sibs had the same father).Our third approach to arriving at an accurate estimate of the power of
heteromorphism analysis extends beyond the finite number of variants in thispopulation. We have observed, as have others, other combinations of the vari-ants reported here, as well as many heteromorphisms not represented in ourdata. These other possibilities can be considered using accepted statisticalmethods.
Using frequencies of variants in a defined population, one can decide theoverall usefulness of a test system, or the PE. This figure indicates what thechances are that a wrongfully accused man will be exonerated by means of
248
HUMAN CHROMOSOME VARIATION
the particular polymorphic locus. Such figures have been calculated for theblood group and HLA systems based on gene frequencies in the population.The individual PEs for each locus are added for a combined PE (CPE). (SeeMATERIALS AND METHODS section for formulas.) The CPEs in the white popula-tion (with black CPEs in parentheses) for red cell antigens, serum proteins, redcell enzymes, HLA (A, B), and, finally, all systems combined are: .72 (.61), .76(.69), .71 (.65), .87 (.87), and .99 (.99), respectively [25].Recognizing the small sample size, we estimated the frequencies of specific
variants in this population. A CPE of 1.0000 for chromosomes 3, 4, 13, 14, 15,21, and 22 was calculated. This considers all possible combinations of thevariants observed in the population studied, although examples of all of thesecombinations were not present. Our figure is in contrast to Niebuhr and Gurt-ler's figures of .72 for females and .74 for males [38]. It is difficult to compareour variant frequencies with those of this group because different criteria wereused in the scoring. Our system is modified from that proposed in the Parisnomenclature and is similar to that used by McKenzie and Lubs [2] and VanDyke et al. [6]. This difference in procedure illustrates one of the problems incompiling adequate population frequency data. Not only are there variedmethods of scoring, but there also is a lack of uniformity in the quality of thematerial being scored. Recent improvements in cytogenetic techniques haveallowed better visualization of the variants present on these chromosomes. Webelieve that each analyzed chromosome contains variants, whether there is abright marker or not. The absence of a satellite may be just as informative asthe presence of one, depending on the other variants present in the karyotypesof each person involved in a particular case.Taking into consideration the evidence presented here and in the literature
for the uniqueness of the individual and the calculations based on our popula-tion data, it seems reasonable to estimate the probability of distinguishingbetween two people by quinacrine-stained chromosomes to be 99.97%-100%and the CPE to approach 100%.Even with high-quality material, the variation seen in chromosome hetero-
morphisms is a continuum and it is difficult to assign these variants to specificcategories. It is our experience that certain variants, such as short, short arms,are more frequently scored differently on blind rescoring. Other variants (forexample, the length of stalks) cover such a wide range that discrepancies sel-dom occur. For this reason, we have not made it a general rule to use a two-score difference for distinguishing true differences between variants, but have,rather, applied it to specific categories. Many investigators have scored, thenblindly rescored individuals to show a discrepancy in a small proportion of theircases [2, 6, 38]. However, those subjects most frequently scored differentlywere the ones for which the chromosome preparations were of poor tomediocre quality. The fact remains that in any scoring system, information islost. Individual cases of questionable parentage are best resolved through vi-sual comparison of variants from a number of serially printed metaphasesrather than by comparison of scores given to those variants.Although chromosome heteromorphism analysis has not yet been accepted
249
as a routine test in paternity disputes, it is being used in a limited number ofcases in which neither HLA nor blood group testing has led to an exclusion. Ina recent case, we were able to exclude one of two brothers named as allegedfathers after no exclusions were found with HLA, red cell enzymes and anti-gens, and serum proteins [24]. This illustrates the value of chromosome analy-sis in cases involving related alleged fathers or alleged fathers related to themother.Owing to the time and expertise involved in preparing and analyzing chromo-
somes in paternity cases, the cost is quite high in comparison with othermethods of testing. We, therefore, suggest a stepwise protocol in whichchromosome heteromorphism analysis is done only after no exclusions arefound with red cell antigens and enzymes, serum proteins, and HLA.The legal community is very receptive to new scientific developments that
will aid in the establishment of paternity and subsequent collection of childsupport. Mathon [39] suggested that there be legislation allowing all provenscientific testing results admitted as evidence into the courts, rather thanspecifying particular tests by name. This allows for the acceptance of inevitablescientific advancements and seems extremely pertinent in light of the datapresented here.
ACKNOWLEDGMENTS
We thank Drs. Nancy Alexander, Robert Koler, David Linder, Kuo Hwa Lu, andJeffrey Morris for their helpful discussions and constructive criticisms. We appreciategreatly the technical assistance of Leland Allen, Sande Barton, Libby Clark, LoreFriend, Jeff Inahara, Robert Sheehy, Diane Tomar, and Shelley Winn. We are gratefulto Drs. Lynn Ryals, James Geyer, and Jerry Morrisey, Roche Biomedical Laboratory,for sending us the paternity case involving two brothers.
REFERENCES
1. MAGENIS RE, CHAMBERLIN J, OVERTON K: Sequential Q- and C-band variants: inher-itance in four generations of a family. 13th Annual Somatic Cell Genetics Confer-ence, U.S. Virgin Islands, 1974
2. McKENZIE WH, LUBS HA: Human Q and C chromosomal variations: distributionand incidence. Cytogenet Cell Genet 14:97-115, 1975
3. MULLER HJ, KLINGER HP, GLASSER M: Chromosome polymorphism in a humannewborn population. II. Potentials of polymorphic chromosome variants for charac-terizing the idiogram of an individual. Cytogenet Cell Genet 15:239-255, 1975
4. JACOBS PA: Human chromosome heteromorphisms (variants). Prog Med GenetII(2):251-274, 1977
5. MAGENIS E, PALMER CG, WANG L, ET AL.: Heritability of chromosome bandingvariants, an invited paper presented at Birth Defects Institute Population Cytoge-netics Symposium, Albany, N.Y., October 1975, in Population Cytogenetics, editedby HOOK EB, PORTER IH, New York, Academic Press, 1977
6. VAN DYKE DL, PALMER CG, NANCE WE, Yu PL: Chromosome polymorphism andtwin zygosity. Am J Hum Genet 29:431-447, 1977
7. VERMA RS, DOSIK H: Human chromosomal heteromorphisms: nature and clinicalsignificance. Int Rev Cytol 62:361-383, 1980
8. ROBINSON JA: Origin of extra chromosome in trisomy 21. Lancet 1:131-133, 19739. SCHMIDT R, DAR H, NITOWSKY HM: Origin of extra 21 chromosome in patients with
Down syndrome (abstr. 367). Pediatr Res 9:318, 1975
250 OLSON ET AL.
HUMAN CHROMOSOME VARIATION
10. KAJii T, NIIKAWA N: Origin of triploidy and tetraploidy in man: 11 cases withchromosome markers. Cytogenet Cell Genet 18:109-125, 1977
11. MAGENIS RE, OVERTON KM, CHAMBERLIN J, BRADY T, LOVRIEN E: Parental origin ofthe extra chromosome in Down's syndrome. Hum Genet 37:7-16, 1977
12. CHAMBERLIN J, MAGENIS RE: Parental origin of de novo chromosome rear-rangements. Hum Genet 53:343-347, 1980
13. MIKKELSEN M, POULSEN H, GRINSTED J, LANGE A: Non-disjunction in trisomy 21:study ofchromosomal heteromorphisms in 110families. Ann Hum Genet44:17-28,1980
14. JACOBS PA, MAYER M: The origin of human trisomy: a study of heteromorphismsand satellite associations. Ann Hum Genet 45:357-365, 1981
15. MAGENIS RE, CHAMBERLIN J: Parental origin of nondisjunction, in Trisomy 21 (DownSyndrome): Research Perspectives, edited by DE LA CRUZ FF, GERALD PS, Balti-more, University Park Press, 1981, pp 77-93
16. LINDER D, KAISER MCCAw B, HECHT F: Parthenogenic origin of benign ovarianteratomas. N Engl J Med 292:63-66, 1975
17. HAUGE M, POULSEN H, HALBERG A, MIKKELSEN M: The value of fluorescence mark-ers in the distinction between maternal and fetal chromosomes. Humangenetik26:187-191, 1975
18. SPARKEs RS: Cytogenetic analysis in human bone marrow transplantation. CancerGenet Cytogenet 4:345-352, 1981
19. BORZY MS, MAGENIS E, TOMAR D: Bone marrow transplantation for severe com-
bined immune deficiency in an infant with chimerism due to intrauterine-derivedmaternal lymphocytes: donor engraftment documented by chromosomal markerstudies. Am J Med Genet 18:527-539, 1984
20. DE LA CHAPELLE A, FELLMAN J, UNNERUS V: Determination of human paternity fromthe length of the Y chromosome. Ann Genet (Paris) 10:60-64, 1967
21. GURTLER H, NIEBUHR E: The use of chromosome variants in paternity cases, in 9.Internationale Tagung der Gesellschaft fur forensische Blutgruppenkunde, Wurz-burg, Germany, Schmitt and Meyer, 1981, pp 597-601
22. OLSON SB, MAGENIS RE, ROWE SI, LOVRIEN EW: Chromosome heteromorphismanalysis in cases of disputed paternity. Am J Med Genet 15:47-55, 1983
23. NORA JJ, ZLOTNIK L, OZTURK G, WALKNOWSKA J: An approach to prenatal diagnosisof paternity (Letter to the Editor). Am J Med Genet 16:641-644, 1983
24. OLSON S, MAGENIS E, LOVRIEN E, GEYER J, RYALS L, MORRISEY J: Resolution ofpaternity disputes involving relatives as alleged fathers using chromosome hetero-morphism analysis. Am J Hum Genet 36:108S, 1984
25. DYKES DD: The use of frequency tables in parentage testing, in Probability ofInclusion in Paternity Testing: A Technical Workshop, edited by SILVER H, Arling-ton, Va., American Association of Blood Banks, 1982, P 20
26. CASPERSSON T, LOMAKKA G, ZECH L: The 24 fluorescence patterns of human meta-phase chromosomes-distinguishing characters and variability. Hereditas 67:89-102, 1971
27. OVERTON KM, MAGENIS RE, BRADY T, CHAMBERLIN J, PARKS M: Cytogenetic dark-room magic: now you see them, now you don't. Am J Hum Genet 28:417-419, 1976
28. GARBER RA, MORRIS JW: General equations for the average power of exclusion forgenetic systems of n codominant alleles in one-parent and no-parent cases of dis-puted parentage, in Inclusion Probabilities in Parentage Testing, edited by WALKERRH, Arlington, Va., American Association of Blood Banks, 1983, pp 277-280
29. GERAEDTS JPM, PEARSON PL: Fluorescent chromosome polymorphisms: frequenciesand segregation in a Dutch population. Clin Genet 6:247-257, 1974
30. BUCKTON KE, O'RIORDAN ML, JACOBS PA, ROBINSON JA, HILL R, EVANS HJ: C- andQ-band polymorphisms in the chromosomes of three human populations. Ann HumGenet 4:99-112, 1976
31. LUBS HA, KIMBERLING WJ, HECHT F, ET AL.: Racial differences in the frequency ofQ and C chromosomal heteromorphisms. Nature 268:631-633, 1977
251
252 OLSON ET AL.
32. VERMA RS, DoSIK H: Human chromosomal heteromorphism in American blacks. V.Racial differences in size variation of the short arm of acrocentric chromosomes.Experientia 37:241-243, 1981
33. IBRAIMOV Al, MIRRAKHIMOV MM, NAZARENKO SA, AXENROD El, AKBANOVA GA:Human chromosomal polymorphism. I. Chromosomal Q polymorphism in Mon-goloid populations of central Asia. Hum Genet 60:1-7, 1982
34. IBRAimov AI, MIRRAKHIMOV MM: Human chromosomal polymorphism. III. Chro-mosomal Q polymorphism in Mongoloids of northern Asia. Hum Genet 62:252-257, 1982
35. IBRAIMov Al, MIRRAKHIMOV MM: Human chromosomal polymorphism. IV. Chro-mosomal Q polymorphism in Russians living in Kirghezia. Hum Genet 62:258-260,1982
36. IBRAIMov Al, MIRRAKHIMOV MM: Human chromosomal polymorphism. V. Chromo-somal Q polymorphism in African populations. Hum Genet 62:261-265, 1982
37. OTTENBERG R: Medicolegal applications of human blood grouping: second com-munication. J Am Med Assoc 78:873-877, 1922
38. NIEBUHR E, GURTLER H: A classification system for chromosome variants, in 9.Internationale Tagung der Gesellschaft fur forensische Blutgruppenkunde, Wurz-burg, Germany, Schmitt and Meyer, 1981, pp 111-116
39. MATHON LR: The evidentiary value of blood tests: the need to establish paternity.32nd Annual Conference on Child Support Enforcement. St. Louis, Mo., 1983