1 HUMAN EXPOSURE TO BISPHENOL A (BPA) Laura N. Vandenberg 1 , Russ Hauser 2 , Michele Marcus 3 , Nicolas Olea 4 , and Wade V. Welshons 5 1 Tufts University Sackler School of Graduate Biomedical Sciences, Boston MA 02111 2 Department of Environmental Health, Harvard School of Public Health, Boston, MA 02115 3 Emory University, Rollins School of Public Health, Atlanta, GA 30322 4 Hospital Clinico, University of Granada, 18071 Granada Spain 5 University of Missouri-Columbia, Department of Biomedical Sciences, Columbia, MO 65211 Corresponding author: Laura N. Vandenberg Tufts University School of Medicine Sackler School of Graduate Biomedical Sciences 136 Harrison Avenue Boston, MA 02111 [email protected]Ph: 617-636-0444 Fax: 617-636-3971 Disclaimer: The findings and conclusions in this report are those of the authors and do not necessarily represent the views of any affiliated institutions or agencies. Mention of trade names or commercial products does not constitute endorsement or recommendation for use. Acknowedgements: The authors gratefully acknowledge expertise and input from additional panel members: Jane C. Atkinson, Antonia M. Calafat, Frederick Eichmiller, Albert Kingman, Ruthann Rudel, and Kristina A. Thayer. This review was prepared in conjunction with the Bisphenol A Conference, Chapel Hill, NC, November 28-29, 2006. Support was provided by the National Institute of Environmental Health Sciences and the National Institute of Dental and Craniofacial Research, NIH, DHHS, the W.M. Keck Center for Behavioral Biology at NC State University, and from Commonweal Running Title: Human exposure to BPA Keywords: serum, urine, epidemiology, disease, epoxy resins, dental sealants, polycarbonate plastic, metabolism
Transcript
1
HUMAN EXPOSURE TO BISPHENOL A (BPA)
Laura N. Vandenberg1, Russ Hauser2, Michele Marcus3, Nicolas Olea4, and Wade V.
Welshons5 1Tufts University Sackler School of Graduate Biomedical Sciences, Boston MA 02111 2Department of Environmental Health, Harvard School of Public Health, Boston, MA 02115 3Emory University, Rollins School of Public Health, Atlanta, GA 30322 4Hospital Clinico, University of Granada, 18071 Granada Spain 5University of Missouri-Columbia, Department of Biomedical Sciences, Columbia, MO 65211 Corresponding author: Laura N. Vandenberg Tufts University School of Medicine Sackler School of Graduate Biomedical Sciences 136 Harrison Avenue Boston, MA 02111 [email protected] Ph: 617-636-0444 Fax: 617-636-3971 Disclaimer: The findings and conclusions in this report are those of the authors and do not necessarily represent the views of any affiliated institutions or agencies. Mention of trade names or commercial products does not constitute endorsement or recommendation for use. Acknowedgements: The authors gratefully acknowledge expertise and input from additional panel members: Jane C. Atkinson, Antonia M. Calafat, Frederick Eichmiller, Albert Kingman, Ruthann Rudel, and Kristina A. Thayer. This review was prepared in conjunction with the Bisphenol A Conference, Chapel Hill, NC, November 28-29, 2006. Support was provided by the National Institute of Environmental Health Sciences and the National Institute of Dental and Craniofacial Research, NIH, DHHS, the W.M. Keck Center for Behavioral Biology at NC State University, and from Commonweal Running Title: Human exposure to BPA Keywords: serum, urine, epidemiology, disease, epoxy resins, dental sealants, polycarbonate plastic, metabolism
2
Abbreviations BADGE bisphenol A diglycidyl ether Bis-DMA bisphenol A dimethylacrylate BPA bisphenol A BPA-gluc bisphenol A glucuronide °C degrees Celsius CDC Centers for Disease Control and Prevention DHEAS dehydroepiandrosterone sulfate DIB-Cl fluorescent labeling agent, 4-(4,5-diphenyl-1H-imidazol-2-yl)benzoyl
chlorine E estrogen ELISA enzyme-linked immunosorbent assay ED or ECD electrochemical detection ER estrogen receptor ESI electrospray ionization FD fluorescence detection FSH follicle stimulating hormone g grams GC gas chromatography HPLC high performance liquid chromatography HRGC high resolution gas chromatography i.p. intraperitoneal i.v. intravenous IVF in vitro fertilization kg kilogram L liter LC liquid chromatography LH lutenizing hormone LOD limit of detection m meter mg milligram ml milliliter MS mass spectrometry MS/MS tandem mass spectrometry NCI negative chemical ionization ND not detected ng nanograms NIEHS National Institute for Environmental Health Sciences NMR Nuclear Magnetic Resonance NOAEL No observable adverse effect level PCOS polycystic ovarian syndrome pg picograms
[3] Gould JC, Leonard LS, Maness SC et al. Bisphenol A interacts with the estrogen receptor α in a distinct manner from estradiol. Mol Cell Endocrinol. 1998;142:203-14.
[4] Kuiper GG, Lemmen JG, Carlsson B et al. Interaction of estrogenic chemicals and phytoestrogens with estrogen receptor beta. Endocrinology. 1998;139:4252-63.
[5] Pennie WD, Aldridge TC, Brooks AN. Differential activation by xenoestrogens of ER α and ER β when linked to different response elements. J Endocrinol. 1998;158:R11-R14.
[6] Welshons WV, Nagel SC, vom Saal FS. Large effects from small exposures. III. Endocrine mechanisms mediating effects of bisphenol A at levels of human exposure. Endocrinology. 2006;147:S56-S69.
[7] EDSTAC. Endocrine Disruptor Screening and Testing Advisory Committee Final Report. Washington, D.C.: US Environmental Protection Agency; 1998.
[8] Colerangle JB, Roy D. Profound effects of the weak environmental estrogen-like chemical bisphenol A on the growth of the mammary gland of Noble rats. J Steroid Biochem Molec Biol. 1997;60:153-60.
[9] Steinmetz R, Brown NG, Allen DL, Bigsby RM, Ben-Jonathan N. The environmental estrogen bisphenol A stimulates prolactin release in vitro and in vivo. Endocrinology. 1997;138:1780-6.
[10] Steinmetz R, Mitchner NA, Grant A, Allen DL, Bigsby RM, Ben-Jonathan N. The xenoestrogen bisphenol A induces growth, differentiation, and c-fos gene expression in the female reproductive tract. Endocrinology. 1998;139:2741-7.
[11] Markey CM, Michaelson CL, Veson EC, Sonnenschein C, Soto AM. The mouse uterotropic assay: a re-evaluation of its validity in assessing the estrogenicity of bisphenol A. Environ Health Perspect. 2001;109:55-60.
[12] Sharpe RM, Skakkebaek NE. Are oestrogens involved in falling sperm count and disorders of the male reproductive tract? Lancet. 1993;341:1392-5.
[13] Skakkebaek NE, Meyts ER, Jorgensen N et al. Germ cell cancer and disorders of spermatogenesis: an environmental connection? APMIS. 1998;106:3-12.
39
[14] Munoz de Toro MM, Markey CM, Wadia PR et al. Perinatal exposure to Bisphenol A alters peripubertal mammary gland development in mice. Endocrinology. 2005;146:4138-47.
[15] Sajiki J, Takahashi K, Yonekubo J. Sensitive method for the determination of bisphenol-A in serum using two systems of high-performance liquid chromatography. Journal of Chromatography B. 1999;736:255-61.
[16] Fukata H, Miyagawa H, Yamazaki N, Mori C. Comparison of ELISA- and LC-MS-Based Methodologies for the Exposure Assessment of Bisphenol A. Toxicology Mechanisms & Methods. 2006;16:427-30.
[17] Zalko D, Soto AM, Dolo L et al. Biotransformations of bisphenol A in a mammalian model: answers and new questions raised by low-dose metabolic fate studies in pregnant CD1 mice. Environ Health Perspect. 2003;111:309-19.
[18] Inoue K, Kato K, Yoshimura Y, Makino T, Nakazawa H. Determination of bisphenol A in human serum by high-performance liquid chromatography with multi-electrode electrochemical detection. Journal of Chromatography B. 2000;749:17-23.
[19] Ikezuki Y, Tsutsumi O, Takai Y, Kamei Y, Taketani Y. Determination of bisphenol A concentrations in human biological fluids reveals significant early prenatal exposure. Hum Reprod. 2002;17:2839-41.
[20] Schonfelder G, Wittfoht W, Hopp H, Talsness CE, Paul M, Chahoud I. Parent bisphenol A accumulation in the human maternal-fetal-placental unit. Environ Health Perspect. 2002;110:A703-A707.
[21] Yamada H, Furuta I, Kato EH et al. Maternal serum and amniotic fluid bisphenol A concentrations in the early second trimester. Reproductive Toxicology. 2002;16:735-9.
[22] Tan BLL, Ali Mohd M. Analysis of selected pesticides and alkylphenols in human cord blood by gas chromatograph-mass spectrometer. Talanta. 2003;61:385-91.
[23] Takeuchi T, Tsutsumi O. Serum bisphenol A concentrations showed gender differences, possibly linked to androgen levels. Biochem Biophys Res Commun. 2002;291:76-8.
[24] Takeuchi T, Tsutsumi O, Ikezuki Y, Takai Y, Taketani Y. Positive relationship between androgen and the endocrine disruptor, bisphenol A, in normal women and women with ovarian dysfunction. Endocrine Journal. 2004;51:165-9.
[25] Takeuchi T, Tsutsumi O, Ikezuki Y et al. Elevated serum bisphenol A levels under hyperandrogenic conditions may be caused by decreased UDP-glucuronosyltransferase activity. Endocrine Journal. 2006;53:485-91.
40
[26] Engel SM, Levy B, Liu Z, Kaplan D, Wolff MS. Xenobiotic phenols in early pregnancy amniotic fluid. Reproductive Toxicology. 2006;21:110-2.
[27] Sun Y, Irie M, Kishikawa N, Wada M, Kuroda N, Nakashima K. Determination of bisphenol A in human breast milk by HPLC with column-switching and fluorescence detection. Biomed Chromatogr. 2004;18:501-7.
[28] Ye X, Kuklenyik Z, Needham J, Calafat AM. Measuring environmental phenols and chlorinated organic chemicals in breast milk using automated on-line column-switching-high performance liquid chromatography-isotope dilution tandem mass spectrometry. Journal of Chromatography B. 2006;831:110-5.
[29] Kuruto-Niwa R, Tateoka Y, Usuki Y, Nozawa R. Measurement of bisphenol A concentrations in human colostrum. Chemosphere. 2007;66:1160-4.
[30] Kuruto-Niwa R, Tateoka Y, Usuki Y, Nozawa R. Measurement of bisphenol A concentrations in human colostrum. Chemosphere. 2006;
[31] Calafat AM, Kuklenyik Z, Reidy JA, Caudill SP, Ekong J, Needham JL. Urinary concentrations of Bisphenol A and 4-Nonylphenol in a human reference population. Environ Health Perspect. 2005;113:391-5.
[32] Wolff MS, Teitelbaum SL, Windham G et al. Pilot study of urinary biomarkers of phytoestrogens, phthalates, and phenols in girls. Environ Health Perspect. 2007;115:116-21.
[33] Kim Y-H, Kim C-S, Park S, Han SY, Pyo M-Y, Yang M. Gender differences in the levels of bisphenol A metabolites in urine. Biochem Biophys Res Commun. 2003;312:441-8.
[34] Ouichi K, Watanabe S. Measurement of bisphenol A in human urine using liquid chromatography with multi-channel coulometric electrochemical detection. Journal of Chromatography B. 2002;780:365-70.
[35] Matsumoto A, Kunugita N, Kitagawa K et al. Bisphenol A levels in human urine. Environ Health Perspect. 2003;111:101-4.
[36] Inoue K, Wada M, Higuchi T et al. Application of liquid chromatography-mass spectrometry to the quantification of bisphenol A in human semen. Journal of Chromatography B. 2002;773:97-102.
[37] Katayama M, Matsuda Y, Shimokawa K-I, Ishikawa H, Kaneko S. Preliminary monitoring of bisphenol A and nonylphenol in human semen by sensitive high performance liquid chromatography and capillary electrophoresis after proteinase K digestion. Analytical Letters. 2003;36:2659-67.
[38] Hunt PA, Koehler KE, Susiarjo M et al. Bisphenol A exposure causes meiotic aneuploidy in the female mouse. Current Biology. 2003;13:546-53.
41
[39] Wilson NK, Chuang JC, Lyu C, Menton R, Morgan MK. Aggregate exposures of nine preschool children to persistent organic pollutants at day care and at home. Journal of Exposure Analysis and Environmental Epidemiology. 2003;13:187-202.
[40] Wilson NK, Chuang JC, Morgan MK, Lordo RA, Sheldon LS. An observational study of the potential exposures of preschool children to pentachlorophenol, bisphenol-A, and nonylphenol at home and daycare. Environmental Research. 2007;103:9-20.
[41] Hanaoka T, Nawamura N, Hara K, Tsugane S. Urinary bisphenol A and plasma hormone concentrations in male workers exposed to bisphenol A diglycidyl ether and mixed organic solvents. Occup Environ Med. 2002;59:625-8.
[42] Sugiura-Ogasawara M, Ozaki Y, Sonta S-I, Makino T, Suzumori K. Exposure to bisphenol A is associated with recurrent miscarriage. Hum Reprod. 2005;20:2325-9.
[43] Yang M, Kim S-Y, Chang S-S, Lee I-S, Kawamoto T. Urinary concentrations of bisphenol A in relation to biomarkers of sensitivity and effect and endocrine-related health effects. Environmental and Molecular Mutagenesis. 2006;47:571-8.
[44] Kang J-H, Kondo F, Katayama Y. Human exposure to bisphenol A. Toxicology. 2006;226:79-89.
[46] Thompson BM, Cressey PJ, Shaw IC. Dietary exposure to xenoestrogens in New Zealand. J Environ Monit. 2003;5:229-35.
[47] Krishnan AV, Starhis P, Permuth SF, Tokes L, Feldman D. Bisphenol-A: an estrogenic substance is released from polycarbonate flasks during autoclaving. Endocrinology. 1993;132:2279-86.
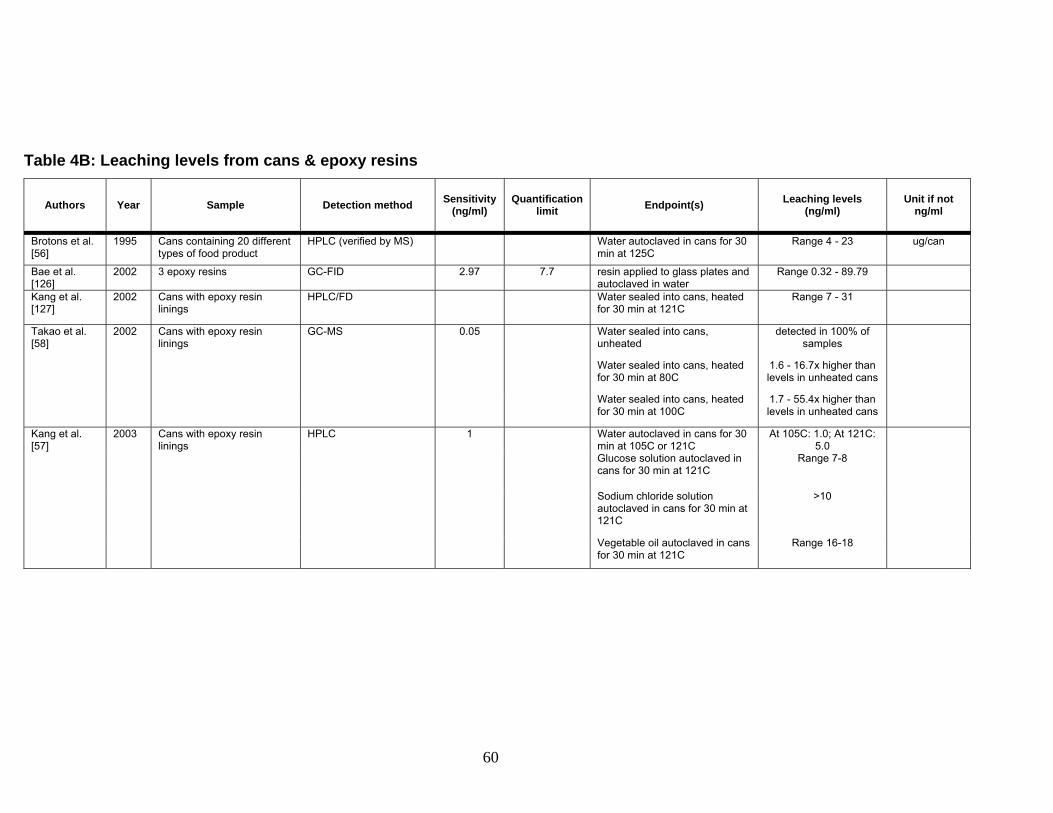
[48] Wong KO, Leo LW, Seah HL. Dietary exposure assessment of infants to bisphenol A from the use of polycarbonate baby milk bottles. Food Addit Contam. 2005;22:280-8.
[49] Sun Y, Wada M, Al-Dirbashi O, Kuroda N, Nakazawa H, Nakashima K. High-performance liquid chromatography with peroxyoxalate chemiluminescence detection of bisphenol A migrated from polycarbonate baby bottles using 4-(4,5-diphenyl-1H-imidazol-2-yl)benzoyl chlorine as a label. Journal of Chromatography B. 2000;749:49-56.
[50] Brede C, Fjeldal P, Skjevrak I, Herikstad H. Increased migration levels of bisphenol A from polycarbonate baby bottles after dishwashing, boiling, and brushing. Food Addit Contam. 2003;20:684-9.
42
[51] Nerín C, Fernandez C, Domeno C, Salafranca J. Determination of potential migrants in polycarbonate containers used for microwave ovens by high-performance liquid chromatography with ultraviolet and fluorescence detection. J Agric Food Chem. 2003;51:5647-53.
[52] Lopez-Cervantes J, Paseiro-Losada P. Determination of bisphenol A in, and its migration from, PVC stretch film used for food packaging. Food Addit Contam. 2003;20:596-606.
[53] Vinggaard AM, Korner W, Lund KH, Bolz U, Petersen JH. Identification and quantification of estrogenic compounds in recycled and virgin paper for household use as determined by an in vitro yeast estrogen screen and chemical analysis. Chem Res Toxicol. 2000;13:1214-22.
[54] Ozaki A, Yamaguchi A, Fujita T, Kuroda K, Endo G. Chemical analysis and genotoxicological safety assessment of paper and paperboard used for food packaging. Food Chem Toxicol. 2004;42:1323-37.
[55] Lopez-Espinosa MJ, Granada A, Araque P et al. Oestrogenicity of paper and cardboard extracts used as food containers. Food Addit Contam. 2007;24:95-102.
[56] Brotons JA, Olea-Serrano MF, Villalobos M, Olea N. Xenoestrogens released from lacquer coating in food cans. Environ Health Perspect. 1994;103:608-12.
[57] Kang J-H, Kito K, Kondo F. Factors influencing the migration of bisphenol A from cans. Journal of Food Protection. 2003;66:1444-7.
[58] Takao Y, Lee HC, Kohra S, Arizono K. Release of bisphenol from food can lining upon heating. Journal of Health Science. 2002;48:331-4.
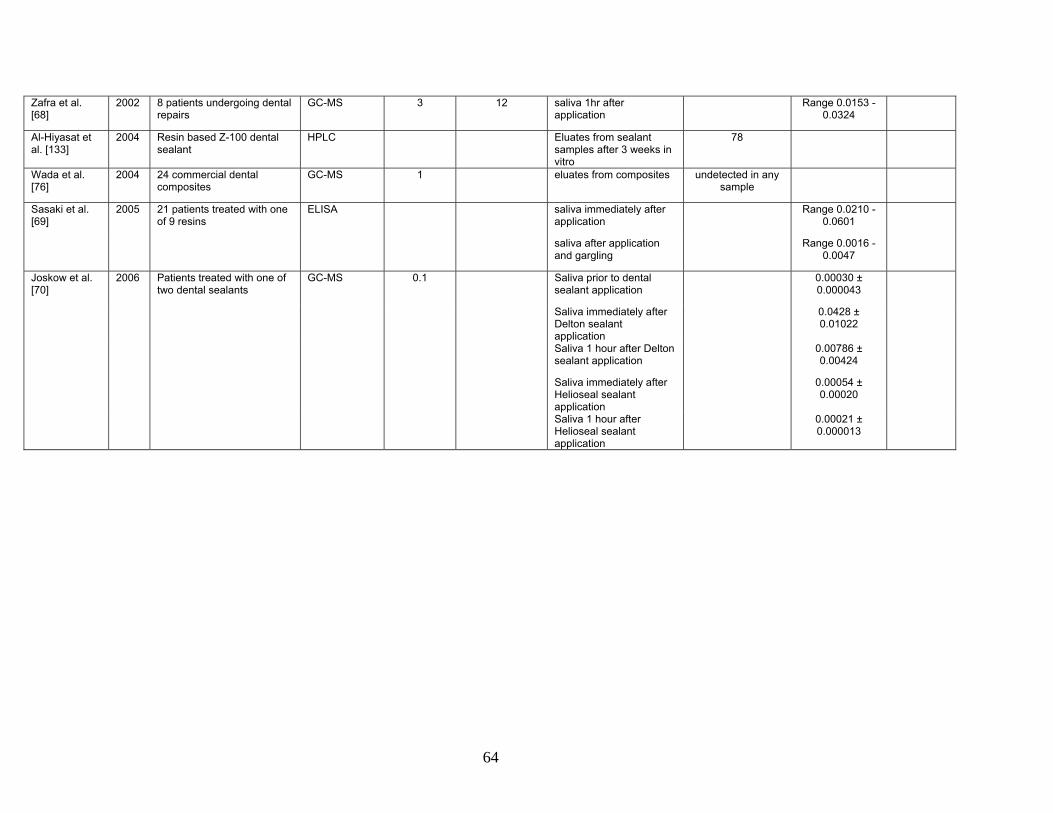
[59] Kang J-H, Kondo F. Determination of bisphenol A in canned pet foods. Research in Veterinary Science. 2002;73:177-82.
[60] Yoshida T, Horie M, Hoshino Y, Nakazawa H. Determination of bisphenol A in canned vegetables and fruit by high performance liquid chromatography. Food Addit Contam. 2001;18:69-75.
[61] Goodson A, Summerfield W, Cooper I. Survey of bisphenol A and bisphenol F in canned foods. Food Addit Contam. 2002;19:796-802.
[62] Munguía-López EM, Gerardo-Lugo S, Peralta E, Bolumen S, Soto-Valdez H. Migration of bisphenol A (BPA) from can coatings into fatty-food simulant and tuna fish. Food Addit Contam. 2005;22:892-8.
[63] Biles JE, McNeal TP, Begley TH. Determination of bisphenol A migrating from epoxy can coatings to infant formula liquid concentrates. J Agric Food Chem. 1997;45:4697-700.
43
[64] Kuo H-W, Ding W-H. Trace determination of bisphenol A and phytoestrogens in infant formula powders by gas chromatography-mass spectrometry. Journal of Chromatography A. 2004;1027:67-74.
[65] Olea N, Pulgar R, Perez P et al. Estrogenicity of resin-based composites and sealants used in dentistry. Environ Health Perspect. 1996;104(3):298-305.
[66] Arenholt-Bindselv D, Breinholt V, Preiss A, Schmalz G. Time-related bisphenol-A content and estrogenic activity in saliva samples collected in relation to placement of fissure sealants. Clin Oral Invest. 1999;3:120-5.
[67] Fung EYK, Ewoldsen NO, St.Germain JrHA et al. Pharmacokinetics of bisphenol A released from a dental sealant. J Am Dent Assoc. 2000;131:51-8.
[68] Zafra A, del Olmo M, Pulgar R, Navalón A, Vílchez JL. Determination of bisphenol-A and related compounds in human saliva by gas chromatography-mass spectometry. Chromatographia. 2002;56:213-8.
[69] Sasaki N, Okuda K, Kato T et al. Salivary bisphenol-A levels detected by ELISA after restoration with composite resin. Journal of Materials Science: Materials in Medicine. 2005;16:297-300.
[70] Joskow R, Barr DB, Barr JR, Calafat AM, Needham LL, Rubin C. Exposure to bisphenol A from bis-glycidyl dimethacrylate-based dental sealants. J Am Dent Assoc. 2006;137:353-62.
[71] Lewis JB, Rueggeberg FA, Lapp CA, Ergle JW, Schuster GS. Identification and characterization of estrogen-like components in commercial resin-based dental restorative materials. Clin Oral Invest. 1999;3:107-13.
[72] Schmalz G, Preiss A, Arenholt-Bindselv D. Bisphenol-A content of resin monomers and related degradation products. Clinical Oral Investigations. 1999;3:114-9.
[73] Pulgar R, Olea-Serrano F, Novillo-Fertrell A et al. Determination of bisphenol A and related aromatic compounds released from Bis-GMA-based composites and sealants by high performance liquid chromatography. Environ Health Perspect. 2000;108:21-7.
[74] Nathanson D, Lertpitayakun P, Lamkin MS, Edalatpour M, Chou LL. In vitro elution of leachable components from dental sealants. J Am Dent Assoc. 1997;128:1517-23.
[75] Tarumi H, Imazato S, Narimatsu M, Matsuo M, Ebisu S. Estrogenicity of fissure sealants and adhesive resins determined by reporter gene assay. J Dent Res. 2000;79:1838-43.
44
[76] Wada H, Tarumi H, Imazato S, Narimatsu M, Ebisu S. In vitro estrogenicity of resin composites. J Dent Res. 2004;83:222-3.
[77] Atkinson JC, Diamond F, Eichmiller F, Selwitz R, Jones G. Stability of bisphenol A, triethylene-glycol dimethyacrylate, and bisphenol A dimethyacrylate in whole saliva. Dental Materials. 2002;18:128-35.
[78] Kawagoshi Y, Fujita Y, Kishi I, Fukunaga I. Estrogenic chemicals and estrogenic activity in leachate from municipal waste landfill determined by yeast two-hybrid assay. J Environ Monit. 2003;5:269-74.
[79] Coors A, Jones PD, Giesy JP, Ratte HT. Removal of estrogenic activity from municipal waste landfill leachate assessed with a bioassay based on reporter gene expression. Environ Sci Technol. 2003;37:3430-4.
[80] Yamamoto T, Yasuhara A, Shiraishi H, Nakasugi O. Bisphenol A in hazardous waste landfill leachates. Chemosphere. 2001;42:415-8.
[82] Kuch HM, Ballschmiter K. Determination of endocrine-disrupting phenolic compounds and estrogens in surface and drinking water by HRGC-(NCI)-MS in the picogram per liter range. Environ Sci Technol. 2001;35:3201-6.
[83] Belfroid A, van Velzen M, van der Horst B, Vethaak D. Occurrence of bisphenol A in surface water and uptake in fish: evaluation of field measurements. Chemosphere. 2002;49:97-103.
[84] Kolpin DW, Furlong ET, Meyer MT et al. Pharmaceuticals, hormones, and other organic wastewater contaminants in U.S. streams, 1999-2000: A national reconnaissance. Environ Sci Technol. 2002;36:1202-11.
[85] Matsumoto H, Adachi S, Suzuki Y. Bisphenol A in ambient air particulates responsible for the proliferation of MCF-7 human breast cancer cells and its concentration changes over 6 months. Arch Environ Con Tox. 2005;48:459-66.
[86] Rudel RA, Camann DE, Spengler JD, Korn LR, Brody JG. Phthalates, alkylphenols, pesticides, polybrominated diphenyl ethers, and other endocrine-disrupting compounds in indoor air and dust. Environ Sci Technol. 2003;37:4543-55.
[87] Rudel RA, Brody JG, Spengler JD et al. Identification of selected hormonally active agents and animal mammary carcinogenesis in commercial and residential air and dust samples. Journal of the Air and Waste Management Association. 2001;51:499-513.
45
[88] Pottenger LH, Domoradzki JY, Markham DA, Hansen SC, Cagen SZ, Waechter JMJr. The relative bioavailability and metabolism of bisphenol A in rats is dependent upon the route of administration. Toxicol Sci. 2000;54:3-18.
[89] Teeguarden JG, Waechter JMJr, Clewell HJ, Covington TR, Barton HA. Evaluation of oral and intravenous route pharmacokinetics, plasma binding protein, and uterine tissue dose metrics of bisphenol A: a physiologically based pharmacokinetic approach. Toxicol Sci. 2005;85:823-38.
[90] Matsumoto J, Yokota H, Yuasa A. Developmental increases in rat hepatic microsomal UDP-glucuronosyltransferase activities toward xenoestrogens and decreases during pregnancy. Environ Health Perspect. 2002;110:193-6.
[91] Snyder RW, Maness SC, Gaido KW, Sumner SCJ, Fennell TR. Metabolism and disposition of Bisphenol A in female rats. Toxicol Appl Pharmacol. 2000;168:225-34.
[92] Matthews JB, Twomey K, Zacharewski TR. In vitro and in vivo interactions of bisphenol A and its metabolite, bisphenol A glucuronide, with estrogen receptors alpha and beta. Chem Res Toxicol. 2001;14:149-57.
[93] Kurebayashi H, Nagatsuka S, Nemoto H, Noquchi H, Ohno Y. Disposition of low doses of 14C-bisphenol A in male, female, pregnant, fetal, and neonatal rats. Arch Toxicol. 2005;79:243-52.
[94] Kurebayashi H, Harada R, Stewart RK, Numata H, Ohno Y. Disposition of a low dose of bisphenol A in male and female cynomolgus monkeys. Toxicol Sci. 2002;68:32-42.
[95] Kurebayashi H, Betsui H, Ohno Y. Disposition of a low dose of 14C-bisphenol A in male rats and its main biliary excretion as BPA glucuronide. Toxicol Sci. 2003;73:17-25.
[96] Nagel SC, vom Saal FS, Thayer KA, Dhar MG, Boechler M, Welshons WV. Relative binding affinity-serum modified access (RBA-SMA) assay predicts the relative in vivo bioactivity of the xenoestrogens bisphenol A and octylphenol. Environ Health Perspect. 1997;105:70-6.
[97] Domoradzki JY, Pottenger LH, Thornton CM et al. Metabolism and pharmacokinetics of bisphenol A (BPA) and the embryo-fetal distribution of BPA and BPA-monoglucuronide in CD Sprague-Dawley rats at three gestational stages. Toxicol Sci. 2003;76:21-34.
[98] Shin BS, Kim CH, Jun YS et al. Physiologically based pharmacokinetics of bisphenol A. J Toxicol Environ Health A. 2004;67:1971-85.
46
[99] Upmeier A, Degan GH, Diel P, Michna H, Bolt HM. Toxicokinetics of bisphenol A in female DA/Han rats after a single i.v. and oral administration. Toxiokinetics and Metabolism. 2000;74:431-6.
[100] Domoradzki JY, Thornton CM, Pottenger LH et al. Age and dose dependency of the pharmacokinetics and metabolism of bisphenol A in neonatal Sprague-Dawley rats following oral administration. Toxicol Sci. 2004;77:230-42.
[101] Tominaga T, Negishi T, Hirooka H et al. Toxicokinetics of bisphenol A in rats, monkeys and chimpanzees by the LC-MS/MS method. Toxicology. 2006;226:208-17.
[102] Volkel W, Colnot T, Csanady GA, Filser JG, Dekant W. Metabolism and kinetics of bisphenol A in humans at low doses following oral administration. Chem Res Toxicol. 2002;15:1281-7.
[103] Volkel W, Bittner N, Dekant W. Quantitation of bisphenol A and bisphenol A glucuronide in biological samples by high performance liquid chromatography-tandem mass spectrometry. Drug Metabolism and Disposition. 2005;33:1748-57.
[104] Yang M, Kim S-Y, Lee S-M et al. Biological monitoring of bisphenol A in a Korean population. Arch Environ Contam Toxicol. 2003;44:546-51.
[105] Yokota H, Iwano H, Endo M et al. Glucuonidation of the environmental oestrogen bisphenol A by an isoform of UDP-glucuronosyltransferase, UGT2B1, in the rat liver. Biochem J. 1999;340:405-9.
[106] Yoshihara S, Mizutare T, Makishima M et al. Potent estrogenic metabolites of bisphenol A and bisphenol B formed by rat liver S9 fraction: their structures and estrogenic potency. Toxicol Sci. 2004;78:50-9.
[107] Inoue K, Murayama S, Takeba K, Yoshimura Y, Nakazawa H. Contamination of xenoestrogens bisphenol A and F in honey: safety assessment and analytical method of these compounds in honey. Journal of Food Composition and Analysis. 2003;16:497-506.
[108] Sakamoto H, Yokota H, Kibe R, Sayama Y, Yuasa A. Excretion of bisphenol A-glucuronide into the small intestine and deconjugation in the cecum of the rat. Biochemica et Biophysica Acta. 2002;1573:171-6.
[109] Takahashi O, Oishi S. Disposition of orally administered 2,2-bis(4-hydroxyphenyl) propane (Bisphenol A) in pregnant rats and placental transfer to fetuses. Environ Health Perspect. 2000;108:931-5.
[110] Uchida K, Suzuki A, Kobayashi Y et al. Bisphenol A administration during pregnancy results in fetal exposure in mice and monkeys. Journal of Health Science. 2002;48:579-82.
47
[111] Elsby R, Maggs JL, Ashby J, Park BK. Comparison of the modulatory effects of human and rat liver microsomal metabolism on the estrogenicity of bisphenol A: implications for extrapolation to humans. J Pharmacol Exp Ther. 2001;297:103-13.
[112] Pritchett JJ, Kuester RK, Sipes IG. Metabolism of bisphenol a in primary cultured hepatocytes from mice, rats, and humans. Drug Metabolism and Disposition. 2002;30:1180-5.
[113] Inoue K, Yamaguchi A, Wada M, Yoshimura Y, Makino T, Nakazawa H. Quantitative detection of bisphenol A and bisphenol A diglycidyl ether metabolites in human plasma by liquid chromatography-electrospray mass spectrometry. Journal of Chromatography B. 2001;765:121-6.
[114] Todaka E, Mori C. Necessity to establish new risk assessment and risk communication for human fetal exposure to multiple endocrine disruptors in Japan. Congenital Anomalies. 2002;42:87-93.
[115] Kuroda N, Kinoshita Y, Sun Y et al. Measurement of bisphenol A levels in human blood serum and acitic fluid by HPLC using a fluorescent labeling reagent. Journal of Pharmaceutical and Biomedical Analysis. 2003;30:1743-9.
[116] Otaka H, Yasuhara A, Morita M. Determination of bisphenol A and 4-nonlyphenol in human milk using alkaline digestion and cleanup by solid-phase extraction. Analytical Sciences. 2003;19:1663-6.
[117] Hiroi H, Tsutsumi O, Takeuchi T et al. Differences in serum bisphenol A concentrations in premenopausal normal women and women with endometrial hyperplasia. Endocrine Journal. 2004;51:595-600.
[118] Brock JW, Yoshimura Y, Barr JR et al. Measurement of bisphenol A levels in human urine. Journal of Exposure Analysis and Environmental Epidemiology. 2001;11:323-8.
[119] Tsukioka T, Brock J, Graiser S, Nguyen J, Nakazawa H, Makino T. Determination of trace amounts of Bisphenol A in urine by negative-ion-chemical-ionization-gas chromatography/mass spectrometry. Analytical Sciences. 2003;19:151-3.
[120] Liu Z, Wolff MS, Moline J. Analysis of environmental biomarkers in urine using an electrochemical detector. Journal of Chromatography B. 2005;819:155-9.
[121] Ye X, Kuklenyik Z, Needham LL, Calafat AM. Quantification of urinary conjugates of bisphenol A, 2,5-dichlorophenol, and 2-hydroxy-4-methoxybenzophenone in humans by online solid phase extraction-high performance liquid chromatography-tandem mass spectrometry. Anal Bioanal Chem. 2005;383:638-44.
48
[122] Mountfort KA, Kelly KA, Jickells SM, Castle L. Investigations into the potential degradation of polycarbonate baby bottles during sterilization with consequent release of bisphenol A. Food Addit Contam. 1997;14:737-40.
[123] D'Antuono A, Dall'Orto VC, Lo Balbo A, Sobral S, Rezzano I. Determination of bisphenol A in food-stimulating liquids using LCED with a chemically modified electrode. J Agric Food Chem. 2001;49:1098-101.
[124] Sajiki J, Yonekubo J. Leaching of bisphenol A (BPA) to seawater from polycarbonate plastic and its degradation by reactive oxygen species. Chemosphere. 2003;51:55-62.
[125] Sajiki J, Yonekubo J. Leaching of bisphenol A (BPA) from polycarbonate plastic to water containing amino acids and its degradation by radical oxygen species. Chemosphere. 2004;55:861-7.
[126] Bae B, Joeng JH, Lee SJ. The quantification and characterization of endocrine disruptor bisphenol-A leaching from epoxy resin. Water Science and Technology. 2002;46:381-7.
[127] Kang J-H, Kondo F. Bisphenol A migration from cans containing coffee and caffeine. Food Addit Contam. 2002;19:886-90.
[128] Biles JE, McNeal TP, Begley TH, Hollifield HC. Determination of Bisphenol-A in reusable polycarbonate food-contact plastics and migration to food simulating liquids. J Agric Food Chem. 1997;45:3541-4.
[129] Howe SR, Borodinsky L. Potential exposure to bisphenol A from food-contact use of polycarbonate resins. Food Addit Contam. 1998;15:370-5.
[130] Munguía-López EM, Peralta E, Gonzalez-Leon A, Vargas-Requena C, Soto-Valdez H. Migration of bisphenol A (BPA) from epoxy can coatings to Jalapeño peppers and an acid food simulant. J Agric Food Chem. 2002;50:7299-302.
[131] Maragou NC, Lampi EN, Thomaidis NS, Koupparis MA. Determination of bisphenol A in milk by solid phase extraction and liquid chromatography-mass spectrometry. Journal of Chromatography A. 2006;1129:165-73.
[132] Noda M, Komatsu H, Sano H. HPLC analysis of dental resin composites components. J Biomed Mat Res. 1999;47:374-8.
[133] Al-Hiyasat AS, Darmani H, Elbetieha AM. Leached components from dental composites and their effects on fertility of female mice. Eur J Oral Sci. 2004;112:267-72.
[134] Rudel RA, Melly SJ, Geno PW, Sun G, Brody JG. Identification of alkylphenols and other estrogenic phenolic compounds in wastewater, septage, and groundwater on Cape Cod, Massachusetts. Environ Sci Technol. 1998;32:861-9.
49
[135] Matsumoto H, Adachi S, Suzuki Y. Bisphenol A in ambient air particulates responsible for the proliferation of MCF-7 human breast caner cells and its concentration changes over 6 months. Arch Environ Con Tox. 2005;48 (4):459-66.
[136] Yoo SD, Shin BS, Lee BM et al. Bioavailability and mammary excretion of bisphenol a in Sprague-Dawley rats. J Toxicol Environ Health A. 2001;64:417-26.
[137] Negishi T, Tominaga T, Ishii Y et al. Comparative study on toxicokinetics of bisphenol A in F344 rats, monkeys (Macaca fascicularis), and chimpanzees (Pan troglodytes). Exp Anim. 2004;53:391-4.
[138] Moors S, Diel P, Degen GH. Toxicokinetics of bisphenol A in pregnant DA/Han rats after single i.v. application. Arch Toxicol. 2006;80:647-55.
[139] Savabieasfahani M, Kannan K, Astapova O, Evans NP, Padmanabhan V. Developmental programming: differential effects of prenatal exposure to bisphenol-A or methoxychlor on reproductive function. Endocrinology. 2006;147:5956-66.
[140] Xiao Q, Li Y, Ouyang H, Xu P, Wu D. High-performance liquid chromatographic analysis of bisphenol A and 4-nonylphenol in serum, liver and testis tissues after oral administration to rats and its application to toxicokinetic study. J Chromatogr B Analyt Technol Biomed Life Sci. 2006;830:322-9.
50
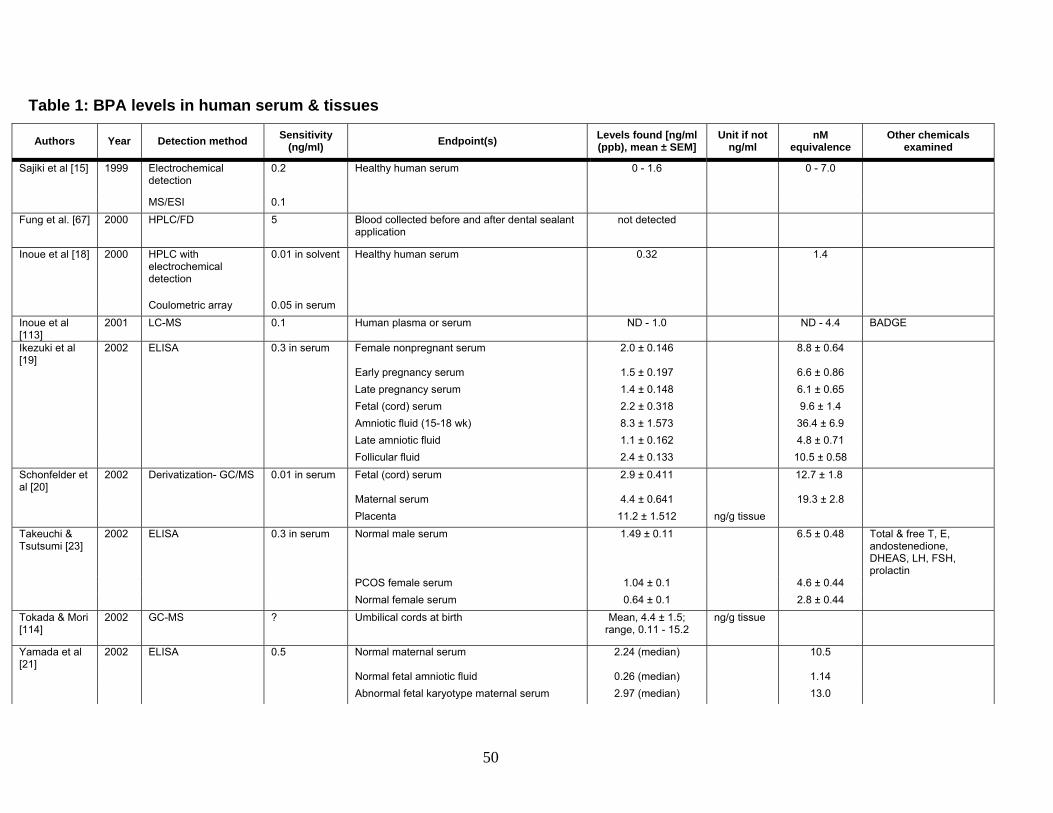
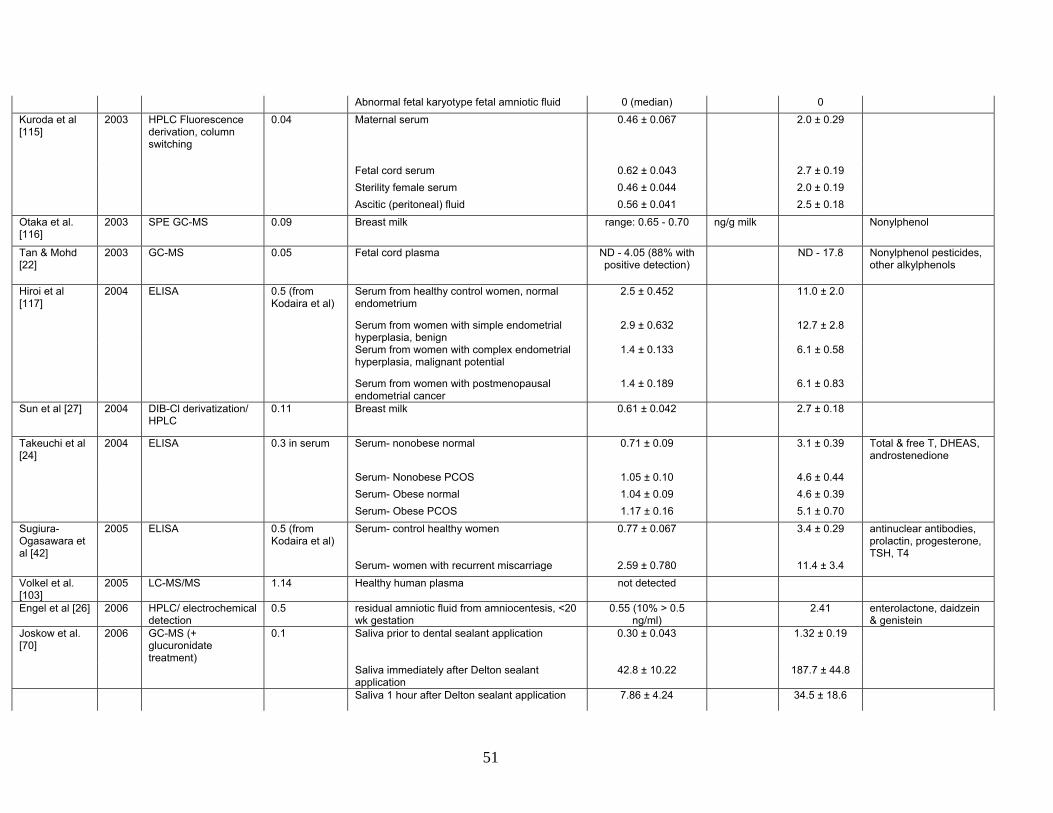
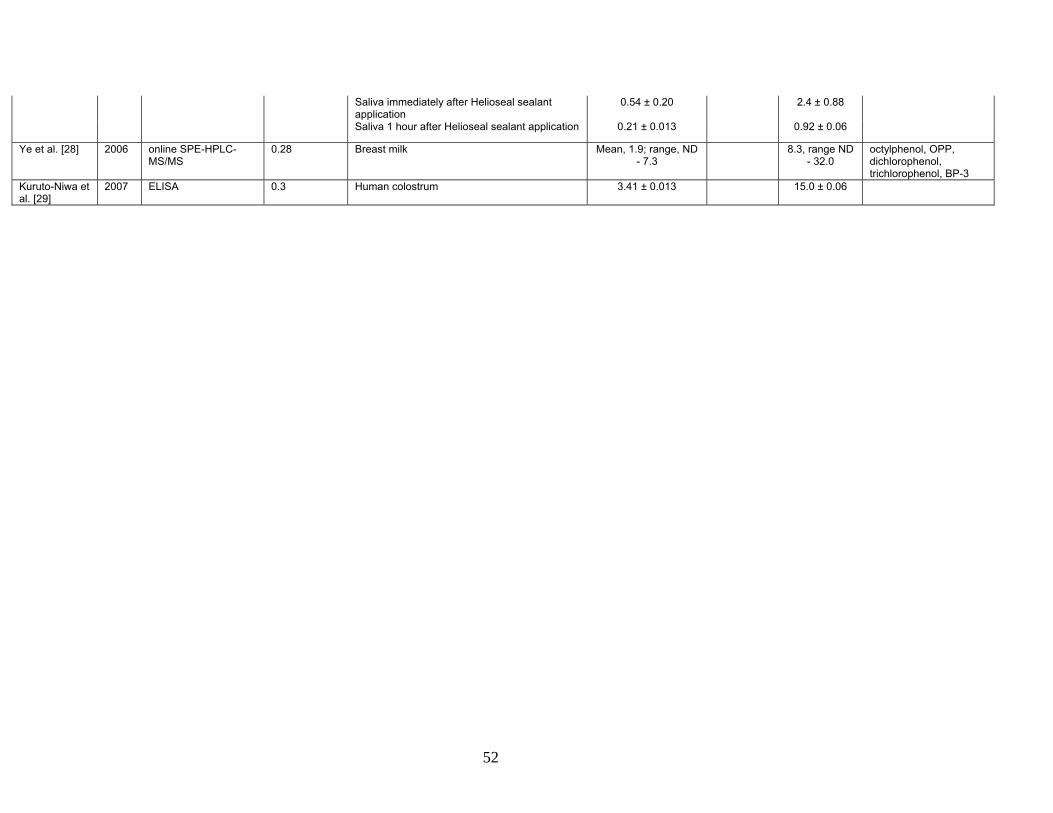
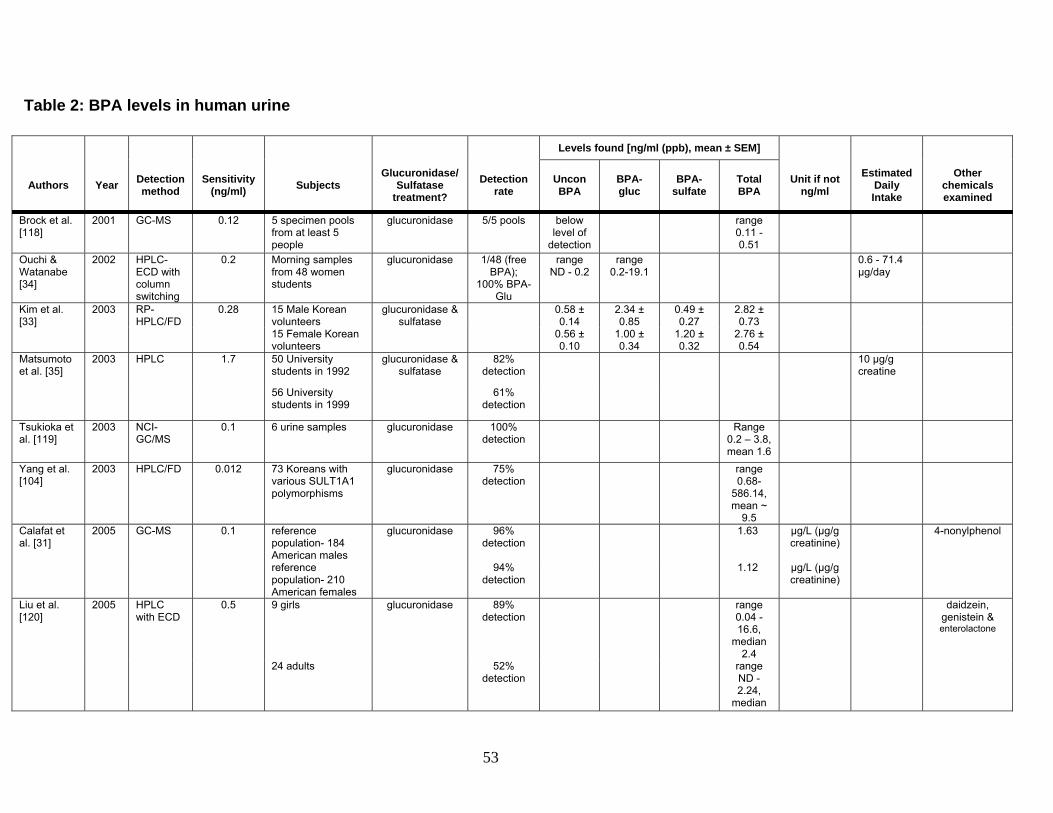
Table 1: BPA levels in human serum & tissues
Authors Year Detection method Sensitivity (ng/ml) Endpoint(s) Levels found [ng/ml
(ppb), mean ± SEM] Unit if not
ng/ml nM
equivalence Other chemicals
examined
Sajiki et al [15] 1999 Electrochemical detection
0.2 Healthy human serum 0 - 1.6 0 - 7.0
MS/ESI 0.1 Fung et al. [67] 2000 HPLC/FD 5 Blood collected before and after dental sealant
application not detected
Inoue et al [18] 2000 HPLC with electrochemical detection
0.01 in solvent Healthy human serum 0.32 1.4
Coulometric array 0.05 in serum Inoue et al [113]
2001 LC-MS 0.1 Human plasma or serum ND - 1.0 ND - 4.4 BADGE
2001 GC-MS 0.12 5 specimen pools from at least 5 people
glucuronidase 5/5 pools below level of
detection
range 0.11 - 0.51
Ouchi & Watanabe [34]
2002 HPLC-ECD with column switching
0.2 Morning samples from 48 women students
glucuronidase 1/48 (free BPA);
100% BPA-Glu
range ND - 0.2
range 0.2-19.1
0.6 - 71.4 μg/day
Kim et al. [33]
2003 RP-HPLC/FD
0.28 15 Male Korean volunteers
glucuronidase & sulfatase
0.58 ± 0.14
2.34 ± 0.85
0.49 ± 0.27
2.82 ± 0.73
15 Female Korean volunteers
0.56 ± 0.10
1.00 ± 0.34
1.20 ± 0.32
2.76 ± 0.54
Matsumoto et al. [35]
2003 HPLC 1.7 50 University students in 1992
glucuronidase & sulfatase
82% detection
10 μg/g creatine
56 University students in 1999
61% detection
Tsukioka et al. [119]
2003 NCI-GC/MS
0.1 6 urine samples glucuronidase 100% detection
Range 0.2 – 3.8, mean 1.6
Yang et al. [104]
2003 HPLC/FD 0.012 73 Koreans with various SULT1A1 polymorphisms
glucuronidase 75% detection
range 0.68-
586.14, mean ~
9.5
Calafat et al. [31]
2005 GC-MS 0.1 reference population- 184 American males
glucuronidase 96% detection
1.63 μg/L (μg/g creatinine)
4-nonylphenol
reference population- 210 American females
94% detection
1.12 μg/L (μg/g creatinine)
Liu et al. [120]
2005 HPLC with ECD
0.5 9 girls glucuronidase 89% detection
range 0.04 - 16.6,
median 2.4
daidzein, genistein & enterolactone
24 adults 52% detection
range ND - 2.24,
median
54
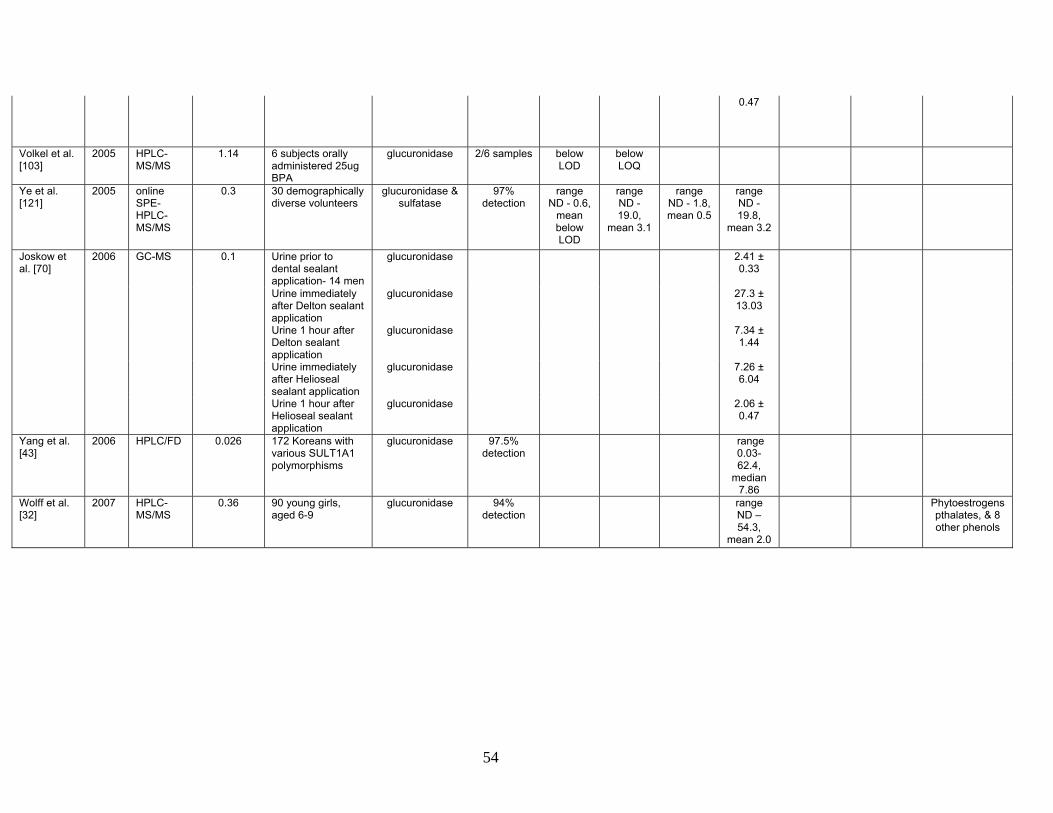
0.47
Volkel et al. [103]
2005 HPLC-MS/MS
1.14 6 subjects orally administered 25ug BPA
glucuronidase 2/6 samples below LOD
below LOQ
Ye et al. [121]
2005 online SPE-HPLC-MS/MS
0.3 30 demographically diverse volunteers
glucuronidase & sulfatase
97% detection
range ND - 0.6,
mean below LOD
range ND - 19.0,
mean 3.1
range ND - 1.8, mean 0.5
range ND - 19.8,
mean 3.2
Joskow et al. [70]
2006 GC-MS 0.1 Urine prior to dental sealant application- 14 men
glucuronidase 2.41 ± 0.33
Urine immediately after Delton sealant application
glucuronidase 27.3 ± 13.03
Urine 1 hour after Delton sealant application
glucuronidase 7.34 ± 1.44
Urine immediately after Helioseal sealant application
glucuronidase 7.26 ± 6.04
Urine 1 hour after Helioseal sealant application
glucuronidase 2.06 ± 0.47
Yang et al. [43]
2006 HPLC/FD 0.026 172 Koreans with various SULT1A1 polymorphisms
glucuronidase 97.5% detection
range 0.03-62.4,
median 7.86
Wolff et al. [32]
2007 HPLC-MS/MS
0.36 90 young girls, aged 6-9
glucuronidase 94% detection
range ND – 54.3,
mean 2.0
Phytoestrogenspthalates, & 8 other phenols
55
Table 3: Summary of epidemiology studies Authors Year Study Type Measurement of BPA Health related outcome Relationship between BPA
& disease Limitations
Hanaoka et al [41] 2002 Cross-sectional: 82 subjects (42 epoxy resin sprayers and 42 unexposed to BADGE)
Urinary BPA levels (by HPLC) in workers applying epoxy resins and unexposed workers
FSH levels high BPA levels are associated with lower FSH levels
Confounding exposures (organic solvents) present
Takeuchi & Tsutsumi [23]
2002 Cross-sectional: 14 healthy women, 16 women with PCOS and 11 healthy men
Serum BPA levels (by ELISA)
PCOS PCOS women had significantly higher BPA than normal women. BPA positively correlated with testosterone among men and women.
Small sample size, cross-sectional design
Yamada et al [21] 2002 Case control: 48 cases with abnormal karyotype, 200 controls (20 per year) selected from women carrying fetuses with normal karyotypes
BPA levels in materal serum & amniotic fluid at time of amniocentesis (by ELISA)
fetus with abnormal karyotype
Higher maternal serum BPA levels in cases with abnormal karyotype as compared to women with fetuses with normal karyotype
Confounders not adjusted for. Decline in BPA concentration over 10 year period, a trend also not adjusted for.
Kuroda et al [115] 2003 Cross-sectional: 9 healthy pregnant women, 21 women with sterility
BPA levels in serum & cord blood from pregnant women; serum & peritoneal fluid from women with sterility (measured by HPLC)
sterility No difference in serum BPA levels between pregnant and sterile women
Small sample size
Wilson et al [39] 2003 Observational: 9 pre-school aged children monitored for 48 hours
Urinary BPA levels, BPA levels in environmental samples
Primary route of BPA exposure was dietary.
Small sample size
Hiroi et al [117] 2004 Cross sectional: 7 women with endometrial carcinoma, 9 women with complex endometrial hyperplasia, 10 women with simple endometrial hyperplasia, 11 controls
Serum BPA levels (by ELISA)
endometrial carcinoma and hyperplasia
BPA lower in complex endometrial hyperplasia and endometrial cancer groups compared to control and simple endometrial hyperplasia groups
No confounders adjusted for, small sample size
Takeuchi et al [24] 2004 Cross-sectional: 7 cases with hyperprolactinemia, 21 cases of hypothalamic amenorrhea, 13 non-obese PCOS, 19 non-obese controls, 7 obese controls
Serum BPA levels (by ELISA)
obesity & PCOS compared to normal, non-obese women, BPA was higher in obese normal women, obese and non-obese women with PCOS.
Small sample size, cross-sectional design
Sugiura-Ogasawara et al [42]
2005 Cross-sectional: 45 women with recurrent miscarriage and 32 nulliparous women
Serum BPA levels (by ELISA)
recurrent miscarriage Mean BPA levels among women with recurrent miscarriage was higher than nulliparous women
Timing of exposure relative to outcome determination, BPA distribution highly skewed, medians identical
56
Wilson et al [40] 2006 Observational: 257 preschool children
Urinary BPA levels, BPA levels in environmental samples
Primary route of BPA exposure was dietary
Yang et al [43] 2006 Cross-sectional: 68 adults appearing for regular check-up
Urinary BPA (HPLC) Sister chromatid exchange in peripheral lymphocytes (untreated and MNNG-treated at .2mM, .4mM or .6mM); self-reported reproductive history and symptoms
Urinary BPA positively associated with SCE in untreated and MNNG-treated at .2mM. No association with SCE for MNNG-treated at higher doses. No association between BPA and self-reported reproductive history or symptoms.
57
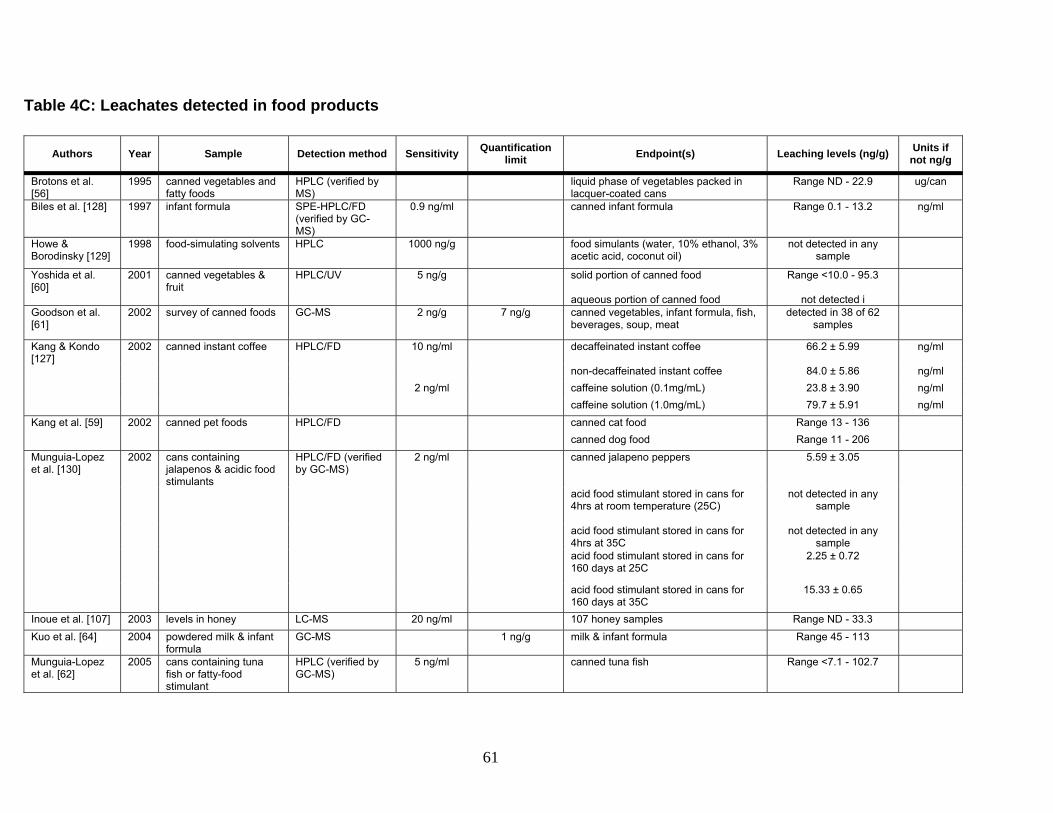
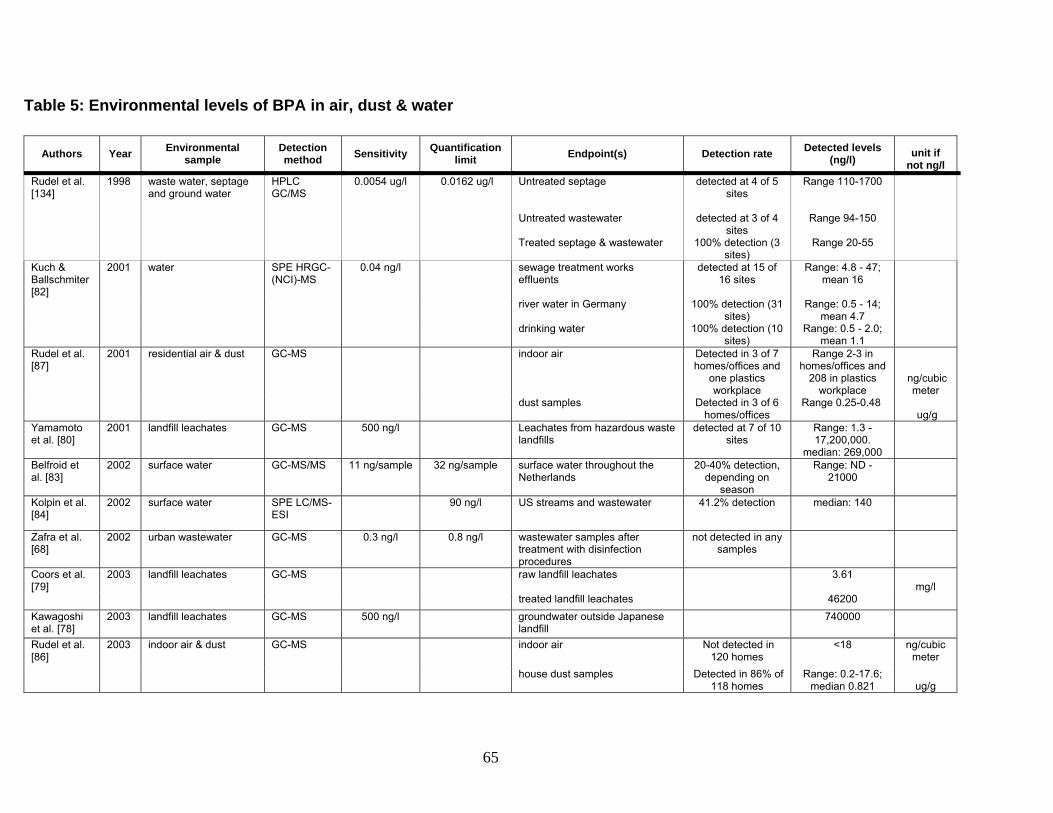
Table 4A: Leaching levels from baby bottles, consumer plastics and papers
Authors Year Sample Detection method Sensitivity Quantification limit Endpoint(s) Levels found in
product (µg/g) Leaching levels
(ng/ml) Unit if not
ng/ml
Baby Bottles
Mountfort et al. [122]
1997 24 polycarbonate baby bottles
HPLC/FD 0.03 ug/g infant feed in contact with baby bottles after simulated use
not detected in any sample, before or
after simulated use
Sun et al. [49] 2000 2 polycarbonate baby bottles
HPLC with chemiluminescence detection
0.38 ng/ml water in contact with new bottles for 30 min at 95C
Bottle A: 0.59 ± 0.04; Bottle B: 0.75
± 0.045
2nd test of water in contact with bottles for 30 min at 95C
Bottle A: 0.13 ± 0.005; Bottle B:
0.16 ± 0.01
water in contact with bottles for 30 min at 95C after brushing
Bottle A: 0.18 ± 0.01; Bottle B:
trace levels
D'Antuono et al. [123]
2001 4 brands of polycarbonate baby bottles purchased in Argentina
LC-ED 0.2 ng/ml distilled water in contact with baby bottle for 30 sec at 100C
1.2
Brede et al. [50] 2003 12 polycarbonate baby bottles purchased in Norway subjected to simulated use
SPE-GC (verified by MS)
0.1 ng/ml water food simulant in contact with new bottles for 1hr at 100C
0.23 ± 0.03
food simulant in contact with bottles for 1hr at 100C after 51 washes & 13 brushes
8.4 ± 1.2
food simulant in contact with bottles for 1hr at 100C after 169 washes & 23 brushes
6.7 ± 1.2
Wong et al. [48] 2005 28 polycarbonate baby bottles purchased in Singapore
HPLC (verified by GC-MS)
3 ug/g composition of plastic material from baby bottles
detected in 19 of 28 samples, mean:
28.1
50 ng/square
inch
10% ethanol in contact with bottles for 8 hr at 70C
ND - 580 ng/square inch
corn oil in contact with bottles for 8 hr at 100C
ND - 2560 ng/square inch
58
Consumer Plastics and Papers
Vinggaard et al. [53]
2000 9 paper towels from recycled paper
GC/FTIR/MS 0.2mg/kg paper
paper towel composition Range 0.55 - 24.1
11 paper towels from virgin paper
paper towel composition Range ND - 0.12
Nerin et al. [51] 2003 Plastic commercial containers for microwave
2002 surface water GC-MS/MS 11 ng/sample 32 ng/sample surface water throughout the Netherlands
20-40% detection, depending on
season
Range: ND - 21000
Kolpin et al. [84]
2002 surface water SPE LC/MS-ESI
90 ng/l US streams and wastewater 41.2% detection median: 140
Zafra et al. [68]
2002 urban wastewater GC-MS 0.3 ng/l 0.8 ng/l wastewater samples after treatment with disinfection procedures
not detected in any samples
Coors et al. [79]
2003 landfill leachates GC-MS raw landfill leachates 3.61 mg/l
treated landfill leachates 46200 Kawagoshi et al. [78]
2003 landfill leachates GC-MS 500 ng/l groundwater outside Japanese landfill
740000
Rudel et al. [86]
2003 indoor air & dust GC-MS indoor air Not detected in 120 homes
<18 ng/cubic meter
house dust samples Detected in 86% of 118 homes
Range: 0.2-17.6; median 0.821 ug/g
66
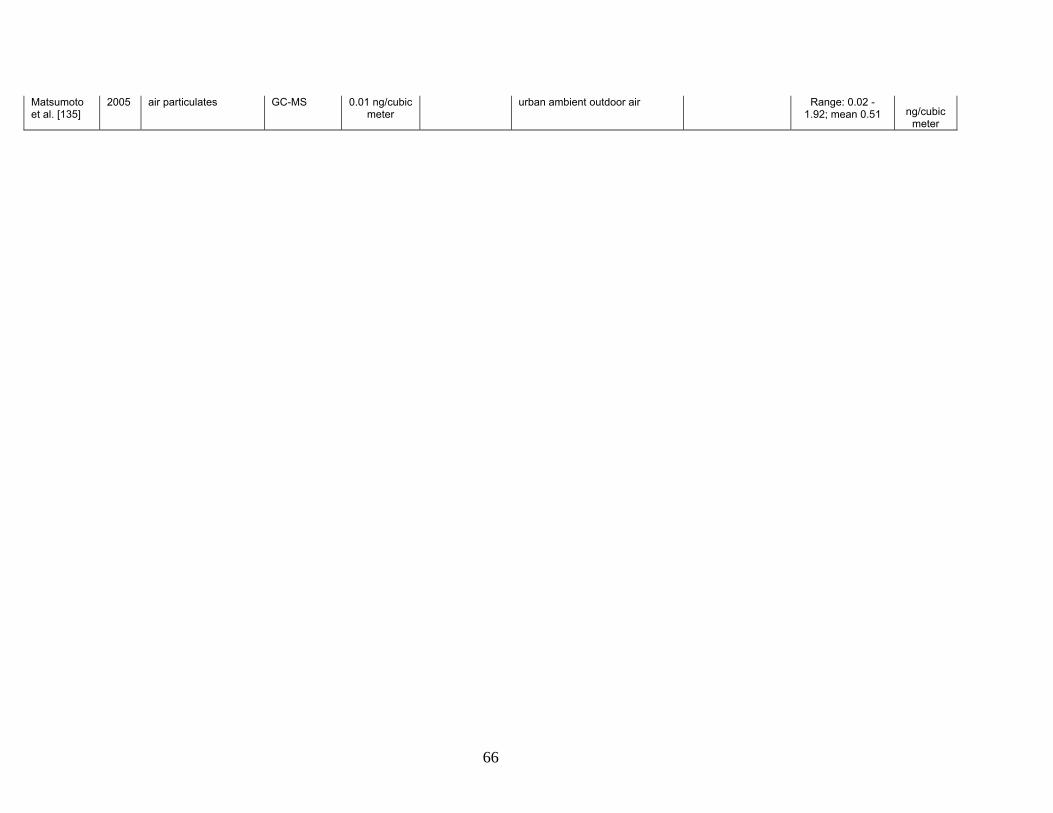
Matsumoto et al. [135]
2005 air particulates GC-MS 0.01 ng/cubic meter
urban ambient outdoor air Range: 0.02 - 1.92; mean 0.51 ng/cubic
meter
67
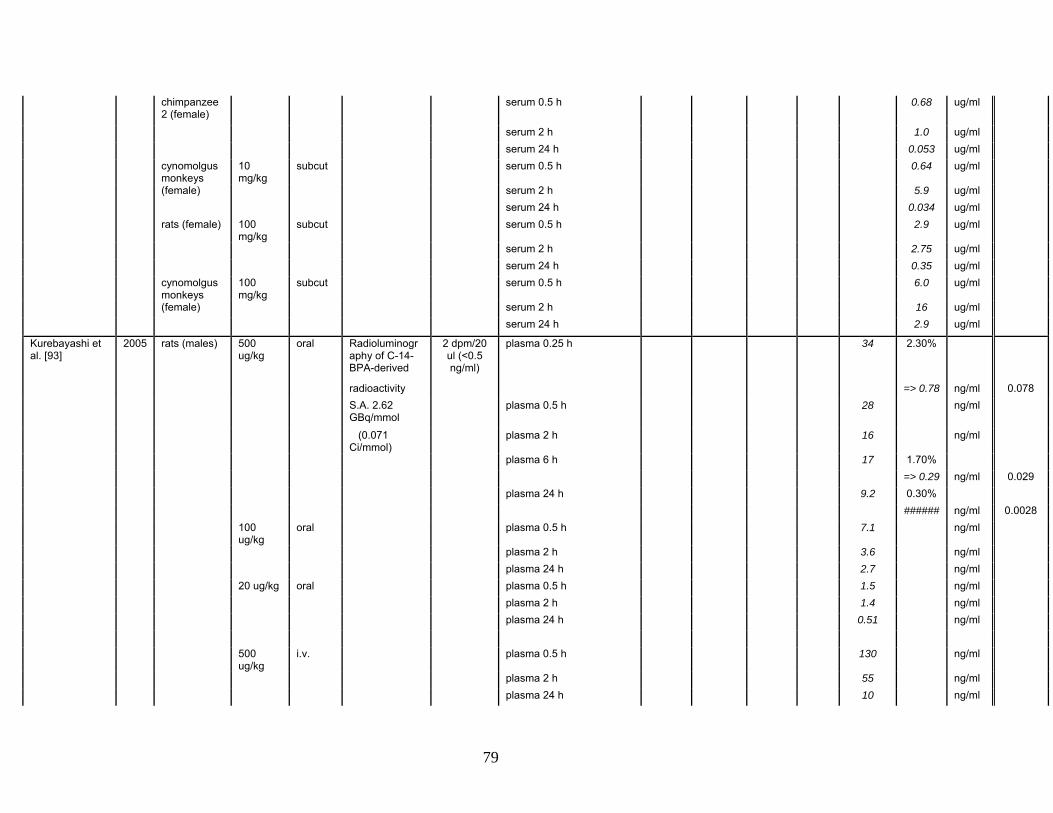
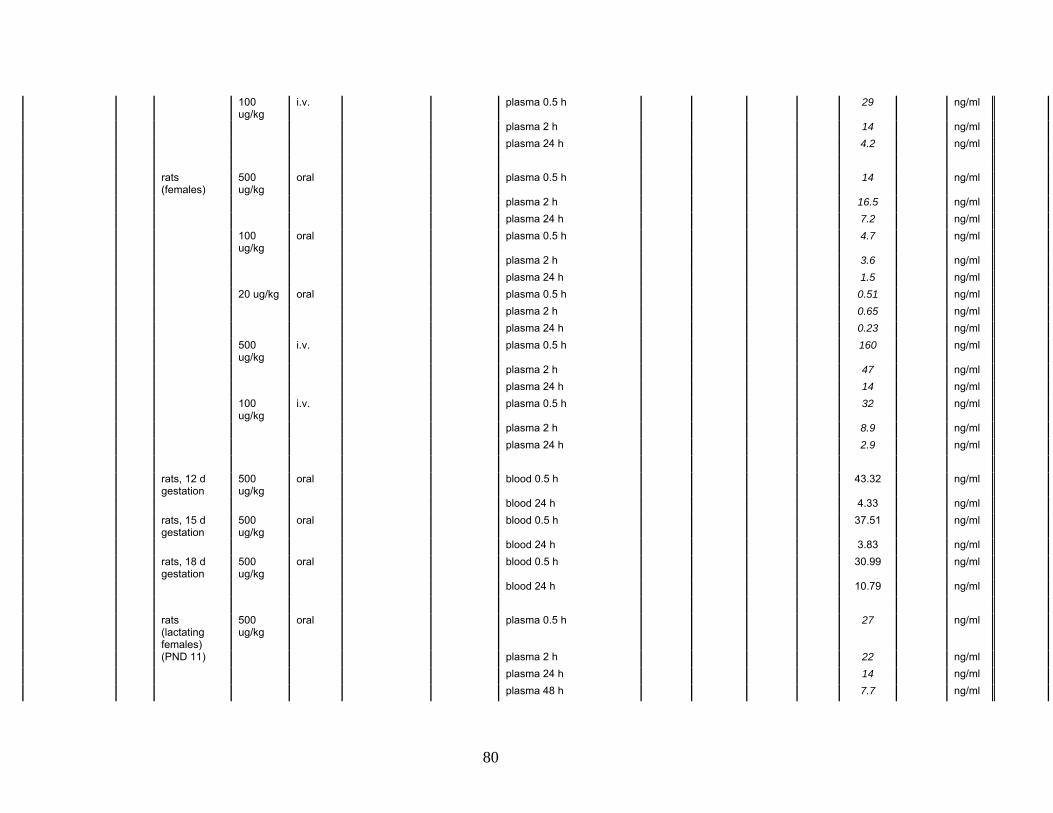
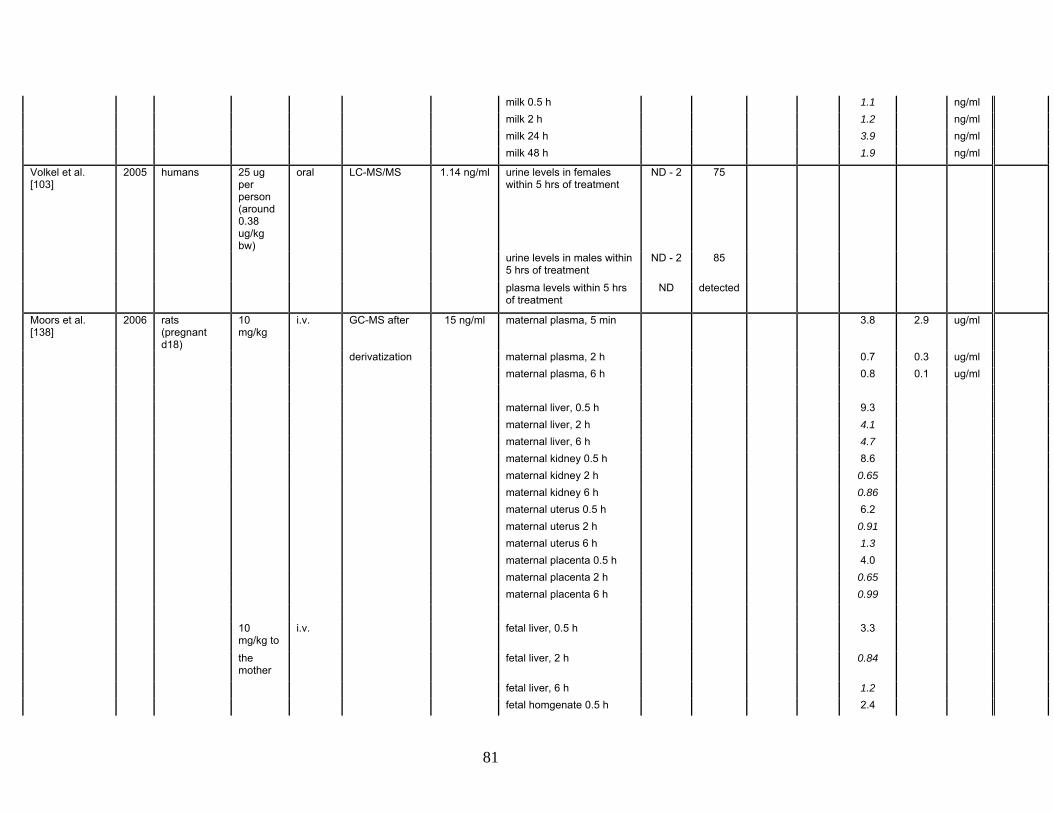
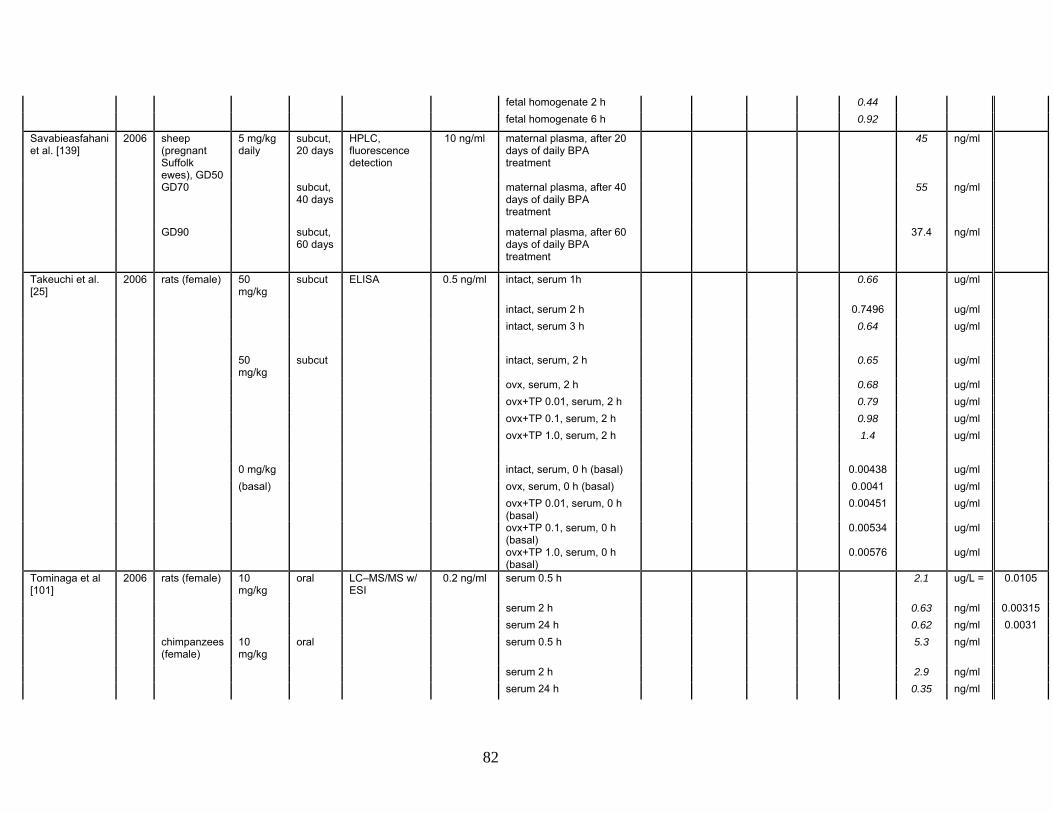
Table 6: Summary of acute metabolic studies Levels found (% of dose
administered) Levels measured (ug/g)
Unconj BPA
(ng/ml)
Authors Year Species
Dose adminis-
tered Dosing method
Detection method Sensitivity Endpoint(s)
Unconj BPA
BPA-gluc
BPA-sulfate
Total BPA
BPA Conj &/or Total
Unconj BPA
Units if not ug/g
scaled to oral dose of
50 ug/kg
Miyakoda et al., 1999
1999 rats (female, GD 19)
10 mg/kg
oral GC-MS with Selective Ion Monitoring after acetylation
1.5-2 ng/ml plasma (?)
Plasma, 1 h after dosing 34 ng/ml 0.17
Plasma, 3 h after dosing 3.6 ng/ml 0.018 Plasma, 24 h after dosing 3.0 ng/ml 0.015 Fetus, 1 h after maternal
dosing 11.4 ng/g
Fetus, 3 h after maternal dosing
4.4 ng/g
Fetus, 24 h after maternal dosing
7.5 ng/g
Miyakoda et al., 2000
2000 rats (female, GD 19)
10 mg/kg
oral GC-MS with Selective Ion Monitoring after acetylation
1.5-2 ng/ml plasma
Fetus, 1 h after maternal dosing
54 ng/g
Fetus, 1 h after maternal dosing, glucuronidase-treated
54 ng/g
rats (male) 10
mg/kg oral Plasma, 1 h after dosing 580 62 ng/ml 0.31
Plasma, 3 h after dosing 295 23 ng/ml 0.115 Plasma, 8 h after dosing 640 12 ng/ml 0.06 Testis, 1 h after dosing 160 21 ng/g Testis, 3 h after dosing 36 22 ng/g Testis, 8 h after dosing 36 42 ng/g
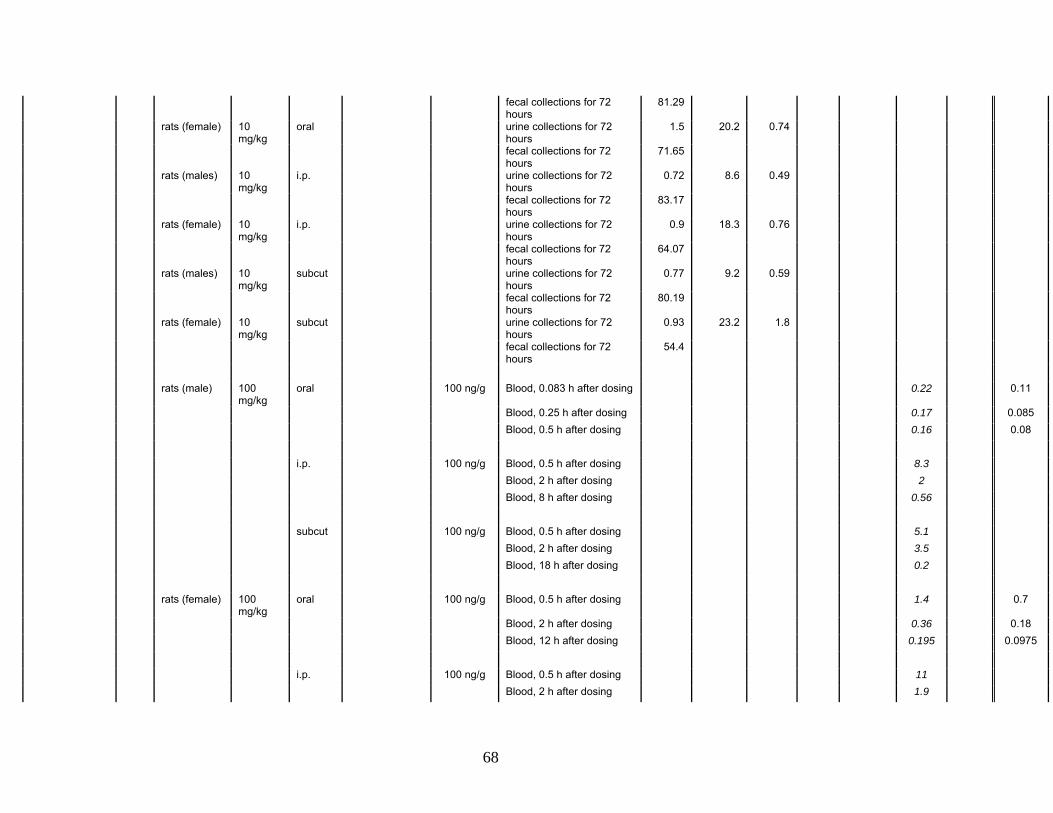
Pottenger et al. [88]
2000 rats (males) 10 mg/kg
oral HPLC w/ GC-MS
urine collections for 72 hours
1.8 9.6 0.48
68
fecal collections for 72 hours
81.29
rats (female) 10 mg/kg
oral urine collections for 72 hours
1.5 20.2 0.74
fecal collections for 72 hours
71.65
rats (males) 10 mg/kg
i.p. urine collections for 72 hours
0.72 8.6 0.49
fecal collections for 72 hours
83.17
rats (female) 10 mg/kg
i.p. urine collections for 72 hours
0.9 18.3 0.76
fecal collections for 72 hours
64.07
rats (males) 10 mg/kg
subcut urine collections for 72 hours
0.77 9.2 0.59
fecal collections for 72 hours
80.19
rats (female) 10 mg/kg
subcut urine collections for 72 hours
0.93 23.2 1.8
fecal collections for 72 hours
54.4
rats (male) 100
mg/kg oral 100 ng/g Blood, 0.083 h after dosing 0.22 0.11
Blood, 0.25 h after dosing 0.17 0.085 Blood, 0.5 h after dosing 0.16 0.08 i.p. 100 ng/g Blood, 0.5 h after dosing 8.3 Blood, 2 h after dosing 2 Blood, 8 h after dosing 0.56 subcut 100 ng/g Blood, 0.5 h after dosing 5.1 Blood, 2 h after dosing 3.5 Blood, 18 h after dosing 0.2 rats (female) 100
mg/kg oral 100 ng/g Blood, 0.5 h after dosing 1.4 0.7
Blood, 2 h after dosing 0.36 0.18 Blood, 12 h after dosing 0.195 0.0975 i.p. 100 ng/g Blood, 0.5 h after dosing 11 Blood, 2 h after dosing 1.9
69
Blood, 24 h after dosing 0.29 subcut 100 ng/g Blood, 0.5 h after dosing 3.9 Blood, 2 h after dosing 2.8 Blood, 24 h after dosing 0.25 rats (male) 10
mg/kg oral 10 ng/g Blood, 0.5 h after dosing NQ NQ
Blood, 2 h after dosing NQ NQ Blood, 24 h after dosing NQ NQ i.p. 10 ng/g Blood, 0.5 h after dosing 0.7 Blood, 2 h after dosing 0.18 Blood, 4 h after dosing 0.049 subcut 10 ng/g Blood, 0.5 h after dosing 0.3 Blood, 2 h after dosing 0.33 Blood, 12 h after dosing 0.038 rats (female) 10
mg/kg oral 10 ng/g Blood, 0.5 h after dosing 0.022 0.11
Blood, 2 h after dosing 0.016 0.08 Blood, 24 h after dosing 0.011 0.055 i.p. 10 ng/g Blood, 0.5 h after dosing 0.85 Blood, 2 h after dosing 0.12 Blood, 18 h after dosing 0.018 subcut 10 ng/g Blood, 0.5 h after dosing 0.28 Blood, 2 h after dosing 0.25 Blood, 24 h after dosing 0.016
Takahashi & Oishi [109]
2000 rats (pregnant, gestational day 18)
1 g/kg oral HPLC w/ UV Detection
5 ng/g maternal blood 10 min after dosing
2.89 0.1445
maternal blood 20 min after dosing
14.7 0.735
70
maternal blood 0.5 h after dosing
2.0 0.1
maternal blood 2 h after dosing
1.2 0.06
maternal blood 6 hrs after treatment
0.29 0.0145
maternal blood 24 hrs after treatment
0.13 0.0065
maternal blood 48 hrs after treatment
0.083 0.00415
maternal liver 20 min after dosing
171
maternal liver 6 hrs after treatment
8.55
maternal kidney 20 min after dosing
36.2
maternal kidney 6 hrs after treatment
1.81
fetuses 10 min after dosing 2 fetuses 20 min after dosing 9.22 fetuses 6 hrs after
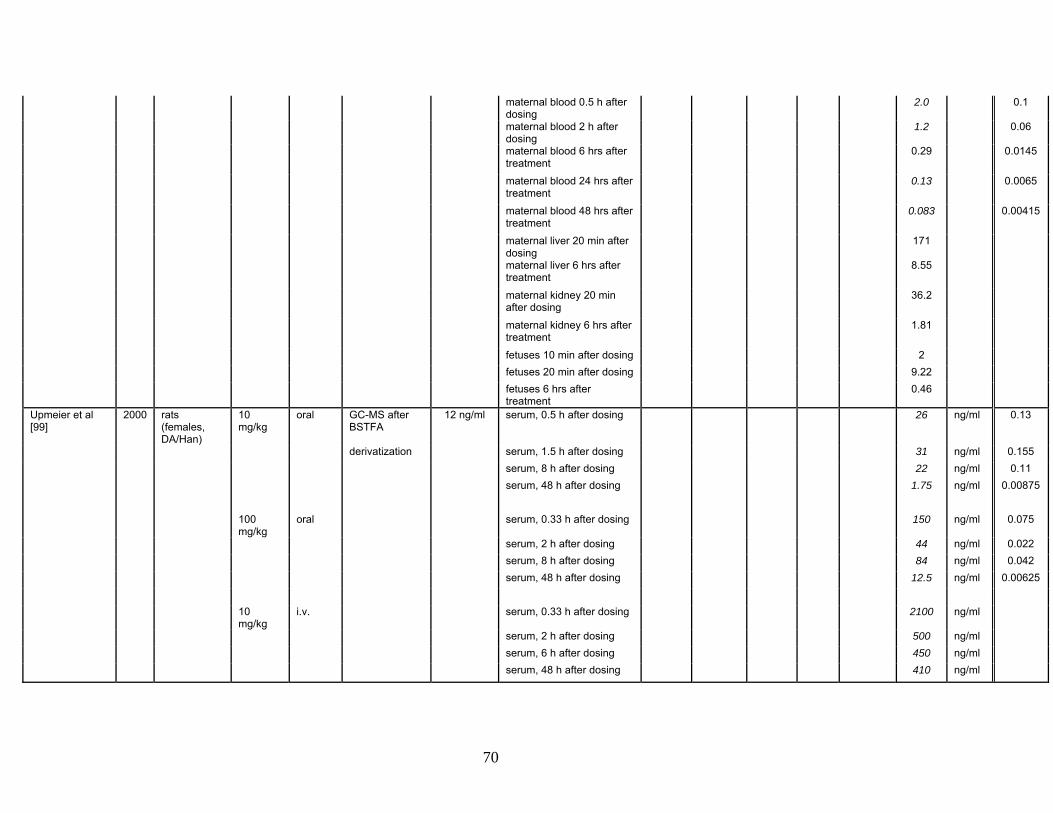
treatment 0.46
Upmeier et al [99]
2000 rats (females, DA/Han)
10 mg/kg
oral GC-MS after BSTFA
12 ng/ml serum, 0.5 h after dosing 26 ng/ml 0.13
derivatization serum, 1.5 h after dosing 31 ng/ml 0.155 serum, 8 h after dosing 22 ng/ml 0.11 serum, 48 h after dosing 1.75 ng/ml 0.00875 100
mg/kg oral serum, 0.33 h after dosing 150 ng/ml 0.075
serum, 2 h after dosing 44 ng/ml 0.022 serum, 8 h after dosing 84 ng/ml 0.042 serum, 48 h after dosing 12.5 ng/ml 0.00625 10
mg/kg i.v. serum, 0.33 h after dosing 2100 ng/ml
serum, 2 h after dosing 500 ng/ml serum, 6 h after dosing 450 ng/ml serum, 48 h after dosing 410 ng/ml
71
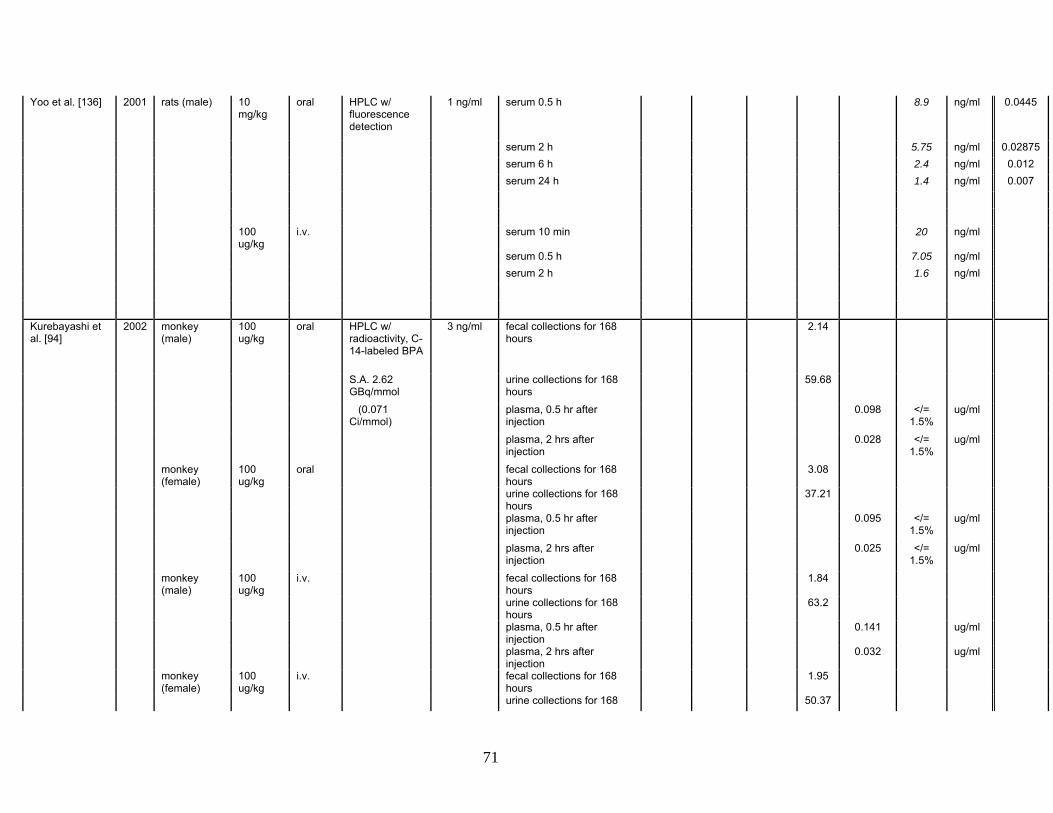
Yoo et al. [136] 2001 rats (male) 10 mg/kg
oral HPLC w/ fluorescence detection
1 ng/ml serum 0.5 h 8.9 ng/ml 0.0445
serum 2 h 5.75 ng/ml 0.02875 serum 6 h 2.4 ng/ml 0.012 serum 24 h 1.4 ng/ml 0.007 100
ug/kg i.v. serum 10 min 20 ng/ml
serum 0.5 h 7.05 ng/ml serum 2 h 1.6 ng/ml
Kurebayashi et al. [94]
2002 monkey (male)
100 ug/kg
oral HPLC w/ radioactivity, C-14-labeled BPA
3 ng/ml fecal collections for 168 hours
2.14
S.A. 2.62 GBq/mmol
urine collections for 168 hours
59.68
(0.071 Ci/mmol)
plasma, 0.5 hr after injection
0.098 </= 1.5%
ug/ml
plasma, 2 hrs after injection
0.028 </= 1.5%
ug/ml
monkey (female)
100 ug/kg
oral fecal collections for 168 hours
3.08
urine collections for 168 hours
37.21
plasma, 0.5 hr after injection
0.095 </= 1.5%
ug/ml
plasma, 2 hrs after injection
0.025 </= 1.5%
ug/ml
monkey (male)
100 ug/kg
i.v. fecal collections for 168 hours
1.84
urine collections for 168 hours
63.2
plasma, 0.5 hr after injection
0.141 ug/ml
plasma, 2 hrs after injection
0.032 ug/ml
monkey (female)
100 ug/kg
i.v. fecal collections for 168 hours
1.95
urine collections for 168 50.37
72
hours plasma, 0.5 hr after
injection 0.161 ug/ml
plasma, 2 hrs after injection
0.036 ug/ml
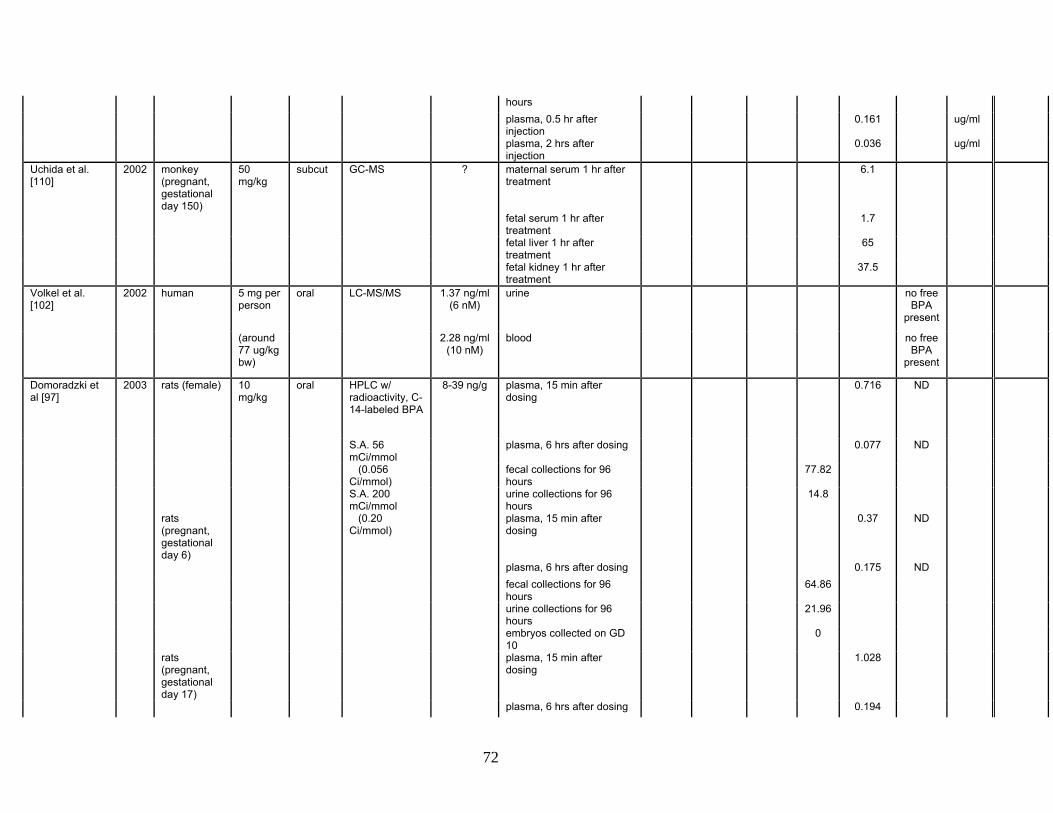
Uchida et al. [110]
2002 monkey (pregnant, gestational day 150)
50 mg/kg
subcut GC-MS ? maternal serum 1 hr after treatment
6.1
fetal serum 1 hr after treatment
1.7
fetal liver 1 hr after treatment
65
fetal kidney 1 hr after treatment
37.5
Volkel et al. [102]
2002 human 5 mg per person
oral LC-MS/MS 1.37 ng/ml (6 nM)
urine no free BPA
present
(around 77 ug/kg bw)
2.28 ng/ml (10 nM)
blood no free BPA
present
Domoradzki et al [97]
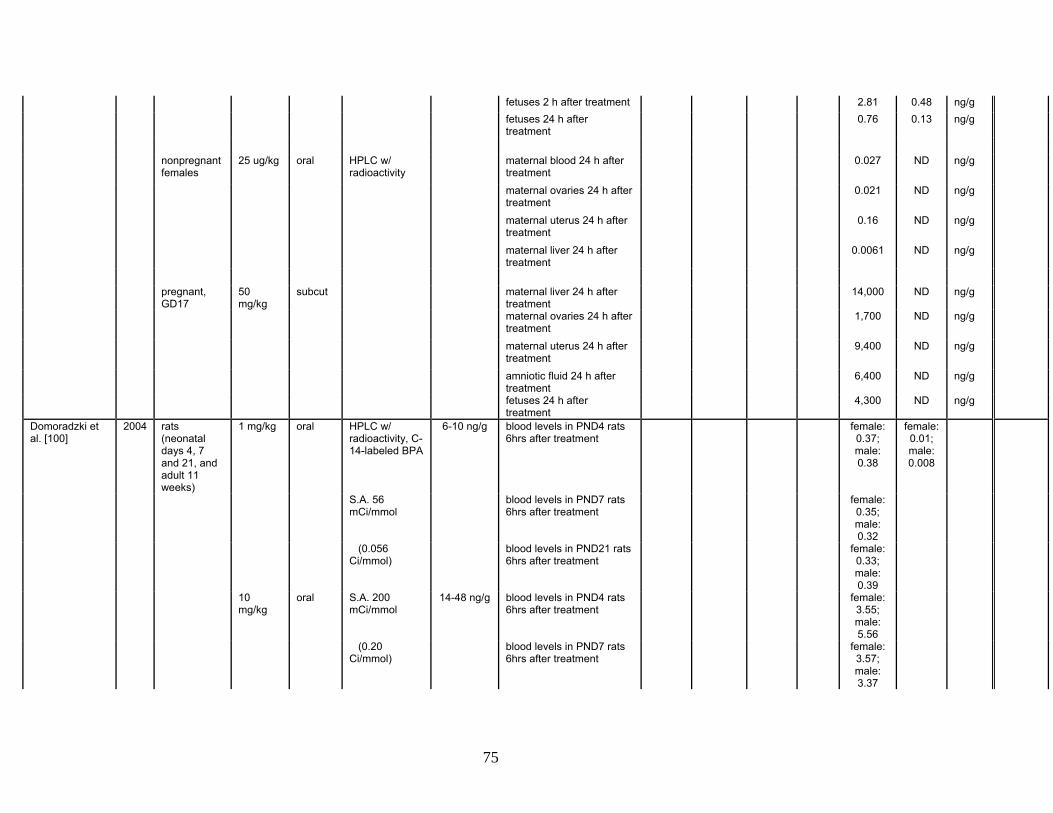
2003 rats (female) 10 mg/kg
oral HPLC w/ radioactivity, C-14-labeled BPA
8-39 ng/g plasma, 15 min after dosing
0.716 ND
S.A. 56 mCi/mmol
plasma, 6 hrs after dosing 0.077 ND
(0.056 Ci/mmol)
fecal collections for 96 hours
77.82
S.A. 200 mCi/mmol
urine collections for 96 hours
14.8
rats (pregnant, gestational day 6)
(0.20 Ci/mmol)
plasma, 15 min after dosing
0.37 ND
plasma, 6 hrs after dosing 0.175 ND fecal collections for 96
hours 64.86
urine collections for 96 hours
21.96
embryos collected on GD 10
0
rats (pregnant, gestational day 17)
plasma, 15 min after dosing
1.028
plasma, 6 hrs after dosing 0.194
73
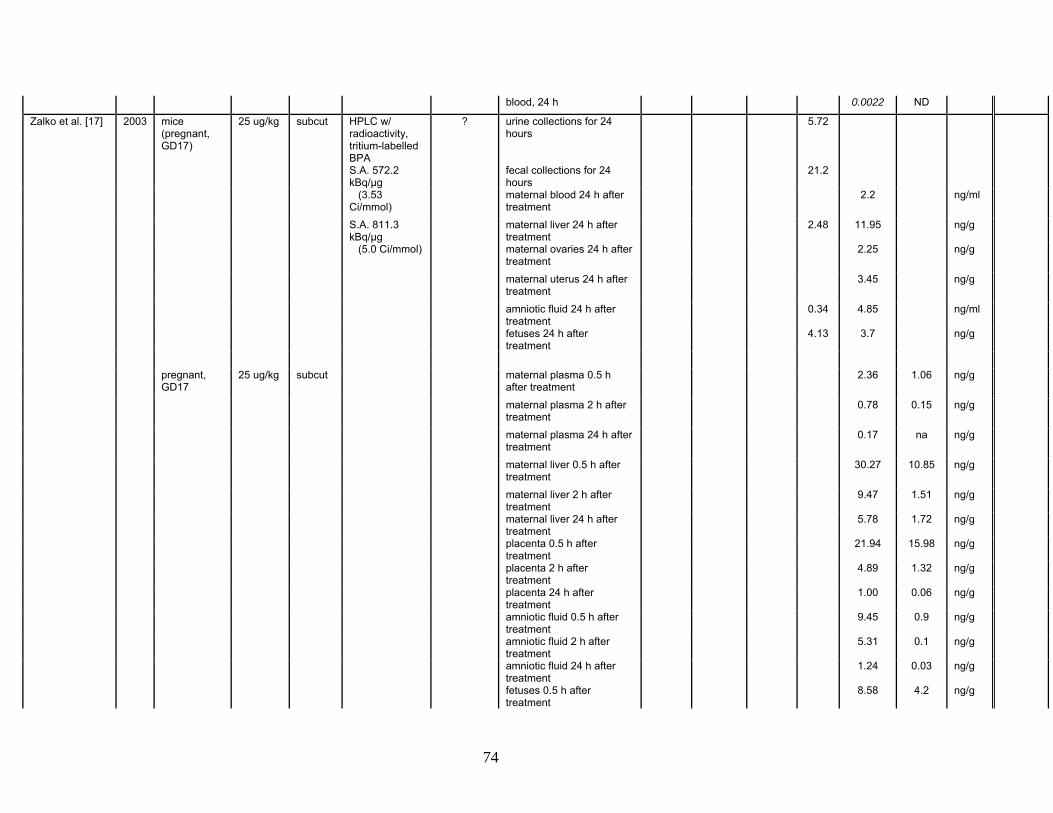
pooled plasma (to 12 h) 0.011-0.022
0.055 - 0.110
fecal collections for 96 hours
72.03
urine collections for 96 hours
16.32
embryos collected on GD 10
0.07
rats
(pregnant, gestational day 16)
maternal plasma, 15 min after dosing
1.699 0.064 0.32
embryos collected 15 min after dosing
0.013 0.018
yolk sac/placenta collected 15 min after dosing
0.342 0.095
Kurebayashi et al. [95]
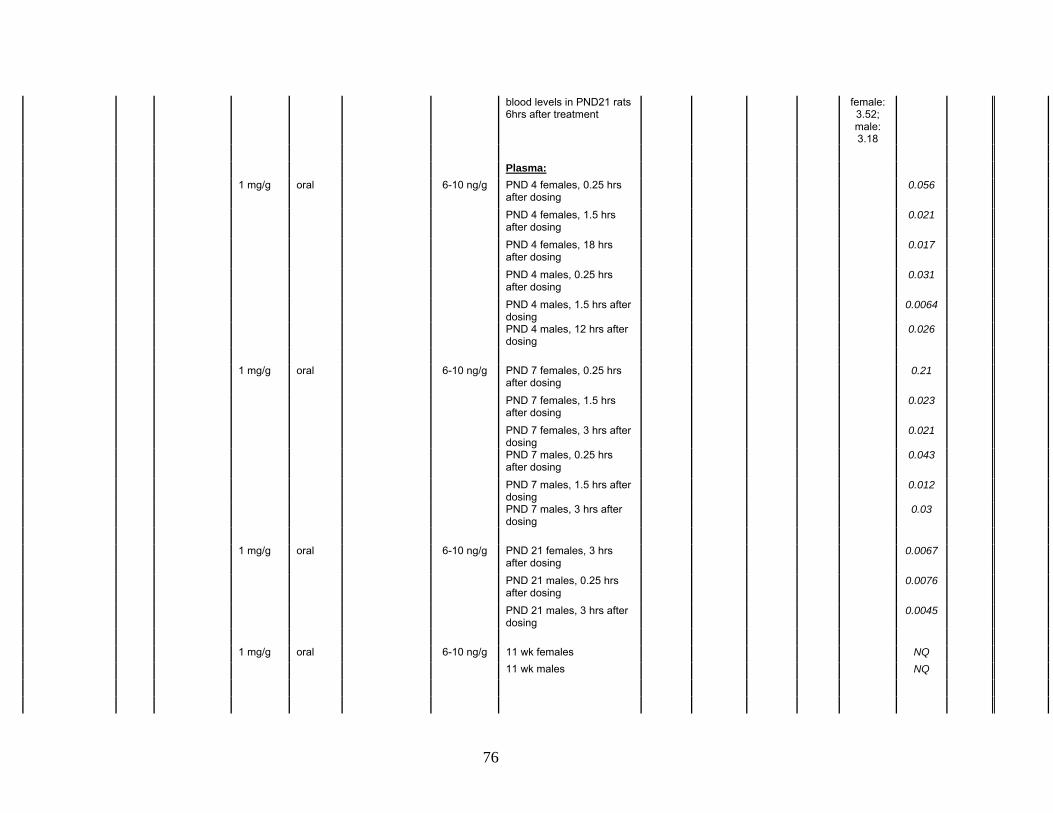
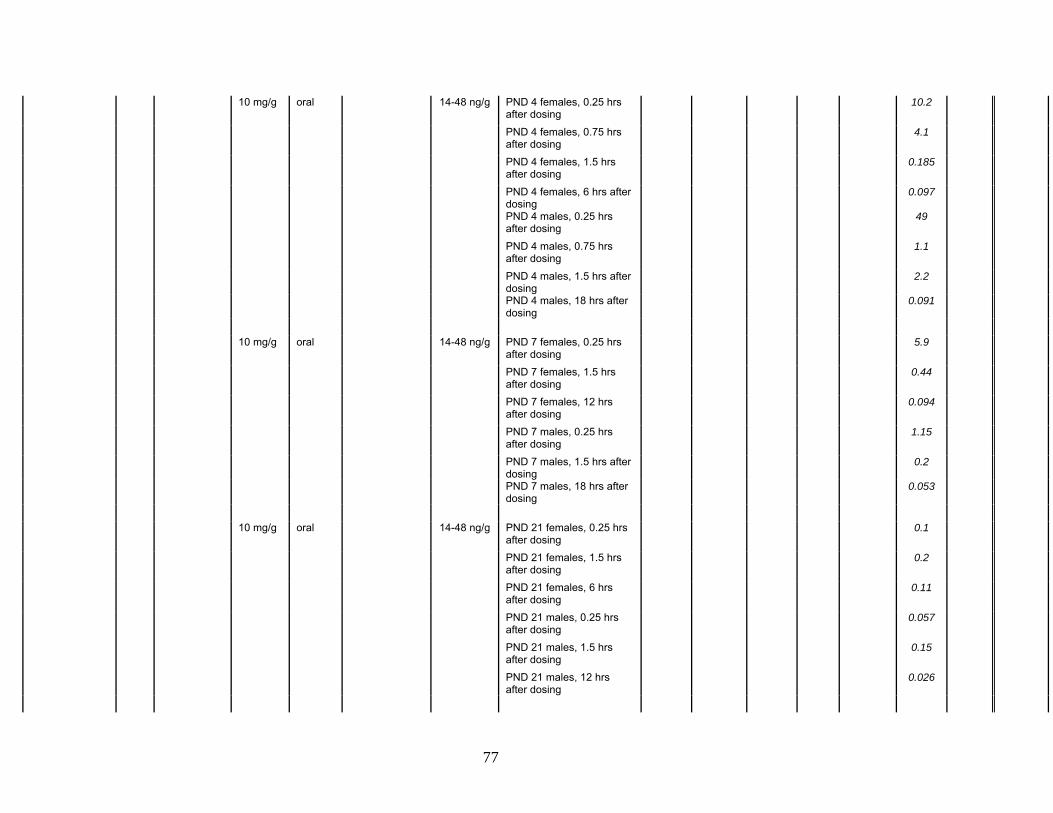
2003 rats (males) 100 mg/kg
oral HPLC w/ BPA-derived radioactivity (verified by ESI/MS), C-14-labeled BPA
1 ng/g urine collections for 72 hours
1.1 6.5 0.3
S.A. 2.62 GBq/mmol
fecal collections for 72 hours
61 ND ND
(0.071 Ci/mmol)
bilary excretions within 18 hours
41
100 ug/kg
oral urine collections for 24 hours
6.3
urine collections for 48 hours
10.1
fecal collections for 48 hours
81.6
100 ug/kg
i.v. urine collections for 24 hours
8.4
urine collections for 48 hours
12.5
fecal collections for 48 hours
77.6
100
ug/kg oral blood, 0.5 h 0.018 ND
blood, 2 h 0.0051 ND blood, 24 h 0.002 ND i.v. blood, 0.5 h 0.0057 ND blood, 2 h 0.003 ND
intact, serum 2 h 0.7496 ug/ml intact, serum 3 h 0.64 ug/ml 50
mg/kg subcut intact, serum, 2 h 0.65 ug/ml
ovx, serum, 2 h 0.68 ug/ml ovx+TP 0.01, serum, 2 h 0.79 ug/ml ovx+TP 0.1, serum, 2 h 0.98 ug/ml ovx+TP 1.0, serum, 2 h 1.4 ug/ml 0 mg/kg intact, serum, 0 h (basal) 0.00438 ug/ml (basal) ovx, serum, 0 h (basal) 0.0041 ug/ml ovx+TP 0.01, serum, 0 h
(basal) 0.00451 ug/ml
ovx+TP 0.1, serum, 0 h (basal)
0.00534 ug/ml
ovx+TP 1.0, serum, 0 h (basal)
0.00576 ug/ml
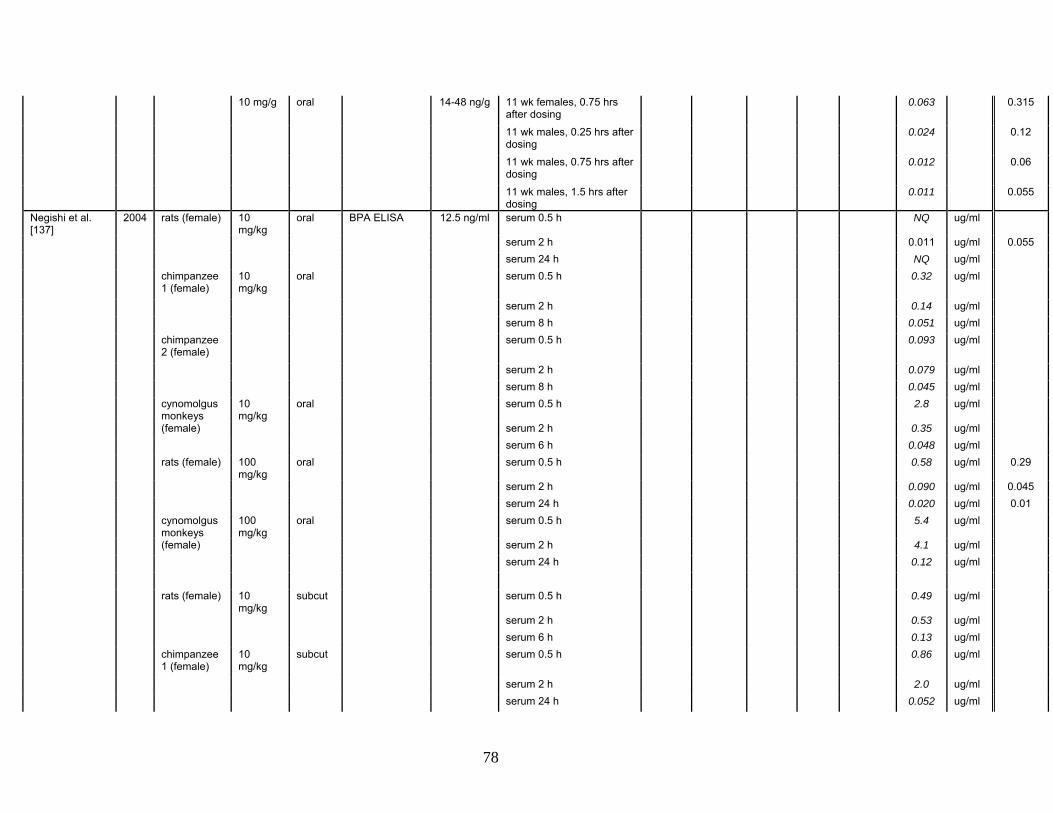
Tominaga et al [101]
2006 rats (female) 10 mg/kg
oral LC–MS/MS w/ ESI
0.2 ng/ml serum 0.5 h 2.1 ug/L = 0.0105
serum 2 h 0.63 ng/ml 0.00315 serum 24 h 0.62 ng/ml 0.0031 chimpanzees
(female) 10 mg/kg
oral serum 0.5 h 5.3 ng/ml
serum 2 h 2.9 ng/ml serum 24 h 0.35 ng/ml
83
cynomolgus monkeys (female)
10 mg/kg
oral serum 0.5 h 9.5 ng/ml
serum 2 h 6.6 ng/ml serum 24 h 0.4 ng/ml rats (female) 100
mg/kg oral serum 0.5 h 48 ng/ml 0.024
serum 2 h 5.9 ng/ml 0.00295 serum 24 h 4.2 ng/ml 0.0021 cynomolgus
monkeys (female)
100 mg/kg
oral serum 0.5 h 17.5 ng/ml
serum 2 h 24 ng/ml serum 24 h 1.4 ng/ml rats (female) 10
mg/kg subcut serum 0.5 h 740 ng/ml
serum 2 h 370 ng/ml serum 24 h 0.84 ng/ml chimpanzees
(female) 10 mg/kg
subcut serum 0.5 h 510 ng/ml
serum 2 h 580 ng/ml serum 24 h 16.7 ng/ml cynomolgus
monkeys (female)
10 mg/kg
subcut serum 0.5 h 640 ng/ml
serum 2 h 4100 ng/ml serum 24 h 34 ng/ml rats (female) 100
mg/kg subcut serum 0.5 h 2300 ng/ml
serum 2 h 2250 ng/ml serum 24 h 9 ng/ml cynomolgus
monkeys (female)
100 mg/kg
subcut serum 0.5 h 3400 ng/ml
serum 2 h 6950 ng/ml serum 24 h 1500 ng/ml rats (female) 10
mg/kg subcut LC–MS/MS w/
ESI, serum 0.5 h 134 ng/ml
after enzymatic serum 2 h 98.5 ng/ml deconjugation serum 24 h 17.3 ng/ml
84
chimpanzees (female)
10 mg/kg
subcut serum 0.5 h 975 ng/ml
serum 2 h 440 ng/ml serum 24 h 8.8 ng/ml cynomolgus
monkeys (female)
10 mg/kg
subcut serum 0.5 h 8800 ng/ml
serum 2 h 2000 ng/ml serum 24 h 33 ng/ml
Xiao et al. [140] 2006 rats (male) 100 mg/kg
oral HPLC w/ fluorescence detection
2.8 ng/ml serum 1 h 1.4 ug/ml 0.7
serum 2 h 2.8 ug/ml 1.4 serum 24 h 1.8 ug/ml 0.9 serum 48 h 0.88 ug/ml 0.44 serum 72 h 0.35 ug/ml 0.175 100
mg/kg oral w/ serum 1 h 2.3 ug/ml 1.15
NP serum 2 h 3.3 ug/ml 1.65 serum 24 h 2.9 ug/ml 1.45 serum 48 h 0.77 ug/ml 0.385 serum 72 h 0.29 ug/ml 0.145
a - Numbers in italics have been digitized from the published figures and are approximate b - Scaling by approximation of linearity of circulating level of BPA with dose within dosing method (P, 2000; refs) c - Current Reference Dose for BPA is 50 ug/kg bw/d; 45 publications from the In Vivo panel report describe effects after oral dose at and below this level subcut - subcutaneous; i.p. - intraperitoneal; i.v. - intravenous NQ - not quantifiable; ND - not detected; PND - Post Natal Day; NP - nonylphenol
85
Figure Legends Figure 1. Scaled values of circulating BPA after oral dosing. The complete set of
17 data sets of circulating BPA at times after oral dosing of adults from 11
studies of Table 6, last column, where unconjugated BPA was measured or could
be calculated, are graphed in the figure. All data recovered from publications and
figures are plotted, not just the selected time points listed in Table 6. The data
are presented as a log-log plot, which allows data spanning a wide range to be
displayed on a single graph. In addition the time-courses were approximately
linear in the log-log plot. The black line shows the power regression curve (linear
regression of log BPA vs. log time) of all of the individual BPA measures against
time after oral dose.
Figure 2. Subsets of the data of Figure 1 grouped by dose (A-C) or by animal
type (D-F). Subsets of the data from Figure 1 are presented to address 1) the
validity of scaling circulating levels from different doses to one reference dose,
and 2) variability due to the type of animal (pregnant female, non-pregnant adult
female or adult male). The black line shows the power regression curve (linear
regression of log BPA vs. log time) of all of the individual BPA measures against
time after oral dose, for reference to the individual data subsets. Panel A graphs
the circulating levels scaled from the extremes of oral doses, 1 g/kg bw (orange)
and 500 ug/kg bw (purple). Panel B graphs all circulating levels after oral dose of
100 mg/kg, and Panel C graphs levels reported after 10 mg/kg. Within the
variation between publications, there was no apparent trend of scaled level with
dose. Panel D graphs the scaled circulating levels in reports of oral dosing in
pregnant females from 4 data sets, 2 consisting of single time points. Panel E
graphs circulating levels after oral dosing of adult, nonpregnant females, and
Panel F graphs levels reported after dosing adult males. Within the variation
between publications, there was no apparent trend of scaled level with animal
86
type, although differences between adult females and adult males were reported
within individual publications that compared both within the same study (see
text).
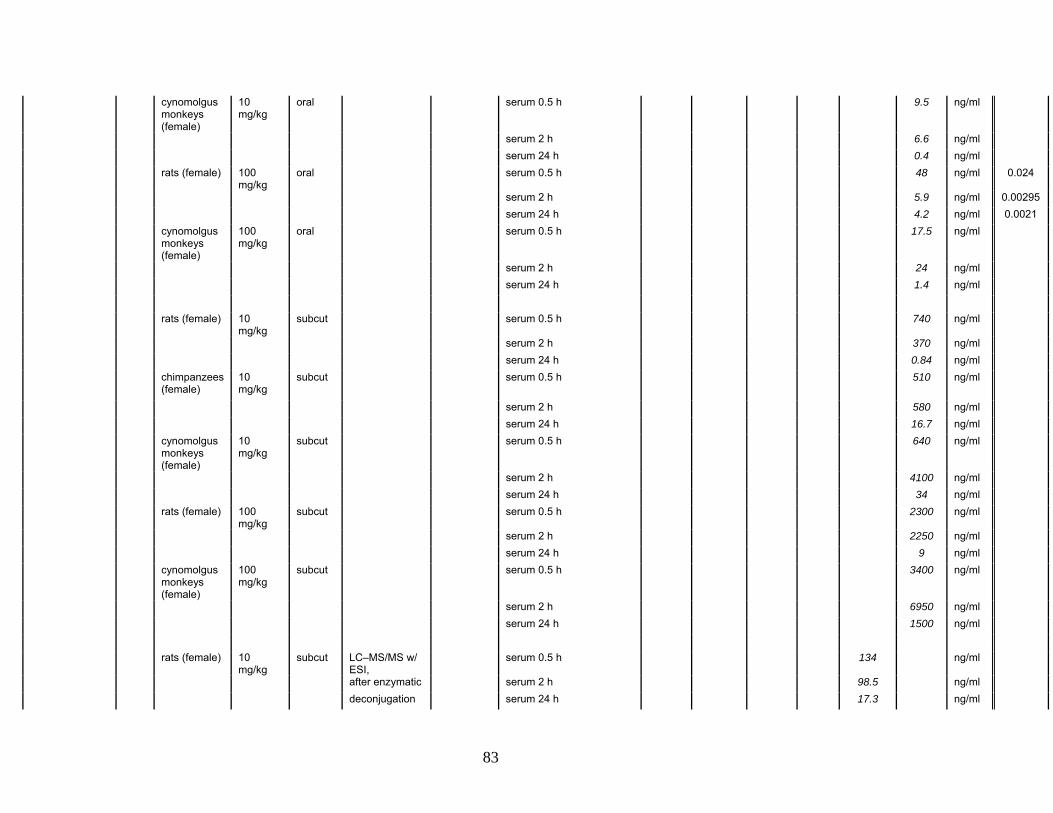
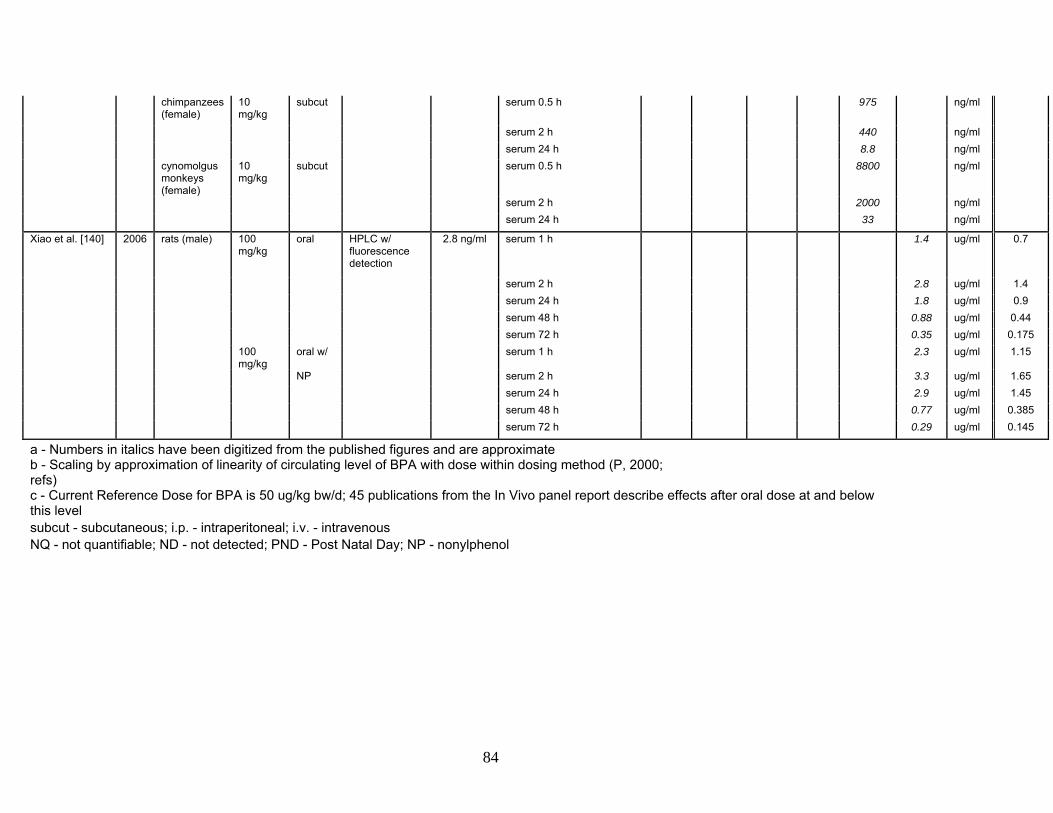
Table 6. Summary of acute metabolic studies. Results from 21 published studies
on the pharmacokinetics / toxicokinetics of BPA are summarized below listing
animal, dose and route of exposure, method of detection for BPA and BPA
metabolites with sensitivity or limit of detection of the method. The levels
measured in the listed matrix are given, with a separate column for
unconjugated, biologically active BPA, where measured. Where data were
presented only in figures, the data were obtained from the pdf form of the figures
from the publication, and the data were recovered with the program GraphClick
(v. 2.9.2, copyright Arizona Software, 2007); the recovered data should be
considered approximate, and are shown in italics in the table. Rather than list all
of the recovered data points, three points were selected at or close to 0.5 h, 2 h
and 24 h after oral dosing, which were time points common to many of the
studies, or the data at all of the time points if there were three or fewer.
Seventeen of the studies contained data from oral dosing, and of these, 11
studies included data on unconjugated BPA in blood, plasma or serum after the
oral dosing, and these data (circulating unconjugated BPA) are given in the last
column of the table after scaling the level measured after various oral doses to a
single dose of 50 µg/kg body weight, the reference dose for BPA (see text). For
example, circulating levels reported after dosing at 500 µg/kg were divided by 10,
while circulating levels after dosing at 10 mg/kg were divided by 200, in order to