Human Factors for Transitway Safety Improvement Final Report for Phase II Prepared for: Intelligent Transportation Systems’ Institute Center for Transportation Studies University of Minnesota Prepared by: Stephen Scallen, Ph.D. Interim Director, Human Factors Research Laboratory and Stirling Stackhouse, Ph.D. Independent Consultant November 1998
Transcript
Human Factors for Transitway Safety Improvement
Final Report for Phase II
Prepared for:
Intelligent Transportation Systems’ Institute Center for Transportation Studies
University of Minnesota
Prepared by:
Stephen Scallen, Ph.D.
Interim Director, Human Factors Research Laboratory
and
Stirling Stackhouse, Ph.D. Independent Consultant
November 1998
ACKNOWLEDGMENT
This human factors study was conducted as part of the Transitway Safety Improvement Program.
The program was guided by a committee formed by the Department of Safety and Health at the
University of Minnesota. The Transitway Safety Improvement Committee was chaired by Paul Tschida,
the Assistant Vice President for Safety and Health Management.
This human factors study was sponsored by the Intelligent Transportation Systems’ Institute at the
University of Minnesota's Center for Transportation Studies. Mr. Lowell Benson served as the
Program Manager. The authors want to acknowledge the contributions of many undergraduate students
who participated in the project as data collectors.
i
TABLE OF CONTENTS Executive Summary 1 Introduction 5 Project Motivation........................................................................................... 5 Potential Accident Causes................................................................................ 7 Literature Review and Analysis 9 Human Factors Research Objective.................................................................. 12 Report Organization......................................................................................... 12 Methods ...................................................................................................................... 13 New Transitway Features................................................................................. 13 STOP Signs and Warning Signs............................................................ 13 NO TURN Signs ................................................................................. 17
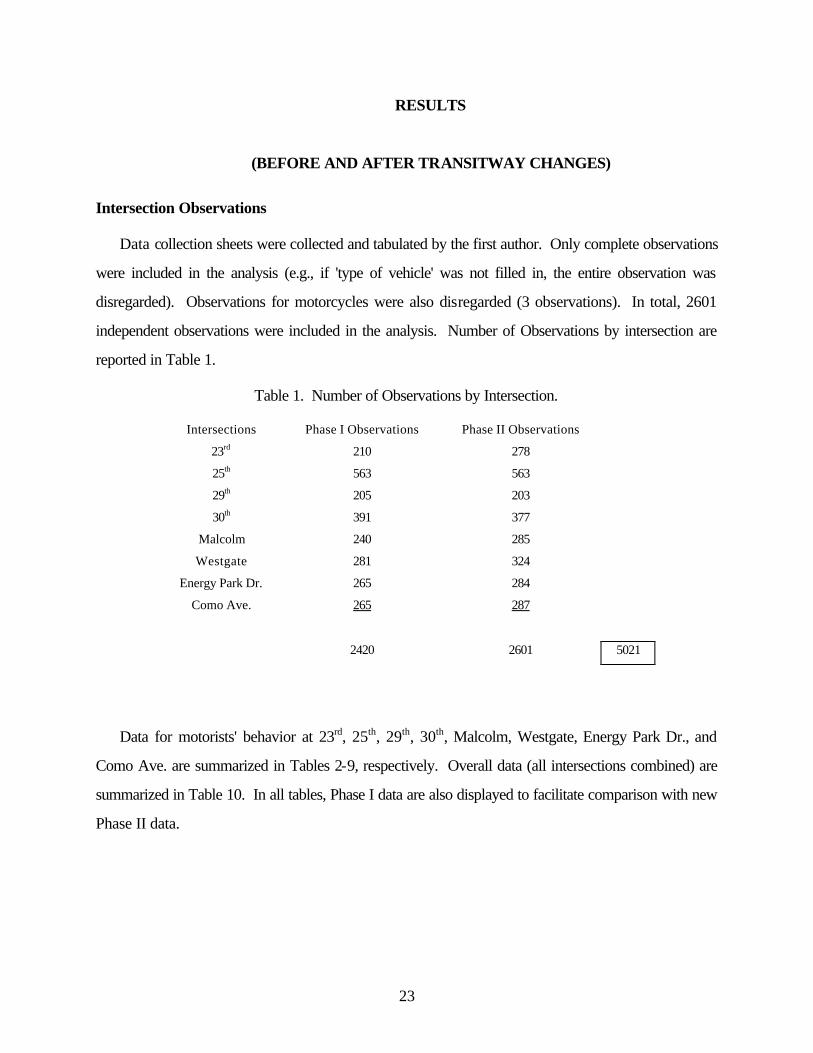
Intersection Observations ................................................................................. 17 Sight Distances................................................................................................. 18 Results (Before and After Transitway Improvements).................................................... 23 Intersection Observations 23 Sight Distances................................................................................................. 33 Accident Data.................................................................................................. 33 Discussion 35 Accident Rate 35 Comparison of Drivers' Behavior Before and After Transitway Improvements 35 Sight Distances 40 Visual Clutter................................................................................................... 41 Signal Light Timing........................................................................................... 42 Bus Mounted Strobe Lights.............................................................................. 43 Conclusions ................................................................................................................. 45
Recommendations........................................................................................................ 49 References................................................................................................................... 51 Appendix A – Literature Review and Analysis .............................................................. 53 Introduction..................................................................................................... 53 Contributing Factors......................................................................................... 54 Comprehension.................................................................................... 55 Detection and recognition 57 Perception 58 Decision making 60 Compliance 61 Impairment........................................................................................... 62
ii
Driver Characteristics 62 Countermeasures 62 Comprehension 62 Detection and recognition 63 Advanced warning signs 64 Active advance warning devices (AAWDs) .................. 64 Rumble strips............................................................... 64 Crossbucks.................................................................. 65 Active warning devices................................................. 65 Trains .......................................................................... 65 Perception 66 Decision Making 66 Enhanced information for advance warnings .................. 66 Enhanced information at the crossing 67 Information credibility................................................... 67 Compliance.......................................................................................... 67 An Appropriate View of the Driver....................................................... 68 Sight Distance...................................................................................... 69 Driver Familiarity with the Crossing....................................................... 70 Directed Visual Attention...................................................................... 70 A System Perspective .......................................................................... 70 Comparison of Flashing Light Signals with Traffic Control Signals.......... 70 Appendix B – Data Collection Sheet for Motorist Behavior at Intersections................... 71 Appendix C – Summaries of Transitway Accidents....................................................... 73 C-1 Transitway Accidents Sorted by Date........................................................ 74 C-2 Transitway Accidents Sorted by Day......................................................... 75 C-3 Transitway Accidents Sorted by Location.................................................. 76 C-4 Transitway Accidents Sorted by Vehicle.................................................... 78 C-5 Transitway Accidents Sorted by Month..................................................... 80 C-6 Transitway Accidents Sorted by Time of Day............................................ 82 C-7 Transitway Accidents Sorted by Action of the Crossing Vehicle................. 83 C-8 Transitway Accidents Sorted by the Object Struck.................................... 84 C-9 Transitway Accidents Sorted by Date........................................................ 85
iii
LIST OF FIGURES
Figure 1. The University of Minnesota's Transitway Bus Route. ..................................... 5
Figure 2. View of the STOP sign and red warning light at 23rd Ave SE and Transitway 14 Figure 3. View of the STOP sign and red warning light at Westgate and Transitway...... 14 Figure 4. View of the STOP sign and red warning lights at 25th Ave SE and Transitway. 15 Figure 5. View of the STOP sign at 29th Ave. SE and Transitway. ............................... 15
Figure 6. View of the STOP sign and illuminated sign at 30th Ave. SE and Transitway... 16 Figure 7. View of the STOP sign and fiber optic warning sign at Malcolm and Transitway. 16 Figure 8. Sight line triangle 19 Figure 9. Required vehicle average speeds for Transitway bus speeds of 20 mph and 40 mph.21 Figure 10. Definition of the x, y distances for cross street-Transitway intersections. 22
LIST OF TABLES
Table 1. Number of Observations by Intersection 23 Table 2. Motorists' Behavior at 23rd Ave. SE and Transitway........................................ 24
Table 3 Motorists' Behavior at 25th Ave. SE and Transitway........................................ 25
Table 4 Motorists' Behavior at 29th Ave. SE and Transitway........................................ 26
Table 5 Motorists' Behavior at 30th Ave. SE and Transitway 27 Table 6 Motorists' Behavior at Malcolm SE and Transitway.......................................... 28
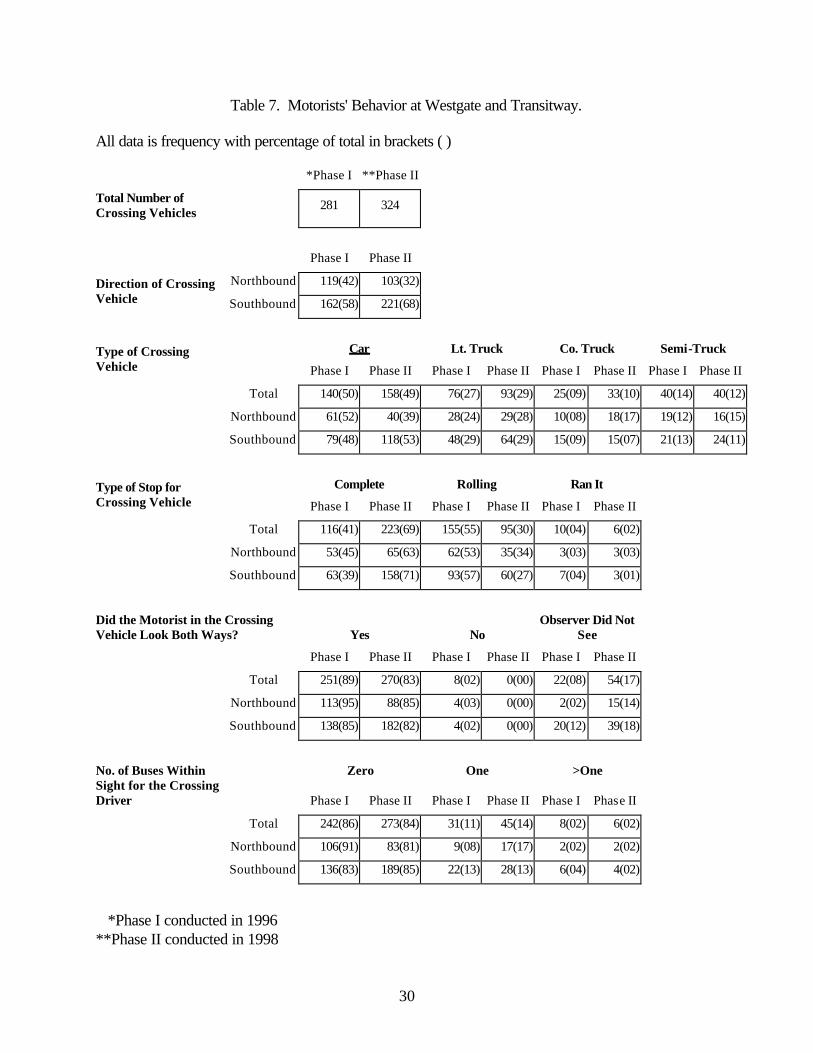
Table 7 Motorists' Behavior at Westgate SE and Transitway 29 Table 8 Motorists' Behavior at Energy Park Dr. and Transitway.................................... 30
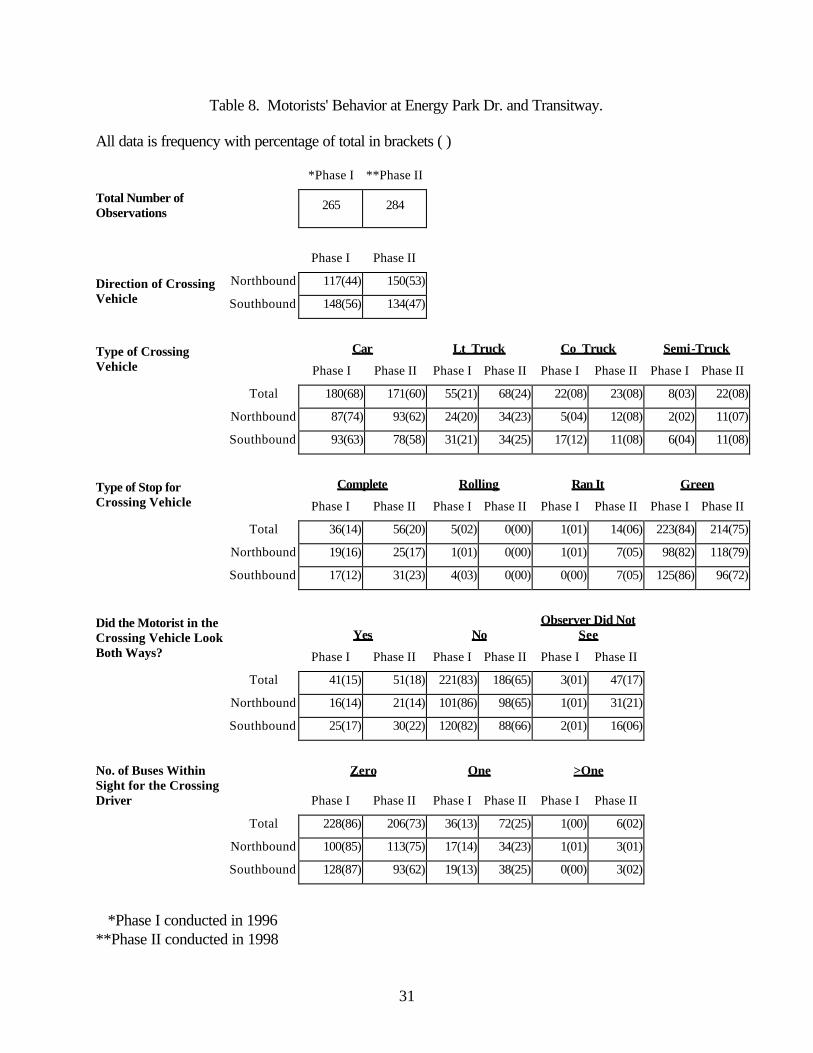
Table 9. Motorists' Behavior at Como Ave and Transitway 31 Table 10 Total Observations of Motorist Behavior at Transitway Intersections............... 32
Table 11 Required Average Speeds to Enable a Stop at The Stop Sign 33 Table 12 Transitway Accident History (April 1992 - April 1998) .................................. 34
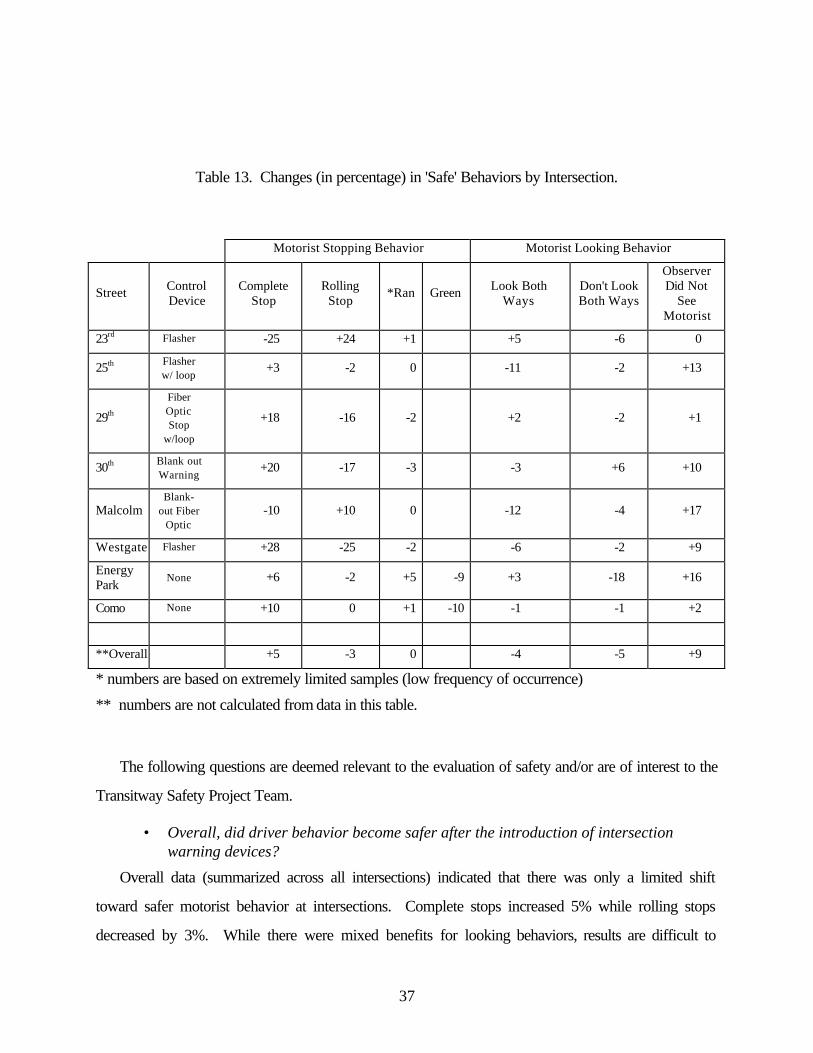
Table 13 Changes (in percentage) in 'Safe' Behaviors by Intersection............................. 36
iv
This sheet deliberately left blank
1
EXECUTIVE SUMMARY
This report details human factors evaluations of a 3.1 mile dedicated bus route (buses and
emergency vehicles) connecting Minneapolis and St. Paul campuses of the University of Minnesota.
The dedicated route (Transitway) contains eight intersections. Two intersections are controlled by
signal lights activated by the approach of a bus and six intersections are controlled by STOP signs. The
motivation for the study was the unexpected increase in the number of accidents when the route was
transferred from city streets to the Transitway in March, 1992. This human factors initiative was
conducted as part of the Transitway Safety Project at the University of Minnesota.
Research was conducted in two phases. In Phase I, the Human Factors Research Laboratory
(HFRL) at the University of Minnesota evaluated bus driver behavior, sight distances at intersections,
and behavior of the driving public at each of the eight intersections. Complete results can be located in
the Phase I final report. In short, Phase I evaluations concluded: bus drivers were operating vehicles
within established guidelines; only 5 of the 32 triangular sight distances met minimum guidelines; and two
percent of drivers run STOP sights with about 50% use a rolling rather than a full stop.
Subsequent to the Phase I study completion, numerous improvements were implemented in the
Transitway. Major changes consisted of adding warning lights at STOP signs and fiber optic highlighting
at STOP signs. At certain intersections, loop sensors detected the approach of a vehicle and activated
warning lights or messages. In addition, small strobe lights were attached to the tops of buses; a bicycle
path was added alongside the western end of the Transitway; landscaping was changed at some
intersections and these changes either increased or decreased the sight distances; and NO TURN and
other non-electronic warning signs were added.
The present report details Phase II research, a 1998 evaluation of the effectiveness of the safety
improvements implemented in the Transitway, using the same measures as those used in Phase I, with
the exception that bus driver evaluations were dropped from Phase II research. The following is a
summary of Phase II conclusions and recommendations.
The overall accident rate prior to Transitway improvements was 0.44 accidents per month. This
rate didn’t change until electronic devices were activated in January 1998. These data should be
2
interpreted with care as accidents are rare events. These statistics merely imply that the Transitway is as
dangerous a roadway as the average Minnesota roadway.
A single cause for the Transitway accidents which have occurred over the first five years was not
identified. However, data suggests that certain factors acting in combination may have contributed to
Transitway accidents. Overall data indicated only a slight improvement in driver behavior with an
overall five percent increase in the frequency of complete stops. Transitway improvements had little or
no impact on the frequency of STOP sign running, with an overall rate of about two percent steady
across the two phases of research. Three intersections demonstrated behavioral improvements, two
demonstrated behavior detriments and data for one intersection did not support a definitive conclusion.
Behavioral effects did not seem to be specific to warning devices, although the fiber optic lighted stop
sign demonstrated some potential. A single intersection demonstrated a dramatic rise in red light
violations, with anecdotal reports supporting the conclusion that specific safety efforts should be
directed at this intersection. There have been no 1998 accidents as shown in year 7 of the following
chart.
Analyses of the triangular sight distances indicated that some sight distances at intersections have
been improved over the Phase I measurements. However, other sight distances have been decreased
by the installation of cabinets for the electronic control equipment. At several intersections, vegetation
continues to obstruct stop line sight lines. Short triangular sight distances suggest that average approach
speeds should be reduced (for non stopping drivers). Calculations of required average speeds to
012345678
Count
1 2 3 4 5 6 7
Operational Year
Transitway Accident Vehicle Types
RollerBlader
Pickups
Trucks
Cars
3
enable a complete stop at a STOP sign indicated that only one intersection would support a speed
greater than 10 mph.
Data collected in Phase II also suggested that the increase in the number of signs at intersections has
contributed to visual clutter, too many messages which were too close together in space and time.
Signal light timing continues to appear to be sub-optimal at two intersections. Bus drivers were regularly
observed slowing and even stopping at intersections.
Discussion of Phase II results suggested that Transitway safety improvements were overly focused
on enhancing the utilitarian value of STOP signs. There was no data suggesting that the ordinary STOP
signs were obscured either visually or in meaning to drivers approaching the Transitway. Accident
reports did not suggest that alcohol contributed to a reduction in drivers' understanding of the meaning
of STOP signs or that visual obscurity contributed to accidents. Most evidence suggests that drivers
see and comprehend the STOP signs.
Recommendations did not specifically address the problem of risk-taking behavior or scofflaws,
other than to suggest a more frequent and conspicuous police presence at Transitway intersections.
Other recommendations were:
• Improve sight distances by eliminating the sight line obstacles whenever this is possible.
Where not possible, employ warnings such as BLIND DRIVEWAY.
• Implement and enforce lower speed limits on streets approaching Transitway intersections.
• Be especially diligent and thorough about snow and ice removal at the approaches to the
Transitway intersections
• Adjust the timing parameters of the bus-actuated system for switching traffic lights to permit
buses to drive at a constant speed when approaching and passing through the intersections.
• Considering the development and use of "new wave" messages designed to have high
impact (NEVER HIT A SCHOOL BUS. THE BUS WILL HIT BACK) Messages could
address the factors cited above as potentially accident causing. Such messages should be on
programmable electronic media and changed frequently to maintain their impact.
4
(This page intentionally left blank)
5
INTRODUCTION
The University of Minnesota’s Transitway connects the Minneapolis and St. Paul campuses with a
3.1 mile roadway restricted to buses and an adjacent path for bicycles. The Transitway’s intersections,
whether controlled by signal lights or stop signs, always give the right of way to the buses and bicycles
on the Transitway. Buses run about every five minutes in both directions from 7:00 a.m. to 4:30 p.m.
and then every 30 minutes until 9:30 p.m. The bus traffic volume during the day on the Transitway is
thus 228 buses per day during the day and 54 buses during the evening. A Metro Transit bus line also
uses the transitway. The streets intersecting the Transitway with the highest volumes have about 900
vehicles per day.
Figure 1. The University of Minnesota's Transitway Bus Route.
Project Motivation
In the year before Transitway operation began, the buses transferring students between the
Minneapolis and St. Paul campuses operated on city streets. There was one minor accident in the last
6
year of operation on the city streets. In the first five years of Transitway operation there had been on
average nearly one accident for each two months of operation, a six-fold increase in accident rate. It is
important to identify the reason or reasons for this apparent change in accident rate since the Transitway
was expected to reduce accident frequency. Until we understand why Transitway accidents occur, it
will be difficult to implement cost effective solutions for reducing the number of accidents.
A Phase I human factors study (1) was performed to identify potential causes of accidents at eight
Transitway intersections. Data were collected on bus operators’ driving behavior, on motorists’
behavior at Transitway intersections then on triangular sight distances at the intersections. Triangular
sight distances are usually determined when ascertaining the warrant for stop signs at railroad crossings.
The study included the sight distance analysis because of the functional similarity. Accident frequencies
were calculated based on the number of cars crossing each intersection per year. Data were related to
the immediate causes of reported accidents.
Phase I analysis of data (for vehicles crossing the Transitway, not the Transitway buses) suggested
that the following were potentially contributory to intersection accidents:
• Two percent of the drivers ran the stop signs and about 50% of the drivers used a rolling rather than a
full stop.
• About 20% of drivers did not look both ways before crossing the Transitway.
• Winter weather brought slippery roads and reduced visibility conditions.
• The timing for bus actuated traffic lights might not be optimal.
• Only five of the 32 triangular sight distances met minimum guidelines.
The data supports the idea that each of the above factors may have contributed to Transitway
accidents. Interpretation of the data suggests that combinations of these factors are more likely to have
contributed to accidents than any factor operating alone. The causes of accidents are complex and
combinations of factors causing accidents need not be the same for all accidents.
While we had no suggestions for eliminating the risk-taking behavior of scofflaws, we recommended
a more frequent and conspicuous police presence at Transitway Intersections. Other Phase I
recommendations were:
7
• Improve lighting at the intersections to improve visibility. We cannot prevent snow or fog but
we may be able to reduce their impact on drivers’ ability to detect on-coming buses.
• Improve sight distances by eliminating the sight line obstacles whenever this is possible. If this is
not possible, then information signs could be used to warn drivers of the short sight distances.
For example, one such frequently seen sign in cities is BLIND DRIVEWAY.
• Be especially diligent and thorough about snow and ice removal at the approaches to the
Transitway.
• Adjust the timing parameters of the bus actuated system for switching traffic lights to permit
buses to drive at a constant speed when approaching and passing through the intersections.
• Consider the effect on accident reduction of reducing bus speed. We showed the clear
relationship between bus speed and sight distance (1). This could be especially important in the
vicinity of intersections where sight distances cannot be improved.
• We recommended considering the development and use of 'new wave' messages on signing for
the streets intersecting the Transitway. The signing could be done on portable or permanent
electronic signs. Messages would address the factors cited above as potentially accident-
causing. The messages would be designed to have high impact. For example, NEVER HIT A
SCHOOL BUS. THE BUS WILL HIT BACK.
Potential Accident Causes
Several potential causes for Transitway accidents, either singly or in combination, seem possible:
• There is no real increase over the pre-Transitway accident rate. Our observations on relative accident frequency are the result of sampling error and chance fluctuations.
There is no valid way to make statistical comparisons between the pre- and post-Transitway
accidents. Clearly, city streets and the Transitway differ in ways which suggest that direct statistical
comparisons based solely on number of accidents would have no meaning. The amount of traffic
interacting with the buses is much greater on city streets than on the Transitway and this cannot be used
to explain the difference in numbers of accidents. The best we can do in trying to decide whether there
has been a real increase in accidents, is to make the common sense observation that the Transitway,
which was meant to reduce travel time between campuses, has instead resulted in a six-fold increase in
8
accidents. While we may not be able to demonstrate statistical significance, we can state our surprise
and seek for the reasons which may account for this unexpected and unwanted outcome.
• Bus drivers are careless or deliberately engage in risk taking driving behavior.
We included this potential reason for the increase in accidents based on the following observations.
On May 5, 1995 one of the authors of this report took a round trip Transitway ride starting at the
Huron Boulevard Parking Lot boarding at about 11:20 am and leaving the bus at the main bus stop on
Bufford St. near the St. Paul Campus Student Center. While waiting about ten minutes for a return bus,
two seemingly significant events were observed.
Improper Parking. Just east of the bus stop shelter, on the sidewalk at curbside on the north side of
Bufford St., is a fire hydrant. Opposite the fire hydrant, a station wagon was parked with the driver
behind the wheel. An incoming bus going west on Bufford St. parked closely alongside the station
wagon with the bus’s front door just in front of the station wagon’s front bumper and the bus’s rear
door just behind the station wagon’s rear bumper. The first passenger pushed the front bus door open
to leave the bus. At this instant, the station wagon accelerated just missing the disembarking passenger.
This was very close (less than one second) to producing a serious injury.
Left Turn at Intersection. Another bus departed and with its loud horn blowing continuously. It was
the bus going west on Bufford St. and approaching the T-intersection with Cleveland Ave. The light
was red as the bus approached. However, the bus driver initiated and completed the left turn onto
Cleveland while running the red light. This was not even close to a yellow light dilemma. The bus was
going slowly and the driver had plenty of time to stop for the red traffic signal. Fortunately, both north-
and south-bound traffic on Cleveland Ave. stopped to let the bus driver make the left turn on their
green light. This was not a close-call.
A potential reason for running the red light is the additional observation that if northbound traffic on
Cleveland Ave. stops close to the Bufford intersection, it is difficult for the bus driver to make the left
turn onto Cleveland Ave. without hitting the encroaching car. Space for making the turn is limited.
• Bus drivers have become relaxed and overly confident due to the apparent protection afforded by the right-of-way for Transitway buses.
9
This possible, but incorrect contributory explanation, was explored by collecting data as described
in the Methods Section of this report.
• Drivers of vehicles crossing the Transitway are scofflaws and this driving behavior at the Transitway intersections may sometimes result in accidents.
The results from collecting data on this issue are described in the Results Section.
• Poor geometry at the Transitway intersections contributes to accidents.
The intersections on the Transitway are nearly orthogonal and level. However, short sight distances,
as described below, could be contributory.
• The traffic control signs and signals for the intersecting streets are in some way
inadequate.
We can not directly provide data bearing on this issue. However, based on other comparisons we
can draw tentative conclusions on the effectiveness of the signs and signals.
• Unauthorized vehicles on the Transitway are a cause of accidents.
We have some data on this issue but found that it could only be a weak contributor, if it contributes
at all, to Transitway accidents.
• Other subtle, less identifiable factors are causing the accidents.
The only way to be sure that the above statement is not true, is to be able to account for all or
almost all of the observed accidents by means other than those just listed.
Literature Review and Analysis
In this review we noted that there was little literature on roadways analogous to the University of
Minnesota’s Transitway. There were, however, numerous transit authorities either considering or
developing busway-like operations. Brief descriptions of some of these projects are identified below.
• Pittsburgh. Pennsylvania has developed two dedicated busways and is now planning a third.
The Sought Busway was opened in 1977 and operates as a 6.4 km (4 mile), two-lane, two-
direction, limited-access roadway. The counter-flow lanes help speed buses from the South
Busway and other routes south of the Monongahela River through downtown Pittsburgh. The
East Busway (later renamed the Martin Luther King East Busway) is a 6.8 mile, two-lane bus
10
roadway built on exclusive right-of-way, connects Downtown Pittsburgh with densely populated
neighborhoods in the City's East End, Borough of Wilkinsburg, and other east suburban
communities. On the East busway routes operate exclusively on the busway except in the
downtown area. On the South busway buses and LRT share the right of way. In 1993, a 2.5
mile East Busway extension was being planned. Pittsburgh was also considering a 19-mile
Airport Busway (1993). Additional information on the Pittsburgh busways can be located in (7)
(8) (9) and (10). Safety statistics for the Pittsburgh busways were not available to the authors.
However, at least two major accidents have been documented. Early in the South Busway
operation there was a serious accident involving a bus (7). In 1996, Two commuter buses on
the East Busway collided head-on on a snow-covered highway, killing one of the drivers and
injuring at least 52 people, several seriously (11).
• Auckland, New Zealand. The North Shore Busway is a combination of busway and high
priority vehicle lane designed to improve the efficiency of passenger transport through the
Northern Corridor. Construction of the busway is expected to commence in 1998. New
Zealand has also initiated a 'Buses First' program that aims to make bus travel more reliable by
reducing the travel time of buses and taking buses out of traffic congestion. 'Bus Priorities'
comprise a package of bus lanes, signal pre-emption (where buses can set lights to green),
super-low-floor buses, improved information, and more frequent bus services.
• Brisbane, Australia. The proposed Inner Northern Busway will be the second stage of the
South East Queensland Busway Network which, when complete, will encompass at least 75
kilometers of dedicated busways and around 65 stations. The Council and Queensland
Transport have commissioned an Impact Assessment Study and Feasibility Study of the
Busway project.
• South Dade, Florida. The Florida Department of Transportation (FDOT) constructed a 8.2
mile roadway just for Metrobus routes. Express buses on the exclusive lanes shuttle passengers
from Dadeland South Metrorail station to Cutler Ridge Mall and South Dade Government
Center. Both full-size buses and minibuses operate on the Busway and in adjacent
neighborhoods, entering the exclusive lanes at major intersections.
11
• Other major cities. Other major US cities that are believed to be operating or developing
exclusive busways or barrier-separated high occupancy vehicle (HOV) facilities include:
Portland, OR; Houston, TX; Los Angeles, CA; and Virginia. Those cities operating buffer-
separated and non-separated HOV facilities include: Seattle, WA; Los Angeles, CA; Marin
Co., CA; and Miami, FL. Descriptions of these facilities were unavailable to the authors.
Accident and safety information for busways was difficult to obtain for a variety of reasons. In some
cases, collision and accident information was unavailable or was not formally reported. In most cases,
agencies did not specifically report busway information or incorporated information into categories such
as HOV accident rates. Information in this form may not relate to the present project because HOV
facilities often share right-way-privileges. HOV facilities vary in design as well. They may be barrier-
separated, buffer-separated, or non-separated facilities. Nevertheless, a report prepared for the Federal
Transit Administration (US DOT) addressed HOV and adjacent facility accidents rates (12). For
barrier-separated facilities (four cases), number of accidents per million vehicle miles were lower (range
0.4-1.0) for HOV lanes than for adjacent mixed flow lanes (range 1.1-2.4). For buffer-separated and
non-separated facilities (five cases), number of accidents per million vehicle miles were generally higher
for HOV lanes (range 1.9-3.2) than for adjacent mixed flow lanes (range 1.3-3.6).
A case study of HOV project experiences indicated that the implementation and operation of HOV
lanes have not caused a noticeable increase in accidents, nor have the facilities degraded safety.
However, the authors noted that complete information on accidents was not available for many areas
due to different reporting procedures by local and state enforcement agencies, incomplete accident
records, and difficulties in determining the cause of a specific accident. Citing studies conducted in
Minneapolis, Los Angeles/Orange County, and Santa Clara County the authors concluded that HOV
facilities were operated safety and have not adversely impacted the safety of the freeway general-
purpose lanes (13). Similar conclusions were presented by (14) who stated that the limited information
made available seems to indicate that accident rates for the HOV lanes are generally either lower, or the
same, as those reported ton the general-traffic lanes.
A report evaluating the public interest of HOV facilities concluded that HOV lane construction is in
many ways creating rather than solving traffic problems. Trends toward allowing general purpose traffic
on HOV lanes in non-peak periods is increasing accident and enforcement problems. The authors
12
suggest that bus-only lanes have lower accident rates than general purpose lanes, whereas HOV lanes
have higher accident rates than general purpose lanes (15).
In summary, available literature indicates that busways and, to a lesser extent HOV lanes, have
accident rates comparable to general purpose areas. Additional literature, including literature related to
railroad-highway grade crossings, since this is, to an extent, analogous to the Transitway intersecting
streets situation is located in Appendix A.
Human Factors Project Objective
The objective of this project is to collect and analyze data related to human factors aspects of
Transitway safety. This information can be used to identify aspects of the Transitway which contribute
to accidents at Transitway intersections. Knowing the source of safety problems may help to suggest
further solutions which may increase Transitway safety.
Following the completion of the Phase I Human Factors study, various changes were made at the
Transitway intersections (see 'Methods'). When these implementations were completed, the Phase II
Human Factors study was begun. The purpose of Phase II was to look for differences ascribable to the
new implementations at the intersections.
Report Organization
We collected independent sets of observations which related to one or more of the potential
accident causes listed above. For each of these sets, we presented a description of the method used.
Once all the methods were discussed, the results were shown. In the Discussion and Conclusion and
Recommendations sections all results were discussed together rather than an independent discussion for
each set of observations. We have emphasized comparisons between the Phase I and Phase II findings,
relating these comparisons to the new implementations at the intersections and the accident data.
13
METHODS
New Transitway Features
This section presents the changes in the Transitway that were made during the Program. These
changes are summarized here and are more extensively documented by Sohrweide and Benson (5).
This summary is taken from the information in (5).
• Efforts were made to improve stop line sight distances at intersections (details are presented in a
* numbers are based on extremely limited samples (low frequency of occurrence)
** numbers are not calculated from data in this table.
The following questions are deemed relevant to the evaluation of safety and/or are of interest to the
Transitway Safety Project Team.
• Overall, did driver behavior become safer after the introduction of intersection warning devices?
Overall data (summarized across all intersections) indicated that there was only a limited shift
toward safer motorist behavior at intersections. Complete stops increased 5% while rolling stops
decreased by 3%. While there were mixed benefits for looking behaviors, results are difficult to
38
interpret because of the increase in 'did not see' reports by data collectors. Generally, the higher
number of 'unable to sees' reported in Phase II will make conclusions concerning looking behaviors
extremely speculative. At three intersections there was an increase in drivers running the stop sign, at
three intersections no change and at three intersections a decrease in stop sign running. Such data does
not offer support for the efficacy of the improvements. Ultimately, intersection warning devices
appeared to have no impact on the frequency of runs, with an overall rate of about 2% steady across
testing phases.
• Can any conclusions be drawn concerning individual intersections?
Data in Table 13 indicates that the impact of intersection warning devices on motorist behavior can
be beneficial, detrimental, or indeterminable (no impact, inconclusive evidence). The data for 29th, 30th,
and Westgate demonstrated increases in complete stops accompanied by decreases in rolling stops and
decreases in runs, exemplifying the beneficial impact of the devices. In particular, 29th also
demonstrated conclusive and desirable shifts in looking behavior, where changes in 'did not see' not as
much of a factor as some other intersections. In contrast, 23rd and Malcolm demonstrated detrimental
effects for intersection warning devices, with decreases in complete stops, and increases in rolling stops.
However, some conclusive looking benefits were demonstrated at 23rd with an increase in looking both
ways. Finally, data at 25th did not support a conclusion. Changes in motorist behavior were small and
looking behavior data was inconclusive.
• Can changes in motorist behavior be linked to particular intersection warning
devices?
Conclusions concerning warning devices are difficult to draw because of the large number of
changes implemented by the project team and the large differences in the physical layout among
intersections. A controlled experiment would have required more than one installation at each
intersection with repeated testing. This design, however, was impractical. Thus, the following
conclusion should be viewed with some skepticism. Data from intersections with flashers (23rd, 25th,
and Westgate) demonstrated contradictory effects or limited success. It appears that flashers may be
effective at only some intersections because of some property of the intersection, and not some warning
property specific to the device. More research is needed to determine why flashers work in some
intersections and not at others. Contradictory results were also evident for intersections with blank-out
39
signs (30th and Westgate), again supporting the conclusion that the blank-out device may be effective at
only some intersections because of some property of the intersection, and not some warning property
specific to the device. Finally, the Fiber Optic Stop Sign activated through detector loops (29th) may
have proved effective, though a definitive conclusion is only warranted with further testing.
• What is the potential for frequency of exposure to undermine the effectiveness of warning devices (habituation)?
Data appears to support the conclusion that habituation is not a formidable problem. The
intersections at 29th and 30th are not public thoroughfares and have very low frequencies. Vehicles
travelling these routes are likely to be driven by employees of a small number of businesses adjacent to
the intersection. Thus, it was highly likely that data collectors recorded the same vehicles coming and
going from the same businesses. Had initial effects of warning devices worn off over repeated
exposure, that data would not reflect the large differences reported. The same principle applies to
Malcolm and Westgate, where the situation is much the same, though with a larger number of
businesses.
• Was there a 'global' response associated with the introduction of intersection warning devices?
The global effect hypothesis predicts that the overall effect of implementing many changes would
produce safer behavior across the entire system, regardless of warning device or location. Two pieces
of data refute this hypothesis. First, data for driver behavior varied across intersections. It is unlikely
that a global safety awareness would differentiate itself across intersections. Second, we would expect
that driver behavior across all intersections would be safer, even at those intersections where no
devices were installed (Energy Park Dr. and Como Ave.). These intersections were consistent across
testing phases or demonstrated more unsafe behavior (5% increase in runs at Energy Park Dr.).
• Were changes in motorist behavior due to differences in data collectors or collection
phases?
Overall data indicated that factors such as direction of travel and vehicle type were remarkably
consistent across collection phases, indicating stability in the traffic patterns being observed. Individual
intersections also demonstrated consistency in these factors with only a limited number of minor
deviations. Taken together, these data indicated that collectors were observing similar traffic and
40
recording data appropriately. Data for Energy Park Dr. and Como Ave., where the frequency of
vehicles required the observer to select from a moving pool of possibilities, indicated a consistency
among observers and phases. Data for direction and type of vehicle were consistent and minor
differences for stopping behavior were easily accounted for by changes in green light exposure.
• It is understandable how the new warning devices improved motorist behaviors; it is also understandable how the devices might have had no noticable effect on motorist behavior. But how could the devices have actually worsened motorist behavior?
Human factors analyses of behavior often identifies unwanted or unintended changes in human
behavior. Systems are designed to produce behavioral effect A; when humans interact with systems,
behavioral effect B is observed. As an example, examine changes in stopping behavior at 23rd and at
Malcolm. In both cases, stopping behavior went down (worsened) after the introduction the respective
warning devices. The data collected in this project does not address why behavior changed, thus the
following explanations are offered as hypotheses, based on the expertise of the authors and anecdotal
evidence of the data collectors. Why did stopping behavior worsen at 23rd? The warning device
installed at 23rd was a continuously flashing red light. The flashing light is designed to grasp driver
attention, which it effectively does. In fact, it grasps motorist attention far before the motorist arrives at
the intersection. The flashing light serves as a stimulus for the driver to begin the upcoming task –
slowing and looking down the transitway for traffic. In effect, the flashing light cues the motorist to
preview the intersection, a task made easy by the good sight lines present at 23rd. In the majority of
instances where there is no transitway traffic, the motorist has already decided it is safe to move through
the intersection prior to actually arriving at the intersection. Thus, the actual stopping behavior is
compromised. Why did stopping behavior worsen at Malcolm? The warning device installed at
Malcolm was a blank-out fiber optic sign activated by Autoscope . Motorists using this intersection
are repeatedly exposed to the device because the intersection is not a major thoroughfare and serves a
limited number of business. After limited exposure, motorists quickly comprehend how the device
works, activating only when traffic is present on the transitway. Importantly, motorists see the device
work accurately. Soon, motorists begin to rely on the device to tell them if traffic is present. As
motorist approach the intersection, they see the device is not activated, thus no traffic will be present in
the intersection. Thus, motorist looking and stopping behavior is compromised at the intersection. The
real danger in this case is that safety is completely dependent on the device working 100% accurately.
41
In the case of a malfunction or missed signal (perhaps an in-line skater) the driver is not sufficiently
prepared to stop because they think there will be no traffic at the intersection.
• Are there additional data that bears attention?
The Phase II data set produced a number of individual data points worth additional mention.
• The overall 9% increase in the number of times observers could not see motorist looking
behavior ('did not see') does not accurately reflect the tremendous variability across individual
intersections.
• The number of bicyclists, pedestrians, police, and others (e.g., in-line skaters) recorded at the
intersections was significantly reduced in Phase II as compared to Phase I.
• The number and percentage of 'runs' rose dramatically at Energy Park Drive.
• Is there any anecdotal evidence addressing safety concerns on the transitway?
In the opinion of the authors, The Energy Park Dr. intersection should represent a major safety
concern, requiring swift and immediate action. This intersection is characterized by:
• poor and limited sight lines for motorists
• poor and limited sight lines for bus drivers
• limited preview due to elevation changes and roadway curvature
• high volume of traffic
• high vehicle speeds
• large number and percentage of red light running (5% in Phase II)
On numerous occasions, the authors and data collectors observed flagrant red light running on the
part of Energy Park Dr. traffic. On numerous occasions, bus drivers had to reduce speed dramatically
in order to avoid potential crashes, despite that fact that buses had the right of way (green light). As a
safety strategy, bus drivers were frequently observed reducing speed when entering the intersection.
Based on this evidence, the authors conclude that it is the conscientious and attentive action of bus
drivers alone that has averted a major crash at the Energy Park Dr-transitway intersection.
42
Sight Distances
In the Phase I report for this project (1), one of our conclusions was that combinations of factors
were most likely responsible for the accidents occurring at the Transitway intersections. Inadequate
sight distances were one of these factors. Since the spring of 1996 some sight distances have been
improved by trimming brush, bushes and trees and by adding some NO PARKING signs. However,
other sight distances have been decreased by the installation of the cabinets for electronic control
equipment for regulating the signs and detectors on the Transitway and vegetation at some intersections
still serves to unduly restrict sight distances. We anticipate that some efforts will continue to prune the
obstructing vegetation. However, it is unlikely that all on-street parking near the Transitway
intersections will be forbidden. It is equally unlikely that the electronic controls cabinets will be moved
to locations where they would not restrict sight lines. For these reasons we place a different emphasis,
compared to the Phase I report, on the meaning of the sight distance data. The interpretation we
discuss here relates to speed restrictions
It is obvious that if cars approached the Transitway at five mph, sight distances could be very short
and safety could still be maintained as far as sight distances are concerned. Since sight distance
improvements seem to have been concluded, another approach to improving safety with respect to sight
distances is to reduce the speeds of either buses or cross street traffic or both. The data presented in
Table 11 showed that at only the 23rd Avenue intersection could the average approach speed be more
than 10 mph for bus speeds of either 20 mph or 40 mph. At all other intersections the average
approach speeds must be less than 10 mph even for bus speeds as low as 20 mph. At 23rd Avenue
the average approach speed could exceed 10 mph for only the northbound traffic with buses going
either eastbound or westbound. It does not seem likely that bus average speeds will be controlled to
less than 10 mph. The alternative is to greatly reduce the speeds of traffic approaching the Transitway.
Realistically, it seems unlikely that cross street speeds could be sufficiently reduced to compensate for
short sight distances without an extensive police presence or the legalization of the technology which
records both speeds and license plate numbers with the owner of the vehicle responsible for the
speeding violations. We can only surmise that short sight distances will continue to be a contributing
factor in Transitway accidents.
43
Visual Clutter
In the Methods section of this report we mentioned the placement positions of the NO TURNS
signs. In addition to this potential for confusing the motorist, at some intersections there are the
conventional diamond shaped warning signs, black and white rectangular signs stating BUSES DO
NOT STOP or BIKES AND BUSES DO NOT STOP with arrows pointing east and west, black and
white rectangular signs with an arrow pointing straight up and the word ONLY. There are also STOP
signs of varying degrees of elegance with and without lights or flashing lights and in addition most of
these signs are in duplicate by being placed to both the left and the right of the driver. One potential
result of visual clutter is that the most important message for safety is obscured by the presentation of
too many messages which are too close together in space and time. Clearly, the most important
message for safety at Transitway intersections is the STOP message. If a driver has stopped, looked up
and down the Transitway for approaching traffic, and then turned left, albeit illegally, there is no
dangerous consequence as long as this action is a relatively rare event. It is more dangerous to obscure
the message STOP by adding visual clutter. Whether or not drivers encroach on the Transitway due to
visual clutter is only a matter for speculation. We have no data which directly relates to this issue on the
Transitway, although the deleterious effects of visual clutter, in many circumstances, are widely known.
Perhaps a reduction in non-essential information would be prudent. For example the removal of the
NO TURNS signs located on the wrong side of the Transitway would reduce clutter without reducing
the supply of relevant information. The NO TURNS signs currently in use could be replaced by the
standard sign showing a turn arrow with a red diagonal line through it. These signs could be placed well
away from the intersections as long as no driveways would make these signs appear to deny turns into
the driveway. Locating these signs well back from the Transitway would reduce the clutter at the
Transitway without reducing the relevant information.
Signal Light Timing
The timing for the traffic signal lights could be improved at Como and Energy Park Drive. The bus
driver should not be required to reduce speed to accommodate the traffic light’s change to green for the
bus and then to increase speed to pass through the intersection before the light changed back to red for
the bus and green for the cross traffic. The bus drivers should be allowed to maintain a constant speed.
44
During data collection for Phase II we observed that on occasion, the signal lights failed to give the
Transitway buses the right-of-way. The buses were required to stop and wait until the light changed.
This is possibly due to system malfunction. If instead there is some schedule which states that on
occasion the signal lights will not give buses the right-of-way, drivers should be carefully coached and
then warned when this event is to occur. It would be even better not to switch back and forth between
the two forms of control.
Bus-Mounted Strobe Lights
Small strobe lights were mounted on the top of the Transitway buses beginning in August 1997.
These lights are not conspicuous during daylight hours. During the dark hours of operation, the normal
lighting of the buses, including their headlights and interior lights make them adequately conspicuous.
We should not sacrifice other safety features to accommodate the strobe lights.
45
(This page left intentionally blank)
46
CONCLUSIONS
In the Introduction to this report we discussed the motivations for performing the investigations
reported here. We maintained that until we understand why Transitway accidents occur, it will be
difficult to identify cost effective solutions which will reduce the number of accidents.
We have seen that most of the solutions implemented thus far have focused on enhancing the
utilitarian value of stop signs. Our belief must be that ordinary stop signs are obscured either visually or
in meaning to drivers approaching the Transitway. Is it reasonable to believe that sober drivers do not
understand the meaning of the familiar stop sign? This is clearly a difficult position to maintain. In the
accident reports for the Transitway there is nothing to suggest that intoxication has reduced drivers’
understanding of the meaning of stop signs. We believe that we should accept the idea that drivers
crossing the Transitway understand that stop signs mean that they should stop at the level of the stop
sign.
Can we maintain that the stop signs on the avenues intersecting the Transitway are visually obscure?
There is no evidence to suggest that this is the case. In fact, we have much evidence to show that
drivers indeed see and comprehend the stop signs. The accident reports do not suggest that visual
obscurity of stop signs was involved in accident causation.
If we accept that the stop signs at the avenues intersecting the Transitway were both visible and
understandable before the embellishments to the stop signs were undertaken, how do we explain the
reasoning which underlies the addition of flashing lights and fiber optic illuminations to the stop signs?
That is, how do we explain how stop sign illuminations add to either understanding of stop signs’
meaning or visibility in such a way as to reduce accidents? We have no data or speculation which
would serve to answer this question. What we do have are data which shows that the accident rate per
month didn't changed following the 1996/1997 changes to the Transitway sign system and the 1998
warning lights haven’t been in place long enough to have an effect on the rate.
We were not able to identify a single cause for the Transitway accidents which have occurred over
the last four years. The data has, however, allowed us to suggest that certain factors acting in
combination, may have contributed to causing Transitway accidents.
47
Bus Driver Behavior
• In general bus drivers are operating their vehicles within established guidelines (Phase I)
Accident Rates
• The overall accident rate prior to any Transitway improvements was 0.44 accidents per
month. The overall accident rate since the improvements beginning in 1996 until May of this
study was 0.45 accidents per month. The electronic warning devices were only in operation
for 5 of these months. These data should be interpreted with care as accidents are rare
events. These statistics merely imply that the Transitway continues to be just as dangerous
roadway as compared to the average Minnesota roadway.
Driver Behavior (Crossing Vehicles)
• Overall, data suggest only a slight shift toward safer driver behavior at intersections after
transitway safety improvements were implemented. (5% increase in complete stops)
• Overall, transitway safety improvements had little or no impact on the frequency of runs, with an
overall rate of about 2% steady across testing phases.
• About 20% of drivers do not look both ways before crossing the Transitway.
• Subsequent to transitway safety improvements, 3 intersections demonstrated behavioral
improvements (29th, 30th, and Westgate), 2 demonstrated behavior detriments (23rd and
Malcolm), and 1 intersection (25th) did not support a definite conclusion.
• Data from intersections with flashers demonstrated contradictory effects or limited success.
Contradictory results ere also evident for intersections with blank-out signs. The Fiber Optic
Stop Sign proved effective, though a definitive conclusion is only warranted with further testing.
• Data does not support the conclusion that habituation or frequent/repeated exposure degrades
the effect of the warning devices in question.
• Data does not support the contention that the numerous improvements in transitway safety
created a 'global' safety conscience on the behalf of transitway users.
• Conclusions regarding changes in driver looking behavior were somewhat compromised by an
increased reporting of 'did not see' in Phase II.
48
• One intersection (Energy Park Drive) demonstrated a dramatic rise in red light violations in
Phase II.
Sight Distances
• 27 of 32 triangular sight distances failed to meet state and federal requirements (Phase I). Short
sight distances suggest that average approach speeds should be reduced (Phase II).
• Calculations of required average speeds to enable a complete stop at a stop sign indicated that
only one intersection (23rd) would support a speed greater than 10mph. (Phase II)
• Since the spring of 1996 some sight distances at intersections have been improved. However
other sight distances have been decreased by the installation of the cabinets for electronic
control equipment for regulating the new warning signs.
• Vegetation continues to obstruct stop line sight lines at a few intersections intersections.
Other
• The addition of signs at intersections has contributed to visual clutter, too many messages which
are too close together in space and time.
• To a layman, the design of the fiber optic stop sign appears to be inconsistent with the
Minnesota Manual on Uniform Traffic Control Devices, in that the sign is not an octagon
(section 2B-4). Mn/DOT was consulted and agreed that the square background behind the
sign was proper, not unlike mounting a sign on the side of a building next to an alley. The sign
meets the octagonal, reflector, and illumination requirements of the manual.
• The position of the NO TURN sign appears to be inconsistent with Minnesota Manual on
Uniform Traffic Control Devices, in that the sign is not placed in advance of the condition to
which it calls attention (section 2A-25).
• Signal light timing continues to appear sub-optimal. Bus drivers are regularly observed slowing
and even stopping at intersections.
• Efforts at Transitway safety improvements have been overly focused on enhancing the utilitarian
value of the stop sign.
49
• Anecdotal evidence, supported by observational data, suggests that the Energy Park Dr.-
transitway intersection represents a significant safety concern.
50
(This page intentionally left blank)
51
RECOMMENDATIONS
The data we have collected are supportive of the idea that each of the above factors may have
contributed to Transitway accidents. Interpretation of the data suggests that combinations of these
factors are more likely to have contributed to accidents than any factor operating alone. The causes of
accidents are complex and combinations of factors causing accidents need not be the same for all
accidents.
While we have no suggestions for eliminating the risk-taking behavior of scofflaws, we recommend
a more frequent and conspicuous police presence at Transitway Intersections. Other recommendations
are:
• Improve sight distances by eliminating the sight line obstacles whenever this is possible. If it is
not possible, then information signs could be used to warn drivers of the short sight distances.
One such frequently seen sign is BLIND DRIVEWAY.
• Be especially diligent and thorough about snow and ice removal at the approaches to the
Transitway.
• Adjust the timing parameters of the bus actuated system for switching traffic lights to permit
buses to drive at a constant speed when approaching and passing through the intersections at
Como and Energy Park Dr.
• Consider the effect on accident reduction of reducing both bus speed as well as cross street
traffic speed. We have shown the clear relationship between bus speed and sight distance.
This could be especially important in the vicinity of intersections where sight distances cannot be
improved.
• Reduce visual clutter by removing non-essential information from intersections, make the sign set
consistent from intersection to intersection.
• Identify and evaluate safety improvements not related to the utilitarian value of the stop signs.
• We recommend considering the development and use of “new wave” messages on signing for
the streets intersecting the Transitway. The signing could be done on portable electronic signs.
52
Messages would address the factors cited above as potentially accident causing. The messages
would be designed to have high impact for example NEVER HIT A SCHOOL BUS. THE
BUS WILL HIT BACK.
• We recommend increased safety efforts specific to the Energy Park Dr. intersection. Efforts
should be focused on increasing sight lines, reducing motorists’ speed, adjusting light timing
parameters, and reducing red light violations.
53
REFERENCES
1. Stackhouse, S.P. and Donna Tranchida. 1996. Human factors for Transitway safety
improvement. Final Report to the Center for Transportation Studies.
2. Easa, S.M. (1993). Should vehicle 15-percentile speed be used in railroad grade crossing
design? ITE Journal, August, p 37-46.
3. Lerner, N. (1990). Driver behavior at rail-highway crossings. Prepared by the Comsis
Corporation.
4. Minnesota Department of Transportation (1991 MN MUTCD). Minnesota manual on uniform
traffic control devices for streets and highways.
5. Sohrweide, Tom - P.E. and L.A. Benson. 1998. Transitway ITS Safety Applications. Pre-print
of the 1998 ITE International Conference Proceedings. Toronto, Canada.
6. Weiss, M. Minnesota Department of Transportation’s Signing Engineer. Personal
communication, May,1998.
7. Wilkins, V. (1993). Pittsburgh plans busway expansion. Bus World, 15, 4-7.
8. Wilkins, V. (1983/84). Pittsburgh finds the busway can provide the ;functional advantages of a
rapid transit line at much lower capital cost and bus routings are much more flexible. Bus World,
6, 9-13.
9. No author (1983). Pittsburgh's East Busway opens for service. Bus Ride, 19, 62-63.
10. Lyons, W., Shadle, P., Dysher, B., Jensen-Fisher, R., Ducca, F., and Salvucci, F. (1993).
Review of the transportation planning process in the Pittsburgh metropolitan area. Final report
produced for the Federal Transit Administration and the Federal Highway Administration by the
Volpe National Transportation systems Center, Research and Special Programs Administration,
and the US Department of Transportation (Report # RSPA/VNTSC-SS-TM392-04).
11. USA Today, January 12, 1996.
54
12. Cohen, H. and Reno, A. (1992). Characteristics of urban transportation systems. Final report
prepared for the Federal Transit Administration, US Department of Transportation. (7th Edition,
revised).
13. No author (1992). High occupancy vehicle project case studies: Historical trends and project
experiences. Report prepared for the Federal Transit Authority by the Texas Transportation
Institute. Washington, DC: US Department of Transportation (DOT-T-94-18).
14. Turnbull, K.F., and Hanks, J.W. (1990). Final report: A description of high-occupancy vehicle
facilities in North America July 1990. Report prepared for the Office of Planning, Urban Mass
Transportation Administration, Washington, DC and Texas State Department of Highways and
Public Transportation, Austin, TX. Washington, DC: US Department of Transportation (DOT-T-
91-05)
15. Leman, C.K., Schiller, P.L., and Pauly, K. (1994). Re-thinking HOV: High occupancy vehicle
facilities and the public interest. Annapolis, MD: The Chesapeake Bay Foundation.
55
APPENDIX A
LITERATURE REVIEW AND ANALYSIS
Introduction
The subject of this literature review is transitway safety. The Transitway which connects the
Minneapolis and St. Paul; campuses of the University of Minnesota, providing bus transportation for
students, is sufficiently unique that we could find no published reports on safety issues for similar
roadways. We had hoped that private roads on industrial “campuses” might have provided relevant
information, but we could not find any reports covering such circumstances. Perhaps the fact that we
could find no “transitway safety” published reports is in itself a significant finding. An easy assumption is
that if there are no reports of “transitway safety” problems, then there are no such problems. We are
reluctant to make such an assumption since there are no grounds on which to base it. Even if we did
assume this, we would be left with the conclusion that Transitway safety at the University of Minnesota
is unique. That is, the problem here at the University is still quite real even though it may be unique.
An approach to relating relevant past experience to Transitway safety, is to find an analogous
situation for which there is data from which we can generalize to the Transitway. Such a situation is
provided by railroad grade crossings. At a grade crossing it is completely clear that trains have the
right-of-way. Not only are trains threatening because of their mass, speed and inability to stop (at 55
mph it takes an average size train about one mile to stop) or take evasive maneuvers, but there are signs
and signals and sometimes gates which warn of their potential or actual presence at the crossing. For
many crossings an approaching train’s presence is sensed and this activates signals at the crossing. Cars
and trucks are warned in advance that they are approaching a crossing by unique signing (yellow
circular sign with a black X). For the transitway, signs make it clear that this roadway is only for buses
and that buses have the right-of-way. On the streets intersecting the transitway which have traffic
signals, the presence of the approaching bus is sensed and the light turns green for the bus and red for
the cross traffic. At other intersecting streets there are conventional STOP signs. A final point is that
there is a surprisingly large number (over 100) of train - vehicle accidents each year in Minnesota and
56
correspondingly there is also a surprisingly high number of accidents between the transitway buses and
vehicles crossing the transitway.
Fortunately there is an excellent 1990 review of the literature on grade crossing accidents with
heavy emphasis on human factors concerns.1 A summary of that review with annotation which points to
the analogy follows. It will be apparent that the analogy between Transitway and grade crossings is
imperfect. However, it will also be clear that there many lessons to be learned for Transitway safety
from a consideration of the grade crossing literature.
The main topics of Lerner’s report are: Contributing Factors, Driver Characteristics,
Countermeasures, and Conclusions. These topics all contain material that is analogous to Transitway
safety improvement.
Contributing Factors
Lerner organizes his analysis of the literature around the Positive Guidance model developed by
Post, Alexander and Lunenfeld in 19812. This is the model used to describe driver requirements in the
“Railroad-Highway Grade Crossing Handbook” prepared by Tustin, Richards, McGee and Patterson
in 19863, as well as in other reports. This model provides a frame of reference for considering the
demands that a rail-highway crossing imposes on the driver. These demands are perceptual and
cognitive involving seeing, comprehending, and making decisions. The model focuses on the driver’s
process of acquiring and using the needed information. This model could be used equally well to
describe the driver approaching the Transitway on one of the intersecting streets. Lerner also created a
description of drivers who are approaching grade crossings that applies equally well to drivers
approaching the Transitway. This description is given later in this report.
Five information handling zones are defined: the advance zone (precedes the demands of the
hazard), approach zone (defined by the decision sight distance), non-recovery zone (defined by the
1 Lerner, N. (1990). Driver behavior at rail-highway crossings. Prepared by the Comsis Corp. Federal Highway Administration Report No. FHWA-SA-90-008. 2 Post, T.J. and Lunenfeld, H. (1981). A users’ guide to positive guidance (2nd ed.) Report No. FHWA-TO-81-1, Washington, D.C., U.S. Department of Transportation, Federal Highway Administration. 3 Tustin, B.H., Richards, H., McGee, H. and Patterson, R. (1986) Railroad-Highway Grade Crossing Handbook (2nd ed.), Report No. FHWA-TS-86-215). Washington, D.C., U.S. Department of Transportation, Federal Highway Administration
57
stopping sight distance), hazard zone ( about 15 feet from the nearest track) and downstream zone
(beyond the hazard). The engineering definition of these zones is arbitrary depending on how
conservatively we define response time, braking distance, vehicle length, visibility conditions, sight
distance and other conditions.
Comprehension
In their investigation of causal factors in railroad-highway crossing accidents, Berg, Knoblauch and
Hucke, 19824, found that both recognition errors and decision errors occurred frequently along the path
to the crossing. However, there was no single error path that accounted for the majority of the
accidents. Failures in perception and decision making occurred all along the path.
Driver expectancy is another important issue for understanding the causes of grade crossing
accidents. Expectancy may be based on long-term experience with driving as in expecting freeway exits
to be on the left. Similarly, drivers might well believe that a bus would rarely be in the vicinity when they
are crossing the Transitway. There are also short term expectancies. For example when driving on a
winding road we come to expect the next curve but we would be surprised if this happened on a long
straight highway. Drivers’ expectancies at a crossing can influence what they see and how they interpret
what they see (likelihood that a train will be in the vicinity, the warning time provided by flashing signals,
length of delay caused by the train, probability of being caught violating crossing laws, willingness to
take risks, etc.)
There are many studies to show the extent to which people understand the meanings of the traffic
control devices (TCDs) associated with rail-highway crossings. Results vary and there are many
reasons for the variance; both content and method. In general drivers understand that the TCDs mean
that there is crossing nearby and that there may be a train present or approaching. The exact meaning
implied by the TCDs is often difficult for motorists to comprehend. Drivers may interpret the lack of an
active signal at a crossing as meaning that it is safe to cross. Sanders et al (1973) interviewed over one
thousand drivers just after they had driven over a grade crossing. At active crossings, 23% of drivers
thought that all crossings had signals or gates. At passive crossings 15% also thought this. Tidwell and
4 Berg, W.D., Knoblauch, K. and Hucke, W. (1982). Causal factors in railroad-highway grade crossing accidents. Transportation Research Record, 847, 47-54. Washington, D.C. Transportation Research Board.
58
Humphreys’ (1981) survey at a license renewal site found that when applicants were shown a picture of
a flashing signal array for a grade crossing over half stated that the signal was rarely or never used. In a
later study, Richards and Heatherington (1988) found this figure to be 23%. In both these studies
almost all drivers understood that flashing lights meant that a train was coming. Drivers crossing the
Transitway are unlikely to demonstrate this poor level of understanding of the signs and signals used,
although some could be confused because of the novelty of the situation.
In spite of many studies related to detection and recognition of grade crossing TCDs there is no
evidence to show a clear correlation between drivers’ understanding of TCDs and accident frequencies.
For example, there is no evidence to show that just because many drivers believe that the crossbuck
means “stop, look and listen” that these same drivers have more crossing-related accidents. We can
only speculate that lack of understanding of the meaning of TCDs or laws leads to accidents. Similarly
for the Transitway, we too could only speculate on the effect on accident rate of possible
misunderstandings of signs and signals.
We can also speculate that failure to understand that trains cannot make sudden collision avoidance
maneuvers. In the Richards and Heatherington survey (1988) 45% of respondents felt that when the
train driver saw cars crossing the track, the train driver should slow or stop the train. About 10% of
drivers did not know whether it took a greater distance to stop a train or a large truck. Based on such
information it is not unreasonable to assume that drivers’ inability to estimate the time available to cross
the tracks could lead to accidents. Similarly, drivers crossing the Transitway, may not always correctly
estimate the amount of time available to safely cross. However, for grade crossings many drivers do not
realize that one train is masking the second train and that when they attempt to cross after the first train
has passed they collide with the second train and this not likely to be the case on the Transitway with
one bus masking another. Lack of visibility due to geometry and sight-line obstructions has been
documented as a contributor to accidents. While buses are much more maneuverable than trains, they
are not as maneuverable as most smaller vehicles. As discussed in the Task 3 Report, sight distances
could play a role in accident causation.
Lerner summarizes this topic by stating that there are factors which are related to accident potential
and drivers should be, but often are not, aware of these. Drivers should understand: 1) the meaning of
information communicated by TCDs; 2) the responsibilities of drivers; and 3) the factors that can
59
contribute to accidents at grade crossings. The same conclusions may apply equally well for the
Transitway.
There is adequate evidence to show that some fraction of drivers fail on one or more of the above
points. However, while there is speculation there is no evidence linking this failure to accident
frequencies.
The next three subtopics considered in the Comprehension of rail-highway accidents context were
detection and recognition, perception, and decision making.
Detection and recognition
The topic of detection and recognition is considered under the following headings:
• Dependent measures of detection. (The three common measures are head movements,
characteristics of the vehicles speed profile on the approach to the crossing and perception-
brake response time.)
• Conspicuity of TCDs (The characteristics of not just the sign but the sign in its environment.)
• Detection and recognition of: Advance warning devices, crossings, active warning devices,
trains at the crossing, approaching trains.
There are significant problems associated with detection and recognition. A difficult problem for the
driver is the recognition of the meaning of the round warning sign. This sign does not tell the motorist
whether there is an active warning device at the crossing nor does it indicate distance from the crossing
nor does it speak to the visibility of the crossing. If it is night, the intersection without lighting and with a
passive warning device but with an approaching train may first become visible in the non-recovery zone,
particularly if there is a difficult geometry.
One of the strategies might be to combine visual, tactile and auditory stimuli since such combinations
are known to improve signal detectibility. One could use rumble strips, the sounds from the train, and
active or passive signals to ensure grade crossing detection. One could also add high intensity lamps or
strobe lights to increase detectibility. Four-quadrant gates decreased perceptual-braking response
times compared two quadrant gates.
60
Perception
In the present context perception refers to the processing of the data obtained during detection and
recognition. This processing might take the form of estimation or evaluation. Perceptual processes
come into play at both grade crossings and the Transitway.
After the crossing and the approaching train are detected, drivers still need to make higher order
perceptual judgments which will form the basis from a decision about whether to cross the tracks. The
perceptual judgments are complex. For example these judgments involve estimating the time to arrival
of the train based on the both the train’s speed and the motorist's speed, the distances to be traversed
by both, the smoothness of the pavement, the grade of the road, the length of the vehicle, the number of
tracks and other factors. Accident data makes it clear that not all drivers stop even when there is a
doubt about the outcome suggesting that some drivers have been too willing to take risks. We believe
that this is a salient problem at the Transitway intersections.
The topic of perception was treated under the following headings:
• The perception problem.
• The difficulty of the perception problem is increased by darkness, short sight distances, and
other factors which serve to decrease the time remaining to make a decision.
• Motion and gap problem.
There was no literature directly relevant to the grade crossing problem, however, there have been
studies on the gap problem. Gap time is the time between two successive vehicles on a road. Lag time
is a special case of gap time and is the time from arrival of the driver’s car at an intersection to the
arrival of the first car on the intersecting road. Ebbesen and Haney (1973)5 found that the probability of
turning into traffic at an intersection (accepting the gap) was a normal function of the logarithm of the
temporal distance. The OECD (1974)6 found that gap acceptance corresponded to a lognormal
distribution of gap times with a median value of 7.3 seconds; an 85th percentile of 10 seconds; and a
5 Ebbesen, E.B., and Haney, M. (1973). Flirting with death: Variables affecting risk taking at intersections. Journal of Applied Social psychology, 3 (4), 303-324. 6 OECD Road Research Group (1974, November). Capacity of at-grade junctions. Organization for Economic Cooperation and Development.
61
15th percentile of 4 seconds. As traffic volume increased, acceptable gap size decreased and this
impatience factor might well operate at grade crossings.
When a vehicle is approaching (as in passing or as in viewing an on-coming train), the major visual
cue is expansion of the retinal image, also called “looming.” Because the size of the retinal image is a
tangent function of its distance, the size of the image grows exponentially as the train or vehicle
approaches at constant speed. As the distance halves, the visual angle subtended is doubled. As a train
approaches from 5,000 feet away to 1000 feet away, the image size changes relatively little; but inside
about 500 feet looming increases dramatically. Thus the difficulty of in perceiving the rate of approach
from a target at a distance is inherent in the geometry of the situation.
In passing experiments Gordon and Mast (1976)7 found that the percent of drivers
underestimating the distance required to pass increased as speed increased. Judgments about passing,
just as judgments made on an approach to a grade crossing, are subject to errors of estimation on each
of the variables involved such as speeds and distances. The judgment of the perceived distance and
motion of large trucks is related to the extent of patterning and delineation with a fully outlined pattern
seen as much closer. Henderson, Zeidman, Burger and Cavey (1983)8 have reviewed the literature
relevant to this topic. Minimal patterning, particularly at night may be typical of trains where the outline
of the approaching locomotive is not distinct. This could lead drivers to believe that the train is farther
away than it actually is.
• Unique problems in the perception of trains.
The most serious of the unique problems in the perception trains are related to the large object
illusion, Leibowitz (1985)9. In this illusion large objects seem to move more slowly than small objects.
An example is large vs. small jet aircraft landings. The larger planes seem to be going much more
slowly then the small planes when in fact they are landing at the same speeds. A classic effect in motion
perception is “velocity transposition” which states that the perceived velocities of moving targets are
related to the relative sizes of the targets and visual fields in which they move Brown (1931)10.
7 Gordon, D. and Mast, T.M. (1976). Driver’s judgment in overtaking and passing. Human Factors, 18, 53-62. 8 Henderson, R.L., Zeidman, K., Burger, W.J. and Cavey, K.E. (1983) Motor vehicle conspicuity. In Crash Avoidance, SP-544 (pp 145-188). Warrendale, PA: Society of Automotive Engineers, Inc. 9 Leibowitz, H.W. (1985). Grade crossing accidents and human factors engineering. American Scientist, 73, 558-562. 10 Brown, J.F. (1931). The visual perception of velocity. Psychologische Forschung, 14, 199-232.
62
• Other sensory modalities.
Vision is the predominant modality with audition related to train whistles of much less importance.
The relationship of detection and recognition for grade crossing to the Transitway is obvious. The
same factors come into play. In fact most of the data comes from studies of roadway intersections
rather than grade crossings.
Decision making
Under this subtopic, decision-making errors, risk perception and risk taking are discussed.
Knoblauch, Hucke and Berg (1982)11 classified decision errors and gave their frequencies as
follows:
For flashing light sites:
• Driver recognizes signal from approach zone, does not detect train. 18%
• Driver recognizes signal from approach zone, does not stop, recognizes train from non-
recovery zone, attempts to stop. 17%
• Driver recognizes signal from approach zone, does not stop, recognizes train from non-
recovery zone, does not stop. 22%
• Driver recognizes signal from approach zone, brakes to stop, recognizes train, attempts to
cross. 5%
For crossbuck-only sites:
• Driver recognizes train from approach zone, does not stop. 7%
• Driver recognizes train from approach zone, enters non-recovery zone, attempts to stop.
8%
• Driver recognizes train from approach zone, brakes to stop, attempts to cross. 3%
About 20 % of the accidents did not fall into these categories and this included cases involving
alcohol. Note that only 8% of the accidents occurred after the driver had stopped. The definition of a
63
decision-making error was narrow and did not consider such factors as weather, pavement, other signs
or markings or driver familiarity. The same logic can be applied to Transitway intersections.
Risk taking refers to willingness to accept a potential for harm. Risk perception refers to a person’s
ability to perceive harm for whatever benefits might accrue. For a driver to take a risk means that the
hazard must be detected, the degree of risk (probability and severity of consequence) perceived and the
potential consequences of an action accepted. A special issue of the journal “Ergonomics” (April 1988,
Volume 31, No. 4) was devoted to “Risky Decision-Making in Transport Operations.”
Many surveys have shown that drivers are poor at estimating risks. Sight distances and approach
speeds may be related to willingness to take risks. However, it could be that when sight distances are
greater, drivers approach crossings at higher speeds.
Factors in decision making errors at crossings are discussed under the following heading:
information limitations and ambiguity; information credibility; expectancies regarding trains; expectancies
regarding crossings, costs of compliance; temporal constraints; competing inputs; decision making as a
disruptive activity; recognition of capabilities and biases; conflicting messages; avoidance of effort; social
influences; and emotional reactions. Drivers approaching the Transitway may also be assessing the risk
of crossing with fully complying with messages provided by the signs and signals.
Compliance
This section deals with actions which the driver knows to be illegal and risky; that is, most cases of
non-compliance are intentional. For example Knoblauch, et al (1982) determined that in more than half
the cases at flashing light crossings, the driver had seen the signal sufficiently in advance, but did not
stop. Other studies were cited which confirmed this study. Drivers are sensitive to the length and
reasonableness of the warning times and this influences compliance. Other factors which influence
compliance are discussed under the heading of inconvenience; driver familiarity with the crossing; social
behavior and norms, enforcement and conflicting concerns. (As an aside, “conflicting concerns” may
well have been a factor in the 1995 crossing accident involving a school bus in Fox River Grove, IL.)
11 Knoblauch, K., Hucke, W. and Berg, W. (1982). Rail highway crossing accident causation study. Vol. II: Technical report FHWA-RD-81-83. Washington D.C., U.S. Department of Transportation, Federal Highway Administration.
64
Impairment
This section of Lerner’s report deals with alcohol, drugs and fatigue and these are not of interest in
the context of the Transitway project since we will not be doing any screening of drivers crossing the
Transitway..
Driver Characteristics
The issues of interest in this section on driver characteristics are familiarity and risk taking. The
findings on crossing familiarity could be summarized by the adage that “familiarity breeds contempt.”
Risk taking of one kind has often been correlated with other forms of risk taking in individuals; such as
risk taking at crossings is correlated with risk taking in other driving situations such as at the Transitway.
Countermeasures
Most countermeasures have not been evaluated, only suggested. There are no global
countermeasures that would solve all problems at crossings. Even if a counter measure would be found
to be effective in modifying behavior in a limited way, there is no guarantee that this would result in a
reduction in accidents. Furthermore, even if accidents were reduced the countermeasure might not be
cost-effective. The thousand or so deaths occurring at crossings each year testifies to the difficulty in
implementing broadly effective countermeasures.
The major subsections in this Countermeasures section mirror those found in Contributing Factors:
Comprehension; Detection and Recognition; Perception; Decision Making; and Compliance.
Comprehension
The NCHRP Report 50, “Factors Influencing Safety at Grade Crossings”” (Schoppert and Hoyt
1968)12 was over 20 years old when Lerner wrote his review in 1990 and Lerner could state that
neither the grade crossing problems nor the proposed countermeasures were new. Lerner points out
the classes of possible countermeasures. The most effective intervention is either to close the crossing
or implement grade separation. Next in order of effectiveness is automatic four quadrant then two
12 Schoppert, D.W. and Hoyt, D.W. (1968). Factors influencing safety at highway-rail grade crossings. (NCHRP Report 50). Washington, D.C. Highway Research Board.
65
quadrant gates because it simplifies drivers options and reduces decision making. Active crossing
signals are more effective than passively protected crossings. Passive protection places the greatest
demands on driver comprehension, detection, perception, and decision making. The relative virtues in
terms of driver behavior are clear. The issues relate to cost of installation and maintenance, cost
effectiveness and resource allocation.
Many studies have suggested some form of educational or public awareness efforts to reduce grade
crossing accidents (Richards and Heatherington, 198813; Knoblauch et al. 1982; Haga 1988)14. Some
educational efforts have been directed toward improving drivers’ understanding of their own perceptual
limitations (Knoblauch et al. 198215; Leibowitz 198516; Leibowitz and Owens 198617; McGinnis
197918). Most of these efforts, including Operation Life Saver have not been formally evaluated for
effectiveness. In the evaluations which have been done no correlations were found between educational
programs and improved driver behavior at crossings. The Cerro Gordo County Iowa effort was
another example of type of program which initially had a beneficial effect on drivers’ behavior but this
effect dissipated within six months.
Detection and recognition
Under detection and recognition the subtopics are: Advance Warning Signs; Active Advance
Warning Devices; Rumble Strips, Crossbucks; Active Warning Devices; and Trains.
Advance warning signs
Many studies have been done to improve advance warning signs. These studies have involved
changing the size, shape, color, symbols, messages, locations and number (redundancy). Some show
13 Richards, S.H. and Heathering, K.W. (1988). Motorists understanding of railroad-highway grade crossing traffic control devices and associated traffic laws. Paper presented at the 67th Annual Meeting of the Transportation Research Board. Washington, D.C. 14 Haga, S. (1988). Prevention of accidents at road-rail level crossings protected with automatic barriers pp. 933-937. Proceedings of the Human Factors Society 32nd Annual Meeting Vol. 2. Santa Monica, CA: The Human Factors Society. 15 Knoblauch et al. 1982. op. cit. 16 Leibowitz, H.W. 1985. op. cit. 17 Leibowitz, H.W. and Owens, D.A. (1986). We drive by night. Psychology Today, 20(1), 55-58. 18 McGinnis, R.G. (1979). The benefits and costs of a program to reflectorize the U.S. fleet of railroad rolling stock, Report No. FRA-OPPD-79-12. Washington, D.C.: Federal Highway Administration.
66
slight enhancement but none have shown substantial effects on drivers’ behavior and potential effects on
driver behavior are unknown.
Active advance warning devices (AAWDs)
AAWDs have been proposed for both active and passive crossings particularly those with limited
sight distances (geometry or weather) and high vehicle speeds (perhaps due to downgrades.) The
rationale behind activating the AAWD prior to activation of the crossing device is to provide sufficient
time for drivers located between the AAWD and the crossing to clear the crossing before activation of
the crossing signals. When AAWDs have been tested at active crossings with limited sight distances,
they appeared to facilitate driver detection of the activated crossing signal, but primarily under daytime
viewing conditions. In a field test (Ruden et al., 1982) using flashing lights on the approach to the
crossing. About half of the drivers recognized that this signaled the approach of a train while the other
half wanted to know whether or not the lights flashed continuously. This latter response was caused by
familiarity with continuously flashing lights such as those at rural intersections or at construction zones.
The TRAIN WHEN CROSSING and the neon R X R GATE AAWDs have been shown to be
effective. Acoustic warning signals have been tested and found to result in some improvements,
however, neighbor’s complaints limit their applicability. Various authors have suggested in-vehicle
warning messages but this advanced concept has not been adequately tested and usage would need to
be nearly universal before this technology could replace conventional AAWDs. Thus AAWDs have
been shown to provide a benefit, particularly when they are only active when a train is present.
Rumble strips
Rumble strips have shown to have advantages over purely visual warning signals in alerting drivers
to the crossing and also the detection of other warning signals. Painted rumble strips cause speed
reduction even before the strips are reached. The most serious disadvantage is the avoidance behavior
of drivers familiar with the crossing. The consensus is that rumble strips should be used only at
crossings with special hazards such as limited sight distances, unusual geometries or excessive vehicle
speeds
67
Crossbucks
There are many studies which have evaluated size, shape and color of crossbuck signs since the
standard crossbuck has limited conspicuity. Overall, the case for changing the standard crossbuck is
not strong.
Active warning devices
Even under ideal viewing conditions the standard narrow-beam lights used for active crossing signals
are not readily detected by drivers at short distances from the crossing (Hopkins and White, 197719;
Lindberg, 197120). Efforts to increase the conspicuity of crossing signals have included manipulations of
intensity, beam size, size color, flash rate, placement and source of light such as incandescent or strobe.
Most attempts at improvements have involved the addition of strobe lights and most of these efforts
have been at least partly effective. The major drawbacks have been that some drivers attend to the
strobe light rather than the train or the other signals which signal the presence of a train. It appears that
strobe lights have more value at urban crossings where conspicuity is an issue. In addition to strobe
lights, studies have considered the use of traffic control signals at grade crossings. The advantage is that
these signals are familiar to drivers. However, traffic control signals have not been shown to be superior
to flashing lights.
Of all the active warning devices studied, strobe lights seem to offer the greatest promise.
However, whether strobes will maintain their attention getting properties if they come into widespread
use is not known.
Trains
Countermeasures for increasing the conspicuity of trains fall into two categories: at the crossing or
before the train reaches the crossing. Accident data shows that in 10% of crossing accidents the driver
could have stopped safely if he had detected the train when it was at the crossing. This type of accident
could be reduced by increasing the visibility of the train when it is at, or about to enter, the crossing.
19 Hopkins, J.B. and White, E. (1977). Improvement of the effectiveness of motorist warnings at railroad-highway grade crossings. Report No. DOT-TSC-FRA--76-25). Washington, D.C.:USDOT, FHWA. 20 Lindberg, V.L. (1971). How to make crossing signals more observable to drivers. Railway Signal Controls, 2(1), 24-30.
68
However, for the majority, about 90%, of accidents, the train was still approaching the crossing when
was at the decision point. For these accidents the counter measure is to increase the sight distances and
train conspicuity. Lerner discusses these factors under the following headings: illumination at the
crossing, reflectorization of railcars, reflectorization of trackside objects and on-train devices.
Perception
Improving perceptual judgments by the use of illusions have been proposed but not tested.
Leibowitz (1985)21 has suggested that the apparent size of an approaching train should be reduced since
smaller objects appear to have a greater speed than larger objects. Leibowitz also suggested that the
looming effect should be increased to make drivers more conservative in there estimation of the train’s
distance from the intersection and the train’s speed of approach. In general the potential benefits from
perceptual countermeasures are untested.
Decision making
Decision making concerns the ways in which drivers deal with the information available to them.
Issues involve the kind of information, its credibility, when and where it is received and the results
compared to alternative decisions. Decision making was covered under five main headings: enhanced
information content in advanced warnings; enhanced information content at the crossing; information
credibility; distribution of information; and the costs of alternative actions.
Enhanced information for advance warnings
Advance warning only inform the driver that there is a crossing ahead. More information could be
provided. Active vs. passive crossings might benefit from different information; at least notification of
which kind of crossing is ahead. Active advanced warnings provide additional information which could
be especially valuable when sight distances are short. Different sight distances may require different
search strategies on the part of the driver and this could be indicated in advance of the crossing.
Advisory signs relating to approach speed, path, and braking have been suggested.
21 Leibowitz, H.W. (1985) op. cit.
69
Enhanced information at the crossing
The information presented at the crossing now is well known. Other information could be given
such as “Do Not Stop On Tracks” or some form of “It Is Safe To Proceed” sign. Information about
circuitry malfunction could also be provided. An amber warning could precede the red signal light. The
direction of the approaching train could be indicated but not by an arrow sign which could confuse the
driver since the meaning of train is approaching from the left vs. train is heading to your left is
ambiguous. Studies have shown that many drivers go through the red flashing signal and cross in front
of the approaching train when the train still distant (14 seconds on average in one study). Yield signs at
passive crossings (other than the crossbuck) have been proposed but improved performance has not
been demonstrated.
Information credibility
Signs which state that a crossing exists are credible because the crossing does in fact exist.
However, warning signs may have a credibility problem. The reason is that the frequency of trains at the
crossing is low. Extended warning times and false alarms also help to lower credibility. Constant
Warning Time (CWT) circuitry is the countermeasure for this problem. There is evidence to show the
effectiveness of CWT on driver behavior and accident rates.
Overall, little has been identified in the way of promising decision-error countermeasures that
address the relative costs of safe vs. unsafe actions.
Compliance
To improve drivers’ compliance with crossing laws and devices the following categories of
countermeasures have been suggested: enforcement; crossing traffic control device validity; use of
intersection-related traffic control devices with better compliance rates; and the perceived
reasonableness of driver requirements.
Enforcement is sporadic; officers are not routinely stationed at grade crossings although their
presence would undoubtedly improve compliance.
70
One program to improve traffic control device compliance is the “800” number posted at the
crossing for reporting signal malfunctions (Lamkin, 1985)22. In one year this program received 5,000
calls and 84 per cent of them concerned false alarms. False alarms reduce credibility. Lerner devoted
a short section to perceived reasonableness pointing out that drivers are more apt to obey traffic control
devices if they think they are reasonable.
An Appropriate View of the Driver
This section has particular significance for the Transitway safety project.
Lerner believes that our view of drivers involved in accidents includes ideas of inattention,
inappropriate speed, unnecessary risk-taking, disregard of signs and signals and the like. That is
accidents are completely assignable to avoidable driver error. Lerner presents different view quoted as
follows:
“The image of the more typical driver is that of a reasonable rational, if imperfect, decision maker,
who is trying to optimize his situation based on his knowledge and the facts at hand. He brings to this
task a variety of perceptions and opinions based on personal experience, and these have some validity.
He is not just relying on the formal information provided by the traffic engineer and the railroad. This
driver is probably quite familiar with the crossing site and has expectancies about its geometric,
operational, and hazard characteristics. At a personal level, the relative importance of some benefits or
costs may not be weighted the same as they would be for a highway safety specialist form his
perspective; ‘wrong’ actions could thus result not from errors as much as from different decision criteria.
Viewing the driver in this way, one can place potential safety treatments in the full context of the driver’s
decision making task.”
Lerner points out that for an average crossing, a driver could cross safely twice a day for fifteen
years even if the driver was deaf and blind to everything but the pavement directly in front of the vehicle
and even the worst driver would not be as oblivious as the hypothetical driver. This illustration may
partly explain the lack of correlation between accidents and knowledge of signs, signals and laws. At
the other end of the spectrum consider a driver who is completely concerned with compliance with
2222 Lamkin, J. (1985). The Texas grade crossing signal notification program: Call 1-800. Proceedings, 1985 National Conference on Highway-Rail Safety. Kansas City, MO, July 1985.
71
signs, signals, laws and crossing safety. This driver at least partially accounts for the statistic which
shows that for every train related accident at a crossing there are two non-train related accidents.
In the quotation above Lerner describes a driver as a decision maker with a difficult task. The
following quote from Lerner suggests a countermeasure for aiding this driver. “Given the view of the
driver as a reasonably rational decision maker facing a complex task under information constraints, what
are the implications for countermeasures? First, it would de-emphasize the approach of trying to instill
greater safety motivation or knowledge of rules and laws. While this is not to imply that there is not
merit in such efforts, they do not attack the crux of the decision making problem. Similarly it would
place less emphasis on passive signage that generally describes a desired action (e.g., slowing, looking)
that the driver may already recognize as an option. Again, this is not to imply such signs may be
without benefit; rather, the suggested view of the driver as a decision maker considering a variety of
information sources and behavioral option means that one cannot presume mechanistic compliance with
such signs. What is suggested by this perspective of the driver is that the roadway approach to the
crossing be viewed in a decision context, and that the decision task itself be as well-structured as
possible. The desired action should be obvious; other options should be eliminated or made less
desirable; extraneous concerns should not be present; and influence should be exerted early in the
decision chain.”
Sight Distance
All three types of sight distance are targets for countermeasures: visibility ahead to the crossing;
visibility along the track on the approach to the crossing (from the decision zone); and visibility along the
track when stopped at the crossing. Instead of a distance problem, sight distance can be considered as
a speed control problem. The sight distance required by the driver is determined by the train’s speed
and the vehicle’s speed and braking ability. A posted speed limit does not require a predetermined
sight distance. This viewpoint places difficult burdens on the driver and is not ideal from the driver’s
behavioral standpoint. Effective counter measures to address the sight distance problem need to adopt
realistic expectations about what drivers will do, what information they need and will use, and what
expectancies they bring to the situation. The Positive Guidance model might a useful tool for addressing
the sight distance problem.
72
Driver Familiarity with The Crossing
Most accidents involve victims that were familiar with the crossing. This suggest that passive
information will not be helpful because it will lose its salience. An intermittent police presence might be a
successful if impractical countermeasure.
Directed Visual Attention
Drivers detect trains visually and there are many factors which interfere with acquiring a train
visually. There is also the problem that visually searching for a train will divert attention from vehicle
control possibly resulting in single or multiple vehicle accidents at the crossing. Redundant information
using different sensory modes is a possible countermeasure. Rumble strips are a possibility but they
suffer the disadvantage of all passive devices in that they are present whether or not there is a train.
A System Perspective
The idea of a system perspective is that introducing CWT at a crossing may have a favorable effect
on credibility that drivers will generalize to other crossings. There is also a negative consequence. For
example as more active devices are added at crossings drivers may tend to believe that all crossings
have active devices.
Comparison of Flashing Light Signals with Traffic Control Signals
This comparison is reported in the form of a four page table. This table suggests that relative to the
traffic control signal, the railroad crossing flashing light presents a more ambiguous message about
appropriate driver actions.
73
APPENDIX B
Data Collection Sheet for Motorist Behavior at Intersections
1. Date: 2. Time of Day: 3. Intersection: 23rd Ave 25th Ave 29th Ave 30th Ave Malcolm Westgate Energy Park Dr Como Ave 4. Direction of Travel: North or South 5. Type of Vehicle: Car Light Truck Commercial Truck Semi-Truck 6. Type of Stop Complete Yield (rolling) Ran It Green Light 7. Did Motorist Look Both Ways? Yes No Unable to See 8. How Many Buses Were in Sight? 0, 1, 2, 3 9. Was There an Incident? Yes of No 10. Were Others Present on the Transitway? Bicyclist Pedestrians Inline Skaters
74
Police Other
75
(This page intentionally left blank)
76
APPENDIX C
Summaries of Transitway Accidents
04-14-92
to
06-01-98
Provided by Roger Huss,
Parking and Transportation Services
Formatting by Lowell A. Benson,
Center for Transportation Studies
77
Appendix C-1 Transitway Accidents Sorted by date
Medicine Lakes Line Bus unless otherwise noted.
Bus Other Vehicle No. Date Time Day Location Struck Type Action Notes 1 04/14/92 7:15 Tues Malcolm Other Car Straight 2 04/17/92 13:27 Fri 25th Ave. SE By Car Straight 3 06/02/92 16:05 Tues 30th Ave. SE By Co-Truck Straight 4 01/13/93 9:50 Wed 29th Ave. SE Other Pickup Straight 5 02/12/93 16:55 Fri Oak St. SE Other Car Straight 6 03/05/93 15:00 Fri Malcolm By Car Straight 7 08/03/93 13:41 Tues Westgate Drive Other Car Stopped 8 11/05/93 9:00 Fri Oak St. SE Other Car Straight 9 11/05/93 15:00 Fri Westgate Drive Other Pickup Straight 10 11/24/93 7:05 Wed Como Ave. By Car Passing 11 01/13/94 8:59 Thurs Como Ave. By Car Straight 12 03/01/94 13:25 Tues Como Ave. Other Car Straight 13 05/02/94 9:05 Mon Westgate Drive Other Pickup Straight 14 07/28/94 9:15 Thurs 25th Ave. SE Other Pickup Straight 15 09/26/94 10:10 Mon Malcolm Other Semi-Truck Straight 16 10/11/94 9:25 Tues Transit Park Lot Other Car Straight 17 01/09/95 16:07 Mon Malcolm By Sport Utility Straight 18 01/10/95 12:40 Tues Westgate Drive Other Car Straight 19 02/02/95 5:30 Thurs Energy Park Drive Other Car Straight 20 02/22/95 16:45 Wed Energy Park Drive By Pickup Following 21 11/27/95 15:15 Mon Energy Park Drive By Car Straight 22 02/27/96 7:45 Tues Como Ave. Other Pickup Straight 23 03/15/96 7:40 Fri 29th Ave. SE Other Semi-Truck Straight 24 06/11/96 9:10 Tues Malcolm By Semi-Truck Straight 25 10/11/96 16:46 Fri Energy Park Drive By Car Straight 26 10/15/96 14:39 Tues Energy Park Drive By Car Straight 27 11/22/96 17:55 Fri Westgate Drive Other Car Straight 28 01/08/97 13:04 Wed Malcolm By Car Straight 29 01/10/97 10:30 Fri Como Ave. By Car Straight 30 01/24/97 9:45 Fri Westgate Drive By Car Straight 31 07/11/97 13:30 Fri Westgate Drive Other Car Straight 32 10/20/97 10:05 Mon Transit Park Lot Other Roller Blader Straight 34 12/01/97 7:57 Mon Malcolm By Co-Truck Straight Metro
Transit** 33* 09/05/94 16:05 Mon Malcolm Other Co-Truck Straight MCTO** 35* 11/15/93 17:02 Mon Westgate Drive Other Straight PhyPlant *Not counted in initial analysis data **Metropolitan Council Transit Operations became Metro Transit in 1997
Note that Official operation began March 30, 1992 Chart below is through June 1998
Accidents per Year
0
1
2
3
4
5
6
7
8
9
1992* 1993 1994 1995 1996 1997 1998
Year
Co
un
t
CarsTotal
79
APPENDIX C-2
Transitway Accidents Sorted by Day
Bus Other Vehicle No. Date Time Day Location Struck Type Action 2 04/17/92 13:27 Fri 25th Ave. SE By Car Straight 23 03/15/96 7:40 Fri 29th Ave. SE Other Semi-Truck Straight 29 01/10/97 10:30 Fri Como Ave. By Car Straight 25 10/11/96 16:46 Fri Energy Park Drive By Car Straight 6 03/05/93 15:00 Fri Malcolm By Car Straight 8 11/05/93 9:00 Fri Oak St. SE Other Car Straight 5 02/12/93 16:55 Fri Oak St. SE Other Car Straight 30 01/24/97 9:45 Fri Westgate Drive By Car Straight 31 07/11/97 13:30 Fri Westgate Drive Other Car Straight 9 11/05/93 15:00 Fri Westgate Drive Other Pickup Straight 27 11/22/96 17:55 Fri Westgate Drive Other Car Straight 21 11/27/95 15:15 Mon Energy Park Drive By Car Straight 34 12/01/97 7:57 Mon Malcolm By Co-Truck Straight 15 09/26/94 10:10 Mon Malcolm Other Semi-Truck Straight 33* 09/05/94 16:05 Mon Malcolm Other Co-Truck Straight 17 01/09/95 16:07 Mon Malcolm By Sport Utility Straight 32 10/20/97 10:05 Mon Transit Park Lot Other Roller Blader Straight 13 05/02/94 9:05 Mon Westgate Drive Other Pickup Straight 35* 11/15/93 17:02 Mon Westgate Drive Other Straight 14 07/28/94 9:15 Thurs 25th Ave. SE Other Pickup Straight 11 01/13/94 8:59 Thurs Como Ave. By Car Straight 19 02/02/95 5:30 Thurs Energy Park Drive Other Car Straight 3 06/02/92 16:05 Tues 30th Ave. SE By Co-Truck Straight 22 02/27/96 7:45 Tues Como Ave. Other Pickup Straight 12 03/01/94 13:25 Tues Como Ave. Other Car Straight 26 10/15/96 14:39 Tues Energy Park Drive By Car Straight 1 04/14/92 7:15 Tues Malcolm Other Car Straight 24 06/11/96 9:10 Tues Malcolm By Semi-Truck Straight 16 10/11/94 9:25 Tues Transit Park Lot Other Car Straight 18 01/10/95 12:40 Tues Westgate Drive Other Car Straight 7 08/03/93 13:41 Tues Westgate Drive Other Car Stopped 4 01/13/93 9:50 Wed 29th Ave. SE Other Pickup Straight 10 11/24/93 7:05 Wed Como Ave. By Car Passing 20 02/22/95 16:45 Wed Energy Park Drive By Pickup Following 28 01/08/97 13:04 Wed Malcolm By Car Straight
Note that the bus system does not operate during the weekends.
80
Appendix C-3
Transitway Accidents Sorted by Location
No. Date Time Day LOCATION Struck Vehicle Type Direction 2 4/17/1992 13:27 Fri 25th Ave. SE By Car Straight 14 07/28/94 9:15 Thurs 25th Ave. SE Other Pickup Straight 23 03/15/96 7:40 Fri 29th Ave. SE Other Semi-Truck Straight 4 01/13/93 9:50 Wed 29th Ave. SE Other Pickup Straight 3 06/02/92 16:05 Tues 30th Ave. SE By Co-Truck Straight 29 01/10/97 10:30 Fri Como Ave. By Car Straight 11 01/13/94 8:59 Thurs Como Ave. By Car Straight 22 02/27/96 7:45 Tues Como Ave. Other Pickup Straight 12 03/01/94 13:25 Tues Como Ave. Other Car Straight 10 11/24/93 7:05 Wed Como Ave. By Car Passing 25 10/11/96 16:46 Fri Energy Park Drive By Car Straight 21 11/27/95 15:15 Mon Energy Park Drive By Car Straight 19 02/02/95 5:30 Thurs Energy Park Drive Other Car Straight 26 10/15/96 14:39 Tues Energy Park Drive By Car Straight 20 02/22/95 16:45 Wed Energy Park Drive By Pickup Following 6 03/05/93 15:00 Fri Malcolm By Car Straight 34 12/01/97 7:57 Mon Malcolm By Co-Truck Straight 15 09/26/94 10:10 Mon Malcolm Other Semi-Truck Straight
33* 09/05/94 16:05 Mon Malcolm Other Co-Truck Straight 17 01/09/95 16:07 Mon Malcolm By Sport Utility Straight 1 04/14/92 7:15 Tues Malcolm Other Car Straight 24 06/11/96 9:10 Tues Malcolm By Semi-Truck Straight 28 01/08/97 13:04 Wed Malcolm By Car Straight 8 11/05/93 9:00 Fri Oak St. SE Other Car Straight 5 02/12/93 16:55 Fri Oak St. SE Other Car Straight 32 10/20/97 10:05 Mon Transit Park Lot Other Roller Blader Straight 16 10/11/94 9:25 Tues Transit Park Lot Other Car Straight 30 01/24/97 9:45 Fri Westgate Drive By Car Straight 31 07/11/97 13:30 Fri Westgate Drive Other Car Straight 9 11/05/93 15:00 Fri Westgate Drive Other Pickup Straight 27 11/22/96 17:55 Fri Westgate Drive Other Car Straight 13 05/02/94 9:05 Mon Westgate Drive Other Pickup Straight
35* 11/15/93 17:02 Mon Westgate Drive Other Straight 18 01/10/95 12:40 Tues Westgate Drive Other Car Straight 7 08/03/93 13:41 Tues Westgate Drive Other Car Stopped
81
APPENDIX C-4
Transitway Accidents Sorted by Vehicle
Bus Other Vehicle No. Date Time Day Location Struck Type Action 2 04/17/92 13:27 Fri 25th Ave. SE By Car Straight 29 01/10/97 10:30 Fri Como Ave. By Car Straight 11 01/13/94 8:59 Thurs Como Ave. By Car Straight 12 03/01/94 13:25 Tues Como Ave. Other Car Straight 10 11/24/93 7:05 Wed Como Ave. By Car Passing 25 10/11/96 16:46 Fri Energy Park Drive By Car Straight 21 11/27/95 15:15 Mon Energy Park Drive By Car Straight 19 02/02/95 5:30 Thurs Energy Park Drive Other Car Straight 26 10/15/96 14:39 Tues Energy Park Drive By Car Straight 6 03/05/93 15:00 Fri Malcolm By Car Straight 1 04/14/92 7:15 Tues Malcolm Other Car Straight 28 01/08/97 13:04 Wed Malcolm By Car Straight 5 02/12/93 16:55 Fri Oak St. SE Other Car Straight 8 11/05/93 9:00 Fri Oak St. SE Other Car Straight 16 10/11/94 9:25 Tues Transit Park Lot Other Car Straight 27 11/22/96 17:55 Fri Westgate Drive Other Car Straight 30 01/24/97 9:45 Fri Westgate Drive By Car Straight 31 07/11/97 13:30 Fri Westgate Drive Other Car Straight 7 08/03/93 13:41 Tues Westgate Drive Other Car Stopped 18 01/10/95 12:40 Tues Westgate Drive Other Car Straight 3 06/02/92 16:05 Tues 30th Ave. SE By Co-Truck Straight
33* 09/05/94 16:05 Mon Malcolm Other Co-Truck Straight 34 12/01/97 7:57 Mon Malcolm By Co-Truck Straight 14 07/28/94 9:15 Thurs 25th Ave. SE Other Pickup Straight 22 02/27/96 7:45 Tues Como Ave. Other Pickup Straight 20 02/22/95 16:45 Wed Energy Park Drive By Pickup Following 9 11/05/93 15:00 Fri Westgate Drive Other Pickup Straight 13 05/02/94 9:05 Mon Westgate Drive Other Pickup Straight 4 01/13/93 9:50 Wed 29th Ave. SE Other Pickup Straight 32 10/20/97 10:05 Mon Transit Park Lot Other Roller Blader Straight 23 03/15/96 7:40 Fri 29th Ave. SE Other Semi-Truck Straight 15 09/26/94 10:10 Mon Malcolm Other Semi-Truck Straight 24 06/11/96 9:10 Tues Malcolm By Semi-Truck Straight 17 01/09/95 16:07 Mon Malcolm By Sport Utility Straight 35* 11/15/93 17:02 Mon Westgate Drive Other Straight
82
APPENDIX C-5
Transitway Accidents Sorted by Month
Bus Other Vehicle No. Date Time Day Location Struck Type Action 4 01/13/93 9:50 Wed 29th Ave. SE Other Pickup Straight 11 01/13/94 8:59 Thurs Como Ave. By Car Straight 17 01/09/95 16:07 Mon Malcolm By Sport Utility Straight 18 01/10/95 12:40 Tues Westgate Drive Other Car Straight 28 01/08/97 13:04 Wed Malcolm By Car Straight 29 01/10/97 10:30 Fri Como Ave. By Car Straight 30 01/24/97 9:45 Fri Westgate Drive By Car Straight 5 02/12/93 16:55 Fri Oak St. SE Other Car Straight 19 02/02/95 5:30 Thurs Energy Park Drive Other Car Straight 20 02/22/95 16:45 Wed Energy Park Drive By Pickup Following 22 02/27/96 7:45 Tues Como Ave. Other Pickup Straight 6 03/05/93 15:00 Fri Malcolm By Car Straight 12 03/01/94 13:25 Tues Como Ave. Other Car Straight 23 03/15/96 7:40 Fri 29th Ave. SE Other Semi-Truck Straight 1 04/14/92 7:15 Tues Malcolm Other Car Straight 2 04/17/92 13:27 Fri 25th Ave. SE By Car Straight 13 05/02/94 9:05 Mon Westgate Drive Other Pickup Straight 3 06/02/92 16:05 Tues 30th Ave. SE By Co-Truck Straight 24 06/11/96 9:10 Tues Malcolm By Semi-Truck Straight 14 07/28/94 9:15 Thurs 25th Ave. SE Other Pickup Straight 31 07/11/97 13:30 Fri Westgate Drive Other Car Straight 7 08/03/93 13:41 Tues Westgate Drive Other Car Stopped
33* 09/05/94 16:05 Mon Malcolm Other Co-Truck Straight 15 09/26/94 10:10 Mon Malcolm Other Semi-Truck Straight 16 10/11/94 9:25 Tues Transit Park Lot Other Car Straight 25 10/11/96 16:46 Fri Energy Park Drive By Car Straight 26 10/15/96 14:39 Tues Energy Park Drive By Car Straight 32 10/20/97 10:05 Mon Transit Park Lot Other Roller Blader Straight 8 11/05/93 9:00 Fri Oak St. SE Other Car Straight 9 11/05/93 15:00 Fri Westgate Drive Other Pickup Straight
35* 11/15/93 17:02 Mon Westgate Drive Other Straight 10 11/24/93 7:05 Wed Como Ave. By Car Passing 21 11/27/95 15:15 Mon Energy Park Drive By Car Straight 27 11/22/96 17:55 Fri Westgate Drive Other Car Straight 34 12/01/97 7:57 Mon Malcolm By Co-Truck Straight
83
APPENDIX C-6
Transitway Accidents Sorted by Time of Day
Bus Other Vehicle No. Date Time Day Location Struck Type Action 19 02/02/95 5:30 Thurs Energy Park Drive Other Car Straight 10 11/24/93 7:05 Wed Como Ave. By Car Passing 1 04/14/92 7:15 Tues Malcolm Other Car Straight 23 03/15/96 7:40 Fri 29th Ave. SE Other Semi-Truck Straight 22 02/27/96 7:45 Tues Como Ave. Other Pickup Straight 34 12/01/97 7:57 Mon Malcolm By Co-Truck Straight 11 01/13/94 8:59 Thurs Como Ave. By Car Straight 8 11/05/93 9:00 Fri Oak St. SE Other Car Straight 13 05/02/94 9:05 Mon Westgate Drive Other Pickup Straight 24 06/11/96 9:10 Tues Malcolm By Semi-Truck Straight 14 07/28/94 9:15 Thurs 25th Ave. SE Other Pickup Straight 16 10/11/94 9:25 Tues Transit Park Lot Other Car Straight 30 01/24/97 9:45 Fri Westgate Drive By Car Straight 4 01/13/93 9:50 Wed 29th Ave. SE Other Pickup Straight 32 10/20/97 10:05 Mon Transit Park Lot Other Roller Blader Straight 15 09/26/94 10:10 Mon Malcolm Other Semi-Truck Straight 29 01/10/97 10:30 Fri Como Ave. By Car Straight 18 01/10/95 12:40 Tues Westgate Drive Other Car Straight 28 01/08/97 13:04 Wed Malcolm By Car Straight 12 03/01/94 13:25 Tues Como Ave. Other Car Straight 2 04/17/92 13:27 Fri 25th Ave. SE By Car Straight 31 07/11/97 13:30 Fri Westgate Drive Other Car Straight 7 08/03/93 13:41 Tues Westgate Drive Other Car Stopped 26 10/15/96 14:39 Tues Energy Park Drive By Car Straight 6 03/05/93 15:00 Fri Malcolm By Car Straight 9 11/05/93 15:00 Fri Westgate Drive Other Pickup Straight 21 11/27/95 15:15 Mon Energy Park Drive By Car Straight 3 06/02/92 16:05 Tues 30th Ave. SE By Co-Truck Straight
33* 09/05/94 16:05 Mon Malcolm Other Co-Truck Straight 17 01/09/95 16:07 Mon Malcolm By Sport Utility Straight 20 02/22/95 16:45 Wed Energy Park Drive By Pickup Following 25 10/11/96 16:46 Fri Energy Park Drive By Car Straight 5 02/12/93 16:55 Fri Oak St. SE Other Car Straight
35* 11/15/93 17:02 Mon Westgate Drive Other Straight 27 11/22/96 17:55 Fri Westgate Drive Other Car Straight
84
APPENDIX C-7
Transitway Accidents Sorted by Action of the Crossing Vehicle
Bus Other Vehicle No. Date Time Day Location Struck Type Action 20 02/22/95 16:45 Wed Energy Park Drive By Pickup Following 10 11/24/93 7:05 Wed Como Ave. By Car Passing 7 08/03/93 13:41 Tues Westgate Drive Other Car Stopped 2 04/17/92 13:27 Fri 25th Ave. SE By Car Straight 14 07/28/94 9:15 Thurs 25th Ave. SE Other Pickup Straight 23 03/15/96 7:40 Fri 29th Ave. SE Other Semi-Truck Straight 4 01/13/93 9:50 Wed 29th Ave. SE Other Pickup Straight 3 06/02/92 16:05 Tues 30th Ave. SE By Co-Truck Straight 29 01/10/97 10:30 Fri Como Ave. By Car Straight 11 01/13/94 8:59 Thurs Como Ave. By Car Straight 12 03/01/94 13:25 Tues Como Ave. Other Car Straight 22 02/27/96 7:45 Tues Como Ave. Other Pickup Straight 25 10/11/96 16:46 Fri Energy Park Drive By Car Straight 21 11/27/95 15:15 Mon Energy Park Drive By Car Straight 19 02/02/95 5:30 Thurs Energy Park Drive Other Car Straight 26 10/15/96 14:39 Tues Energy Park Drive By Car Straight 6 03/05/93 15:00 Fri Malcolm By Car Straight
33* 09/05/94 16:05 Mon Malcolm Other Co-Truck Straight 15 09/26/94 10:10 Mon Malcolm Other Semi-Truck Straight 17 01/09/95 16:07 Mon Malcolm By Sport Utility Straight 34 12/01/97 7:57 Mon Malcolm By Co-Truck Straight 1 04/14/92 7:15 Tues Malcolm Other Car Straight 24 06/11/96 9:10 Tues Malcolm By Semi-Truck Straight 28 01/08/97 13:04 Wed Malcolm By Car Straight 5 02/12/93 16:55 Fri Oak St. SE Other Car Straight 8 11/05/93 9:00 Fri Oak St. SE Other Car Straight 32 10/20/97 10:05 Mon Transit Park Lot Other Roller Blader Straight 16 10/11/94 9:25 Tues Transit Park Lot Other Car Straight 9 11/05/93 15:00 Fri Westgate Drive Other Pickup Straight 27 11/22/96 17:55 Fri Westgate Drive Other Car Straight 30 01/24/97 9:45 Fri Westgate Drive By Car Straight 31 07/11/97 13:30 Fri Westgate Drive Other Car Straight 35* 11/15/93 17:02 Mon Westgate Drive Other Straight 13 05/02/94 9:05 Mon Westgate Drive Other Pickup Straight 18 01/10/95 12:40 Tues Westgate Drive Other Car Straight
85
APPENDIX C-8
Transitway Accidents Sorted by the Object Struck
Bus Other Vehicle No. Date Time Day Location Struck Type Action 2 04/17/92 13:27 Fri 25th Ave. SE By Car Straight 3 06/02/92 16:05 Tues 30th Ave. SE By Co-Truck Straight 29 01/10/97 10:30 Fri Como Ave. By Car Straight 11 01/13/94 8:59 Thurs Como Ave. By Car Straight 10 11/24/93 7:05 Wed Como Ave. By Car Passing 25 10/11/96 16:46 Fri Energy Park Drive By Car Straight 21 11/27/95 15:15 Mon Energy Park Drive By Car Straight 26 10/15/96 14:39 Tues Energy Park Drive By Car Straight 20 02/22/95 16:45 Wed Energy Park Drive By Pickup Following 6 03/05/93 15:00 Fri Malcolm By Car Straight 17 01/09/95 16:07 Mon Malcolm By Sport Utility Straight 34 12/01/97 7:57 Mon Malcolm By Co-Truck Straight 24 06/11/96 9:10 Tues Malcolm By Semi-Truck Straight 28 01/08/97 13:04 Wed Malcolm By Car Straight 30 01/24/97 9:45 Fri Westgate Drive By Car Straight 14 07/28/94 9:15 Thurs 25th Ave. SE Other Pickup Straight 23 03/15/96 7:40 Fri 29th Ave. SE Other Semi-Truck Straight 4 01/13/93 9:50 Wed 29th Ave. SE Other Pickup Straight 12 03/01/94 13:25 Tues Como Ave. Other Car Straight 22 02/27/96 7:45 Tues Como Ave. Other Pickup Straight 19 02/02/95 5:30 Thurs Energy Park Drive Other Car Straight
33* 09/05/94 16:05 Mon Malcolm Other Co-Truck Straight 15 09/26/94 10:10 Mon Malcolm Other Semi-Truck Straight 1 04/14/92 7:15 Tues Malcolm Other Car Straight 5 02/12/93 16:55 Fri Oak St. SE Other Car Straight 8 11/05/93 9:00 Fri Oak St. SE Other Car Straight 32 10/20/97 10:05 Mon Transit Park Lot Other Roller Blader Straight 16 10/11/94 9:25 Tues Transit Park Lot Other Car Straight 9 11/05/93 15:00 Fri Westgate Drive Other Pickup Straight 27 11/22/96 17:55 Fri Westgate Drive Other Car Straight 31 07/11/97 13:30 Fri Westgate Drive Other Car Straight
35* 11/15/93 17:02 Mon Westgate Drive Other Straight 13 05/02/94 9:05 Mon Westgate Drive Other Pickup Straight 7 08/03/93 13:41 Tues Westgate Drive Other Car Stopped 18 01/10/95 12:40 Tues Westgate Drive Other Car Straight
86
APPENDIX C-9
Transitway Accidents sorted by Count
Bus Other Vehicle
No. Date Time Day Location Struck Type Action Notes 1 04/14/92 7:15 Tues Malcolm Other Car Straight 2 04/17/92 13:27 Fri 25th Ave. SE By Car Straight 3 06/02/92 16:05 Tues 30th Ave. SE By Co-Truck Straight 4 01/13/93 9:50 Wed 29th Ave. SE Other Pickup Straight 5 02/12/93 16:55 Fri Oak St. SE Other Car Straight 6 03/05/93 15:00 Fri Malcolm By Car Straight 7 08/03/93 13:41 Tues Westgate Drive Other Car Stopped 8 11/05/93 9:00 Fri Oak St. SE Other Car Straight 9 11/05/93 15:00 Fri Westgate Drive Other Pickup Straight 10 11/24/93 7:05 Wed Como Ave. By Car Passing 11 01/13/94 8:59 Thurs Como Ave. By Car Straight 12 03/01/94 13:25 Tues Como Ave. Other Car Straight 13 05/02/94 9:05 Mon Westgate Drive Other Pickup Straight 14 07/28/94 9:15 Thurs 25th Ave. SE Other Pickup Straight 15 09/26/94 10:10 Mon Malcolm Other Semi-Truck Straight 16 10/11/94 9:25 Tues Transit Park Lot Other Car Straight 17 01/09/95 16:07 Mon Malcolm By Sport Utility Straight 18 01/10/95 12:40 Tues Westgate Drive Other Car Straight 19 02/02/95 5:30 Thurs Energy Park Drive Other Car Straight 20 02/22/95 16:45 Wed Energy Park Drive By Pickup Following 21 11/27/95 15:15 Mon Energy Park Drive By Car Straight 22 02/27/96 7:45 Tues Como Ave. Other Pickup Straight 23 03/15/96 7:40 Fri 29th Ave. SE Other Semi-Truck Straight 24 06/11/96 9:10 Tues Malcolm By Semi-Truck Straight 25 10/11/96 16:46 Fri Energy Park Drive By Car Straight 26 10/15/96 14:39 Tues Energy Park Drive By Car Straight 27 11/22/96 17:55 Fri Westgate Drive Other Car Straight 28 01/08/97 13:04 Wed Malcolm By Car Straight 29 01/10/97 10:30 Fri Como Ave. By Car Straight 30 01/24/97 9:45 Fri Westgate Drive By Car Straight 31 07/11/97 13:30 Fri Westgate Drive Other Car Straight 32 10/20/97 10:05 Mon Transit Park Lot Other Roller Blader Straight 34 12/01/97 7:57 Mon Malcolm By Co-Truck Straight Metro Transit**
33* 09/05/94 16:05 Mon Malcolm Other Co-Truck Straight MCTO** 35* 11/15/93 17:02 Mon Westgate Drive Other Straight PhyPlant
• Not counted in initial analysis data • **Metropolitan Council transit Operations became Metro Transit in 1997