http://peeg.wordpress.com Papers in Evolutionary Economic Geography # 20.10 Is innovation (increasingly) concentrated in large cities? An international comparison Michael Fritsch and Michael Wyrwich
Transcript
http://peeg.wordpress.com
Papers in Evolutionary Economic Geography
# 20.10
Is innovation (increasingly) concentrated in large cities? An international comparison
Michael Fritsch and Michael Wyrwich
Is innovation (increasingly) concentrated in large cities? An international comparison
Michael Fritscha
Michael Wyrwichb
February 2020
Abstract
We investigate the geographic concentration of patenting in large cities using a sample of 14 developed countries. There is wide dispersion of the share of patented inventions in large metropolitan areas. South Korea and the US are two extreme outliers where patenting is highly concentrated in large cities. We do not find any general trend that there is a geographic concentration of patents for the period 2000-2014. There is also no general trend that inventors in large cities have more patents than in rural areas (scaling). Hence, while agglomeration economies of large cities may offer advantages for innovation activities, the extent of these advantages is not very large. We conclude that popular theories over-emphasize the importance of large cities for innovation activities.
a) Friedrich Schiller University Jena and Halle Institute for Economic Research (IWH), Germany. [email protected]
b) University of Groningen, The Netherlands and Friedrich Schiller University Jena, Germany. [email protected]
1
1. Introduction: Large cities and innovation1
Large cities appear to have many advantages over rural areas, one such
advantage is commonly known as agglomeration economies (Duranton
and Puga 2004; Glaeser 2011; Jacobs 1969). Based on claims about the
effectiveness of agglomeration economies, many scholars argue that large
cities are ‘innovation machines’ and that agglomeration economies are a
requirement for successful innovation activity (Carlino and Kerr 2015;
Florida, Adler and Mellander 2017). Some scholars go so far as to take
this widespread belief that innovation activities are considerably more
successful and productive in large cities to suggest that policy attempts to
stimulate innovation in non-urban areas are ineffective and a waste of
resources (see, for example, Glaeser and Hausman 2019).
This paper investigates and compares the geographic
concentration of patents in a number of developed market economies. We
find a wide dispersion of the share of patenting in large metropolitan areas
among the countries of our sample. While South Korea and the US are
two ‘outliers’ with an extremely high concentration of patents in some large
metropolitan areas, this type of concentration is much less pronounced in
the other countries of our sample. Moreover, it is often not the largest
metropolitan areas that have the highest shares of patents. A further
important finding is that inventors in large metropolitan areas do not have
more patents than inventors located in non-urban areas. We do not find a
general trend of increasing geographic concentration of patents over the
2000-2014 period. In fact, there are more countries where the
concentration of patents in large metropolitan areas is decreasing than
countries where this type of concentration has increased.
Our results challenge the belief that innovative activity occurs
mostly in large cities (Florida, Adler and Mellander 2017). We argue that
empirical evidence of regional innovative activity based on the rather
1 We are indebted to Maria Kristalova, Frank Neffke, and Korneliusz Pylak for helpful comments on an earlier version of this paper.
2
special case of the US should be regarded with great caution. It seems
obvious that drawing generalizations based on evidence from a single
country may not be valid for other countries. Such generalizations may
ignore other important factors or economic realities that exist in other
countries. Based on the results of our research, we conclude that
agglomeration economies are much less important for innovation activities
as is suggested by some popular theories.
The paper is structured as follows. The next section (Section 2)
provides an overview of the arguments for the claim that large cities are a
prerequisite for successful innovation activity. Section 3 introduces the
data and the definition of spatial categories employed in our research. We
then compare the shares of patents in different spatial categories (Section
4), and analyze geographic concentrations in general (Section 5). Section
6 summarizes our findings and discusses the outcomes, offers some
thoughts about theory and policy, and outlines some important avenues
for further research.
2. Why successful innovation activity might occur mostly in large cities
Empirical research suggests that innovation activity is geographically
concentrated in large cities than population or the general production of
goods and services (Feldman and Kogler 2010; Bettencourt, Lobo and
Strumsky 2007; Carlino and Kerr 2015). The common interpretation of this
result is that large cities have a locational advantage with regard to
innovation activity over less densely populated areas (Glaeser 2011;
Glaeser and Hausman 2019). To test this hypothesis, some authors
regress the number of patents on the regional population, or the number of
inventors in a region.2 These studies find that larger cities tend to have
more patents per population than smaller cities. This effect of ‘urban
2 Bettencourt, Lobo and Strumsky (2007), Bettencourt and Lobo (2016), Bettencourt (2013), Gomez-Lievano, Patterson-Lomba and Hausmann (2017).
3
scaling’ is obviously due to the fact that larger cities also tend to have a
higher share of inventors.
A common explanation for higher levels of innovative activity in
large cities builds on the effect of agglomeration economies. Literature
mentions four reasons why large cities may be favorable places for
innovative activity (see Duranton and Puga 2004; Puga 2010; Carlino and
Kerr 2015), particularly when compared to rural or peripheral regions.
First, large cities tend to have a rich endowment of R&D facilities (such
as universities, other public research institutes), and innovative private
sector firms (‘sharing’).
Second, large cities have abundant input markets that stimulate R&D
that provide a better and more productive match of inputs (‘matching’)
(Helsley and Strange 2002, 2011).
Third, the rich endowment of R&D facilities found in large cities provide
more knowledge spillovers due to the spatial proximity and cooperation
of R&D actors (‘learning’).3
Fourth, Large cities may be highly attractive places for creative people
(Florida 2002; Florida, Adler and Mellander 2017). In this way, large
cities benefit from inflows of talent and new knowledge from other areas
that strengthens the quality of the regional workforce there. This
redistribution of talent comes at the expense of other areas.
Although these advantages of large cities (Bettencourt 2013) are
undisputed, cities also have diseconomies such as high levels of crime,
pollution, traffic congestion etc. Moreover, the relatively easy flow of
knowledge that occurs within cities may be considered a disadvantage for
firms that want to keep their knowledge secret.
What is still rather unclear is how the disadvantages and other
potentially negative factors of agglomerations impact its assets. While
some scholars assume that the agglomeration advantages are rather
3 Bettencourt, Lobo and Strumsky (2007), Breschi and Lenzi (2006).
4
dominant,4 others are more cautious in this respect. One important
objection against the simple ‘innovation requires large cities’ argument is
that cities should not be considered in isolation, but rather in the context of
the whole spatial system of a set of locations. In other words, large cities
rarely exist in spatial isolation. Instead, large cities spatially exist and
interact with smaller cities and less populated areas, and the geographic
distances of the spatial system introduce important idiosyncrasies
(Crescenzi, Rodriguez-Posé and Storper 2007; Bettencourt and Lobo
2016). If distances between cities are relatively small—as is the case in
many parts of Europe—division of innovative labor between cities and
inter-agglomeration spillovers may be much more pronounced than in a
constellation where geographic distances between the main
agglomerations are rather large, as is the case in the US.5
A frequently heard argument promoting large cities is their higher
productivity (Ciccone and Hall 1996; Ciccone 2000) that is reflected in
higher wages, the so-called ‘urban wage premium’.6 This is, however, of
limited relevance for innovation activity because higher productivity is a
static phenomenon while innovation is an inherently dynamic process.
Hence, for successful innovation it is particularly important that places are
able to manage and adapt to change. We are not aware of any study that
provides robust empirical evidence of higher productivity of innovative
activity in larger cities.7 There are, however, quite a number of examples
of economic success taking place in larger cities that did not persist when
4 For example, Florida, Adler, and Mellander (2017, 93) state that “…innovation and entrepreneurship do not simply take place in but require cities.”
5 As a consequence, Crescenzi, Rodriguez-Posé, and Storper (2007, 686f.) speculate that “the higher average population density of the EU, with major metropolitan areas relatively closer together than in the US (where instead metropolitan areas are farther away from one another), may allow a more intensive Continent-wide circulation of knowledge, and possibly limit the distance decay of useful knowledge”.
6 Carlino and Kerr (2015), Faberman and Freedman (2016), Glaeser and Maré (2001), Puga (2010), Neffke (2017).
7 Moretti (2019), in a recent analysis for the USA, distinguishes a number of technological fields and finds that the number of patents per inventor in a certain field increases with the size of the cluster (not city size) measured as the number of regional inventors that have patents in the respective field.
5
the given products and technologies mature and are replaced by new and
more relevant fields of knowledge (Storper 2018).8
It is quite remarkable that many studies of the relationship between
innovation and city-size disregard rural areas and, therefore, cannot make
comparisons between cities and non-agglomerated areas. Despite this,
there are a few studies that focus on successfully innovating firms in rural
and peripheral areas.9
Research on regional innovative activity has identified many factors
other than city size and settlement structure that may be relevant for
regional innovation activities. These other influences include: institutional
conditions, the population’s age structure, the sectoral composition of the
local economy and the type of knowledge base, the quantity and the
quality of the available human and social capital, as well as regional and
national cultures (Asheim, Isaksen and Trippl 2019; Crescenzi and
Rodriguez-Posé 2013; Fritsch and Slavtchev 2011).
3. Data and definitions
3.1 Patents as an indicator for innovation activities
Patents is the only available indicator for innovation activity that allows for
a comparison of the geographic structure across a larger number of
countries. Although a patent represents an invention and not its
application in a new process or product, it indicates an intermediate result
of innovation effort.
Patents as innovation indicator have a number of advantages and
disadvantages (for an overview see Griliches 1990, and Nagaoka,
Motohashi and Goto 2010). A main advantage of patents is that obtaining
a patent requires a certain level of ‘newness’ that secures comparability
across countries and regions. The patent data include considerable
8 Well-known examples are old industrialized areas such as the German Ruhr area, Detroit in the US, or Glasgow in Scotland.
9 E.g., Fritsch and Wyrwich (2020), Graffenberger et al. (2019), Grillitsch and Nilsson (2015).
6
information, such as: the technological field according to the International
Patent Classification, the date of application, name(s) and address(es) of
the applicant(s) as well as name and address of each of the inventors.
Patents are taken from the OECD regional patent database (RegPat) and
are assigned to the region in which the inventor claims his or her
residence. If a patent has more than one inventor, the count is divided by
the number of inventors and each inventor is assigned his or her share of
that patent.
Using patents as a measure of economic activity may have some
shortcomings. One disadvantage of patents can be seen in the fact that
they represent only the first stage of an innovation process. Hence, one
does not know if or where the invention will become a marketable product
market novelty (Feldman and Kogler 2010). There is also a clear indication
that the economic value of patents considerably varies, indicating that their
economic impact is unpredictable.10 Another critical issue is that not all
firms or inventors use patents as a way to protect their intellectual property
(Cohen, Nelson and Walsh 2000; Blind et al. 2006). Hence, not all
inventions are patented. Moreover, some inventors obtain a number of
related patents for basically the same invention in order to block follow-up
patents by rivals.
3.2 Sample
For an international comparison of the spatial concentration of patenting
activity across countries, we not only include the G7 countries,11 but also
consider some other highly developed countries, namely: Sweden, South
Korea, Switzerland, and Spain. Finally, we also include the Czech
Republic, Poland, and Hungary as examples of post-socialist transition
countries. We assume that Sweden and South Korea will reveal a
pronounced geographic concentration of innovative activities due to the
10 The distribution of the economic value of patents appears to be highly skewed. While a few patents are extremely valuable, most patents are not worth much (Harhoff, Narin, Scherer and Vopel 1999; Harhoff, Scherer and Vopel 2003).
11 The G7 countries are Canada, France, Germany, the United Kingdom, Italy, Japan, and the US.
7
high share of the population of these two countries in and around their
capital cities, Stockholm and Seoul. The same is to be expected, although
to a somewhat lesser degree, for the United Kingdom (Greater London),
France (Paris/Ile-de-France), Hungary (Budapest), and Japan, where
population is concentrated mainly in the metropolitan areas of Tokyo and
Osaka.
The US is geographically much larger than the European countries,
with a considerably lower population density and higher geographic
concentration of population in large cities. Accordingly, innovative activity
in the US may be strongly clustered in some regions as well. Another
characteristic of the US is the relatively greater distances between large
metropolitan areas that may work as an impediment to an inter-regional
division of innovative labor (Crescenzi, Rodriguez-Posé and Storper
2007). Germany, Italy, Spain, and Switzerland are characterized by
decentralized political and economic structures caused by historical
developments.
There are considerable differences with regard to the number of
patents per 10,000 population between the countries of or our sample (see
Table A2). Switzerland, Sweden, Japan, Germany and South Korea have
the highest rates, followed with some distance by the US. The lowest rates
are found for the three former socialist countries of Eastern Europe
Poland, Hungary and the Czech Republic.
3.3 Regional categories
In our analysis we follow the OECD definition of functional urban areas
(OECD 2012). These areas are geographic units characterized by one or
more cities (the core) and a commuting zone that is interconnected with
the city. A city is a local administrative unit where at least 50% of its
population live in an urban center. An urban center is defined as an area
with a density of at least 1,500 population per km2, and an overall
population of at least 50,000. The commuting zone is defined by local
administrative units for which at least 15% of the workforce commute to
the city. Commuting zones of the functional areas are identified based on
8
commuting data (travel from home-to-work). In the assessment, we
distinguish between large metropolitan areas (population >1.5 million),
metropolitan areas (population = 250,000 to 1.5 million), non-metropolitan
areas (population <250,000), and regions that are not part of a functional
urban area.12
The official OECD definition of functional urban areas does not
exactly resemble the borders defined by official statistical areas (TL3
regions) for which our patent data are available. Therefore, we include TL3
regions (NUTS3 regions in European Union countries) as part of functional
urban areas if the bulk share of the TL3 region is part of the commuting
zone of the urban center. Since it might be the case that NUTS3 regions
host a metropolitan area and some smaller parts of non-metropolitan
space, we may slightly overestimate the patent share of (large)
metropolitan areas. TL3 regions are also used in our regression analysis
of urban scaling patterns (Section 4.4) where we apply the same logic.
Table A1 in the Appendix displays the number of regions in the different
spatial categories per country of our sample.13
4. The spatial structure of innovative activity across countries
4.1 Metropolitan and non-metropolitan areas
We first investigate the contribution of a country’s large metropolitan areas
to the national share of patents (Table 1).14 The motivation for taking this
12 In their analysis, Paunov et al. (2019) define all functional urban areas as “cities” while our focus is on functional urban areas that the OECD defines as metropolitan areas or large metropolitan areas. In contrast to our approach, their analysis also does not consider regions that are not part of a functional urban areas in.
13 It should be noted that the size and number of TL3 regions differs across countries. Hence, in countries where TL3 regions are relatively large, metropolitan areas can comprise larger parts of surrounding area than in countries where TL3 regions are smaller, making the definition less precise. As a consequence, our data has a slight tendency of assigning more patents to metropolitan areas in countries with larger TL3 regions.
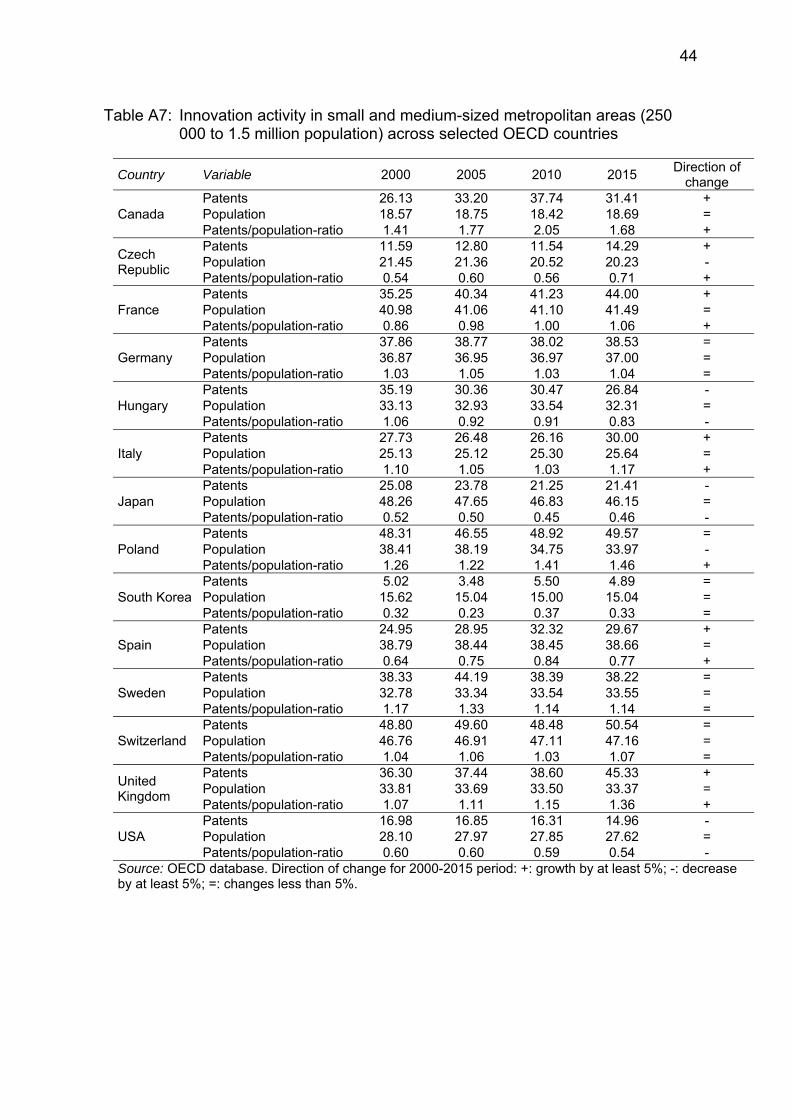
14 Switzerland has to be excluded from this analysis because the country does not have any metropolitan areas according to the OECD definition (see Section 3.3). For results on innovative activity in small and medium-sized metropolitan areas (population=250,000 to 1.5 million) across selected OECD countries, see Table A6 in the Appendix.
9
Table 1: Shares of patents and population (in %) in large metropolitan areas (population >1.5 million) across selected OECD countries
Country Variable 2000 2005 2010 2014 Change
2014/2000
Canada Patents 45.63 40.22 36.42 42.55 0.93
Population 31.36 32.15 32.72 33.27 1.06
Patents/population ratio 1.46 1.25 1.11 1.28 0.88
Czech Republic
Patents 73.43 70.14 67.83 69.10 0.94
Population 27.93 28.14 29.47 30.02 1.07
Patents/population ratio 2.63 2.49 2.30 2.30 0.88
France Patents 48.59 44.21 43.79 43.36 0.89
Population 26.10 26.23 26.28 26.35 1.01
Patents/population ratio 1.86 1.69 1.67 1.65 0.88
Germany Patents 38.97 35.76 35.35 36.44 0.94
Population 29.50 29.72 30.19 30.56 1.04
Patents/population ratio 1.32 1.20 1.17 1.19 0.90
Hungary Patents 31.48 41.32 36.33 29.74 0.94
Population 22.35 22.60 23.66 24.21 1.08
Patents/population ratio 1.41 1.83 1.54 1.23 0.87
Italy Patents 29.85 28.83 26.10 23.79 0.80
Population 22.56 22.48 22.45 23.06 1.02
Patents/population ratio 1.32 1.28 1.16 1.03 0.78
Japan Patents 69.86 71.24 74.43 73.40 1.05
Population 44.63 45.36 46.32 46.92 1.05
Patents/population ratio 1.57 1.57 1.61 1.56 1.00
Poland Patents 30.51 25.71 25.65 26.43 0.87
Population 15.78 15.75 15.76 15.91 1.01
Patents/population ratio 1.93 1.63 1.63 1.66 0.86
South Korea
Patents 94.26 96.25 93.92 93.40 0.99
Population 82.18 82.73 82.78 82.52 1.00
Patents/population ratio 1.15 1.16 1.13 1.13 0.99
Spain Patents 57.34 55.01 52.15 55.94 0.98
Population 31.80 32.40 32.55 32.45 1.02
Patents/population ratio 1.80 1.70 1.60 1.72 0.96
Sweden Patents 32.65 27.89 34.88 34.79 1.07
Population 20.35 20.78 21.62 22.43 1.10
Patents/population ratio 1.60 1.34 1.61 1.55 0.97
United Kingdom
Patents 36.97 37.57 35.55 34.56 0.93
Population 38.43 38.47 38.81 39.14 1.02
Patents/population ratio 0.96 0.98 0.92 0.88 0.92
USA Patents 80.11 80.13 81.11 83.10 1.04
Population 62.02 62.33 62.51 62.86 1.01
Patents/population ratio 1.29 1.29 1.30 1.32 1.02
Source: OECD database. Patents is the regional number of patent applications over the national total in %. Population is the regional number of people over the national total in %. The patents/population ratio is the quotient of these two shares.
10
approach is that the ‘innovation requires large cities’ argument suggests
that there is a general trend across developed countries of innovation
activities being concentrated in the largest cities. Comparable data on
patenting is only available for the period 2000 to 2014.
The highest patent share of large metropolitan areas in 2014 is
found in South Korea (93.4%), followed by the US (83.1%). In Germany,
the patent share of large metropolitan areas is only about 36%. The value
of 34.6% for the United Kingdom is surprisingly low given the dominant
role of the London area in terms of population.15 The lowest patent share
of metropolitan areas (23.8%) is found in Italy. Among the European
countries, only Spain and the Czech Republic have a majority of patents in
large metropolitan areas. It is rather remarkable that in eight out of the 13
countries included in Table 1, the patent share of large metropolitan areas
decreased by more than 5% from 2000 to 2014. In France and Italy, the
patent share of large metropolitan areas dropped by about 10% between
2000 and 2014. In Poland the decrease was even higher (13%). Sweden
is the only European country showing an increase of more than 5%, while
the change of the patent share of other large metropolitan areas in the
European countries included in our sample remained within the -5% to
+5% range. Overall, the data show that there is no general tendency of an
increasing concentration of innovative activity in large metropolitan areas
in the early 21st century.
In order to understand whether the national share of innovative
activity is higher than the national share of population in the largest
metropolitan areas, we benchmark the concentration of innovative
activities against the concentration of population. If large metropolitan
areas have a patent/population ratio higher than 1, then this indicates an
15 The patent share of London in 2014 is about 27%. Other regions with high national shares of patents are Cambridgeshire (8.7%), Oxfordshire (4.5%) and Coventry (3.7%). None of these regions are regarded as large metropolitan areas based on the OECD definition. Furthermore, for Cambridgeshire the patent/population ratio achieves a remarkable value of 8.8, which means that the national patent share of the region is almost 9 times larger than its population share.
11
“urban premium” for innovative activity as suggested by the ‘innovation
requires large cities’ argument. Large metropolitan areas might have a
higher patent/population ratio because of the concentration of universities
and other research facilities and the on average higher share of R&D
employees in these regions.16
We do indeed find such an urban premium in all of the countries in
our sample except in the United Kingdom (0.88 in 2014), where large
metropolitan areas have lower patent/population ratios. The urban
premium in the year 2014 is largest for the Czech Republic (2.3), Spain
(1.74) and Poland (1.66). The values of the patent/population ratios for
South Korea (1.13) and for the US (1.32), those countries with exceptional
high shares of patents in large metropolitan areas, are in the mid-range. It
is interesting to note that the urban premium is declining over time in most
of the countries, with a 2% increase being revealed in the US.
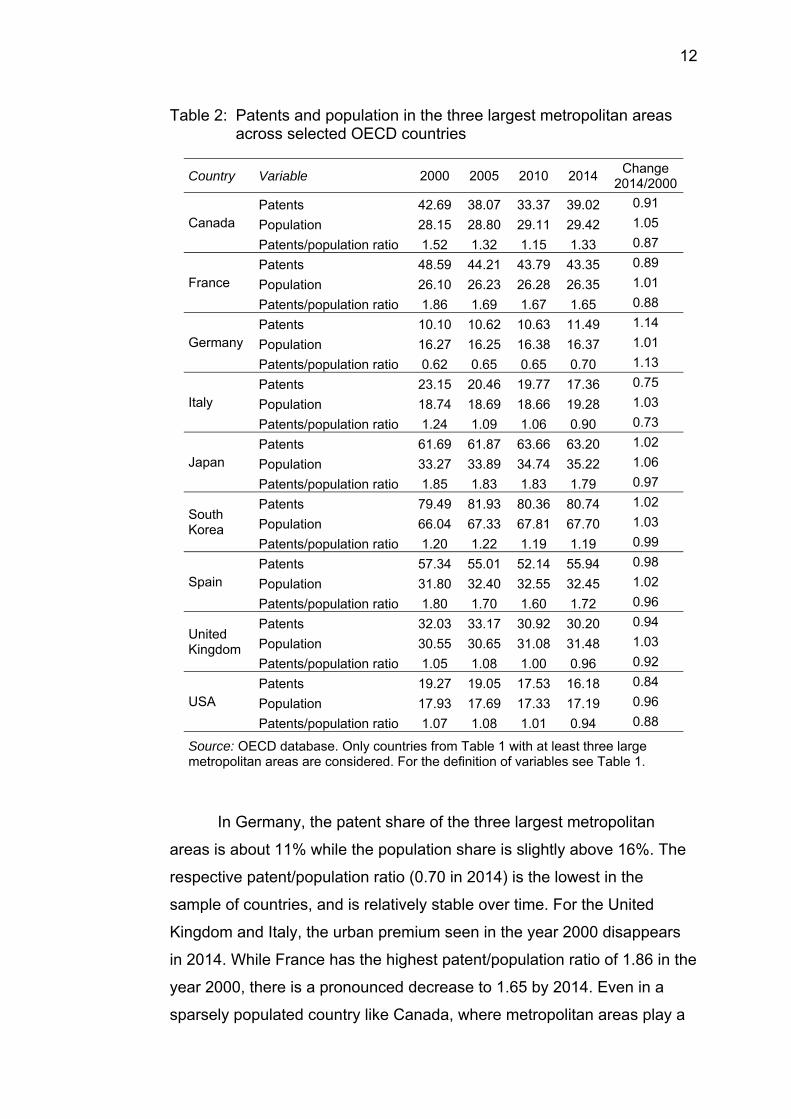
In Table 2, we focus on innovative activities in the three largest
metropolitan areas across the selected OECD countries in terms of
population size. Countries with only one metropolitan area according to
the OECD definition (Czech Republic, Hungary, Poland, and Sweden) are
excluded. Since France and Spain have exactly three large metropolitan
areas, the numbers for these two countries are the same as in Table 1.
The focus on the three largest cities reveal some remarkable differences
when compared to the analysis that includes all metropolitan areas. For
the US, the patent share in the year 2014 drops to only 16% while the
population share of these areas is 17%, suggesting that no urban premium
exists for these largest agglomerations of the US. This clearly indicates
that it is not the largest metropolitan areas in the US that have most of the
patents. It is also remarkable that the patent share of the three largest
metropolitan areas is decreasing over time.
16 Due to the higher share of R&D activities, a value of the patents/population ratio larger than 1 does not indicate higher productivity of R&D activities in large agglomerations. A measure for productivity of regional research could be the number of patents per inventor (see Section 4.4).
12
Table 2: Patents and population in the three largest metropolitan areas across selected OECD countries
Country Variable 2000 2005 2010 2014 Change
2014/2000
Canada Patents 42.69 38.07 33.37 39.02 0.91
Population 28.15 28.80 29.11 29.42 1.05
Patents/population ratio 1.52 1.32 1.15 1.33 0.87
France Patents 48.59 44.21 43.79 43.35 0.89
Population 26.10 26.23 26.28 26.35 1.01
Patents/population ratio 1.86 1.69 1.67 1.65 0.88
Germany Patents 10.10 10.62 10.63 11.49 1.14
Population 16.27 16.25 16.38 16.37 1.01
Patents/population ratio 0.62 0.65 0.65 0.70 1.13
Italy Patents 23.15 20.46 19.77 17.36 0.75
Population 18.74 18.69 18.66 19.28 1.03
Patents/population ratio 1.24 1.09 1.06 0.90 0.73
Japan Patents 61.69 61.87 63.66 63.20 1.02
Population 33.27 33.89 34.74 35.22 1.06
Patents/population ratio 1.85 1.83 1.83 1.79 0.97
South Korea
Patents 79.49 81.93 80.36 80.74 1.02
Population 66.04 67.33 67.81 67.70 1.03
Patents/population ratio 1.20 1.22 1.19 1.19 0.99
Spain Patents 57.34 55.01 52.14 55.94 0.98
Population 31.80 32.40 32.55 32.45 1.02
Patents/population ratio 1.80 1.70 1.60 1.72 0.96
United Kingdom
Patents 32.03 33.17 30.92 30.20 0.94
Population 30.55 30.65 31.08 31.48 1.03
Patents/population ratio 1.05 1.08 1.00 0.96 0.92
USA Patents 19.27 19.05 17.53 16.18 0.84
Population 17.93 17.69 17.33 17.19 0.96
Patents/population ratio 1.07 1.08 1.01 0.94 0.88
Source: OECD database. Only countries from Table 1 with at least three large metropolitan areas are considered. For the definition of variables see Table 1.
In Germany, the patent share of the three largest metropolitan
areas is about 11% while the population share is slightly above 16%. The
respective patent/population ratio (0.70 in 2014) is the lowest in the
sample of countries, and is relatively stable over time. For the United
Kingdom and Italy, the urban premium seen in the year 2000 disappears
in 2014. While France has the highest patent/population ratio of 1.86 in the
year 2000, there is a pronounced decrease to 1.65 by 2014. Even in a
sparsely populated country like Canada, where metropolitan areas play a
13
particularly important role, there is a significant decline of the urban
premium from 1.52 to 1.32. Spain and Japan have the relatively most
stable patent/population ratios and show the highest ratios of 1.72 and
1.79, respectively, in 2014.
Altogether, the rather pronounced heterogeneity across countries
suggests that the largest metropolitan areas do not necessarily host a
more than proportional share of innovative activity and that the largest
agglomerations did not increase in importance over the 2000 to 2014
period. Rather, the urban premium for the three largest metropolitan areas
is relatively stable or declining in all countries with the exception of
Germany. These results suggest that the largest metropolitan areas of a
country do not necessarily provide the most conducive framework
conditions for, nor are specialized in innovation activity.
In order to investigate the concentration of patenting in those
metropolitan areas that are most specialized in innovative activity, we
focus on the three large metropolitan areas with the highest number of
patents per population (Table 3). For Japan, France, and Spain the
metropolitan areas are the same as in Table 1. The majority of all patents
come from the three most innovative metropolitan areas in Japan (63%)
and Spain (56%). A relatively high share can also be observed for France
(43%). For South Korea the value is even 85%. The value for the US is,
however, only about 23%; smaller than for the United Kingdom (31.5%)
and only slightly larger than in Germany (19.5%).
However, the picture changes completely when benchmarking the
patenting share against the population share of the three most innovative
agglomerations per country. The highest ratio by far is found in the US
(4.62), while the values are much lower (between 0.97 and 2.25) for the
other countries. Thus, in 2014, the three US agglomerations with the
highest number of patents per population contributed about 4.6 times
more to the national patents (23.1%) than their share of the population is
(5%). The US is also the only country of our sample that shows an
14
Table 3: Patents and population in the three most innovative large metropolitan areas across selected OECD countries
Country Variable 2000 2005 2010 2014 Change
2014/2000
Canada Patents 42.69 38.07 33.37 39.02 0.91
Population 28.15 28.80 29.11 29.42 1.05
Patents/population ratio 1.52 1.32 1.15 1.33 0.87
France Patents 48.59 44.21 43.79 43.35 0.89
Population 26.10 26.23 26.28 26.35 1.01
Patents/population ratio 1.86 1.69 1.67 1.65 0.88
Germany Patents 21.93 19.07 18.82 19.34 0.88
Population 7.95 8.15 8.38 8.61 1.08
Patents/population ratio 2.76 2.34 2.25 2.25 0.81
Italy Patents 29.00 27.41 25.09 22.87 0.79
Population 17.17 17.18 17.29 17.91 1.04
Patents/population ratio 1.69 1.60 1.45 1.28 0.76
Japan Patents 61.69 61.87 63.66 63.20 1.02
Population 33.27 33.89 34.74 35.22 1.06
Patents/population ratio 1.85 1.83 1.83 1.79 0.97
South Korea
Patents 84.07 86.34 83.93 85.18 1.01
Population 55.13 56.78 57.67 57.82 1.05
Patents/population ratio 1.52 1.52 1.46 1.47 0.97
Spain Patents 57.34 55.01 52.14 55.94 0.98
Population 31.80 32.40 32.55 32.45 1.02
Patents/population ratio 1.80 1.70 1.60 1.72 0.96
United Kingdom
Patents 33.99 34.21 32.76 31.55 0.93
Population 31.49 31.65 32.05 32.43 1.03
Patents/population ratio 1.08 1.08 1.02 0.97 0.90
USA Patents 17.58 17.68 20.46 23.11 1.31
Population 5.05 4.95 4.95 5.00 0.99
Patents/population ratio 3.48 3.57 4.14 4.62 1.33
Source: OECD database. Only countries from Table 1 with at least three large metropolitan areas are considered. For the definition of variables see Table 1.
increase of the patents/population ratio in the 2000 to 2014 period, while
this figure is relatively stable or decreasing in all other countries of our
sample.
Again, these results suggest that the size of an agglomeration is not
a key factor in determining whether or not it is conducive to innovative
activity. It is certain agglomerations rather than the largest ones that show
an above average innovation performance. When considering the
15
concentration of innovative activities in large metropolitan areas, the US is
an extreme and exceptional case that is hardly in line with the general
‘innovation requires large cities’ argument in its purest sense.
4.2 Non-urban areas
To shed more light on the role of non-urban areas—functional regions with
a population of less than 250 000—we calculate the national shares of
patents registered in these areas (Table 4). These calculations identify two
clear outliers, South Korea and the US, where the shares of patents in
non-metropolitan areas are extremely low (0.6% in South Korea and 2.8%
in the US). While the patent share of non-urban areas is also relatively low
in Japan (between 4.3% and 5.5%) it is much higher in all other countries.
The highest values are found for Switzerland (about 53%) and Italy
(around 48%), two countries with a pronounced historically grown federal
tradition. For most of the other countries the national share of patents
registered in non-urban areas varies between around 10% and 40%. The
development of the patent share of non-urban areas in the 2000 to 2014
period is rather stable in most of the countries in our sample. The patent
share of non-urban areas increased by more than 5% in seven countries
and decreased by more than 5% in six countries of our sample. Hence,
the data show no general trend of a concentration of patenting in
metropolitan areas.
In all countries the patents/population ratio for the non-urban areas
is below 1, indicating that for most of these regions specializing in
innovative activities is below the national average. Table 4 shows,
however, some rather pronounced heterogeneity in this respect. While
South Korea and the US have the lowest values of (0.28 and 0.26 in 2014,
respectively), rather high values can be found for Switzerland (1.00) and
Italy (0.93). The patents/population ratio decreased by more than 5% in
four countries of the sample, remained relatively constant in three
countries and increased by more than 5% in seven countries. Hence,
there is also no general trend towards an increased specialization of
innovative activities in non-urban areas.
16
Table 4: Patents and population in non-urban areas (less than 250,000 population) across selected OECD countries
Country Variable 2000 2005 2010 2014 Change 2014/2000
Canada Patents 28.24 26.58 25.84 26.38 0.93
Population 51.79 50.63 49.91 49.04 0.95
Patents/population ratio 0.55 0.53 0.52 0.54 0.99
Czech Republic
Patents 14.98 17.06 20.63 22.67 1.51
Population 51.09 50.97 50.00 49.65 0.97
Patents/population ratio 0.29 0.33 0.41 0.46 1.56
France Patents 16.17 15.45 14.97 14.12 0.87
Population 32.92 32.71 32.63 32.35 0.98
Patents/population ratio 0.49 0.47 0.46 0.44 0.89
Germany Patents 23.17 25.46 26.62 25.61 1.10
Population 33.63 33.35 32.84 32.47 0.97
Patents/population ratio 0.69 0.76 0.81 0.79 1.14
Hungary Patents 33.33 28.57 33.20 41.69 1.25
Population 44.52 44.47 43.78 43.40 0.97
Patents/population ratio 0.75 0.64 0.76 0.96 1.28
Italy Patents 42.43 44.69 47.74 47.97 1.13
Population 52.47 52.40 52.33 51.75 0.99
Patents/population ratio 0.81 0.85 0.91 0.93 1.15
Japan Patents 5.06 4.98 4.32 5.53 1.09
Population 7.11 6.99 6.85 6.76 0.95
Patents/population ratio 0.71 0.71 0.63 0.82 1.15
Poland Patents 21.19 27.59 25.43 25.23 1.19
Population 50.64 50.59 50.60 50.33 0.99
Patents/population ratio 0.42 0.55 0.50 0.50 1.20
South Korea Patents 0.77 0.27 0.58 0.86 1.13
Population 2.20 2.22 2.22 2.27 1.03
Patents/population ratio 0.35 0.12 0.26 0.38 1.09
Spain Patents 15.25 13.17 11.80 11.36 0.74
Population 30.37 29.99 29.96 29.82 0.98
Patents/population ratio 0.50 0.44 0.39 0.38 0.76
Sweden Patents 29.03 27.92 26.73 27.34 0.94
Population 46.87 46.09 44.85 44.04 0.94
Patents/population ratio 0.62 0.61 0.60 0.62 1.00
Switzerland Patents 51.20 50.40 51.52 52.91 1.03
Population 53.24 53.09 52.89 52.89 0.99
Patents/population ratio 0.96 0.95 0.97 1.00 1.04
17
Table 4 (continued)
Country Variable 2000 2005 2010 2014 Change 2014/2000
United Kingdom
Patents 26.19 24.40 25.16 21.23 0.81
Population 26.58 26.63 26.50 26.30 0.99
Patents/population ratio 0.99 0.92 0.95 0.81 0.82
USA Patents 3.10 3.25 2.79 2.57 0.83
Population 10.24 10.06 9.98 9.84 0.96
Patents/population ratio 0.30 0.32 0.28 0.26 0.86
Source: OECD database. For the definition of variables see Table 1.
4.3 Regional size, and density, and innovation intensity
Our data also allows us to investigate the relationship between a region’s
population density and the number of patents per population (patent
intensity). Most proponents of the ‘innovation requires large cities’
argument relate their hypotheses to size rather than density (e.g.,
Bettencourt, Lobo and Strumsky 2007: Bettencourt 2013; Gomez-Lievano,
Patterson-Lomba and Hausmann 2016), while most arguments in the
literature on agglomeration economies rely on density in terms of
geographic proximity to a large number of actors (e.g., Storper and
Venables 2004). We base our assessment on average values for two
equally divided sub-periods 2000-2007 and 2008-2014.
Figure 1 clearly shows that there is no breathtaking linear
relationship between population size and patents per population, nor
between population size and patents per population across metropolitan
areas. While there is a strong and statistically significant relationship when
considering all regions (r=0.2, Figure 1a), there is a substantially weaker
but still significant correlation for small and medium-sized metropolitan
areas (r=0.1, Figure 1b). For large metropolitan regions there is no
significant relationship between density and patents per population (Figure
1c). Overall, the results suggest that an increase in size, beyond the
threshold of being a small and medium sized metropolitan area, has no
18
2000-2007 2008-2014
a) All regions
b) Small and medium-sized metropolitan regions
b) Large metropolitan regions
Figure 1: Population size and patents per population17
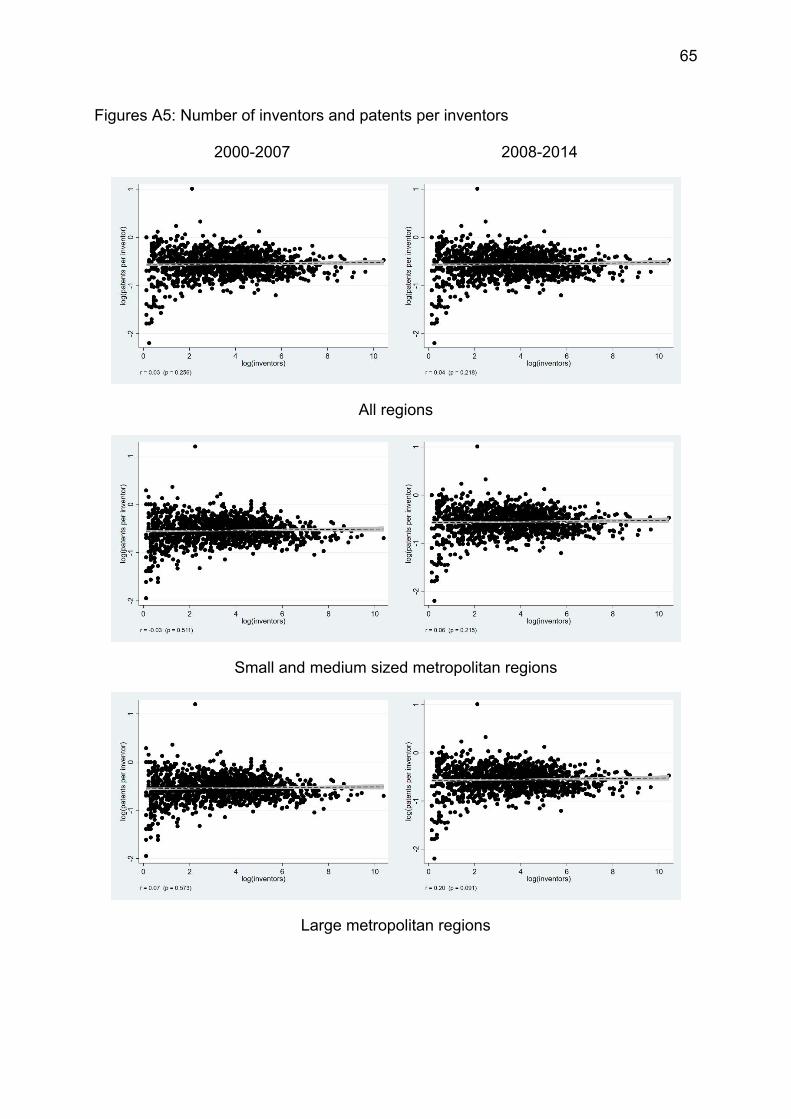
17 The relationship between the number of inventors and patents per inventors is shown in Figures A5 in the Appendix.
19
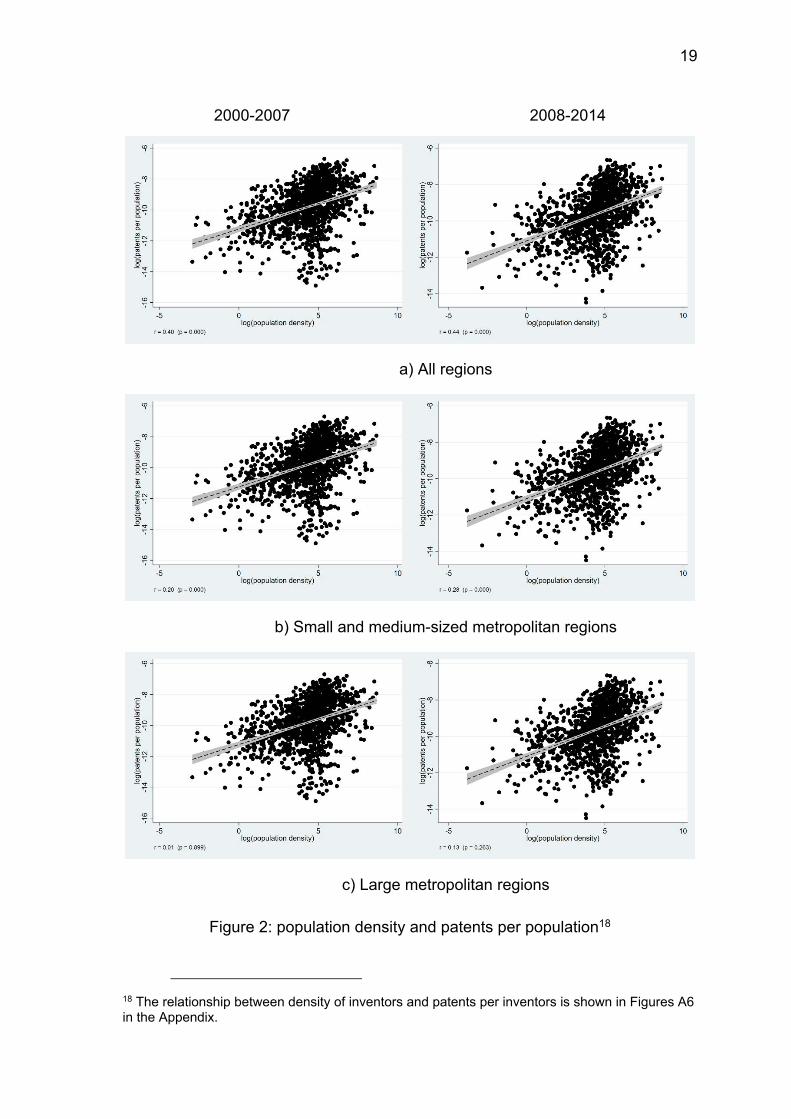
2000-2007 2008-2014
a) All regions
b) Small and medium-sized metropolitan regions
c) Large metropolitan regions
Figure 2: population density and patents per population18
18 The relationship between density of inventors and patents per inventors is shown in Figures A6 in the Appendix.
20
additional impact on patenting activity. Figure 2 shows the relationship
between population density and patents per population, confirming the
patterns from Figure 1. The correlation coefficients indicate a slightly
closer statistical relationship between density and small and medium-sized
metropolitan regions.
To summarize, our results reveal large differences across our
sample regarding the geographic concentration of inventive activity in
large cities. The highest shares of patents in large metropolitan areas are
found for South Korea and the US. These are also the countries (together
with Japan) that have relatively low shares of patents in non-urban and
rural regions. The result that the metropolitan areas in all countries have a
higher number of patents per population (urban premium) than
intermediate and non-urban regions does suggest some locational
advantages of cities for innovative activities. However, the pronounced
variation of the urban premium among the metropolitan areas of a country
shows that the effect of size and density on innovative activity can
considerably vary. In particular, it is not the largest agglomerations that
have the highest urban premium.
In the majority of the countries in our sample, the concentration of
patents and the urban premium found in large metropolitan areas have
declined over the observation period. This indicates an increasing role of
smaller cities and non-urban areas in innovative activity. Our results do
reveal, however, an increasing trend in Hungary, Japan, Sweden and the
US, all countries with rather uneven settlement structures.
4.4 Urban scaling in innovative activity across countries
We now analyze urban scaling following the approach of Bettencourt and
Lobo (2016) who regress the number of patents on the size of the
population of a region. In contrast to these authors who focus on
metropolitan areas with a population greater than 500,000, we also
consider all other regions in order to understand whether cities and
metropolitan areas have a scaling advantage when compared to non-
metropolitan areas. To this end, we regress the number of patents on the
21
regional population. We make use of the average values for the periods
2000 to 2007, and 2008 to 2014. We interact population with country
dummies where the US is the reference category. Significant interaction
effects indicate whether urban scaling for innovative activity in the
respective countries is more pronounced than in the US. We use the US
as a benchmark because theories emphasizing the important role of large
cities in innovative activity are mainly based on observations made for this
country.
We first run the analysis for all regions of the countries in the
sample (Models I and II in Table 5), i.e., we do not restrict the analysis to
cities of a certain minimum size as was the case in some of the previous
analyses (e.g., Bettencourt and Lobo 2016). In order to offer a comparison
with the results of Bettencourt and Lobo (2016), we run the analysis for
(metropolitan) regions with a population greater than 500,000 (see Table
5, Models III and IV).19
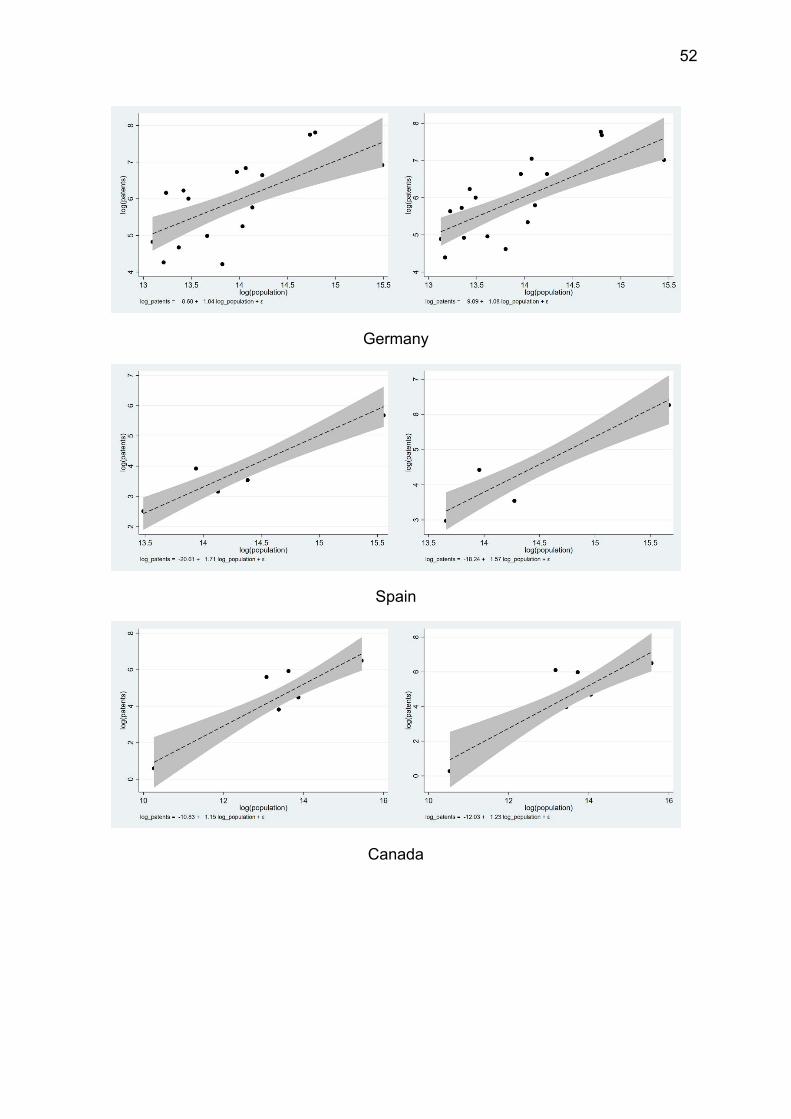
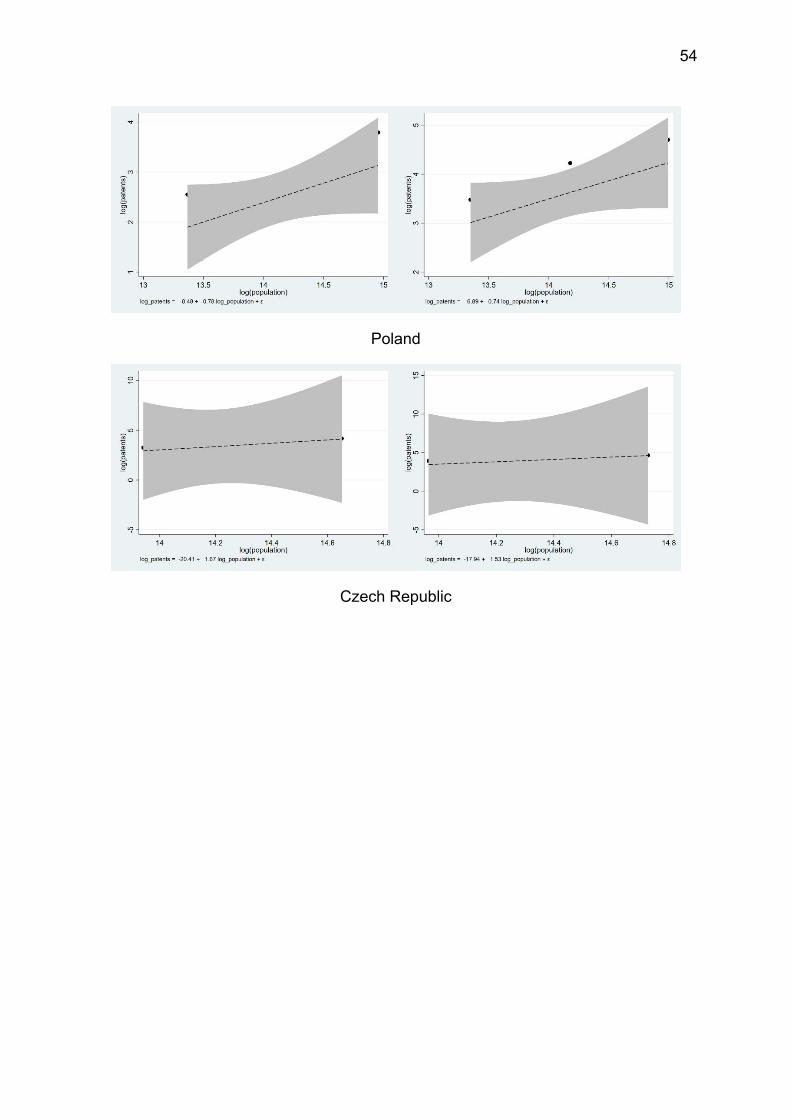
In the analysis for all regions (Models I and II in Table 5) we obtain
a coefficient estimate for the US of about 1.45. We obtain significantly
negative interaction effects in both time periods for Canada, Germany,
Switzerland, and the UK. For Spain and Sweden there is a significantly
negative interaction effect only in the first period. The negative effects are
particularly pronounced for Canada and Switzerland. In Switzerland, the
coefficient for urban scaling is only slightly above 1 while for Canada it is
even below 1, indicating urban descaling. For the UK and Germany, the
overall effect is only about 1.2.
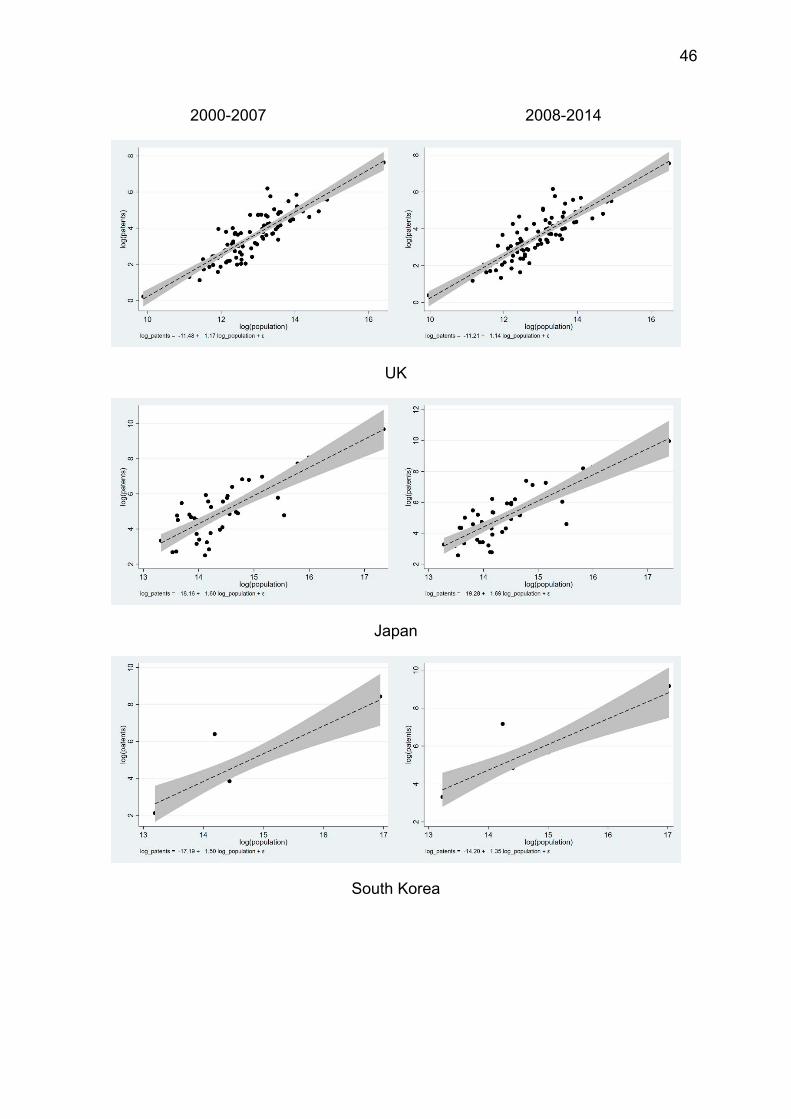
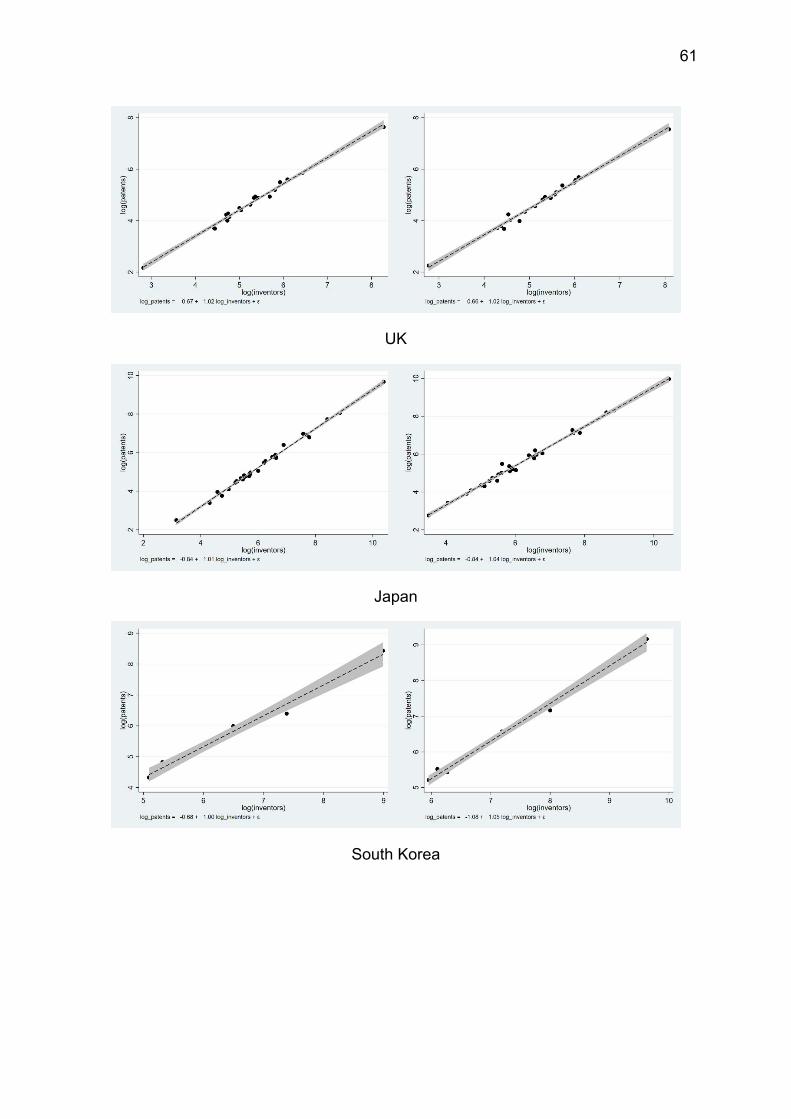
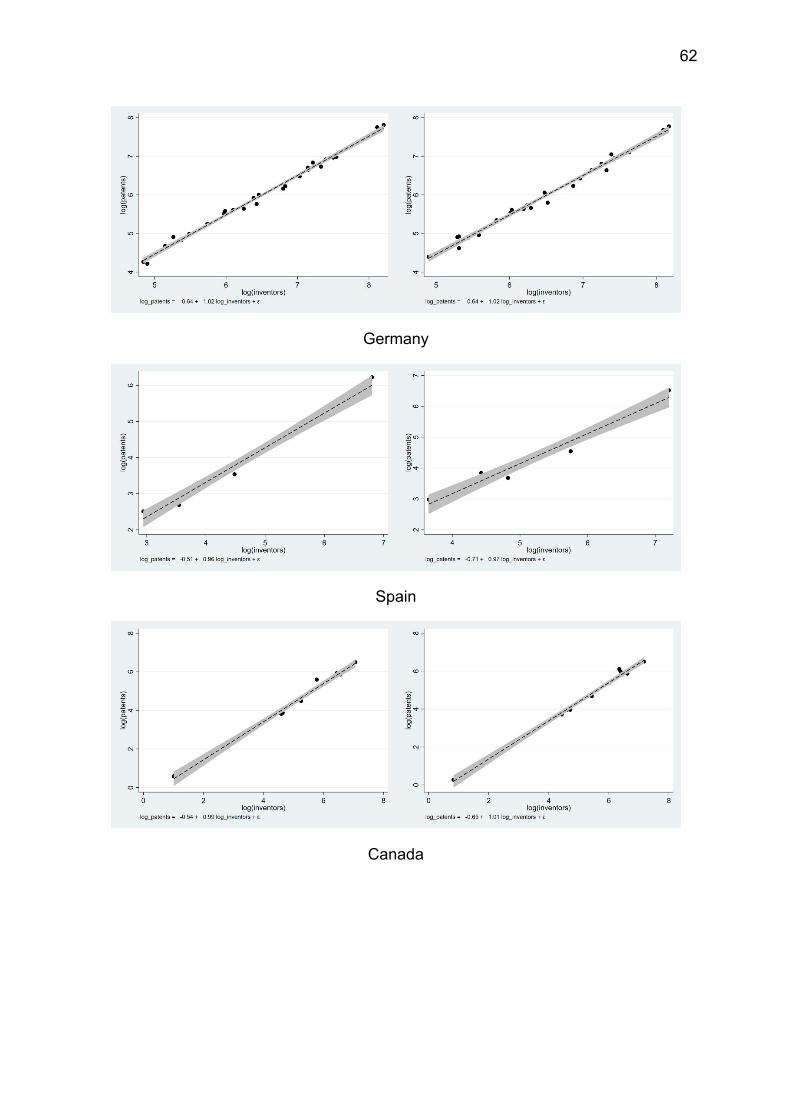
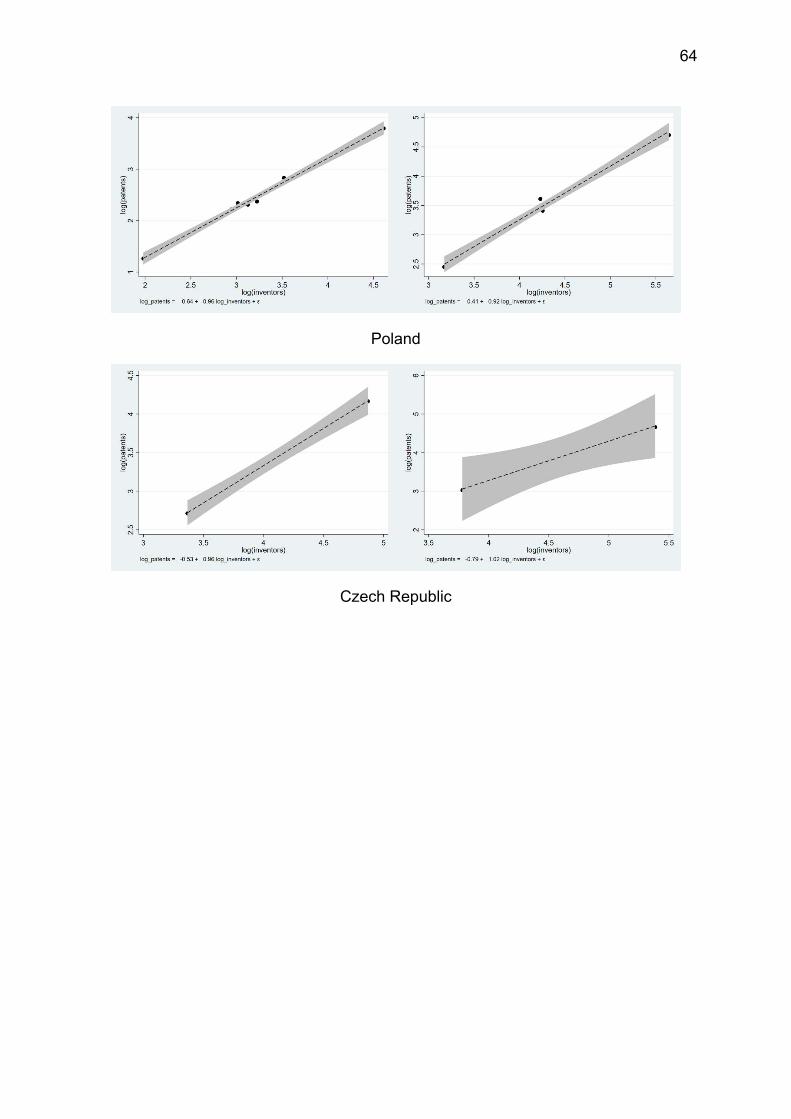
Table A3 in the Appendix documents the scaling coefficient
estimates and the respective confidence intervals. There are several
countries for which the lower bound of the confidence interval is below
one, indicating that the coefficient is not significantly different from one.
19 This deviates from the OECD definition of metropolitan areas that we follow in other parts of the paper. The approach by Bettencourt and Lobo (2016) measures the role of urban scaling conditioned on a region being a metropolitan area. This is not suited to our primary interest, which is a comparison of innovative activity between metropolitan areas and rural regions.
22
Figures A1 in the Appendix show the respective country-specific
scatterplots for the two time periods.
Table 5: Urban scaling based on regional population across selected OECD countries
I II III IV
All regions
Metro regions > 500,000 population
Dependent variable: Patents 2000-07 2008-14 2000-07 2008-14 Country dummies Y Y Y Y Population 1.487*** 1.445*** 1.457*** 1.481*** (reference: USA) (0.048) (0.049) (0.101) (0.103) Population X France 0.006 0.099 -0.363 -0.417*
(0.096) (0.100) (0.258) (0.235) Population X UK -0.318*** -0.300*** -0.470*** -0.510***
(0.066) (0.067) (0.170) (0.163) Population X Japan 0.116 0.247 -0.012 0.009
(0.157) (0.160) (0.212) (0.207) Population X South Korea 0.014 -0.092 -0.281 -0.344
(0.157) (0.155) (0.356) (0.358) Population X Germany -0.291*** -0.276*** -0.415* -0.401**
(0.070) (0.066) (0.213) (0.190) Population X Spain -0.277*** -0.057 0.252 0.092
(0.099) (0.083) (0.201) (0.193) Population X Canada -0.606*** -0.585*** -0.312** -0.250
(0.073) (0.074) (0.136) (0.196) Population X Italy -0.182 -0.145 -0.620 -0.667
(0.132) (0.126) (0.471) (0.430) Population X Switzerland -0.419*** -0.389*** -0.555** -0.665**
(0.077) (0.086) (0.244) (0.312) Population X Sweden 0.118 0.192 -0.539* -0.259
(0.100) (0.129) (0.300) (0.522) Population X Poland -0.218 0.204 -0.681 -0.739*
(0.146) (0.154) (0.488) (0.404) Population X Czech Republic 0.173 0.080 0.000 0.000
(0.144) (0.170) (0.000) (0.000) Population X Hungary -0.260 -0.336* 0.217 0.050
(0.238) (0.201) (0.419) (0.522) Number of observations 1,264 1,264 223 223 R2 0.842 0.845 0.760 0.733
Notes: ***: statistically significant at the 1 percent level; **: statistically significant at the 5 percent level; * statistically significant at the 10 percent level. Robust standard errors in parentheses. Population and patents are log-transformed annual averages of their total number for the periods indicated in the column headings.
The results of the analysis for metropolitan regions with more than
500,000 population (Models III and IV in Table 5) resemble the patterns of
the main analysis, although the levels of statistical significance tend to be
23
Table 6: Urban scaling based on number of regional inventors (inventor productivity) across regions of selected OECD countries
I II III IV
All regions Metro regions >
500,000 population
Dependent variable: Patents 2000-07 2008-14 2000-07 2008-14 Country dummies Y Y Y Y Inventors 0.974*** 0.973*** 0.988*** 0.999*** (reference group: USA) (0.005) (0.006) (0.007) (0.009) Inventors X France -0.020* -0.008 0.036 0.029
(0.011) (0.011) (0.022) (0.030) Inventors X UK -0.029*** -0.008 0.030 0.026
(0.011) (0.012) (0.022) (0.023) Inventors X Japan 0.036*** 0.074*** 0.022 0.038***
(0.011) (0.011) (0.016) (0.014) Inventors X South Korea 0.044 0.066*** 0.013 0.056
(0.051) (0.071) (0.009) (0.029) Number of observations 1,264 1,264 223 223 R2 0.993 0.992 0.994 0.992
Notes: ***: statistically significant at the 1 percent level; **: statistically significant at the 5 percent level; * statistically significant at the 10 percent level. Standard errors are robust. Robust standard errors in parentheses. Inventors and patents are annual averages for the periods indicated in the column headings.
24
weaker because of the smaller sample size. The scaling coefficients of
1.457 and 1.481 that we estimate for the US are higher than that of 1.291
estimated by Bettencourt, Lobo and Strumsky (2006) for the years 1980-
2001.20
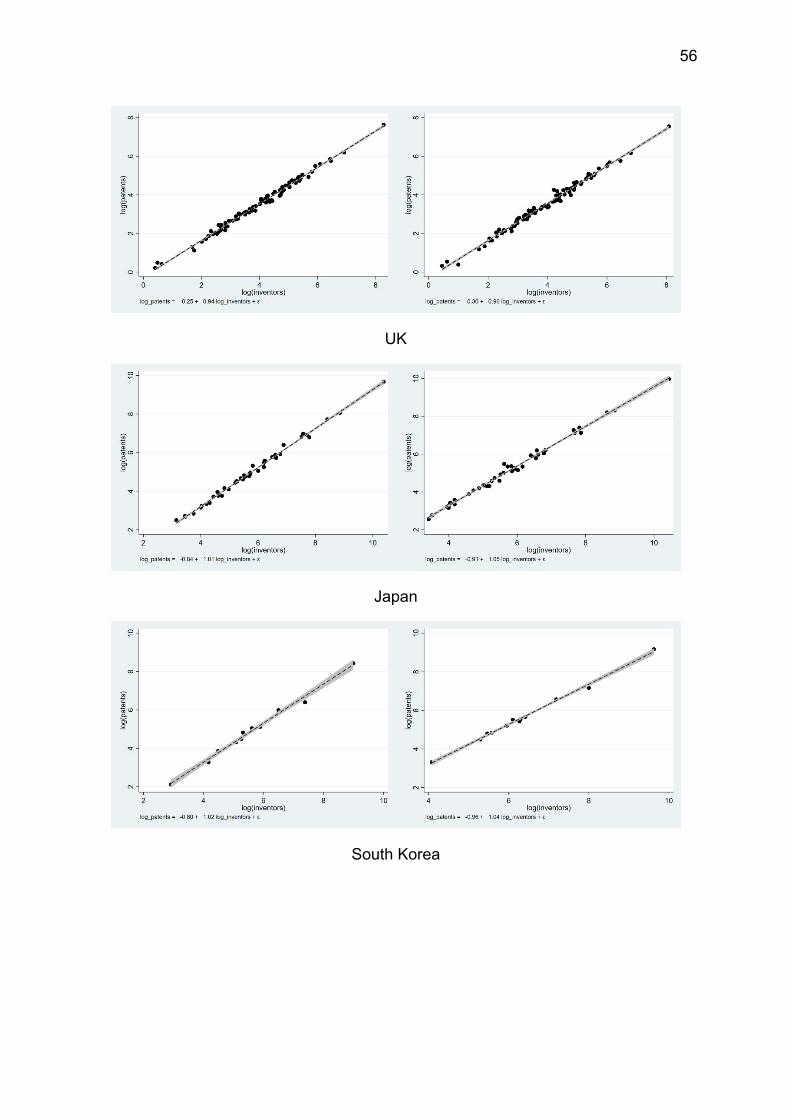
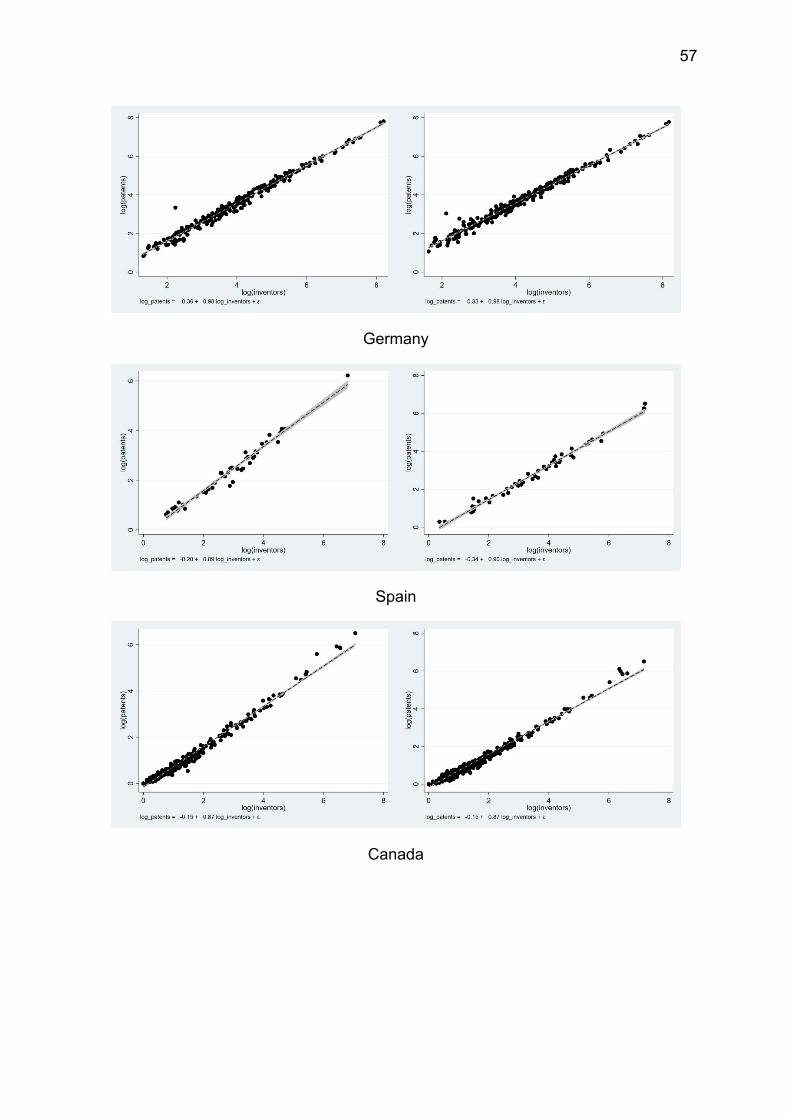
To explore whether inventors located in cities are more productive,
we regress the number of patents on the number of inventors per region. If
inventors living in metropolitan areas have more patents, the coefficient
estimate and the lower bound of the confidence interval should exceed the
value of one. Table 6 shows the results. We hardly find any urban mark-up
on inventor productivity across countries (see also Table A5 and Figures
A4 in the Appendix). Japan and South Korea are the only countries where
inventors seem to be more productive in cities. While the scaling
coefficient for the US is close to one, it is significantly below one in
Canada, Spain, the UK, and in the former socialist countries of Eastern
Europe. This indicates that inventors in metropolitan areas of these
countries are less productive than those in other regions. When narrowing
down the focus to the variation among metropolitan areas, Japan and
Sweden stand out as the only countries where the productivity of inventive
activity is significantly higher in agglomerations, but only for the period
2008 to 2014. For Poland we find a significantly negative scaling effect.
5. The general geographic concentration of patenting
In a final analysis we look at the overall geographic concentration of
innovative activities. Our measure of geographic concentration is the well-
known normalized Herfindahl-Hirsch Index (HHI) that assumes the value
of 1 if innovative activity is completely concentrated in one region. In this
final analysis we also consider the geographic concentration of R&D
employment for which we have information at the level of OECD TLS2
large regions (e.g., NUTS1 regions for European countries; Federal States
in the US) in the years 2008 and 2013.
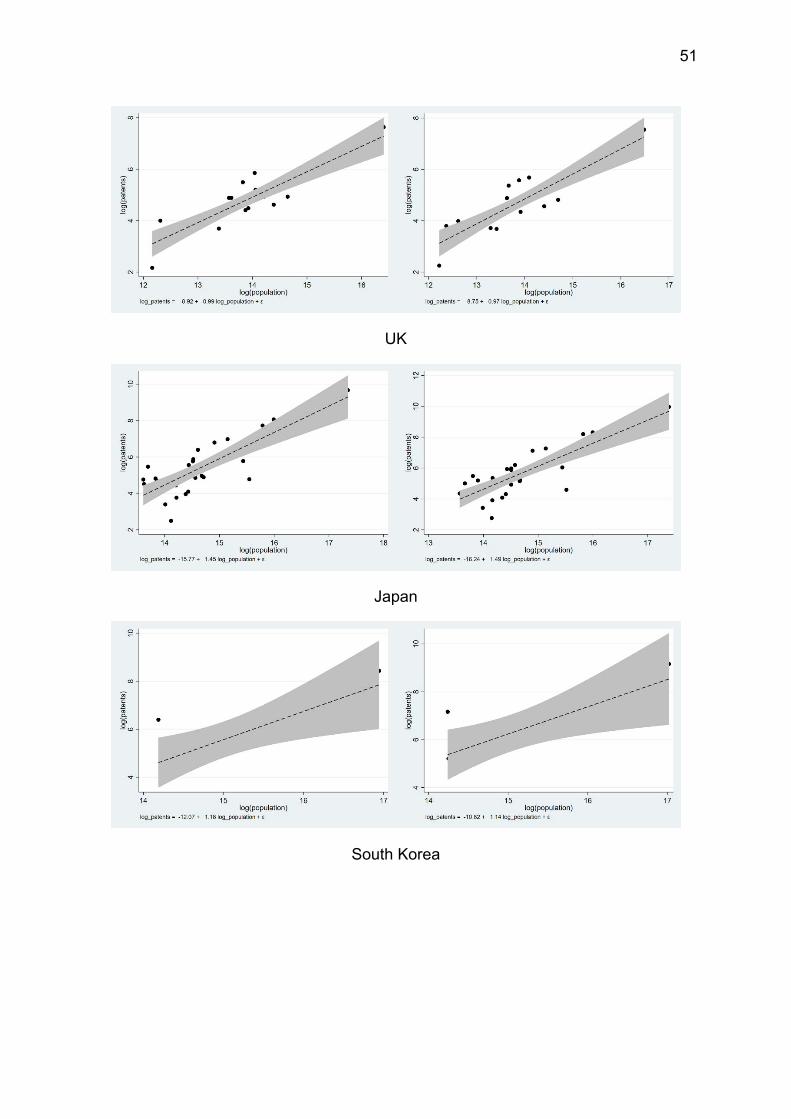
20 See Table A4 and Figures A3 in the Appendix for more details on country-specific coefficient estimates and scatterplots of urban scaling across metropolitan regions with more than 500,000 population.
25
Table 7: Geographic concentration of patenting activity (Herfindahl-Hirsch-Index) across selected OECD countries
Country Variable 2000 2005 2010 2014 Change
2014/2000
Canada Patents 0.060 0.061 0.066 0.058 0.97
Population 0.023 0.024 0.024 0.025 1.06
Patents/population ratio 2.567 2.557 2.735 2.337 0.91
Czech Republic
Patents 0.371 0.340 0.299 0.295 0.79
Population 0.074 0.073 0.075 0.076 1.04
Patents/population ratio 5.030 4.679 3.988 3.855 0.77
France Patents 0.039 0.038 0.037 0.037 0.93
Population 0.016 0.016 0.016 0.016 1.00
Patents/population ratio 2.393 2.345 2.235 2.230 0.93
Germany Patents 0.009 0.008 0.008 0.008 0.92
Population 0.006 0.006 0.006 0.006 1.05
Patents/population ratio 1.666 1.451 1.407 1.469 0.88
Hungary Patents 0.138 0.133 0.122 0.099 0.72
Population 0.084 0.084 0.084 0.085 1.01
Patents/population ratio 1.642 1.587 1.450 1.165 0.71
Italy Patents 0.044 0.040 0.035 0.033 0.75
Population 0.020 0.019 0.019 0.020 1.03
Patents/population ratio 2.236 2.054 1.780 1.630 0.73
Japan Patents 0.136 0.141 0.161 0.190 1.40
Population 0.039 0.040 0.041 0.042 1.07
Patents/population ratio 3.450 3.495 3.889 4.497 1.30
Poland Patents 0.070 0.048 0.055 0.053 0.76
Population 0.016 0.016 0.016 0.016 1.00
Patents/population ratio 4.388 2.997 3.449 3.326 0.76
South Korea
Patents 0.250 0.278 0.257 0.267 1.07
Population 0.113 0.119 0.123 0.123 1.09
Patents/population ratio 2.209 2.331 2.099 2.164 0.98
Spain Patents 0.153 0.146 0.125 0.147 0.96
Population 0.052 0.053 0.054 0.054 1.04
Patents/population ratio 2.956 2.743 2.330 2.732 0.92
Sweden Patents 0.170 0.164 0.188 0.188 1.10
Population 0.101 0.103 0.107 0.110 1.09
Patents/population ratio 1.685 1.587 1.758 1.709 1.01
Switzerland Patents 0.102 0.098 0.094 0.096 0.94
Population 0.078 0.079 0.080 0.080 1.02
Patents/population ratio 1.301 1.246 1.184 1.199 0.92
26
Table 7 (continued)
Country Variable 2000 2005 2010 2014 Change
2014/2000
United Kingdom
Patents 0.022 0.022 0.023 0.026 1.14
Population 0.012 0.012 0.012 0.012 1.04
Patents/population ratio 1.894 1.877 1.873 2.088 1.10
USA Patents 0.047 0.044 0.046 0.050 1.06
Population 0.022 0.021 0.021 0.021 0.98
Patents/population ratio 2.200 2.049 2.195 2.394 1.09
Source: OECD database.
Table 7 shows the concentration patterns of patents. An
international comparison is somewhat hampered by the fact that the value
of the index is affected by the number of regions, which considerably
varies across countries. However, we are more interested in the relating
the concentration of patents to population density, which is comparable
across countries. In all countries, the number of patents in the year 2014 is
more geographically concentrated than population. The value of the ratio
for Japan (4.5) is exceptionally high. The three countries with a
pronounced federal tradition, Germany (1.47), Italy (1.63) and Switzerland
(1.2) have rather low values.
The value of about 2.4 for the US is similar to the values for the
United Kingdom (2.0) and France (2.2). Comparing the values of the index
for different years clearly reveals that there is an increase in the
concentration of patents relative to population by more than 5% in three
countries, while the concentration decreases by more than 5% in eight
countries. Hence, there is also no general trend of a geographic
concentration of inventive activity.
27
Table 8: Geographic concentration (Herfindahl-Index) of R&D employment across selected OECD countries
United Kingdom 0.107 0.107 0.095 0.096 1.130 1.118
USA 0.051 0.051 0.044 0.044 1.159 1.155
Source: OECD database.
Analyzing the concentration patterns for R&D employment reveals
additional insights (Table 8). First, the values for the ratio between the
concentration of population and R&D employment are much lower than for
patents. Thus, concentration is considerably more pronounced for
innovation output as compared to innovation input. Second, France is the
only ‘outlier’ with regard to the HHI ratio in the year 2013 (1.90 compared
to values between 1.12 and 1.38 for the other countries). Germany and
the US are also very similar with respect to the concentration of R&D
employment. Third, there is high degree of stability in the values when
comparing the years 2008 and 2013, years for which we have reliable
data. Country differences in concentration patterns of innovative activity
are particularly visible when it comes to patents but not as obvious in the
case of R&D employment.
28
6. Discussion and Conclusions
6.1 Findings
Some prominent theories suggest that successful innovative activity
benefits from agglomeration economies and thrives in large cities (Carlino
and Kerr 2015; Glaeser and Hausman 2019; Florida, Adler and Mellander
2017). Our investigation of the geographic concentration of patents in a
sample of developed countries reveals a great variety of environments
where innovative activity is prevalent. We identified two countries where
innovative activities are, indeed, concentrated in large metropolitan areas,
South Korea and the US. This ‘outlier’ position held by the US and South
Korea suggests that empirical results for these two extreme cases may be
of rather limited relevance for other countries that are characterized by a
more balanced geographic distribution of innovative activities.
Interestingly, we find that even in the US it is not the largest
agglomerations that have the highest shares of patents. We could not find
any general trend towards an increasing concentration of innovative
activities in large agglomerations over the 2000-2014 period (Section 4.1).
In fact, our results show that there are more countries in our sample with a
greater than 5% decrease in the share of patents registered in large
metropolitan areas than countries where this share increased by more
than 5%. These results clearly suggest that population density and
agglomeration economies do not play a dominant role for regional
innovative activity, at least in the great majority of countries. This clearly
suggests that that innovation does not ‘require’ large cities.
The relationship between the number of patents and the size of
regional population (urban scaling) shows more patents per population in
most of the countries, with the highest scaling coefficient for the US. The
obvious reason behind this result is that agglomerations tend to have
higher levels of innovative activity caused by a higher share of inventors
among that specific population. The scaling coefficient for the number of
patents based on the number of inventors (patent productivity) is close to
or below one for nearly all countries. This clearly indicates that inventors in
29
larger agglomerations are not more productive in terms of having more
patents.
Finally, we investigated the general regional concentration of
population, patents, and R&D employment. In all countries, patents are
considerably more geographically concentrated than population. This
stronger concentration of patents is extremely high in Japan, while similar
to the United Kingdom and France, the US holds a mid-range position in
this respect. The difference between the concentration of patents and
population is relatively small in the three countries of our sample that have
a pronounced federal tradition: Germany, Italy and Switzerland. The
geographic concentration of R&D employment is much less pronounced
than the concentration of patents. The US is no ‘outlier’ with regard to the
concentration of R&D employment compared to the concentration of
population. There is an increase in the concentration of patents relative to
population by more than 5% in three countries, while concentration is
decreasing by more than 5% in eight countries. Hence, there is no general
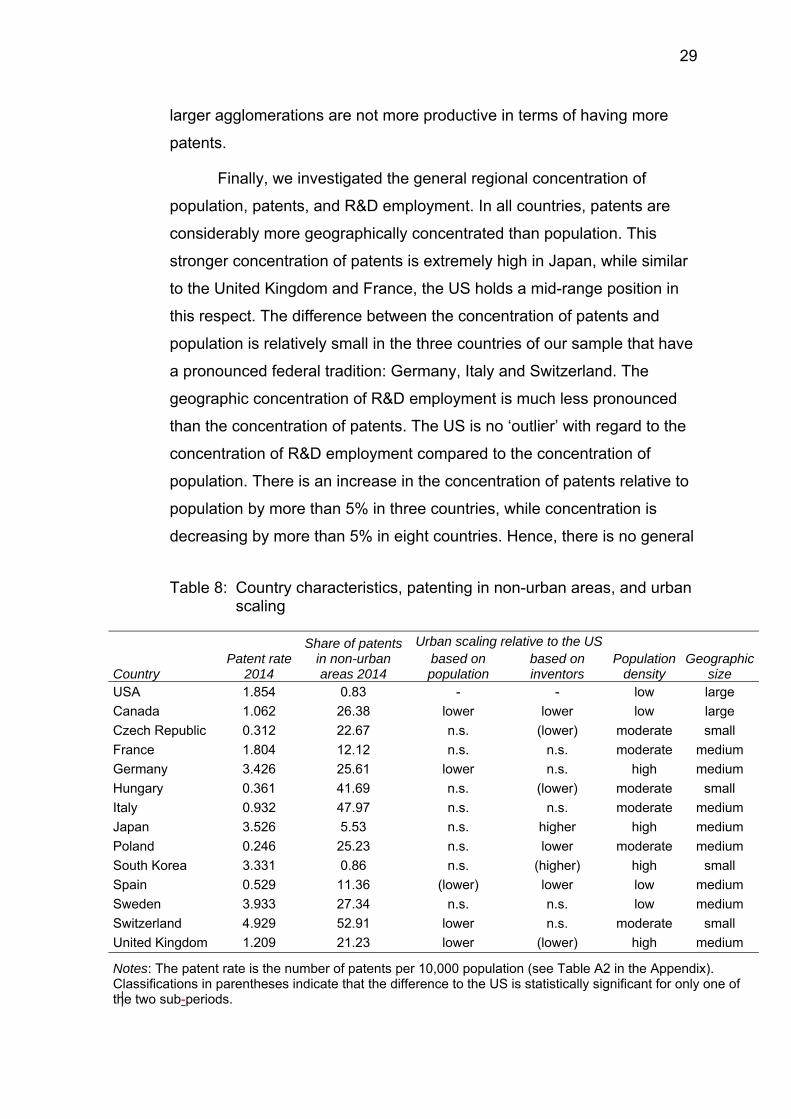
Table 8: Country characteristics, patenting in non-urban areas, and urban scaling
Share of patents in non-urban areas 2014
Urban scaling relative to the US
Country Patent rate
2014 based on population
based on inventors
Population density
Geographic size
USA 1.854 0.83 - - low large
Canada 1.062 26.38 lower lower low large
Czech Republic 0.312 22.67 n.s. (lower) moderate small
France 1.804 12.12 n.s. n.s. moderate medium
Germany 3.426 25.61 lower n.s. high medium
Hungary 0.361 41.69 n.s. (lower) moderate small
Italy 0.932 47.97 n.s. n.s. moderate medium
Japan 3.526 5.53 n.s. higher high medium
Poland 0.246 25.23 n.s. lower moderate medium
South Korea 3.331 0.86 n.s. (higher) high small
Spain 0.529 11.36 (lower) lower low medium
Sweden 3.933 27.34 n.s. n.s. low medium
Switzerland 4.929 52.91 lower n.s. moderate small
United Kingdom 1.209 21.23 lower (lower) high medium
Notes: The patent rate is the number of patents per 10,000 population (see Table A2 in the Appendix). Classifications in parentheses indicate that the difference to the US is statistically significant for only one of the two sub-periods.
30
trend towards higher geographic concentration of inventive activity.
Comparing the geographic concentration of R&D employment in the years
2008 and 2013 shows only minor changes in all countries.
Quite remarkable, the extreme geographic concentration of
patenting in South Korea and the US does not necessarily imply high
levels of innovativeness in terms of the number of patents per population
(patent rate). Comparing the geographic concentration of patenting in a
country and the degree of urban scaling with its patent rate (Table 8)
makes it clear that there are countries with lower degrees of concentration
and urban scaling but higher levels of innovativeness (Germany, Sweden
and Switzerland). There are also countries (the UK, for example) where
the patent rate is similar to the US, but where the geographic
concentration of patenting and urban scaling is less pronounced. Japan
and South Korea are two countries where the concentration of patenting
and the degree of urban scaling is comparable to the US. One reason for
this could be because these two countries are much smaller in size and
have a much higher population density. Altogether, Table 8 shows that
countries deviating from the US pattern are not ‘outliers’.
6.2 Limitations
The main limitation of our analysis is due to the characteristics of patents,
our main indicator of innovative activity. However, as argued in Section
3.1, patents are the only measure for innovative activity that is comparable
across countries. One might try to improve the comparability of patents by
assessing their quality in terms of citations, or their economic value based
on license income and patent renewal (Harhoff et al. 1999; Harhoff,
Scherer and Vopel 2003). Such data could be used to determine if patents
generated in large agglomerations are more valuable than those in less
densely populated areas.
The most appropriate way of regionalizing patents is by assigning
them to the residence of the inventor (for details see Maurat et al. 2008).
This process creates another limitation because our analysis cannot be
reasonably performed for very small spatial units such as inner cities or
31
suburbs. Since the inventor’s residence might be geographically distant
from her/his workplace, a small-scale definition of the region such as the
narrowly defined district or city would lead to considerably underestimating
the respective city’s level of inventive activity.21
6.3 Contribution to theory development
It goes without saying that a good theory is a radical simplification of
reality and focuses on the most relevant factors and relationships. We also
recognize the role of agglomeration economies in promoting successful
innovative activities. However, our results clearly indicate that the role of
agglomeration economies is much less pronounced than many authors
suggest (e.g., Bettencourt 2013; Carlino and Kerr 2015; Florida, Adler and
Mellander 2017), and that other factors are considerably more important
for the great majority of the countries in our sample. Hence, the popular
theory that builds almost entirely on the role of agglomeration economies
is much too simple to explain the regional distribution of innovative
activities, and is largely inappropriate for many countries.22
A case study of the geographic distribution of innovative activity in
Germany by Fritsch and Wyrwich (2020) suggests a number of other
factors that may explain the regional distribution of inventive and
innovative activity. These factors are the regional settlement structure, the
geographic distribution of knowledge sources, the local availability of
finance, the educational system, and the level of political decentralization.
The characteristics of the political system, settlement structure, and
geographic distribution of knowledge sources are, of course, related in the
sense that a federal political system may be conducive to the emergence
of a rather decentralized settlement structure, as well as geographically
21 Assigning a patent to the location of the filing organization would lead to a misspecification since many firms and organizations file their patents at the location of their headquarters even if the respective research was entirely conducted in a distant branch facility.
22 Our result show that even in the US it is not the largest agglomerations that have the highest shares of patents. This clearly indicates that any theory that prioritizes the role of agglomeration economies has limited relevance, even in outlier cases.
32
scattered institutions of research and higher education. Since the political
system and the settlement structure have pronounced historical roots and
develop over long periods of time, the historical roots, regional traditions
and cultures may play important roles (Fritsch, Obschonka and Wyrwich
2019).
6.4 Policy implications
The main policy implication of our research is that innovation does not
require large cities, but can also be successfully conducted in non-urban
environments.23 Hence, concentrating public R&D spending in large
agglomerations (see, for example, Glaeser and Hausman 2019) is not
necessarily the best strategy recommendation. Instead, policy programs
such as the EU Smart Specialization Strategy (Foray 2014; McCann 2015;
McCann and Ortega Argilés 2015) that aim at stimulating regional
development of low-density and lagging regions by initiating and
supporting innovation processes may be quite successful. If agglomeration
economies are of only limited relevance for successful innovative
activities, then such programs are not necessarily an inefficient or wasteful
allocation of resources as some scholars suggest (e.g., Glaeser and
Hausman 2019).
Since our research shows that agglomeration economies are not
the main factor determining the spatial structure of innovative activities in
most countries, the policy recommendations promoted by popular theories
to concentrate public spending on large agglomerations may be
misleading and harmful. Therefore, policymakers are strongly advised to
consider influences other than city size or population density.
6.5 Avenues for further research
An important avenue of further research could be to overcome the
limitations of our analysis due to the weaknesses of patents as an
indicator for innovative activity (Section 3.1). One step could be to develop
23 For a detailed exposition of the German case where many highly innovative firms are located in rural areas, see Fritsch and Wyrwich (2020).
33
and apply measures for the quality of a patent and compare this quality
across regions. In general, an important step forward would be the
development of more fine-tuned indicators for innovative activity that are
comparable across countries and regions.24
A key question that follows from our analyses concerns the factors
that determine the location of innovative activities and the region-specific
determinants of their success. Why is innovative activity concentrated in
certain regions? To what extent are actors attracted to certain regions to
engage in innovative activities? Why do certain non-urban areas engender
successful innovative activities? An in-depth study of the geographic
distribution of innovative activities in Germany (Fritsch and Wyrwich 2020)
identifies the important role played by the political/administrative structures
and traditions that obviously affected settlement structures, as well as the
location of knowledge sources (i.e., universities) and the financial system
on innovative activity. In particular, the German case study demonstrates
the long-lasting effect of historical factors for current structures. The
educational system, labor market regulation and the tax treatment of
inheriting a business also seem to have an effect in the German context.
The interplay of these dynamics may be suitable candidates as factors for
a closer inspection of causal relationships in case studies for other
countries.
An important element of such investigations for other countries
could be analyses of the innovation behavior of firms that are located
outside of large agglomerations. Why are some firms located in remote
rural areas innovative and economically successful? How do these firms
acquire the qualified labor that they need for their innovative activities? Do
these firms have to adapt their innovation behavior based on the locational
conditions? Is a decentralized settlement structure with a variety of easily
24 The data of the Community Innovation Survey (CIS) are not suited for an analysis across regions because innovative activities of subsidiary locations of a firm are all assigned to the firm’s headquarter and not to the region where the R&D took place. See https://ec.europa.eu/eurostat/web/microdata/community-innovation-survey
34
accessible smaller and medium-sized cities (as it is found in many parts of
Europe) important for innovative activities in rural areas?
Metropolitan areas and rural regions may have differing sources of
inspiration that drive innovation. Based on this presumption, firms in rural
and peripheral regions may focus on different types of innovations, or
have different modes of innovative activity than firms in large urban areas.
It has been argued that actors in rural areas engage in incremental
innovations, while radical innovation primarily takes place in cities
(Duranton and Puga 2011; Shearmur 2011). For example, there is
evidence that digital technologies are spurring an increase in the
concentration of innovative activities in selected cities (Paunov et al.
2019). There also seems to be a tendency for start-up activity in new high-
tech sectors becoming more concentrated in cities (Florida and King 2018;
Fritsch and Wyrwich 2020).
Another appropriate avenue for future research is to investigate and
explain the role of public policy in this respect. How can public policy effect
the geographic distribution of innovative activities? To what extent does
policy aimed at rural and lagging areas stimulate innovative activities? Can
an appropriate time period be established in which to expect significant
changes of regional innovative activities? Do differing national and local
policies of OECD countries explain the existing differences in the role that
metropolitan areas play in innovative activity?
Any of these analyses could focus on, or distinguish between
different types of innovation, such as radical vs. incremental, high vs. low
tech, science-based vs. engineering or artistic-based. Such types of
empirical analyses should help to provide a more relevant basis for policy
decisions than the simple “big is efficient” paradigm.
35
References
Asheim, B.T., A. Isaksen and M. Trippl (2019): Advanced Introduction to Regional Innovation Systems. Cheltenham: Elgar.
Bettencourt, L.M.A., J. Lobo and D. Strumsky (2007): Invention in the city: Increasing returns to patenting as a scaling function of metropolitan size. Research Policy, 36, 107-120. https://doi.org/10.1016/j.respol.2006.09.026
Bettencourt, L.M.A. (2013): The Origins of Scaling in Cities. Science, 340, 1438-1441. https://doi.org/10.1126/science.1235823
Bettencourt, L.M.A. and José Lobo (2016): Urban Scaling in Europe. Journal of the Royal Society Interface, 13, 20160005, http://dx.doi.org/10.1098/rsif.2016.0005
Blind, K., J. Edler, R. Frietsch and U. Schmoch (2006): Motives to patent: Empirical evidence from Germany. Research Policy, 35(5), 655-672. https://doi.org/10.1016/j.respol.2006.03.002
Breschi, S. and C. Lenzi (2016): Co-invention networks and inventive productivity in US cities. Journal of Urban Economics, 92, 66-75. https://doi.org/10.1016/j.jue.2015.12.003
Carlino, G.A. and W.R. Kerr (2015): Agglomeration and Innovation. In Gilles Duranton, Vernon Henderson and William Strange (eds.): Handbook of Regional and Urban Economics. Vol. 5A, Amsterdam, Elsevier, pp. 349-404. https://doi.org/10.1016/B978-0-444-59517-1.00006-4
Ciccone, A. and R.E. Hall (1996): Productivity and the Density of Economic Activity. American Economic Review, 86, 54-70. https://www.jstor.org/stable/2118255
Ciccone, Antonio (2000): Agglomeration effects in Europe. European Economic Review, 46, 213-227. https://doi.org/10.1016/S0014-2921(00)00099-4
Cohen, W.M., R.R. Nelson and J.P. Walsh (2000): Protecting their Intellectual Assets: Appropriability Conditions and why U.S. Manufacturing Firms Patent (or not). NBER Working Paper 7552. Cambridge, MA: National Bureau of Economic Research. https://www.nber.org/papers/w7552
Crescenzi, R., A. Rodríguez-Posé and M. Storper (2007): The Territorial Dynamics of Innovation: A Europe-United States Comparative Analysis. Journal of Economic Geography, 7, 673–709. https://doi.org/10.1093/jeg/lbm030
Crescenzi, R. and A. Rodríguez-Posé (2013): R&D, Socio-Economic Conditions, and Regional Innovation in the U.S. Growth and Change, 44, 287-320. https://doi.org/10.1111/grow.12011
36
Duranton G. and D. Puga (2011): Nursery Cities: Urban Diversity, Process Innovation, and the Life Cycle of Products. American Economic Review, 90, 1454-1477.
Duranton G. and D. Puga (2004): Micro-foundation of urban agglomeration economies. In Vernon Henderson and Jaques Thisse (eds): Handbook of Regional and Urban Economics. Vol. 4, Amsterdam: Elsevier, 2063-2117. https://doi.org/10.1016/S0169-7218(04)07048-0
Faberman, R.L. and M. Freedman (2016): The urban density premium across establishments. Journal of Urban Economics, 93, 71-84. https://doi.org/10.1016/j.jue.2016.03.006
Feldman, M. and D. Kogler (2010): Stylized Facts in the Geography of Innovation. In Bronwyn H. Hall and Nathan Rosenberg (eds.): Handbook of the Economics of Innovation. Vol. 1, Amsterdam: North Holland Publishers, pp. 381-410. https://doi.org/10.1016/S0169-7218(10)01008-7
Florida, R. (2002): The Rise of the Creative Class. New York: Basic Books
Florida, R., P. Adler and C. Mellander (2017): The City as Innovation Machine. Regional Studies, 51, 86-96. http://dx.doi.org/10.1080/00343404.2016.1255324
Florida, R. and K. King (2018): Urban Start-up Districts: Mapping Venture Capital and Start-up Activity Across ZIP Codes. Economic Development Quarterly, 32 99-118. http://dx.doi.org/10.1177/0891242418763731.
Foray, D. (2014): From smart specialisation to smart specialisation policy. European Journal of Innovation Management, 17, 492-507. http://dx.doi.org/10.1108/EJIM-09-2014-0096
Fritsch, M. and V. Slavtchev (2011): Determinants of the Efficiency of Regional Innovation Systems. Regional Studies, 45, 905-918. https://doi.org/10.1080/00343400802251494
Fritsch, M., M. Obschonka and M. Wyrwich (2019): Historical Roots of Entrepreneurship-facilitating Culture and Innovation Activity―An Analysis for German Regions. Regional Studies, 53, 1296-1307. https://doi.org/10.1080/00343404.2019.1580357
Fritsch, M. und M. Wyrwich (2020): Does Successful Innovation Require Large Cities? Germany as a Counterexample. Jena Economic Research Papers #2020-004, Friedrich Schiller University Jena.
Glaeser, E.L. (2011): Triumph of the City – How Our Greatest Invention Makes us Richer, Smarter, Greener, Healthier and Happier. New York: Penguin Press.
Glaeser, E.L. and N. Hausman (2019): The Spatial Mismatch Between Innovation and Joblessness. NBER Working Paper No. 25913, Cambridge, MA: National Bureau of Economic Research.
Gomez-Lievano, A., O. Patterson-Lomba and R. Hausmann (2016): Explaining the Prevalence, Scaling and Variance of Urban
37
Phenomena. Nature Human Behavior, 1, 0012. https://doi.org/10.1038/s41562-016-0012
Graffenberger, M., L. Vonnahme, M. Brachert and T. Lang (2019): Broadening perspectives: innovation outside of agglomerations. In Knut Koschatzky and Thomas Stahlecker (eds.): Innovation-based Regional Change in Europe: Chances, Risks and Policy Implications. Stuttgart: Fraunhofer Verlag, pp. 47-68.
Griliches, Z. (1990): Patent statistics as economic indicators: A survey. Journal of Economic Literature, 28, 1661-1707. https://www.jstor.org/stable/2727442
Grillitsch, M. and M. Nilsson (2015): Innovation in peripheral regions: Do collaborations compensate for a lack of local knowledge spillovers? The Annals of Regional Science, 54, 299–321. https://doi.org/10.1007/s00168-014-0655-8
Harhoff, D., F. Narin, F.M. Scherer and K. Vopel (1999): Citation Frequency and the Value of Patented Inventions. Review of Economics and Statistics, 81, 511-515. https://doi.org/10.1162/003465399558265
Harhoff, D., F.M. Scherer and K. Vopel (2003): Citations, Family Size, Opposition and the Value of Patent Rights-Evidence for Germany. Research Policy, 32, 1343-1363. https://doi.org/10.1016/S0048-7333(02)00124-5
Helsley, R.W. and W.C. Strange (2002): Innovation and input sharing. Journal of Urban Economics, 51, 25-45. https://doi.org/10.1006/juec.2001.2235
Helsley, R.W. and W.C. Strange (2011): Entrepreneurs and cities: Complexity, thickness and balance. Regional Science and Urban Economics, 41, 550-559. https://doi.org/10.1016/j.regsciurbeco.2011.04.001
Jacobs, J. (1969): The Economy of Cities. Vintage Books, New York.
Maraut, S., H. Dernis, C. Webb, V. Spiezia and D. Guellec (2008): The OECD REGPAT Database: A Presentation. OECD Science, Technology and Industry Working Papers, 2008/02, OECD Publishing. http://dx.doi.org/10.1787/241437144144
McCann, P. (2015): The Regional and Urban Policy of the European Union. Cheltenham: Elgar.
McCann, P. and R. Ortega-Argilés (2015): Smart specialization, regional growth and applications to European Union cohesion policy. Regional Studies, 49, 1291-1302. https://doi.org/10.1080/00343404.2013.799769
Moretti, E. (2019): The Effect of High-Tech Clusters on the Productivity of Top Inventors Enrico Moretti. NBER Working Paper No. 26270, Cambridge, Ma.: National Bureau of Economic Research.
38
Nagaoka, S., K. Motohashi and A. Goto (2010): Patent Statistics as an Innovation Indicator. In Bronwyn H. Hall and Nathan Rosenberg (eds.): Handbook of the Economics of Innovation. Vol. 2, Dordrecht: Elsevier, pp. 1083-1127. https://doi.org/10.1016/S0169-7218(10)02009-5
Neffke, F. (2017): Coworker complementarity. Mimeo, Boston MA: Harvard University.
OECD (2012): Redefining “urban”: A new way to measure metropolitan areas. Paris: OECD Publishing.
Paunov, C., D. Guellec, N. El-Mallakh, S. Planes-Satorra and L. Nuese (2019): On the concentration of innovation in top cities in the digital age. OECD Science, Technology and Innovation Policy Papers No. 85.
Puga, D. (2010): The Magnitude and Causes of Agglomeration Economies. Journal of Regional Science. 50, 203-219. https://doi.org/10.1111/j.1467-9787.2009.00657.x
Shearmur, Ri. (2011): Innovation, Regions and Proximity: From Neo-Regionalism to Spatial Analysis. Regional Studies, 45, 1225-1243. https://doi.org/10.1080/00343404.2010.484416
Storper, M. and A.J. Venables (2004), Buzz: Face-to-face contact and the urban economy. Journal of Economic Geography 4, 351–70.
Storper, M. (2018): Regional Innovation Transition. In Johannes Glückler, Roy Suddaby and Regina Lenz (eds.): Knowledge and Institutions. Cham: Springer, pp. 197-225. https://doi.org/10.1007/978-3-319-75328-7_10
39
Appendix
Tables
Table A1: Number of regions by spatial category in selected OECD countries
Notes: ***: statistically significant at the 1 percent level; **: statistically significant at the 5 percent level; * statistically significant at the 10 percent level. Standard errors are robust.
42
Table A5: Summary of urban scaling based on the number of regional inventors (inventor productivity) across all regions
Standard error
Limits of five percent confidence interval Difference to
Notes: ***: statistically significant at the 1 percent level. **: statistically significant at the 5 percent level; *: statistically significant at the 10 percent level. Standard errors are robust.
43
Table A6: Summary of urban scaling based on the number of regional inventors (inventor productivity) across metropolitan regions (population > 500,000 population)
Coefficient
Standard error
Limits of five percent confidence interval Difference to
the US lower upper N R2 Year 2000 All countries 1.004*** 0.006 0.992 1.016 223 0.989 USA 0.988*** 0.006 0.975 1.000 74 0.996 France 1.024*** 0.021 0.977 1.070 14 0.988 n.s. UK 1.017*** 0.021 0.974 1.061 20 0.991 n.s. Japan 1.010*** 0.014 0.981 1.039 30 0.994 n.s. South Korea 1.000*** 0.049 0.879 1.122 8 0.983 n.s. Germany 1.020*** 0.020 0.979 1.061 26 0.992 n.s. Spain 0.957*** 0.053 0.831 1.084 9 0.984 n.s. Canada 0.989*** 0.027 0.927 1.051 11 0.988 n.s. Italy 1.034*** 0.042 0.941 1.127 13 0.977 n.s. Switzerland 1.071* 0.140 -0.714 2.856 3 0.967 n.s. Sweden 0.899* 0.112 -0.521 2.319 3 0.97 n.s. Poland 0.964*** 0.010 0.939 0.989 8 0.993 ** Czech Republic - - - - - - - Hungary 0.965*** 0.010 0.842 1.088 3 1 **
Notes: ***: statistically significant at the 1 percent level. **: statistically significant at the 5 percent level; *: statistically significant at the 10 percent level. Standard errors are robust.
44
Table A7: Innovation activity in small and medium-sized metropolitan areas (250 000 to 1.5 million population) across selected OECD countries