Page 1
Washington University in St. Louis Washington University in St. Louis
Washington University Open Scholarship Washington University Open Scholarship
Engineering and Applied Science Theses & Dissertations McKelvey School of Engineering
Summer 8-15-2021
Human iPSC Tissue-Engineered Cartilage for Disease Modeling of Human iPSC Tissue-Engineered Cartilage for Disease Modeling of
Skeletal Dysplasia-Causing TRPV4 Mutations Skeletal Dysplasia-Causing TRPV4 Mutations
Amanda R. Dicks Washington University in St. Louis
Follow this and additional works at: https://openscholarship.wustl.edu/eng_etds
Part of the Biomedical Engineering and Bioengineering Commons, Cell Biology Commons, and the
Developmental Biology Commons
Recommended Citation Recommended Citation Dicks, Amanda R., "Human iPSC Tissue-Engineered Cartilage for Disease Modeling of Skeletal Dysplasia-Causing TRPV4 Mutations" (2021). Engineering and Applied Science Theses & Dissertations. 652. https://openscholarship.wustl.edu/eng_etds/652
This Dissertation is brought to you for free and open access by the McKelvey School of Engineering at Washington University Open Scholarship. It has been accepted for inclusion in Engineering and Applied Science Theses & Dissertations by an authorized administrator of Washington University Open Scholarship. For more information, please contact [email protected] .
Page 2
WASHINGTON UNIVERSITY IN ST. LOUIS
McKelvey School of Engineering and Applied Science
Department of Biomedical Engineering
Dissertation Examination Committee:
Farshid Guilak, Chair
Nathaniel Huebsch
Spencer Lake
Ingrid Meulenbelt
Simon Tang
Human iPSC Tissue-Engineered Cartilage for
Disease Modeling of Skeletal Dysplasia-Causing TRPV4 Mutations
by
Amanda Dicks
A dissertation presented to
The Graduate School
of Washington University in
partial fulfillment of the
requirements for the degree
of Doctor of Philosophy
August 2021
St. Louis, Missouri
Page 3
© 2021, Amanda Dicks
Page 4
ii
Table of Contents
List of Figures .............................................................................................................................. viii
List of Tables ................................................................................................................................. xi
Acknowledgements ....................................................................................................................... xii
Abstract ......................................................................................................................................... xv
Chapter 1 Introduction ................................................................................................................... 1
1.1 Abstract ............................................................................................................................. 1
1.2 Cartilage Development and Homeostasis ......................................................................... 1
1.2.1 Chondrocyte differentiation ................................................................................... 2
1.2.2 Cartilage homeostasis ............................................................................................ 3
1.3 Transient Receptor Potential Vanilloid 4 .......................................................................... 5
1.4 Cartilage Diseases ............................................................................................................. 6
1.4.1 Arthritis .................................................................................................................. 6
1.4.2 Skeletal dysplasias ................................................................................................. 8
1.5 Tissue-Engineered Cartilage ........................................................................................... 10
1.5.1 Cell sources .......................................................................................................... 10
1.5.2 hiPSC chondrogenesis ......................................................................................... 11
1.6 In Vitro Disease Modeling and Therapeutic Development ............................................ 13
1.7 Summary ......................................................................................................................... 14
1.8 References ....................................................................................................................... 15
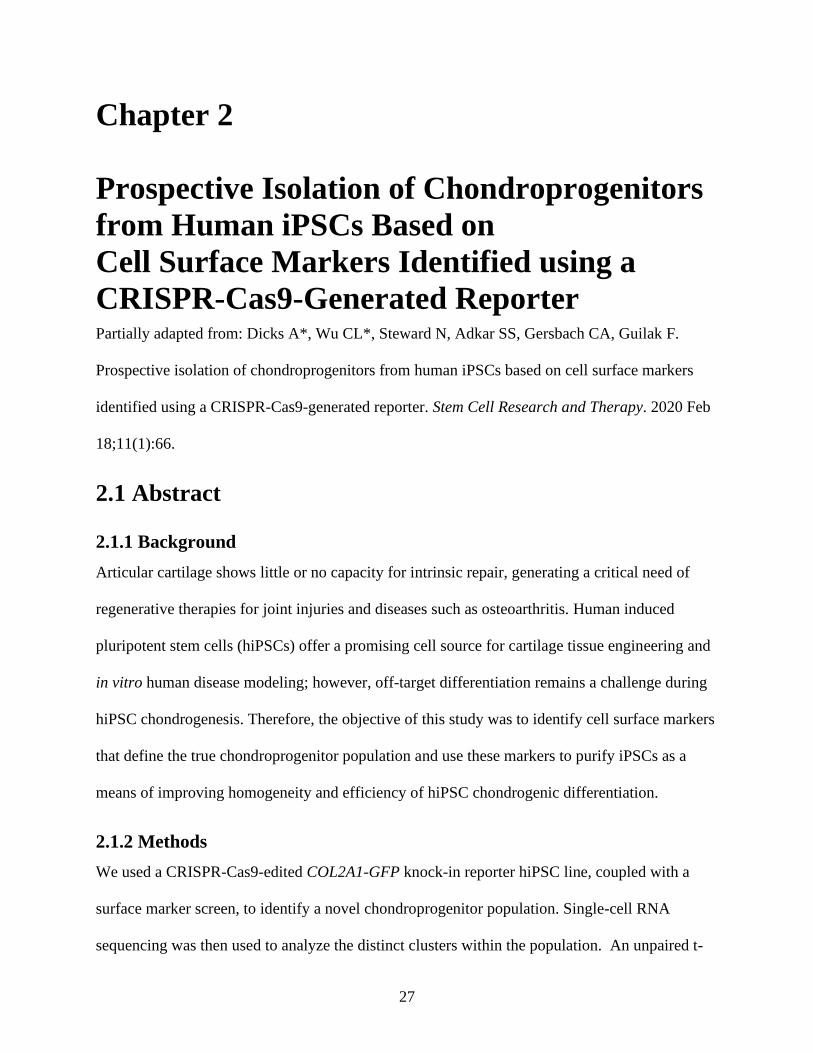
Chapter 2 Prospective Isolation of Chondroprogenitors from Human iPSCs Based on Cell
Surface Markers Identified using a CRISPR-Cas9-Generated Reporter .................... 27
2.1 Abstract ........................................................................................................................... 27
2.1.1 Background .......................................................................................................... 27
2.1.2 Methods................................................................................................................ 27
2.1.3 Results .................................................................................................................. 28
2.1.4 Conclusions .......................................................................................................... 28
2.2 Introduction ..................................................................................................................... 28
2.3 Methods........................................................................................................................... 30
2.3.1 hiPSC lines and culture ........................................................................................ 31
2.3.2 Mesodermal differentiation .................................................................................. 31
2.3.3 Fluorescent activated cell sorting (FACS) ........................................................... 32
2.3.4 10X chromium platform scRNA-seq ................................................................... 33
2.3.5 Preprocessing of scRNA-seq data ........................................................................ 34
2.3.6 Unsupervised clustering analysis and cell cluster annotation .............................. 34
2.3.7 Canonical correlation analysis for integrated analysis of sorted and unsorted
scRNA-seq data ................................................................................................... 35
Page 5
iii
2.3.8 Expansion of chondroprogenitor cells ................................................................. 36
2.3.9 Chondrogenic differentiation ............................................................................... 36
2.3.10 Histology ............................................................................................................ 37
2.3.11 Immunohistochemistry ...................................................................................... 37
2.3.12 Biochemical analysis ......................................................................................... 37
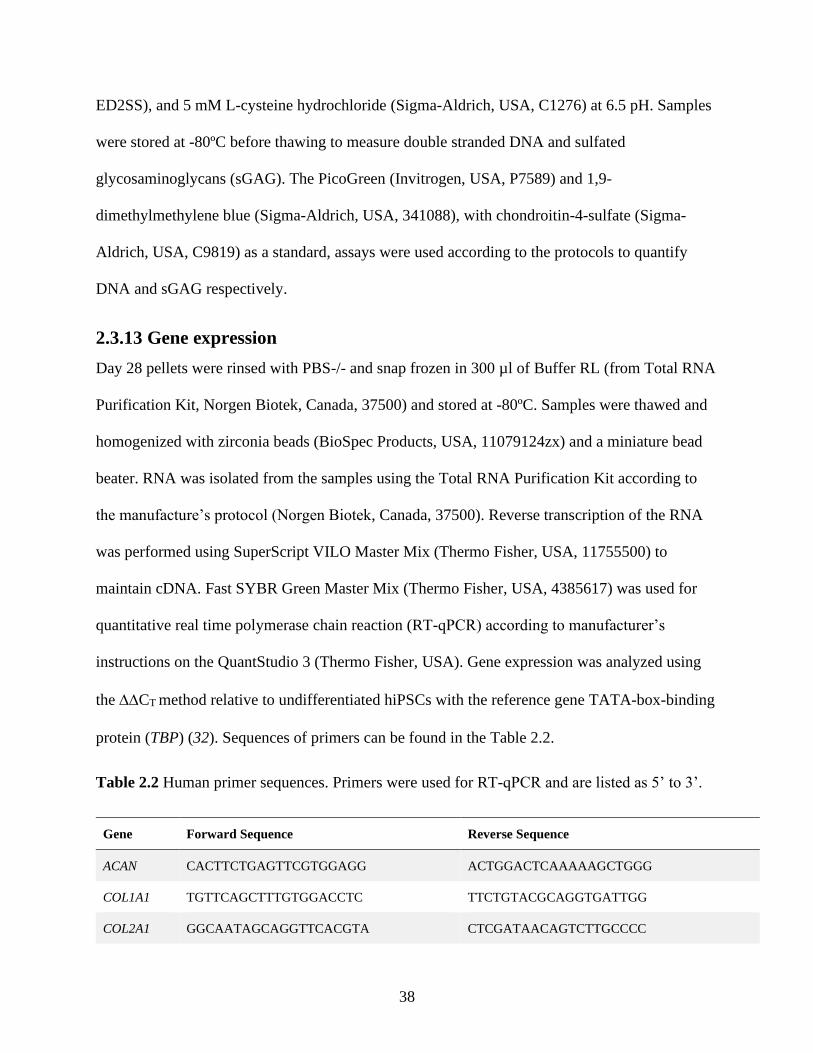
2.3.13 Gene expression ................................................................................................. 38
2.3.14 Statistical analysis .............................................................................................. 39
2.4 Results ............................................................................................................................. 39
2.4.1 COL2A1-positive chondroprogenitor cells express PDGFR, CD146, and CD166
............................................................................................................................. 39
2.4.2 PDGFR, CD146, and CD166 enriched chondroprogenitor cells ....................... 40
2.4.3 scRNA-seq reveals that unsorted chondroprogenitor cells contained diverse cell
populations .......................................................................................................... 42
2.4.4 scRNA-seq reveals that sorting enriched SOX9/COL2A1+ cells ....................... 44
2.4.5 Canonical correlation analysis (CCA) demonstrates high enrichment of
proliferative and mesenchymal genes in sorted chondroprogenitor cells ........... 47
2.4.6 Sorting improved matrix production and homogeneity in cartilaginous pellets .. 49
2.4.7 Expression of cartilaginous genes was significantly higher in pellets derived from
triple positive chondroprogenitor cells ................................................................ 50
2.4.8 Chondrogenic capacity was maintained through one passage of unsorted and
sorted chondroprogenitor cells ............................................................................ 51
2.5 Discussion ....................................................................................................................... 52
2.6 Supplemental Figures...................................................................................................... 57
2.7 Conclusion ...................................................................................................................... 61
2.8 References ....................................................................................................................... 62
Chapter 3 Single Cell Transcriptomic Analysis of Human Pluripotent Stem Cell Chondrogenesis
..................................................................................................................................... 67
3.1 Abstract ........................................................................................................................... 67
3.2 Introduction ..................................................................................................................... 68
3.3 Methods........................................................................................................................... 69
3.3.1 hiPSC lines and culture ........................................................................................ 69
3.3.2 hMSCs and culture ............................................................................................... 70
3.3.3 Mesodermal differentiation .................................................................................. 70
3.3.4 Chondrogenic differentiation ............................................................................... 71
3.3.5 C59 and ML329 treatment for Wnt and MITF inhibition ................................... 72
3.3.6 Wnt ligands treatment during chondrogenesis ..................................................... 72
3.3.7 Animal experiments ............................................................................................. 73
3.3.8 RNA isolation, library preparation, and bulk RNA-seq ...................................... 74
3.3.9 Preprocessing of bulk RNA-seq data ................................................................... 74
3.3.10 DEGs and GO enrichment analysis and of bulk RAN-seq data ........................ 75
Page 6
iv
3.3.11 10X chromium platform scRNA-seq ................................................................. 76
3.3.12 Preprocessing of scRNA-seq data ...................................................................... 77
3.3.13 Unsupervised clustering analysis and annotation .............................................. 77
3.3.14 Cell cycle analysis of scRNA-seq data .............................................................. 78
3.3.15 CCA for integrated analysis of multiple scRNA-seq datasets ........................... 79
3.3.16 Pseudotemporal ordering and lineage trajectories ............................................. 79
3.3.17 WGCNA reconstruction of GRNs and hub genes ............................................. 80
3.3.18 Multicellular signaling and ligand-receptor models .......................................... 81
3.3.19 RNA Fluorescence in situ hybridization (RNA-FISH) ...................................... 82
3.3.20 Fluorescent activated cell sorting (FACS) for progenitors ................................ 82
3.3.21 Histology ............................................................................................................ 83
3.3.22 Immunohistochemistry ...................................................................................... 83
3.3.23 Biochemical analysis of cartilaginous matrix production .................................. 84
3.3.24 RT-qPCR............................................................................................................ 84
3.3.25 Western blots ..................................................................................................... 85
3.3.26 Statistical analysis .............................................................................................. 86
3.3.27 Data availability ................................................................................................. 86
3.4 Results ............................................................................................................................. 87
3.4.1 Bulk RNA-seq indicates successful differentiation of hiPSCs ............................ 87
3.4.2 in vitro characterization of hiPSC-derived chondrocytes .................................... 90
3.4.3 in vivo characterization of hiPSC-derived chondrocytes..................................... 91
3.4.4 scRNA-seq mapping of cellular heterogeneity .................................................... 93
3.4.5 Lineage bifurcation in hiPSC differentiation trajectory....................................... 94
3.4.6 WGCNA identifies GRNs of neurogenesis and melanogenesis .......................... 95
3.4.7 Inhibition of Wnt signaling enhances hiPSC chondrogenesis ............................. 98
3.4.8 scRNA-seq confirms Wnt inhibition enhances chondrogenesis ........................ 101
3.4.9 Differential gene expression profiles after C59 treatment ................................. 106
3.4.10 Wnt expression with neurogenesis................................................................... 107
3.4.11 Wnts alter GAG/DNA and collagen production .............................................. 109
3.4.12 Heterocellular Wnt signaling may regulate chondrogenesis ........................... 110
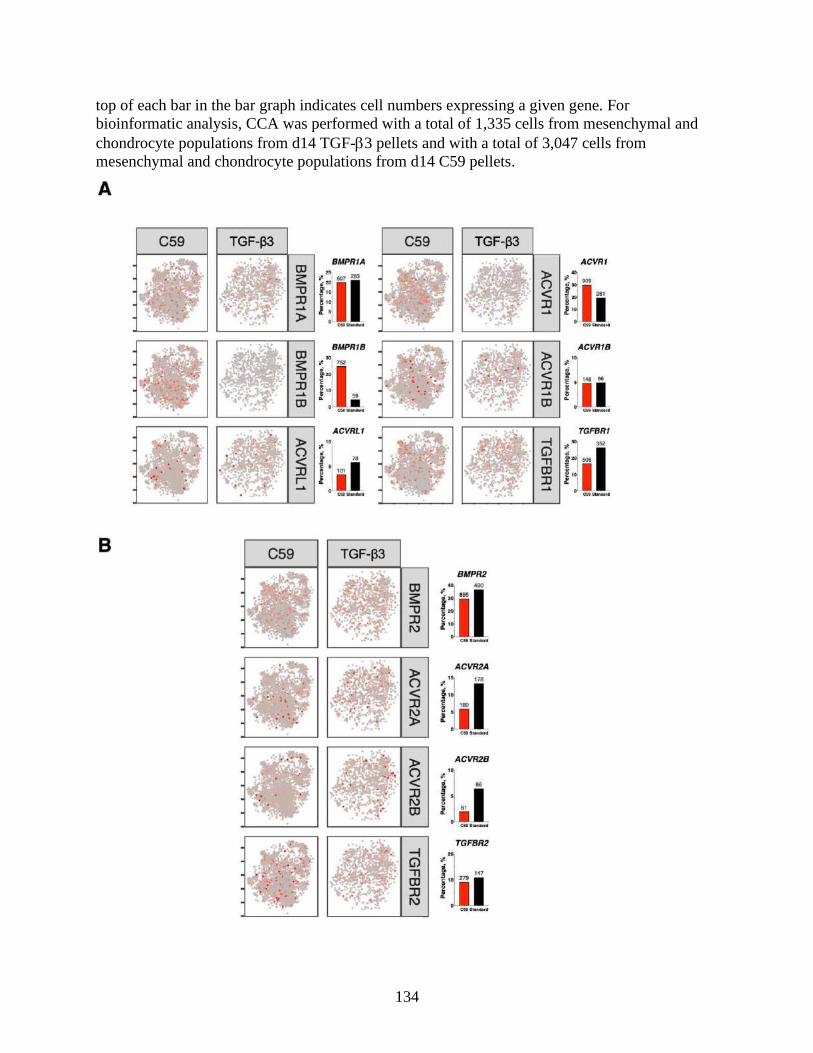
3.4.13 BMP/GDF differential expression after C59 treatment ................................... 113
3.5 Discussion ..................................................................................................................... 115
3.6 Supplemental Figures and Tables ................................................................................. 118
3.7 Conclusion .................................................................................................................... 140
3.8 References ..................................................................................................................... 141
Chapter 4 Chondrogenic Differentiation of Human Induced Pluripotent Stem Cells .............. 145
4.1 Abstract ......................................................................................................................... 145
4.2 Introduction ................................................................................................................... 145
4.2.1 Development of the protocol ............................................................................. 147
4.2.2 Applications of the protocol............................................................................... 149
Page 7
v
4.2.3 Comparison with other methods ........................................................................ 150
4.3 Experimental Design ..................................................................................................... 151
4.3.1 Cell source ......................................................................................................... 151
4.3.2 Mesodermal differentiation ................................................................................ 152
4.3.3 Chondrogenic differentiation ............................................................................. 152
4.3.4 Chondrogenic validation .................................................................................... 153
4.4 Materials ....................................................................................................................... 154
4.4.1 hiPSC culture ..................................................................................................... 154
4.4.2 Mesodermal differentiation ................................................................................ 155
4.4.3 Chondrogenic differentiation ............................................................................. 156
4.4.4 Chondrogenic validation .................................................................................... 157
4.5 Methods......................................................................................................................... 160
4.5.1 hiPSC culture ..................................................................................................... 160
4.5.2 Mesodermal differentiation ................................................................................ 162
4.5.3 Chondrogenic differentiation ............................................................................. 164
4.5.4 Chondrogenic validation .................................................................................... 166
4.6 Anticipated Results ....................................................................................................... 172
4.7 Troubleshooting Notes .................................................................................................. 178
4.8 References ..................................................................................................................... 180
Chapter 5 Skeletal Dysplasia-causing TRPV4 Mutations Suppress the Hypertrophic
Differentiation of Human iPSC-derived Chondrocytes ............................................ 185
5.1 Abstract ......................................................................................................................... 185
5.2 Introduction ................................................................................................................... 186
5.3 Methods......................................................................................................................... 188
5.3.1 hiPSC culture ..................................................................................................... 188
5.3.2 Mesodermal differentiation ................................................................................ 188
5.3.3 Chondrogenic differentiation with 3D pellet culture ......................................... 189
5.3.4 BMP4 treatment to promote hypertrophic differentiation ................................. 190
5.3.5 Dissociation of chondrogenic pellets to obtain single cell hiPSC-derived
chondrocytes ...................................................................................................... 190
5.3.6 TRPV4 agonists and antagonists ....................................................................... 191
5.3.7 Patch clamping ................................................................................................... 191
5.3.8 Confocal imaging of Ca2+ signaling ................................................................. 192
5.3.9 AFM measurement of neocartilage mechanical properties ............................... 193
5.3.10 Histology .......................................................................................................... 194
5.3.11 Biochemical analysis ....................................................................................... 194
5.3.12 Western blot ..................................................................................................... 195
5.3.13 RNA isolation .................................................................................................. 195
5.3.14 Gene expression with RT-qPCR ...................................................................... 196
5.3.15 Genome-wide mRNA sequencing ................................................................... 196
Page 8
vi
5.3.16 Transcriptomic analysis of sequencing datasets .............................................. 197
5.3.17 Statistical analysis ............................................................................................ 199
5.4 Results ........................................................................................................................... 199
5.4.1 Mutant TRPV4 has altered response to chemical agonist GSK101 .................. 199
5.4.2 Chondrogenic differentiation of WT and mutant hiPSC lines ........................... 203
5.4.3 TRPV4 mutations altered chondrogenic gene expression in hiPSC-derived
chondrocytes ...................................................................................................... 205
5.4.4 V620I and T89I mutants demonstrate similar gene expression profiles ............ 208
5.4.5 The severe T89I mutation inhibits chondrocyte hypertrophy more than moderate
V620I mutation .................................................................................................. 209
5.4.6 TRPV4 mutations exhibit dysregulated BMP4-induced chondrocyte hypertrophy
........................................................................................................................... 212
5.5 Discussion ..................................................................................................................... 217
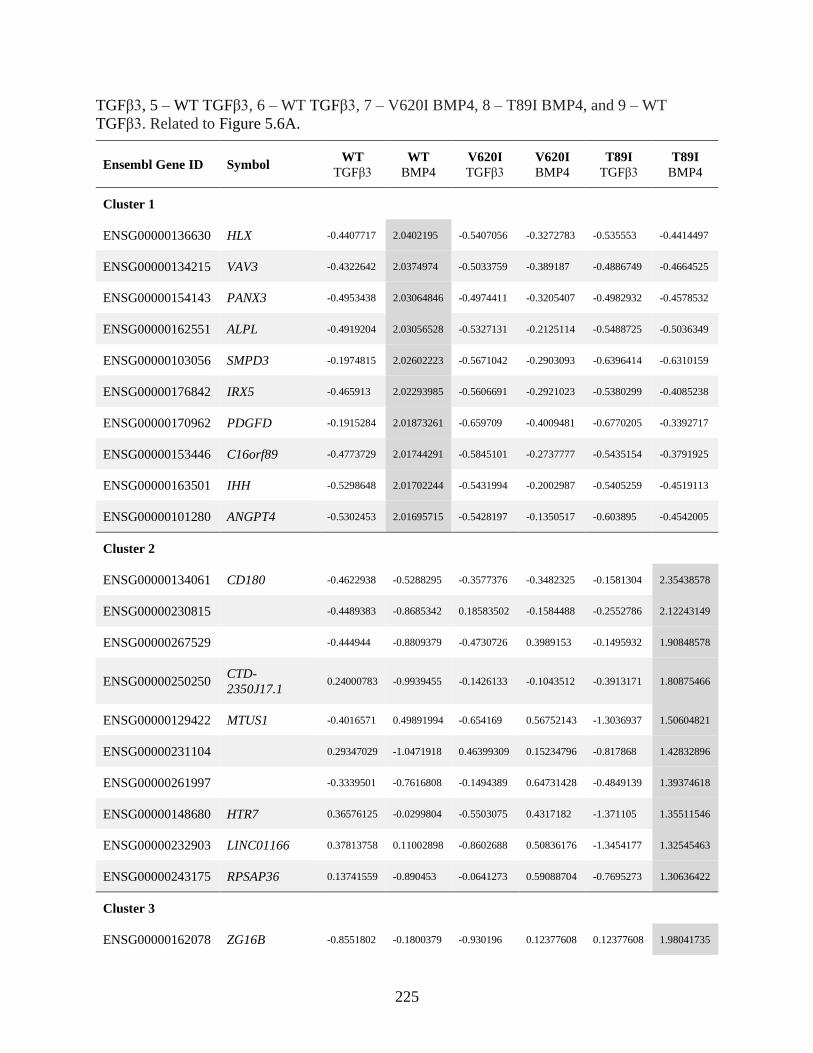
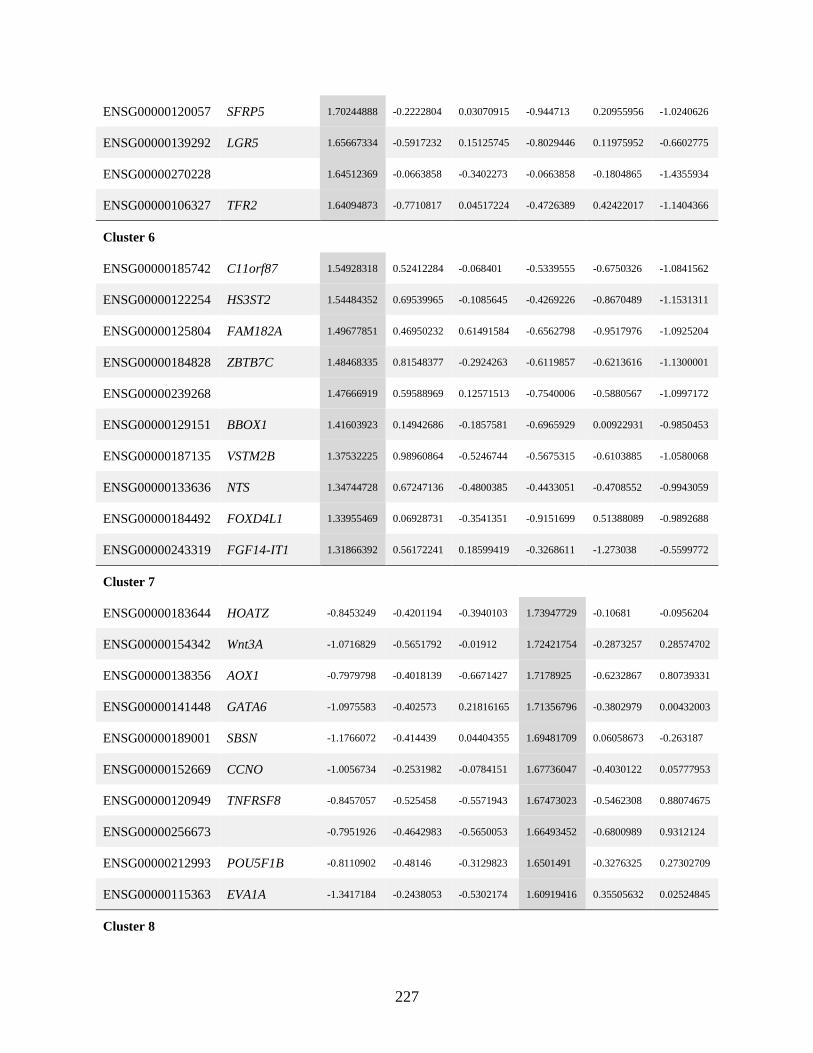
5.6 Supplemental Figures and Tables ................................................................................. 224
5.7 Conclusion .................................................................................................................... 228
5.8 References ..................................................................................................................... 229
Chapter 6 Skeletal Dysplasia-causing TRPV4 Mutations Increase Mechanosensitivity of
Human iPSC-derived Chondrocytes ......................................................................... 235
6.1 Abstract ......................................................................................................................... 235
6.2 Introduction ................................................................................................................... 236
6.3 Methods......................................................................................................................... 237
6.3.1 hiPSC culture ..................................................................................................... 237
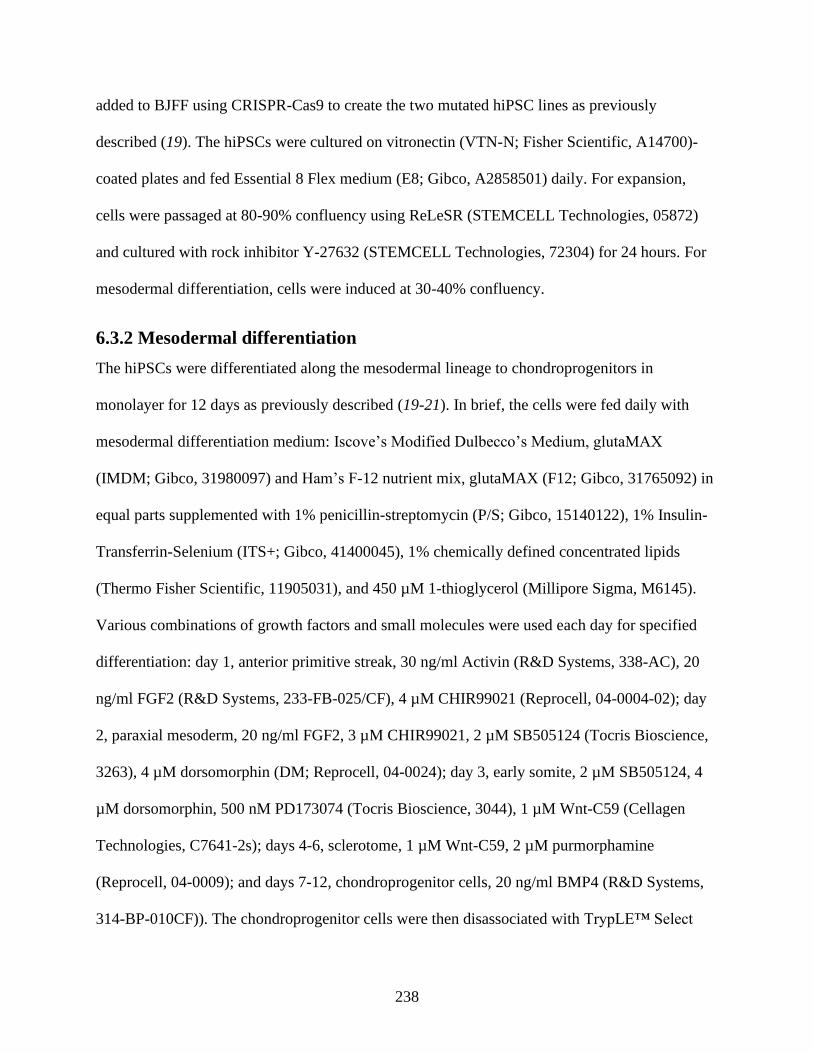
6.3.2 Mesodermal differentiation ................................................................................ 238
6.3.3 Chondrogenic differentiation ............................................................................. 239
6.3.4 Digestion of chondrogenic pellets to obtain hiPSC-derived chondrocytes ....... 239
6.3.5 Casting of hiPSC-derived chondrocytes in agarose ........................................... 239
6.3.6 Inhibition of TRPV4 during culture ................................................................... 240
6.3.7 Analysis of elastic modulus ............................................................................... 240
6.3.8 Histology ............................................................................................................ 240
6.3.9 Biochemical analysis ......................................................................................... 240
6.3.10 Sinusoidal compressive loading ....................................................................... 241
6.3.11 RNA isolation .................................................................................................. 241
6.3.12 Genome-wide mRNA sequencing ................................................................... 241
6.3.13 Transcriptomic analysis of sequencing datasets .............................................. 242
6.3.14 Statistical analysis ............................................................................................ 243
6.4 Results ........................................................................................................................... 243
6.4.1 hiPSC-derived chondrocytes secrete a cartilaginous matrix in agarose ............ 243
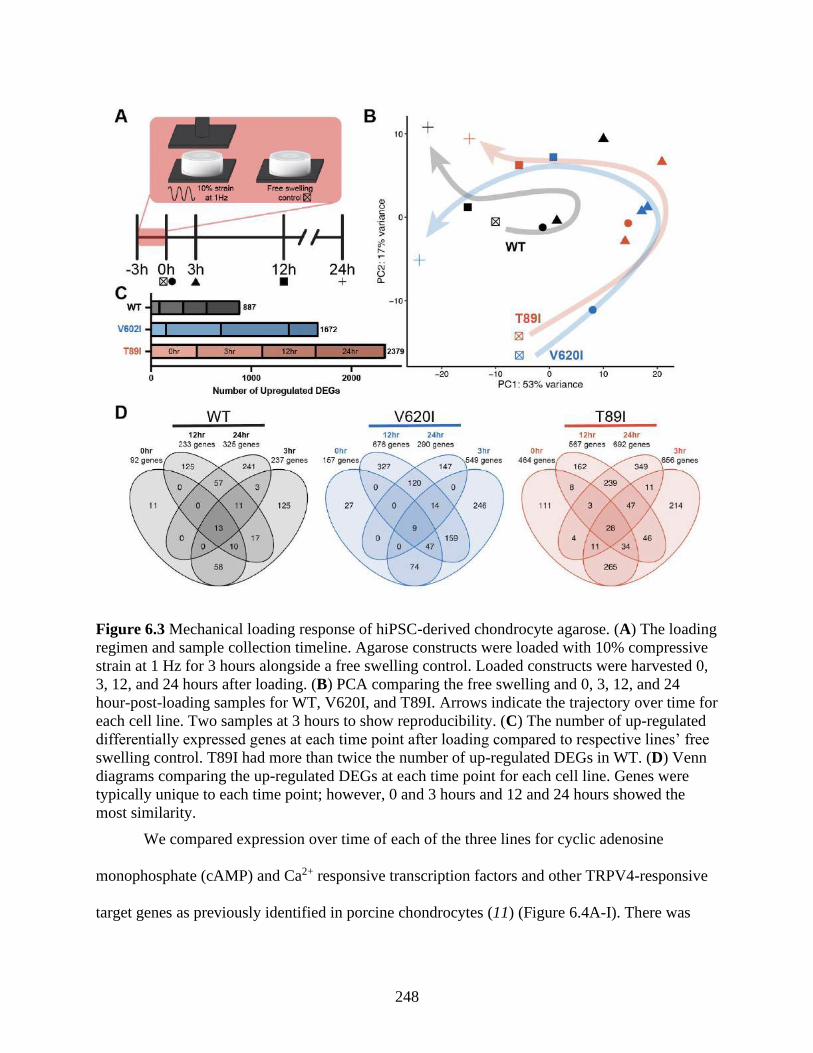
6.4.2 Mutant chondrocytes are more responsive to loading ....................................... 246
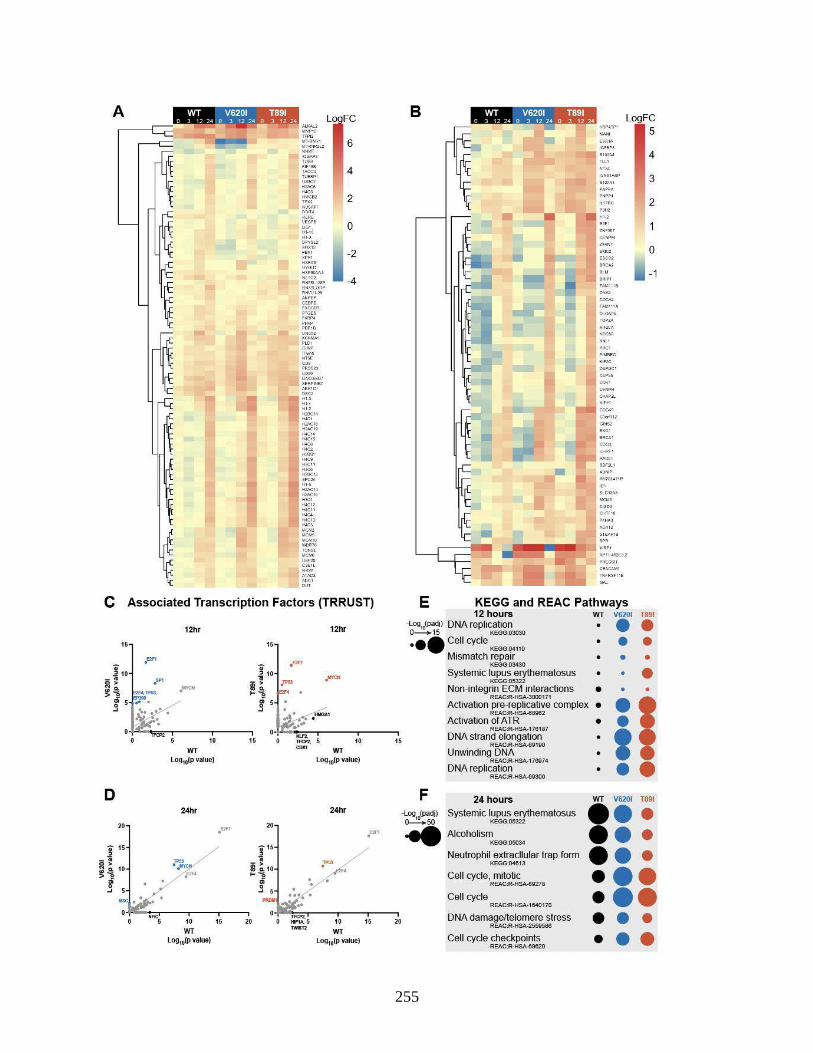
6.4.3 Proliferative genes are upregulated long-term after loading.............................. 252
6.4.4 Loading upregulates ECM-related proteins, particularly with mutant TRPV4 . 256
Page 9
vii
6.5 Discussion ..................................................................................................................... 260
6.6 Conclusion .................................................................................................................... 265
6.7 References ..................................................................................................................... 265
Chapter 7 Conclusions and Future Directions ........................................................................... 270
Curriculum Vitae ........................................................................................................................ 273
Page 10
viii
List of Figures Figure 1.1 Representation of the thesis chapters and their integration .........................................15
Figure 2.1 Surface marker analysis and sorting strategy to identify progenitors with robust
chondrogenic potential from heterogenous chondroprogenitor (CP) cells ..................41
Figure 2.2 Cell populations and GO enrichment analysis of unsorted chondroprogenitor cells ..43
Figure 2.3. Cell populations and GO enrichment analysis of sorted chondroprogenitor cells .....46
Figure 2.4 CCA for integrated analysis of sorted and unsorted scRNA-seq datasets ...................48
Figure 2.5 Histology and IHC for matrix proteins in RVR-COL2 and BJFF pellets ...................50
Figure 2.6 Quantitative analysis of matrix production and gene expression ................................51
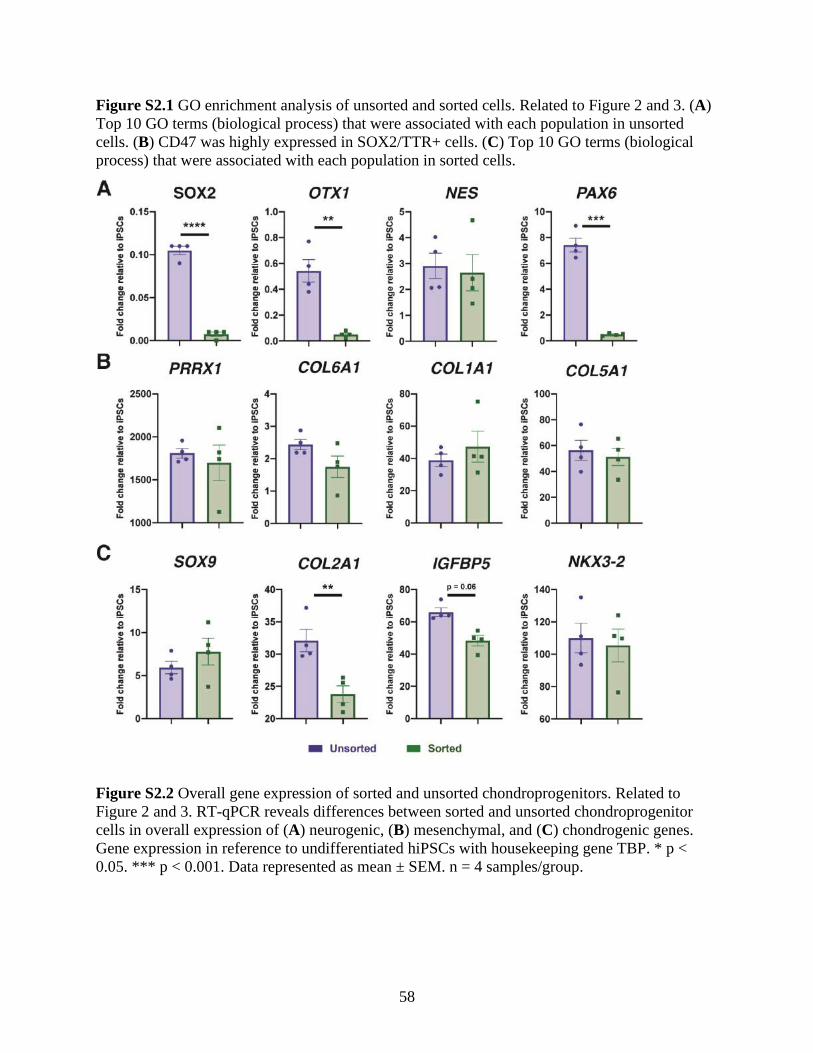
Figure S2.1 GO enrichment analysis of unsorted and sorted cells ...............................................57
Figure S2.2 Overall gene expression of sorted and unsorted chondroprogenitors .......................58
Figure S2.3 Expression profiles of pro-chondrogenic genes in sorted and unsorted
chondroprogenitor cells ............................................................................................59
Figure S2.4 Histology for matrix proteins ....................................................................................59
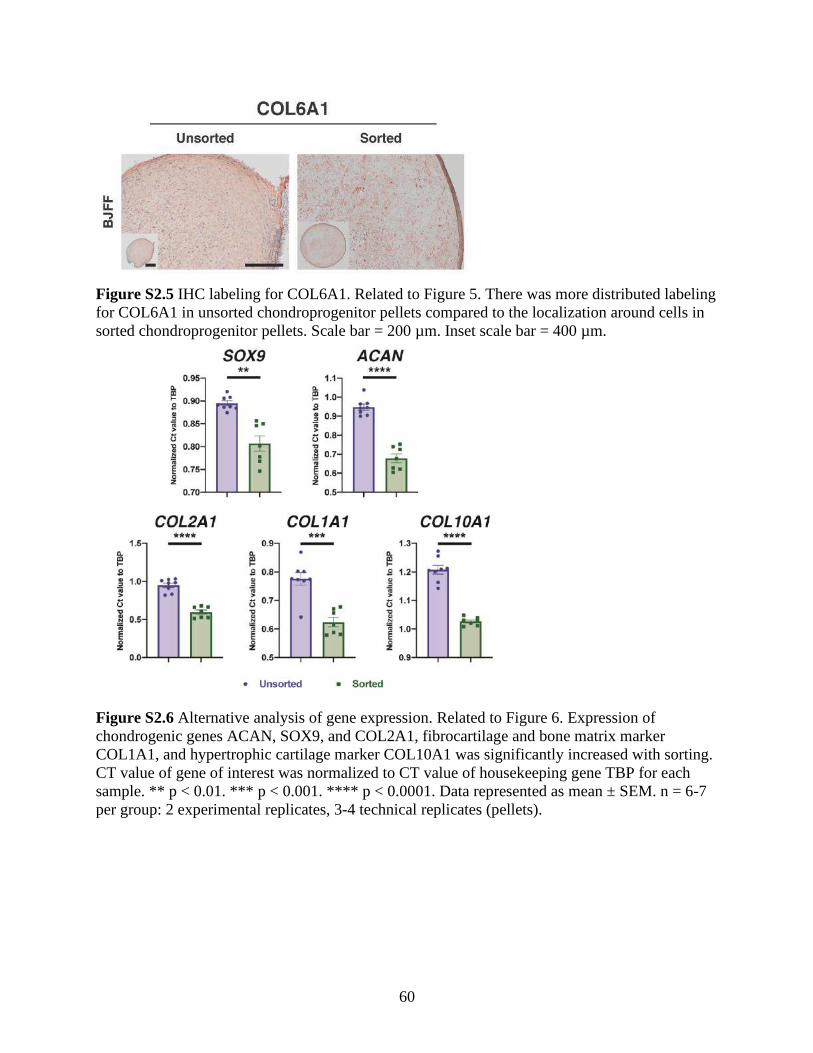
Figure S2.5 IHC labeling for COL6A1 .........................................................................................60
Figure S2.6 Alternative analysis of gene expression ....................................................................60
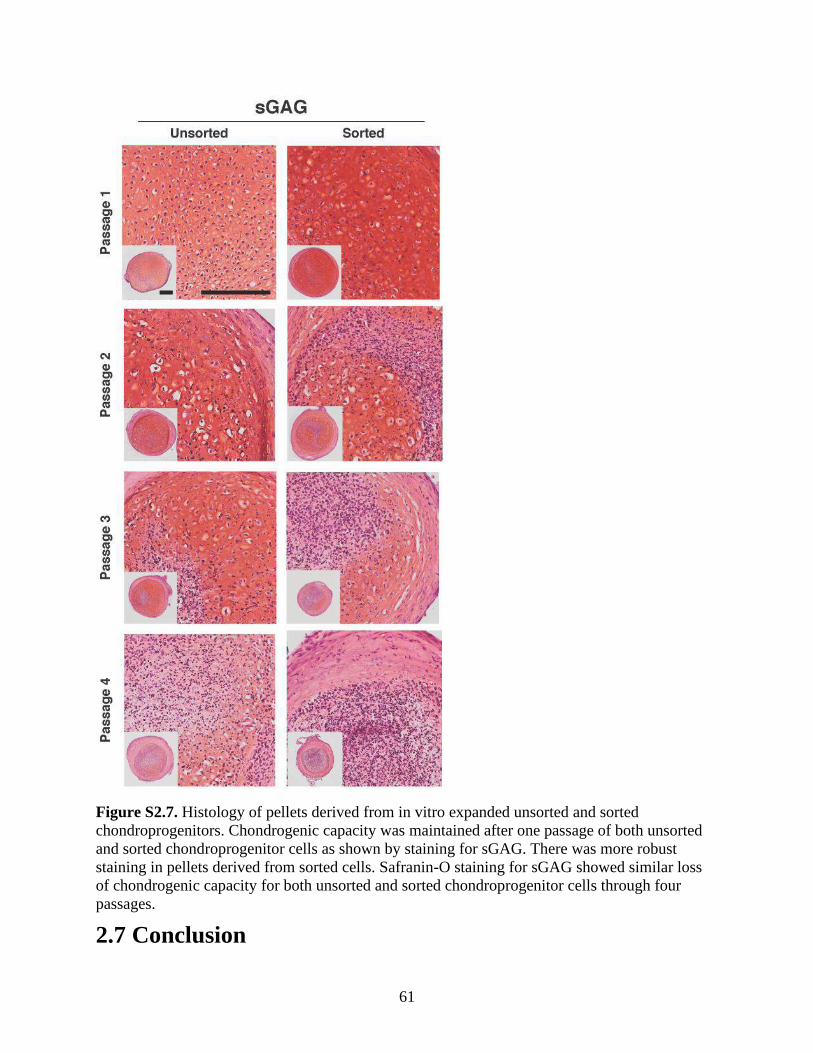
Figure S2.7. Histology of pellets derived from in vitro expanded unsorted and sorted
chondroprogenitors ........................................................................................................................61
Figure 3.1 DEGs of mesodermal and chondrogenic differentiation of 3 hiPSC lines by bulk
RNA-seq ......................................................................................................................89
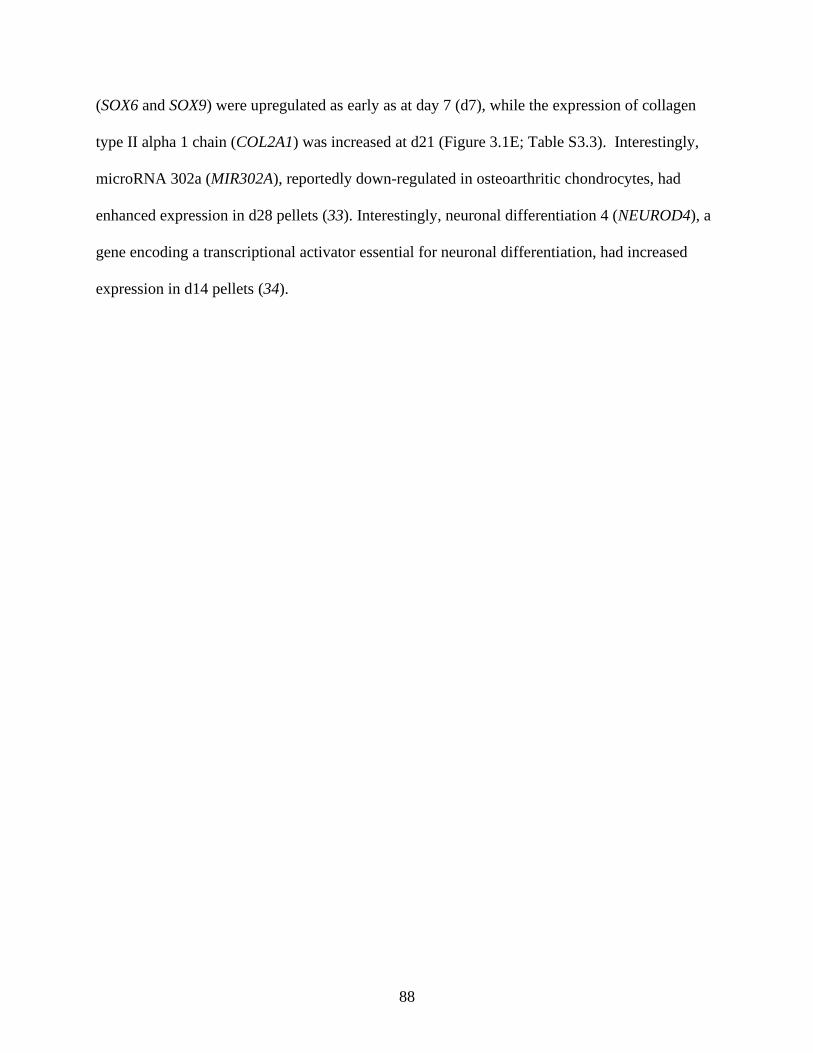
Figure 3.2 In vitro and in vivo characterization of hiPSC-derived chondrocytes .........................92
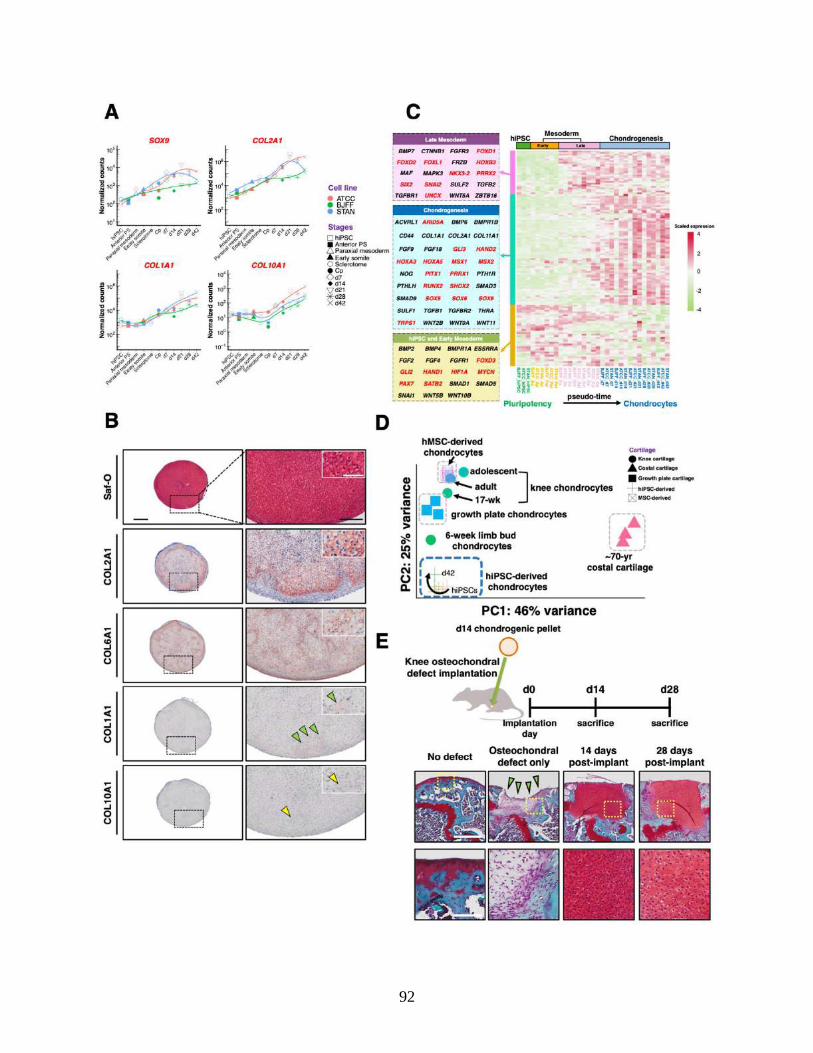
Figure 3.3 scRNA-seq and WGCNA reveal neural cells and melanocytes as off-target cells .....97
Figure 3.4 Wnt inhibition during pellet culture enhanced homogeneity of hiPSC chondrogenesis
..................................................................................................................................100
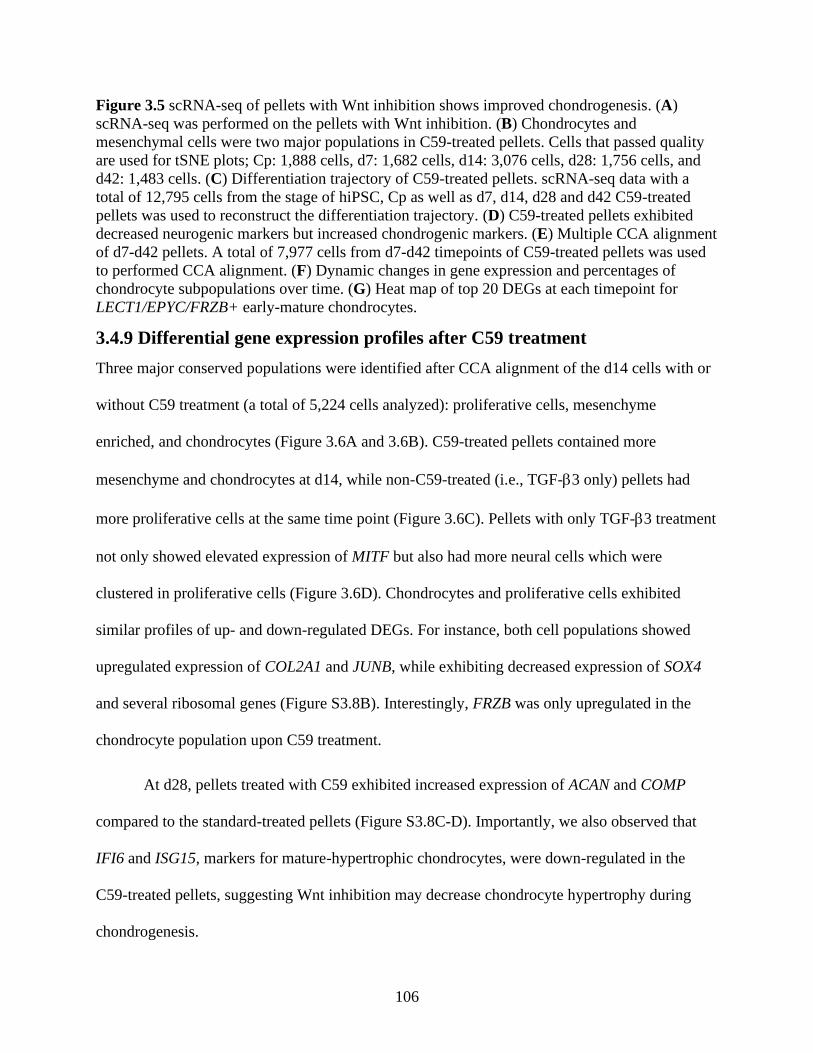
Figure 3.5 scRNA-seq of pellets with Wnt inhibition shows improved chondrogenesis ...........105
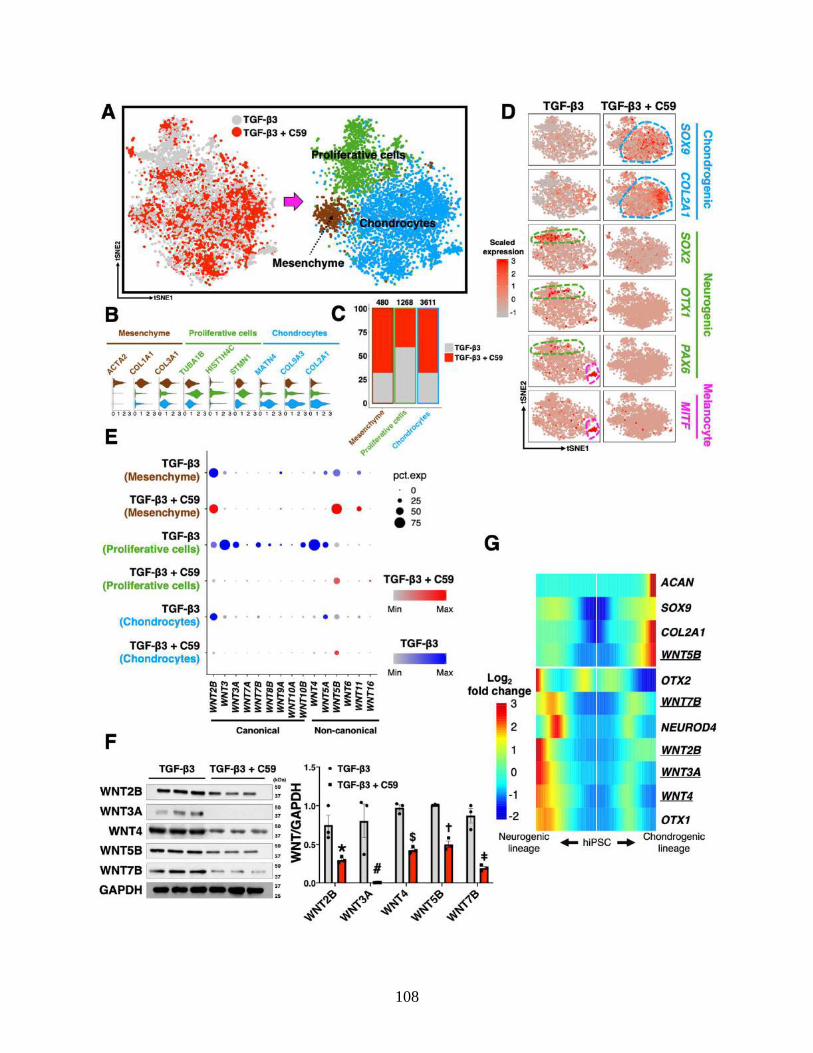
Figure 3.6 CCA analysis reveals that most Wnts, except Wnt5B, were secreted by off-target
cells ............................................................................................................................108
Figure 3.7 Heterogenous multicellular Wnt signaling models ...................................................112
Figure S3.1 Step-wise differentiation of hiPSCs toward chondrocytes via specification of
mesoderm ................................................................................................................119
Page 11
ix
Figure S3.2 GO enrichment analysis of bulk RNA-seq data and subcutaneous implantation of
hiPSC-derived chondrocytes in mice ......................................................................120
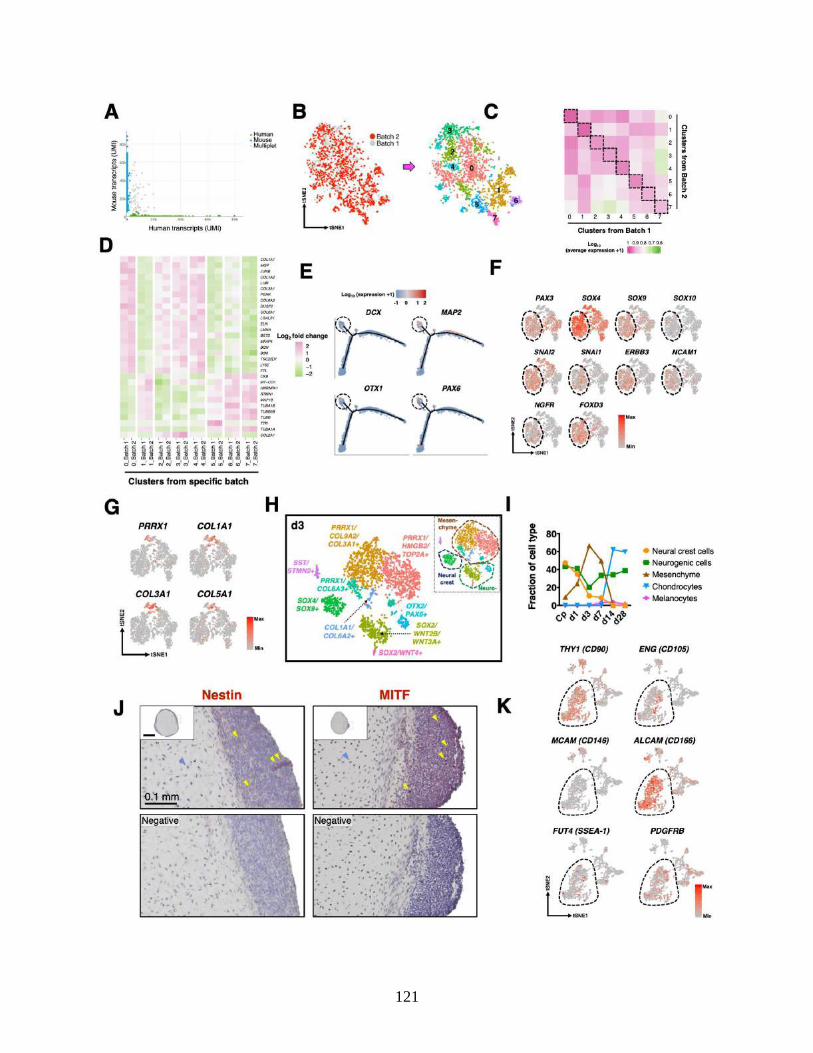
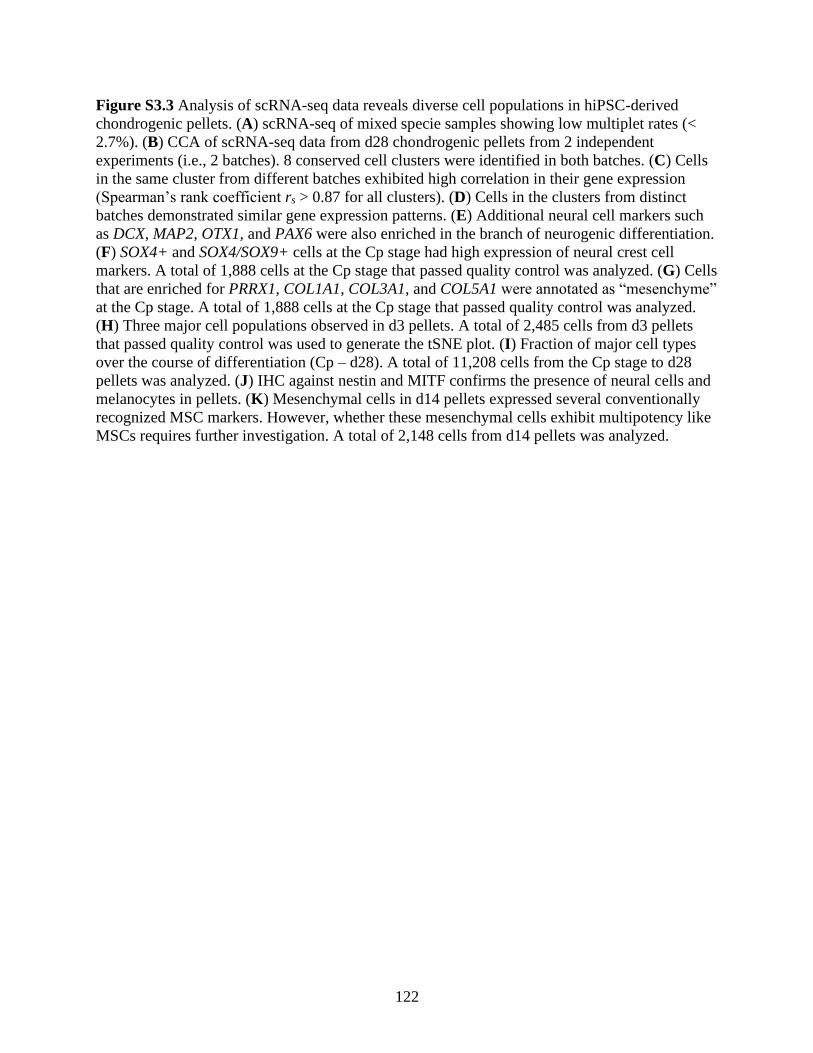
Figure S3.3 Analysis of scRNA-seq data reveals diverse cell populations in hiPSC-derived
chondrogenic pellets ...............................................................................................121
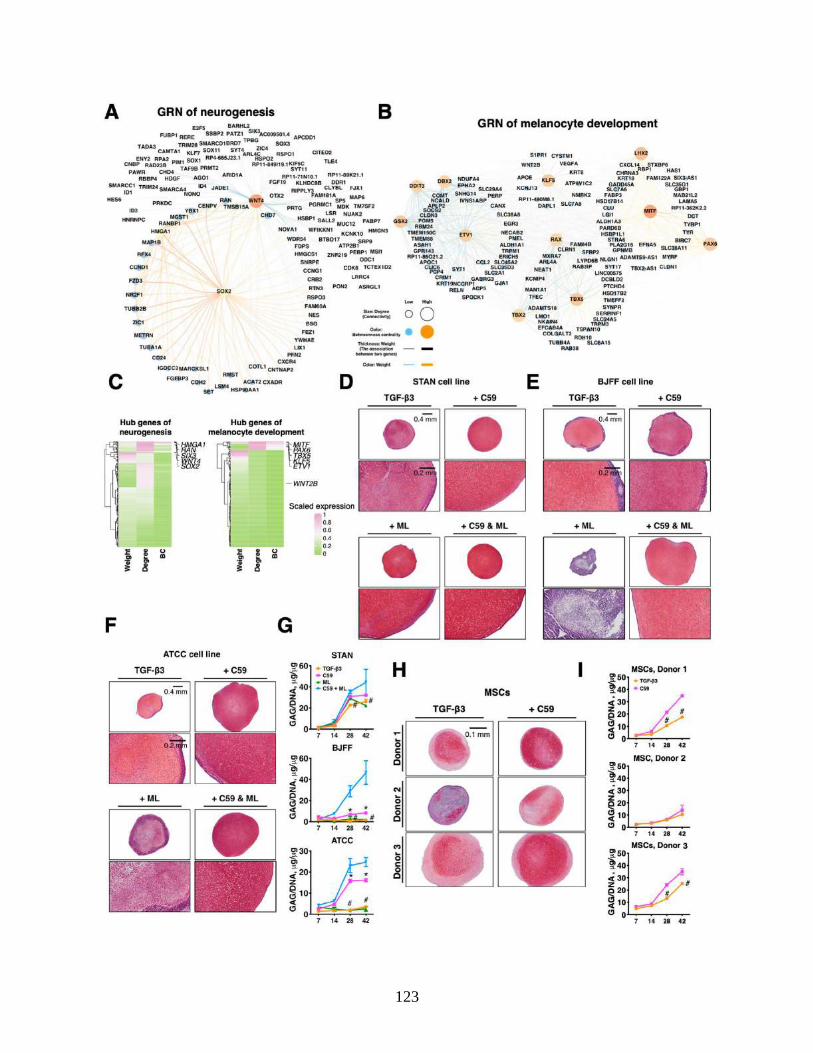
Figure S3.4 WGCNA reconstructed GRNs of neurogenesis and melanogenesis and identified the
hub genes in each network ......................................................................................123
Figure S3.5 Semi-quantification of RNA-FISH against Wnts and COL2A1 .............................124
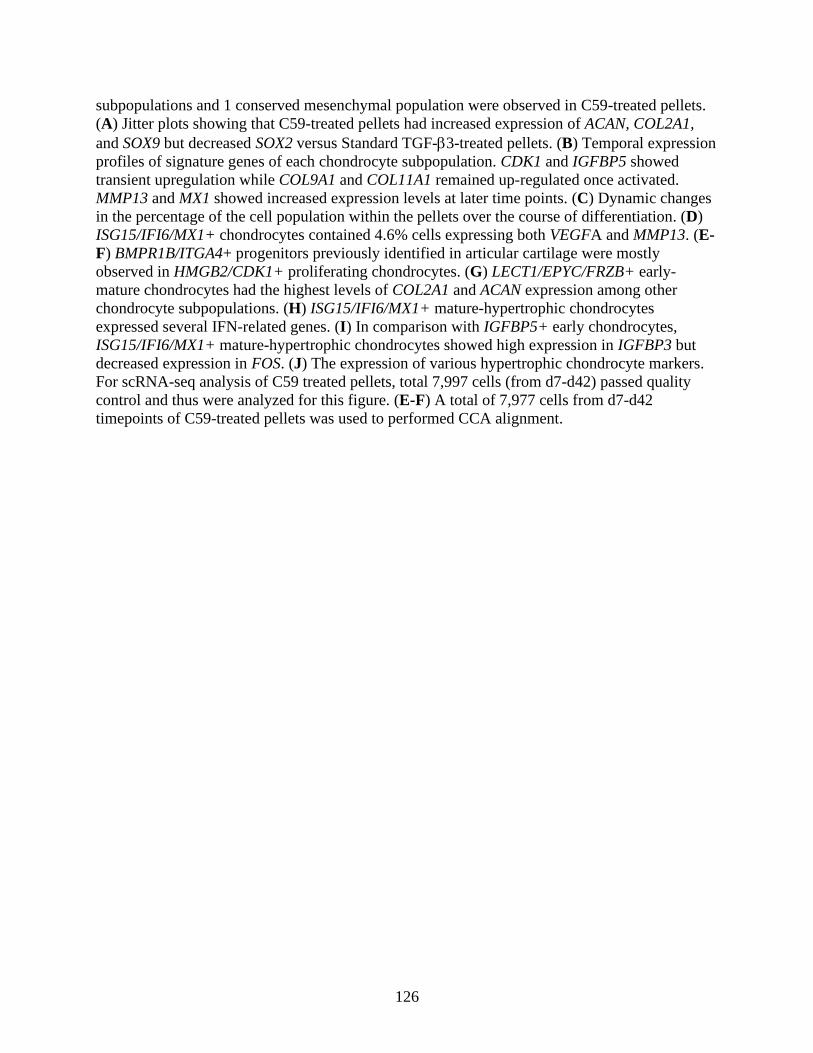
Figure S3.6 Multiple CCA alignment of d7-d42 pellets reveals that 4 conserved chondrocyte
subpopulations and 1 conserved mesenchymal population were observed in C59-
treated pellets ..........................................................................................................125
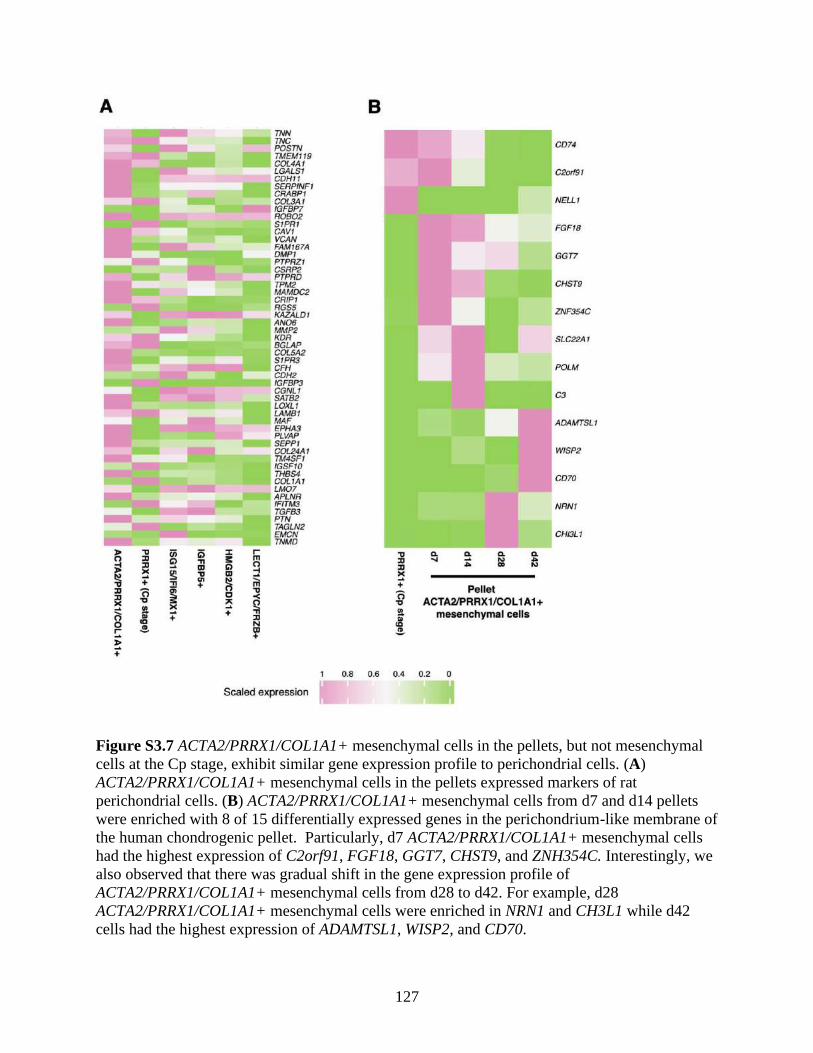
Figure S3.7 ACTA2/PRRX1/COL1A1+ mesenchymal cells in the pellets, but not mesenchymal
cells at the Cp stage, exhibit similar gene expression profile to perichondrial cells
.................................................................................................................................127
Figure S3.8 The GRN of hiPSC chondrogenesis ........................................................................128
Figure S3.9 Effect of Wnts on chondrogenesis...........................................................................130
Figure S3.10 Differential expression of BMPs/GDFs and receptors in response to Wnt inhibition
...............................................................................................................................131
Figure S3.11 CCA analysis showing differential gene expression with C59 treatment .............133
Figure S3.12 CCA analysis showing differential receptor gene expression with C59 treatment
......................................................................................................................................................134
Figure 4.1 Overview schematic of the protocol ..........................................................................149
Figure 4.2 Phase contrast images of cells throughout mesodermal differentiation ....................174
Figure 4.3 Anticipated results – gene expression and matrix quantification ..............................175
Figure 4.4 Anticipated results – histology ..................................................................................177
Figure 5.1 Differences in TRPV4 electrophysiological properties of WT and mutant hiPSC-
derived chondrocytes .................................................................................................202
Figure 5.2 Mutant TRPV4 had little effect on chondrogenic matrix production ........................205
Figure 5.3 V620I and T89I had differing effects on gene expression during chondrogenic
differentiation .............................................................................................................207
Figure 5.4 Dynamic changes in transcriptomic profiles of V620I and T89I mutants during
chondrogenesis ...........................................................................................................211
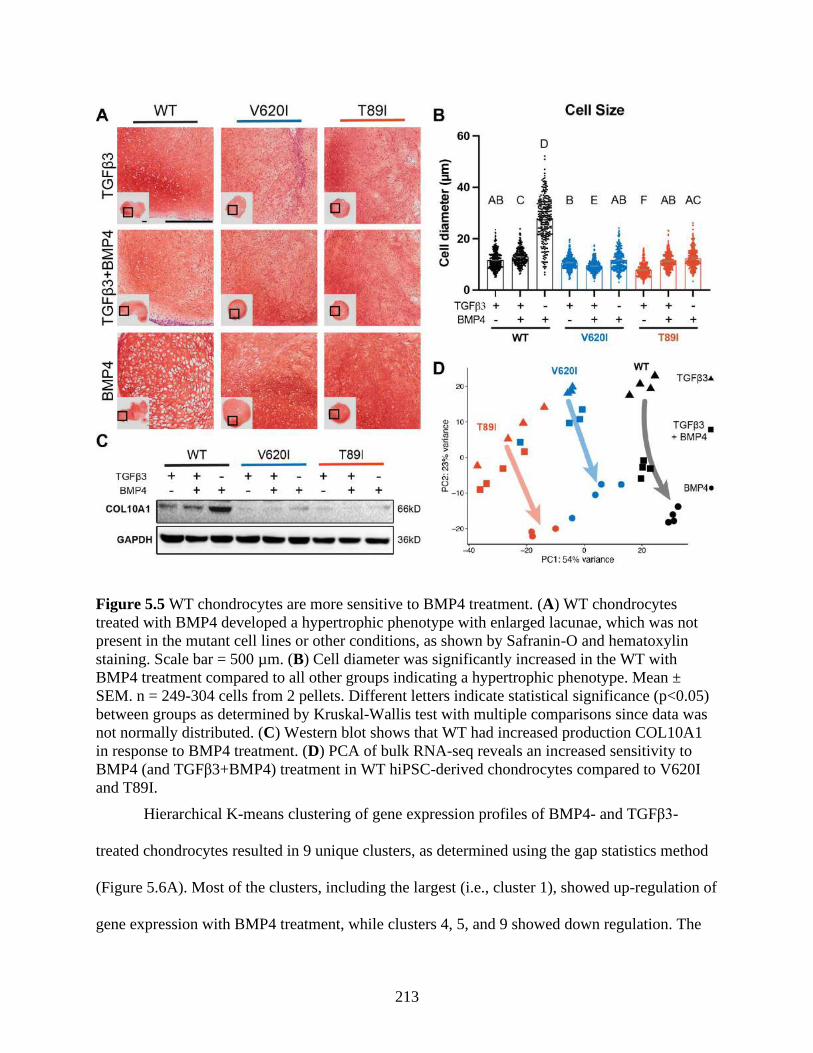
Figure 5.5 WT chondrocytes are more sensitive to BMP4 treatment .........................................213
Page 12
x
Figure 5.6 V620I and T89I had an inhibited hypertrophic response to BMP4 treatment ...........216
Figure S5.1 Top DEGs of V620I and T89I chondrocytes compared to WT remain from day 28
to day 56 ..................................................................................................................224
Figure 6.1 hiPSC-derived chondrocytes secrete cartilaginous matrix in agarose after 2 weeks of
culture ........................................................................................................................244
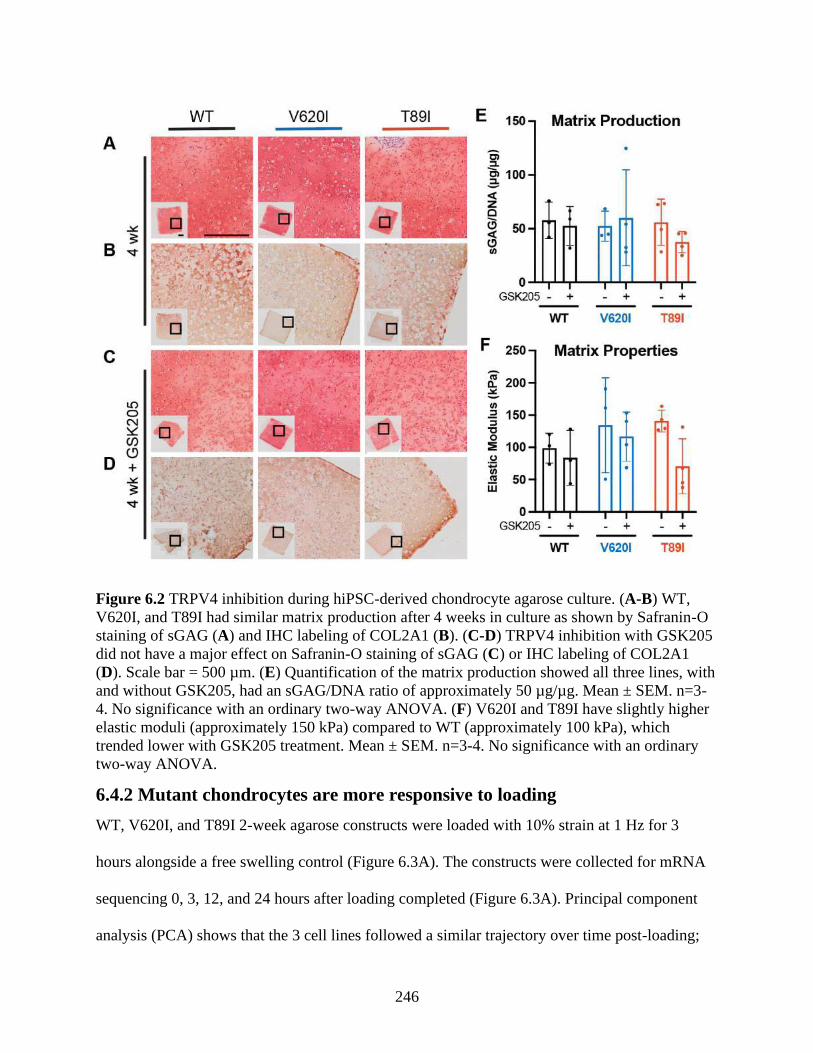
Figure 6.2 TRPV4 inhibition during hiPSC-derived chondrocyte agarose culture ....................246
Figure 6.3 Mechanical loading response of hiPSC-derived chondrocyte agarose ......................248
Figure 6.4 TRPV4 mutants had an altered and increased response to loading ...........................251
Figure 6.5 Long-term response to loading ..................................................................................255
Figure 6.6 Short-term response to loading ..................................................................................259
Page 13
xi
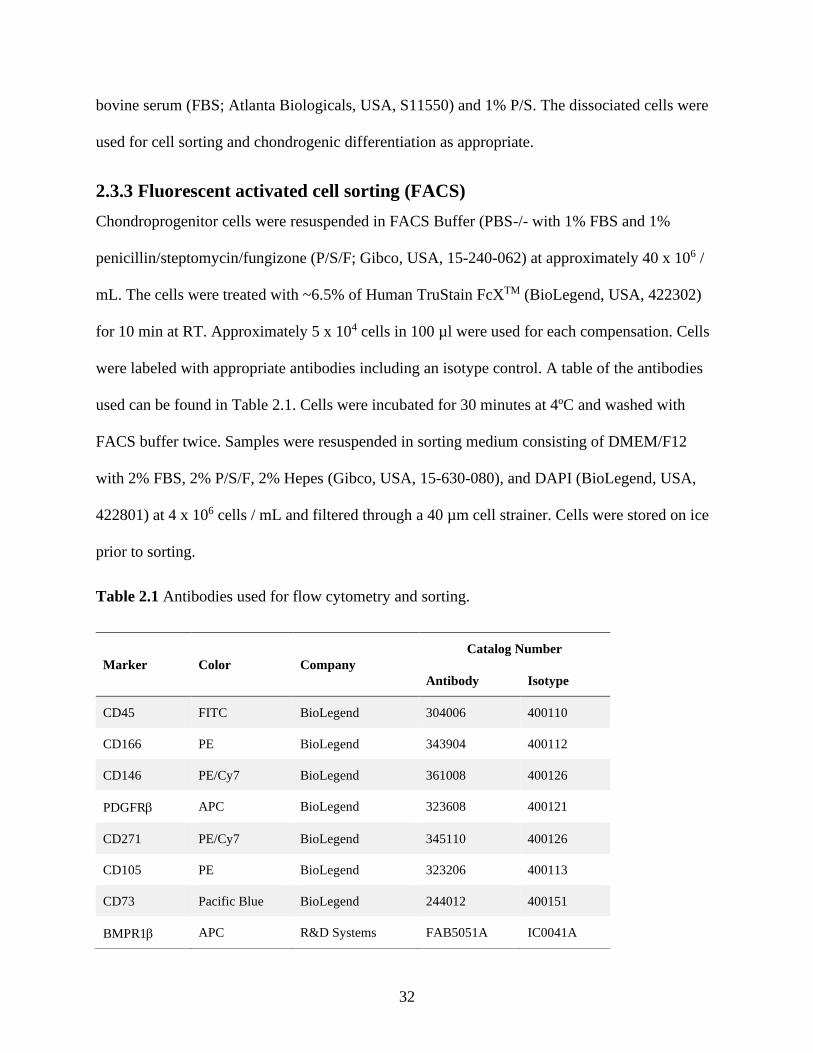
List of Tables Table 2.1 Antibodies used for flow cytometry and sorting ...........................................................32
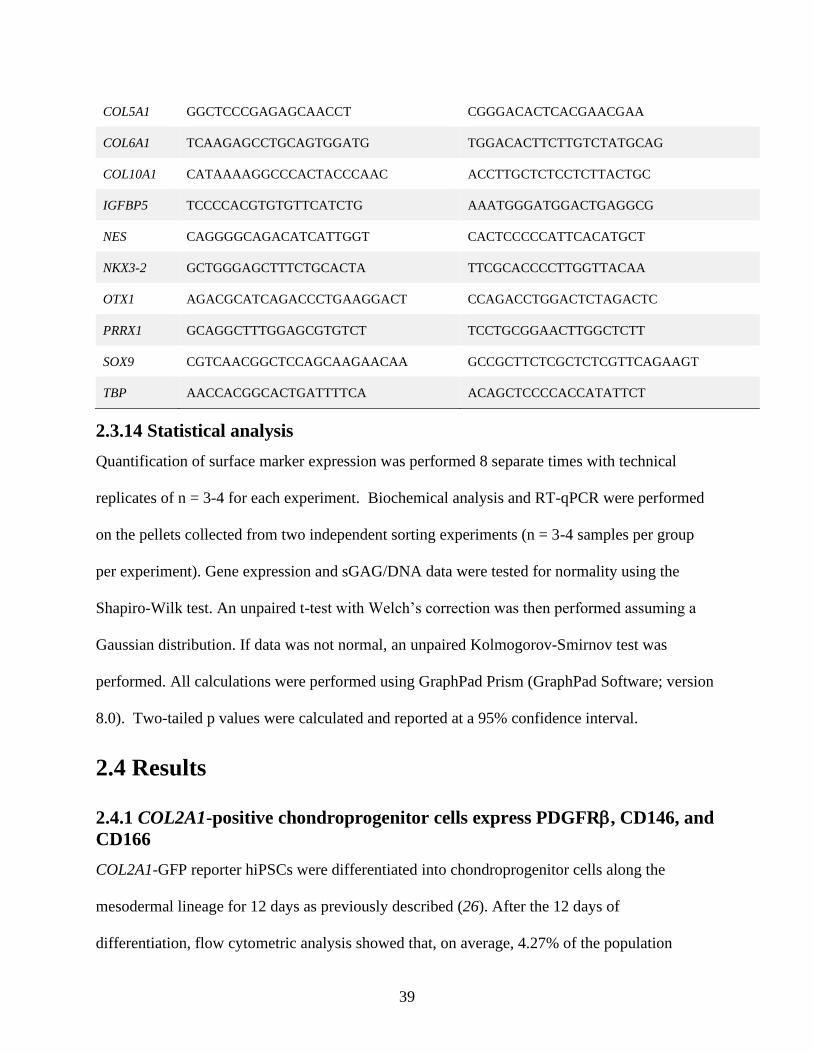
Table 2.2 Human primer sequences ..............................................................................................38
Table 3.1 Subject details ...............................................................................................................70
Table 3.2 qRT-PCR Primer Sequences .........................................................................................85
Table S3.1 Numbers of the cells passed quality control (QC) for each stage and associated
highly variable genes ................................................................................................136
Table S3.2 Top 10 up-regulated genes in fold change in mesodermal phase .............................137
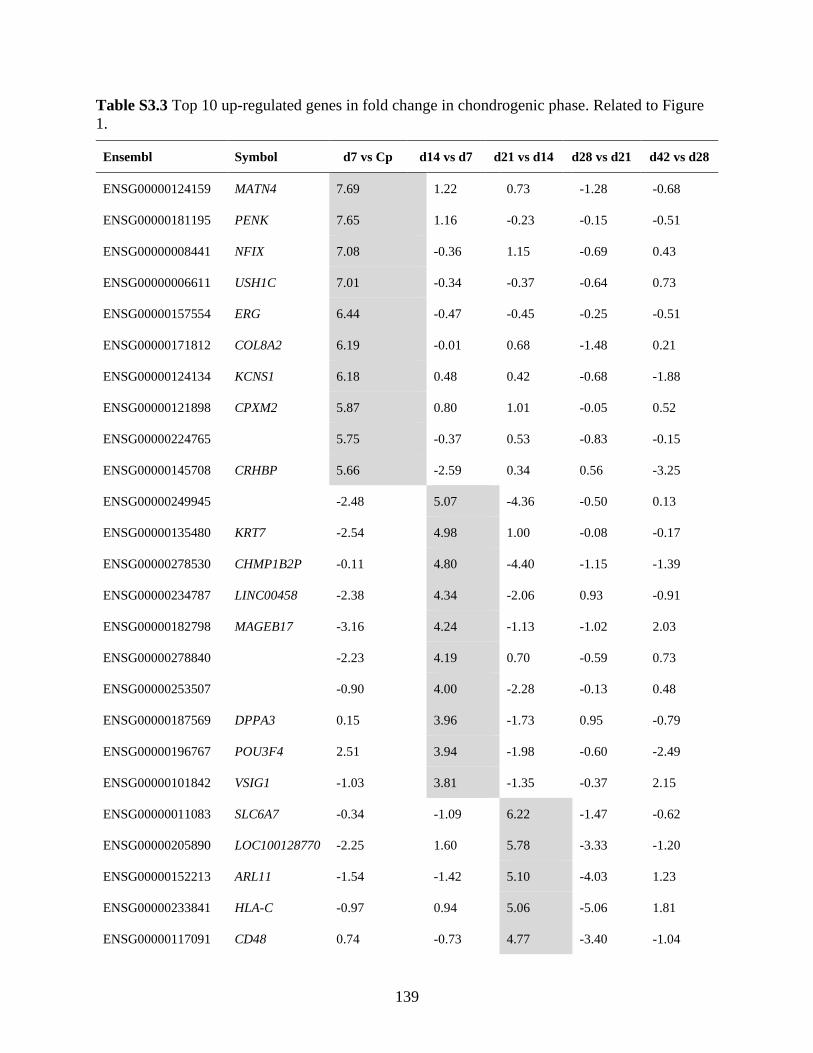
Table S3.3 Top 10 up-regulated genes in fold change in chondrogenic phase ...........................139
Table 4.1 RT-qPCR primers........................................................................................................160
Table 4.2 IHC antibodies ............................................................................................................171
Table 5.1 Primers for RT-qPCR ..................................................................................................196
Table S5.1 Clustering of BMP4 treatment ..................................................................................224
Page 14
xii
Acknowledgements
Thank you to my mentor, Farshid Guilak, for his continued support and guidance. Thank you for
accepting me into your laboratory and believing in me and my projects. Thank you for always
having an optimistic view and an alternative perspective on my data. Beyond doing the science,
thank you for teaching me how to communicate my science and inspiring my love of storytelling
science and visualizing data by continuously motivating me with your presentations.
Furthermore, thank you for supporting my professional development at and away from the
bench. You have set a high bar and an excellent example for all of us to strive for throughout our
careers.
Thank you to my second mentor and co-author, Chia-Lung Wu, for your never-ending
encouragement and support. Thank you for sending me home with conical tubes to practice with
on my first day and teaching me everything I know from basic laboratory techniques to hiPSC
culture to experimental design to RNA sequencing analysis. Thank you for the rides home late at
night and on weekends, the conversations about science and life, the Tai Ke dinners, and
trimming Evie’s nails. Thank you for your friendship. Thank you to the other hiPSC team
members Nancy Steward and Zainab Harissa. Thanks for the long chats in the tissue culture
hoods and all the help with experiments. Thank you to the hiPSC team for always being there for
whatever I needed; you have all been an incredible help to this thesis. Thank you to Bob Nims
and Alireza Savadipour for their never-ending mechanics assistance. Thank you to the rest of the
Guilak lab. You have all taught me so much and inspired me to do great science. It has been an
honor to work with and be a part of the Guilak lab family. Special thanks to the people who keep
the lab running no matter what, even a pandemic, Nick Thompson, Jim Maus, and Sara Oswald.
Thank you to the Washington University research community for their assistance and
Page 15
xiii
support of these projects. Special thanks to the Center for Investigation of Membrane Excitability
Diseases for the invaluable contributions and electrophysiology expertise of Grigory Maksaev
and Colin Nichols (Chapter 5) and the training grant (T32 DK108742). Thank you to the Flow
Cytometry & Fluorescence Activated Cell Sorting Core, Genome Engineering and iPSC Center,
and Genome Technology Access Center for their assistance on this work. This work would not
have been possible without the funding support from Shriners Hospitals for Children – St. Louis,
Nancy Taylor Foundation, Arthritis Foundation, and the National Institute of Health (R01
AG46927, R01 AG15768, R01 AR072999, R00 AR075899, P30 AR073752, P30 AR074992,
T32 DK108742, T32 EB018266, and CTSA grant UL1 TR002345). Thank you to my committee
Nathaniel Huebsch, Spencer Lake, Ingrid Meulenbelt, and Simon Tang for their advice and
guidance on this thesis.
Thank you to my friends and family for all their love and support throughout graduate
school; it’s been a wild ride. Thank you to my undergraduate professors Jack Phlipot and Amy
Shank who gave me the educational foundation to get to where I am. Thanks to my late
grandmother for always supporting my academic ventures; she would be so proud. Thanks to my
mother, Joyce Dicks, for encouraging me to pursue my PhD despite my doubts, never settling for
anything less than my best, and always being there to cheer me on, listen to me vent, or cook
some good food. Thanks to my best friend, Katelyn Schoenike, for always being there for some
Handle’s or a wine night, even from 6000 miles away. Special thanks to my partner, Andy
Daniel. I cannot imagine doing this PhD without you by my side, especially through a pandemic.
And thanks to our mascot, Evie.
Amanda Dicks
Washington University in St. Louis
August 2021
Page 16
xiv
Dedicated to my supportive mother and grandmother and loving partner.
Page 17
xv
ABSTRACT OF THE DISSERTATION
Human iPSC Tissue-Engineered Cartilage for
Disease Modeling of Skeletal Dysplasia-Causing TRPV4 Mutations
by
Amanda Dicks
Doctor of Philosophy in Biomedical Engineering
Washington University in St. Louis, 2021
Professor Farshid Guilak, Chair
Cartilage is essential to joint development and function. However, there is a variety of
cartilage diseases, ranging from developmental (e.g., skeletal dysplasias) to degenerative (e.g.,
arthritis), in which treatments and therapeutics are lacking. For example, specific point mutations
in the ion channel transient receptor potential vanilloid 4 (TRPV4) prevent proper joint
development, leading to mild brachyolmia and severe, neonatally lethal metatropic dysplasia.
Tissue-engineered cartilage offers an opportunity to elucidate the underlying mechanisms of
these cartilage diseases for the development of treatments.
Human induced pluripotent stem cells (hiPSCs) are an improved cell source option for
cartilage tissue engineering given their minimal donor site morbidity, absence of ethical
concerns, and extensive proliferation, differentiation, and gene editing capacities. Unfortunately,
previously published hiPSC chondrogenesis protocols were time consuming, difficult to
reproduce, and resulted in off-target differentiation. Here, we used two methods to enhance
hiPSC chondrogenesis using our previously published stepwise chondrogenic differentiation
protocol. Next, we used the improved protocol to perform in vitro disease modeling of
Page 18
xvi
brachyolmia and metatropic dysplasia resulting from mutations in mechanosensor TRPV4.
To enhance chondrogenesis, we used a CRISPR-Cas9-edited hiPSC cell line with a GFP
reporter to determine surface markers co-expressed with early chondrogenic marker and cartilage
matrix protein COL2A1. We found that chondroprogenitors that were positive for PDGFRβ,
CD146, and CD166 and negative for CD45 had enhanced chondrogenic potential. In fact, sorted
chondroprogenitors from the reporter line and an unedited line had significantly improved
homogeneity compared to unsorted as determined by single-cell RNA sequencing. Furthermore,
the derived chondrocytes synthesized more homogenous and robust matrix proteins and had
higher chondrogenic gene expression.
In a continued effort to improve the chondrogenesis protocol, we used bulk and single-
cell RNA sequencing to determine where the off-target differentiation occurred. We found that
Wnt and melanocyte inducing transcription factor (MITF) signaling were driving the two
primary off-target populations: neurogenic and melanogenic, respectively. Single-cell RNA
sequencing, histology, and quantification of matrix production confirmed pan-Wnt and MITF
inhibition during chondrogenesis improved homogeneity of the cells throughout differentiation
and increased chondrogenic potential.
Using the findings from these studies, we created an hiPSC chondrogenesis protocol that
follows the developmental mesodermal lineage and uses chemically defined medium. We also
provide instructions for digesting the chondrogenic tissue to isolate hiPSC-derived chondrocytes
at the single cell level. This protocol has applications for a variety of tissue engineering uses
including regenerative therapies, gene editing, drug screening, and disease modeling.
In fact, we applied this protocol for disease modeling of TRPV4 mutations that result in
skeletal dysplasias. Using CRISPR-Cas9 gene editing technology, we created two hiPSC lines
Page 19
xvii
harboring either the brachyolmia-causing V620I substitution or the metatropic dysplasia-causing
T89I substitution. The hiPSCs were chondrogenically differentiated and then were treated with
BMP4 to stimulate hypertrophic differentiation. We determined that TRPV4 mutations increased
basal signaling but decreased sensitivity to chemical agonist GSK1016790A using
electrophysiology techniques and confocal imaging. Furthermore, using bulk RNA sequencing,
we found the mutations suppressed chondrocyte maturation and hypertrophy, likely preventing
endochondral ossification and long bone formation leading to the disease phenotype.
We also used these cell lines to study the effects of the mutations on
mechanotransduction. The hiPSC-derived chondrocytes were physiologically loaded in agarose
constructs for 3 hours and then sequenced to elucidate the temporal response to loading. We
found the mutant TRPV4 increased gene expression in response to loading compared to
wildtype. Gene expression patterns indicated increased proliferation in mutant cells, which could
prevent chondrocyte hypertrophic differentiation and endochondral ossification.
Overall, we have developed an improved chondrogenic hiPSC protocol. The resulting
tissue-engineered cartilage has many uses including in vitro disease modeling of genetic,
developmental conditions, as shown here. Our findings provide target genes for future drug
development to treat brachyolmia and metatropic dysplasia. Furthermore, we have increased the
understanding of TRPV4 function in chondrocytes, which can be applied to cartilage tissue
engineering and other cartilage disease studies.
Page 20
1
Chapter 1
Introduction
1.1 Abstract
Cartilage is an avascular, aneural soft tissue composed only of chondrocytes and the extracellular
matrix they produce. Cartilage serves two functions in the joint: as a template for endochondral
ossification and long bone development and as a lining of long bones to provide a nearly
frictionless surface. The transient receptor potential vanilloid 4 (TRPV4) ion channel serves as a
regulator of both chondrogenic development and cartilage homeostasis through
mechanotransduction. Physiologic loading mediated through TRPV4 promotes cartilage matrix
synthesis. Moreover, gain-of-function mutations in the TRPV4 gene cause mild to lethal skeletal
dysplasias. While the underlying mechanisms of skeletal dysplasias is unclear, tissue-engineered
cartilage offers the possibility to study these processes. Tissue-engineered cartilage, which can
be derived from human induced pluripotent stem cells (hiPSCs) among other cell types, serves as
an option to study cartilage development, homeostasis, function, and disease. In fact, in vitro
disease modeling, drug screening, and genetic engineering with hiPSC-derived chondrocytes can
aid in the development of regenerative therapeutics and treatments for cartilage diseases. In this
thesis, we developed an hiPSC chondrogenic differentiation protocol and applied it to disease
modeling of skeletal dysplasia-causing TRPV4 mutations.
1.2 Cartilage Development and Homeostasis
Following chondrogenesis, cartilage undergoes one of two fates: hypertrophy or homeostasis. In
the first, chondrocytes differentiate into hypertrophic chondrocytes and undergo endochondral
Page 21
2
ossification, or the formation of long bones. The second fate is homeostasis, during which the
soft tissue lines diarthrodial joints throughout one’s lifetime. Chondrocytes, the primary cell type
of cartilage, are under strict regulation via transcription factors and biochemical and
biomechanical cues that guide their differentiation, anabolic matrix synthesis, and catabolic
matrix degradation occurring in both fates.
1.2.1 Chondrocyte differentiation
During embryogenesis, cartilage develops and forms the template for long bones (1, 2).
Mesenchymal cells aggregate together before undergoing SOX9-driven chondrogenesis (2-4).
Sry-related high-mobility-group box 9 (SOX9) and its downstream targets, SOX5 and SOX6,
form a transcription factor axis responsible for driving chondrocyte differentiation and
proliferation (3). Chondrocyte expression of SOX9 is regulated by fibroblast growth factor
(FGF), insulin-like growth factor I (IGF-I), transient receptor potential vanilloid 4 (TRPV4), and
transcription factors Sp1 and CREB (3). SOX9 is required to upregulate expression of
chondrogenic matrix proteins, such as collagen type II alpha chain I (COL2A1) and cartilage
oligomeric matrix protein (COMP) (3, 5). Resting and proliferating chondrocytes secrete the
cartilage extracellular matrix (ECM) primarily composed of sulfated glycosaminoglycans
(sGAGs) and type II collagen (COL2) (2, 6, 7). Some of the chondrocytes will then stop
proliferating, begin to hypertrophy, and undergo endochondral ossification.
Endochondral ossification is separate from membranous ossification, in which neural
crest cells differentiate into osteoblasts and secrete cortical bone to form flat bones (e.g., skull,
clavicle) (2). In contrast, endochondral ossification is responsible for formation of the long bones
of the appendicular skeleton. Chondrocyte hypertrophy, which leads to endochondral
ossification, is driven by transcription factors runt related transcription factor 2 (RUNX2) and
Page 22
3
Indian hedgehog (IHH). Hypertrophic chondrocytes switch from COL2 to COL10 production,
increase in size, and organize in columnar formations (2, 6, 7). Additionally, they begin secreting
bone morphogenic proteins (BMPs), vascular endothelial growth factors (VEGFs), and
parathyroid hormone-related peptide (PTHR) to recruit osteoblast progenitors (2, 6, 7).
Hypertrophic chondrocytes the either undergo apoptosis or differentiate into osteoblasts (2, 6, 7).
The newly differentiated osteoblasts express osteogenic factors (e.g., bone sialoprotein,
osteopontin), begin to mineralize bone, and allow for vascular invasion (2, 6, 7). This process
occurs in the center of the bone during embryogenesis and continues to occur in secondary
ossification sites (i.e., growth plate), towards the ends of the bones, after birth and through
adolescence (2, 6, 7).
1.2.2 Cartilage homeostasis
The remaining chondrocytes that did not undergo hypertrophy are the only cell type present in
articular cartilage, the soft tissue lining the ends of the long bones (8, 9). In adults, chondrocytes
compose 5% of cartilage’s volume and maintain cartilage homeostasis in response to genetic and
environmental signals, such as growth factors or physiologic loading, through a balanced
regulation of anabolic and catabolic ECM synthesis and degradation (10, 11). The resulting ECM
is avascular, aneural, and primarily composed of proteoglycans (e.g., glycosaminoglycans) and
type II collagen, alongside several other collagens and non-collagenous proteins (e.g.,
hyaluronate, fibronectin) (8, 9, 12). Glycosaminoglycans (GAGs), largely comprising the large
aggregating proteoglycan aggrecan (ACAN), make up 4-7% of cartilage (8, 13, 14). Due to their
negative charge, GAGs retain water, which composes 65-80% of the tissue weight, contributing
to the compressive properties of cartilage (8, 13, 14). Type II collagen, approximately 10-20% of
cartilage matrix, primarily contributes to the shear and tensile properties of the tissue (8, 13, 14).
Page 23
4
Cartilage has a highly hydrated, cross-linked composition that also has a unique structure:
zonal organization. In the superficial zone, which experiences immediate strain and interacts
with the opposing bone’s cartilage, chondrocytes are flat, and the matrix proteins are aligned
parallel with the surface, providing tensile strength. The deep zone provides compressive
strength with rounded chondrocytes in a columnal alignment and matrix proteins in an alignment
perpendicular to the surface. The chondrocytes and matrix proteins are randomly aligned and
organized in the middle zone, providing a transition between the superficial and deep zones. The
composition and structure of cartilage results in biphasic properties and viscoelastic behavior
with a compressive Young’s modulus of 240-850 kPa, an aggregate modulus of 100-2000 kPa,
and a Poisson’s ratio of 0.06-0.3 (1, 8, 9, 15-21). Due to these properties, articular cartilage can
distribute stress while experiencing millions of cycles of compressive loading several times one’s
body weight (1, 12, 16-18, 22, 23).
Not only does cartilage withstand loading, but the mechanical forces from joint
movements (e.g., walking, running, climbing stairs) are vital for tissue development and
homeostasis (17, 24-26). Matrix synthesis, chondrogenic gene expression, and anti-inflammatory
responses are stimulated by physiologic levels of compressive, shear, hydrostatic pressure, and
osmotic forces (9, 16, 17, 20, 23-25, 27-30). Cartilage stress and strain during loading is filtered
through the zonal organization to the pericellular matrix (PCM). The PCM, composed of
collagen type VI (COL6), fibronectin 1, and proteoglycans perlecan and biglycan (31-33),
integrates with the ECM and has approximately 35% of the ECM’s mechanical properties (34,
35). The PCM surrounds the chondrocyte, forming the chondron, to serve as a biomechanical
and biochemical filter (31-33). The chondrocyte senses load through mechanosensors such as
integrins, primary cilium, and ion channels (e.g., TRPV4) and converts the signal into
Page 24
5
downstream pathways (e.g., Indian hedgehog, Wnt, TGFβ, MAPK-ERK) resulting in
transcriptomic changes (27, 32).
1.3 Transient Receptor Potential Vanilloid 4
Transient receptor potential vanilloid 4 (TRPV4) is a non-selective, calcium-permeable ion
channel. The cell membrane protein is tetrameric with each component composed of six
transmembrane alpha helices and a pore loop with an amino group on one end and a carboxyl
group on the other (36). Recently, the crystalline cryo-EM structure has been identified, giving
insights into gating mechanisms and therapeutics (37). It is well known that TRPV4 is an osmo-
sensor (38-41) found in multiple osmotically-regulating cell types including the brain, liver, and
kidneys (36, 42, 43). Furthermore, TRPV4 function has been found to play a role in bone (44),
vasculature (45), adipose (46), and nociception (47, 48). The channel is activated by, but not
limited to, heat (49, 50), hypo-osmolarity or cell swelling (39, 41), shear stress (51, 52),
mechanical loading (53), and chemical agonists such as 4α-phorbol 12,13-didecanoate,
ruthenium red, and GSK1016790A (43, 54). Mutations in TRPV4 lead to a variety of genetic
disorders (55, 56) including hyponatremia (57), chronic obstructive pulmonary disorder (58, 59),
and neuropathies (e.g., distal spinal muscular atrophy congenital non-progressive (60-62),
Charcot–Marie–Tooth disease type 2C (CMT2C) (63-68), scapuloperoneal spinal muscular
atrophy (SPSMA) (63, 64, 68)). TRPV4 mutations also lead to skeletal disorders including
arthropathies, such as familial digital arthropathy-brachydactyly (69), and skeletal dysplasias,
such as brachyolmia (70), metatropic dysplasia (71-76), spondyloepiphyseal dysplasia
Maroteaux type (77-80), and parastremmatic dwarfism (81). Given the number of skeletal-
related channelopathies associated with TRPV4 mutations, TRPV4 is critical for proper skeletal
development.
Page 25
6
In fact, TRPV4 plays a role in both chondrogenesis and cartilage homeostasis. TRPV4
activation was found to upregulate transcription factor SOX9 in chondrogenic ATDC5 cells (82),
while deletion of TRPV4 decreased chondrogenic potential of murine adipose-derived stem cells
(83). Studies using compressive loading and chemical agonists to activate TRPV4 found that the
resulting calcium signaling is coupled with transforming growth factor beta (TGFβ) signaling, an
essential growth factor family in chondrogenesis and cartilage homeostasis (84, 85).
Furthermore, TRPV4 activation also increased matrix production, elastic modulus, and anti-
inflammatory gene expression in primary porcine chondrocytes (53, 86-88). Studies in mouse
models found a TRPV4 global knockout increased the incidence of osteoarthritis (OA) (89) in
male mice, especially on a high fat diet (83). However, a cartilage-specific knockout protected
against age-related OA but not post-traumatic OA (90). In summary, TRPV4 is a critical
component and regulator of chondrogenic development and homeostasis.
1.4 Cartilage Diseases
Cartilage diseases include, but are not limited to: aggrecanopathies, arthritis, arthropathies,
cartilaginous tumors, chondrocalcinosis, chondrodysplasia, collagenopathies, osteochondritis
dissecans, relapsing polychondritis, and skeletal dysplasias (91). Not only do these diseases
range in severity, but they also range in onset – from developmental to degenerative disease. The
large variety of cartilage diseases require research into their mechanisms, symptoms, treatment,
and regenerative therapies. Here, we describe the most common cartilage disorder family,
arthritis, and a family of developmental disorders, skeletal dysplasia.
1.4.1 Arthritis
Arthritis is a family of diseases that causes pain, swelling, and loss of motion of the diarthrodial
joints (92, 93). It has been reported as one of the top three leading causes of pain and disability
Page 26
7
across the United States (94). Arthritis currently affects at least 54 million adults in the United
States (95), and the number is expected to rise with the aging, obese population (12, 92).
Furthermore, it was estimated that by 2040 the number of adults affected by arthritis will
increase to 78.4% in the US with 11.4% of the total population suffering from activity-limiting
arthritis (96). As of 2007, arthritis cost the US $128 billion (direct medical and indirect losses
combined) (97), and with incidence continuing to rise, so will the cost (12, 92). Beyond the costs
and disability caused by arthritis, it is associated with many comorbidities including heart
disease, respiratory disease, diabetes, and obesity (92, 98). Moreover, 31% of patients with
arthritis also reported having anxiety (99), and 27% (compared to 12% without arthritis) reported
fair to poor health-related quality of life (100).
Arthritis is typically diagnosed through repeated doctor’s appointments using
radiographs, looking for erosion and boney spurs, and self-reported joint pain, inflammation, and
stiffness (92, 101). In fact, inflammation is the primary driver of disease onset, as the avascular
and aneural environment leaves cartilage more susceptible to inflammatory degeneration without
the ability to regenerate (8, 92, 93, 102). The degeneration, erosion, and cracking of articular
cartilage occurs as collagen and proteoglycans are degraded by aggrecanases and matrix
metalloproteinases (MMPs) stimulated by inflammatory cytokines interluekin-1 beta, -6, and -8
(IL-1, IL-6, IL-8) and tumor necrosis factor alpha (TNF) (9, 16, 17, 19, 20, 30, 92, 97, 103).
Systemic, inflammatory flares occur in rheumatoid arthritis (RA), an autoimmune disease with a
prevalence of 1% that affects women more often (93, 104). In osteoarthritis (OA), inflammation
is caused by metabolic and biomechanical factors (17, 22, 32, 102, 103, 105, 106). Risk factors
include age (107), female sex (108), genetics (108), obesity (22), and injury (92, 103, 109, 110).
Despite the homeostatic benefits of physiologic loading (17, 24, 25, 28), injurious loading (i.e.,
Page 27
8
greater than 35% strain) increases chondrocyte catabolism leading to post-traumatic OA (PTOA)
(17, 103). In fact, prevalence of PTOA is higher in the younger population and risk increases to
approximately 50% after traumatic injury that results in misalignment of the joint (e.g., ligament
or meniscal tears) (103, 109, 111).
There is no cure for arthritis, and treatments are limited. Patients are encouraged to lose
weight and exercise to reduce systemic inflammation. In mild cases, treatments include non-
steroidal anti-inflammatories, which treat disease-induced pain short term (17, 92, 97). Disease-
modifying antirheumatic drugs have been developed to treat RA; however, they are effective in
only a fraction of individuals and have been associated with significant side effects (93). As the
arthritis progresses, surgery and total joint arthroplasty becomes an option (92, 101), but the
surgery has a dissatisfaction rate of up to 20% (112). Additionally, joint replacements have a
limited lifespan, increasing the number of revisions and decreasing their effectiveness in younger
populations (113, 114). Therefore, there is a critical need for treatment and therapeutics for
arthritis.
1.4.2 Skeletal dysplasias
Skeletal dysplasias are a group of over 450 bone and cartilage diseases including achondroplasia,
type 2 collagenopathies, osteogenesis imperfecta, brachyolmia, spondylometaphyseal dysplasia
Kozlowski, and metatropic dysplasia (115-118). The diseases, which range in severity from
moderate to neonatally lethal, are characterized by disproportionate stature and bones (116).
With a birth incidence of 1 in 5000 (119), the dysplasias can be diagnosed prenatally with
radiographic evidence of disproportion followed by skeletal surveying, histopathology, and
molecular genetic testing (115-118). Early diagnosis, especially in severe or lethal incidences, is
important for family counseling and immediate stabilization of the airway and respiratory status
Page 28
9
upon birth to prevent death due to small chest size, pulmonary restriction, and cardiopulmonary
compromise (75, 116). In non-lethal cases, the patient requires a multidisciplinary team to assess,
diagnose, treat, and manage orthopedic, neurologic, auditory, visual, pulmonary, cardiac, renal,
and psychological complications (116, 120). Skeletal dysplasia patients may require physical
therapy and surgical intervention throughout their life (121-123). Additionally, a study showed
that depression and anxiety, often associated with pain, is present in 34% and 31% of patients
with skeletal dysplasia, respectively, representing the need for pain management and mental
health counseling (124).
The heterogenous phenotypes of skeletal dysplasias is inherent to the cause of this family
of diseases: genetic mutations. Skeletal dysplasia-causing mutations occur in ECM proteins,
transcription factors, tumor suppressors, signal transducers, cellular transporters, and growth
factor receptors (116, 120). A common location of these mutations is transient receptor vanilloid
4 (TRPV4), a non-selective cation channel. These mutations cause a spectrum of skeletal
dysplasias, including autosomal-dominant brachyolmia and metatropic dysplasia, among other
diseases (55). Autosomal-dominant brachyolmia is caused by a gain-of-function mutation in the
transmembrane 5 pore region of TRPV4 caused by an exon 12 858G>A transition encoding a
V620I substitution (55, 70, 125). The moderate dysplasia exhibits a phenotype of moderately
short stature, mildly short limbs, mild brachydactyly, scoliosis, flattened and irregular vertebra,
mild irregularities in metaphyses, and delayed epiphyseal and carpal ossification (70, 125, 126).
In contrast, metatropic dysplasia is caused by a mutation in the cytoplasmic NH2 end protein
domain of TRPV4 caused by an exon 2 C366>T transition encoding a T89I substitution (55, 75,
125). Some studies have shown the T89I mutation to be gain-of-function (126, 127), while other
reports have claimed it does not cause a change in conductivity (55, 125). This severe dysplasia
Page 29
10
can be neonatally lethal and exhibits a phenotype of short extremities, dumbbell-shaped long
bones with widened metaphyses, elongated and narrow trunk, scoliosis, flat vertebral bodies,
joint contractures, prominent forehead, squared-off jaw, and brachydactyly with delayed carpal
ossification (75, 125). Histological analysis of brachyolmia and metatropic dysplasia have shown
disorganized, hypertrophic chondrocytes and cartilage islands among bone, indicating
dysregulation of endochondral ossification and skeletal development to be an underlying cause
of the diseases (75, 116, 120). It was hypothesized that increased TRPV4 signaling prevented
proper endochondral ossification through an upregulated expression of follistatin, a potent BMP
antagonist, a potential underlying cause of these conditions (127-129).
1.5 Tissue-Engineered Cartilage
Tissue-engineered cartilage provides opportunities for regenerative therapies, particularly for
degenerative diseases such as arthritis. Furthermore, it can serve as an in vitro disease model for
drug screening and as a tool for the elucidation of underlying mechanisms of cartilage diseases.
To engineer cartilage, one needs a chondrocyte source, a 3D scaffold or environment, and
chondrogenic medium. As the chondrocytes are cultured, they will synthesize the cartilaginous
ECM, thus producing tissue-engineered cartilage. An advantage of using cartilage in the tissue
engineering field is that it does not have any other cell types, such as vasculature. However, the
unique composition and organization of the chondrocytes and ECM, which produces its
impressive mechanical properties, poses much more of a challenge.
1.5.1 Cell sources
Studies have used a range of cell types for the chondrocyte cell source including primary
chondrocytes and chondrocytes derived from adult multipotent stem cells and pluripotent stem
cells (14). Primary chondrocytes eliminate in vitro chondrogenic differentiation as they are
Page 30
11
already able to synthesize a cartilaginous matrix in 3D (130). However, their limited expansion
potential paired with dedifferentiation during monolayer passaging limits their applicability
(130). Furthermore, they are difficult to obtain due to donor site morbidity and limited cadaveric
and surgical waste sources (14).
Therefore, most tissue engineering studies differentiate stem cells into chondrocytes. One
of the most common sources are adult multipotent stem cells, such as mesenchymal stem cells
(MSCs) and adipose-derived stem cells (ASCs). Chondrogenesis protocols for these cell types
have been successfully optimized to produce robust cartilage-like tissue (131-135). While ASCs
are isolated from adipose tissue, such as during liposuction (131), MSCs are typically isolated
from adult bone marrow, an invasive process (1, 135). A drawback to this method, however, is it
is well-recognized that adult stem cells are a heterogenous cell population with significant donor-
to-donor variability and limited proliferation and differentiation potential after long-term
expansion in vitro (135-139).
Pluripotent stem cells solve these problems with their high proliferation and
differentiation capacities, which also provide the opportunity for gene editing (140, 141).
Embryonic stem cells (ESCs) are derived from embryos prior to implantation, which may raise
ethical concerns or be restricted in some places (142). However, adult somatic cells, such as
fibroblasts, can be reprogrammed into a pluripotent state by defined transcriptional factors
providing patient-specific cells with low to no donor morbidity (140-143). These reprogramed
cells are known as induced pluripotent stem cells (iPSCs) and behave comparably to ESCs in
terms of proliferation and differentiation (136, 140-143).
1.5.2 hiPSC chondrogenesis
Previously our lab developed a chondrogenic differentiation protocol for mouse iPSCs (144);
Page 31
12
however, human cells have remained a larger challenge for the field. Using a variety of growth
factor and morphogen combinations and chondrogenic medium solutions, several studies have
reported protocols for differentiating human iPSCs (hiPSCs) into chondrocytes (1, 136, 145-
152). Unfortunately, the methods are time consuming, have modest expression of chondrogenic
genes, have irregular chondrocyte morphology, do not follow developmental pathways, or are
difficult to reproduce. For example, many methods rely on the use of fetal bovine serum (FBS) in
their medium to increase cell viability; however, FBS has extensive lot-to-lot variability
preventing consistency and reproducibility.
Therefore, we aimed to develop a serum-free, chemically-defined chondrogenic
differentiation protocol for hiPSCs. Using the newly elucidated temporal sequence of signaling
cues required for stem cell differentiation across various lineages in vivo (146) and previous in
vitro reports of stem cell chondrogenic differentiation (144, 153, 154), we developed a stepwise
protocol for hiPSC differentiation following the paraxial mesodermal lineage (155). The protocol
differentiates sclerotome cells into chondroprogenitors with bone morphogenic protein 4
(BMP4), similar to mesenchymal condensation during development (155, 156).
Chondroprogenitors are then treated with transforming growth factor beta 3 (TGFβ3) to stimulate
chondrogenesis (144, 145, 148, 155, 157-159). Given the chondrogenic requirement for a 3D
environment, this protocol uses a conventional 3D pellet culture system (9, 159). With this
culture system, chondroprogenitors are centrifuged in a tube to form a spherical construct, or
“pellet,” over multiple weeks growing in diameter as the cells differentiate and produce
cartilaginous matrix. After 28 days in pellet culture, tissue-engineered cartilage matrix
synthesized by hiPSC-derived chondrocytes has formed (155). Unfortunately, this protocol,
among others has resulted in significant and unpredictable cellular and matrix heterogeneity
Page 32
13
(155, 160, 161).
1.6 In Vitro Disease Modeling and Therapeutic Development
Tissue-engineered cartilage, particularly from hiPSCs, provides opportunities for in vitro disease
modeling, genetic engineering, gene therapy, and drug development and validation (162-172).
Genetic engineering tools such as clustered regularly interspaced short palindromic repeats
(CRISPR) and the CRISPR-associated protein (Cas9) are valuable tools for disease modeling
(173). For example, hiPSCs can be derived from adult patients with a genetic disorder, and the
mutation can be corrected using CRISPR-Cas9 technology to create an isogenic control (140,
141, 163, 173). If patient samples are not available, CRISPR-Cas9 can be used to create the
mutation in a control line (140, 141, 163, 173). After the development of mutant and isogenic
lines, scientists can study the effects of the mutation on chondrogenesis and cartilage
homeostasis. Additionally, diseased environments can be simulated using hiPSC-derived
chondrocyte culture, such as the introduction of inflammatory cytokines to mimic arthritis (162).
This system has pharmaceutical potential, as patient-specific, genetically engineered, or diseased
hiPSC-derived chondrocytes can be used for drug development, and the large volumes produced
provide the opportunity for high throughput screening.
Beyond disease modeling, hiPSC-derived chondrocytes are useful for elucidating the
mechanisms driving or repressing chondrogenesis and regulating cartilage homeostasis (e.g.,
mechanical forces) (26). These findings will not only answer fundamental questions regarding
chondrocyte biology, but they will provide insights into optimizing tissue engineering strategies
for regenerative therapeutics. Moreover, our lab has developed stem cells modified for
autonomous regenerative therapy (i.e., self-regulating “SMART” cells) harnessing synthetic
biology to create cell-based therapies in murine iPSCs, which could be translated to human cells
Page 33
14
in the future (84, 174-176).
1.7 Summary
Due to the importance of articular cartilage to skeletal development and joint loading, we
developed an hiPSC chondrogenic differentiation protocol as a tool to study chondrogenesis and
cartilage homeostasis. Unfortunately, there was cellular and matrix heterogeneity in the tissue-
engineered cartilage. To address this, we applied two strategies: cell sorting and inhibition of off-
target pathways. In the first method, CD146, CD166, and PDGFR were identified as pro-
chondrogenic surface markers in hiPSC-derived chondroprogenitor cells as described in Chapter
2. In the second method, we used next-generation sequencing to identify wingless/integrated
(Wnt) and melanocyte inducing transcription factor (MITF) signaling as the drivers of off-target
differentiation. We found inhibition of these factors during chondrogenesis significantly
improved the protocol and resulted in homogenous, robust tissue-engineered cartilage as
described in Chapter 3 and 4. Next, we applied this protocol to a disease modeling application.
We differentiated hiPSCs harboring skeletal dysplasia-causing TRPV4 mutations into
chondrocytes to study the effects on TRPV4 function, chondrogenesis, and chondrocyte
hypertrophy and on TRPV4 mechanotransduction, as described in Chapters 5 and 6, respectively.
The findings from the disease modeling studies provide insights into therapeutic targets for mild
brachyolmia and severe metatropic dysplasia. Furthermore, the hiPSC chondrogenesis protocol
can be applied to other disease models, such as osteoarthritis risk mutations in type VI collagen,
and tissue engineering studies. This thesis is summarized in Figure 1.1.
Page 34
15
Figure 1.1 Representation of the thesis chapters and their integration. We developed a protocol
to derive chondroprogenitors; however, they produced heterogenous hiPSC-derived cartilage.
Therefore, we enhanced chondrogenesis through cell sorting or inhibition of off-target pathways.
Then using the improved chondrogenesis protocol, we used hiPSC-derived cartilage for disease
modeling of skeletal dysplasia-causing TRPV4 mutations. We found the mutations suppress
chondrocyte hypertrophy but increase sensitivity to physiologic loading.
1.8 References
1. L. Wu et al., Human developmental chondrogenesis as a basis for engineering chondrocytes
from pluripotent stem cells. Stem Cell Reports 1, 575-589 (2013).
2. G. Breeland, M. A. Sinkler, R. G. Menezes, Embryology, Bone Ossification. (Treasure
Island (FL): StatPearls Publishing, SttatPearls (Internet), 2021).
3. H. Akiyama, Control of chondrogenesis by the transcription factor Sox9. Mod Rheumatol
18, 213-219 (2008).
4. Y. Kamachi, M. Uchikawa, H. Kondoh, Pairing SOX off: with partners in the regulation of
embryonic development. Trends Genet 16, 182-187 (2000).
5. T. Furumatsu, T. Ozaki, Epigenetic regulation in chondrogenesis. Acta Med Okayama 64,
Page 35
16
155-161 (2010).
6. R. Nishimura et al., Regulation of endochondral ossification by transcription factors. Front
Biosci (Landmark Ed) 17, 2657-2666 (2012).
7. C. Prein, F. Beier, ECM signaling in cartilage development and endochondral ossification.
Curr Top Dev Biol 133, 25-47 (2019).
8. A. J. Sophia Fox, A. Bedi, S. A. Rodeo, The basic science of articular cartilage: structure,
composition, and function. Sports Health 1, 461-468 (2009).
9. Z. Lin, C. Willers, J. Xu, M. H. Zheng, The chondrocyte: biology and clinical application.
Tissue Eng 12, 1971-1984 (2006).
10. F. Guilak, C. Hung, V. Mow, R. Huiskes, Basic orthopaedic biomechanics and mechano-
biology. (2005).
11. A. C. Shieh, K. A. Athanasiou, Principles of cell mechanics for cartilage tissue engineering.
Ann Biomed Eng 31, 1-11 (2003).
12. J. M. Mansour, in Kinesiology: The Mechanics and Pathomechanics of Human Movement.
(2003), vol. 2e, chap. 5, pp. 66-75.
13. Y. Xia et al., in Biophysics and Biochemistry of Cartilage by NMR and MRI. (The Royal
Society of Chemistry, 2017), pp. 1-43.
14. L. Zhang, J. Hu, K. A. Athanasiou, The role of tissue engineering in articular cartilage repair
and regeneration. Crit Rev Biomed Eng 37, 1-57 (2009).
15. C. J. Little, N. K. Bawolin, X. Chen, Mechanical properties of natural cartilage and tissue-
engineered constructs. Tissue Eng Part B Rev 17, 213-227 (2011).
16. J. Bleuel, F. Zaucke, G. P. Bruggemann, A. Niehoff, Effects of cyclic tensile strain on
chondrocyte metabolism: a systematic review. PLoS One 10, e0119816 (2015).
17. J. Sanchez-Adams, H. A. Leddy, A. L. McNulty, C. J. O'Conor, F. Guilak, The
mechanobiology of articular cartilage: bearing the burden of osteoarthritis. Curr Rheumatol
Rep 16, 451 (2014).
18. N. J. Kuiper, A. Sharma, A detailed quantitative outcome measure of glycosaminoglycans in
human articular cartilage for cell therapy and tissue engineering strategies. Osteoarthritis
Cartilage 23, 2233-2241 (2015).
19. S. Agarwal et al., Role of NF-kappaB transcription factors in antiinflammatory and
proinflammatory actions of mechanical signals. Arthritis Rheum 50, 3541-3548 (2004).
20. C. Chen et al., Cyclic Equibiaxial Tensile Strain Alters Gene Expression of Chondrocytes
via Histone Deacetylase 4 Shuttling. PLoS One 11, e0154951 (2016).
21. G. Ofek, R. M. Natoli, K. A. Athanasiou, In situ mechanical properties of the chondrocyte
cytoplasm and nucleus. J Biomech 42, 873-877 (2009).
22. F. Guilak, Biomechanical factors in osteoarthritis. Best Pract Res Clin Rheumatol 25, 815-
823 (2011).
23. F. Eckstein, M. Hudelmaier, R. Putz, The effects of exercise on human articular cartilage. J
Anat 208, 491-512 (2006).
Page 36
17
24. C. Chen, D. T. Tambe, L. Deng, L. Yang, Biomechanical properties and mechanobiology of
the articular chondrocyte. Am J Physiol Cell Physiol 305, C1202-1208 (2013).
25. E. Kim, F. Guilak, M. A. Haider, The dynamic mechanical environment of the chondrocyte:
a biphasic finite element model of cell-matrix interactions under cyclic compressive loading.
J Biomech Eng 130, 061009 (2008).
26. C. J. O'Conor, N. Case, F. Guilak, Mechanical regulation of chondrogenesis. Stem Cell Res
Ther 4, 61 (2013).
27. Z. Zhao et al., Mechanotransduction pathways in the regulation of cartilage chondrocyte
homoeostasis. Journal of Cellular and Molecular Medicine 24, 5408-5419 (2020).
28. L. G. Alexopoulos, L. A. Setton, F. Guilak, The biomechanical role of the chondrocyte
pericellular matrix in articular cartilage. Acta Biomater 1, 317-325 (2005).
29. D. Ma et al., Hydrostatic Compress Force Enhances the Viability and Decreases the
Apoptosis of Condylar Chondrocytes through Integrin-FAK-ERK/PI3K Pathway. Int J Mol
Sci 17, (2016).
30. S. Madhavan et al., Biomechanical signals exert sustained attenuation of proinflammatory
gene induction in articular chondrocytes. Osteoarthritis Cartilage 14, 1023-1032 (2006).
31. R. E. Wilusz, J. Sanchez-Adams, F. Guilak, The structure and function of the pericellular
matrix of articular cartilage. Matrix Biol 39, 25-32 (2014).
32. F. Guilak, R. J. Nims, A. Dicks, C. L. Wu, I. Meulenbelt, Osteoarthritis as a disease of the
cartilage pericellular matrix. Matrix Biol 71-72, 40-50 (2018).
33. C. A. Poole, Articular cartilage chondrons: form, function and failure. J Anat 191 ( Pt 1), 1-
13 (1997).
34. I. Youn, J. B. Choi, L. Cao, L. A. Setton, F. Guilak, Zonal variations in the three-
dimensional morphology of the chondron measured in situ using confocal microscopy.
Osteoarthritis Cartilage 14, 889-897 (2006).
35. E. M. Darling, R. E. Wilusz, M. P. Bolognesi, S. Zauscher, F. Guilak, Spatial mapping of
the biomechanical properties of the pericellular matrix of articular cartilage measured in situ
via atomic force microscopy. Biophys J 98, 2848-2856 (2010).
36. J. P. White et al., TRPV4: Molecular Conductor of a Diverse Orchestra. Physiol Rev 96,
911-973 (2016).
37. Z. Deng et al., Cryo-EM and X-ray structures of TRPV4 reveal insight into ion permeation
and gating mechanisms. Nature Structural & Molecular Biology 25, 252-260 (2018).
38. A. Mizuno, N. Matsumoto, M. Imai, M. Suzuki, Impaired osmotic sensation in mice lacking
TRPV4. Am J Physiol Cell Physiol 285, C96-101 (2003).
39. W. Liedtke et al., Vanilloid receptor-related osmotically activated channel (VR-OAC), a
candidate vertebrate osmoreceptor. Cell 103, 525-535 (2000).
40. W. Liedtke, J. M. Friedman, Abnormal osmotic regulation in trpv4-/- mice. Proc Natl Acad
Sci U S A 100, 13698-13703 (2003).
41. R. Strotmann, C. Harteneck, K. Nunnenmacher, G. Schultz, T. D. Plant, OTRPC4, a
Page 37
18
nonselective cation channel that confers sensitivity to extracellular osmolarity. Nat Cell Biol
2, 695-702 (2000).
42. B. Nilius, A. Szallasi, Transient receptor potential channels as drug targets: from the science
of basic research to the art of medicine. Pharmacol Rev 66, 676-814 (2014).
43. W. Everaerts, B. Nilius, G. Owsianik, The vanilloid transient receptor potential channel
TRPV4: From structure to disease. Progress in Biophysics and Molecular Biology 103, 2-17
(2010).
44. R. Masuyama et al., TRPV4-mediated calcium influx regulates terminal differentiation of
osteoclasts. Cell Metab 8, 257-265 (2008).
45. S. K. Sonkusare et al., Elementary Ca2+ signals through endothelial TRPV4 channels
regulate vascular function. Science 336, 597-601 (2012).
46. L. Ye et al., TRPV4 is a regulator of adipose oxidative metabolism, inflammation, and
energy homeostasis. Cell 151, 96-110 (2012).
47. N. Alessandri-Haber et al., Transient receptor potential vanilloid 4 is essential in
chemotherapy-induced neuropathic pain in the rat. J Neurosci 24, 4444-4452 (2004).
48. N. Alessandri-Haber et al., Hypotonicity induces TRPV4-mediated nociception in rat.
Neuron 39, 497-511 (2003).
49. A. D. Guler et al., Heat-evoked activation of the ion channel, TRPV4. J Neurosci 22, 6408-
6414 (2002).
50. H. Watanabe et al., Heat-evoked activation of TRPV4 channels in a HEK293 cell
expression system and in native mouse aorta endothelial cells. J Biol Chem 277, 47044-
47051 (2002).
51. X. Gao, L. Wu, R. G. O'Neil, Temperature-modulated diversity of TRPV4 channel gating:
activation by physical stresses and phorbol ester derivatives through protein kinase C-
dependent and -independent pathways. J Biol Chem 278, 27129-27137 (2003).
52. R. Kohler et al., Evidence for a functional role of endothelial transient receptor potential V4
in shear stress-induced vasodilatation. Arterioscler Thromb Vasc Biol 26, 1495-1502 (2006).
53. C. J. O'Conor, H. A. Leddy, H. C. Benefield, W. B. Liedtke, F. Guilak, TRPV4-mediated
mechanotransduction regulates the metabolic response of chondrocytes to dynamic loading.
Proc Natl Acad Sci U S A 111, 1316-1321 (2014).
54. M. Jin et al., Determinants of TRPV4 Activity following Selective Activation by Small
Molecule Agonist GSK1016790A. PLoS ONE 6, e16713 (2011).
55. S. Sun, in Mutagenesis, Kang, Ed. (InTech, 2012).
56. B. Nilius, T. Voets, The puzzle of TRPV4 channelopathies. EMBO Rep 14, 152-163 (2013).
57. W. Tian et al., A loss-of-function nonsynonymous polymorphism in the osmoregulatory
TRPV4 gene is associated with human hyponatremia. Proc Natl Acad Sci U S A 106, 14034-
14039 (2009).
58. G. Zhu et al., Association of TRPV4 gene polymorphisms with chronic obstructive
pulmonary disease. Hum Mol Genet 18, 2053-2062 (2009).
Page 38
19
59. J. Dai et al., TRPV4-pathy, a novel channelopathy affecting diverse systems. J Hum Genet
55, 400-402 (2010).
60. C. J. Frijns, J. Van Deutekom, R. R. Frants, F. G. Jennekens, Dominant congenital benign
spinal muscular atrophy. Muscle Nerve 17, 192-197 (1994).
61. M. E. McEntagart et al., Confirmation of a hereditary motor and sensory neuropathy IIC
locus at chromosome 12q23-q24. Ann Neurol 57, 293-297 (2005).
62. M. Auer-Grumbach et al., Alterations in the ankyrin domain of TRPV4 cause congenital
distal SMA, scapuloperoneal SMA and HMSN2C. Nat Genet 42, 160-164 (2010).
63. P. J. Dyck et al., Hereditary motor and sensory neuropathy with diaphragm and vocal cord
paresis. Ann Neurol 35, 608-615 (1994).
64. M. Donaghy, R. Kennett, Varying occurrence of vocal cord paralysis in a family with
autosomal dominant hereditary motor and sensory neuropathy. J Neurol 246, 552-555
(1999).
65. C. J. Klein et al., TRPV4 mutations and cytotoxic hypercalcemia in axonal Charcot-Marie-
Tooth neuropathies. Neurology 76, 887-894 (2011).
66. D. H. Chen et al., CMT2C with vocal cord paresis associated with short stature and
mutations in the TRPV4 gene. Neurology 75, 1968-1975 (2010).
67. G. Landoure et al., Mutations in TRPV4 cause Charcot-Marie-Tooth disease type 2C. Nat
Genet 42, 170-174 (2010).
68. H. X. Deng et al., Scapuloperoneal spinal muscular atrophy and CMT2C are allelic
disorders caused by alterations in TRPV4. Nat Genet 42, 165-169 (2010).
69. S. R. Lamande et al., Mutations in TRPV4 cause an inherited arthropathy of hands and feet.
Nat Genet 43, 1142-1146 (2011).
70. M. J. Rock et al., Gain-of-function mutations in TRPV4 cause autosomal dominant
brachyolmia. Nat Genet 40, 999-1003 (2008).
71. D. Krakow et al., Mutations in the gene encoding the calcium-permeable ion channel
TRPV4 produce spondylometaphyseal dysplasia, Kozlowski type and metatropic dysplasia.
Am J Hum Genet 84, 307-315 (2009).
72. S. Unger et al., Fetal akinesia in metatropic dysplasia: The combined phenotype of
chondrodysplasia and neuropathy? Am J Med Genet A 155A, 2860-2864 (2011).
73. M. Beck, M. Roubicek, J. G. Rogers, P. Naumoff, J. Spranger, Heterogeneity of metatropic
dysplasia. Eur J Pediatr 140, 231-237 (1983).
74. S. D. Boden et al., Metatropic dwarfism. Uncoupling of endochondral and perichondral
growth. J Bone Joint Surg Am 69, 174-184 (1987).
75. N. Camacho et al., Dominant TRPV4 mutations in nonlethal and lethal metatropic
dysplasia. Am J Med Genet A 152A, 1169-1177 (2010).
76. J. Dai et al., Novel and recurrent TRPV4 mutations and their association with distinct
phenotypes within the TRPV4 dysplasia family. J Med Genet 47, 704-709 (2010).
77. A. N. Doman, P. Maroteaux, E. D. Lyne, Spondyloepiphyseal dysplasia of Maroteaux. J
Page 39
20
Bone Joint Surg Am 72, 1364-1369 (1990).
78. A. Megarbane, P. Maroteaux, C. Caillaud, M. Le Merrer, Spondyloepimetaphyseal
dysplasia of Maroteaux (pseudo-Morquio type II syndrome): report of a new patient and
review of the literature. Am J Med Genet A 125A, 61-66 (2004).
79. G. Nishimura et al., Spondylo-epiphyseal dysplasia, Maroteaux type (pseudo-Morquio
syndrome type 2), and parastremmatic dysplasia are caused by TRPV4 mutations. Am J Med
Genet A 152A, 1443-1449 (2010).
80. G. Nishimura et al., Spondyloepiphyseal dysplasia Maroteaux type: report of three patients
from two families and exclusion of type II collagen defects. Am J Med Genet A 120A, 498-
502 (2003).
81. L. O. Langer, D. Petersen, J. Spranger, An unusual bone dysplasia: parastremmatic
dwarfism. Am J Roentgenol Radium Ther Nucl Med 110, 550-560 (1970).
82. S. Muramatsu et al., Functional gene screening system identified TRPV4 as a regulator of
chondrogenic differentiation. J Biol Chem 282, 32158-32167 (2007).
83. C. J. O'Conor, T. M. Griffin, W. Liedtke, F. Guilak, Increased susceptibility of Trpv4-
deficient mice to obesity and obesity-induced osteoarthritis with very high-fat diet. Ann
Rheum Dis 72, 300-304 (2013).
84. R. J. Nims et al., A synthetic mechanogenetic gene circuit for autonomous drug delivery in
engineered tissues. Sci Adv 7, (2021).
85. S. Woods et al., Regulation of TGFbeta Signalling by TRPV4 in Chondrocytes. Cells 10,
(2021).
86. M. N. Phan et al., Functional characterization of TRPV4 as an osmotically sensitive ion
channel in porcine articular chondrocytes. Arthritis Rheum 60, 3028-3037 (2009).
87. M. Lv et al., Calcium signaling of in situ chondrocytes in articular cartilage under
compressive loading: Roles of calcium sources and cell membrane ion channels. J Orthop
Res 36, 730-738 (2018).
88. M. R. Servin-Vences, M. Moroni, G. R. Lewin, K. Poole, Direct measurement of TRPV4
and PIEZO1 activity reveals multiple mechanotransduction pathways in chondrocytes. Elife
6, (2017).
89. A. L. Clark, B. J. Votta, S. Kumar, W. Liedtke, F. Guilak, Chondroprotective role of the
osmotically sensitive ion channel transient receptor potential vanilloid 4: age- and sex-
dependent progression of osteoarthritis in Trpv4-deficient mice. Arthritis Rheum 62, 2973-
2983 (2010).
90. C. J. O'Conor et al., Cartilage-Specific Knockout of the Mechanosensory Ion Channel
TRPV4 Decreases Age-Related Osteoarthritis. Sci Rep 6, 29053 (2016).
91. Y. Krishnan, A. J. Grodzinsky, Cartilage diseases. Matrix Biol 71-72, 51-69 (2018).
92. F. C. Breedveld, Osteoarthritis--the impact of a serious disease. Rheumatology (Oxford) 43
Suppl 1, i4-8 (2004).
93. J. S. Smolen, D. Aletaha, I. B. McInnes, Rheumatoid arthritis. Lancet 388, 2023-2038
(2016).
Page 40
21
94. K. A. Theis, D. W. Roblin, C. G. Helmick, R. Luo, Prevalence and causes of work disability
among working-age U.S. adults, 2011-2013, NHIS. Disabil Health J 11, 108-115 (2018).
95. K. E. Barbour et al., Geographic Variations in Arthritis Prevalence, Health-Related
Characteristics, and Management - United States, 2015. MMWR Surveill Summ 67, 1-28
(2018).
96. J. M. Hootman, C. G. Helmick, K. E. Barbour, K. A. Theis, M. A. Boring, Updated
Projected Prevalence of Self-Reported Doctor-Diagnosed Arthritis and Arthritis-
Attributable Activity Limitation Among US Adults, 2015-2040. Arthritis Rheumatol 68,
1582-1587 (2016).
97. V. Y. Ma, L. Chan, K. J. Carruthers, Incidence, prevalence, costs, and impact on disability
of common conditions requiring rehabilitation in the United States: stroke, spinal cord
injury, traumatic brain injury, multiple sclerosis, osteoarthritis, rheumatoid arthritis, limb
loss, and back pain. Arch Phys Med Rehabil 95, 986-995 e981 (2014).
98. K. E. Barbour, C. G. Helmick, M. Boring, T. J. Brady, Vital Signs: Prevalence of Doctor-
Diagnosed Arthritis and Arthritis-Attributable Activity Limitation - United States, 2013-
2015. MMWR Morb Mortal Wkly Rep 66, 246-253 (2017).
99. L. B. Murphy, J. J. Sacks, T. J. Brady, J. M. Hootman, D. P. Chapman, Anxiety and
depression among US adults with arthritis: prevalence and correlates. Arthritis Care Res
(Hoboken) 64, 968-976 (2012).
100. S. E. Furner, J. M. Hootman, C. G. Helmick, J. Bolen, M. M. Zack, Health-related quality of
life of US adults with arthritis: analysis of data from the behavioral risk factor surveillance
system, 2003, 2005, and 2007. Arthritis Care Res (Hoboken) 63, 788-799 (2011).
101. R. L. Taruc-Uy, S. A. Lynch, Diagnosis and treatment of osteoarthritis. Prim Care 40, 821-
836, vii (2013).
102. F. Berenbaum, T. M. Griffin, R. Liu-Bryan, Review: Metabolic Regulation of Inflammation
in Osteoarthritis. Arthritis Rheumatol 69, 9-21 (2017).
103. J. Lieberthal, N. Sambamurthy, C. R. Scanzello, Inflammation in joint injury and post-
traumatic osteoarthritis. Osteoarthritis Cartilage 23, 1825-1834 (2015).
104. T. K. Kvien, Epidemiology and burden of illness of rheumatoid arthritis.
PharmacoEconomics 22, 1-12 (2004).
105. A. Courties, J. Sellam, F. Berenbaum, Metabolic syndrome-associated osteoarthritis. Curr
Opin Rheumatol 29, 214-222 (2017).
106. B. O. Diekman, F. Guilak, Stem cell-based therapies for osteoarthritis: challenges and
opportunities. Curr Opin Rheumatol 25, 119-126 (2013).
107. J. A. Martin, J. A. Buckwalter, Roles of articular cartilage aging and chondrocyte
senescence in the pathogenesis of osteoarthritis. Iowa Orthop J 21, 1-7 (2001).
108. T. D. Spector, F. Cicuttini, J. Baker, J. Loughlin, D. Hart, Genetic influences on
osteoarthritis in women: a twin study. BMJ 312, 940-943 (1996).
109. L. Punzi et al., Post-traumatic arthritis: overview on pathogenic mechanisms and role of
inflammation. RMD Open 2, e000279 (2016).
Page 41
22
110. C. Palazzo, C. Nguyen, M. M. Lefevre-Colau, F. Rannou, S. Poiraudeau, Risk factors and
burden of osteoarthritis. Ann Phys Rehabil Med 59, 134-138 (2016).
111. L. S. Lohmander, P. M. Englund, L. L. Dahl, E. M. Roos, The long-term consequence of
anterior cruciate ligament and meniscus injuries: osteoarthritis. Am J Sports Med 35, 1756-
1769 (2007).
112. B. D. Springer, W. M. Sotile, The Psychology of Total Joint Arthroplasty. J Arthroplasty
35, S46-S49 (2020).
113. K. T. Kim et al., Causes of failure after total knee arthroplasty in osteoarthritis patients 55
years of age or younger. Knee Surg Relat Res 26, 13-19 (2014).
114. S. Kurtz, K. Ong, E. Lau, F. Mowat, M. Halpern, Projections of primary and revision hip
and knee arthroplasty in the United States from 2005 to 2030. J Bone Joint Surg Am 89,
780-785 (2007).
115. A. Superti-Furga, S. Unger, Nosology and classification of genetic skeletal disorders: 2006
revision. Am J Med Genet A 143A, 1-18 (2007).
116. D. Krakow, D. L. Rimoin, The skeletal dysplasias. Genet Med 12, 327-341 (2010).
117. A.-V. Ngo, M. Thapa, J. Otjen, S. Kamps, Skeletal Dysplasias: Radiologic Approach with
Common and Notable Entities. Seminars in Musculoskeletal Radiology 22, 066-080 (2018).
118. S. F. Nemec et al., The importance of conventional radiography in the mutational analysis
of skeletal dysplasias (the TRPV4 mutational family). Pediatr Radiol 42, 15-23 (2012).
119. I. M. Orioli, E. E. Castilla, J. G. Barbosa-Neto, The birth prevalence rates for the skeletal
dysplasias. J Med Genet 23, 328-332 (1986).
120. D. L. Rimoin et al., The Skeletal Dysplasias: Clinical Molecular Correlations. Annals of the
New York Academy of Sciences 1117, 302-309 (2007).
121. J. M. Bauer, C. P. Ditro, W. G. Mackenzie, The Management of Kyphosis in Metatropic
Dysplasia. Spine Deform 7, 494-500 (2019).
122. A. Wada et al., Operative treatment of bilateral hip dislocations in a child with metatropic
dysplasia. J Pediatr Orthop B 16, 94-97 (2007).
123. B. A. McCray, A. Schindler, J. E. Hoover-Fong, C. J. Sumner, in GeneReviews((R)), M. P.
Adam et al., Eds. (Seattle (WA), 1993).
124. S. E. Jennings et al., Prevalence of mental health conditions and pain in adults with skeletal
dysplasia. Quality of Life Research 28, 1457-1464 (2019).
125. S. S. Kang, S. H. Shin, C.-K. Auh, J. Chun, Human skeletal dysplasia caused by a
constitutive activated transient receptor potential vanilloid 4 (TRPV4) cation channel
mutation. Experimental & Molecular Medicine 44, 707 (2012).
126. S. Loukin, Z. Su, C. Kung, Increased basal activity is a key determinant in the severity of
human skeletal dysplasia caused by TRPV4 mutations. PLoS One 6, e19533 (2011).
127. H. A. Leddy et al., Follistatin in chondrocytes: the link between TRPV4 channelopathies
and skeletal malformations. FASEB J 28, 2525-2537 (2014).
128. H. A. Leddy, A. L. McNulty, F. Guilak, W. Liedtke, Unraveling the mechanism by which
Page 42
23
TRPV4 mutations cause skeletal dysplasias. Rare Dis 2, e962971 (2014).
129. A. L. McNulty, H. A. Leddy, W. Liedtke, F. Guilak, TRPV4 as a therapeutic target for joint
diseases. Naunyn Schmiedebergs Arch Pharmacol 388, 437-450 (2015).
130. S. Thirion, F. Berenbaum, Culture and phenotyping of chondrocytes in primary culture.
Methods Mol Med 100, 1-14 (2004).
131. B. T. Estes, B. O. Diekman, J. M. Gimble, F. Guilak, Isolation of adipose-derived stem cells
and their induction to a chondrogenic phenotype. Nat Protoc 5, 1294-1311 (2010).
132. D. B. Katz, N. P. T. Huynh, A. Savadipour, I. Palte, F. Guilak, An immortalized human
adipose-derived stem cell line with highly enhanced chondrogenic properties. Biochem
Biophys Res Commun 530, 252-258 (2020).
133. N. P. Huynh et al., Long non-coding RNA GRASLND enhances chondrogenesis via
suppression of the interferon type II signaling pathway. Elife 9, (2020).
134. B. L. Larson et al., Chondrogenic, hypertrophic, and osteochondral differentiation of human
mesenchymal stem cells on three-dimensionally woven scaffolds. J Tissue Eng Regen Med
13, 1453-1465 (2019).
135. D. Nasrabadi, S. Rezaeiani, M. B. Eslaminejad, A. Shabani, Improved Protocol for
Chondrogenic Differentiation of Bone Marrow Derived Mesenchymal Stem Cells -Effect of
PTHrP and FGF-2 on TGFbeta1/BMP2-Induced Chondrocytes Hypertrophy. Stem Cell Rev
Rep 14, 755-766 (2018).
136. Q. Lian et al., Functional mesenchymal stem cells derived from human induced pluripotent
stem cells attenuate limb ischemia in mice. Circulation 121, 1113-1123 (2010).
137. A. I. Caplan, Mesenchymal Stem Cells: Time to Change the Name! Stem Cells Transl Med
6, 1445-1451 (2017).
138. K. Drela, L. Stanaszek, A. Nowakowski, Z. Kuczynska, B. Lukomska, Experimental
Strategies of Mesenchymal Stem Cell Propagation: Adverse Events and Potential Risk of
Functional Changes. Stem Cells Int 2019, 7012692 (2019).
139. Y. K. Yang, C. R. Ogando, C. Wang See, T. Y. Chang, G. A. Barabino, Changes in
phenotype and differentiation potential of human mesenchymal stem cells aging in vitro.
Stem Cell Res Ther 9, 131 (2018).
140. S. Yumlu et al., Gene editing and clonal isolation of human induced pluripotent stem cells
using CRISPR/Cas9. Methods 121-122, 29-44 (2017).
141. K. Musunuru, Genome editing of human pluripotent stem cells to generate human cellular
disease models. Dis Model Mech 6, 896-904 (2013).
142. S. P. Medvedev, A. I. Shevchenko, S. M. Zakian, Induced Pluripotent Stem Cells: Problems
and Advantages when Applying them in Regenerative Medicine. Acta Naturae 2, 18-28
(2010).
143. K. Takahashi et al., Induction of pluripotent stem cells from adult human fibroblasts by
defined factors. Cell 131, 861-872 (2007).
144. B. O. Diekman et al., Cartilage tissue engineering using differentiated and purified induced
pluripotent stem cells. Proc Natl Acad Sci U S A 109, 19172-19177 (2012).
Page 43
24
145. A. M. Craft et al., Generation of articular chondrocytes from human pluripotent stem cells.
Nat Biotechnol 33, 638-645 (2015).
146. K. M. Loh et al., Mapping the Pairwise Choices Leading from Pluripotency to Human
Bone, Heart, and Other Mesoderm Cell Types. Cell 166, 451-467 (2016).
147. H. Nejadnik et al., Improved approach for chondrogenic differentiation of human induced
pluripotent stem cells. Stem Cell Rev Rep 11, 242-253 (2015).
148. A. Yamashita et al., Generation of scaffoldless hyaline cartilaginous tissue from human
iPSCs. Stem Cell Reports 4, 404-418 (2015).
149. Q. Zhao et al., MSCs derived from iPSCs with a modified protocol are tumor-tropic but
have much less potential to promote tumors than bone marrow MSCs. Proc Natl Acad Sci U
S A 112, 530-535 (2015).
150. J. Lee et al., Early induction of a prechondrogenic population allows efficient generation of
stable chondrocytes from human induced pluripotent stem cells. FASEB J 29, 3399-3410
(2015).
151. W. M. Suchorska, E. Augustyniak, M. Richter, T. Trzeciak, Comparison of Four Protocols
to Generate Chondrocyte-Like Cells from Human Induced Pluripotent Stem Cells (hiPSCs).
Stem Cell Rev Rep 13, 299-308 (2017).
152. M. Xu, G. Shaw, M. Murphy, F. Barry, Induced Pluripotent Stem Cell-Derived
Mesenchymal Stromal Cells Are Functionally and Genetically Different From Bone
Marrow-Derived Mesenchymal Stromal Cells. Stem Cells 37, 754-765 (2019).
153. K. Umeda et al., Human chondrogenic paraxial mesoderm, directed specification and
prospective isolation from pluripotent stem cells. Sci Rep 2, 455 (2012).
154. R. A. Oldershaw et al., Directed differentiation of human embryonic stem cells toward
chondrocytes. Nat Biotechnol 28, 1187-1194 (2010).
155. S. S. Adkar et al., Step-Wise Chondrogenesis of Human Induced Pluripotent Stem Cells and
Purification Via a Reporter Allele Generated by CRISPR-Cas9 Genome Editing. Stem Cells
37, 65-76 (2019).
156. J. Lim et al., BMP-Smad4 signaling is required for precartilaginous mesenchymal
condensation independent of Sox9 in the mouse. Dev Biol 400, 132-138 (2015).
157. A. S. Patil, R. B. Sable, R. M. Kothari, An update on transforming growth factor-beta (TGF-
beta): sources, types, functions and clinical applicability for cartilage/bone healing. J Cell
Physiol 226, 3094-3103 (2011).
158. Q. O. Tang et al., TGF-beta3: A potential biological therapy for enhancing chondrogenesis.
Expert Opin Biol Ther 9, 689-701 (2009).
159. B. Johnstone, T. M. Hering, A. I. Caplan, V. M. Goldberg, J. U. Yoo, In vitro
chondrogenesis of bone marrow-derived mesenchymal progenitor cells. Exp Cell Res 238,
265-272 (1998).
160. A. Yamashita et al., Considerations in hiPSC-derived cartilage for articular cartilage repair.
Inflamm Regen 38, 17 (2018).
161. C. Murphy, A. Mobasheri, Z. Tancos, J. Kobolak, A. Dinnyes, The Potency of Induced
Page 44
25
Pluripotent Stem Cells in Cartilage Regeneration and Osteoarthritis Treatment. Adv Exp
Med Biol 1079, 55-68 (2018).
162. V. P. Willard et al., Use of cartilage derived from murine induced pluripotent stem cells for
osteoarthritis drug screening. Arthritis Rheumatol 66, 3062-3072 (2014).
163. S. S. Adkar et al., Genome Engineering for Personalized Arthritis Therapeutics. Trends Mol
Med 23, 917-931 (2017).
164. S. K. O'Connor, D. B. Katz, S. J. Oswald, L. Groneck, F. Guilak, Formation of
Osteochondral Organoids from Murine Induced Pluripotent Stem Cells. Tissue Eng Part A,
(2020).
165. B. Saitta et al., Patient-derived skeletal dysplasia induced pluripotent stem cells display
abnormal chondrogenic marker expression and regulation by BMP2 and TGFbeta1. Stem
Cells Dev 23, 1464-1478 (2014).
166. Y. Nur Patria et al., CRISPR/Cas9 gene editing of a SOX9 reporter human iPSC line to
produce two TRPV4 patient heterozygous missense mutant iPSC lines, MCRIi001-A-3
(TRPV4 p.F273L) and MCRIi001-A-4 (TRPV4 p.P799L). Stem Cell Res 48, 101942
(2020).
167. H. Liu et al., The potential of induced pluripotent stem cells as a tool to study skeletal
dysplasias and cartilage-related pathologic conditions. Osteoarthritis Cartilage 25, 616-624
(2017).
168. C. Sanjurjo-Rodriguez et al., Versatility of Induced Pluripotent Stem Cells (iPSCs) for
Improving the Knowledge on Musculoskeletal Diseases. Int J Mol Sci 21, (2020).
169. A. Yamashita et al., Statin treatment rescues FGFR3 skeletal dysplasia phenotypes. Nature
513, 507-511 (2014).
170. Y. Matsumoto et al., Induced pluripotent stem cells from patients with human fibrodysplasia
ossificans progressiva show increased mineralization and cartilage formation. Orphanet J
Rare Dis 8, 190 (2013).
171. E. E. Miller et al., EIF4A3 deficient human iPSCs and mouse models demonstrate neural
crest defects that underlie Richieri-Costa-Pereira syndrome. Hum Mol Genet 26, 2177-2191
(2017).
172. M. Okada et al., Modeling type II collagenopathy skeletal dysplasia by directed conversion
and induced pluripotent stem cells. Hum Mol Genet 24, 299-313 (2015).
173. R. Torres-Ruiz, S. Rodriguez-Perales, CRISPR-Cas9 technology: applications and human
disease modelling. Brief Funct Genomics 16, 4-12 (2017).
174. J. M. Brunger, A. Zutshi, V. P. Willard, C. A. Gersbach, F. Guilak, CRISPR/Cas9 Editing of
Murine Induced Pluripotent Stem Cells for Engineering Inflammation-Resistant Tissues.
Arthritis Rheumatol 69, 1111-1121 (2017).
175. L. Pferdehirt, A. K. Ross, J. M. Brunger, F. Guilak, A Synthetic Gene Circuit for Self-
Regulating Delivery of Biologic Drugs in Engineered Tissues. Tissue Eng Part A 25, 809-
820 (2019).
176. F. Guilak et al., Designer Stem Cells: Genome Engineering and the Next Generation of
Page 45
26
Cell-Based Therapies. J Orthop Res 37, 1287-1293 (2019).
Page 46
27
Chapter 2
Prospective Isolation of Chondroprogenitors
from Human iPSCs Based on
Cell Surface Markers Identified using a
CRISPR-Cas9-Generated Reporter
Partially adapted from: Dicks A*, Wu CL*, Steward N, Adkar SS, Gersbach CA, Guilak F.
Prospective isolation of chondroprogenitors from human iPSCs based on cell surface markers
identified using a CRISPR-Cas9-generated reporter. Stem Cell Research and Therapy. 2020 Feb
18;11(1):66.
2.1 Abstract
2.1.1 Background
Articular cartilage shows little or no capacity for intrinsic repair, generating a critical need of
regenerative therapies for joint injuries and diseases such as osteoarthritis. Human induced
pluripotent stem cells (hiPSCs) offer a promising cell source for cartilage tissue engineering and
in vitro human disease modeling; however, off-target differentiation remains a challenge during
hiPSC chondrogenesis. Therefore, the objective of this study was to identify cell surface markers
that define the true chondroprogenitor population and use these markers to purify iPSCs as a
means of improving homogeneity and efficiency of hiPSC chondrogenic differentiation.
2.1.2 Methods
We used a CRISPR-Cas9-edited COL2A1-GFP knock-in reporter hiPSC line, coupled with a
surface marker screen, to identify a novel chondroprogenitor population. Single-cell RNA
sequencing was then used to analyze the distinct clusters within the population. An unpaired t-
Page 47
28
test with Welch’s correction or an unpaired Kolmogorov-Smirnov test was performed with
significance reported at a 95% confidence interval.
2.1.3 Results
Chondroprogenitors expressing CD146, CD166, and PDGFR, but not CD45, made up an
average of 16.8% of the total population. Under chondrogenic culture conditions, these triple
positive chondroprogenitor cells demonstrated decreased heterogeneity as measured by single-
cell RNA sequencing with fewer clusters (9 clusters in unsorted vs. 6 in sorted populations)
closer together. Additionally, there was more robust and homogenous matrix production
(unsorted: 1.5 ng/ng vs. sorted: 19.9 ng/ng sGAG/DNA; p < 0.001) with significantly higher
chondrogenic gene expression (i.e., SOX9, COL2A1, ACAN; p < 0.05).
2.1.4 Conclusions
Overall, this study has identified a unique hiPSC-derived subpopulation of chondroprogenitors
that are CD146+/CD166+/PDGFR+/CD45- and exhibit high chondrogenic potential, providing a
purified cell source for cartilage tissue engineering or disease modeling studies.
2.2 Introduction
Articular cartilage is the load-bearing tissue that lines the ends of long bones in diarthrodial
joints, serving to resist compression and provide a nearly frictionless surface during joint loading
and movement (1, 2). The extracellular matrix of cartilage is comprised primarily of type II
collagen and proteoglycans, which are synthesized by the main residing cell type, chondrocytes
(3, 4). However, because it is aneural and avascular, cartilage shows little or no capacity for
intrinsic repair (4). Traumatic injury and a chronic inflammatory state lead to irreversible
degeneration of the tissue, driving diseases such as osteoarthritis (OA) (5, 6). Current treatments
Page 48
29
only target disease symptoms, creating a great demand for tissue-engineered cartilage as a
system for disease modeling, drug testing, and tissue replacement.
Human induced pluripotent stem cells (hiPSCs) offer a promising source for cartilage
tissue engineering and in vitro disease modeling (7) as they have virtually unlimited expansion
capacity, can be genetically modified, and avoid many of the ethical considerations associated
with embryonic stem cells (8, 9). Despite reports of several chondrogenic differentiation
protocols for pluripotent stem cells (10-15), incomplete differentiation and cell heterogeneity
remain major obstacles for iPSC chondrogenesis (16, 17). This challenge has been addressed in
other stem and progenitor cell types by prospectively isolating cells that exhibit chondrogenic
lineage commitment using surface marker expression. For example, previous studies have
identified chondroprogenitors within adult articular cartilage that can be isolated using
fibronectin adhesion assays since progenitors express integrins 5 and 1 (18, 19). Additionally,
mesenchymal progenitor cells, which express CD105, CD166, and CD146, have been reported to
have a high chondrogenic potential (19-21). Adult multipotent cells, such as bone marrow
mesenchymal stem cells (MSCs) or adipose stem cells (ASCs), exhibit chondrogenic potential
and have been used extensively for cartilage tissue engineering. They are often characterized by
a range of cell surface marker expression, including CD105, CD73, CD90, CD271, CD146, Stro-
1, and SSEA-4 (22). In an effort to identify a more developmentally-relevant progenitor
population, self-renewing human skeletal stem cells characterized by CD164+, CD73-, and
CD146- showed chondrogenic differentiation when implanted in a mouse renal capsule (23). In
another study, limb bud cells expressing CD73 and BMPR1 while having low to no expression
of CD166, CD146, and CD44 were proposed to be the earliest cartilage committed cells
(prechondrocytes) in human embryonic development (24). However, surface markers
Page 49
30
characteristics of hiPSC-derived chondroprogenitors or chondrocytes remain to be identified.
Previously, our lab used green fluorescent protein (GFP) reporter systems to track the
expression of collagen type II alpha 1 chain (COL2A1) in mouse (25) and human (26) iPSCs,
allowing for the prospective isolation and purification of COL2A1-GFP+ chondrogenic cells
during the differentiation process. Despite the fact that this approach significantly enhanced
homogeneity of iPSC chondrogenesis (26), genome editing is required to create a reporter line,
hindering potential clinical translation. In this regard, the identification of cell surface markers
that are directly representative of this COL2A1-positive population could greatly enhance the
prospective isolation and purification of chondroprogenitors, without requiring genetic
modifications to the cell line.
In this study, we used a COL2A1-GFP knock-in reporter hiPSC line as a tool to identify
cell surface markers that are highly co-expressed with COL2A1 to test the hypothesis that this
sub-population of chondroprogenitor cells will show increased purity and chondrogenic capacity.
Single-cell RNA sequencing (scRNA-seq) was then used to investigate the gene expression
profile of this population and to identify subsets within it. Matrix production, cell morphology,
and gene expression were measured to evaluate chondrogenic ability of unsorted and sorted
chondroprogenitor cells. This chondroprogenitor population appears to represent an intermediate
step in the developmental pathway of in vitro hiPSC chondrogenesis in which off-target
differentiation also occurs. The identification of surface markers to purify this population of
chondroprogenitor cells via sorting will enhance the efficiency of hiPSC-chondrogenic
differentiation for use in tissue engineering, in vitro disease modeling, and drug testing.
2.3 Methods
Page 50
31
2.3.1 hiPSC lines and culture
Two hiPSC lines were used in the current study: RVR COL2A1-GFP knock-in line (RVR) and
BJFF.6 line (BJFF). The RVR line was retrovirally reprogrammed from BJ fibroblasts and
characterized as previously described (12, 27). Using CRISPR-Cas9 genome editing, a GFP
reporter allele was added to the COL2A1 gene as previously reported (26). The cells were
cultured in mTeSR1 medium (StemCell Technologies, Canada, 85857). The BJFF line was
derived using Sendai viral transfection of foreskin fibroblasts from a newborn male and cultured
in Essential 8 Flex medium (E8; Gibco, USA, A2858501). Both lines were maintained on
vitronectin coated plates (VTN-N; Fisher Scientific, USA, A14700) with daily medium changes.
Cells were passaged at approximately 90% confluency and induced into mesodermal
differentiation at 40% confluency.
2.3.2 Mesodermal differentiation
hiPSCs were induced into mesodermal differentiation in monolayer according to the previously
published protocol (26). In brief, cells were fed daily with various cocktails of growth factors
and small molecules driving stepwise lineage differentiation (anterior primitive streak, paraxial
mesoderm, early somite, sclerotome, and chondroprogenitor) in differentiation medium
composed of IMDM GlutaMAX (IMDM; Gibco, USA, 31980097) and Ham’s F12 Nutrient Mix
(F12; Gibco, USA, 11765062) with 1% chemically defined lipid concentrate (Gibco, USA,
11905031), 1% insulin/human transferrin/selenous acid (ITS+; Corning, USA, 354352), 1%
penicillin/steptomycin (P/S; Gibco, USA, 15070063), and 450 μM 1-thioglycerol (Sigma–
Aldrich, USA, M6145-25ML). Upon differentiation into the chondroprogenitor stage, cells were
dissociated using TrypLE (Gibco, USA, 12563029) at 37ºC followed by neutralization with
equal parts of DMEM/F-12, GlutaMAXTM (DMEM/F12; Gibco, USA, 10565042) with 10% fetal
Page 51
32
bovine serum (FBS; Atlanta Biologicals, USA, S11550) and 1% P/S. The dissociated cells were
used for cell sorting and chondrogenic differentiation as appropriate.
2.3.3 Fluorescent activated cell sorting (FACS)
Chondroprogenitor cells were resuspended in FACS Buffer (PBS-/- with 1% FBS and 1%
penicillin/steptomycin/fungizone (P/S/F; Gibco, USA, 15-240-062) at approximately 40 x 106 /
mL. The cells were treated with ~6.5% of Human TruStain FcXTM (BioLegend, USA, 422302)
for 10 min at RT. Approximately 5 x 10⁴ cells in 100 µl were used for each compensation. Cells
were labeled with appropriate antibodies including an isotype control. A table of the antibodies
used can be found in Table 2.1. Cells were incubated for 30 minutes at 4ºC and washed with
FACS buffer twice. Samples were resuspended in sorting medium consisting of DMEM/F12
with 2% FBS, 2% P/S/F, 2% Hepes (Gibco, USA, 15-630-080), and DAPI (BioLegend, USA,
422801) at 4 x 10⁶ cells / mL and filtered through a 40 µm cell strainer. Cells were stored on ice
prior to sorting.
Table 2.1 Antibodies used for flow cytometry and sorting.
Marker Color Company
Catalog Number
Antibody Isotype
CD45 FITC BioLegend 304006 400110
CD166 PE BioLegend 343904 400112
CD146 PE/Cy7 BioLegend 361008 400126
PDGFR APC BioLegend 323608 400121
CD271 PE/Cy7 BioLegend 345110 400126
CD105 PE BioLegend 323206 400113
CD73 Pacific Blue BioLegend 244012 400151
BMPR1 APC R&D Systems FAB5051A IC0041A
Page 52
33
An Aria-II FACS machine was used to compensate and gate the samples. Sorted cells
were collected in collection media composed of DMEM/F12, 20% FBS, 1% P/S/F, 1% ITS+, 1%
MEM non-essential amino acids (NEAA; Gibco, USA, 11140050), and 0.1% ROCK inhibitor
(Stemcell Technologies, Canada, NC0791122). Data was analyzed using FlowJo software.
2.3.4 10X chromium platform scRNA-seq
Cells were thawed at 37ºC and resuspended in PBS + 0.01% BSA at concentration of 2,000
cells/l. Cell suspension were submitted to the Genome Technology Access Center (GTAC
sequencing core) at Washington University in St. Louis for library preparation and sequencing. In
brief, 10,000 cells per sample were loaded on a Chromium Controller (10x Genomics, USA) for
single capture. Libraries were prepared using Single Cell 3′ Library & Gel Bead Kit v2 (10x
Genomics, USA, 120237) following manufacture’s instruction. A single cell emulsion (Gel Bead-
In-Emulsions, GEMs) is created by making barcoded cDNA unique to each individual emulsion.
Recovery agent was added to break GEM and cDNA was then amplified. A library is produced
via end repair, dA-tailing, adaptor ligation, post-ligation cleanup with SPRIselect, and sample
index PCR. The quality and concentration of the amplified cDNA was evaluated by Bioanalyzer
(Agilent Technologies, USA, 2100) on a High Sensitivity DNA chip (Agilent Technologies, USA,
5065-4401). Only cDNA with average library size 260-620 bp were used for sequencing.
Sequencing was performed by HiSeq2500 (Illumina, USA) with the following read length: 26 bp
for Read1, 8 bp for i7 Index, and 98 bp for Read2. A species mixing experiment (mouse and
human) was also performed prior to running on actual sample to ensure good single cell capture
(i.e., cell doublet rate < 5%).
Page 53
34
2.3.5 Preprocessing of scRNA-seq data
Paired-end sequencing reads were processed by Cell Ranger (10x Genomics software, version
2.0.0). Briefly, reads were aligned to the GRCh38 (version 90) for genome annotation,
demultiplexing, barcode filtering and gene quantification. Cell Ranger also removes any barcode
that has less than 10% of the 99th percentile of total unique molecular identifiers (UMI) counts
per barcode as these barcodes are associated with empty droplets. After this quality control, gene
barcode matrix for sorted and unsorted cells were generated by counting the number of UMIs for
a given gene (as row) in individual cell (as column). For sorted cell sample, 8,682 cells with
19,140 genes were captured, while for unsorted cell sample, we obtained 8,220 cells with 19,604
genes.
2.3.6 Unsupervised clustering analysis and cell cluster annotation
To assess the difference in composition of cell populations due to sorting for selective markers,
we performed global unsupervised clustering analysis on data sets of scRNA-seq from sorted and
unsorted cells. First, gene barcode matrices from were input into Seurat R package (version 2.4)
(28). We then removed the low-quality cells with less than 200 or more than 7,000 detected genes,
or if their mitochondrial gene content was more than 5%. Genes were filtered out that were
detected in less than 3 cells. After filtering out low-quality cells or cell doublets, the gene
expression was then natural log transformed and normalized for scaling the sequencing depth to
10,000 molecules per cell. Next, to reduce the variance introduced by “unwanted” sources, we
regressed out variation in gene expression driven by cell cycle stages and mitochondrial gene
expression with vars.to.regress argument in function ScaleData in Seurat. We then used
FindVariableGenes function in Seurat to identify highly variable genes across cells for
downstream analysis. These quality control steps resulted in 4,173 cells with 1,833 highly variable
Page 54
35
genes for sorted cell sample, and 8,630 cells with 3,009 highly variable genes for unsorted cell
sample. Dimensionality reduction on the data was then performed by computing the significant
principal components on highly variable genes. We then performed unsupervised clustering by
using FindClusters function in Seurat with the resolution argument set to 0.6, and clusters were
then visualized in t-distributed Stochastic Neighbor Embedding (tSNE) plot (29).
Differentially expressed genes (DEGs) among each cell cluster were determined using
FindAllMarkers function in Seurat. DEGs expressing at least in 25% cells within the cluster and
with a fold change of more than 0.25 in log scale were considered to be marker genes of the
cluster. To determine the biology functions of the marker genes from a given cluster, we
performed Gene Ontology (GO) enrichment analysis by using The DAVID Gene Functional
Classification Tool (http://david.abcc.ncifcrf.gov; version 6.8) (30). By comparing these unique
biological GO terms with existing RNA-seq datasets and the literature, we were able to annotate
cell clusters. Additionally, the top 10 enriched GO terms from biological function category with
associated p values were visualized by GraphPad Prism (version 8.0; GraphPad Software).
2.3.7 Canonical correlation analysis for integrated analysis of sorted and
unsorted scRNA-seq data
To compare cell types and to identify their associated DEGs between sorted and unsorted cells,
we applied canonical correlation analysis (CCA), a computational strategy implemented in
Seurat for integrated analysis of multiple datasets, on the scRNA-seq datasets from the cells with
or without sorting. First, top 1,000 highly variable genes from two datasets were selected. We
then use RunCCA function to identify common sources of variation between the two datasets and
to merge the two objects into a single dataset. We next determined the top principal components
of the CCA by examining a saturation in the relationship between the number of principle
components and the percentage of the variance explained using the MetageneBicorPlot function.
Page 55
36
By using selected top principal components, we aligned the CCA subspaces with AlignSubspace
function, which returns a new dimensional reduction matrix allowing for downstream clustering
and DEG analyses. DEG analysis was performed on the cells from different datasets but grouped
in the same cluster (i.e. conserved cell types between two conditions) after CCA alignment. The
methods for cell clustering, identification of conserved cells types and DEGs as well as
annotation of cell clusters were similar to the ones mentioned previously. DEGs in each
conserved cell types in response to sorting were visualized by ComplexHeatmap R package (31).
2.3.8 Expansion of chondroprogenitor cells
Sorted and unsorted chondroprogenitor cells were plated on non-coated flasks and cultured in
MEM alpha media (Gibco, USA, 12571048) with 1% penicillin/streptomycin (P/S; Gibco, USA,
15070063), 50 μg/ml L-ascorbic acid 2-phosphate (ascorbate; Sigma-Aldrich, USA, A4544), and
10 ng/ml basic fibroblast growth factor (bFGF; R&D Systems, USA, 233FB001MGC). Cells
were fed every three days until 80-90% confluency prior to further expansion or chondrogenesis.
chondroprogenitor cells were passaged up to four times.
2.3.9 Chondrogenic differentiation
Sorted, unsorted, and expanded chondroprogenitor cells were re-suspended at 2.5 x 10⁵ cells /
mL in chondrogenic medium composed of DMEM/F-12, 1% FBS, 1% ITS+, 55 µM -
mercaptoethanol (Gibco, USA, 21985-023), 100 nM dexamethasone (DEX; Sigma-Aldrich,
USA, D4902), 1% NEAA, 1% P/S, 10 ng/ml human transforming growth factor beta 3 (TGF-3;
R&D Systems, USA, 24-3B3-200CF), 50 μg/ml L-ascorbic acid 2-phosphate (ascorbate; Sigma-
Aldrich, USA, A4544), and 40 μg/ml L-Proline (proline; Sigma-Aldrich, USA, P5607). 2 mL of
the cell solution was added to a 15mL conical tube and centrifuged for 5 min at 300g to form a
pellet. Chondrogenic pellets were cultured at 37ºC for 28 days. Medium was changed every 3-4
Page 56
37
days.
2.3.10 Histology
After chondrogenic differentiation, pellets were collected in 10% neutral buffered formalin for
fixation for 24 hours. Pellets were then transferred to 70% ethanol, dehydrated, and embedded in
paraffin wax. Wax blocks were sectioned at 8 µm and stained for glycosaminoglycans and cell
nuclei according to the Safranin-O and hematoxylin standard protocol.
2.3.11 Immunohistochemistry
Histologic sections were washed with xylene three times and rehydrated before labeling against
COL1A1, COL2A1, COL6A1, and COL10A1. Antigen retrieval was performed with 0.02%
proteinase K for 3 min at 37ºC for COL2A1 and COL6A1 and with pepsin for 5 min at RT for
COL1A1 and COL10A1 followed by peroxidase quench then serum blocking for 30 min at RT
each. Samples were labeled for 1 hour with the primary antibody (COL1A1: 1:800 Abcam, UK,
90395; COL2A1: 1:10 Developmental Studies Hybridoma Bank, USA, II-II6B3-s; COL6A1
1:1000 Fitzgerald, USA, 70F-CR009X; COL10A1 1:200 Sigma, USA, C7974) and for 30 min
with the secondary antibody (COL1A1, COL2A1, COL10A1: 1:500 Goat Anti-Mouse Abcam,
UK, 97021; COL6A1: 1:500 Goat Anti-Rabbit Abcam, UK, 6720). Reagent C was then used for
enzyme conjugation for 20 min at RT followed by AEC for 2.5 min (COL2A1 and COL6A1) or
2 min (COL1A1 and COL10A1) at RT. Finally, samples were counterstained with hematoxylin
to reveal cell nuclei for 45 sec.
2.3.12 Biochemical analysis
Pellets were rinsed with PBS after chondrogenic differentiation and digested at 65ºC overnight in
200 µl of 125 μg/ml papain (Sigma-Aldrich, USA, P4762), 100 mM sodium phosphate (Sigma-
Aldrich, USA, 71507), 5 mM ethylenediaminetetraacetic acid (EDTA; Sigma-Aldrich, USA,
Page 57
38
ED2SS), and 5 mM L-cysteine hydrochloride (Sigma-Aldrich, USA, C1276) at 6.5 pH. Samples
were stored at -80ºC before thawing to measure double stranded DNA and sulfated
glycosaminoglycans (sGAG). The PicoGreen (Invitrogen, USA, P7589) and 1,9-
dimethylmethylene blue (Sigma-Aldrich, USA, 341088), with chondroitin-4-sulfate (Sigma-
Aldrich, USA, C9819) as a standard, assays were used according to the protocols to quantify
DNA and sGAG respectively.
2.3.13 Gene expression
Day 28 pellets were rinsed with PBS-/- and snap frozen in 300 µl of Buffer RL (from Total RNA
Purification Kit, Norgen Biotek, Canada, 37500) and stored at -80ºC. Samples were thawed and
homogenized with zirconia beads (BioSpec Products, USA, 11079124zx) and a miniature bead
beater. RNA was isolated from the samples using the Total RNA Purification Kit according to
the manufacture’s protocol (Norgen Biotek, Canada, 37500). Reverse transcription of the RNA
was performed using SuperScript VILO Master Mix (Thermo Fisher, USA, 11755500) to
maintain cDNA. Fast SYBR Green Master Mix (Thermo Fisher, USA, 4385617) was used for
quantitative real time polymerase chain reaction (RT-qPCR) according to manufacturer’s
instructions on the QuantStudio 3 (Thermo Fisher, USA). Gene expression was analyzed using
the CT method relative to undifferentiated hiPSCs with the reference gene TATA-box-binding
protein (TBP) (32). Sequences of primers can be found in the Table 2.2.
Table 2.2 Human primer sequences. Primers were used for RT-qPCR and are listed as 5’ to 3’.
Gene Forward Sequence Reverse Sequence
ACAN CACTTCTGAGTTCGTGGAGG ACTGGACTCAAAAAGCTGGG
COL1A1 TGTTCAGCTTTGTGGACCTC TTCTGTACGCAGGTGATTGG
COL2A1 GGCAATAGCAGGTTCACGTA CTCGATAACAGTCTTGCCCC
Page 58
39
COL5A1 GGCTCCCGAGAGCAACCT CGGGACACTCACGAACGAA
COL6A1 TCAAGAGCCTGCAGTGGATG TGGACACTTCTTGTCTATGCAG
COL10A1 CATAAAAGGCCCACTACCCAAC ACCTTGCTCTCCTCTTACTGC
IGFBP5 TCCCCACGTGTGTTCATCTG AAATGGGATGGACTGAGGCG
NES CAGGGGCAGACATCATTGGT CACTCCCCCATTCACATGCT
NKX3-2 GCTGGGAGCTTTCTGCACTA TTCGCACCCCTTGGTTACAA
OTX1 AGACGCATCAGACCCTGAAGGACT CCAGACCTGGACTCTAGACTC
PRRX1 GCAGGCTTTGGAGCGTGTCT TCCTGCGGAACTTGGCTCTT
SOX9 CGTCAACGGCTCCAGCAAGAACAA GCCGCTTCTCGCTCTCGTTCAGAAGT
TBP AACCACGGCACTGATTTTCA ACAGCTCCCCACCATATTCT
2.3.14 Statistical analysis
Quantification of surface marker expression was performed 8 separate times with technical
replicates of n = 3-4 for each experiment. Biochemical analysis and RT-qPCR were performed
on the pellets collected from two independent sorting experiments (n = 3-4 samples per group
per experiment). Gene expression and sGAG/DNA data were tested for normality using the
Shapiro-Wilk test. An unpaired t-test with Welch’s correction was then performed assuming a
Gaussian distribution. If data was not normal, an unpaired Kolmogorov-Smirnov test was
performed. All calculations were performed using GraphPad Prism (GraphPad Software; version
8.0). Two-tailed p values were calculated and reported at a 95% confidence interval.
2.4 Results
2.4.1 COL2A1-positive chondroprogenitor cells express PDGFR, CD146, and
CD166
COL2A1-GFP reporter hiPSCs were differentiated into chondroprogenitor cells along the
mesodermal lineage for 12 days as previously described (26). After the 12 days of
differentiation, flow cytometric analysis showed that, on average, 4.27% of the population
Page 59
40
expressed COL2A1 based on GFP expression (Figure 2.1A). The COL2A1-positive cells were
assumed to be chondroprogenitors with a unique surface marker profile. The cells were labeled
for surface markers commonly associated with MSCs and/or chondroprogenitors in the
developing limb bud: BMPR1, CD73, CD105, CD146, CD166, CD271, and PDGFR (22-24).
Of the total population, less than 1% expressed COL2A1 in addition to either CD271 (0.4%),
CD105 (0.16%), CD73 (0.09%), or BMPR1 (0%) (Figure 2.1B). Interestingly, 2.32%, 2.17%,
or 1.32% of the total population co-expressed COL2A1 with PDGFR, CD146, or CD166
respectively (Figure 2.1C). Since these markers appear to be the most highly correlated with
COL2A1 expression of the previously identified as MSC and/or chondroprogenitor markers
selected, cells were sorted based on expression of these markers for this study. Sorting also
removed cells expressing CD45 (< 15% of total cells) to eliminate any non-chondrogenic
hematopoietic stem cells potentially derived during mesoderm differentiation (Figure 2.1D).
2.4.2 PDGFR, CD146, and CD166 enriched chondroprogenitor cells
The BJFF hiPSC line (wildtype without genome editing) was differentiated into
chondroprogenitor cells accordingly (12 days in monolayer). Cells either directly underwent
chondrogenic pellet culture, were expanded, were saved for scRNA-seq, or were labeled for the
surface markers of interest (Figure 2.1D). Fluorescent activated cell sorting (FACS) was used to
sort live chondroprogenitor cells negative for CD45 and positively expressing PDGFR and
CD146, followed by expression of CD166 (Figure 2.1E). Cells not expressing any of these
surface markers were also analyzed as a negative control. Approximately 16.5% of the total
chondroprogenitor cell population was triple positive for PDGFR, CD146, and CD166, which
was significantly higher than the percentage of the cells (7.2% of total cell population) that were
triple-negative for these markers (Figure 2.1F). As with unsorted cells, sorted cells were also
Page 60
41
collected and either pelleted for chondrogenesis, expanded, or saved for scRNA-seq, as
described in Figure 2.1D.
Figure 2.1 Surface marker analysis and sorting strategy to identify progenitors with robust
chondrogenic potential from heterogenous chondroprogenitor (CP) cells. (A) Flow cytometry
showed approximately 4.27% of cells expressed COL2A1-GFP. (B-C) Chondroprogenitors were
labeled for various surface markers and analyzed for co-expression with COL2A1-GFP. (B)
Most COL2A1-GFP+ cells did not express CD271, CD105, CD73, and BMPR1. (C) PDGFR,
Page 61
42
CD146, and CD166 were co-expressed with COL2A1-GFP. (D) A schematic representing the
experimental design. The RVR cell line with the COL2A1-GFP reporter was differentiated into
chondroprogenitor cells. Surface marker analysis indicated that PDGFR, CD146, and CD166
expression were highly co-expressed with COL2A1 but not CD45. (E) Cells expressing these
desired markers were sorted from wildtype BJFF chondroprogenitor cells. To evaluate
chondrogenic potential of the sorted cells, pellets from the sorted cells were either made
immediately post-sorting or formed after in vitro expansion. (F) A higher percentage of the total
cell population (~16.8%) were triple positive for the desired markers compared to the population
not expressing any of these markers. * p < 0.05. Data represented as mean ± SEM. n = 7-8
independent experiments.
2.4.3 scRNA-seq reveals that unsorted chondroprogenitor cells contained
diverse cell populations
We next used scRNA-seq to explore the cell diversity and genetic profiles of unsorted
chondroprogenitor cells. At least 9 distinct cell populations (cell clusters) were observed in
unsorted chondroprogenitor cells (Figure 2.2A). Among these populations, 5 of them were
enriched for a variety of neural cell markers such as SOX2, OTX1, NES, and PAX6 (Figure 2.2B),
likely representing populations of the neurogenic lineage. Of these, SOX2, OTX1, and PAX6
expression were significantly downregulated with sorting according to RT-qPCR (Figure S2.2A).
Furthermore, we found that 3 cell populations exhibited high expression levels of several
mesenchyme markers including PRRX1, COL1A1, COL5A1, and COL6A1 which were
comparable between sorted and unsorted groups, while only a small cell population (2.3% of
total cells) expressed chondrogenic markers such as SOX9, COL2A1, IGFBP5, and NKX3-2
(Figure 2.2B, 2.2C, S2.2B, and S2.2C). Using Gene Ontology (GO) enrichment analysis of the
gene sets representing each cell cluster (Figure 2.2D and S2.1A) we observed that cells
expressing SOX9 and COL2A1 demonstrated gene sets enriched for protein translation and
skeletal system development.
Page 63
44
Figure 2.2 Cell populations and GO enrichment analysis of unsorted chondroprogenitor cells.
(A) scRNA-seq identified unsorted chondroprogenitor cells contained at least 9 populations,
which could be further categorized into 3 broad classes: neurogenic cells (blue dashed circle),
chondrogenic cells (green dashed circle), and mesenchyme (brown dashed circle). (B)
Expression of signature genes of each cell lineage. (C) GO terms analysis (biological process) of
each unique population. (D) Percentage of total unsorted chondroprogenitor cells in each unique
cell population. More than 20% of the unsorted chondroprogenitors were SOX2/TTR/NES+
neurogenic cells, while only small number of unsorted cells expressed SOX9 and COL2A1.
2.4.4 scRNA-seq reveals that sorting enriched SOX9/COL2A1+ cells
scRNA-seq of sorted chondroprogenitor cells indicated that there were at least 6 cell populations
consisting of PDGFR+/CD146+/CD166+ cells (Figure 2.3A). Surprisingly, there was still a
small percentage of cells (4% of total sorted cells) expressing SOX2 and NES, despite the
stringent sorting regime (Figures 2.3B and 2.3C). We also observed that SOX2/NES+ cells
exhibited high expression of CD47, an integrin-associated protein (33) (Figure S2.1B).
Nevertheless, sorting still significantly enriched cells positive for SOX9 and COL2A1 by > 11-
fold (27% of total sorted cells vs. 2.3% of total unsorted cells). Interestingly, overall gene
expression of these chondrogenic genes was not increased, in fact COL2A1 was decreased with
sorting when evaluated by RT-qPCR (Figure S2.2C). We observed that sorting slightly increased
the percentage of the cells expressing ALCAM (22.1% of the unsorted cells vs. 28.3% of the
sorted cells). However, 9.9% of the total sorted cells were triple positive for
SOX9/COL2A1/ALCAM, while only 0.8% of the total unsorted cells co-expressed these three
genes. Interestingly, we also found that ALCAM was also expressed by both chondrogenic and
neurogenic progenitors (e.g., 31.9% of SOX9/COL2A1+ cells and 44.9% of SOX2/TTR+ cells
were positive for ALCAM in the sorted group), implying ALCAM alone may not be used as a
sole marker for chondroprogenitor cells. Additionally, we also observed that gene expression
levels of the sorting makers were enriched in the sorted population, with ALCAM (CD166)
highest in the SOX9 and COL2A1 cluster compared to the enrichment of all three in the unsorted
Page 64
45
mesenchyme population (Figure 2.3D). Similarly, there was enrichment of some previously
reported pro-chondrogenic markers (18, 19, 21, 24) in the sorted chondroprogenitor population;
specifically ITGA5 and ENG (CD105) (Figure S2.3). Skeletal system development, as expected,
emerged as a significant GO term in SOX9/COL2A1+ cells, while HMGB2/TOP2A+ and
LGALS1/PTTG1+ cells were enriched in gene sets of cell division (Figure 2.3E and S2.1C).
Page 66
47
Figure 2.3. Cell populations and GO enrichment analysis of sorted chondroprogenitor cells. (A)
scRNA-seq identified PDGFR+/CD146+/CD166+ cells contained at least 6 populations. (B)
Expression of signature genes of each cell lineage. The sorted cells were enriched for
mesenchymal and chondrogenic genes. (C) Percentage of total sorted chondroprogenitor cells in
each unique cell population. 27% of the sorted were SOX9/COL2A1. Interestingly, a small
percentage of cells (4% of total sorted cells) expressing SOX2 and NES was still observed. (D)
PDGFR+/CD146+/CD166+ sorted cells may belong to mesenchymal population (brown dashed
circle) in unsorted cells. Green dashed circle indicates the population that was positive for SOX9
and COL2A1. (E) GO terms analysis (biological process) showing skeletal system development
was highlighted in SOX9/COL2A1+ cells, while HMGB2/TOP2A+ and LGALS1/PTTG1+ cells
were enriched in gene sets of cell division.
2.4.5 Canonical correlation analysis (CCA) demonstrates high enrichment of
proliferative and mesenchymal genes in sorted chondroprogenitor cells
CCA, a machine-learning method that performs linear combinations of features across data sets
that are maximally correlated, was used to integrate scRNA-seq datasets from sorted and
unsorted cells (28). Five major conserved populations were identified after CCA alignment of the
sorted and unsorted chondroprogenitor cells (Figure 2.4A). Among these populations,
HIST1H4C+ cells accounted for the largest conserved population, while the IGFBP5/COL2A1+
cluster was the smallest. We next performed differentially expression gene (DEG) analysis to
explore how sorting enriches or depletes the levels of gene expression within each individual
population (Figure 2.4B). Within the IGFBP5/COL2A1+ population, sorted cells exhibited
significantly up-regulated expression of several mesenchymal genes including TPM1, TAGLN
and TMSB10 (indicated by brown circle), which have been suggested to be essential in
chondrogenesis (34, 35). Furthermore, within the IGFBP5/COL2A1+ population, sorted cells
demonstrated significantly down-regulated expression of IGFBP5 (indicated by blue circle), an
important transcription factor inducing chondroprogenitor cells into the chondrogenic lineage
(36).
Page 68
49
Figure 2.4 CCA for integrated analysis of sorted and unsorted scRNA-seq datasets. (A) Five
major conserved populations were identified after CCA alignment of the sorted and unsorted
chondroprogenitor cells (B) DEG analysis indicated that sorted cells exhibited significantly up-
regulated expression of several mesenchymal genes including TPM1, TAGLN and TMSB10
(brown circle), which have been suggested to be essential in chondrogenesis. Proliferative
markers including SOX4 (red circle) and TUBA1A (yellow circle) were increased, but IGFBP5
(blue circle) and several ribosomal genes were decreased in sorted cells.
2.4.6 Sorting improved matrix production and homogeneity in cartilaginous
pellets
Sorted and unsorted cells from both the reporter and wildtype lines underwent chondrogenesis in
pellet culture for 28 days. Pellets stained with safranin-O for sulfated glycosaminoglycans
(sGAGs) showed that sorting increased matrix production as well as homogeneity of cell
morphology (Figure 2.5A and S2.4). Additionally, the layer of non-cartilaginous-like cells
surrounding unsorted cell pellets was eliminated in the pellets derived from sorted cells.
Biochemical analysis demonstrated that sorting significantly increased the ratio of sGAGs to
DNA in pellets by almost 15-fold (unsorted: 1.5 ng/ng vs. sorted: 19.89 ng/ng, Figure 2.6A).
Similarly, there was an increase in production and homogeneity observed in sorted pellets
labeled for COL2A1 (Figure 2.5B). In addition, IHC labeling for COL1A1 showed a slight
decrease at the perimeter of the pellet while the labeling for COL10A1 showed an increase in the
respective matrix proteins with sorting (Figure 2.5C and 2.5D). Additionally, pellets formed with
sorted cells had more localized staining of COL6A1 around the cells as shown with IHC
compared to the more diffused pattern observed with unsorted cells (Figure S2.5).
Page 69
50
Figure 2.5 Histology and IHC for matrix proteins in RVR-COL2 and BJFF pellets. (A) Safranin-
O staining for sGAG showing pellets derived from sorted chondroprogenitor cells had more
robust staining and homogenous cell morphology compared to pellets derived from unsorted
cells in both lines. (B) Labeling of COL2A1 showed similar results with an increase in COL2A1
in sorted pellets as opposed to unsorted which has isolated areas of staining. (C) There was little
labeling of COL1A1 for both unsorted and sorted cell pellets. (D) Labeling for COL10A1 was
increased with sorting. Scale bar = 200 µm. Inset scale bar = 400 µm.
2.4.7 Expression of cartilaginous genes was significantly higher in pellets
derived from triple positive chondroprogenitor cells
Gene expression in pellets derived from unsorted and triple positive-sorted chondroprogenitor
cells was analyzed using RT-qPCR. Chondrogenic genes SOX9 (unsorted: 0.88-fold change vs.
sorted: 6.62 fold change), ACAN (unsorted: 7.22-fold change vs. sorted: 1614-fold change), and
COL2A1 (unsorted: 0.68-fold change vs. sorted: 1667-fold change) were significantly increased
in sorted pellets (Figure 2.6B-D). Additionally, COL1A1 (unsorted: 0.74-fold change vs. sorted:
25.91-fold change) and COL10A1 (unsorted: 2.69-fold change vs. sorted: 54.32-fold change)
were significantly higher in sorted pellets compared to unsorted (Figure 2.6E-F). Statistical
Page 70
51
significance was maintained for all genes when analyzed alternatively (Figure S2.6).
Figure 2.6. Quantitative analysis of matrix production and gene expression. (A) Sorting of
chondroprogenitor cells prior to chondrogenesis significantly increased the sGAG/DNA ratio to
approximately 20 ng/ng. (B-D) Expression of chondrogenic genes ACAN, SOX9, and COL2A1
was significantly increased with sorting. (E-F) Sorting significantly unregulated fibrocartilage
and bone matrix marker COL1A1, and hypertrophic cartilage marker COL10A1. Gene expression
in reference to undifferentiated hiPSCs with housekeeping gene TBP. * p < 0.05. ** p < 0.01.
*** p < 0.001. **** p < 0.0001. Data represented as mean ± SEM. n = 6-7 per group: 2
experimental replicates, 3-4 technical replicates (pellets).
2.4.8 Chondrogenic capacity was maintained through one passage of unsorted
and sorted chondroprogenitor cells
Pellets derived from passage 1 (p1) sorted cells exhibited the most robust and homogenous
safranin-O staining as compared to the pellets derived from sorted cells of later passages and to
the pellets derived from unsorted cells of a similar passage (Figure S2.7). Pellets derived from
p2-4 unsorted and sorted chondroprogenitor cells had comparable staining and cell morphology
with decreased chondrogenic capacity (Figure S2.7).
Page 71
52
2.5 Discussion
Using a COL2A1-GFP reporter line, we have identified a novel combination of surface markers
(i.e., PDGFR+/CD146+/CD166+/CD45-) depicting a unique progenitor population with robust
chondrogenic potential in hiPSC chondrogenesis. This finding was further confirmed by
significantly increased cartilaginous matrix production of the prospectively isolated cells with
these selected markers from a wildtype, non-edited hiPSC line. The results of scRNA-seq of
sorted cells revealed that cells positive for PDGFR, CD146, and CD166 exhibited enhanced
cell homogeneity with decreased neurogenic subpopulations. These findings support the
hypothesis that sorting of hiPSC-derived chondroprogenitor cells using surface markers can be
used to purify progenitor cells with enhanced chondrogenic potential, without the need for
genetic modification to improve hiPSC chondrogenesis (25, 26).
We previously reported that chondroprogenitor cells at the end of mesodermal lineage
differentiation had high expression of CD146 and CD166 (26). In the present study, we observed
that these markers were also co-expressed with COL2A1. CD146 and CD166, along with CD105,
have also been shown to be expressed in chondroprogenitors in articular cartilage (19-21). While
our chondroprogenitor cells did not co-express CD105 (ENG) with COL2A1, sorting did enrich
CD105 gene expression. Interestingly, it has been shown that CD105 itself may not indicate
chondrogenic potential (37). In addition, scRNA-seq showed that sorted cells exhibited increased
expression of ITGB1 (CD29) and ITGA5 (CD49e), which have been deemed necessary for
chondrogenic differentiation in progenitor cells and MSCs (18, 19, 38). Nevertheless, our
chondroprogenitor cells had somewhat different expression profiles than skeletal progenitor cells
identified previously in vivo (23, 24). Moderate expression of CD164, a surface marker of the
skeletal stem cell (23), was conserved between the unsorted and sorted chondroprogenitor cells
Page 72
53
while many other markers described were absent from both populations including
prechondrocyte markers BMPR1 and CD73 (NT5E) (24). Therefore, the chondroprogenitor
population described in this study is a distinct, unique subpopulation of iPSCs that possesses
robust chondrogenic potential.
Several factors may contribute to the differences in cell surface markers that have been.
identified as markers of chondrogenesis in these different cell types. First, in our study we used a
differentiation protocol which follows the paraxial mesodermal lineage of cartilage (26, 39).
Different types of cartilage follow various developmental pathways (e.g., paraxial mesoderm vs.
lateral plate mesoderm) and therefore the other studies could be investigating these lineages, thus
the cells would have different surface marker expression during differentiation (39-41). Another
explanation may be the time point along the developmental pathway in which the cells are being
investigated. Our surface marker profiles are based on the expression of COL2A1. While
COL2A1 is one of the most prominent matrix proteins in articular cartilage (4) and can indicate
chondrogenic potential and determination of a chondrogenic fate (42), COL2A1 is a relatively
late marker of chondrogenesis (43). Therefore, differences between the cell surface markers
identified in our study as compared to other previous work may reflect differences in the
prescribed differentiation pathway or the specific subpopulation identified.
In addition to the fact that COL2A1 expression is a later chondrogenic marker, COL2A1
expression was found throughout the entire unsorted population including neurogenic cells and
sorting significantly decreased its overall expression indicating that COL2A1+ cells were
heterogenous. This finding is consistent with studies showing that COL2A1 expression may be a
broader indicator for the initial lineage specification of a variety of tissues rather than a sole
marker for chondrogenesis during embryonic development (43-45). Indeed, it has been reported
Page 73
54
that COL2A1 is expressed in the floor plate of the central nervous system (46), which provides a
plausible explanation for our observation of COL2A1 expression in neurogenic cells. This may
also explain why there are many COL2A1 positive cells not expressing the selected surface
markers. CD146, CD166, and PDGFR may be specific to chondroprogenitors as opposed to
cells of other lineages also expressing collagen type II thus purifying the population as shown
with increased COL2A1 IHC labeling when compared to sorting for COL2A1 alone. Following
sorting for these markers, the size of the chondrogenic SOX9/COL2A1 population was increased
and, while the neural SOX2 populations were reduced, a SOX2/TTR population remained. In fact,
this population had high expression of CD47, an integrin-associated and modulating protein (33)
that could be used as an additional marker for sorting in future experiments to improve
homogeneity. The expression of nestin and several mesenchyme markers appeared to be
permissive in sorted cells, suggesting that PDGFR/CD146/CD166 triple-positive cells may still
have a similar signature as neural crest cells (47, 48) and might come primarily from
mesenchyme populations in unsorted cells. Nonetheless, despite the presence of 6 unique cell
clusters, including the SOX2/TTR population, sorted chondroprogenitor cells showed robust
chondrogenic capacity.
The sorted chondroprogenitors, which all express PDGFR, CD146, and CD166, were
found to be localized in the mesenchyme clusters of unsorted cells. Alignment of the unsorted
and sorted populations by CCA allowed us to compare similarities and differences between the
two groups. After alignment, the largest cell cluster expressed histone H4 (HIST1H4C). Histones
are primarily synthesized during the S-phase of the cell cycle to package the replicated DNA
(49), thus indicating the large portion of cells in both sorted and unsorted populations are
proliferative. Furthermore, there was a decrease in insulin-like growth factor binding protein-5
Page 74
55
(IGFBP5) expression in sorted cells among the IGFBP5/CO2A1 population compared to
unsorted. IGFBP5 plays a role in insulin-like growth factor-1 (IGF-1)-dependent chondrocyte
proliferation (50) and protects cartilage during OA-induced degeneration (51). This may imply
that sorted cells may be precursors not fully committed into chondrogenic linage in comparison
with unsorted cells. This could be further supported by the observation that sorted cells had
increased expression in neural crest and proliferation markers (i.e., SOX4 and TUBA1A,
respectively) (52). Indeed, for all populations identified in the sorted cells, we found that they
exhibited elevated expression in proliferative and mesenchymal genes, further suggesting that
sorted cells were primarily derived from mesenchyme populations in unsorted cells. Nonetheless,
subpopulations in sorted cells still expressed unique gene signatures as shown by the clustering.
This finding implies that chondrocytes may differentiate from mesenchyme cells with a variety
of transcriptomic profiles if given the correct signaling cues with appropriate timing.
Cartilaginous pellets derived from sorted chondroprogenitor cells showed a significant
increase in chondrogenic matrix production and gene expression along with the elimination of a
surrounding layer of non-chondrocyte-like cells. Despite the increase in COL1A1 gene
expression, COL1A1 protein, as indicated by IHC labeling, does not reflect its gene expression,
implying a potential possibility of post-transcriptional regulation of COL1A1 in protein
translation (53). This results also suggest that the matrix produced by the hiPSC-derived
chondrocytes is similar to hyaline cartilage instead of fibrocartilage which is rich in COL1A1
protein. Surprisingly, there was also a relatively small increase in IHC labeling of COL10A1, a
matrix protein often associated with hypertrophic chondrocytes (54, 55). Interestingly, COL6A1
was observed to be more localized around the cells in pellets derived from sorted cells. In
developing neonatal cartilage, COL6A1 is found throughout the matrix, but with maturity it is
Page 75
56
only found in the pericellular matrix surrounding the chondrocytes (56-58). The increased
expression in COL10A1 at both mRNA and protein levels alongside the co-localization of
COL6A1 around chondrocytes suggests that the chondrocytes derived from the sorted cells were
at more mature stages as compared to the chondrocytes derived from unsorted cells after 28 days
of chondrogenic culture. With maturity and COL10A1 secretion, there is a possibility that these
cells may further differentiate into hypertrophic chondrocytes and undergo endochondral
ossification. Future studies could be done to investigate the differentiation trajectory with more
time in culture and in vivo.
As cell sorting can significantly reduce the number of functional cells (59), we also
examined the effects of cell expansion on differentiation potential of the sorted cells prior to
chondrogenesis. Cells in the first passage following sorting exhibit high chondrogenic potential
and sGAG staining in pellet culture. However, in subsequent passages, cells showed signs of
dedifferentiation and loss of chondrogenic capacity, similar to that observed in primary
chondrocytes (60) as well as similarly sorted mouse iPSCs (25). The decreased chondrogenic
potential of sorted cells may result from telomere erosion (61), plating density (e.g., cell-cell and
cell-matrix interactions) (60, 62-64), mechanobiological factors (e.g., plate stiffness and/or
coating) (65, 66), or culture medium (e.g., low vs. high glucose, growth factors) (62, 65). While
we used an expansion media similar to MSC expansion media due to similarities of the cells, in
the future, the media could be altered by changing the glucose level (64) and/or adding growth
factors such as fibroblastic growth factor (FGF)-2 and FGF-4, bone morphogenic protein (BMP)-
2 and BMP-3, transforming growth factor beta (TGF)-3, heparin-binding epidermal growth
factor (EGF), and platelet derived growth factor (PDGF)- (62, 65, 67) as these have been
shown to maintain and improve multipotency and chondrogenic capacity.
Page 76
57
2.6 Supplemental Figures
Page 77
58
Figure S2.1 GO enrichment analysis of unsorted and sorted cells. Related to Figure 2 and 3. (A)
Top 10 GO terms (biological process) that were associated with each population in unsorted
cells. (B) CD47 was highly expressed in SOX2/TTR+ cells. (C) Top 10 GO terms (biological
process) that were associated with each population in sorted cells.
Figure S2.2 Overall gene expression of sorted and unsorted chondroprogenitors. Related to
Figure 2 and 3. RT-qPCR reveals differences between sorted and unsorted chondroprogenitor
cells in overall expression of (A) neurogenic, (B) mesenchymal, and (C) chondrogenic genes.
Gene expression in reference to undifferentiated hiPSCs with housekeeping gene TBP. * p <
0.05. *** p < 0.001. Data represented as mean ± SEM. n = 4 samples/group.
Page 78
59
Figure S2.3 Expression profiles of pro-chondrogenic genes in sorted and unsorted
chondroprogenitor cells. Related to Figure 2 and 3. scRNA-seq reveals that sorted and unsorted
cells had distinct gene expression patterns of several markers that were proposed to be pro-
chondrogenic identified by previous studies.
Figure S2.4 Histology for matrix proteins. Related to Figure 5. Safranin-O staining for sGAG
showing pellets derived from sorted chondroprogenitor cells had more robust staining and
homogenous cell morphology compared to pellets derived from unsorted cells in two individual
experimental replicates. Scale bar = 200 µm. Inset scale bar = 400 µm.
Page 79
60
Figure S2.5 IHC labeling for COL6A1. Related to Figure 5. There was more distributed labeling
for COL6A1 in unsorted chondroprogenitor pellets compared to the localization around cells in
sorted chondroprogenitor pellets. Scale bar = 200 µm. Inset scale bar = 400 µm.
Figure S2.6 Alternative analysis of gene expression. Related to Figure 6. Expression of
chondrogenic genes ACAN, SOX9, and COL2A1, fibrocartilage and bone matrix marker
COL1A1, and hypertrophic cartilage marker COL10A1 was significantly increased with sorting.
CT value of gene of interest was normalized to CT value of housekeeping gene TBP for each
sample. ** p < 0.01. *** p < 0.001. **** p < 0.0001. Data represented as mean ± SEM. n = 6-7
per group: 2 experimental replicates, 3-4 technical replicates (pellets).
Page 80
61
Figure S2.7. Histology of pellets derived from in vitro expanded unsorted and sorted
chondroprogenitors. Chondrogenic capacity was maintained after one passage of both unsorted
and sorted chondroprogenitor cells as shown by staining for sGAG. There was more robust
staining in pellets derived from sorted cells. Safranin-O staining for sGAG showed similar loss
of chondrogenic capacity for both unsorted and sorted chondroprogenitor cells through four
passages.
2.7 Conclusion
Page 81
62
In conclusion, we have identified a unique chondroprogenitor population from hiPSCs which
expresses PDGFR, CD146, and CD166 and has strong chondrogenic potential. While the
population does share some characteristics with previously defined chondroprogenitors and
traditionally defined MSCs, it has a distinct profile. The methods and findings in this study will
contribute to future cartilage tissue engineering and disease modeling studies to improve
understanding and treatment of diseases such as osteoarthritis.
2.8 References
1. J. M. Mansour, in Kinesiology: The Mechanics and Pathomechanics of Human Movement.
(2003), vol. 2e, chap. 5, pp. 66-75.
2. F. Guilak, Biomechanical factors in osteoarthritis. Best Pract Res Clin Rheumatol 25, 815-
823 (2011).
3. Z. Lin, C. Willers, J. Xu, M. H. Zheng, The chondrocyte: biology and clinical application.
Tissue Eng 12, 1971-1984 (2006).
4. A. J. Sophia Fox, A. Bedi, S. A. Rodeo, The basic science of articular cartilage: structure,
composition, and function. Sports Health 1, 461-468 (2009).
5. F. Berenbaum, T. M. Griffin, R. Liu-Bryan, Review: Metabolic Regulation of Inflammation
in Osteoarthritis. Arthritis Rheumatol 69, 9-21 (2017).
6. J. Lieberthal, N. Sambamurthy, C. R. Scanzello, Inflammation in joint injury and post-
traumatic osteoarthritis. Osteoarthritis Cartilage 23, 1825-1834 (2015).
7. K. Musunuru, Genome editing of human pluripotent stem cells to generate human cellular
disease models. Dis Model Mech 6, 896-904 (2013).
8. K. Takahashi et al., Induction of pluripotent stem cells from adult human fibroblasts by
defined factors. Cell 131, 861-872 (2007).
9. S. Yumlu et al., Gene editing and clonal isolation of human induced pluripotent stem cells
using CRISPR/Cas9. Methods 121-122, 29-44 (2017).
10. H. Nejadnik et al., Improved approach for chondrogenic differentiation of human induced
pluripotent stem cells. Stem Cell Rev Rep 11, 242-253 (2015).
11. A. Yamashita et al., Generation of scaffoldless hyaline cartilaginous tissue from human
iPSCs. Stem Cell Reports 4, 404-418 (2015).
12. J. Lee et al., Early induction of a prechondrogenic population allows efficient generation of
stable chondrocytes from human induced pluripotent stem cells. FASEB J 29, 3399-3410
(2015).
13. W. M. Suchorska, E. Augustyniak, M. Richter, T. Trzeciak, Comparison of Four Protocols to
Page 82
63
Generate Chondrocyte-Like Cells from Human Induced Pluripotent Stem Cells (hiPSCs).
Stem Cell Rev Rep 13, 299-308 (2017).
14. Q. Lian et al., Functional mesenchymal stem cells derived from human induced pluripotent
stem cells attenuate limb ischemia in mice. Circulation 121, 1113-1123 (2010).
15. A. M. Craft et al., Generation of articular chondrocytes from human pluripotent stem cells.
Nat Biotechnol 33, 638-645 (2015).
16. Y. Yoshida, S. Yamanaka, Recent stem cell advances: induced pluripotent stem cells for
disease modeling and stem cell-based regeneration. Circulation 122, 80-87 (2010).
17. P. Cahan, G. Q. Daley, Origins and implications of pluripotent stem cell variability and
heterogeneity. Nat Rev Mol Cell Biol 14, 357-368 (2013).
18. R. Williams et al., Identification and clonal characterisation of a progenitor cell sub-
population in normal human articular cartilage. PLoS One 5, e13246 (2010).
19. E. Vinod, P. Boopalan, S. Sathishkumar, Reserve or Resident Progenitors in Cartilage?
Comparative Analysis of Chondrocytes versus Chondroprogenitors and Their Role in
Cartilage Repair. Cartilage 9, 171-182 (2018).
20. X. Su et al., CD146 as a new marker for an increased chondroprogenitor cell sub-population
in the later stages of osteoarthritis. J Orthop Res 33, 84-91 (2015).
21. S. Alsalameh, R. Amin, T. Gemba, M. Lotz, Identification of mesenchymal progenitor cells
in normal and osteoarthritic human articular cartilage. Arthritis Rheum 50, 1522-1532 (2004).
22. F. J. Lv, R. S. Tuan, K. M. Cheung, V. Y. Leung, Concise review: the surface markers and
identity of human mesenchymal stem cells. Stem Cells 32, 1408-1419 (2014).
23. C. K. F. Chan et al., Identification of the Human Skeletal Stem Cell. Cell 175, 43-56 e21
(2018).
24. L. Wu et al., Human developmental chondrogenesis as a basis for engineering chondrocytes
from pluripotent stem cells. Stem Cell Reports 1, 575-589 (2013).
25. B. O. Diekman et al., Cartilage tissue engineering using differentiated and purified induced
pluripotent stem cells. Proc Natl Acad Sci U S A 109, 19172-19177 (2012).
26. S. S. Adkar et al., Step-Wise Chondrogenesis of Human Induced Pluripotent Stem Cells and
Purification Via a Reporter Allele Generated by CRISPR-Cas9 Genome Editing. Stem Cells
37, 65-76 (2019).
27. J. Lee et al., Activation of innate immunity is required for efficient nuclear reprogramming.
Cell 151, 547-558 (2012).
28. A. Butler, P. Hoffman, P. Smibert, E. Papalexi, R. Satija, Integrating single-cell
transcriptomic data across different conditions, technologies, and species. Nat Biotechnol 36,
411-420 (2018).
29. L. van der Maaten, G. Hinton, Visualizing Data using t-SNE. Journal of Machine Learning
Research 9, 2579-2605 (2008).
30. D. W. Huang et al., The DAVID Gene Functional Classification Tool: a novel biological
module-centric algorithm to functionally analyze large gene lists. Genome Biol 8, R183
Page 83
64
(2007).
31. Z. Gu, R. Eils, M. Schlesner, Complex heatmaps reveal patterns and correlations in
multidimensional genomic data. Bioinformatics 32, 2847-2849 (2016).
32. K. J. Livak, T. D. Schmittgen, Analysis of relative gene expression data using real-time
quantitative PCR and the 2(-Delta Delta C(T)) Method. Methods 25, 402-408 (2001).
33. E. J. Brown, W. A. Frazier, Integrin-associated protein (CD47) and its ligands. Trends Cell
Biol 11, 130-135 (2001).
34. W. Zhang et al., Deer thymosin beta 10 functions as a novel factor for angiogenesis and
chondrogenesis during antler growth and regeneration. Stem Cell Res Ther 9, 166 (2018).
35. A. Molnar et al., Identification of differentially expressed genes in the developing antler of
red deer Cervus elaphus. Mol Genet Genomics 277, 237-248 (2007).
36. D. R. Clemmons, IGF binding proteins and their functions. Mol Reprod Dev 35, 368-374;
discussion 374-365 (1993).
37. M. A. Cleary et al., Expression of CD105 on expanded mesenchymal stem cells does not
predict their chondrogenic potential. Osteoarthritis Cartilage 24, 868-872 (2016).
38. C. Cicione, S. Diaz-Prado, E. Muinos-Lopez, T. Hermida-Gomez, F. J. Blanco, Molecular
profile and cellular characterization of human bone marrow mesenchymal stem cells: donor
influence on chondrogenesis. Differentiation 80, 155-165 (2010).
39. K. M. Loh et al., Mapping the Pairwise Choices Leading from Pluripotency to Human Bone,
Heart, and Other Mesoderm Cell Types. Cell 166, 451-467 (2016).
40. R. S. Decker, E. Koyama, M. Pacifici, Genesis and morphogenesis of limb synovial joints
and articular cartilage. Matrix Biol 39, 5-10 (2014).
41. M. E. Bronner, N. M. LeDouarin, Development and evolution of the neural crest: an
overview. Dev Biol 366, 2-9 (2012).
42. T. D. Grant et al., Col2-GFP reporter marks chondrocyte lineage and chondrogenesis during
mouse skeletal development. Dev Dyn 218, 394-400 (2000).
43. R. A. Kosher, M. Solursh, Widespread distribution of type II collagen during embryonic
chick development. Dev Biol 131, 558-566 (1989).
44. W. M. Kulyk, C. N. Coelho, R. A. Kosher, Type IX collagen gene expression during limb
cartilage differentiation. Matrix 11, 282-288 (1991).
45. H. D. Nah et al., In situ hybridization analysis of the expression of the type II collagen gene
in the developing chicken limb bud. Coll Relat Res 8, 277-294 (1988).
46. Y. L. Yan, K. Hatta, B. Riggleman, J. H. Postlethwait, Expression of a type II collagen gene
in the zebrafish embryonic axis. Dev Dyn 203, 363-376 (1995).
47. J. Isern et al., The neural crest is a source of mesenchymal stem cells with specialized
hematopoietic stem cell niche function. Elife 3, e03696 (2014).
48. C. Coste et al., Human bone marrow harbors cells with neural crest-associated characteristics
like human adipose and dermis tissues. PLoS One 12, e0177962 (2017).
Page 84
65
49. M. A. Osley, The regulation of histone synthesis in the cell cycle. Annu Rev Biochem 60,
827-861 (1991).
50. D. Kiepe et al., Intact IGF-binding protein-4 and -5 and their respective fragments isolated
from chronic renal failure serum differentially modulate IGF-I actions in cultured growth
plate chondrocytes. J Am Soc Nephrol 12, 2400-2410 (2001).
51. D. R. Clemmons et al., Inhibition of insulin-like growth factor binding protein 5 proteolysis
in articular cartilage and joint fluid results in enhanced concentrations of insulin-like growth
factor 1 and is associated with improved osteoarthritis. Arthritis Rheum 46, 694-703 (2002).
52. E. V. Sviderskaya et al., Functional neurons and melanocytes induced from immortal lines of
postnatal neural crest-like stem cells. FASEB J 23, 3179-3192 (2009).
53. R. I. Schwarz, Collagen I and the fibroblast: high protein expression requires a new paradigm
of post-transcriptional, feedback regulation. Biochem Biophys Rep 3, 38-44 (2015).
54. M. Pacifici et al., Hypertrophic chondrocytes. The terminal stage of differentiation in the
chondrogenic cell lineage? Ann N Y Acad Sci 599, 45-57 (1990).
55. H. M. Kronenberg, Developmental regulation of the growth plate. Nature 423, 332-336
(2003).
56. F. Guilak, R. J. Nims, A. Dicks, C. L. Wu, I. Meulenbelt, Osteoarthritis as a disease of the
cartilage pericellular matrix. Matrix Biol 71-72, 40-50 (2018).
57. E. H. Morrison, M. W. Ferguson, M. T. Bayliss, C. W. Archer, The development of articular
cartilage: I. The spatial and temporal patterns of collagen types. J Anat 189 ( Pt 1), 9-22
(1996).
58. A. F. Sherwin, D. H. Carter, C. A. Poole, J. A. Hoyland, S. Ayad, The distribution of type VI
collagen in the developing tissues of the bovine femoral head. Histochem J 31, 623-632
(1999).
59. C. W. t. Shields, C. D. Reyes, G. P. Lopez, Microfluidic cell sorting: a review of the
advances in the separation of cells from debulking to rare cell isolation. Lab Chip 15, 1230-
1249 (2015).
60. E. M. Darling, K. A. Athanasiou, Rapid phenotypic changes in passaged articular
chondrocyte subpopulations. J Orthop Res 23, 425-432 (2005).
61. I. M. Khan, J. C. Bishop, S. Gilbert, C. W. Archer, Clonal chondroprogenitors maintain
telomerase activity and Sox9 expression during extended monolayer culture and retain
chondrogenic potential. Osteoarthritis Cartilage 17, 518-528 (2009).
62. G. Schulze-Tanzil et al., Redifferentiation of dedifferentiated human chondrocytes in high-
density cultures. Cell Tissue Res 308, 371-379 (2002).
63. I. Ustunel et al., The immunohistochemical localization of notch receptors and ligands in
human articular cartilage, chondroprogenitor culture and ultrastructural characteristics of
these progenitor cells. Acta Histochem 110, 397-407 (2008).
64. Y. Jiang et al., Human Cartilage-Derived Progenitor Cells From Committed Chondrocytes
for Efficient Cartilage Repair and Regeneration. Stem Cells Transl Med 5, 733-744 (2016).
65. S. Kaitainen et al., TiO2 coating promotes human mesenchymal stem cell proliferation
Page 85
66
without the loss of their capacity for chondrogenic differentiation. Biofabrication 5, 025009
(2013).
66. Y. Chen et al., Morphology and adhesion of mesenchymal stem cells on PLLA, apatite and
apatite/collagen surfaces. J Mater Sci Mater Med 19, 2563-2567 (2008).
67. D. L. Coutu, J. Galipeau, Roles of FGF signaling in stem cell self-renewal, senescence and
aging. Aging (Albany NY) 3, 920-933 (2011).
Page 86
67
Chapter 3
Single Cell Transcriptomic Analysis of
Human Pluripotent Stem Cell
Chondrogenesis Partially adapted from: Wu CL*, Dicks A*, Steward N, Tang R, Katz DB, Choi YR, Guilak F.
Single cell transcriptomic analysis of human pluripotent stem cell chondrogenesis. Nature
Communications. 2021 Jan 13;12(1):362.
3.1 Abstract
The therapeutic application of human induced pluripotent stem cells (hiPSCs) for cartilage
regeneration is largely hindered by the low-yield of chondrocytes accompanied by unpredictable
and heterogeneous off-target differentiation of cells during chondrogenesis. Here, we combine
bulk RNA sequencing, single-cell RNA sequencing, and bioinformatic analyses, including
weighted gene co-expression analysis (WGCNA), to investigate the gene regulatory networks
regulating hiPSC differentiation under chondrogenic conditions. We identify specific Wnts and
MITF as hub genes governing the generation of off-target differentiation into neural cells and
melanocytes during hiPSC chondrogenesis. With heterocellular signaling models, we further
show that Wnt signaling produced by off-target cells are responsible for inducing chondrocyte
hypertrophy. By targeting Wnts and MITF, we eliminate these cell lineages, significantly
enhancing the yield and homogeneity of hiPSC-derived chondrocytes. Collectively, our findings
identify the trajectories and molecular mechanisms governing cell fate decision in hiPSC
chondrogenesis, as well as dynamic transcriptome profiles orchestrating chondrocyte
proliferation and differentiation.
Page 87
68
3.2 Introduction
Osteoarthritis (OA) is a debilitating joint disease characterized by cartilage degeneration as well
as pathologic remodeling of other joint tissues. Cartilage has limited intrinsic healing capacity,
motivating the application of stem cells for regenerative therapies. In this regard, the advent of
human induced pluripotent stem cells (hiPSCs) has served as a major breakthrough towards
cartilage regenerative therapies and in vitro disease modeling for OA drug discovery (1).
However, the development of protocols to consistently differentiate hiPSCs into chondrocytes
remains challenging. Early studies reported that chondrocytes can be generated from hiPSCs via
embryoid body formation followed by monolayer expansion of mesodermal cells and three-
dimensional cell pellet culture in chondrogenic induction medium (2, 3). Despite some success,
this approach was proven difficult to reproduce across different iPSC lines, potentially due to
variability in lots of fetal bovine serum generally used for cell expansion. Thus, recent strategies
have sought to use serum-free and chemically defined medium (4-6). By coupling inductive and
repressive signals required for mesoderm specification in embryonic development (7), we
established a step-wise hiPSC chondrogenic differentiation protocol that was validated with
multiple hiPSC lines and in several laboratories (8).
An important consideration in the differentiation process of hiPSCs is that they are
considered to be in a primed pluripotent state with increased genome-wide DNA methylation
compared to ground state naïve pluripotent cells, such as pre-implantation blastocysts (9).
Therefore, even directed differentiation of hiPSCs can lead to unpredictable formation of off-
target cell populations. However, the gene regulatory networks (GRNs) leading to on- or off-
target differentiation of hiPSCs, as well as the effect of the undesired cells on hiPSC
chondrogenesis (i.e., heterocellular signaling), remain to be elucidated, particularly at the single
Page 88
69
cell level.
Here, we apply bulk RNA sequencing (bulk RNA-seq) and single-cell RNA sequencing
(scRNA-seq) throughout the process of mesodermal and chondrogenic differentiation of hiPSCs
to map the dynamics of gene expression. By exploiting single cell transcriptomics, we confirm
the mesodermal and chondrogenic differentiation of hiPSCs in addition to identifying the GRNs
and critical hub genes regulating the generation of heterogenous off-target cells. We demonstrate
that homogeneity of hiPSC chondrogenesis can be significantly improved by inhibiting the
molecular targets Wnts and MITF. In summary, this study develops and validates an enhanced
hiPSC chondrogenic differentiation protocol.
3.3 Methods
3.3.1 hiPSC lines and culture
Three distinct hiPSC lines were used in the current study: STAN, ATCC, and BJFF. STAN line
was purchased from WiCell (#STAN061i-164-1), ATCC line was acquired from ATCC
(#ATCCACS-1019), and BJFF was obtained from the Genome Engineering and iPSC Core at
Washington University in Saint Louis. All three lines were reprogrammed by Sendai virus from
human foreskin fibroblasts and confirmed to be karyotypically normal and mycoplasma free.
STAN and BJFF hiPSCs were maintained on vitronectin coated 6-well plates (Thermo Fisher
Scientific, #A31804) in Essential 8 Flex medium (Thermo Fisher Scientific, #A2858501). ATCC
hiPSCs were cultured on CellMatrix Basement Membrane Gel coated 6-well plates (ATCC,
#ACS3035) in Pluripotent Stem Cell SFM XF/FF medium (ATCC, #ACS3002). Cells were fed
daily, and passaged with ReLeSR (STEMCELL Technologies, #05872). All hiPSC lines were
maintained below passage 30. Information regarding the cell lines can be found in Table 3.1.
Page 89
70
3.3.2 hMSCs and culture
Discarded and deidentified waste tissue from the iliac crests of adult bone marrow transplant
donors were collected in accordance with the institutional review board of Washington
University in Saint Louis. Human bone marrow-derived MSCs (hMSCs) were isolated by their
physical adherence to plastic culture vessels. (10) Cells were expanded and maintained in
expansion medium consisting of DMEM-low glucose (Thermo Fisher Scientific, #11885092),
1% penicillin/streptomycin (P/S, Thermo Fisher Scientific, #15140-122), 10% lot-selected fetal
bovine serum (FBS; Atlanta Biologicals, #S11550), and 1 ng ml-1 basic fibroblast growth factor
(R&D Systems, #233-FB). Three individual donors were used as biologic replicates in
subsequent experiments (Table 3.1).
Table 3.1 Subject details.
Donor ID Study ID Cell type GenoType Age, Sex
PHBI-BA-060 STAN iPSC wt/wt 1 yr, M
SCRC-1041 ATCC iPSC wt/wt Newborn, M
BJFF.6 BJFF iPSC wt/wt Newborn, M
hMSC3 Donor 1 MSC wt/wt 51, F
hMSC4 Donor 2 MSC wt/wt 38, M
hMSC6 Donor 3 MSC wt/wt 26, F
3.3.3 Mesodermal differentiation
hiPSCs were induced into mesodermal differentiation in monolayer at 40% confluency (7). Each
day, cells were rinsed with wash medium consisting of 50% IMDM GlutaMAX (IMDM, Fisher
Scientific, #31980097) and 50% Ham’s F12 Nutrient Mix (F12, Fisher Scientific, #31765092) to
remove previous medium. hiPSCs were then fed daily to sequentially drive mesodermal
differentiation similar to those identified in embryonic development with various sets of growth
Page 90
71
factors and small molecules supplemented in mesodermal differentiation medium consisting of
IMDM and F12 with 1% chemically defined lipid concentrate (Gibco), 1% insulin/human
transferrin/selenous acid (ITS+, Corning, #354352), 1% P/S (Thermo Fisher Scientific, #15140-
122), and 450 μM 1-thioglycerol (Sigma–Aldrich, #M6145). Cells were induced to the anterior
primitive streak with 30 ng ml-1 of Activin A (R&D Systems, #338-AC), 4 µM CHIR99021
(Stemgent, #04-0004), and 20 ng ml-1 human fibroblast growth factor (FGF; R&D Systems, #233-
FB-025/CF) for 24 hours. On the second day, cells were driven to paraxial mesoderm with 2 µM
SB-505124 (Tocris, #3263), 3 µM CHIR99021, 20 ng ml-1 FGF, and 4 µM dorsomorphin
(Stemgent, #04-0024). Then, cells were treated with 2 µM SB5, 4 µM DM, 1 µM Wnt-C59 (C59;
Cellagent Technology, #C7641-2s), and 500 nM PD173074 (Tocris, #3044) to become early
somite on the third day. For the fourth through sixth days, cells were driven to the sclerotome with
daily feedings of 2 µM purmorphamine (Stemgent, #04-0009) and 1 µM C59. Finally, for six days,
cells were driven to the chondroprogenitor stage (Cp) with 20 ng ml-1 of human bone
morphogenetic protein 4 (BMP4; R&D Systems, #314-BP-010/CF) daily (Figure S3.1A).
At each stage, some cells were dissociated using TrypLE (Gibco, #12604013) at 37ºC for
3 mins followed by adding an equal part of neutralizing medium consisting of DMEM/F-12,
GlutaMAXTM (DMEM/F12; Thermo Fisher Scientific, #10565042) with 10% FBS (Atlanta
Biologicals) and 1% P/S. The dissociated cells were either used for bulk RNA-seq, scRNA-seq,
chondrogenic differentiation, or fluorescence-activated cell sorting (FACS) as appropriate.
3.3.4 Chondrogenic differentiation
Cells dissociated at Cp stage were re-suspended at 5 x 10⁵ cells per mL in chondrogenic medium
consisting of DMEM/F-12, 1% FBS, 1% ITS+, 55 µM -mertcaptoethanol, 100 nM
dexamethasone (DEX; Sigma-Aldrich, #D4902), 1% NEAA (Gibco, #11140050), 1% P/S, 10 ng
Page 91
72
ml-1 human transforming growth factor beta 3 (TGF-3; R&D Systems, #243-B3-010), 50 μg ml-
1 L-ascorbic acid 2-phosphate (ascorbate; Sigma-Aldrich, #A8960), and 40 μg ml-1 L-Proline
(proline; Sigma-Aldrich, #P5607). Cells were then centrifuged for 5 min at 300x g to form a
pellet. Chondrogenic pellets were cultured at 37ºC for up to 42 days.
On the day of collection for bulk RNA-seq experiments, 3-4 pellets per experimental
group were pooled together and washed once with PBS, snap frozen in 300 µl of Buffer RL
(Norgen Biotek), and stored at -80ºC until processing for RNA extraction. At harvesting time
points for scRNA-seq experiments, 6-8 pellets per experimental group were pooled and digested
with 0.04% type 2 collagenase solution in DMEM/F12 for 1hr. Cells were washed once with
PBS, re-suspended in standard freezing medium, and stored in liquid nitrogen until needed.
3.3.5 C59 and ML329 treatment for Wnt and MITF inhibition
For C59 treatment for Wnt inhibition during chondrogenesis, pellets were treated with either 10
ng ml-1 TGF-3 (control group) or a combination of 10 ng ml-1 TGF-3 and 1 M C59 in
chondrogenic medium from d0 to d42 as appropriate. For C59 and ML329 treatment (ML, Axon
Medchem, HY-101464) for Wnt and MITF inhibition during chondrogenesis, pellets were
treated with either 10 ng ml-1 TGF-3 (control group), a combination of 10 ng ml-1 TGF-3 and
1 M ML, a combination of 10 ng ml-1 TGF-3 and 1 M C59, or a combination of 10 ng ml-1
TGF-3, 1 M ML and 1 M C59 in chondrogenic medium from d0 to d42 as appropriate.
3.3.6 Wnt ligands treatment during chondrogenesis
For Wnt ligands treatment during chondrogenesis, pellets were treated with either 10 ng/ml TGF-
3 (control group) or a combination of 10 ng ml-1 TGF-3 and 100 ng ml-1 individual Wnt ligand
(Wnt2B, Wnt3A, Wnt4, Wnt5B, or Wnt7B, all from R&D system) in chondrogenic medium
from d0 to d42 as appropriate. For Wnt ligands treatment during the Cp stage, cells were
Page 92
73
supplemented with either 20 ng ml-1 BMP4 (R&D Systems, #314-BP-010) alone (control group),
a combination of 20 ng ml-1 BMP4 and 1 M C59, or a combination of 20 ng ml-1 BMP4 and
100 ng ml-1 Wnt3A (R&D Systems, #5036-WN-010) in mesodermal differentiation medium
from d7 to d12.
3.3.7 Animal experiments
All animal procedures were approved by Institutional Animal Care and Use Committee (IACUC)
at Washington University in Saint Louis. Male NSG mice (NOD.Cg-Prkdcscid Il2rgtm1Wjl/SzJ,
#005557, Jackson laboratory) at age of 18-20 weeks-old were used for human xenograft
implantation in the in the dorsal region (subcutaneous) or in osteochondral defects in the knee
joints of mice. Mice were housed under a 12hr light/12hr dark cycle with ambient temperature
and humidity. NSG mice were anesthetized with 3% isoflurane in oxygen for all surgical
procedures. For subcutaneous implantation, the skin was shaved and sterilized over the
implantation site using standard sterile techniques. A mid-scapular incision was made, and a
hemostat was inserted into the skin incision to create a pocket for implantation. A d14 hiPSC
chondrogenic pellet was then inserted into the pockets. The incision of the skin was closed with
8-0 suture with taper point (PolysorbTM, Covidien, #L-2800). Tissue adhesive was applied to
the skin wound area. For implantation in osteochondral defects in the knee, a 3 mm long medial
parapatellar incision was made in the left hindlimb, and the knee joint was exposed via lateral
dislocation of the patella. An osteochondral defect (1 mm in diameter and 1 mm in depth) in the
trochlear groove of femur was created by a 1 mm micro bone drill (Roboz, #RS-6300A). All
debris were removed by sterile PBS washes. Mild hemorrhage from the fat pad was controlled by
epinephrine 1:1000 (International Medication Systems, #491590) followed by sterile PBS wash.
A d14 hiPSC chondrogenic pellet was implanted into the defect, and the patella was re-
Page 93
74
positioned to its original anatomical location. Mice with osteochondral defects that did not
receive pellet implantation were used as control group. After implantation, the subcutaneous
layer and skin were closed with 8-0 suture with taper point followed by the application of tissue
adhesive to the skin wound area. After surgery, the mice were allowed to move freely within
their cages. After 14- and 28-days post-implantation, mice were sacrificed for pellet harvest for
histological analysis.
3.3.8 RNA isolation, library preparation, and bulk RNA-seq
To determine transcriptome profiles over the course of differentiation, three hiPSCs lines
(ATCC, BJFF, and STAN) as biological replicates at various differentiation stages (6
mesodermal and 5 chondrogenic stages per cell line; i.e., total 33 samples) were collected for
bulk RNA-seq. Cell samples were thawed on ice, and pellet samples were homogenized with
zirconia beads (BioSpec Products, # 11079110zx) and a miniature bead beater. RNA was then
isolated from all samples using the Total RNA Purification Kit according to the manufacture’s
protocol (Norgen Biotek, #37500). RNA was eluted in 20 l of diethylpyrocarbonate-treated
water. The quality and quantity of RNA from each sample was evaluated by RNA Analysis
ScreenTape (Agilent, #5067-5576) on bioanalyzer (Agilent 4200 Tapestation). Only samples
with a RIN value larger than 0.8 were submitted to the Genome Technology Access Center
(GTAC sequencing core) at Washington University in St. Louis for library preparation and bulk
RNA-seq. Libraries were prepared using TruSeq Stranded Total RNA with Ribo-Zero Gold kit
(Illumina). Sequencing was performed on a HiSeq2500 instrument (Illumina) (1 x 50 bp reads)
with a sequencing depth of 30 million reads per sample.
3.3.9 Preprocessing of bulk RNA-seq data
Reads were processed using an in-house pipeline and open-source R packages as previously
Page 94
75
described (11). Raw reads were first trimmed using Cutadapt to remove low quality bases and
reads (12). After trimming, processed reads were aligned to the human reference genome
GRCh38 (version 90) by STAR (13), and the number of aligned reads to each annotated genes or
transcripts (GENCODE v21) was performed using featureCounts from the Subread package
(v1.4.6) (14).
3.3.10 DEGs and GO enrichment analysis and of bulk RAN-seq data
After quality control, un-normalized gene counts were read into DESeq2 R package by
DESeqDataSetFromMatrix function as instructed by the package tutorial (15). Genes that were
expressed by less than 10 cells were then removed. Next, we used DESeq and results functions
which implement Wald test in DESeq2 to determine the differentially expressed genes (DEGs)
between two consecutive differentiation stages. In this process, the estimation of size factors
(i.e., controlling for differences in the sequencing depth of the samples), the estimation of
dispersion values for each gene, and fitting a generalized linear model were performed. The
Gene counts were also averaged from three hiPSC lines. Top 20 DEGs between two consecutive
stages were selected and visualized using ComplexHeatmap R package. To observe the temporal
expression of a given gene for each hiPSC line, the count matrix was regularized-logarithm
transformed via rlog function first, and we used plotCounts function in DESeq2 to visualize the
expression pattern of the gene. Furthermore, regularized-logarithm transformed counts were also
used for principle component analysis (PCA) and PCA plots were visualized by ggplot function
in ggplot2 R package (16).
We next performed gene ontology (GO) enrichment analysis of the genes in mesodermal
and chondrogenic stages using GAGE R package (Generally Applicable Gene-set/Pathway
Analysis), whose algorism evaluates the coordinated up- or down-differential expression over
Page 95
76
gene sets defined by GO terms (17). Significantly upregulated GO terms with their associated p
values in biological process, molecular function, and cellular component were plotted by
GraphPad Prism (version 8.0; GraphPad Software). Furthermore, GAGE analysis also reveals
that 134 out of 205 genes defined by GO term cartilage development (GO:0051216) were
significantly increased during our differentiation process. Thus, a heatmap was generated to
investigate the expression levels of these genes at various stages using ComplexHeatmap R
package (18).
3.3.11 10X chromium platform scRNA-seq
Cells were thawed at 37ºC and resuspended in PBS + 0.04% BSA at concentration of 2,000 cells
per l. Cell suspensions were submitted to the GTAC sequencing core at Washington University
in St. Louis for library preparation and sequencing. In brief, 10,000 cells per sample were loaded
on a Chromium Controller (10x Genomics) for single capture. Libraries were prepared using
Single Cell 3′ Library & Gel Bead Kit v2 (#120237 10x Genomics) following manufacture’s
instruction. A single cell emulsion (Gel Bead-In-EMulsions, GEMs) is created by making
barcoded cDNA unique to each individual emulsion. Recovery agent was added to break GEM
and cDNA was then amplified. A library is produced via end repair, dA-tailing, adaptor ligation,
post-ligation cleanup with SPRIselect, and sample index PCR. The quality and concentration of
the amplified cDNA was evaluated by Bioanalyzer (Agilent 2100) on a High Sensitivity DNA
chip (Agilent, #5065-4401). Only cDNA with average library size 260-620 bp were used for
sequencing. Sequencing was performed by Illumina HiSeq2500 with the following read length:
26 bp for Read1, 8 bp for i7 Index, and 98 bp for Read2. We generally acquired ~180 million
reads per library (sample). A species mixing experiment (mouse adipose stem cells and human
iPSCs, 1:1 mixture) was also performed prior to running on actual sample to ensure good quality
Page 96
77
of single cell capture (i.e., cell doublet rate < 5%).
3.3.12 Preprocessing of scRNA-seq data
Paired-end sequencing reads were processed by Cell Ranger (10x Genomics software, version
2.0.0). Reads were aligned to the GRCh38 (version 90) for genome annotation, demultiplexing,
barcode filtering, and gene quantification. Cell Ranger also removes any barcode that has less
than 10% of the 99th percentile of total unique molecular identifiers (UMI) counts per barcode as
these barcodes are associated with empty droplets. After this quality control, gene barcode
matrices for each sample were generated by counting the number of UMIs for a given gene (as
row) in individual cell (as column). For each sample, ~2,200-2,500 cells were captured.
3.3.13 Unsupervised clustering analysis and annotation
To assess the difference in composition of cell populations, we performed global unsupervised
clustering analysis scRNA-seq datasets. First, gene barcode matrices were input into Seurat R
package (version 2.4) (19). We then removed the low-quality cells with less than 200 or more
than 7,000 detected genes, or if their mitochondrial gene content was more than 5%. Note that
the cutoff criteria were adjusted in few cases due to the sequencing depth and the variations in
mitochondrial gene content from datasets. Genes that were detected in less than 3 cells were
filtered out. After filtering out low-quality cells or cell doublets, the gene expression was then
natural log transformed and normalized for scaling the sequencing depth to 10,000 molecules per
cell. Next, to reduce the variance introduced by unwanted sources, we regressed out variation in
gene expression driven by cell cycle stages and mitochondrial gene expression with
vars.to.regress argument in function ScaleData in Seurat. We then used FindVariableGenes
function in Seurat to identify highly variable genes across cells for downstream analysis. These
steps resulted in (1) total 8,547 cells with average 1,882 highly variable genes from stages of
Page 97
78
hiPSCs, Scl, and CP, (2) total 10,648 cells with average 2,061 highly variable genes from stages
of TGF-3-treated pellets (d1, d3, d7, d14, d28, and d42), and (3) total 7,997 cells with average
1,886 highly variable genes from TGF-3+C59-treated pellets (d7, d14, d28, and d42) for
downstream analysis. Detailed cells numbers passed quality control steps for each stage are listed
in Table S3.1. Dimensionality reduction on the data was then performed by computing the
significant principal components on highly variable genes. We then performed unsupervised
clustering by using FindClusters function in Seurat with the resolution argument set to 0.6 and
clusters were then visualized in tSNE plot (20).
DEGs among each cell cluster were determined using FindAllMarkers function in Seurat.
DEGs expressed in at least 25% cells within the cluster and with a fold change of more than 0.25
in log scale were considered marker genes of the cluster. To determine the biology functions of
the marker genes from a given cluster, we performed Gene Ontology (GO) enrichment analysis
by using The DAVID Gene Functional Classification Tool (http://david.abcc.ncifcrf.gov; version
6.8) (21). By comparing these unique biological GO terms with existing RNA-seq datasets and
the literature, we were able to annotate cell clusters. Additionally, the top 10 enriched GO terms
from biological function category with associated p values were visualized GraphPad Prism
(version 8.0; GraphPad Software).
3.3.14 Cell cycle analysis of scRNA-seq data
CellCycleScoring function in Seurat was used to determine a cell cycle score on each cell
according to its gene expression of G2/M phase (54 genes) and S phase (43 genes) markers (22).
Based on this scoring system, fractions of each cell cluster with given cell cycle score in total
cell population were computed and plotted.
Page 98
79
3.3.15 CCA for integrated analysis of multiple scRNA-seq datasets
To compare cell types and to identify their associated DEGs between distinct experimental
conditions such as batch effect, C59 treatment, or differentiation stages (i.e., time points), we
applied canonical correlation analysis (CCA), a computational strategy implemented in Seurat
for integrated analysis of multiple datasets. First, the top 1,000 highly variable genes from each
dataset were selected. We then use RunCCA function or RunMultiCCA function (if more than 2
datasets) to identify common sources of variation resulting from experimental conditions and to
merge the multiple objects into a single dataset. We next determined the top principal
components of the CCA by examining a saturation in the relationship between the number of
principle components and the percentage of the variance explained using the MetageneBicorPlot
function. By using selected top principal components, we aligned the CCA subspaces with
AlignSubspace function, which returns a new dimensional reduction matrix allowing for
downstream clustering and DEG analyses. DEG analysis was performed on the cells from
different datasets but grouped in the same cluster (i.e., conserved cell types between two
conditions) after CCA alignment. The methods for cell clustering, identification of conserved
cell types and DEGs, as well as annotation of cell clusters were similar to the ones mentioned
previously. DEGs in each conserved cell types in response to differentiation stages or C59
treatment were visualized by ComplexHeatmap R package (18). In some cases, gene of interests
such as Wnts and various lineage markers were also visualized using the FeatureHeatmap and
DotPlot function in Seurat.
3.3.16 Pseudotemporal ordering and lineage trajectories
We used Monocle2 R package to reconstruct differentiation trajectories by computing and
ordering the sequence of gene expression changes of the cells collected from different time
Page 99
80
points in an unsupervised manner (23, 24). First, scRNA-seq datasets from different timepoints
underwent several quality control steps as mentioned previously. These multiple scRNA-seq
datasets were then merged into one single object using MergeSeurat function in Seurat. The
merged matrix was then converted into Monocle object using importCDS and newCellDataSet
functions in Monocle2. We then identified a set of DEGs between the cells collected at the
beginning of the process to those at the end using differentialGeneTest function with argument
qval < 0.01 in Monocle. The dimensions of the dataset were then reduced using first two
principal components with ‘DDRTree’ method. Next, we used orderCells function to order the
cells based on the selected DEGs and the trajectory of the cells was visualized by
plot_cell_trajectory function in Monocle. The temporal expression of the gene of interests was
visualized using the plot_genes_in_pseudotime function in Monocle. Additionally, to observe
dynamic changes in the expression levels of the genes that were branch dependent (i.e., along
with specific lineage), we used plot_genes_branched_heatmap function in Monocle to construct
a special type of heatmap in which genes that had similar lineage-dependent expression patterns
were clustered together.
3.3.17 WGCNA reconstruction of GRNs and hub genes
We used Weighted Gene Co-expression Network Analysis (WGCNA), an algorithm
implemented in WGCNA R package, to reconstruct GRNs and to identify their associated hub
genes that regulate cell differentiation (38). First, the dataset of interest (e.g., a given timepoint)
created in Seurat was converted into a plain matrix for a given gene (in column) in an individual
cell (in row). The dataset was then cleaned by removing cells with too many missing values
using goodSamplesGenes function in WGCNA. Next, we used pickSoftThreshold function in
WGCNA to determine the proper soft-thresholding power () that fits the criterion of
Page 100
81
approximate scale-free topology of the network, and an adjacency matrix was then built with
soft-thresholding power of 8 in our study. Hierarchical clustering and GRN were constructed by
using blockwiseModules function with arguments TOMType set to unsigned, networkType set to
signed, and mergeCutHeight set to 0.25 in WGCNA. Modules containing genes that were highly
associated with each other were identified in this process. Gene lists of interesting modules were
extracted and submitted to DAVID for GO term analysis to retrieve their biological process and
molecular functions. We then identified transcription factors (TFs) and TF regulators from the
genes based on the GO terms in molecular functions. We then selected top 100 genes that have
highest weight (i.e., high correlation coefficient) connected to a given TF or TF regulator.
Finally, the GRN based on these TFs and TF regulators then underwent cluster analysis using
community cluster (GLay) (25) and was then visualized using Cytoscape (26). Hub genes for
each GRN were identified as genes with high weight (summed correlation coefficients), high
degree (summed connectivity, i.e., total numbers genes connected to this specific gene), and high
betweenness centrality (BC) measure of the network. The hub gene of a given GRN were
visualized by ComplexHeatmap R package (18).
3.3.18 Multicellular signaling and ligand-receptor models
To investigate the ligand-receptor interaction in heterogenous multicellular signaling systems,
we used a list comprising of 2,557 human ligand–receptor pairs curated by Database of Ligand-
Receptor Partners (DLRP), IUPHAR, and Human Plasma Membrane Receptome (HPMR) (27,
28). We first quantified the percentage of the cells (i.e., neural cells, melanocytes, and
chondrocytes) that expressed a specific Wnt ligand and its associated frizzled (FZD) receptors
using scRNA-seq datasets. To ensure the ligand and receptors are uniquely expressed, we
required that their expression in fold change needs to more than 0.25 in log scale. We then used
Page 101
82
Circlize R package to visualize the directions of the signaling in the cell type based on
connections of ligand-receptor pairs (29).
3.3.19 RNA Fluorescence in situ hybridization (RNA-FISH)
To validate scRNA-seq findings and to visualize the spatial distribution of Wnts and COL2A1
within pellets, we performed RNA-FISH for Wnt3A, Wnt4, and COL2A1 expression. d28 pellets
with or without C59 treatment were harvested (n = 3 time point) and snap frozen in liquid
nitrogen. Pellets were cryo-sectioned at 10 m thick and fixed using 4% paraformaldehyde in
PBS on ice for 10 min. Sample pre-treatment and RNA probe hybridization, amplification, and
signal development were performed using the RNAscope Multiplex Fluorescent Reagent Kit v1
(Advanced Cell Diagnostics, #320850) following the manufacturer’s instruction. Samples were
imaged with multi-channel confocal microscopy (Zeiss LSM 880). Tiled images with Z-stacks
were taken at 20X magnification to capture the entire pellet. Maximum intensity projection, a
process in which brightest pixel (voxel) in each layer along Z direction is projected in the final
2D image, was performed using Zeiss Zen Blue (version 2.5).
3.3.20 Fluorescent activated cell sorting (FACS) for progenitors
Cells at the Cp stage with treatment of BMP4, a combination of BMP4 and Wnt3A, or a
combination of BMP4 and C59 were dissociated and resuspended in FACS Buffer (PBS-/- with
1% FBS and 1% penicillin/steptomycin/fungizone (P/S/F; Gibco) at approximately 40 x 106 cells
per ml. The cells were treated with Human Tru Stain FC XTM (BioLegend, #422302) for 10 min
at room temperature. Approximately 10,000 cells in 100 µl were used for each compensation.
Cells were labeled with appropriate antibodies including their associated isotype control (FITC-
CD45, #304006; PE/Cy7-CD146, #361008; PE-CD166, #343904, all from BioLegend). Cells
were incubated for 30 minutes at 4ºC and washed with FACS buffer twice. Samples were
Page 102
83
resuspended in sorting medium consisting of DMEM/F12 with 2% FBS, 2% P/S/F, 2% HEPES
(Gibco), and DAPI (BioLegend, #422801) at 4 x 10⁶ cells per ml and filtered through a 40 µm
cell strainer. Cells were stored on ice prior to sorting. Five µl of all antibodies were used per
million cells in 100 µl staining volume, 10 µl of Tru Stain FC XTM was used per million cells in
100 µl staining volume. DAPI was used at 3 µM. An Aria-II FACS machine was used to
compensate the color overlapping and to gate the samples. Data was analyzed using FlowJo
software (version 10.5.3).
3.3.21 Histology
Pellets were collected in 10% neutral buffered formalin for fixation for 24 hours. Pellets were
then transferred to 70% ethanol, dehydrated, and embedded in paraffin wax. Pellet blocks were
sectioned at 8 µm thickness and stained for proteoglycans and cell nuclei according to the
Safranin-O and hematoxylin standard protocol.
3.3.22 Immunohistochemistry
Histologic sections (8 m thick) of the pellets were rinsed with xylenes three times and
rehydrated before labeling. Antigen retrieval was performed with 0.02% proteinase K for 3 min
at 37ºC for COL2A1 and COL6A1 and with pepsin for 5 min at room temperature for COL1A1
and COL10A1 followed by peroxidase quench then serum blocking for 30 min at room
temperature. Samples were labeled for 1 hour with the primary antibody against COL1A1 (1:800
Abcam #90395), COL2A1 (1:10 Iowa #II-II6B3-s), COL6A1 (1:1000 Fitzgerald #70F-
CR009X), and COL10A1 (1:200 Sigma #C7974) and for 30 min with the secondary antibody
goat anti-mouse (1: 500, Abcam #97021) or goat anti-rabbit (1:500 Abcam #6720) as
appropriate. Histostain Plus Kit (Sigma, #858943) was then used for enzyme conjugation for 20
min at room temperature followed by AEC (ThermoFisher, #001111) for 2.5 min (COL2A1 and
Page 103
84
COL6A1) or 2 min (COL1A1 and COL10A1) at RT. Finally, samples were counterstained with
hematoxylin to reveal cell nuclei for 45 sec and mounted with Vector Hematoxylin QS (Vector
lab, #H3404). Images were taken by Olympus VS120 microscope (VS120-S6-W).
3.3.23 Biochemical analysis of cartilaginous matrix production
Pellets were rinsed with PBS after chondrogenic differentiation and digested at 65ºC overnight in
200 µl papain solution consisting of 125 μg ml-1 papain (Sigma, P4762), 100 mM sodium
phosphate, 5 mM EDTA, and 5 mM L-cysteine hydrochloride at 6.5 pH. Samples were stored at
-80ºC before thawing to measure double stranded DNA by Quant-iT PicoGreen dsDNA Assya
Kit (ThermoFisher, #P11496) and glycosaminoglycans (GAG) by the 1,9-dimethylmethylene
blue assay at 525 nm wavelength (30). GAG content, as calculated based on the standard curve,
was normalized to double stranded DNA content.
3.3.24 RT-qPCR
RNA of the pellets was isolated using the Total RNA Purification Kit according to the
manufacture’s protocol (Norgen Biotek, #37500). Reverse transcription of the RNA was
performed using SuperScript VILO Master Mix (Thermo Fisher, # 11755050). Fast SYBR Green
Master Mix (Thermo Fisher, # 4385614) was used for reverse transcription quantitative
polymerase chain reaction (RT-qPCR) according to manufacturer’s instructions on
the QuantStudio 3 (Thermo Fisher). Gene expression was analyzed using the CT method
relative to undifferentiated hiPSCs with the reference gene TATA-box-binding protein (TBP).
Sequences of primers are listed in Table 3.2.
Page 104
85
Table 3.2 qRT-PCR Primer Sequences. Primers are listed as 5’ to 3’.
3.3.25 Western blots
To examine the effect of C59 on Wnt inhibition in the pellets at protein levels, Western blot
analysis was performed on d28 pellets with or without C59 treatments. 6-8 pellets per
experimental group were pooled and digested with 0.04% type 2 collagenase solution in
DMEM/F12 for 1hr. Cells were washed once with PBS and lyzed in RIPA buffer (Cell Signaling
Technology, #9806S) with protease inhibitor (ThermoFisher, #87786) and phosphatase inhibitor
(Santa Cruz Biotechnology, #sc-45044). Protein concentration was measured using the BCA
Assay (Pierce). 10 μg of proteins for each well were separated on 10% SDS-PAGE gels with
prestained molecular weight markers (Bio-Rad, 161-0374). and transferred to a PVDF
Gene Forward Sequence Reverse Sequence
ACAN CACTTCTGAGTTCGTGGAGG ACTGGACTCAAAAAGCTGGG
COL1A1 TGTTCAGCTTTGTGGACCTC TTCTGTACGCAGGTGATTGG
COL2A1 GGCAATAGCAGGTTCACGTA CTCGATAACAGTCTTGCCCC
COL10A1 CATAAAAGGCCCACTACCCAAC ACCTTGCTCTCCTCTTACTGC
MITF AGTTGCTGGCGTAGCAAGAT AAAGTCAACCGCTGAAGAGC
PAX6 GAGTGCCCGTCCATCTTTG GTCTGCGCCCATCTGTTGCTTTTC
SOX2 TACAGCATGATGCAGGACCA CCGTTCATGTAGGTCTGCGA
SOX9 CGTCAACGGCTCCAGCAAGAACAA GCCGCTTCTCGCTCTCGTTCAGAAGT
TBP AACCACGGCACTGATTTTCA ACAGCTCCCCACCATATTCT
Wnt2B GTGTCCTGGCTGGTTCCTTA AGCTGGTGCAAAGGAAAGAA
Wnt3A CCTGCACTCCATCCAGCTACA GACCTCTCTTCCTACCTTTCCCTTA
Wnt4 GATGTGCGGGAGAGAAGCAA ATTCCACCCGCATGTGTGT
Wnt5B CTGCCTTTCCAGCGAGAATT AGGTCAAATGGCCCCCTTT
Wnt7B CCCCCTCCCTGGATCATGCACA GCCACCACGGATGACAGTGCT
Page 105
86
membrane. The PVDF membrane blots were incubated overnight at 4 °C with the following
primary antibodies: anti-Wnt2B (1:350, abcam, ab178418), anti-Wnt3A (1:1000, abcam,
ab81614), anti-Wnt4 (1:500, abcam, ab91226), anti-Wnt5B (1:500, abcam, ab93134), anti-
Wnt7B (1:2000, abcam, ab155313) and anti-GAPDH (1:30000, Proteintech 60004-1-Ig) for
loading control, respectively. Affinity purified horseradish peroxidase(HRP)-linked goat anti-
rabbit IgG secondary antibody (1:3000, Cell Signaling, #7074) or horse anti-mouse IgG
secondary antibody (1:3000, Cell Signaling, #7076) was added and incubated for 45 minutes at
room temperature. Immunoblots were imaged and analyzed using the iBright FL1000 Imaging
System (Thermo Fisher). After the Wnt proteins were imaged, the blots were then stripped by
incubating with restore plus Western blot stripping buffer (ThermoFisher Scientific) at room
temperature for 15 mins.
3.3.26 Statistical analysis
All data were presented as mean SEM. Analyses were performed using SPSS Statistics
(version 25), with significance reported at the 95% confidence level. In the current study, the
number of pellets per group or treatment condition are technical replicates, while number of the
mice per group are biological replicates.
3.3.27 Data availability
We acquired RNA-seq datasets of human primary chondrocytes from a previously published
study (NIH Gene Expression Omnibus (GEO) accession number GSE106292) (31), in which
embryonic hind limb bud chondrocytes (age: 6 weeks, n = 2 ), adolescent knee chondrocytes
(age: 17 weeks, n = 2), adult knee chondrocytes (age: 18-60 years, n = 2), and growth plate
chondrocytes (age: 14 weeks, 15 weeks, and 18 weeks, n = 1 per age). For the datasets obtained
from the previous mentioned study, gene expression counts were averaged if there were more
Page 106
87
than 2 samples with the same age. We also harvested chondrocytes from human costal cartilage
and performed bulk RNA-seq on these samples (age: ~70 years, n = 3). However, it was
challenging to collect rib cartilage from young healthy donors; thus, aged 70-year-old costal
cartilages were used. To compare the difference between the phenotypes of chondrocytes derived
from hiPSCs and hMSCs, we also used bulk RNA-seq datasets of hMSC chondrogenesis from
our recent study (GEO accession number GSE109503) (10). For the present study, our bulk
RNA-seq and scRNA-seq datasets are available on GEO accession number GSE 160787.
3.4 Results
3.4.1 Bulk RNA-seq indicates successful differentiation of hiPSCs
Previously, we reported a robust differentiation protocol that can drive hiPSCs toward a
chondrogenic lineage via the paraxial mesoderm (8) (Figure S3.1A-B). To determine
transcriptome profiles over the course of differentiation, 3 independent hiPSCs lines (ATCC,
BJFF, and STAN) were collected for bulk RNA-seq at various stages (Figure 3.1A). Principal
component analysis (PCA) reveals that the 3 hiPSC lines follow similar mesodermal and
chondrogenic differentiation trajectories (Figure 3.1B-C). Analysis of differentially expressed
genes (DEGs) between each stage revealed upregulation of stage-specific markers. For example,
T-box transcription factor T (TBXT) and mix paired-like homeobox (MIXL1) were upregulated at
the stage of anterior primitive streak (anterior PS) compared to hiPSCs (32) (Figure 3.1D; Table
3.2). Markers representing mesodermal derivatives including T-box 6 (TBX6), UNC homeobox
(UNCX), and paired box 9 (PAX9) were upregulated sequentially at the stages of paraxial
mesoderm, early somite, and sclerotome, respectively (Figure 3.1C).
Chondrogenic markers such as matrilin 4 (MATN4), aggrecan (ACAN), collagen type VI
alpha 3 chain (COL6A3), collagen type IX alpha 1 chain (COL9A1), and SRY-box 6 and 9
Page 107
88
(SOX6 and SOX9) were upregulated as early as at day 7 (d7), while the expression of collagen
type II alpha 1 chain (COL2A1) was increased at d21 (Figure 3.1E; Table S3.3). Interestingly,
microRNA 302a (MIR302A), reportedly down-regulated in osteoarthritic chondrocytes, had
enhanced expression in d28 pellets (33). Interestingly, neuronal differentiation 4 (NEUROD4), a
gene encoding a transcriptional activator essential for neuronal differentiation, had increased
expression in d14 pellets (34).
Page 109
90
Figure 3.1 DEGs of mesodermal and chondrogenic differentiation of 3 hiPSC lines by bulk
RNA-seq. (A) Schematic of chondrogenic differentiation protocol for hiPSCs. (B-C) PCA
indicates that 3 unique hiPSC lines followed similar differentiation trajectories. (D-E) DEGs
averaged from 3 unique hiPSC lines at each stage of differentiation, respectively. Each column
of the heatmap represents a comparison between two stages/timepoints, and each gene presented
was assigned a colored dot (following the gene label). The color of a dot matches the color of the
timepoint label at the left side of the heatmap. When the color of a gene label and a timepoint
label match, that gene was significantly upregulated at the corresponding time points and was
thus detected as a differentially expressed gene.
3.4.2 in vitro characterization of hiPSC-derived chondrocytes
While temporal expression of chondrogenic markers such as SOX9 and COL2A1 were
upregulated in unique hiPSC lines, both the hypertrophic chondrocyte marker collagen type X
alpha 1 chain (COL10A1) and osteogenic marker collagen type I alpha 1 chain (COL1A1)
exhibited increased expression over time (Figure 3.2A). It is important to note that COL1A1 is
also a marker for fibrous tissues, perichondrium, and many other cell types. The d28 pellet
matrix also demonstrated rich proteoglycan staining using Safranin-O (Saf-O) as well as intense
labeling for COL2A1 and COL6A1 by immunohistochemistry (IHC). However, little labeling
for COL10A1 and COL1A1 was observed despite increased gene expression of COL10A1 and
COL1A1 at later time points (Figure 3.2B). Gene ontology (GO) enrichment analysis of the
genes using R package GAGE was performed (17). Significantly upregulated GO terms in
Biological Process highlighted skeletal system and cartilage development (Figure S3.2A). GAGE
analysis also revealed that 134 out of the 205 genes defined by cartilage development
(GO:0051216) were significantly increased. Interestingly, in addition to upregulated SOX5, 6,
and 9, which are known to be master transcription factors (TFs) governing chondrogenesis, we
also observed several Wnts, including Wnt2B, had increased gene expression at different stages
during differentiation (Figure 3.2C).
To determine the phenotype of hiPSC-derived cartilage, we projected our bulk RNA-seq
data and publicly available sequencing datasets of primary chondrocytes from a variety of
Page 110
91
cartilaginous tissues and chondrocytes derived from mesenchymal stem cells (MSCs) in a PCA
plot (Figure 3.2D) (31). We found that hiPSC-derived chondrocytes demonstrated a similar
phenotype to embryonic limb bud chondrocytes.
3.4.3 in vivo characterization of hiPSC-derived chondrocytes
To determine whether hiPSC-derived chondrocytes could maintain their phenotype in vivo, we
implanted d14 pellets subcutaneously in the dorsal region of immunodeficient NSG (NOD.Cg-
Prkdcscid Il2rgtm1Wjl/SzJ) mice (Figure S3.2B). The d14 pellets represented the earliest time point
when a chondrocyte-like phenotype was observed in vitro. After 14 days of implantation, pellets
were harvested and found to retain a cartilage phenotype, with rich proteoglycan and COL2A1
labeling. No endochondral ossification was observed during this relatively short-term
implantation period in our study.
To test whether hiPSC-derived chondrocytes can retain their phenotype within the joint,
we created an osteochondral defect in the femoral groove of the mouse (Figure 3.2E). Due to the
small size of the mouse knee, the osteochondral defect model here also involves a growth plate
defect. The defect was either left empty as a non-repair control group or filled with a d14 pellet.
Defects left untreated did not exhibit any repair with hyaline cartilage, and only fibrotic tissue
was observed. However, defects with pellet implantation demonstrated enhanced repair of the
focal cartilage lesion, which was filled with cartilaginous matrix rich in Saf-O staining at both
14- and 28-days post-implantation. While this finding provides proof-of-concept of the
maintenance of the chondrogenic phenotype over 28 days, future studies may wish to investigate
cell fate and implant properties after long-term implantation.
Page 112
93
Figure 3.2 In vitro and in vivo characterization of hiPSC-derived chondrocytes (A) Temporal
gene expression of chondrogenic markers SOX9 and COL2A1, hypertrophic marker COL10A1,
and osteogenic marker COL1A1. (B) Pellets showed enriched Saf-O, COL2A1, and COL6A1
staining. Most COL1A1 staining (green arrow) was located at the edge of the pellets, while faint
COL10A1 (yellow arrowheads) was observed. Left column scale bar = 400 µm. Right column
scale bar = 200 µm. Inset scale bar = 50 µm. Experiment was repeated 3 times with similar
results. (C) Heatmap of 134 significantly upregulated genes identified in GO term cartilage
development (GO:0051216). Genes in red font are either TFs or transcription regulators. (D)
hiPSC-derived chondrocytes exhibit similar phenotype to embryonic limb bud chondrocytes. (E)
hiPSC-derived chondrocytes repaired osteochondral defects in the cartilage of mouse knee joints
and remained a chondrocyte phenotype 28-days post-implantation. n = 3 mice per group. Top
row scale bar = 500 µm. Bottom row scale bar = 100 µm.
3.4.4 scRNA-seq mapping of cellular heterogeneity
Although our protocol generates a predominantly chondrocyte-like population as shown by IHC
and bulk RNA-seq (Figure 3.2B), we often observed non-chondrocyte populations and
occasional focal accumulation of black pigmented regions on the surface of the pellets (Figure
S3.2C-D). These results suggest the presence of off-target differentiation, prompting us to seek
their cellular identities. To dissect this cellular heterogeneity, 8 samples from the STAN cell line
at different differentiation time points were collected for scRNA-seq (Figure 3.3A). Detailed cell
numbers passed quality control steps and median genes per cell for each stage are listed in Table
S3.1 (see Methods for quality control steps and criteria).
Sequencing of mixed species ensured a low cell multiplet rate (2.7%) (Figure S3.3A). To
verify reproducibility of the differentiation, two batches of d28 samples were collected from
independent experiments for scRNA-seq. Canonical correlation analysis (CCA) was used to
align cells from the 2 batches (19) (Figure S3.3B). The cells in the same cluster from different
batches exhibited high correlation in their gene expression (Spearman’s rank coefficient rs > 0.87
for all clusters) (Figure S3.3C). Furthermore, genes that were highly conserved in one particular
cluster (using cluster 0 as an example) showed similar expression patterns in the clusters from
distinct batches, suggesting that our differentiation is highly reproducible (Figure S3.3D).
Page 113
94
3.4.5 Lineage bifurcation in hiPSC differentiation trajectory
We used the Monocle2 R package to reconstruct the differentiation trajectory from the stage of
hiPSCs to d42 chondrocytes with a total of 19,195 cells that passed quality control (Figure 3.3B)
(23). While cells following chondrogenic fate expressed chondrocyte markers including ACAN,
COL2A1, SOX9, and cartilage oligomeric matrix protein (COMP), we found one major
branchpoint, diverting cell fate toward neural lineage with the expression of neural cell markers
such as nestin (NES), orthodenticle homeobox 2 (OTX2), SOX2, and Wnt3A (Figure 3.3C). Other
neural cell markers such as OTX1 and PAX6 were also enriched in this branch (Figure S3.3E).
The off-target cell differentiation toward neurogenic lineage confirmed our findings of increased
NEUROD4 in the bulk RNA-seq data.
To explore distinct cell populations at each stage, scRNA-seq data were subjected to
unsupervised clustering and visualized using t-distributed stochastic neighbor embedding (tSNE)
plots (Figure 3.3D). By comparing DEGs with signature genes of cell types in the literature and
GO term analyses, we annotated broad cell populations by combining clusters expressing similar
marker genes. For example, 2 of 7 clusters identified at the chondroprogenitor (Cp) stage not
only had high expression levels of SOX4 and SOX9, but were also enriched in several markers
resembling neural crest cells including PAX3 and forkhead box D3 (FOXD3) (Figure S3.3F)
(35). Therefore, these two clusters were assigned to a broad cell population referred to as neural
crest cells. Similarly, 4 clusters at the Cp stage exhibited markers of neural lineage including
SOX2, OTX1/2, and PAX6, and thus were annotated as neurogenic lineage cells, while PRRX1,
COL1A1, and COL3A1 are known markers for mesenchyme (Figure S3.3G) (36). Similar major
cell populations were also observed in d1 and d3 pellets, although it appeared that the percentage
of mesenchymal and neural cells increased in d1 and d3 while there was a decreased percentage
Page 114
95
of neural crest cells (Figure S3.3H-I).
Of note, a cluster with high expression of melanocyte inducing transcription factor
(MITF) was observed in d7 and d14 pellets. MITF is a master TF regulating development of
melanocytes, cells that produce melanin (i.e., pigment) (37). IHC of the pellets labeling for NES
and MITF further confirmed the presence of neural cells and melanocytes (Figure S3.3J),
suggesting that the focal black dots observed at the surface of pellets are likely to be the pigment
accumulation in melanocytes. Nevertheless, as distinct subtypes of hiPSC-derived chondrocytes
and off-target cells were defined primarily based on marker genes, the complete functionality of
these population require future investigation.
3.4.6 WGCNA identifies GRNs of neurogenesis and melanogenesis
Next, we aimed to improve hiPSC chondrogenesis by decreasing off-target differentiation. We
performed weighted gene co-expression network analysis (WGCNA) to reconstruct GRNs and
identify the hub genes that modulate neurogenesis and melanogenesis (38). scRNA-seq data of
d14 pellets (with a total of 2,148 cells and 3,784 genes) was used for this computation due to the
earliest presence of both chondrogenic and off-target populations detected. Five major gene
modules (each containing > 150 genes) were identified, and based on GO enrichment analyses,
they were categorized into: cell division, cilium movement and assembly, skeletal system
development, nervous system development, and melanin biosynthetic process. The genes in the
modules of nervous system development and melanin biosynthetic process were then used to
build corresponding GRNs and subnetworks by Cytoscape, while hub genes were determined by
degree (node connectivity), weight (association between two genes), and betweenness centrality
measure of the network (Figure 3.3E and Figure S3.4A-C) (39). In the GRN of neurogenesis,
Wnt4 was strongly associated with several TFs regulating neural differentiation. We also
Page 115
96
observed that Wnt2B was associated with both MITF and ETS variant 1 (ETV1), a gene whose
activity has been reported to positively regulate MITF (40).
Page 117
98
Figure 3.3 scRNA-seq and WGCNA reveal neural cells and melanocytes as off-target cells. (A)
scRNA-seq was performed at hiPSC, Sclerotome, Cp, and 6 chondrogenic pellet time points. (B)
Reconstruction of differentiation trajectory reveals an off-target lineage bifurcation toward
neural cells. A total of 19,195 cells that passed quality control from the stage of hiPSC to d42
chondrogenic pellet was used to reconstructed differentiation trajectory. (C) Chondrogenic
markers were enriched in the chondrogenic branch, while neurogenic markers were observed in
the branch of neurogenesis. (D) Annotated cell populations at different timepoints during hiPSC
chondrogenesis. Cells that passed quality are used for tSNE plots; Cp: 1,888 cells, d1: 2,216
cells, d7: 1,200 cells, d14: 2,148 cells, d28: 1,271 cells, and d42: 1,328 cells. (E) WGCNA and
GO term analysis identified Wnt4 as a hub gene of neurogenesis while Wnt2B was highly
associated with melanocyte development. scRNA-seq data of d14 pellets (with a total of 2,148
cells and 3,784 genes) was used for this computation.
3.4.7 Inhibition of Wnt signaling enhances hiPSC chondrogenesis
As Wnts were identified as essential genes in the off-target cells, we hypothesized that inhibition
of Wnt signaling may improve hiPSC chondrogenesis by decreasing undesired cell populations.
It is known that Wnts are required to properly specify somites from pluripotent cells (41).
Therefore, we administrated Wnt-C59 (C59), a Wnt inhibitor, at either the Cp stage and/or
during the chondrogenic pellet culture (i.e., 4 different inhibition regimens; Figure 3.4A).
Chondrocyte homogeneity, as indicated by Saf-O staining, was increased if Wnt signaling was
inhibited during pellet culture (Figure 3.4B). This finding was reflected by increased production
of glycosaminoglycans per cell (GAG/DNA ratio) in the group receiving C59 during the pellet
culture (Figure 3.4C). However, inhibiting Wnts at the Cp stage severely impaired
chondrogenesis. Mesenchymal cells that are positive for CD146 and CD166 are proposed to be
putative chondroprogenitors due to their robust chondrogenic potential (30). Flow cytometric
analysis showed that C59 treatment largely decreased the percentage of CD146/CD166+ cells,
while Wnt3A supplementation increased this population at the Cp stage (Figure 3.4D). Similar
results were observed using two additional hiPSC lines (ATCC and BJFF) (Figure S3.4D-G).
Interestingly, pellets derived from hMSCs with Wnt inhibition also exhibited increased Saf-O
staining (Figure S3.4H-I). Additionally, hiPSC pellets receiving combined administration of C59
Page 118
99
and ML329 (ML), an MITF antagonist, also exhibited enhanced chondrocyte homogeneity
compared to standard TGF-3 treatment (Figure S3.4G).
RNA fluorescence in situ hybridization (RNA-FISH) labeling of Wnts and COL2A1
within d28 pellets indicated that although some labeling could be detected in the center of the
pellets, most Wnts were in the perichondral layer, consistent to the inhomogeneous cell
populations observed via IHC staining. Furthermore, C59-treated pellets showed a more
homogenous distribution of COL2A1 RNA-FISH labeling versus TGF-3-treated pellets (Figure
3.4E and Figure S3.5).
Page 120
101
Figure 3.4 Wnt inhibition during pellet culture enhanced homogeneity of hiPSC chondrogenesis.
(A) Experimental scheme of Wnt inhibition. (B) C59 treatment during pellet culture enhanced
Saf-O staining and decreased off-target cells (yellow arrowheads) as compared to other Wnt
inhibition culture regiments. Top row scale bar = 400 µm. Bottom row scale bar = 200 µm.
Experiment was performed twice with similar results. (C) Pellets treated with C59 in pellet
culture only exhibited an increased GAG/DNA ratio compared to pellets treated with other
culture regiments. * p = 0.00001 at d28. # p = 0.0228 at d42. Mean ± SEM. n = 4 pellets per
group. Statistical significance was determined by one-way ANOVA with Tukey’s post-hoc test
at specific timepoint. (D) C59 significantly decreased, but Wnt3A significantly increased,
CD146/CD166+/CD45- progenitors at the Cp stage. Different letters are significantly different (a
vs. b, p = 0.0005; a vs. c, p = 0.0021; b vs. c, p = 0.0001). Mean ± SEM. n = 3 per group
(independent experiment). Statistical significance was determined by one-way ANOVA with
Tukey’s post-hoc test. (E) RNA-FISH of d28 pellets showing C59-treated pellets had decreased
Wnt3A and Wnt4 staining (green) but more homogenous COL2A1 distribution (red) in the pellets.
Scale bar = 200 µm. Experiment was performed twice with similar results.
3.4.8 scRNA-seq confirms Wnt inhibition enhances chondrogenesis
To determine how Wnt inhibition altered cell populations in chondrogenesis and to identify
chondrocyte subpopulations, pellets treated with C59 were analyzed using scRNA-seq with a
total of 12,795 cells from the stage of hiPSC, Cp as well as d7, d14, d28 and d42 C59-treated
pellets (Figure 3.5A-B). We found the C59-treated pellets comprised two major cell populations:
mesenchyme and chondrocytes. Mesenchyme exhibited high expression of actin (ACTA2),
PRRX1, COL1A1, and COL3A1. Most importantly, neural cells and melanocytes were
significantly decreased with Wnt inhibition. The differentiation trajectory of C59-treated
chondrogenesis was reconstructed, using scRNA-seq datasets of hiPSC and Cp stages from
previous sequencing (since they did not involve in C59 intervention) (Figure 3.5C). Compared to
the trajectory built from TGF-3-treated pellets, C59-treated pellets exhibited little, if any,
neurogenic markers, but showed enriched expression for chondrogenic markers (Figure 3.5D). In
pseudotime analysis, we found that C59-treatment led to earlier induction of ACAN expression,
higher levels of COL2A1 and SOX9 expression, and an earlier decrease in SOX2 expression as
compared to pellets treated with TGF-3 alone (Figure S3.6A).
Page 121
102
Chondrocytes in C59-treated pellets comprised several subpopulations as identified by multiple
CCA alignment of d7-d42 timepoints with a total of 7,997 cells (Figure 3.5E-F and Figure
S3.6B-C), including one mesenchymal population and four conserved chondrocyte subsets with
enriched COL2A1 and SOX9 expression. The chondrocyte subset enriched in cell cycling
markers, such as high mobility group box 2 and cyclin dependent kinase 1 (HMGB2/CDK1+), is
defined as proliferating chondrocytes (42). The second chondrocyte subset is enriched in IGF-
binding protein-5 (IGFBP5). It has been previously reported that IGFBP5 is highly upregulated
in early differentiating stage (43). Hence, the IGFBP5+ chondrocyte subset is defined as a
population of early differentiating chondrocytes. The third chondrocyte subset expresses
leukocyte cell-derived chemotaxin 1, epiphycan, and frizzled related protein
(LECT1/EPYC/FRZB+) and had the highest levels of COL2A1 and ACAN expression among
other chondrocyte subsets. Therefore, the LECT1/EPYC/FRZB+ chondrocyte subset is defined as
a population of early-mature chondrocytes. Finally, we identified a unique chondrocyte subset
expressing interferon (IFN)-related genes including ISG15 ubiquitin-like modifier, interferon
alpha inducible protein 6, and MX dynamin like GTPase 1 (ISG15/IFI6/MX1+). We observed
that 4.6% of ISG15/IFI6/MX1+ chondrocytes co-expressed terminal hypertrophic differentiation
markers VEGFA and MMP13; thus, we defined the ISG15/IFI6/MX1+ chondrocyte subset as
mature-hypertrophic chondrocytes (Figure S3.6D).
At early timepoint d7, HMGB2/CDK1+ proliferating chondrocytes was the main cell
population (44.5%) within the pellets (Figure S3.6C). Interestingly, this population also had the
highest numbers of BMPR1B/ITGA4 double-positive cells, a rare osteochondral progenitor
population found in articular cartilage (Figure S3.6E-F) (31). When proliferating chondrocytes
differentiated toward maturity, potentially facilitated by IGFBP5 (43), IGFBP5+ early
Page 122
103
differentiating chondrocytes and LECT1/EPYC/FRZB+ early-mature chondrocytes became
dominant (Figure S3.6C). The enriched expression of FRZB, which encodes a secretory Wnt
inhibitor, in early-mature chondrocytes might help stabilize this population by further
antagonizing Wnt signaling in addition to C59 treatment (Figure S3.6G). As
LECT1/EPYC/FRZB+ chondrocytes had the highest levels of COL2A1 and ACAN expression,
we investigated the DEGs of this particular population at various time points (Figure 3.5G).
Among several early chondrogenic markers such as COL9A1 and osteogenic markers such as
COL1A1, IGFBP7 exhibited biphasic upregulation at both early and later time points of
chondrogenesis.
The percentage of ISG15/IFI6/MX1+ mature-hypertrophic chondrocytes greatly
increased at d28 (Figure S3.6C). Although the downstream IFN regulatory molecules including
STAT1 and PML were elevated in this population, we could not detect any type of IFNs which
were conventionally believed to be the activators of IFN pathways (Figure S3.6H). Instead, we
observed that IGFBP3 was enriched in ISG15/IFI6/MX1+ chondrocytes, whereas IGFBP5 was
highly expressed in early differentiating chondrocytes. In line with the results of previous
studies, we also observed that IGFBP3 inhibited expression of FOS (C-FOS), a possible driver of
chondrocyte hypertrophy when it dimerizes with JUN (AP-1) (Figure S3.6I) (44). This result
may provide some explanations for the finding that ISG15/IFI6/MX1+ chondrocytes had variable
expression levels of hypertrophic chondrocyte markers (Figure S3.6J) (45).
During chondrogenic culture, pellets were generally surrounded by a fibrous layer,
resembling the cartilage anlage enclosed by fibroblastic cells (i.e., perichondrium). To determine
if the mesenchyme (i.e., ACTA2/PRRX1/COL1A1+ cells) identified in pellets and the
mesenchyme (i.e., PRRX1+ cells) identified at the Cp stage (monolayer culture) were similar to
Page 123
104
the perichondrium, we benchmarked these mesenchymal cells, as well as various chondrocyte
subpopulations, against previously reported markers of perichondrial cells in rats and humans
(Figure S3.7) (46, 47). We found that ACTA2/PRRX1/COL1A1+ cells in pellets, but not
PRRX1+ cells at the Cp stage, were enriched in genes of perichondrium, suggesting that the
mesenchymal populations at the Cp stage and in pellets had distinct phenotypes, despite their
shared mesenchymal genes such as COL1A1 and COL3A1. These data were then used
reconstruct the GRN of hiPSC chondrogenesis, with minimal presence of off-target cells as
shown by WGCNA (Figure S3.8A).
Page 125
106
Figure 3.5 scRNA-seq of pellets with Wnt inhibition shows improved chondrogenesis. (A)
scRNA-seq was performed on the pellets with Wnt inhibition. (B) Chondrocytes and
mesenchymal cells were two major populations in C59-treated pellets. Cells that passed quality
are used for tSNE plots; Cp: 1,888 cells, d7: 1,682 cells, d14: 3,076 cells, d28: 1,756 cells, and
d42: 1,483 cells. (C) Differentiation trajectory of C59-treated pellets. scRNA-seq data with a
total of 12,795 cells from the stage of hiPSC, Cp as well as d7, d14, d28 and d42 C59-treated
pellets was used to reconstruct the differentiation trajectory. (D) C59-treated pellets exhibited
decreased neurogenic markers but increased chondrogenic markers. (E) Multiple CCA alignment
of d7-d42 pellets. A total of 7,977 cells from d7-d42 timepoints of C59-treated pellets was used
to performed CCA alignment. (F) Dynamic changes in gene expression and percentages of
chondrocyte subpopulations over time. (G) Heat map of top 20 DEGs at each timepoint for
LECT1/EPYC/FRZB+ early-mature chondrocytes.
3.4.9 Differential gene expression profiles after C59 treatment
Three major conserved populations were identified after CCA alignment of the d14 cells with or
without C59 treatment (a total of 5,224 cells analyzed): proliferative cells, mesenchyme
enriched, and chondrocytes (Figure 3.6A and 3.6B). C59-treated pellets contained more
mesenchyme and chondrocytes at d14, while non-C59-treated (i.e., TGF-3 only) pellets had
more proliferative cells at the same time point (Figure 3.6C). Pellets with only TGF-3 treatment
not only showed elevated expression of MITF but also had more neural cells which were
clustered in proliferative cells (Figure 3.6D). Chondrocytes and proliferative cells exhibited
similar profiles of up- and down-regulated DEGs. For instance, both cell populations showed
upregulated expression of COL2A1 and JUNB, while exhibiting decreased expression of SOX4
and several ribosomal genes (Figure S3.8B). Interestingly, FRZB was only upregulated in the
chondrocyte population upon C59 treatment.
At d28, pellets treated with C59 exhibited increased expression of ACAN and COMP
compared to the standard-treated pellets (Figure S3.8C-D). Importantly, we also observed that
IFI6 and ISG15, markers for mature-hypertrophic chondrocytes, were down-regulated in the
C59-treated pellets, suggesting Wnt inhibition may decrease chondrocyte hypertrophy during
chondrogenesis.
Page 126
107
3.4.10 Wnt expression with neurogenesis
To determine the expression patterns of Wnts and to identify the cells responsible for Wnt
production, we investigated Wnt expression levels in multiple cell populations of d14 and d28
pellets (Figure 3.6E and Figure S3.8E; a total of 5,224 d14 cells and a total of 3,027 d28 cells
analyzed). In TGF-3-treated pellets, several canonical Wnts such as Wnt3, Wnt3A, and Wnt7B,
as well as non-canonical Wnts including Wnt4, were enriched in the proliferative population
(where the neural cells clustered), while Wnt2B and Wnt5B could be found in proliferative cells,
chondrocytes, and mesenchyme. We did not detect Wnt1, Wnt2, and Wnt8 in any specimens.
Upon C59 treatment, most Wnts showed decreased expression, particularly in proliferative cells.
Western blots confirmed that C59-treated pellets had decreased protein levels of Wnt2B, Wnt3A,
Wnt4, and Wnt7B (Figure 3.6F). Interestingly, C59 only moderately inhibited Wnt5B. We next
plotted these Wnt ligands along with neurogenic and chondrogenic markers in pseudotime to
investigate their expression patterns. We observed that Wnt2B, Wnt3A, Wnt4, and Wnt7B
clustered with neurogenic markers, whereas Wnt5B was upregulated along chondrogenic
differentiation, implying that individual Wnts may play distinct roles in regulating
chondrogenesis (Figure 3.6G).
Page 128
109
Figure 3.6 CCA analysis reveals that most Wnts, except Wnt5B, were secreted by off-target
cells. (A) Three major conserved populations in d14 pellets. A total of 5,224 cells from the d14
pellets with or without C59 treatment was analyzed. (B) Violin plots of the specific markers for
each conserved population. (C) C59-treated pellets comprised more chondrocytes and
mesenchymal cells. (D) Expression levels of chondrogenic markers were higher in C59-treated
pellets while expression of neurogenic markers and melanocyte markers was higher in TGF-3-
treated pellets. (E) Dotplot showing proliferative cells (mainly neural cells) from TGF-3-treated
pellets had high expression levels of Wnt ligands. Wnt inhibition largely decreased expression
levels of Wnts in cells. (F) Western blots confirm that Wnt inhibition significantly decreased
Wnts in cells at protein levels. * p = 0.026, # p = 0.021, $ p = 0.0003, † p = 0.00029, ‡ p = 0.021
to its corresponding group. Mean ± SEM. n = 3 per treatment condition. Statistical significance
was determined by two-tailed Student’s t-test for the groups with or without specific Wnt
inhibition. (G) Most Wnts were upregulated along the lineage of neural cells, where Wnt5B was
clustered with chondrogenic differentiation in TGF-3-treated pellets. A total of 2,148 cells from
the TGF-3-treated d14 pellets was analyzed and used to generate the heatmap.
3.4.11 Wnts alter GAG/DNA and collagen production
As C59 is a pan-Wnt signaling inhibitor, it therefore remained unknown which Wnt ligand had
the most severe adverse effect on hiPSC chondrogenesis. To answer this question, we
administrated a variety of Wnts during pellet culture (Figure S3.9A). RT-qPCR analysis showed
that only Wnt7B significantly decreased chondrogenic markers (SOX9, ACAN, and COL2A1),
hypertrophic marker (COL10A1), and osteogenic marker (COL1A1) when compared to TGF-3
only pellets (Figure 3.7A). Interestingly, the pellets treated with Wnt2B and Wnt3A exhibited
increased COL2A1, COL1A1, and COL10A1 expression versus TGF-3 pellets. However, only
the pellets with Wnt3A treatment had a significantly decreased GAG/DNA ratio compared to the
pellets with TGF-3 only treatment (Figure 3.7B). Wnt2B-treated pellets also showed a trend
toward increasing expression of neurogenic markers (PAX6 and SOX2), although not statistically
significant. Furthermore, Wnt2B- and Wnt7B-treated pellets had significantly lower expression
of MITF relative to TGF-3 pellets. We also observed that Wnt ligands may not only regulate
their own expression but may also modulate the expression of other Wnt ligands (Figure S3.9B).
While all pellets had comparable Saf-O staining, Wnt treatment increased off-target cells
Page 129
110
within the pellets (Figure 3.7C). Furthermore, these off-target cells exhibited lower production of
COL2A1 compared to chondrocytes. Additionally, pellets treated with Wnts, particularly
Wnt3A, exhibited higher intensity of COL1A1 and COL10A1 staining, which was observed near
off-target cells and perichondrium. On the contrary, C59 pellets had low COL1A1 and
COL10A1 production and the staining was mainly at the perichondrium. Together, these results
indicate that Wnts increased non-chondrogenic cells and modulated collagen production. The
histological images in Figure 3.7C were quantified using a published ImageJ protocol (Figure
S3.9C) (48).
3.4.12 Heterocellular Wnt signaling may regulate chondrogenesis
To investigate which cell populations are the main sources for the endogenous production of
specific Wnts during chondrogenesis, a heatmap in which the expression of Wnt ligands against
multiple cell populations at the d28 timepoint was plotted (Figure 3.7D and Figure S3.9D). We
found that 30% of melanocytes expressed Wnt2B, while Wnt3A, Wnt4, and Wnt7B were mainly
expressed in neural cells. Wnt5B was expressed primarily by chondrocytes (about 10% of
chondrocyte population) providing a possible explanation for the upregulation of Wnt5B during
chondrogenesis. As Wnts are secretory proteins, we next aimed to identify the potential cell
populations receiving Wnt signaling based on published lists of ligand-receptor pairs (27). We
found that 31.6% of chondrocytes expressed FZD2, the highest expression of a Wnt receptor in
chondrocytes (Figure 3.7E). Thus, we created the multicellular signaling for Wnt3A-FZD2 pair
and identified that 9.9% of neural cells expressed Wnt3A while more than a third of chondrocytes
(36.1%) were capable of receiving this ligand (Figure 3.7F). Additionally, we also observed that
although chondrocytes were the major contributor for Wnt5B production, melanocytes (30%)
might be the main receiving cell type. Furthermore, while 30% of melanocytes may secrete
Page 130
111
Wnt2B, only 1% of chondrocytes expressed FZD4, one of the main Wnt2B receptors (Figure
3.7G).
Page 132
113
Figure 3.7 Heterogenous multicellular Wnt signaling models. (A-B) RT-qPCR and GAG/DNA
ratios of pellets treated with various Wnts during pellet culture. Different letters are significantly
different from each other (p < 0.05). Mean ± SEM. n = 3-4 pellets per group. Statistical
significance was determined by one-way ANOVA with Tukey’s post-hoc test. (C) Wnt treatment
increased infiltration of off-target cells (pink arrowheads and white dashed lines) into the pellets,
decreased COL2A1 staining, but increased COL1A1 (yellow arrowheads) and COL10A1
staining in the pellets. The pellets with C59 treatment exhibited homogenous COL2A1 staining
and decreased COL1A1 and COL10A1 staining. Scale bar = 0.2 mm. Experiment was performed
twice with similar results. (D) Heatmap showing distinct expression levels of various Wnts in
d14 TGF-3-treated pellets. A total of 2,148 cells from the TGF-3-treated d14 pellets was
analyzed and used to generate the heatmap. (E) Percentage of the cells expressing Wnt3A and its
putative receptors in d14 TGF-3-treated pellets. (F-G) Heterogenous multicellular signaling
models in d14 TGF-3-treated pellets.
3.4.13 BMP/GDF differential expression after C59 treatment
While the precise mechanisms of enhanced chondrogenesis remain to be determined, our CCA
analysis showed that six chondrocyte subpopulations and 1 mesenchymal population were
conserved between TGF-3 and C59 conditions in d14 pellets: 1) HMGB2/CDK1+ proliferating
chondrocytes, 2) UBE2C/CCNB1+ proliferating chondrocytes, 3) LECT1/EPYC/FRZB+ early-
mature chondrocytes, 4) ISG15/IFI6/MX1+ mature-hypertrophic chondrocytes, 5) FTL/MT-
CO2+ stressed chondrocytes, 6) BNIP3/FAM162A+ apoptotic chondrocytes, and
ACTA2/PRRX1/COL1A1+ mesenchymal cells (Figure S3.10A; CCA was performed with a total
of 1,335 cells from mesenchymal and chondrocyte populations from d14 TGF-3 pellets and
with a total of 3,047 cells from mesenchymal and chondrocyte populations from d14 C59
pellets). Interestingly, C59 treatment differentially influenced the expression of various growth
factors and receptor in the TGF- superfamily essential in regulating chondrogenesis (49)
(Figure S3.11A-B and Figure S3.12A-B).
In addition to exogenous TGF-3 stimulation, endogenous signaling from other members
of the TGF- superfamily (e.g., bone morphogenetic proteins (BMPs), growth and differentiation
factors (GDFs)) is also essential for regulating chondrogenesis. To investigate how C59
Page 133
114
treatment alters gene expression profiles of these families and their associated receptors
(including Type I and Type II receptors), we used CCA to align chondrocytes populations and
mesenchymal cells from d14 pellets with or without C59 treatment. We also observed that C59
treatment decreased BMP2, BMP4, BMP6, and BMP7 gene expression, but it increased GDF5
and GDF10 gene expression. For receptors, C59 treatment enhanced expression levels of
BMPR1B and ACVR1, but it decreased BMPR2, ACVR2A, and ACVR2B expression (Figure
S3.11A-B and S3.12A-B). BMP8A, BMP10, BMP11, and BMP15, as well as GDF2, GDF4,
GDF6, and GDF8 were not detected in our datasets.
To investigate how C59 treatment affects the percentage of cells expressing genes of
interest within a specific chondrocyte subpopulation, we used BMP4, GDF5, BMPR1B (type I
receptor), and BMPR2 (type II receptor) as examples (Figure S3.10B-E). For BMP4, C59-treated
pellets had a decreased percentage of BMP4-expressing cells within all chondrocyte
subpopulations except ISG15/IFI6/MX1+ mature-hypertrophic chondrocytes as compared to
pellets treated with TGF-3 only condition. In addition, C59-treated pellets also demonstrated a
remarkably increased percentage of GDF5 and BMPR1B expressing cells within all chondrocyte
populations versus TGF-3-treated pellets. Furthermore, C59 decreased the percentage of the
cells expressing BMPR2 in LECT1/EPYC/FRZB+ early-mature, ISG15/IFI6/MX1+ mature-
hypertrophic chondrocytes, BNIP3/FAM162+ chondrocytes, and HMGB2/CDK1+ and
UBE2C/CCNB1+ proliferating chondrocytes. Interestingly, it appeared that C59 treatment did
not significantly affect the contribution of a chondrocyte subpopulation to the cells expressing a
given gene (i.e., the cells expressing the genes of interests mainly came from
LECT1/EPYC/FRZB+ early-mature chondrocytes regardless of the treatments as presented in the
pie charts in Figure S3.10B-E).
Page 134
115
3.5 Discussion
The therapeutic applications of hiPSCs for cartilage regeneration or disease modeling have been
limited by the low-yield of bona fide chondrocytes, accompanied by off-target populations
during chondrogenic differentiation. Our GRN analysis revealed two major off-target cell
populations, neural cells and melanocytes, which showed high association with Wnt4 and Wnt2B
signaling, respectively. By building heterocellular signaling models, we showed that off-target
cells were the main source of several canonical and non-canonical Wnt ligands that were
implicated in chondrocyte hypertrophic differentiation. Importantly, inhibition of Wnt and
MITF, the master regulator of melanocyte development, significantly enhanced homogeneity of
hiPSC chondrogenesis by decreasing off-target cells, circumventing the need for prospective
sorting and expansion of isolated progenitor cells.
An important finding of this study was the identification of distinct subtypes of hiPSC-
derived chondrocytes, as shown in depth by the comprehensive transcriptomic profiles of each
cell type at various differentiation stages. We also observed that inhibition of Wnt signaling
during chondrogenesis alters gene expression levels of BMPs/GDFs (e.g., decreasing BMP4 and
BMP7 levels) in chondrocytes, which is consistent with a recent study demonstrating decreased
BMP activity during MSC chondrogenesis due to Wnt inhibition (50). Another intriguing finding
is the discovery of ISG15/IFI6/MX1+ mature-hypertrophic chondrocytes as, without scRNA-seq,
this unique population has not been reported before. Although the signature genes of this
chondrocyte population (e.g., STAT-1) were generally believed to be downstream of IFN-related
pathways, we did not detect IFN expression. The high expression of IGFBP3 in
ISG15/IFI6/MX1+ chondrocytes may provide an explanation for this observation, as IGFBP3
can activate STAT-1 expression without the presence of IFN molecules in chondrogenesis (51).
Page 135
116
Additionally, IGFBP3-enriched chondrocytes also had decreased expression of FOS, essential in
driving chondrocytes toward hypertrophy (44). It has been reported that chondrocyte
hypertrophy was largely prevented upon IGFBP3 knockdown in the ATDC5 line (52). Thus, low
FOS expression in ISG15/IFI6/MX1+ chondrocytes provides a plausible explanation for their
low expression of hypertrophic markers. Nevertheless, the causal relationship between the dual
function of IGFBP3 in chondrocyte hypertrophy and Wnt inhibition merits further study.
The finding that melanocytes and neural cells were the major off-target cells imply that
some, if not all, progenitors may acquire the phenotype of neural crest cells, a transient stem cell
population that can give rise to neurons and melanocytes. This differentiation pathway likely
occurs at the Cp stage, where we first observed cell populations expressing several markers of
neural crest cells. It is likely that the neural crest cells observed in the current study were also
off-target cells (i.e., non-paraxial mesodermal lineage) generated during early stages of
mesodermal differentiation and amplified due to BMP4 treatment at the Cp stage. It has been
reported that the Bmp4-Msx1 signaling axis inhibits Wnt antagonists such as Dkk2 and Sfrp2 in
dental mesenchyme in mice (53), implying BMP4 activating Wnt signaling that is essential for
the proliferation of neural crest cells.
Additionally, our sorting results showed that supplementation of Wnt increased, but
inhibition of Wnt decreased, the proportion of CD146/CD166+ cells, suggesting that Wnt
signaling is required to maintain progenitors at the Cp stage. This finding is in agreement with a
recent study showing that Wnt3A supports multipotency of hMSCs during in vitro expansion
(54). In our recent publication using a CRISPR-Cas9-edited reporter hiPSC line and scRNA-seq
techniques, we identified that mesenchymal cells triple-positive for CD146, CD166, and
PDGFRβ, but negative for CD45, at the Cp stage showed robust chondrogenic potential but little
Page 136
117
osteogenic capacity compared to unsorted cells, suggesting that CD146/CD166/PDGFRβ+
mesenchymal cells may be a unique chondroprogenitor population (55). However, whether the
CD146/CD166+ progenitor population identified in the current study functions like MSCs with
multilineage potential warrants future investigation. Furthermore, as distinct subtypes of hiPSC-
derived chondrocytes were defined primarily based on marker genes, the complete functionality
of these subsets require future investigation.
An important contribution of this study is the construction of the GRN of hiPSC
chondrogenesis with the presence of minimal off-target cells, ensuring the hub genes identified
are truly governing differentiation. In addition to conventional master TFs such as SOX9, we
also identified several additional hub genes associated with chondrogenesis. For instance, the
expression levels of complement C1q like 1 (C1QL1) was highly correlated with those of
COL2A1 in our model. C1QL1 encodes a secreted protein with Ca2+ binding sites that regulates
synaptogenesis in neuronal cells (56). However, how C1QL1 affects chondrogenesis or if it plays
a role in synovial joint innervation is currently unknown. Additionally, our finding of the
melanogenic GRN during hiPSC chondrogenesis suggests an off-target cell fate decision in
differentiation. This result is further corroborated by the study of Yamashita and colleagues
demonstrating the presence melanin or lipofuscin on the surface of hiPSC-derived cartilage pellet
using rigorous histological staining (57). Furthermore, we also revealed the significant
association between Wnt2B and MITF, providing insights into melanogenesis. Indeed, a recent
study proposed genetic variants in Wnt2B may serve as a biomarker to predict survival rate of the
patients with cutaneous melanoma (58). We also identified Wnt4 as a hub gene in the GRN of
neurogenesis and observed that Wnt3A was enriched in the cell populations expressing neural
markers. These results are consistent with the previously identified roles for these Wnts in
Page 137
118
promoting forebrain development (59, 60).
Heterogenous multicellular signaling models indicate that although most Wnts were
produced by off-target cells, these ligands may signal though chondrocytes. It is well recognized
that Wnt signaling not only blocks SOX9 expression in limb bud mesenchymal cells but also
regulates chondrocyte maturation, driving them toward hypertrophy (61, 62). In agreement with
these findings, hiPSC-derived chondrogenic pellets treated with individual Wnts exhibited
increased COL10A1 staining. We also demonstrated that blocking endogenous Wnt signaling
significantly improved chondrogenesis in hMSCs. These findings reveal the potential
modulatory effects of off-target cells on chondrocytes through Wnt signaling pathway, indicating
that inhibition of Wnt has dual beneficial effects on hiPSC chondrogenesis as it not only removes
off-target cells but also prevents chondrocyte hypertrophy.
These findings not only identify the mechanisms regulating the heterogeneity in hiPSC
chondrogenesis but, more importantly, provide an enhanced chondrogenic differentiation
protocol capable of generating homogenous chondrocytes by removing off-target cells without
cell sorting. Furthermore, this protocol has been validated in multiple unique lines,
demonstrating its robustness and efficiency in deriving chondrocytes from hiPSCs. We also
established a comprehensive map of single-cell transcriptome profiles and GRNs governing cell
fate decision during hiPSC chondrogenesis. These findings provide insights into dynamic
regulatory and signaling pathways orchestrating hiPSC chondrogenesis, thereby advancing a
further step of cartilage regenerative medicine toward therapeutic applications. This approach
also provides a roadmap for the use of single-cell transcriptomic methods for the study and
optimization of other in vitro or in vivo differentiation processes.
3.6 Supplemental Figures and Tables
Page 138
119
Figure S3.1 Step-wise differentiation of hiPSCs toward chondrocytes via specification of
mesoderm. (A) Differentiation protocol of hiPSCs into chondrocytes. (B) Cell morphology at
each stage during mesodermal differentiation. Please note that low cell density at hiPSC stage is
required to obtain successful mesodermal differentiation. Scale bar = 500 µm. (C) Up-regulation
of stage-specific markers for 3 unique hiPSC lines.
Page 139
120
Figure S3.2 GO enrichment analysis of bulk RNA-seq data and subcutaneous implantation of
hiPSC-derived chondrocytes in mice. (A) GO enrichment analysis of bulk RNA-seq data
showing that up-regulated genes were involved in skeletal system and cartilage development. (B)
d14 chondrogenic pellets maintained a cartilage phenotype indicated by intense Saf-O and
COL2A1 staining after 14 days of subcutaneous implantation in mice. n = 3 mice. (C) The off-
target cells (mostly located at the edge of perichondrium, yellow arrowheads) were observed in
the pellets derived from 3 distinct hiPSC lines. (D) Focal black dots were occasionally observed
on the surface of the pellets.
Page 141
122
Figure S3.3 Analysis of scRNA-seq data reveals diverse cell populations in hiPSC-derived
chondrogenic pellets. (A) scRNA-seq of mixed specie samples showing low multiplet rates (<
2.7%). (B) CCA of scRNA-seq data from d28 chondrogenic pellets from 2 independent
experiments (i.e., 2 batches). 8 conserved cell clusters were identified in both batches. (C) Cells
in the same cluster from different batches exhibited high correlation in their gene expression
(Spearman’s rank coefficient rs > 0.87 for all clusters). (D) Cells in the clusters from distinct
batches demonstrated similar gene expression patterns. (E) Additional neural cell markers such
as DCX, MAP2, OTX1, and PAX6 were also enriched in the branch of neurogenic differentiation.
(F) SOX4+ and SOX4/SOX9+ cells at the Cp stage had high expression of neural crest cell
markers. A total of 1,888 cells at the Cp stage that passed quality control was analyzed. (G) Cells
that are enriched for PRRX1, COL1A1, COL3A1, and COL5A1 were annotated as “mesenchyme”
at the Cp stage. A total of 1,888 cells at the Cp stage that passed quality control was analyzed.
(H) Three major cell populations observed in d3 pellets. A total of 2,485 cells from d3 pellets
that passed quality control was used to generate the tSNE plot. (I) Fraction of major cell types
over the course of differentiation (Cp – d28). A total of 11,208 cells from the Cp stage to d28
pellets was analyzed. (J) IHC against nestin and MITF confirms the presence of neural cells and
melanocytes in pellets. (K) Mesenchymal cells in d14 pellets expressed several conventionally
recognized MSC markers. However, whether these mesenchymal cells exhibit multipotency like
MSCs requires further investigation. A total of 2,148 cells from d14 pellets was analyzed.
Page 143
124
Figure S3.4 WGCNA reconstructed GRNs of neurogenesis and melanogenesis and identified the
hub genes in each network. (A-B) GRNs of neurogenesis and melanogenesis. Topological
analysis (community cluster) was performed to visualize subnetworks. (C) Wnt4 was among the
hub genes in the GRN of neurogenesis while Wnt2B was associated with the GRN of melanocyte
development. (D-F) Representative d28 pellet images showing that C59 or a combination of C59
and ML treatment during pellet culture enhanced the homogeneity of chondrogenesis by
removing off-target cells. This was validated in 3 unique hiPSC lines. (G) The pellets treated
with C59 or a combination of C59 and ML treatment exhibited significantly increased
GAG/DNA ratios compared to the pellets treated with ML and the pellets treated TGF-3. * C59
vs. TGF-3 (p = 0.01) at a specific timepoint. # C59 + ML vs. TGF-3 (p = 0.001) at a specific
timepoint. Mean SEM. n = 4 pellets per treatment condition. One-way ANOVA with Fisher’s
LSD was performed at d28 and d42. (H) hMSCs harvested from 3 distinct donors exhibited
increased chondrogenesis when treated with C59 during pellet culture. (I) hMSCs harvested
from donor 1 and donor 3 had significantly increased GAG/DNA ratios when treated with C59
compared to with TGF-3 alone. # C59 vs. TGF-3 (p = 0.01) at specific time point. Mean
SEM. n = 4 pellets per treatment condition. Two-tailed Student’s t-test was performed at d28
and d42.
Figure S3.5 Semi-quantification of RNA-FISH against Wnts and COL2A1. C59-treated pellets
showed decreased Wnt3A and Wnt4 expression but increased COL2A1 RNA-FISH labeling
versus TGF-3-treated pellets.
Page 144
125
Figure S3.6 Multiple CCA alignment of d7-d42 pellets reveals that 4 conserved chondrocyte
Page 145
126
subpopulations and 1 conserved mesenchymal population were observed in C59-treated pellets.
(A) Jitter plots showing that C59-treated pellets had increased expression of ACAN, COL2A1,
and SOX9 but decreased SOX2 versus Standard TGF-3-treated pellets. (B) Temporal expression
profiles of signature genes of each chondrocyte subpopulation. CDK1 and IGFBP5 showed
transient upregulation while COL9A1 and COL11A1 remained up-regulated once activated.
MMP13 and MX1 showed increased expression levels at later time points. (C) Dynamic changes
in the percentage of the cell population within the pellets over the course of differentiation. (D)
ISG15/IFI6/MX1+ chondrocytes contained 4.6% cells expressing both VEGFA and MMP13. (E-
F) BMPR1B/ITGA4+ progenitors previously identified in articular cartilage were mostly
observed in HMGB2/CDK1+ proliferating chondrocytes. (G) LECT1/EPYC/FRZB+ early-
mature chondrocytes had the highest levels of COL2A1 and ACAN expression among other
chondrocyte subpopulations. (H) ISG15/IFI6/MX1+ mature-hypertrophic chondrocytes
expressed several IFN-related genes. (I) In comparison with IGFBP5+ early chondrocytes,
ISG15/IFI6/MX1+ mature-hypertrophic chondrocytes showed high expression in IGFBP3 but
decreased expression in FOS. (J) The expression of various hypertrophic chondrocyte markers.
For scRNA-seq analysis of C59 treated pellets, total 7,997 cells (from d7-d42) passed quality
control and thus were analyzed for this figure. (E-F) A total of 7,977 cells from d7-d42
timepoints of C59-treated pellets was used to performed CCA alignment.
Page 146
127
Figure S3.7 ACTA2/PRRX1/COL1A1+ mesenchymal cells in the pellets, but not mesenchymal
cells at the Cp stage, exhibit similar gene expression profile to perichondrial cells. (A)
ACTA2/PRRX1/COL1A1+ mesenchymal cells in the pellets expressed markers of rat
perichondrial cells. (B) ACTA2/PRRX1/COL1A1+ mesenchymal cells from d7 and d14 pellets
were enriched with 8 of 15 differentially expressed genes in the perichondrium-like membrane of
the human chondrogenic pellet. Particularly, d7 ACTA2/PRRX1/COL1A1+ mesenchymal cells
had the highest expression of C2orf91, FGF18, GGT7, CHST9, and ZNH354C. Interestingly, we
also observed that there was gradual shift in the gene expression profile of
ACTA2/PRRX1/COL1A1+ mesenchymal cells from d28 to d42. For example, d28
ACTA2/PRRX1/COL1A1+ mesenchymal cells were enriched in NRN1 and CH3L1 while d42
cells had the highest expression of ADAMTSL1, WISP2, and CD70.
Page 148
129
Figure S3.8 The GRN of hiPSC chondrogenesis. (A) The GRN and hub genes of hiPSC
chondrogenesis. (B) CCA was used to identify DEGs of each subpopulation between d14 pellets
with and without C59 treatment. ID2, a neurogenic marker (blue circle), was decreased in
proliferative cells in C59-treated pellets, while PRG4 (red circle) was increased in mesenchymal
cells in C59-treated pellets. (C) CCA alignment of cells from d28 pellets with and without C59
treatment. A total of 3,027 cells from d28 pellets with and without C59 treatment was used to
performed CCA alignment. (D) CCA was used to identify DEGs of chondrocytes between d28
pellets with and without C59 treatment. Markers for mature-hypertrophic chondroocytes, such as
IFI6 and ISG15 (blue circles), were decreased while ACAN and COMP (red circles) were
increased in C59-treated pellets. (E) Similar to the Wnt expression profiles in d14 pellets, most
Wnts were expressed by proliferative cells in the d28 pellets treated with TGF-3.
Page 149
130
Figure S3.9 Effect of Wnts on chondrogenesis. (A) Schematic of Wnt treatment during
chondrogenic pellet culture. (B) RT-qPCR of d14 pellets treated various Wnts showing that gene
expression of Wnts can be modulated by other Wnt ligands. Different letters are significantly
different from each other (p < 0.05). Mean ± SEM. n = 3-4 pellets per group. Statistical
significance was determined by one-way ANOVA with Tukey’s post-hoc test. (C) Semi-
quantification of Saf-O and IHC labeling against various collagens. (D) Percentage of the cells
Page 150
131
expressing a variety of Wnts in d14 pellets treated with TGF-3. For scRNA-seq analysis of d14
TGF-3 treated pellets, total 2,148 cells passed quality control and thus were analyzed.
Page 151
132
Figure S3.10 Differential expression of BMPs/GDFs and receptors in response to Wnt
inhibition. (A) CCA alignment of chondrocyte and mesenchymal populations from TGF-3 only
and C59 conditions. (B) C59-treated pellets had a decreased percentage of BMP4 expressing
cells within all clusters except within ISG15/IFI6/MX1+ mature-hypertrophic chondrocytes. (C-
D) C59-treated pellets demonstrated a remarkably increased percentage of GDF5 and BMPR1B
expressing cells within all clusters versus TGF-3-treated pellets. (E) C59 treatment decreased
percentage of cells expressing BMPR2 in LECT1/EPYC/FRZB+ early-mature chondrocytes,
ISG15/IFI6/MX1+ mature-hypertrophic chondrocytes, BJIP3/FAM162+ apoptotic chondrocytes,
as well as HMGB2/CDK1+ and UBE2C/CCNB1/KPNA2+ proliferating chondrocytes. (B-E)
Note that C59 treatment did not significantly affect the contribution of a cluster to the cells
expressing BMP4, GDF5, BMPR1B, and BMPR2 as presented in the pie charts. For
bioinformatic analysis, CCA was performed with a total of 1,335 cells from mesenchymal and
chondrocyte populations from d14 TGF-3 pellets and with a total of 3,047 cells from
mesenchymal and chondrocyte populations from d14 C59 pellets.
Page 152
133
Figure S3.11 CCA analysis showing differential gene expression with C59 treatment. (A) BMP
and (B) GDF families in chondrocyte subpopulations due to C59 treatment. Numerical value on
Page 153
134
top of each bar in the bar graph indicates cell numbers expressing a given gene. For
bioinformatic analysis, CCA was performed with a total of 1,335 cells from mesenchymal and
chondrocyte populations from d14 TGF-3 pellets and with a total of 3,047 cells from
mesenchymal and chondrocyte populations from d14 C59 pellets.
Page 154
135
Figure S3.12 CCA analysis showing differential receptor gene expression with C59 treatment.
(A) Type I and (B) type II receptors for the BMP/GDF family in chondrocyte subpopulations due
to C59 treatment. Numerical value on top of each bar in the bar graph indicates cell numbers
expressing a given gene. For bioinformatic analysis, total 2,148 cells from d14 TGF-3 treated
pellets and total 3,076 cells from d14 C59+TGF-3 treated pellets passed quality control and
thus were analyzed for this figure.
Page 155
136
Table S3.1 Numbers of the cells passed quality control (QC) for each stage and associated
highly variable genes.
Detected cells Cells passed QC Median genes/cell Highly variable genes
Monolayer culture
hiPSC 6258 4798 1688 1651
Sclerotome 2237 1861 3107 2240
Cp 2536 1888 3443 1754
Sum 11031 8547 8238 5645
Average 3677 2849 2746 1882
TGF-3 chondrogenic pellets
d1 2418 2216 3447 2097
d3 2810 2485 3357 1835
d7 1369 1200 4049 2302
d14 2266 2148 3784 2001
d28 1321 1271 2900 2178
d42 1355 1328 2324 1955
Sum 11539 10648 19861 12368
Average 1923 1775 3310 2061
TGF-3 + C59 chondrogenic pellets
d7 2191 1682 4030 1733
d14 3461 3076 2718 1693
d28 1881 1756 2714 1991
d42 1926 1483 3003 2126
Sum 9459 7997 12456 7543
Average 2365 1999 3116 1886
Page 156
137
Table S3.2 Top 10 up-regulated genes in fold change in mesodermal phase. Related to Figure 1.
Ensembl Symbol AP vs hiPSC PM vs AP ES vs Par Scl vs ES ES vs Cp
ENSG00000113722 CDX1 7.47 1.28 -5.77 -1.90 -2.03
ENSG00000185155 MIXL1 7.32 -2.67 -4.09 -2.29 0.91
ENSG00000222033 LINC01124 7.32 0.31 -5.65 -2.48 2.72
ENSG00000164458 T 7.19 -0.13 -5.22 -2.84 -1.81
ENSG00000104371 DKK4 7.13 -2.61 -5.28 -0.92 1.07
ENSG00000274981 6.99 -0.44 -4.38 -2.01 -0.10
ENSG00000241345 LOC105375483 6.80 1.09 -5.53 -1.25 2.06
ENSG00000253308 6.75 2.33 -7.08 -1.82 2.23
ENSG00000106038 EVX1 6.51 0.01 -5.38 -2.44 1.48
ENSG00000105991 HOXA1 6.34 3.87 -2.36 -1.99 -1.85
ENSG00000049249 TNFRSF9 1.16 6.93 -5.79 -0.95 3.01
ENSG00000120094 HOXB1 2.25 6.54 -3.53 -3.39 -0.37
ENSG00000151379 MSGN1 3.11 6.23 -5.27 -3.42 -0.60
ENSG00000137252 HCRTR2 0.01 6.01 -2.13 -0.74 1.57
ENSG00000179111 HES7 0.97 5.54 -2.97 -2.34 -0.34
ENSG00000253552 2.07 5.13 0.68 -2.19 -0.52
ENSG00000182742 HOXB4 1.54 4.93 1.00 -1.24 -0.41
ENSG00000129654 FOXJ1 -2.73 4.73 -2.53 1.02 1.48
ENSG00000163083 INHBB -2.68 4.55 -0.68 -2.63 1.58
ENSG00000100678 SLC8A3 -0.89 4.53 -0.27 -0.63 -1.42
ENSG00000147223 RIPPLY1 -0.02 -0.99 11.49 -8.93 -1.53
ENSG00000005102 MEOX1 0.06 0.37 9.05 -1.35 -5.05
ENSG00000164853 UNCX -1.66 0.00 8.92 -0.59 -1.21
ENSG00000136698 CFC1 -2.67 2.82 8.33 -4.80 -1.36
ENSG00000224865 LOC101928782 0.07 0.01 8.17 -2.92 -4.34
Page 157
138
ENSG00000168269 FOXI1 1.00 -0.91 8.12 -4.89 -3.26
ENSG00000102837 OLFM4 0.99 -0.16 7.77 -4.75 -0.94
ENSG00000176692 FOXC2 0.89 0.83 7.24 -1.11 -2.23
ENSG00000176678 FOXL1 -0.32 0.94 7.15 -2.86 -1.48
ENSG00000213931 HBE1 1.07 0.33 7.12 -1.58 -0.82
ENSG00000136327 NKX2-8 2.46 -0.32 -2.04 9.99 -3.90
ENSG00000184302 SIX6 0.22 -1.31 -3.65 8.29 -0.28
ENSG00000008196 TFAP2B 2.42 0.63 -4.51 7.30 1.47
ENSG00000274021 -0.86 0.85 -6.19 6.97 -1.09
ENSG00000064218 DMRT3 0.99 0.80 -2.70 6.97 -3.17
ENSG00000139318 DUSP6 -0.39 0.72 -6.78 6.96 -1.03
ENSG00000176165 FOXG1 0.14 0.67 -0.64 6.81 -3.11
ENSG00000244405 ETV5 -0.05 0.62 -6.23 6.76 -1.15
ENSG00000152785 BMP3 -0.82 0.49 0.16 6.63 -3.57
ENSG00000178235 SLITRK1 -0.99 0.33 -2.34 6.62 -2.86
ENSG00000180828 BHLHE22 2.88 -1.47 -2.00 -3.08 7.73
ENSG00000167941 SOST -1.11 0.36 5.37 -4.87 7.09
ENSG00000188620 HMX3 -2.25 -0.08 2.35 -3.91 6.47
ENSG00000164125 FAM198B 0.87 -0.59 -0.25 1.80 6.30
ENSG00000163132 MSX1 4.90 0.75 -2.60 -1.44 6.30
ENSG00000175899 A2M -0.10 -0.72 -0.41 1.55 6.29
ENSG00000165092 ALDH1A1 -0.27 -1.01 -1.47 0.82 6.20
ENSG00000109846 CRYAB -1.24 -0.25 -0.09 -0.25 6.12
ENSG00000107984 DKK1 5.15 -0.85 -3.78 -2.19 6.10
ENSG00000122641 INHBA -1.45 -1.94 1.50 -0.96 6.07
AP: anterior primitive streak; PM: paraxial mesoderm; ES: early somite, Scl: Sclerotome; Cp:
Chondroprogenitor
Page 158
139
Table S3.3 Top 10 up-regulated genes in fold change in chondrogenic phase. Related to Figure
1.
Ensembl Symbol d7 vs Cp d14 vs d7 d21 vs d14 d28 vs d21 d42 vs d28
ENSG00000124159 MATN4 7.69 1.22 0.73 -1.28 -0.68
ENSG00000181195 PENK 7.65 1.16 -0.23 -0.15 -0.51
ENSG00000008441 NFIX 7.08 -0.36 1.15 -0.69 0.43
ENSG00000006611 USH1C 7.01 -0.34 -0.37 -0.64 0.73
ENSG00000157554 ERG 6.44 -0.47 -0.45 -0.25 -0.51
ENSG00000171812 COL8A2 6.19 -0.01 0.68 -1.48 0.21
ENSG00000124134 KCNS1 6.18 0.48 0.42 -0.68 -1.88
ENSG00000121898 CPXM2 5.87 0.80 1.01 -0.05 0.52
ENSG00000224765 5.75 -0.37 0.53 -0.83 -0.15
ENSG00000145708 CRHBP 5.66 -2.59 0.34 0.56 -3.25
ENSG00000249945 -2.48 5.07 -4.36 -0.50 0.13
ENSG00000135480 KRT7 -2.54 4.98 1.00 -0.08 -0.17
ENSG00000278530 CHMP1B2P -0.11 4.80 -4.40 -1.15 -1.39
ENSG00000234787 LINC00458 -2.38 4.34 -2.06 0.93 -0.91
ENSG00000182798 MAGEB17 -3.16 4.24 -1.13 -1.02 2.03
ENSG00000278840 -2.23 4.19 0.70 -0.59 0.73
ENSG00000253507 -0.90 4.00 -2.28 -0.13 0.48
ENSG00000187569 DPPA3 0.15 3.96 -1.73 0.95 -0.79
ENSG00000196767 POU3F4 2.51 3.94 -1.98 -0.60 -2.49
ENSG00000101842 VSIG1 -1.03 3.81 -1.35 -0.37 2.15
ENSG00000011083 SLC6A7 -0.34 -1.09 6.22 -1.47 -0.62
ENSG00000205890 LOC100128770 -2.25 1.60 5.78 -3.33 -1.20
ENSG00000152213 ARL11 -1.54 -1.42 5.10 -4.03 1.23
ENSG00000233841 HLA-C -0.97 0.94 5.06 -5.06 1.81
ENSG00000117091 CD48 0.74 -0.73 4.77 -3.40 -1.04
Page 159
140
ENSG00000166869 CHP2 -3.55 0.82 4.70 -4.51 1.21
ENSG00000204121 -3.93 1.36 4.51 -3.57 1.80
ENSG00000224865 LOC101928782 0.13 -0.54 4.48 -4.29 2.13
ENSG00000182912 -0.87 -1.29 4.45 -2.86 0.11
ENSG00000188257 PLA2G2A 2.84 -1.28 4.22 1.86 -0.02
ENSG00000213931 HBE1 -3.49 1.31 -0.55 3.12 -4.81
ENSG00000207927 MIR302A -0.72 0.80 -1.84 2.87 0.72
ENSG00000120094 HOXB1 -0.17 1.40 -1.90 2.82 -3.71
ENSG00000164746 C7orf57 -0.30 -0.16 -0.92 2.77 -0.75
ENSG00000183463 URAD -2.49 -0.82 0.69 2.68 -3.05
ENSG00000203635 -0.46 0.86 -2.09 2.66 -1.49
ENSG00000131095 GFAP 0.18 0.65 1.11 2.65 0.93
ENSG00000255282 WTAPP1 -2.90 -1.23 0.75 2.62 -0.60
ENSG00000101276 SLC52A3 -1.43 1.12 -1.39 2.57 -0.83
ENSG00000277060 NLRP2 -1.14 1.39 -1.19 2.56 -2.86
ENSG00000166828 SCNN1G -2.23 0.06 -0.22 0.46 4.32
ENSG00000129451 KLK10 -2.31 -0.66 1.84 0.73 3.96
ENSG00000168447 SCNN1B -1.71 0.49 3.90 -3.56 3.84
ENSG00000176654 -1.05 2.23 1.68 -4.23 3.50
ENSG00000234745 HLA-B 0.48 -0.20 0.68 -1.09 3.48
ENSG00000013588 GPRC5A 0.83 -0.05 1.38 0.16 3.45
ENSG00000105392 CRX 0.14 1.54 -1.45 -1.03 3.32
ENSG00000137265 IRF4 -1.02 -0.43 3.20 -1.55 3.27
ENSG00000123689 G0S2 -2.25 0.07 1.75 0.99 3.25
ENSG00000161652 IZUMO2 -1.81 -1.56 0.78 0.27 3.02
3.7 Conclusion
In conclusion, we used next generation sequencing to map the transcriptomic profile of hiPSC
Page 160
141
chondrogenesis. This allowed us to identify Wnt and MITF as the drivers of off-target
differentiation resulting in neurogenic and melanocytic cell populations, respectively. By
inhibiting these signaling pathways during chondrogenesis, we significantly improved the
homogeneity and robustness of the hiPSC-derived cartilage. The extensive data gathered about
chondrogenesis via the mesodermal lineage will provide insights and preliminary data for future
studies investigating chondrogenic differentiation and optimizing cartilage tissue engineering.
Furthermore, the hiPSC-derived cartilage can serve as an in vitro disease model for
developmental and degenerative cartilage diseases.
3.8 References
1. S. S. Adkar et al., Genome engineering for personalized arthritis therapeutics. Trends in
molecular medicine 23, 917-931 (2017).
2. Y. Nam, Y. A. Rim, S. M. Jung, J. H. Ju, Cord blood cell-derived iPSCs as a new candidate
for chondrogenic differentiation and cartilage regeneration. Stem cell research & therapy 8,
16 (2017).
3. N. Koyama et al., Human induced pluripotent stem cells differentiated into chondrogenic
lineage via generation of mesenchymal progenitor cells. Stem cells and development 22, 102-
113 (2012).
4. A. M. Craft et al., Generation of articular chondrocytes from human pluripotent stem cells.
Nature biotechnology 33, 638 (2015).
5. A. Yamashita et al., Generation of scaffoldless hyaline cartilaginous tissue from human
iPSCs. Stem cell reports 4, 404-418 (2015).
6. C. K. Chan et al., Identification of the human skeletal stem cell. Cell 175, 43-56. e21 (2018).
7. K. M. Loh et al., Mapping the pairwise choices leading from pluripotency to human bone,
heart, and other mesoderm cell types. Cell 166, 451-467 (2016).
8. S. S. Adkar et al., Step‐Wise Chondrogenesis of Human Induced Pluripotent Stem Cells and
Purification Via a Reporter Allele Generated by CRISPR‐Cas9 Genome Editing. STEM
CELLS 37, 65-76 (2019).
9. T. W. Theunissen et al., Molecular criteria for defining the naive human pluripotent state.
Cell stem cell 19, 502-515 (2016).
10. N. P. Huynh, B. Zhang, F. Guilak, High-depth transcriptomic profiling reveals the temporal
gene signature of human mesenchymal stem cells during chondrogenesis. The FASEB
Journal 33, 358-372 (2018).
11. F. Qu, I. C. Palte, P. M. Gontarz, B. Zhang, F. Guilak, Transcriptomic analysis of bone and
Page 161
142
fibrous tissue morphogenesis during digit tip regeneration in the adult mouse. The FASEB
Journal 34, 9740-9754 (2020).
12. M. Martin, Cutadapt removes adapter sequences from high-throughput sequencing reads.
EMBnet. journal 17, 10-12 (2011).
13. A. Dobin et al., STAR: ultrafast universal RNA-seq aligner. Bioinformatics 29, 15-21 (2013).
14. Y. Liao, G. K. Smyth, W. Shi, The Subread aligner: fast, accurate and scalable read mapping
by seed-and-vote. Nucleic acids research 41, e108-e108 (2013).
15. M. I. Love, W. Huber, S. Anders, Moderated estimation of fold change and dispersion for
RNA-seq data with DESeq2. Genome biology 15, 550 (2014).
16. H. Wickham, ggplot2: elegant graphics for data analysis. (Springer, 2016).
17. W. Luo, M. S. Friedman, K. Shedden, K. D. Hankenson, P. J. Woolf, GAGE: generally
applicable gene set enrichment for pathway analysis. BMC bioinformatics 10, 161 (2009).
18. Z. Gu, R. Eils, M. Schlesner, Complex heatmaps reveal patterns and correlations in
multidimensional genomic data. Bioinformatics 32, 2847-2849 (2016).
19. A. Butler, P. Hoffman, P. Smibert, E. Papalexi, R. Satija, Integrating single-cell
transcriptomic data across different conditions, technologies, and species. Nature
biotechnology 36, 411 (2018).
20. L. v. d. Maaten, G. Hinton, Visualizing data using t-SNE. Journal of machine learning
research 9, 2579-2605 (2008).
21. D. W. Huang et al., The DAVID Gene Functional Classification Tool: a novel biological
module-centric algorithm to functionally analyze large gene lists. Genome biology 8, R183
(2007).
22. I. Tirosh et al., Dissecting the multicellular ecosystem of metastatic melanoma by single-cell
RNA-seq. Science 352, 189-196 (2016).
23. C. Trapnell et al., The dynamics and regulators of cell fate decisions are revealed by
pseudotemporal ordering of single cells. Nature biotechnology 32, 381 (2014).
24. X. Qiu et al., Single-cell mRNA quantification and differential analysis with Census. Nature
methods 14, 309 (2017).
25. G. Su, A. Kuchinsky, J. H. Morris, D. J. States, F. Meng, GLay: community structure
analysis of biological networks. Bioinformatics 26, 3135-3137 (2010).
26. P. Shannon et al., Cytoscape: a software environment for integrated models of biomolecular
interaction networks. Genome research 13, 2498-2504 (2003).
27. J. A. Ramilowski et al., A draft network of ligand–receptor-mediated multicellular signalling
in human. Nature communications 6, 7866 (2015).
28. S. Hrvatin et al., Single-cell analysis of experience-dependent transcriptomic states in the
mouse visual cortex. Nature neuroscience 21, 120 (2018).
29. Z. Gu, L. Gu, R. Eils, M. Schlesner, B. Brors, circlize implements and enhances circular
visualization in R. Bioinformatics 30, 2811-2812 (2014).
Page 162
143
30. L. Wu et al., Human developmental chondrogenesis as a basis for engineering chondrocytes
from pluripotent stem cells. Stem cell reports 1, 575-589 (2013).
31. G. B. Ferguson et al., Mapping molecular landmarks of human skeletal ontogeny and
pluripotent stem cell-derived articular chondrocytes. Nature communications 9, 3634 (2018).
32. H. Kempf et al., Bulk cell density and Wnt/TGFbeta signalling regulate mesendodermal
patterning of human pluripotent stem cells. Nature communications 7, 13602 (2016).
33. N. Akhtar et al., MicroRNA‐27b regulates the expression of matrix metalloproteinase 13 in
human osteoarthritis chondrocytes. Arthritis & Rheumatism 62, 1361-1371 (2010).
34. N. E. Baker, N. L. Brown, All in the family: proneural bHLH genes and neuronal diversity.
Development 145, dev159426 (2018).
35. M. Simões-Costa, M. E. Bronner, Establishing neural crest identity: a gene regulatory recipe.
Development 142, 242-257 (2015).
36. D. ten Berge, A. Brouwer, J. Korving, J. F. Martin, F. Meijlink, Prx1 and Prx2 in
skeletogenesis: roles in the craniofacial region, inner ear and limbs. Development 125, 3831-
3842 (1998).
37. J. Vachtenheim, J. Borovanský, “Transcription physiology” of pigment formation in
melanocytes: central role of MITF. Experimental dermatology 19, 617-627 (2010).
38. P. Langfelder, S. Horvath, WGCNA: an R package for weighted correlation network
analysis. BMC bioinformatics 9, 559 (2008).
39. M. Barthelemy, Betweenness centrality in large complex networks. The European physical
journal B 38, 163-168 (2004).
40. J. Jané-Valbuena et al., An oncogenic role for ETV1 in melanoma. Cancer research 70,
2075-2084 (2010).
41. T. Nakajima et al., Modeling human somite development and fibrodysplasia ossificans
progressiva with induced pluripotent stem cells. Development 145, dev165431 (2018).
42. M. Saito et al., The indispensable role of cyclin-dependent kinase 1 in skeletal development.
Scientific reports 6, 1-10 (2016).
43. D. Kiepe, S. Ciarmatori, A. Haarmann, B. Tonshoff, Differential expression of IGF system
components in proliferating vs. differentiating growth plate chondrocytes: the functional role
of IGFBP-5. American Journal of Physiology-Endocrinology and Metabolism 290, E363-
E371 (2006).
44. E. Wagner, Functions of AP1 (Fos/Jun) in bone development. Annals of the rheumatic
diseases 61, ii40-ii42 (2002).
45. P. Van der Kraan, W. Van den Berg, Chondrocyte hypertrophy and osteoarthritis: role in
initiation and progression of cartilage degeneration? Osteoarthritis and cartilage 20, 223-232
(2012).
46. S. S. Späth, A. C. Andrade, M. Chau, M. Baroncelli, O. Nilsson, Evidence That Rat
Chondrocytes Can Differentiate Into Perichondrial Cells. JBMR plus 2, 351-361 (2018).
47. X. Chen et al., Integration Capacity of Human Induced Pluripotent Stem Cell-Derived
Page 163
144
Cartilage. Tissue Engineering Part A 25, 437-445 (2019).
48. G. Haimovich, S. Sonam, Semi-quantitative Determination of Protein Expression Using
Immunohistochemistry Staining and Analysis: An Integrated Protocol.
49. V. Dexheimer et al., Differential expression of TGF-β superfamily members and role of
Smad1/5/9-signalling in chondral versus endochondral chondrocyte differentiation. Scientific
reports 6, 1-14 (2016).
50. S. Diederichs et al., Regulation of Wnt5A and Wnt11 during MSC in vitro chondrogenesis:
Wnt inhibition lowers BMP and hedgehog activity, and reduces hypertrophy. Cellular and
Molecular Life Sciences 76, 3875-3889 (2019).
51. A. Spagnoli et al., Identification of STAT-1 as a molecular target of IGFBP-3 in the process
of chondrogenesis. Journal of Biological Chemistry 277, 18860-18867 (2002).
52. D. S. Evans et al., Genome-wide association and functional studies identify a role for
IGFBP3 in hip osteoarthritis. Annals of the rheumatic diseases 74, 1861-1867 (2015).
53. S. Jia et al., Bmp4-Msx1 signaling and Osr2 control tooth organogenesis through
antagonistic regulation of secreted Wnt antagonists. Developmental biology 420, 110-119
(2016).
54. R. Narcisi et al., Long-term expansion, enhanced chondrogenic potential, and suppression of
endochondral ossification of adult human MSCs via Wnt signaling modulation. Stem cell
reports 4, 459-472 (2015).
55. A. Dicks et al., Prospective isolation of chondroprogenitors from human iPSCs based on cell
surface markers identified using a CRISPR-Cas9-generated reporter. Stem cell research &
therapy 11, 1-14 (2020).
56. S. Ressl et al., Structures of C1q-like proteins reveal unique features among the C1q/TNF
superfamily. Structure 23, 688-699 (2015).
57. A. Yamashita et al., Considerations in hiPSC-derived cartilage for articular cartilage repair.
Inflammation and regeneration 38, 1-7 (2018).
58. Q. Shi et al., Genetic variants in Wnt2B and BTRC predict melanoma survival. Journal of
Investigative Dermatology 137, 1749-1756 (2017).
59. S. J. Harrison-Uy, S. J. Pleasure, Wnt signaling and forebrain development. Cold Spring
Harbor perspectives in biology 4, a008094 (2012).
60. C. Elizalde et al., Distinct roles for Wnt‐4 and Wnt‐11 during retinoic acid‐induced neuronal
differentiation. Stem cells 29, 141-153 (2011).
61. Y. Deng et al., Engineering hyaline cartilage from mesenchymal stem cells with low
hypertrophy potential via modulation of culture conditions and Wnt/β-catenin pathway.
Biomaterials 192, 569-578 (2019).
62. D. Kumar, A. B. Lassar, Fibroblast growth factor maintains chondrogenic potential of limb
bud mesenchymal cells by modulating DNMT3A recruitment. Cell reports 8, 1419-1431
(2014).
Page 164
145
Chapter 4
Chondrogenic Differentiation of
Human Induced Pluripotent Stem Cells
Partially adapted from: Dicks A, Steward N, Guilak F*, Wu CL*. Chondrogenic Differentiation
of Human Induced Pluripotent Stem Cells. Methods in Molecular Biology. Submitted.
4.1 Abstract
The generation of large quantities of genetically defined human chondrocytes remains a critical
step for the development of tissue engineering strategies for cartilage regeneration and high-
throughput drug screening. This protocol describes chondrogenic differentiation of human
induced pluripotent stem cells (hiPSCs), which can undergo genetic modification and the
capacity for extensive cell expansion. The hiPSCs are differentiated in a stepwise manner in
monolayer through the mesodermal lineage for 12 days using defined growth factors and small
molecules. This is followed by 28 days of chondrogenic differentiation in a 3D pellet culture
system using transforming growth factor beta 3 and specific compounds to inhibit off-target
differentiation. The 6-week protocol results in hiPSC-derived cartilaginous tissue that can be
characterized by histology, immunohistochemistry, and gene expression or enzymatically
digested to isolate chondrocyte-like cells. Investigators can use this protocol for experiments
including genetic engineering, in vitro disease modeling, or tissue engineering.
4.2 Introduction
Articular cartilage is the tissue lining the ends of long bones in synovial joints, providing a
nearly frictionless surface for joint motion while withstanding millions of cycles of loading per
Page 165
146
year (1, 2). The unique mechanical properties of cartilage (3) are due to the composition and
structure of the cartilage matrix – predominantly a variety of proteoglycans and collagens as well
as hyaluronate and fibronectin (4). Glycosaminoglycans (GAGs), largely comprising the large
aggregating proteoglycan aggrecan (ACAN), make up 4-7% of the tissue (4-6). Due to their
negative charge, GAGs retain water, which composes 65-80% of the tissue weight, contributing
to the compressive properties of cartilage (4-6). Type II collagen, making up approximately 10-
20% of cartilage matrix, primarily contributes to the shear and tensile properties of the tissue (4-
6).
Chondrocytes, the sole cell type in articular cartilage, are responsible for maintaining the
homeostasis of cartilage matrix proteins in response to genetic and environmental signals, such
as growth factors or physiologic loading (7, 8). However, under pathologic, injurious loading, the
chondrocytes shift to a degradative and inflammatory phenotype (9). Since the cartilage is
avascular and aneural, it is susceptible to degeneration in an inflammatory environment, while
lacking the ability to regenerate, leading to diseases such as arthritis (4, 10).
Arthritis is a family of joint diseases characterized degradation of the cartilage matrix,
which leads to joint space narrowing, along with osteophyte formation, bone remodeling, and
synovitis. These progressive changes which are associated with pain, swelling, and loss of
motion (11, 12). There is a variety of types of arthritis, affecting approximately 54 million adults
in the United States (13), with osteoarthritis (OA) and rheumatoid arthritis (RA) as the most
common. OA affects the largest number of people with increasing age, female sex, genetics, joint
injury, and obesity as the primary risk factors (11, 14). RA is an autoimmune disease (12), where
the immune system leads to the inflammatory environment and onset of degeneration and
symptoms (12). Unfortunately, current treatment for OA is limited to non-steroidal, anti-
Page 166
147
inflammatory drugs for mild to moderate cases and joint replacements for severe cases (11).
Disease-modifying antirheumatic drugs have been developed to treat RA; however, they are
effective in only a fraction of individuals and have been associated with significant side effects
(12). Therefore, there remains a need for improved therapies for cartilage injury or arthritis. In
this regard, cartilage tissue engineering not only provides a potential regenerative therapy for
joint diseases but can also provide in vitro model systems for disease modeling and drug
development (15-17). Furthermore, such in vitro models can be used to elucidate mechanisms of
and develop treatments for a variety of other cartilage-associated diseases (18-25). In this regard,
the availability of large numbers of genetically-defined cells that can be chondrogenically
differentiated could serve as a critical component in the development of new cell-based therapies
or in vitro disease models for drug screening.
4.2.1 Development of the protocol
This protocol was developed based on a series of previous studies that elucidated the sequence of
signaling cues required for cartilage development in vivo coupled with various reports of in vitro
chondrogenic differentiation of mouse and human pluripotent stem cells (26-29). In previous
studies, we developed a method to derive chondrocytes from hiPSCs in a stepwise manner via
the paraxial mesodermal lineage (30) based on the mesodermal roadmap developed by Loh, et al.
using embryonic stems cells and iPSCs (26). The next steps toward directed chondrogenic
differentiation were induced using bone morphogenic protein 4 (BMP4) and transforming
growth factor beta 3 (TGF-β3), given their known roles in pre-cartilaginous mesenchymal
condensation and chondrogenic differentiation (29, 31-36). In this process, hiPSC-derived
sclerotome cells were treated with BMP4. The resulting chondroprogenitor cells were then
cultured in a conventional 3D pellet system with TGF-β3 to further specify mesodermal cells
Page 167
148
into the chondrogenic fate. However, despite the robust generation of chondrocytes from hiPSCs
using BMP4 and TGF-β3, we and others have shown significant and unpredictable cellular
heterogeneity within newly formed cartilaginous tissues (30, 37-40).
To determine the identity of such non-chondrocytic cells, bulk and single-cell RNA
sequencing were applied at multiple time points throughout the course of hiPSC chondrogenesis.
These studies revealed that the primary off-target cells were of neural and melanocytic lineages
(37, 38). With the analysis of the gene regulatory networks, we identified that Wnts and
melanocyte inducing transcription factor (MITF) are the primary hub genes responsible for off-
target neurogenesis and melanogenesis during hiPSC chondrogenic differentiation, respectively.
Thus, in the improved protocol, we use small molecules to inhibit Wnt and MITF signaling
during chondrogenic pellet culture, significantly enhancing the efficiency and homogeneity of
hiPSC chondrogenesis. We further validated our optimized protocol using multiple hiPSC lines,
histological and quantitative biochemical analysis of cartilage matrix production, and real-time
quantitative polymerase chain reaction (RT-qPCR) and single-cell RNA sequencing techniques
to evaluate gene expression (Figure 4.1).
Page 168
149
Figure 4.1 Overview schematic of the protocol. hiPSCs undergo mesodermal differentiation in
monolayer for twelve days. The cells go through the anterior primitive streak, paraxial
mesoderm, early somite, sclerotome, and finally chondroprogenitor stage. Cells are then cultured
in a 3D pellet culture to become chondrocytes and synthesize cartilaginous matrix. The protocol
then has 4 options to either digest the tissue to isolate single cells or validate chondrogenesis
with histology (Saf-O and IHC), biochemical assays (DMMB for sGAG and PicoGreen for
dsDNA), and/or RT-qPCR.
4.2.2 Applications of the protocol
The hiPSC-derived chondrocytes and tissue-engineered cartilage from this protocol can facilitate
the development of patient-specific regenerative approaches for a variety of cartilaginous
disorders including, but not limited to, arthritis, osteochondritis dissecans, relapsing
polychondritis, chondrocalcinosis, cartilaginous tumors, and arthropathies (41). Particularly, our
protocol can allow for in vitro disease modeling and high throughput drug screening (15).
Furthermore, in vitro modeling of specific genetic conditions can be established through targeted
genome engineering of the cells (e.g., CRISPR-Cas9 genome editing) with isogenic controls or
patient-derived iPSCs, in conjunction with simulation of a diseased environment (e.g.,
inflammatory cytokines) (16, 42, 43). Furthermore, since the protocol follows the developmental
lineage, such models allow investigation of the mechanisms underlying developmental disorders,
Page 169
150
such as skeletal dysplasias, chondrodysplasias, collagenopathies, and aggrecanopathies (41).
Additionally, the protocol can be applied to cartilage tissue engineering and other topics
in the musculoskeletal field. Studies can be developed to investigate mechanisms that promote or
repress chondrogenic differentiation to improve tissue engineering and regenerative strategies.
For example, various forms of loading such as osmotic, compressive, and shear forces can be
applied at different magnitudes, time points, and regimens to optimize matrix production and
mechanical properties (44). The similarity between hiPSC-derived chondrocytes and primary
chondrocytes allows for the study of fundamental questions regarding cell physiology, such as
mechanisms of chondrocyte mechanobiology (e.g., role of ion channels, integrins, and other
mechanotransduction pathways) (45, 46), the development and physiology of the chondrocyte
circadian rhythm, and the cells’ responses to metabolic syndrome and inflammation.
Furthermore, the rapid expansion of genome engineering in the cartilage field provides the
opportunity to apply principals of synthetic biology for the development of “smart,” self-
regulating cells or mechanogenetic gene circuits in human cells (45, 47-49). Therefore, the
ability to generate a large number of chondrogenically differentiated cells from hiPSCs provides
the opportunity for numerous advances in cartilage research, including other types of
cartilaginous tissues (50).
4.2.3 Comparison with other methods
To tissue-engineer cartilage, a culture system is needed to differentiate and culture chondrocytes
that can synthesize and accumulate cartilaginous matrix, with or without a biomaterial scaffold
(6). A variety of cell types have also been used for this purpose including primary chondrocytes,
adult multipotent stem cells, and pluripotent stem cells (6). While primary chondrocytes can
synthesize a cartilaginous matrix in 3D, they are limited in their expansion potential and undergo
Page 170
151
dedifferentiation with passage in monolayer (51). Additionally, harvesting of human
chondrocytes from a patient results in donor site morbidity, while other sources (e.g., cadaveric,
surgical waste) are difficult to obtain (6). Therefore, adult stem cells, such as bone marrow-
derived mesenchymal stem cells (52) and adipose-derived stem cells (53), have been used for
cartilage tissue engineering. While these methods have been optimized to successfully produce
cartilage-like tissue, adult stem cells represent a heterogeneous population of cells and show
significant donor-to-donor variability. Furthermore, they have limited in vitro expansion
capacity, making it difficult to perform gene editing and clonal isolation (54-56). Induced
pluripotent stems cells have high proliferation and differentiation capacities, allowing for the
study of genetic perturbations. Furthermore, they can be derived in a patient-specific manner
with low or no donor morbidity, and they do not have the ethical concerns associated with
embryonic stem cells (42, 43, 57).
Previously published chondrogenesis protocols of stem cells, including ours, have greatly
extended our knowledge in chondrocyte biology and cartilage tissue engineering; however, many
of these approaches rely on the application of fetal bovine serum (FBS) in culture medium.
While it may enhance cell viability, FBS may also lead to off-target differentiation because of its
undefined chemical composition. Furthermore, lot-to-lot variability of FBS may also make the
protocols difficult to reproduce in different laboratories (34, 35, 58-62). Here, we have
established a chondrogenic differentiation protocol for hiPSCs, using serum-free, chemically
defined medium, that we have validated with 8 hiPSC lines with and without genetic mutations.
4.3 Experimental Design
4.3.1 Cell source
hiPSC lines derived from foreskin or skin fibroblasts with either retroviral or Sendai viral
Page 171
152
induction of the Yamanaka factors (i.e., OCT3/4, SOX2, KLF4, and c-MYC) (56) have been
tested with this protocol. Sendai-viral hiPSCs are free from genomic integration of the
Yamanaka factors, unlike retrovirally-transduced hiPSCs, which have the genes integrated in
their genome (62). The cells are maintained in hiPSC-maintenance medium, avoiding
overcrowding and spontaneous differentiation. In some cases, cleaning, either colony picking or
scraping of differentiated cells, can be carried out. hiPSC maintenance, expansion, and
mesodermal differentiation are performed on vitronectin-coated plates.
4.3.2 Mesodermal differentiation
Approximately 48 hours after passaging, when the hiPSCs have reached 30-40% confluency, the
cells should be induced for mesodermal differentiation in monolayer. The cells are fed every 24
hours with a defined growth factor and small molecule cocktail to guide differentiation. First,
basic fibroblast growth factor (FGF) alongside activation of the TGF and Wnt-signaling
pathways drive the cells into the anterior primitive streak. Wnt activation and FGF are continued
while the TGF/BMP pathway is inhibited on the second day to derive paraxial mesodermal cells.
Next, all these pathways (i.e., FGF, Wnt, and TGF/BMP) are inhibited for differentiation into the
early somite. Wnt inhibition is continued in combination with sonic hedgehog (SHH) activation
for the next three days achieving sclerotome cells. The following 6 days drive the cells into
chondroprogenitors by adding BMP4 each day (Figure 4.1). Notably, mesodermal differentiation
begins along the perimeter of the hiPSC colonies, and cell morphology will change from the
small, round, colonized hiPSCs into longer, more fibrotic cells which spread throughout the
culture plate.
4.3.3 Chondrogenic differentiation
After the 12-day mesodermal differentiation in monolayer, chondroprogenitor cells are
Page 172
153
disassociated with TrypLE into single cells. Cells are resuspended at a concentration of 5 105
cells/mL using complete chondrogenic medium containing TGF-β3. These cells
are transferred to a 15-mL conical tube and centrifuged to form the 3D chondrogenic pellet
culture (Figure 4.1). The media is replaced every 3-4 days with complete chondrogenic medium
until the time point of interest, typically 28 days after chondrogenic induction.
4.3.4 Chondrogenic validation
We use five different methods to validate the outcome of the chondrogenic differentiation:
isolated single cells (chondrocytes), histology, immunohistochemistry (IHC), biochemical
analysis, and RT-qPCR (Figure 4.1).
The chondrogenic pellets are digested to obtain hiPSC-derived chondrocytes at the single
cell level (Figure 4.1). Pellets are washed with DPBS-/- and transferred into a 0.4% (wt/vol) type
II collagenase solution in a conical tube. The tubes are vortexed and placed on an orbital shaker
in a 37 ºC incubator. The tubes should be vortexed every 20 minutes until the pellets are
digested. After pellet digestion, the collagenase solution with single cell suspension is
neutralized with medium containing 10% FBS. Cells are then resuspended in the appropriate
serum-free culture medium for follow up experiments.
Pellets are fixed in 10% neutral buffered formalin overnight, dehydrated in 70% ethanol
at 4 ºC, processed following standard histological protocol (including multiple dehydration
steps), and embedded in paraffin wax. Wax blocks containing the pellets are cut into 8 µm
sections, and sections are placed on microscope slides. Histological slides are stained for the
nuclei and proteoglycans with hematoxylin and Safranin-O, respectively. For IHC, slides are
rehydrated, prepared for staining with a primary antibody of interest, visualized with a secondary
antibody, enzyme conjugation, and a chromogen substrate, and then counterstained for the
Page 173
154
nucleus. Slides are mounted with paramount and cover slipped for imaging and storage. IHC can
be semi-quantified using the previously published ImageJ protocol (64).
For a more quantitative analyses and validation of our protocol, we recommend two
additional methods. The first is the biochemical assay using dimethylmethylene blue (DMMB)
and PicoGreen for quantitative measures of sulfated GAG (sGAG) and DNA contents,
respectively (53). Chondrogenic pellets are washed in DPBS-/-, transferred into a 1.7-mL tube
containing 200 µL of 125 g/mL papain, vortexed, and digested at 65 ºC overnight to release
DNA and sGAG content. The following day, the digested samples are vortexed again and can be
frozen until needed. This protocol measures the sGAG content which can then be normalized to
DNA. The second method is to quantify gene expression using RT-qPCR (53, 65). Each pellet is
washed with DPBS-/- and transferred into a 2-mL tube to be snap frozen in liquid nitrogen and
stored at -80ºC until the RNA isolation.
4.4 Materials
4.4.1 hiPSC culture
1. hiPSC lines. This protocol has been validated with hiPSCs derived from fibroblasts
reprogrammed using Sendai virus or retrovirus. It has also been successful with CRISPR-
Cas9-edited hiPSCs.
2. Culture dishes: 6-well cell culture plate or T75 or T225 cm2 cell culture flask
3. Matrix substrate: 1 µg/mL vitronectin recombinant human protein, truncated (Invitrogen)
in DPBS. Coat plate at 0.5 µg/cm2 and distribute by rocking plate to ensure surface is
coated and incubate at room temperature 1 hour. Plates can be used immediately or stored
at 2-8 °C wrapped in plastic film. If stored, warm for 1 hour at room temperature before
using. Aspirate vitronectin solution and discard before culturing cells.
Page 174
155
4. hiPSC culture medium: Essential 8 flex media (E8; Gibco). Prepare according to
manufacturer instruction and store at 4 ºC for up to 2 weeks. Add 10 µM Y-27632
(STEMCELL Technologies) to E8 medium for first 24 hours after thawing or passaging.
5. Disassociation solution: ReLeSR (STEMCELL Technologies).
6. Cryomedium: PSC cryopreservation kit (Gibco).
7. 2-ml cryotubes.
4.4.2 Mesodermal differentiation
1. Differentiation medium: 242.5 mL Iscove’s Modified Dulbecco’s
Medium, glutaMAX (IMDM; Gibco), 242.5 mL Ham’s F-12 nutrient
mix, glutaMAX (F12; Gibco), 5 mL penicillin-streptomycin (P/S; Gibco), 5 mL Insulin-
Transferrin-Selenium (ITS+; Gibco), 19.5 µL 1-Thioglycerol (Millipore Sigma),
chemically defined concentrated lipids (Thermo Fisher Scientific). Store at 4 ºC for up to
2 weeks.
2. Wash medium: 248.5 mL IMDM, 248.5 mL F12, 5 mL P/S. Store at. 4 ºC for up to 2
weeks.
3. Anterior primitive streak differentiation medium (day 1): 30 ng/mL activin A protein
(R&D Systems), 20 ng/mL recombinant human fibroblast growth factor basic protein
(FGF2; R&D Systems), 4 µM CHIR99021 (Reprocell) in differentiation medium.
4. Paraxial mesoderm differentiation medium (day 2): 20 ng/mL FGF2, 3 µM CHIR99021,
2 µM SB505124 (Tocris Bioscience), 4 µM dorsomorphin (Reprocell) in differentiation
medium.
Page 175
156
5. Early somite differentiation medium (day 3): 2 µM SB505124, 4 µM dorsomorphin, 500
nM PD173074 (Tocris Bioscience), 1 µM Wnt-C59 (Cellagen Technologies) in
differentiation medium.
6. Sclerotome differentiation medium (days 4-6): 1 µM Wnt-C59, 2 µM
purmorphamine (Reprocell) in differentiation medium.
7. Chondroprogenitor differentiation medium (days 7-12): 20 ng/mL recombinant human
bone morphogenic protein 4 (BMP4, R&D Systems) in differentiation medium.
8. Disassociation reagent: TrypLE Select enzyme (Gibco).
9. Neutralization medium: 494 mL Dulbecco’s Modified Eagle
Medium/F12, glutaMAX (DMEM/F12; Gibco), 5 mL fetal bovine serum (FBS; Atlanta
Biologicals).
10. Trypan blue stain (Invitrogen).
11. Cell counter.
12. 50-mL conical tubes.
13. Cryomedium: 16 mL FBS, 2 mL DMEM, 2 mL dimethylsulfoxide (DMSO).
14. 2-ml cryotubes.
4.4.3 Chondrogenic differentiation
1. Dexamethasone: 100 µM. Add 19.62 mg dexamethasone powder (Millipore Sigma) to 1
mL absolute ethanol. Transfer 0.8 mL of the ethanol solution to 39.2 mL DMEM/F12 for
a 1-mM solution. Transfer 4 mL of the 1-mM solution to 36 mL DMEM/F12 to make a
100-μM solution. Store aliquots at -80 °C up to 1 year.
2. Ascorbic acid solution: 50 mg/mL ascorbic acid (Millapore Sigma) in DMEM/F12. Store
aliquots at -80 ºC for up to 3 months.
Page 176
157
3. Proline: 40 mg/mL proline (Millapore Sigma) in DMEM/F12. Store aliquots at -80 ºC for
up to 3 months.
4. Chondrogenic medium: 483 mL DMEM/F12, 5 mL P/S, 5 mL ITS+, 5 mL Modified
Eagle Medium (MEM) with nonessential amino acids (Gibco), 0.5 mL dexamethasone,
0.5 mL 2-Mercaptoethnol (Gibco). Store at 4 ºC for up to 2 weeks.
5. Complete chondrogenic medium: 10 ng/mL recombinant human transforming growth
factor beta 3 protein (TGF-β3; R&D Systems), 1 µM Wnt-C59, 1 µM ML329 (Cayman
Chemical), 0.1% ascorbic acid, 0.1% proline in chondrogenic medium.
6. 15-ml conical tubes.
4.4.4 Chondrogenic validation
Digestion of chondrogenic pellets
1. DPBS-/-.
2. Neutralization medium.
3. Digestion medium: 0.4% wt/vol type II collagenase (Worthington Biochemical, activity
225 units/mL) in warm neutralization medium. Sterile filter and use immediately.
4. 15-mL or 50-mL conical tubes.
5. Orbital shaker.
Histology preparation
1. DPBS-/-.
2. 20-ml glass scintillation vials.
3. 10% neutral buffered formalin.
4. Paraffin.
5. Ethanol, 200 proof.
Page 177
158
6. Xylenes.
7. Microscope slides.
8. Microtome.
Safranin-O staining
1. Safranin-O solution (Millipore Sigma).
2. Harris hematoxylin with glacial acetic acid (Poly Scientific).
3. Ethanol, 200 proof.
4. Xylenes.
5. Differentiation solution (Millipore Sigma).
6. Permount mounting media.
7. Glass cover slips.
Immunohistochemistry
1. Ethanol, 200 proof.
2. Xylenes.
3. COL1A1 antibody (Abcam, cat. no. ab90395).
4. COL2A1 antibody (Iowa Hybridoma Bank, cat. no. II-II6B3-s).
5. COL6A1 antibody (Fitzgerald Industries, cat. no. 70F-CR009X).
6. COL10A1 antibody (Millipore Sigma, cat. no. C7974).
7. Goat anti-mouse antibody (Abcam, cat. no. ab97021).
8. Goat anti-rabbit antibody (Abcam, cat. no. ab6720).
9. Hydrogen peroxide.
10. Methanol.
11. 10% goat serum (Thermo Fisher Scientific).
Page 178
159
12. Pepsin (Thermo Fisher Scientific).
13. Proteinase K (Millipore Sigma): 0.5% wt/vol in TE buffer. Prepare fresh.
14. Quenching solution: 3% hydrogen peroxide in methanol.
15. Histostain Plus Kit (Thermo Fisher Scientific).
16. AEC substrate solution (Abcam).
17. Vector hematoxilyn QS counterstain (Vector Laboratories).
18. VectaMount AQ aqueous mounting medium (Vector Laboratories).
19. Glass cover slips.
20. Aluminum foil.
Biochemical analysis preparation
1. DPBS-/-.
2. Papain solution: 125 mg/L papain, pH 6.5. Weigh 125 mg of papain (Millapore Sigma),
13.8 g of sodium phosphate, 1.46 g ethylenediaminetetraacetic acid (EDTA), and 0.79 g
cysteine hydrochloric acid (HCl). Mix reagents using a stir bar and plate at room
temperature with 1 L ultrapure distilled water. Reagents may take 1.5-2 hours to
dissolve. Adjust pH to 6.5 using approximately 38 mL of 1 N NaOH. Aliquot and store
at -20°C for up to 3 months.
3. 1.7-mL tubes.
RT-qPCR preparation
1. DPBS-/-.
2. 2-ml screw-top tubes.
3. Liquid nitrogen.
4. Primers. See Table 4.1 for suggested chondrogenic primers.
Page 179
160
Table 4.1 RT-qPCR primers.
Target gene Forward primer (5’-3’) Reverse primer (5’-3’)
ACAN CACTTCTGAGTTCGTGGAGG ACTGGACTCAAAAAGCTGGG
COL1A1 TGTTCAGCTTTGTGGACCTC TTCTGTACGCAGGTGATTGG
COL2A1 GGCAATAGCAGGTTCACGTA CTCGATAACAGTCTTGCCCC
COL10A1 CATAAAAGGCCCACTACCCAAC ACCTTGCTCTCCTCTTACTGC
SOX9 CGTCAACGGCTCCAGCAAGAACAA GCCGCTTCTCGCTCTCGTTCAGAAGT
TBP AACCACGGCACTGATTTTCA ACAGCTCCCCACCATATTCT
4.5 Methods
4.5.1 hiPSC culture
≥ 1 hour for coating plate(s), 30 minutes for plating/passaging, 30 minutes for feeding, 2-7 days
for culture
1. Coat a 6-well plate with vitronectin.
2. Thaw a vial of hiPSCs in a 37 ºC water bath.
3. Transfer the cells using sterile serological plastic pipettes into 10 mL of room-
temperature hiPSC maintenance medium in a 15 mL-conical tube.
4. Centrifuge cells at 200 g for 5 min at 23 ºC.
5. Aspirate the supernatant.
6. Add 13 mL hiPSC maintenance medium containing 10 M of Y-27632 to the cell pellet.
Do not pipette up and down, instead gently rock the tube back and forth twice. This will
prevent breaking up the colonies into single cells.
7. Aspirate the vitronectin-PBS-/- solution from plate.
Page 180
161
8. Add 2 mL of cell solution to each well. Gently tilt the plate in a circular motion to
distribute the cells evenly throughout the wells. Failure to do so will cause the cells to
cluster in one area, preventing proper proliferation, which may lead to spontaneous
differentiation.
9. Incubate the plate at 37 ºC.
10. After 24 hours, aspirate the medium from the plate and feed with hiPSC maintenance
medium without Y-27632.
11. Continue cell culture, feeding every day until cells reach approximately 80% confluency.
Cells can be frozen in cryopreservation medium. We typically freeze cells sufficient for
one 6-well plate in 1 mL of cryopreservation medium for future passaging. The split ratio
may vary depending on hiPSC lines.
12. Before passaging, coat the appropriate number of 6-well plates and/or T225 flasks with
vitronectin.
13. Aspirate medium from cell plate.
14. Wash each well with 2 mL of DPBS-/-.
15. Add 1.5 mL of ReLeSR for 1 min at RT.
16. Aspirate off ReLeSR.
17. Incubate plate for 2 min at 37 ºC. If the cells are ≥ 85% confluent or if there is
spontaneous differentiation, the time can be shortened to 1 min.
18. Pipette 2 mL of hiPSC maintenance medium onto the bottom of each well, you should
see the cells lift off with the medium, and transfer into a conical tube using sterile
Page 181
162
serological plastic pipettes. Do not pipette up and down.
19. Tap the plate several times.
20. Centrifuge cells at 200 g for 5 min at 23 ºC.
21. Aspirate the supernatant.
22. Resuspend cells in hiPSC maintenance medium containing 10 M of Y-27632. Do not
pipette up and down, instead gently rock the tube back and forth twice. This will prevent
breaking up the colonies into single cells.
23. Aspirate the vitronectin-PBS-/- solution from plate(s) / flask(s).
24. Add cell solution to plate(s) / flask(s). Gently tilt the plate(s) / flask(s) in a circular
motion to distribute the cells throughout the wells. Failure to do so will cause the cells to
cluster, preventing proper proliferation and leading to spontaneous differentiation
25. Check cell density in microscope. If too confluent, remove some of the cell solution and
add up volume with maintenance medium containing Y-27632.
26. Culture for at least 48 h until 30-40% confluent. Too high cell density inhibits
mesodermal differentiation. Too low cell density prevents adhesion and increases cell
death. (see Notes 1-3)
4.5.2 Mesodermal differentiation
30 minutes – 1 hour for feeding, 12 days for culture
1. Warm appropriate volume of wash and differentiation medium in 37 ºC water bath. For
days 2-12: if fed medium changes from orange to yellow in color after 24 h, suggesting
high metabolic activity of the cells, increase differentiation medium volume by 1 mL per
Page 182
163
well and / or 5 mL per flask.
2. Make the appropriate differentiation medium for the corresponding day by adding the
correct growth factors. Day 1: anterior primitive streak; day 2: paraxial mesoderm; day 3:
early somite; days 4-6: sclerotome; days7-12: chondroprogenitor.
3. Aspirate maintenance media from plate(s) / flask(s).
4. Rinse plate(s) / flask(s) with wash medium.
5. Add complete differentiation medium.
6. Incubate plate at 37 ºC.
7. Feed the cells every 24 h with mesodermal differentiation medium supplemented with the
appropriate growth factor and small molecule cocktails. Note that more-than-usual cell
death may be observed after day 3 due to the inhibition of several major signaling
pathways. When switching to a new set of the growth factors and small molecules (i.e.,
days 1, 2, 3, 4, and 7), it is critical to feed at the 24-hour time points to ensure proper
lineage specification. Cells can be harvested after days 1, 2, 3, 6, and 12 if the specific
lineage stages are of interest to the experiment (e.g., RT-qPCR). (see Notes 4-7)
8. On day 13, aspirate medium from cell plate(s) / flask(s).
9. Wash with DPBS-/-
10. Pipette TrypLE disassociation reagent onto plate(s) / flask(s).
2 mL per well of 6-well plate and 20-25 mL per T225 flask.
11. Incubate for 3 min at 37 ºC.
12. Gently tap plate(s) / flask(s) several times to disassociate cells. You should see cells
Page 183
164
floating in medium (see Note 8).
13. Add slightly more than an equal volume of neutralization media.
14. Pipette half of the medium into a conical tube.
15. Pipette up and down the other half in the wells / flask(s) twice to lift any remaining cells.
Transfer to a conical tube.
16. Rinse the wells / flask(s) twice with neutralization medium and transfer to tubes each
time.
17. Centrifuge cell tubes at 300 g for 5 min at 23 ºC.
18. Aspirate supernatant.
19. Chondroprogenitor cells can undergo chondrogenesis or frozen in cryomedium for future
chondrogenesis.
4.5.3 Chondrogenic differentiation
1-3 hours for pelleting, 28 days for differentiation
1. Warm neutralization and chondrogenic medium in 37 ºC water bath.
2. Add TGF-β3, ascorbate, proline, Wnt-C59, and ML329 to make complete chondrogenic
medium.
3. Resuspend chondroprogenitor cells in complete chondrogenic medium. Combine cells if
you have multiple tubes.
4. Stain 10 µL of the cell solution with 10 µL of Trypan Blue to count cell number on an
automated cell counter or hemocytometer.
5. Using the cell count, calculate the volume needed for a concentration of 5 105 cells per
Page 184
165
1 mL of complete chondrogenic medium (see Note 9).
6. Pipette the cell solution to make pellet cultures – 1 mL per 15 mL conical tube.
7. Centrifuge tubes at 300 g for 5 min at 23 ºC.
8. Loosen the caps of the tubes in the biosafety cabinet. The tubes must be loosened to
provide oxygen supply to the cells. The cap should however still be screwed on so that it
cannot be lifted off to prevent contamination.
9. Incubate the tubes at 37 ºC.
10. Check tubes to confirm pellet formation after 24 hours (see Note 10).
11. Feed pellets every 3 – 4 days.
12. Warm incomplete chondrogenic medium in 37 ºC water bath.
13. Add TGF-β3, ascorbate, proline, Wnt-C59, and ML329 to make complete chondrogenic
medium.
14. Aspirate medium from the conical tube with a 9” Pasteur pipette.
15. Use at 12-mL stereological pipette to feed 6 tubes at a time with 2 mL per pellet. Ensure
lids remain loose (see Notes 11-12).
16. Chondrogenic pellets can be harvested at various time points as desired. Proceed to
section 3.4. We recommend weekly harvest on days 7, 14, 21, 28, and 42. In general,
cells start to deposit matrix 14 days post-chondrogenic induction (i.e., apparent pellet
enlargement). Additionally, chondrocytes usually can be observed approximately 14-21
days post-chondrogenic induction.
17. 28 days after chondrogenic induction, most of the cells should have differentiated into
Page 185
166
chondrocytes and formed cartilaginous matrix. We recommend digesting the
chondrogenic pellet to retrieve the chondrocytes at a single cell level (3.4.1) for further
experimentation or using histology/IHC (3.4.2-4), biochemical assays (3.4.5), and/or RT-
qPCR (3.4.6) to confirm and study chondrogenic differentiation.
4.5.4 Chondrogenic validation
Digestion of chondrogenic pellets
3 hours
1. Warm neutralization and desired medium for the experiment. If plating the cells, we
recommend using the neutralization medium.
2. Prepare digestion medium.
3. Aspirate medium from pellets.
4. Wash each pellet with 2-3 mL of DPBS-/-.
5. Transfer pellets into a tube with digestion medium. Use an equal volume of digestion
medium to the number of pellets being digested (± 1 mL). A 15-mL or 50-mL tube
should not exceed 8 mL or 25 mL of digestion medium, respectively.
6. Vortex the tube(s) and shake manually then place on an orbital shaker (80 RPMs) in a 37
ºC incubator.
7. Every 20 min remove the tube(s) from the incubator to vortex and check digestion
progress.
8. After approximately 2 h, the matrix of chondrogenic pellets should be mostly digested.
The length of digestion time needed depends on harvest time point and size of the tube.
Page 186
167
For example, pellets harvested prior 28 days post-chondrogenic induction may only
require 1 hr to achieve full digestion. Additionally, we have observed faster digestion
using 50-mL conical tubes (see Note 13).
9. Add neutralization medium to the tube(s) bringing the volume to 12 mL or 45 mL.
10. Centrifuge tube(s) at 300 g for 5 min at 23 ºC.
11. Aspirate supernatant.
12. Resuspend in neutralization medium.
13. Stain 10 µL of the cell solution with 10 µL of Trypan Blue to count on an automated cell
counter or hemocytometer.
14. Centrifuge at 300 g for 5 min at 23 ºC.
15. Resuspend the cells at the desired concentration. The number of cells retrieved per pellet
may depend on hiPSC lines. On average, we get approximately 6.5 105 cells per pellet.
The cell recovery rate may be increased if multiple pellets from the same group are
pooled and digested together. If plating the chondrocytes, we recommend adding the cells
to desired dish(s) and incubating for 6-8 h. This provides sufficient time for the cells to
adhere without dedifferentiating and losing their phenotype.
Histology preparation
At least 3 days
1. Transfer pellet(s) into a scintillation vial with 10% (vol/vol) neutral buffered formalin.
2. Store at 4 ºC overnight.
3. Remove formalin and add 70% (vol/vol) ethanol. Pellets can be stored in 70% (vol/vol)
Page 187
168
ethanol at 4ºC long term.
4. Transfer pellet into a plastic cassette for processing. Biopsy foam pads can be used to
sandwich the chondrogenic pellet within the cassette to prevent it from falling out.
Processing can be done by hand or using a tissue processor.
5. Dehydrate the chondrogenic pellet for 30 min in 80% (vol/vol) ethanol followed by 30
min in 100% (vol/vol) ethanol. Exchange the 100% (vol/vol) ethanol for another 30 min.
Pellets can be stored in 100% (vol/vol) ethanol overnight.
6. Clear the pellet for 30 min with a 1:1 solution of ethanol and xylene followed by 30 min
of 100% (vol/vol) xylene. Exchange the 100% (vol/vol) xylene for another 30 min.
7. Begin embedding the pellet for 1 h with a 1:1 solution of xylene and paraffin wax at 60
ºC followed by 1 h with 100% (vol/vol) paraffin at 60 ºC. Exchange the 100% (vol/vol)
paraffin for another 1 h at 60 ºC.
8. Transfer pellet into an embedding tray, place cassette on top, and fill with paraffin wax.
9. Store for a few hours or overnight at 4 ºC to harden wax. Pellets can be stored in wax
long term at RT.
10. Cut the wax blocks in 8-µm-thick sections and place a short ribbon of sections in a 42 ºC
water bath.
11. Remove a ribbon of sections from the water bath by allowing it to attach to a microscope
slide. In general, there should be 3-5 sections per ribbon on each slide. Slides can be
stored long term at RT.
12. Dry slides in a warmer at 37 ºC for staining or in a drying rack at RT for storage
overnight.
Page 188
169
13. Perform desired histology such as staining for sGAGs with Safranin-O or labeling of
collagenous proteins with immunohistochemistry.
Safranin-O and hematoxylin staining
1-2 hours
1. Remove paraffin wax with 3 rounds of soaking slide(s) in xylene for 5 min.
2. Rehydrate tissue with 100% (vol/vol) ethanol for 2 min followed by 50% (vol/vol)
ethanol for 2 min.
3. Rinse slide(s) in tap water for 2 min.
4. Remove all excess water.
5. Stain slide(s) with Harris hematoxylin for 3 min (nuclei will be stained purple). Filter
Harris hematoxylin staining solution before each use to remove potential precipitations
and avoid deposition of particulates on slide. Do not reuse stain more than ten times.
6. Rinse slide(s) in tap water for 3 min.
7. Differentiate slide(s) in differentiation solution (acid alcohol) for 15 sec.
8. Rinse slide(s) in tap water for 3 min.
9. Stain slide(s) with Safranin-O for 3-5 min (sGAGs will be stained pink/red). Do not reuse
stain more than 10 times.
10. Rinse slide(s) multiple times with 100% (vol/vol) ethanol until no excess stain remains.
11. Let slide(s) partially dry before rinsing with xylene for 30 sec.
12. Mount slide(s) with permount, coverslip, let dry, and image (see Note 14).
Page 189
170
Immunohistochemistry
4-5 hours
1. Remove paraffin wax with 3 rounds of soaking slide(s) in xylene for 5 min.
2. Rehydrate tissue by washing slide(s) with 100% (vol/vol) ethanol for 5 min twice, 95%
(vol/vol) ethanol for 5 min twice, 70% (vol/vol) ethanol for 5 min, 50% (vol/vol) ethanol
for 5 min, and then tap water for 5 min. Do not let the slides dry out. Place slide(s) in a
container with a hydrated paper towel.
3. Perform antigen retrieval by adding 100 µL of proteinase K or pepsin on the slide and
incubating (see Table 4.2 for recommended reagent, timing, and temperature).
4. Wash the slide(s) with DPBS-/- for 5 min twice.
5. Quench the slide(s) for 1 h in 3% (vol/vol) hydrogen peroxide in methanol.
6. Wash the slide(s) with DPBS-/- for 5 min three times.
7. Use a Pap-pen to circle each piece of tissue on the slide(s) to prevent solution spreading.
8. Perform blocking by adding a couple drops (enough to cover the tissue) of 2.5% (vol/vol)
goat serum to each piece of tissue for 1 h at RT.
9. Blot excess serum from bottom of inclined slide. Do not rinse.
10. Stain tissue with primary antibody for 1 h at RT in hydrated container. See Table 4.2 for
antibodies and dilutions. Do not add primary antibody to one piece of tissue. Instead add
more goat serum from step viii to serve as negative control.
11. Wash the slide(s) with DPBS-/- for 5 min three times.
12. Add a couple drops (enough to cover the tissue) of the proper secondary antibody at a
Page 190
171
1:500 dilution for 30 min at RT (Table 4.2).
13. Wash the slide(s) with DPBS for 5 min three times.
14. Combine 5 mL of ImmPact AEC diluent, 2 drops of AEC reagent 1, 3 drops of AEC
reagent 2, and 2 drops of AEC reagent 3. Mix well.
15. Add AEC solution to the slide(s) and incubate at RT. See Table 4.2 for timing (see Note
15).
16. Wash the slide(s) with distilled water for 5 min.
17. Rinse the slide(s) in tap water.
18. Cover tissue sections with Vector Hematoxylin QS counterstain for 45 sec.
19. Rinse the slide(s) in tap water for 10 sec. Do not dehydrate slides.
20. Mount the slide(s) with VectaMount AQ aqueous mounting medium, coverslip, let dry,
and image.
Table 4.2 IHC antibodies.
Antibody Host Manufacturer Cat. No. Retrieval
(Time, Temp)
Dilution AEC
Time
COL1A1 Mouse Abcam ab90395 Pepsin
(5 min, RT)
1:800 2 min
COL2A1 Mouse Iowa Hybridoma
Bank
II-II6B3-s
Proteinase K
(3 min, 37 ºC)
1:10 2.5 min
COL6A1 Rabbit Fitzgerald
Industries
70F-CR009X Proteinase K
(3 min, 37 ºC)
1:1000 2.5 min
COL10A1 Mouse Millipore Sigma C7974 Pepsin
(5 min, RT)
1:200 2 min
Goat anti-mouse
IgG, biotin
Goat Abcam ab97021 1:500
Page 191
172
Goat anti-rabbit
IgG, biotin
Goat Abcam ab6720 1:500
Biochemical assay preparation
1 day for sample preparation, 2-3 hour for assay
1. Wash chondrogenic pellets with 2-3 mL of DPBS-/-.
2. Transfer each pellet into a 1.7-mL tube with 200 µL of papain and vortex.
3. Digest tissue at 65 ºC overnight and vortex. Use of cap-lock on the tubes may help
securely seal the tube at high temperatures. Samples can be stored at -20 ºC until analysis.
4. Follow previously published protocol to determine sGAG/DNA ratio using DMMB and
PicoGreen Assays (53).
RT-qPCR Preparation
1-2 days
1. Clean work area with RNaseZap solution.
2. Wash chondrogenic pellets with 2-3 mL DPBS.
3. Transfer pellet into a tube and snap freeze in liquid nitrogen. We generally use screw-top
microcentrifuge tubes with O-ring cap. Samples can be frozen at -80 ºC until analysis.
4. Follow previously published protocol to determine gene expression using RT-qPCR (53,
65).
4.6 Anticipated Results
During regular culture, the hiPSCs have a small, round phenotype, and they grow in dense, round
colonies (Figure 4.2a). When passaging and plating, caution must be taken to prevent from
Page 192
173
breaking up the colonies too much as the hiPSCs tend to trigger cell death or spontaneously
differentiate if cultured as single cells. In our laboratory, most hiPSC lines had optimal survival
and growth on vitronectin-coated 6-well plates while there was lower viability when cultured on
10-cm dishes. Some hiPSC lines that were originally maintained on other substrates (e.g.,
Matrigel) were able to be switched onto vitronectin substrate by culturing cells on vitronectin-
coated plates for several passages before mesodermal differentiation. After mesodermal
induction, hiPSCs begin to differentiate at the edges of the colonies. As the cells become more
elongated and spread out, the center of the colony begins to differentiate as well (Figure 4.2b-e).
Some cell death may be observed after the third day of mesodermal induction due to the
inhibition of multiple essential pathways; however, the remaining cells should recover and
differentiate as expected. Excess cell death may occur if hiPSCs are induced at too low of a cell
density. In our previous study, we have demonstrated a decrease in pluripotent genes OCT4 and
NANOG throughout the mesodermal differentiation with an upregulation of MIXL1 indicating
anterior primitive streak cells after day 1, MSGN1 indicating the paraxial mesoderm after day 2,
and PARAXIS indicating the early somite state after day 3 (30). After day 6, the cells are
committed into the sclerotome lineage with an upregulation of SOX9, PDGFRA, and PDGFRB.
The upregulation of PDGFRβ continues through the chondroprogenitor stage alongside COL2A1
expression after day 12 of mesodermal induction (30). We have also demonstrated that the
chondroprogenitors express the surface markers CD166, CD146, and PDGFRβ, but not CD45,
using flow cytometric analysis (37). Cells in the chondroprogenitor stage should be fully
differentiated and spread out throughout the dish with an elongated phenotype (Figure 4.2f). If
the mesodermal differentiation is induced at too high of a cell density; however, one might
observe formation of nodules in the center of cell colonies (Figure 4.2g) and/or formation of a
Page 193
174
cell “sheet” that often spontaneously lifts off the culture plates, resulting into failed mesodermal
lineage commitment.
Figure 4.2 Phase contrast images of cells throughout mesodermal differentiation. (A) Induce
cells when they are 30-40% confluent. (B-F) As cells differentiate, from (B) anterior primitive
streak, (C) paraxial mesoderm, (D) early somite, (E) sclerotome, to (F) chondroprogenitor, they
spread and become more spindled. (G) If cells are induced at too high of a density, they may not
fully differentiate and form nodules in the center of the colonies. Scale bar = 1 mm.
Chondroprogenitor cells in monolayer culture (i.e., day 12 of mesodermal differentiation)
should be disassociated into single cells to form 3D, chondrogenic pellets for chondrogenesis.
Cells should lift off the bottom of the culture dish in the TrypLE solution after a 3 min
incubation and gentle tapping. If cells do not lift off, increase the time of incubation. We have
tried using cell scrapers in instances where cells do not lift after 8 min of incubation; however,
the cells had poor viability and failed to form chondrogenic pellets. We average a yield of 6 x
107 chondroprogenitor cells per T225 flask; however, this value may vary due to different hiPSC
lines and plating density used. Approximately 24 h after chondrogenic induction, we observe the
formation of a spherical pellet in the bottom of the conical tube. Occasionally, the pellet may
need additional time before the proper shape is visible. Pellets that do not form after 48 h should
be discarded. This may be caused by improper mesodermal differentiation or incompatible
disassociation reagent (cell line specific). In some cell lines, we have found disassociating
chondroprogenitor cells in 0.05 mM EDTA and/or differentiating cells on Matrigel has improved
pelleting and chondrogenesis. As pellet cultures approach 28 days, the medium may begin to turn
yellow due to increased cellular metabolic activity, which can be prevented by increasing the
Page 194
175
volume of chondrogenic medium during feeding. In other cases, some excess matrix may have
formed apart from the pellet in the tube; removing this during feeding will also reduce the rate
the culture medium is metabolized. If black dots appear on the pellets, suggestive of off-target
differentiation and presence of melanocytes, increasing the concentration of ML329 will inhibit
MITF and potential melanin production. Throughout chondrogenic culture, the pellets should
grow due to accumulation of cartilaginous matrix but maintain a relatively spherical shape. We
have reported a significant increase in chondrogenic genes SOX9, COL2A1, and ACAN from the
chondroprogenitor stage through day 42 culture, while fibrocartilage and hypertrophic cartilage
markers COL1A1 and COL10A1, respectively, remain relatively low until later time points
(Figure 4.3a-e) (30, 37).
Figure 4.3 Anticipated results – gene expression and matrix quantification. (A-C) Chondrogenic
transcription factor SOX9 gene expression should increase early, followed by matrix genes
COL2A1 and ACAN. (D-E) Relative to the expression of COL2A1, lower gene expression of
fibrocartilage and hypertrophic cartilage markers COL1A1 and COL10A1, respectively, was
observed. (F) sGAG/DNA ratio should increase throughout chondrogenesis, reaching 20-30
ng/ng at day 28 and over 40 ng/ng at day 42. Mean ± SEM, n=4. *p<0.05 compared to previous
time point.
To obtain hiPSC-derived chondrocytes, day 28 chondrogenic pellets can be digested with
Page 195
176
type 2 collagenase. Vortexing the tubes every 20 min will facilitate the breakdown of the tissue
matrix, thus increasing digestion efficiency. However, if the chunks of pellets remain intact after
a lengthy period of digestion, “smashing” the pellets using a tool with a flat surface (e.g., spatula
with shovel head, or lid of an Eppendorf tube) in a sterile Petri dish may help break up the tissue
matrix. We do not recommend digesting for longer than 2.5 h as it may decrease the cell
viability. Occasionally, small pieces of tissue may still be visible after the digestion process;
however, most of the cells will be dissociated from the matrix. We average a cell viability of
85% and approximately 6.5 x 10⁵ cells per digested pellet. We found an increase in viability and
efficiency when more pellets are digested at a time and 50-mL conical tubes are used.
To validate and visualize the cartilage matrix produced by hiPSC-derived chondrocytes,
we use Safranin-O staining to reveal the presence of sGAGs (Figure 4.4a-c), IHC to label various
types of collagens (Figure 4.4d-f), biochemical DMMB assay to quantify sGAG production
(Figure 4.3f), and RT-qPCR to analyze gene expression (Figure 4.3a-e). We normally observe
round chondrocyte-like cells within cartilaginous matrix with robust, homogenous Safranin-O
staining (Figure 4.4a-c). If cellular heterogeneity is observed, concentration of Wnt-C59 and
ML329 can be increased to further prevent off-target differentiation. If there is little or no sGAG
staining, differentiation was unsuccessful, which can be attributed to several issues addressed in
Notes. If hiPSCs have successfully differentiated into chondrocytes, there should also be
significant labeling for COL2A1 (Figure 4.4d), with minimal labeling of COL1A1 (Figure 4.4e)
and COL10A1 (Figure 4.4f). Biochemical analysis and RT-qPCR for these genes can further
support successful chondrogenesis. Chondrogenic pellets typically have an sGAG/DNA ratio
between 20-30 ng/ng in day 28 pellet samples, which can continue to increase with more time in
culture (Figure 4.3f). A significant upregulation of SOX9, COL2A1, and ACAN gene expression
Page 196
177
should be detected in the pellets at day 28 versus day 0 pellet samples (Figure 4.3a-c), while the
expression levels of COL1A1 and COL10A1 remain low until later time points (Figure 4.3d-e).
The hiPSC-derived chondrocytes and cartilage matrix generated using this protocol can be used
for a variety of experiments including genetic engineering, in vitro disease modeling, and tissue
engineering.
Figure 4.4 Anticipated results – histology. (A-C) Robust, homogenous safranin-O staining for
sGAGs in three different cell lines. (D-F) Pellet in panel a with IHC labeling of COL2A1 (D),
COL1A1 (E), and COL10A1 (F). Scale bar = 500 µm.
Page 197
178
4.7 Troubleshooting Notes
1. If hiPSCs are confluent in 2-3 days, the cell concentration of the frozen stock is too high.
Plate one vial to more than one 6-well plate (e.g., 1.5 or 2 x 6-well plates).
2. If there is hiPSC death, cells were plated at too low of a density, media was changed too
soon, Y-27632 was not added, cells were washed and fed too aggressively, or the cell line
is not compatible with vitronectin. Reduce number of wells and/or flasks you are plating,
make sure media is changed 24 hours after plating (or try extending the time slightly
longer than 24 hours), make sure to add Y-27632 to media for the first 24 hours, pipette
media slowly and onto the side of the dish (not directly on the cells), or try other matrix
substrates such as Matrigel.
3. If there is spontaneous differentiation, colonies were not maintained but broken into
single cells or cells were plated at an incorrect density. Do not pipette up and down when
plating and passaging hiPSCs or change the number of wells you plate per cell vial/plate.
You can scrape differentiated cells to clean the wells.
4. If there is cell death, cells were induced at too low of a density or there was spontaneous
differentiation. Wait longer after passaging to increase cell density before induction or
clean wells before passaging by scraping differentiated cells.
5. If cells are not differentiating or nodules form in the center of colonies, cells were
induced at too high of a density. Passage cells at a lower density and induce cells 48
hours after passaging.
6. If cells lift off the culture surface, cells were induced at too high of a density or were
washed and fed too aggressively. Passage cells at a lower density, induce 48 hours after
Page 198
179
passaging, and pipette media slowly on the side of the dish (not directly on cells).
7. If media is yellow, cells were metabolic and fed too low of a media volume. Increase
volume by 1 mL per well (6-well plate) or 5 mL per T225 flask.
8. If cells are still stuck to the dish, they did not fully lift off the plate during disassociation.
Place dishes with fresh TrypLE back in the incubator for 2 min and increase the force of
slap without causing media to splash on top of dish.
9. If you do not have enough cells to create the desired number of chondrogenic pellets,
reduce the number of cells per chondrogenic pellet (e.g., 2.5 x 10⁵ or 3 x 10⁵).
10. If pellets have not formed, wait an additional 24 hours to allow them to form. Otherwise,
dissociation reagent (TrypLE) was too aggressive, cells did not differentiate properly, or
the cell line is incompatible with vitronectin. Use a milder disassociation reagent (e.g.,
0.05 mM EDTA), decrease cell density at time of mesodermal induction, or try a
different matrix substrate such as Matrigel.
11. If media is yellow, pellets have grown significantly and are metabolically active or extra
matrix is being produced around walls of the conical tube in addition to the pellet.
Increase chondrogenic medium volume by 1 mL per tube or aspirate away excess matrix
with Pasteur pipette during aspiration.
12. If black spots appear on pellet, melanin is being produced. Increase concentration of
ML329.
13. If chondrogenic pellets are not fully digested, the collagenase solution is not strong
enough or the matrix is too dense. Ensure proper ratio of collagenase to medium was used
and test different lots of collagenase. Remove pellets from tube and place in an empty
Page 199
180
well of 6-well plate. Use a closed, sterile 1.7-mL Eppendorf to gently “smash” pellets.
Use collagenase solution to rinse the well and transfer back to tube. Digest an additional
20 min.
14. If there is cell and matrix heterogeneity in chondrogenic pellet, Wnt and MITF signaling
is occurring and causing off-target differentiation. Increase concentrations of Wnt-C59
and ML329.
15. If the positive control is not showing stain, development time is too short. Increase time
of development with AEC.
4.8 References
1. J. M. Mansour, in Kinesiology: The Mechanics and Pathomechanics of Human Movement.
(2003), vol. 2e, chap. 5, pp. 66-75.
2. F. Guilak, Biomechanical factors in osteoarthritis. Best Pract Res Clin Rheumatol 25, 815-
823 (2011).
3. J. Antons et al., Zone-dependent mechanical properties of human articular cartilage obtained
by indentation measurements. J Mater Sci Mater Med 29, 57 (2018).
4. A. J. Sophia Fox, A. Bedi, S. A. Rodeo, The basic science of articular cartilage: structure,
composition, and function. Sports Health 1, 461-468 (2009).
5. Y. Xia et al., in Biophysics and Biochemistry of Cartilage by NMR and MRI. (The Royal
Society of Chemistry, 2017), pp. 1-43.
6. L. Zhang, J. Hu, K. A. Athanasiou, The role of tissue engineering in articular cartilage repair
and regeneration. Crit Rev Biomed Eng 37, 1-57 (2009).
7. F. Guilak, C. Hung, in Basic Orthopaedic Biomechanics and Mechanobiology, V. Mow, R.
Huiskes, Eds. (Lippincott-Raven Publishers, Philadelphia, 2005), pp. 179-207.
8. A. C. Shieh, K. A. Athanasiou, Principles of cell mechanics for cartilage tissue engineering.
Ann Biomed Eng 31, 1-11 (2003).
9. J. Sanchez-Adams, H. A. Leddy, A. L. McNulty, C. J. O'Conor, F. Guilak, The
mechanobiology of articular cartilage: bearing the burden of osteoarthritis. Curr Rheumatol
Rep 16, 451 (2014).
10. F. Berenbaum, T. M. Griffin, R. Liu-Bryan, Review: Metabolic Regulation of Inflammation
in Osteoarthritis. Arthritis Rheumatol 69, 9-21 (2017).
11. F. C. Breedveld, Osteoarthritis--the impact of a serious disease. Rheumatology (Oxford) 43
Suppl 1, i4-8 (2004).
Page 200
181
12. J. S. Smolen, D. Aletaha, I. B. McInnes, Rheumatoid arthritis. Lancet 388, 2023-2038
(2016).
13. K. E. Barbour et al., Geographic Variations in Arthritis Prevalence, Health-Related
Characteristics, and Management - United States, 2015. MMWR Surveill Summ 67, 1-28
(2018).
14. C. Palazzo, C. Nguyen, M. M. Lefevre-Colau, F. Rannou, S. Poiraudeau, Risk factors and
burden of osteoarthritis. Ann Phys Rehabil Med 59, 134-138 (2016).
15. V. P. Willard et al., Use of cartilage derived from murine induced pluripotent stem cells for
osteoarthritis drug screening. Arthritis Rheumatol 66, 3062-3072 (2014).
16. S. S. Adkar et al., Genome Engineering for Personalized Arthritis Therapeutics. Trends Mol
Med 23, 917-931 (2017).
17. S. K. O'Connor, D. B. Katz, S. J. Oswald, L. Groneck, F. Guilak, Formation of
Osteochondral Organoids from Murine Induced Pluripotent Stem Cells. Tissue Eng Part A,
(2020).
18. B. Saitta et al., Patient-derived skeletal dysplasia induced pluripotent stem cells display
abnormal chondrogenic marker expression and regulation by BMP2 and TGFbeta1. Stem
Cells Dev 23, 1464-1478 (2014).
19. Y. Nur Patria et al., CRISPR/Cas9 gene editing of a SOX9 reporter human iPSC line to
produce two TRPV4 patient heterozygous missense mutant iPSC lines, MCRIi001-A-3
(TRPV4 p.F273L) and MCRIi001-A-4 (TRPV4 p.P799L). Stem Cell Res 48, 101942 (2020).
20. H. Liu et al., The potential of induced pluripotent stem cells as a tool to study skeletal
dysplasias and cartilage-related pathologic conditions. Osteoarthritis Cartilage 25, 616-624
(2017).
21. C. Sanjurjo-Rodriguez et al., Versatility of Induced Pluripotent Stem Cells (iPSCs) for
Improving the Knowledge on Musculoskeletal Diseases. Int J Mol Sci 21, (2020).
22. A. Yamashita et al., Statin treatment rescues FGFR3 skeletal dysplasia phenotypes. Nature
513, 507-511 (2014).
23. Y. Matsumoto et al., Induced pluripotent stem cells from patients with human fibrodysplasia
ossificans progressiva show increased mineralization and cartilage formation. Orphanet J
Rare Dis 8, 190 (2013).
24. E. E. Miller et al., EIF4A3 deficient human iPSCs and mouse models demonstrate neural
crest defects that underlie Richieri-Costa-Pereira syndrome. Hum Mol Genet 26, 2177-2191
(2017).
25. M. Okada et al., Modeling type II collagenopathy skeletal dysplasia by directed conversion
and induced pluripotent stem cells. Hum Mol Genet 24, 299-313 (2015).
26. K. M. Loh et al., Mapping the Pairwise Choices Leading from Pluripotency to Human Bone,
Heart, and Other Mesoderm Cell Types. Cell 166, 451-467 (2016).
27. K. Umeda et al., Human chondrogenic paraxial mesoderm, directed specification and
prospective isolation from pluripotent stem cells. Sci Rep 2, 455 (2012).
28. R. A. Oldershaw et al., Directed differentiation of human embryonic stem cells toward
Page 201
182
chondrocytes. Nat Biotechnol 28, 1187-1194 (2010).
29. B. O. Diekman et al., Cartilage tissue engineering using differentiated and purified induced
pluripotent stem cells. Proc Natl Acad Sci U S A 109, 19172-19177 (2012).
30. S. S. Adkar et al., Step-Wise Chondrogenesis of Human Induced Pluripotent Stem Cells and
Purification Via a Reporter Allele Generated by CRISPR-Cas9 Genome Editing. Stem Cells
37, 65-76 (2019).
31. J. Lim et al., BMP-Smad4 signaling is required for precartilaginous mesenchymal
condensation independent of Sox9 in the mouse. Dev Biol 400, 132-138 (2015).
32. A. S. Patil, R. B. Sable, R. M. Kothari, An update on transforming growth factor-beta (TGF-
beta): sources, types, functions and clinical applicability for cartilage/bone healing. J Cell
Physiol 226, 3094-3103 (2011).
33. Q. O. Tang et al., TGF-beta3: A potential biological therapy for enhancing chondrogenesis.
Expert Opin Biol Ther 9, 689-701 (2009).
34. A. M. Craft et al., Generation of articular chondrocytes from human pluripotent stem cells.
Nat Biotechnol 33, 638-645 (2015).
35. A. Yamashita et al., Generation of scaffoldless hyaline cartilaginous tissue from human
iPSCs. Stem Cell Reports 4, 404-418 (2015).
36. B. Johnstone, T. M. Hering, A. I. Caplan, V. M. Goldberg, J. U. Yoo, In vitro chondrogenesis
of bone marrow-derived mesenchymal progenitor cells. Exp Cell Res 238, 265-272 (1998).
37. A. Dicks et al., Prospective isolation of chondroprogenitors from human iPSCs based on cell
surface markers identified using a CRISPR-Cas9-generated reporter. Stem Cell Res Ther 11,
66 (2020).
38. C. L. Wu et al., Single cell transcriptomic analysis of human pluripotent stem cell
chondrogenesis. Nat Commun 12, 362 (2021).
39. A. Yamashita et al., Considerations in hiPSC-derived cartilage for articular cartilage repair.
Inflamm Regen 38, 17 (2018).
40. C. Murphy, A. Mobasheri, Z. Tancos, J. Kobolak, A. Dinnyes, The Potency of Induced
Pluripotent Stem Cells in Cartilage Regeneration and Osteoarthritis Treatment. Adv Exp Med
Biol 1079, 55-68 (2018).
41. Y. Krishnan, A. J. Grodzinsky, Cartilage diseases. Matrix Biol 71-72, 51-69 (2018).
42. K. Musunuru, Genome editing of human pluripotent stem cells to generate human cellular
disease models. Dis Model Mech 6, 896-904 (2013).
43. S. Yumlu et al., Gene editing and clonal isolation of human induced pluripotent stem cells
using CRISPR/Cas9. Methods 121-122, 29-44 (2017).
44. C. J. O'Conor, N. Case, F. Guilak, Mechanical regulation of chondrogenesis. Stem Cell Res
Ther 4, 61 (2013).
45. J. M. Brunger, A. Zutshi, V. P. Willard, C. A. Gersbach, F. Guilak, Genome Engineering of
Stem Cells for Autonomously Regulated, Closed-Loop Delivery of Biologic Drugs. Stem
Cell Reports 8, 1202-1213 (2017).
Page 202
183
46. L. Pferdehirt, A. K. Ross, J. M. Brunger, F. Guilak, A Synthetic Gene Circuit for Self-
Regulating Delivery of Biologic Drugs in Engineered Tissues. Tissue Eng Part A 25, 809-
820 (2019).
47. R. J. Nims et al., A synthetic mechanogenetic gene circuit for autonomous drug delivery in
engineered tissues. Sci Adv 7, (2021).
48. F. Guilak et al., Designer Stem Cells: Genome Engineering and the Next Generation of Cell-
Based Therapies. J Orthop Res 37, 1287-1293 (2019).
49. R. Tang et al., Differentiation of human induced pluripotent stem cells into nucleus pulposus-
like cells. Stem Cell Res Ther 9, 61 (2018).
50. S. Thirion, F. Berenbaum, Culture and phenotyping of chondrocytes in primary culture.
Methods Mol Med 100, 1-14 (2004).
51. D. Nasrabadi, S. Rezaeiani, M. B. Eslaminejad, A. Shabani, Improved Protocol for
Chondrogenic Differentiation of Bone Marrow Derived Mesenchymal Stem Cells -Effect of
PTHrP and FGF-2 on TGFbeta1/BMP2-Induced Chondrocytes Hypertrophy. Stem Cell Rev
Rep 14, 755-766 (2018).
52. B. T. Estes, B. O. Diekman, J. M. Gimble, F. Guilak, Isolation of adipose-derived stem cells
and their induction to a chondrogenic phenotype. Nat Protoc 5, 1294-1311 (2010).
53. A. I. Caplan, Mesenchymal Stem Cells: Time to Change the Name! Stem Cells Transl Med 6,
1445-1451 (2017).
54. Y. K. Yang, C. R. Ogando, C. Wang See, T. Y. Chang, G. A. Barabino, Changes in
phenotype and differentiation potential of human mesenchymal stem cells aging in vitro.
Stem Cell Res Ther 9, 131 (2018).
55. K. Drela, L. Stanaszek, A. Nowakowski, Z. Kuczynska, B. Lukomska, Experimental
Strategies of Mesenchymal Stem Cell Propagation: Adverse Events and Potential Risk of
Functional Changes. Stem Cells Int 2019, 7012692 (2019).
56. K. Takahashi et al., Induction of pluripotent stem cells from adult human fibroblasts by
defined factors. Cell 131, 861-872 (2007).
57. H. Nejadnik et al., Improved approach for chondrogenic differentiation of human induced
pluripotent stem cells. Stem Cell Rev Rep 11, 242-253 (2015).
58. J. Lee et al., Early induction of a prechondrogenic population allows efficient generation of
stable chondrocytes from human induced pluripotent stem cells. FASEB J 29, 3399-3410
(2015).
59. W. M. Suchorska, E. Augustyniak, M. Richter, T. Trzeciak, Comparison of Four Protocols to
Generate Chondrocyte-Like Cells from Human Induced Pluripotent Stem Cells (hiPSCs).
Stem Cell Rev Rep 13, 299-308 (2017).
60. Q. Lian et al., Functional mesenchymal stem cells derived from human induced pluripotent
stem cells attenuate limb ischemia in mice. Circulation 121, 1113-1123 (2010).
61. M. Xu, G. Shaw, M. Murphy, F. Barry, Induced Pluripotent Stem Cell-Derived
Mesenchymal Stromal Cells Are Functionally and Genetically Different From Bone Marrow-
Derived Mesenchymal Stromal Cells. Stem Cells 37, 754-765 (2019).
Page 203
184
62. I. P. Chen et al., Induced pluripotent stem cell reprogramming by integration-free Sendai
virus vectors from peripheral blood of patients with craniometaphyseal dysplasia. Cell
Reprogram 15, 503-513 (2013).
63. A. R. Crowe, W. Yue, Semi-quantitative Determination of Protein Expression using
Immunohistochemistry Staining and Analysis: An Integrated Protocol. Bio Protoc 9, (2019).
64. T. Nolan, R. E. Hands, S. A. Bustin, Quantification of mRNA using real-time RT-PCR. Nat
Protoc 1, 1559-1582 (2006).
Page 204
185
Chapter 5
Skeletal Dysplasia-causing TRPV4 Mutations
Suppress the Hypertrophic Differentiation of
Human iPSC-derived Chondrocytes Partially adapted from: Dicks A, Maksaev GI, Harissa Z, Savadipour A, Tang R, Steward N,
Liedtke W, Nichols CG, Wu CL*, Guilak F*. Skeletal dysplasia-causing TRPV4 mutations
suppress the hypertrophic differentiation of human iPSC-derived chondrocytes.
bioRxiv 2021.06.15.448562; doi: 10.1101/2021.06.15.448562. eLife. Submitted.
5.1 Abstract
Mutations in the TRPV4 ion channel can lead to a range of skeletal dysplasias. However, the
mechanisms by which TRPV4 mutations lead to distinct disease severity remain unknown. Here,
we use CRISPR-Cas9-edited human induced pluripotent stem cells (hiPSCs) harboring either the
mild V620I or lethal T89I mutations to elucidate the differential effects on channel function and
chondrogenic differentiation. We found that hiPSC-derived chondrocytes with the V620I
mutation exhibited increased basal currents through TRPV4. However, both mutations showed
more rapid calcium signaling with a reduced overall magnitude in response to TRPV4 agonist
GSK1016790A compared to wildtype. There were no differences in overall cartilaginous matrix
production, but the V620I mutation resulted in reduced mechanical properties of cartilage matrix
later in chondrogenesis. mRNA sequencing revealed that both mutations upregulated several
anterior HOX genes and downregulated antioxidant genes CAT and GSTA1 throughout
chondrogenesis. BMP4 treatment upregulated several essential hypertrophic genes in WT
chondrocytes; however, this hypertrophic maturation response was inhibited in mutant
Page 205
186
chondrocytes. These results indicate that the TRPV4 mutations alter BMP signaling in
chondrocytes and prevent proper chondrocyte hypertrophy, as a potential mechanism for
dysfunctional skeletal development. Our findings provide potential therapeutic targets for
developing treatments for TRPV4-mediated skeletal dysplasias.
5.2 Introduction
Skeletal dysplasias comprise a heterogeneous group of over 450 bone and cartilage diseases with
an overall birth incidence of 1 in 5000 (1-5). In the specific cases of moderate autosomal-
dominant brachyolmia and severe metatropic dysplasia, among other dysplasias, arthropathies,
and neuropathies, the disease is caused by mutations in transient receptor potential vanilloid 4
(TRPV4), a non-selective cation channel (6, 7). For example, a V620I substitution (exon 12,
G858A) in TRPV4 is responsible for moderate brachyolmia, which exhibits short stature,
scoliosis, and delayed development of deformed bones (6, 8, 9). These features, albeit more
severe, are also present in metatropic dysplasia. Metatropic dysplasia can be caused by a TRPV4
T89I substitution (exon 2, C366T) and leads to joint contractures, disproportionate
measurements, and, in severe cases, death due to small chest size and cardiopulmonary
compromise (6, 9, 10). Both V620I and T89I TRPV4 mutations are considered gain-of-function
variants (11, 12). Given the essential role of TRPV4 during chondrogenesis (13) and cartilage
homeostasis (14), it is hypothesized that TRPV4 mutations may affect the cartilaginous phase of
endochondral ossification during skeletal development.
Endochondral ossification is a process by which bone tissue is created from a cartilage
template (2, 10, 15, 16). During this process, chondrocytes transition from maintaining the
homeostasis of cartilage, regulated by transcription factor SRY-box containing gene 9 (SOX9)
(16-19), to hypertrophy. Hypertrophy is driven by runt related transcription factor 2 (RUNX2)
Page 206
187
and bone morphogenic protein (BMP) signaling (16, 18, 19) and leads to chondrocyte apoptosis
or differentiation into osteoblasts to form bone (16, 18, 19). However, how TRPV4 and its
signaling cascades regulate endochondral ossification remains to be determined.
The activation of TRPV4 increases SOX9 expression (13) and prevents chondrocyte
hypertrophy and endochondral ossification (18, 20-23). One study found that overexpressing
wildtype Trpv4 in mouse embryos increased intracellular calcium (Ca2+) concentration and
delayed bone mineralization (24), a potential link between intracellular Ca2+, such as with gain-
of-function TRPV4 mutations, and delayed endochondral ossification. Our previous study also
observed increased expression of follistatin (FST), a potent BMP inhibitor, and delayed
hypertrophy in porcine chondrocytes overexpressing human V620I- and T89I-TRPV4 (12, 25).
While previous studies have greatly increased our knowledge of the influence of TRPV4
mutations on chondrogenesis and hypertrophy, most of them often involved animal models (12,
24) or cells (2, 8, 10, 11) (12) overexpressing mutant TRPV4. Therefore, these approaches may
not completely recapitulate the effect of TRPV4 mutations on human chondrogenesis.
Human induced pluripotent stem cells (hiPSCs), which are derived from adult somatic
cells (26), offer a system for modeling human disease to study the effect of mutations throughout
differentiation (27, 28). In fact, two studies have used patient-derived hiPSCs with TRPV4
mutations to study lethal and non-lethal metatropic dysplasia-causing variants I604M (29) and
L619F (30), respectively. However, patient samples are often challenging to procure due to the
rarity of skeletal dysplasias. In this regard, CRISPR-Cas9 technology allows the creation of
hiPSC lines harboring various mutations along with isogenic controls (i.e., wildtype; WT).
The goal of this study was to elucidate the detailed molecular mechanisms underlying
how two TRPV4 gain-of-function mutations lead to strikingly distinct severities of skeletal
Page 207
188
dysplasias (i.e., moderate brachyolmia vs. lethal metatropic dysplasia). To achieve this goal, we
used CRISPR-Cas9 gene-edited hiPSC lines bearing either the V620I or T89I TRPV4 mutation,
and their isogenic WT control, to delineate the effects of TRPV4 mutations on chondrogenesis
and hypertrophy using RNA sequencing and transcriptomic analysis. We further examined the
effects of the mutations on channel function and matrix production and properties. We
hypothesized the V620I and T89I TRPV4 mutations would enhance chondrogenesis with
differing degrees of altered hypertrophy. This study will improve our understanding of the role
of TRPV4 in chondrocyte homeostasis and maturation and lay the foundation for treatment and
prevention of TRPV4-mediated dysplasias.
5.3 Methods
5.3.1 hiPSC culture
The BJFF.6 (BJFF) human iPSC line (Washington University Genome Engineering and iPSC
Center (GEiC), St. Louis, MO), was used in this study as the isogenic-wildtype control.
CRISPR-Cas9 gene editing was used to create the V620I and T89I mutations in the BJFF cell
line as described previously (31). The hiPSCs were maintained on vitronectin (VTN-N; cat. num.
A14700; Thermo Fisher Scientific, Waltham, MA)-coated plates in Essential 8 Flex medium
(E8; cat. num. A2858501; Gibco, Thermo Fisher Scientific, Waltham, MA). Medium was
changed daily until cells were passaged at 80-90% confluency (medium supplemented with Y-
27632 [cat. num. 72304; STEMCELL Technologies, Vancouver, Canada] for 24 hours) or
induced into mesodermal differentiation at 30-40% confluency.
5.3.2 Mesodermal differentiation
The hiPSCs were differentiated through the mesodermal pathway as previously described (31-
33). In brief, cells were fed daily with different cocktails of growth factors and small molecules
Page 208
189
for twelve days in mesodermal differentiation medium and driven through the anterior primitive
streak (1 day; 30 ng/ml Activin [cat. num. 338-AC; R&D Systems, Minneapolis, MN], 20 ng/ml
FGF2 [cat. num. 233-FB-025/CF; R&D Systems, Minneapolis, MN], 4 µM CHIR99021 [cat.
num. 04-0004-02; Reprocell, Beltsville, MD]), paraxial mesoderm (1 day; 20 ng/ml FGF2, 3 µM
CHIR99021, 2 µM SB505124 [cat. num. 3263; Tocris Bioscience, Bristol, UK], 4 µM
dorsomorphin [DM; cat. num. 04-0024; Reprocell, Beltsville, MD]), early somite (1 day; 2 µM
SB505124, 4 µM dorsomorphin, 500 nM PD173074 [cat. num. 3044; Tocris Bioscience, Bristol,
UK], 1 µM Wnt-C59 [cat. num. C7641-2s; Cellagen Technologies, San Diego, CA]), and
sclerotome (3 days; 1 µM Wnt-C59, 2 µM purmorphamine [cat. num. 04-0009; Reprocell,
Beltsville, MD]) into chondroprogenitor cells (6 days; 20 ng/ml BMP4 [cat. num. 314-BP-
010CF; R&D Systems, Minneapolis, MN]). Mesodermal differentiation medium had a base of
Iscove’s Modified Dulbecco’s Medium, glutaMAX (IMDM; cat. num. 31980097; Gibco,
Thermo Fisher Scientific, Waltham, MA) and Ham’s F-12 nutrient mix, glutaMAX (F12; cat.
num. 31765092; Gibco, Thermo Fisher Scientific, Waltham, MA) in equal parts supplemented
with 1% penicillin-streptomycin (P/S; cat. num. 15140122; Gibco, Thermo Fisher Scientific,
Waltham, MA), 1% Insulin-Transferrin-Selenium (ITS+; cat. num. 41400045; Gibco, Thermo
Fisher Scientific, Waltham, MA), 1% chemically defined concentrated lipids (cat. num.
11905031; Thermo Fisher Scientific, Waltham, MA), and 450 µM 1-thioglycerol (cat. num.
M6145; Millipore Sigma, St. Louis, MO). The chondroprogenitor cells were then disassociated
for chondrogenic differentiation.
5.3.3 Chondrogenic differentiation with 3D pellet culture
Cells were differentiated into chondrocytes using a high-density, suspension pellet culture (31-
33). In summary, cells were resuspended in chondrogenic medium: Dulbecco’s Modified Eagle
Page 209
190
Medium/F12, glutaMAX (DMEM/F12; cat. num. 10565042; Gibco, Thermo Fisher Scientific,
Waltham, MA), 1% P/S, 1% ITS+, 1% Modified Eagle Medium (MEM) with nonessential amino
acids (NEAA; cat. num. 11140050; Gibco, Thermo Fisher Scientific, Waltham, MA), 0.1%
dexamethasone (Dex; cat. num. D4902; Millipore Sigma, St. Louis, MO), and 0.1% 2-
Mercaptoethnol (2-ME; cat. num. 21985023; Gibco, Thermo Fisher Scientific, Waltham, MA)
supplemented with 0.1% L-ascorbic acid (ascorbate; cat. num. A8960; Millipore Sigma, St.
Louis, MO), 0.1% L-proline (proline; cat. num. P5607; Millipore Sigma, St. Louis, MO), 10
ng/ml human transforming growth factor-β3 (TGFβ3; cat. num. 243-B3-010/CF; R&D Systems,
Minneapolis, MN), 1 µM Wnt-C59, and 1 µM ML329 (cat. num. 22481; Cayman Chemical, Ann
Arbor, MI) at 5 x 10⁵ cells/mL. One mL of the cell solution was added to a 15 mL-conical tube
(cat. num. 430790; Corning, Corning, NY) and centrifuged to form the spherical pellets. Pellets
were fed every 3-4 days with complete chondrogenic medium until the desired time point.
Several timepoints of the chondrogenic pellets were used to study chondrocyte maturation (7, 14,
28, and 42 days), mechanical properties (28 and 42 days), hypertrophy (28 days) or, after
digestion to single cell day-28 chondrocytes, on Ca2+ signaling in response to pharmacological
activation of TRPV4.
5.3.4 BMP4 treatment to promote hypertrophic differentiation
Some day-28 pellets were also further differentiated for an additional 4 weeks to examine the
effects of the mutations on chondrocyte hypertrophy. Pellets were cultured with complete
chondrogenic medium with either TGFβ3 (10 ng/mL) alone, BMP4 (50 ng/mL) alone, or a
combination of TGFβ3 (10 ng/mL) and BMP4 (50 ng/mL).
5.3.5 Dissociation of chondrogenic pellets to obtain single cell hiPSC-derived
chondrocytes
To isolated hiPSC-derived chondrocytes, day-28 chondrogenic pellets were rinsed and placed in
Page 210
191
an equal volume (1 pellet per 1 mL) of digestion medium (0.4% w/v type II collagenase [cat.
num. LS00417; Worthington Biochemical, Lakewood, NJ] in DMEM/F12 with 10% fetal bovine
serum [FBS; cat. num. S11550; Atlanta Biologicals, R&D Systems, Minneapolis, MN]). The
tubes were placed on an orbital shaker at 37ºC and vortexed every 20 minutes for approximately
2 hours. Once the tissue was digested and could no longer be seen by the naked eye, the
digestion medium was neutralized in DMEM/F12 medium containing 10% FBS. These cells
were used for patch clamping and confocal experiments.
5.3.6 TRPV4 agonists and antagonists
Solutions were prepared immediately before experiments and held at room temperature.
GSK1016790A (GSK101; cat. num. G0798; Sigma Aldrich, St. Louis, MO) and/or GSK205 (cat.
num. AOB1612 1263130-79-5; AOBIOUS, Gloucester, MA), in addition to DMSO for a vehicle
control, were added to assay buffer (Hanks' Balanced Salt Solution [HBSS; cat. num. 14025076;
Gibco, Thermo Fisher Scientific, Waltham, MA] with 2% HEPES [cat. num. 15630130; Gibco,
Thermo Fisher Scientific, Waltham, MA]) at 2x the desired concentration (20 nM GSK101, 40
µM GSK205). Solutions were made at 2x the desired concentration because they would be
mixed at an equal volume of assay buffer after capturing a baseline fluorescence in Ca2+
signaling experiments.
5.3.7 Patch clamping
Isolated chondrocytes were kept on ice and used for patching within 36 hours. Patch-clamp
experiments were carried out at RT under two conditions. Single-channel measurements were
made in excised inside-out membrane patches in a symmetric potassium chloride (KCl) solution
(148mM KCl, 1mM K2EDTA, 1mM EGTA, 10mM HEPES, pH 7.4). Channel activation was
achieved by bath perfusion with the same buffer solution containing 10 nM GSK101. Blocking
Page 211
192
was performed using the same buffer solution supplied with both 10 nM GSK101 and 20 µM
GSK205. Recordings were made at -30mV membrane. Whole-cell currents were recorded using
an external sodium chloride (NaCl) solution (150 mM NaCl, 5 mM KCl, 1 mM EGTA, 10 mM
Glucose, 10 mM HEPES, and 10 µM free Ca2+) and KCl pipette solution as used for single-
channel recordings. Inhibition of basal currents was performed by pre-incubation of the cells in
external solution supplied with 20 µM GSK205 for 20 min before patching; the drug was also
present in the bath at the same concentration during the experiment. Data were acquired at 3
kHz, low-pass filtered at 1 kHz with Axopatch 1D patch-clamp amplifier and digitized with
Digidata 1320 digitizer (Molecular Devices, San Jose, CA). Data analysis was performed using
the pClamp software suite (Molecular Devices, San Jose, CA). Pipettes with 2.0-4.0 MOhm
resistance in symmetric 150 mM KCl buffer were pulled from Kimble Chase 2502 soda lime
glass with a Sutter P-86 puller (Sutter Instruments, Novato, CA).
5.3.8 Confocal imaging of Ca2+ signaling
hiPSC-derived chondrocytes from digested pellets were plated in DMEM medium containing
10% FBS at 2.1 x 10⁴ cells/cm2 in 35 mm-dishes for 6-8 hours to allow the cells to adhere
without dedifferentiating. Cells were then rinsed and stained for 30 min with Fluo-4 AM (cat.
num. F14201; Thermo Fisher Scientific, Waltham, MA), Fura Red AM ((cat. num. F3021;
Thermo Fisher Scientific, Waltham, MA), and sulfinpyrazone ( cat. num. S9509-5G; Sigma
Aldrich, St. Louis, MO) with 20 mM GSK205 or 1000x DMSO (vehicle control). The dye
solution was replaced with assay buffer before imaging cells on a confocal microscope (LSM
880; Zeiss, Oberkochen, Germany) at baseline for the first 100 frames (approximately 6 min).
Then, an equal volume of a 2x solution of GSK101 or GSK101 and GSK205 was added, and
imaging continued for an additional 300 frames (approximately 20 min). Fiji software (ImageJ,
Page 212
193
version 2.1.0) was used to locate cells and quantify the ratiometric fluorescence intensity
(Intensityfluo-4/Intensityfura red). In brief, .czi files were imported into Fiji and the channels were
split. After applying the median filter, the image calculator divided the green channel by the red.
A Z-projection was performed based on the maximum fluorescence of the red channel (to ensure
that all cells were identified even in groups were there was no increase in Ca2+ signaling). A
threshold and watershed binary were then applied, and measurements were set for a cell size of
100-infinity. Outlines were projected, and the mean fluorescence of each cell was measured over
time. The average fluorescence was plotted for all the cells in the group over time. Area under
the curve and time of response were calculated to quantify differences between groups. Cells
were classified as responders if they had a fluorescence greater than the baseline mean plus 3
times the standard deviation in at least a quarter of the frames. Time of response was the time of
the first frame in which the cell responded for at least 2 consecutive frames. The fluorescence
was measured for all the cells in the frame of view as technical replicates for 2 experimental
replicates.
5.3.9 AFM measurement of neocartilage mechanical properties
Day-28 and day-42 hiPSC-derived pellets were rinsed in PBS and snap frozen in optimal cutting
temperature (OCT; cat. num. 4583; Sakura Finetek, Torrance, CA) medium and stored at -80 ºC.
Pellets were cryosectioned using cryofilm (type 2C(10); Section-Lab, Hiroshima, Japan) in
multiple different regions of the pellet (i.e., zones). The 10 µm cryosection with cryofilm was
fixed on a microscope slide using chitosan and stored at 4 ºC overnight. The next day,
cryosections were mechanically loaded using an atomic force microscopy (AFM, MFP-3D Bio,
Asylum Research, Goleta, CA) as previously described (34). Briefly, the samples were tested in
PBS at 37 ºC to maintain hydration and mimic physiologic conditions, respectively. The sections
Page 213
194
were mechanically probed using a silicon cantilever with a spherical tip (5μm diameter, k~7.83
N/m, Novascan Technologies, Ames, IA). An area of 10 μm2 with 0.5 μm intervals (400
indentations) was loaded to 300 nN with the loading rate of 10 μm/sec. Multiple locations from
different sites of each zone and pellet were loaded as replicates. The curves obtained from AFM
were imported into a custom written MATLAB code to determine the mechanical properties of
the pellets. Using contact point extrapolation, the contact point between the cantilever’s tip and
the tissue was detected, and the elastic modulus was calculated using a modified Hertz model
(34-38).
5.3.10 Histology
Chondrogenic pellets at days 7, 14, 28, 42, and 56 (with and without BMP4) were fixed and
dehydrated in sequential steps of increasing ethanol and xylene solutions until embedded in
paraffin wax. Wax blocks were cut into 8 µm sections on microscope slides for histological and
immunohistochemical analysis. Slides were rehydrated in ethanol and water and the nuclei were
stained with Harris hematoxylin and sGAGs with Safranin-O. Antigen retrieval was performed
on rehydrated slides followed by blocking, the addition of primary and secondary antibodies, and
AEC development to label collagen proteins (COL1A1, COL2A1, COL6A1, and COL10A1) and
Vector Hematoxylin QS counterstain.
5.3.11 Biochemical analysis
Chondrogenic pellets at days 7, 14, 28, and 42 were washed with PBS and digested in papain
overnight at 65ºC. sGAG and dsDNA content were measured using the dimethylmethylene blue
(DMMB) and PicoGreen assays (Quant-iT™ PicoGreen™ dsDNA Assay Kit; cat. num. P7589;
Thermo Fisher Scientific, Waltham, MA) respectively. sGAG content was normalized to
dsDNA. Three to four independent experiments were performed with 3-4 technical replicates per
Page 214
195
group.
5.3.12 Western blot
Day-56 pellets treated with TGFβ3, TGFβ3+BMP4, or BMP4 were digested to single cells, as
described above, and lysed in RIPA buffer (cat. num. 9806S; Cell Signaling Technology,
Danvers, MA) with protease inhibitor (cat. num. 87786; Thermo Fisher Scientific, Waltham,
MA). Protein concentration was then measured using the BCA Assay (Pierce). Twenty
micrograms of proteins for each well were separated on 10% sodium dodecyl sulfate-
polyacrylamide gel electrophoresis gel with pre-stained molecular weight markers (cat. num.
161-0374; Bio-Rad, Hercules, CA) and transferred to a polyvinylidene fluoride (PVDF)
membrane. The PVDF membrane blot was cut through the line at 50 kD. Two blots were
incubated overnight at 4 °C with the primary antibodies: anti-COL10A1 (1:500; cat. num. PA5-
97603; Thermo Fisher Scientific, Waltham, MA) and anti-GAPDH (1:30000; cat. num. 60004-1-
Ig; Proteintech, Rosemont, IL), as the loading control. TidyBlot-Reagent-HRP (1:1000; cat. num.
147711; Bio-RAD, Hercules, CA) and horse anti-mouse IgG secondary antibody (1:3000; cat.
num. 7076; Cell Signaling, Danvers, MA) were then used respectively. Immunoblots were
imaged and analyzed using the iBright FL1000 Imaging System (Thermo Fisher Scientific,
Waltham, MA).
5.3.13 RNA isolation
Chondrogenic pellets at days 7, 14, 28, 42, and 56 were washed with PBS, lysed, snap frozen,
and homogenized. RNA was isolated using the Total RNA Purification Plus Kit (cat. num.
48400; Norgen Biotek, Thorold, Canada) and used immediately for either RT-qPCR or RNA-
seq.
Page 215
196
5.3.14 Gene expression with RT-qPCR
Isolated RNA was reverse transcribed into cDNA. The cDNA was used to run real-time,
quantitative PCR using Fast SYBR green. Gene expression was analyzed using the ∆∆CT method
with hiPSC as the reference time point and TBP as the housekeeping gene (39). Three to four
independent experiments were performed with 3-4 technical replicates per group. Primers can be
found in the Table 5.1.
Table 5.1 Primers for RT-qPCR.
Gene Forward Primer (3’) Reverse Primer (5’)
ACAN CACTTCTGAGTTCGTGGAGG ACTGGACTCAAAAAGCTGGG
COL1A1 TGTTCAGCTTTGTGGACCTC TTCTGTACGCAGGTGATTGG
COL2A1 GGCAATAGCAGGTTCACGTA CTCGATAACAGTCTTGCCCC
COL10A1 CATAAAAGGCCCACTACCCAAC ACCTTGCTCTCCTCTTACTGC
FST TGTGCCCTGACAGTAAGTCG GTCTTCCGAAATGGAGTTGC
S100B AGGGAGGGAGACAAGCACAA ACTCGTGGCAGGCAGTAGTA
SOX9 CGTCAACGGCTCCAGCAAGAACAA GCCGCTTCTCGCTCTCGTTCAGAAGT
TRPV4 AGAACTTGGGCATCATCAACGAG GTTCGAGTTCTTGTTCAGTTCCAC
TBP AACCACGGCACTGATTTTCA ACAGCTCCCCACCATATTCT
5.3.15 Genome-wide mRNA sequencing
Isolated RNA was treated with DNase (cat. num. 25720; Norgen Biotek, Thorold, Canada) and
cleaned (cat. num. 43200; Norgen Biotek, Thorold, Canada) according to manufacturer
instructions prior to submitting to the Genome Technology Access Center at Washington
University in St. Louis (GTAC). Libraries were prepared according to manufacturer’s protocol.
Samples were indexed, pooled, and sequenced at a depth of 30 million reads per sample on an
Illumina NovaSeq 6000. Basecalls and demultiplexing were performed with Illumina’s bcl2fastq
Page 216
197
software and a custom python demultiplexing program with a maximum of one mismatch in the
indexing read. RNA-seq reads were then aligned to the Ensembl release 76 primary assembly
with STAR version 2.5.1a (40). Gene counts were derived from the number of uniquely aligned
unambiguous reads by Subread:featureCount version 1.4.6-p5 (41). Isoform expression of known
Ensembl transcripts were estimated with Salmon version 0.8.2 (42). Sequencing performance
was assessed for the total number of aligned reads, total number of uniquely aligned reads, and
features detected. The ribosomal fraction, known junction saturation, and read distribution over
known gene models were quantified with RSeQC version 2.6.2 (43).
5.3.16 Transcriptomic analysis of sequencing datasets
R and the DESeq2 package were used to read un-normalized gene counts, and genes were
removed if they had counts lower than 200 (44). Regularized-logarithm transformed data of the
samples were visualized with the Pheatmap package (45) function on the calculated Euclidean
distances between samples or with the ggplot2 package (46) to create a principle component
analysis (PCA). The transformed data was also used to determine the top 5000 most variable
genes across the samples. The replicates, from DESeq data, for each group were averaged
together, and the up- and down-regulated differentially expressed genes (DEGs) were
determined. The total number of DEGs was plotted using GraphPad Prism. At day 28, the V620I
and T89I lines were compared to WT. At day 56, TGFβ3-treated V620I and T89I were
compared to TGFβ3-treated WT, and BMP4-treated groups were compared to their respective
TGFβ3-treated group of the same line (e.g., BMP4-treated WT vs. TGFβ3-treated WT). Genes
were considered differentially expressed if adjusted p value (padj) < 0.1 and log2(fold change) ≥ 1
or ≤ -1. The intersecting and unique DEGs were determined and plotted with the intersect and
setdiff, and venn.diagram (VennDiagram package (47)) functions. The fold changes of common
Page 217
198
chondrogenic, hypertrophic, growth factor, Ca2+ signaling, and off-target genes, in the top 5000
most variable genes, were plotted using the pheatmap function. The top 25 most up-regulated
and down-regulated for each group, based on log2(fold change), and the log2(fold change) of that
gene for the other group(s) were also plotted with the pheatmap. Gene lists (e.g., intersected
genes, genes upregulated with BMP4 treatment) were entered into g:profiler to determine
associated Gene Ontology (GO) Biological Processes, Molecular Functions, Cellular
Components, KEGG pathways, Reactome pathways, and Human Phenotype (HP) Ontologies
(48). The negative log10 of the adjusted p value for each term was plotted with GraphPad Prism
or using a function to scale circle diameter to the p value in Illustrator.
The gap statistic method determined the ideal number of clusters resulting from BMP4
treatment was either 1 or 9. We then performed k-means clustering with 9 clusters and plotted
the gene expression trends for each gene within the cluster with the average expression trend
overlaying for each cell line of the largest cluster using the tidyverse package (49). The genes in
each cluster, with the normalized counts for each group, are listed in Table S5.1. The largest
cluster was plotted using the Cytoscape String app’s protein interaction to create a protein-
protein network (50, 51). Using the average log fold change with BMP4 treatment across lines,
the network was propagated using the Diffusion app, and functional enrichment with
EnrichmentMap was performed on the network (52). We then created a network connecting the
genes to their associated genes with black lines and to their associated Gene Ontology processes
using grey lines. We colored the gene circles with three colors representing the log fold change
of that gene in each line. The white arrows were added to the color scale legend to indicate
maximum log fold change for each line.
Page 218
199
5.3.17 Statistical analysis
Data were graphed and analyzed using GraphPad Prism (Version 9.1.0). Outliers were removed
from the data using the ROUT method (Q = 1%), and the data were tested for normality with the
Shapiro-Wilk test ( = 0.05). For RT-qPCR, normally distributed data were analyzed within
each time point using a Brown-Forsythe and Welch one-way ANOVA with multiple
comparisons (mean of each column, cell line, with every other column). A Kruskal-Wallis test
was used if data was not normally distributed. For biochemical analysis, mechanical properties,
and area under the curve, and time of response, data were analyzed using an ordinary two-way
ANOVA, comparing each cell with all other cells, with Tukey’s post-hoc test. Area under the
curve was quantified for plots over time considering a baseline of Y=0, ignoring peaks less than
10% of the distance from minimum to maximum Y, and all peaks going over the baseline.
5.4 Results
5.4.1 Mutant TRPV4 has altered response to chemical agonist GSK101
We first assessed TRPV4 channel function and alterations in Ca2+ signaling due to the V620I and
T89I mutations in day-28 hiPSC-derived chondrocytes using electrophysiology and fluorescence
imaging. Using whole-cell patch clamping, we measured the basal membrane current of the
hiPSC-derived chondrocytes from the mutated and WT lines. V620I-TRPV4 had the highest
basal currents at both 70 and -70 mV (70/-70 mV pA/pF – WT: 18.52/5.93 vs. V602I:
77.79/55.33 vs. T89I: 40.97/50.13; Figure 5.1A). However, when TRPV4 was inhibited with
GSK205 (53), TRPV4-specfic chemical antagonist, the three lines had similar, decreased
currents (70/-70 mV – WT: 18.72/14.36 pA/pF vs. V620I: 13.55/9.15 pA/pF vs. T89I:
29.27/13.8 pA/pF; Figure 5.1A). To capture the specific current through TRPV4, we took the
difference of the basal current (no GSK205) and the average TRPV-inhibited current (with
Page 219
200
GSK205). TRPV4 inhibition caused a significant change in current in V620I at both 70 and -70
mV (70 mV – V620I: Δ64.28 vs. WT: Δ -0.19, p=0.0379 and T89I: Δ11.67, p<0.0001; -70 mV –
V620I: Δ46.13 vs. WT: Δ -8.47, p<0.0001 and T89I: Δ36.33, p=0.0057; Figure 5.1B).
Interestingly, T89I-TRPV4 was not significantly different from WT despite also causing a gain-
of-function in recombinant channels (11).
Next, we activated WT and mutant TRPV4 with chemical agonist GSK1016790A
(GSK101) (54) and found that the mutations decreased the cellular response to the agonist,
resulting in reduced Ca2+ signaling. These results were supported using two methods: inside-out
excised patches and confocal imaging of Ca2+ signaling (Figure 5.1C-D). The representative
traces of inside-out patches showed increased current through the patch with the addition of
GSK101 and the attenuation by GSK205 (Figure 5.1C). GSK205 continued to block the channel
and prevented another increase in current despite the addition of GSK101. Though the unitary
currents were indistinguishable (8 pA at -30mV) among WT and mutants, in excised inside-out
patches WT typically produced higher GSK101-induced currents than the mutants (WT: 290 pA
vs. V620I: 87.1 pA and T89I: 62.3 pA at -30mV), potentially indicative of more channels per
patch (Figure 5.1C). In the confocal imaging experiments, a ratiometric fluorescence indicated
Ca2+ signaling of the hiPSC-derived chondrocytes in response to either 10 nM GSK101 or a
cocktail of 10 nM GSK101 and 20 µM GSK205. WT cells had significantly higher fluorescence,
and therefore Ca2+ signaling, in response to GSK101 according to the plots and their area under
the curve (AUC; WT: 1470 vs. V620I: 1114 and T89I: 1044; p<0.0001; Figure 5.1D-E). The
presence of GSK205 attenuated this response for all three lines, confirming the Ca2+ influx was
due to the TRPV4 ion channel (WT: 366 vs. V620I: 460 vs T89I: 358). We also evaluated the
response time of the cells to GSK101 and GSK101+GSK205. We considered a cell to be
Page 220
201
responding if more than a quarter of its frames, after stimuli, had a fluorescence higher than the
mean baseline plus 3 times the standard deviation. The mutants responded faster to GSK101 than
the WT (WT: 46.2 sec vs. V620I: 12 sec, p=0.0048 and T89: 10.8 sec, p=0.0097; Figure 5.1F).
Interestingly, the addition of GSK205 did not significantly slow the response of WT, but it did
slow the response of the mutants, with the severe mutation slower than the moderate (WT: 35.4
sec vs. V620I: 234 sec and T89: 366 sec; p<0.0001; Figure 5.1F).
Page 221
202
Figure 5.1 Differences in TRPV4 electrophysiological properties of WT and mutant hiPSC-
derived chondrocytes. (A) Whole-cell currents were higher, on average, in mutant hiPSC-derived
Page 222
203
chondrocytes than WT at 70 and -70 mV. TRPV4 inhibition with 20 µM GSK205 reduced
mutant currents to similar levels as WT. Mean ± SEM. n=20-40 cells. (B) The difference
between the current through TRPV4 without GSK205 from the average current through inhibited
channels was significantly higher in V620I. There was no difference between no drugs and
GSK205 in WT. Mean ± SEM. n=20-40 cells. Kruskal-Wallis test with multiple comparisons
comparing cell lines at 70 mV and -70 mV. *p<0.05, **p<0.01, ****p<0.001. (C) Inside-out
excised patches of WT had a higher current in response to 10 nM GSK101 (indicated by *) than
mutants. The addition of 10 nM GSK101 + 20 µM GSK205 (indicated by ) decreased the
current and continued to block the channel when GSK101 alone was re-introduced (*).
Representative plots with average unitary current and current in response to GSK101. Mean ±
SEM. n=5, 9, and 8 for WT, V620I, and T89I, respectively. (D) Mutant TRPV4 decreased the
channels’ sensitivity to activation with GSK101 as shown with confocal imaging of ratiometric
fluorescence indicating Ca2+ signaling. GSK205 attenuated GSK101-mediated signaling. Mean ±
95% CI. N = 3 experiments with a total of 158-819 cells per line. (E) Quantification of the area
under the curve of (D). Mean ± SEM. n=158-819 cells from N=3 experiments. Ordinary two-
way ANOVA with Tukey’s post-hoc test. Interaction, cell line, and treatment p<0.0001. (F)
Time of initial response of each responding cell (≥25% of frames for that cell are responding)
measured from the addition of stimulus. Mutant TRPV4 responded faster to GSK101, but the
response was significantly slowed by GSK205. Responding frames were considered to have a
fluorescence greater than the mean plus three times the standard deviation. Mean ± SEM.
Ordinary two-way ANOVA with Tukey’s post-hoc test. Interaction, cell line, and treatment
p<0.0001.
5.4.2 Chondrogenic differentiation of WT and mutant hiPSC lines
To confirm if the hiPSCs with dysplasia-causing mutations would undergo proper
chondrogenesis, we differentiated CRISPR-Cas9-edited hiPSCs with mutant TRPV4 alongside an
isogenic wildtype (WT) using our previously published protocol (31, 33). After 12 days of
monolayer mesodermal differentiation, the cells underwent 42 days of chondrogenic
differentiation, and pellets were collected at days 7, 14, 28, and 42. At day 28, the three lines had
similar chondrogenic matrix as shown with Safranin-O staining for sulfated glycosaminoglycans
(sGAGs) and collagen type 2 alpha chain 1 (COL2A1) labeling with immunohistochemistry
(IHC; Figure 5.2A-B). All three lines had little to no labeling of fibrocartilage marker COL1A1
and hypertrophic cartilage marker COL10A1 with IHC (Figure 5.2C-D). To quantitatively
confirm the matrix production throughout chondrogenesis, we performed biochemical assays to
measure sGAG production and normalize it to double-stranded DNA content. As expected,
Page 223
204
differences in matrix production were significant between time points (p<0.0001; Figure 5.2E).
The sGAG/DNA ratio increased in WT by 8-fold and in V620I and T89I by 5- to 5.5-fold from
day 14 to 28 (p<0.0001). V620I pellets also increased in matrix content by 150% from day 28 to
42 (p=0.0163) with all three lines reaching an sGAG/DNA ratio of approximately 30. However,
there were no differences in sGAG/DNA ratios among the three cell lines at any time point (cell
line: p=0.1206; interaction: p=0.7426).
Atomic force microscopy (AFM) was then used to measure the mechanical properties of
the hiPSC-derived cartilaginous matrix deposited by the WT and two TRPV4 mutated cell lines.
The elastic modulus ranged from 14 to 20 kPa, consistent with mouse iPSC-derived cartilage
(55). At day 28, the three lines had similar properties (WT: 14.4 kPa vs. V620I: 15.9 kPa vs.
T89I: 14.8 kPa); however, at day 42, V620I had a significantly decreased elastic modulus
(V620I: 10.32 kPa vs. WT: 20.0 kPa, p=0.0004 and T89I: 17.5 kPa, p=0.0328; Figure 5.2F).
These experiments indicated that all three lines could properly differentiate into chondrocytes
and had similar cartilaginous matrix production by day 28. Therefore, we used the day 28 time
point for further studies.
Page 224
205
Figure 5.2 Mutant TRPV4 had little effect on chondrogenic matrix production. (A-D) WT,
V620I, and T89I day-28 pellets exhibit similar matrix production shown by staining for sGAGs
with Safranin-O and hematoxylin (A) and labeling with IHC for COL2A1 (B), COL1A1 (C), and
COL10A1 (D). Scale bar = 500 µm. (E) The sGAG/DNA ratio increased in all three lines from
day 14 to 28 of chondrogenesis. There were no differences between lines at each time point.
Mean ± SEM. n = 11-16 from 3-4 different experiments. ****p<0.0001 Statistical significance
determined by an ordinary two-way ANOVA with Tukey’s post-hoc test. (F) There were no
differences in the elastic modulus of the matrix at day 28. Day-42 V620I had a significantly
lower elastic modulus than WT and T89I. Mean ± SEM. n=11-14 from 3 experiments. *p<0.05,
***p<0.001 Statistical significance determined by an ordinary two-way ANOVA with Tukey’s
post-hoc test.
5.4.3 TRPV4 mutations altered chondrogenic gene expression in hiPSC-
derived chondrocytes
RT-qPCR analysis throughout differentiation shows that mutants had higher ACAN expression
compared to WT at day 28; however, expression decreased at day 42 in T89I (day-42 fold
changes; V620I: 5933 vs. WT: 2687, p=0.0016 and T89I: 2631, p=0.0058; Figure 5.3A).
Page 225
206
COL2A1 expression was similar among the three lines at day 28 but significantly lower in T89I
at day 42 (day-42 fold changes; T89I: 2798 vs. WT: 9209, p=0.0144 and V620I: 7177,
p=0.0007; Figure 5.3B). Throughout chondrogenesis, V620I significantly increased expression
of chondrogenic transcription factor SOX9 (day-42 fold changes; V620I: 195.3 vs. WT: 44.29,
p<0.0001 and T89I: 32.19, p=0.0003; Figure 5.3C) and TRPV4 (day-42 fold changes; V620I:
168.5 vs. WT: 48.82, p<0.0001 and T89I: 44.72, p<0.0001; Figure 5.3D). On the other hand,
T89I significantly increased expression of pro-inflammatory, calcium binding protein S100B
(56) throughout chondrogenesis (day-42 fold changes; T89I: 1363 vs. WT: 362.0, p=0.0018 and
V620I: 507.8, p=0.0439; Figure 5.3E). T89I also had significantly higher expression of
fibrocartilage marker COL1A1 at days 7, 14, and 28 than the other two lines, and both mutations
had increased expression at day 42 compared to WT (day-42 fold changes; WT: 32.47 vs. V620I:
76.42, p=0.01.58 and T89I: 74.23, p=0.0132; Figure 5.3F). In contrast, hypertrophic marker
COL10A1 was significantly higher in the WT line than the mutants at days 28 and 42 (day-42
fold changes; WT: 615.7 vs. V620I: 71.00, p=0.0001 and T89I: 83.07, p=0.0015; Figure 5.3G).
Surprisingly, there was not a significant increase in follistatin (FST) expression in mutants at
later time points (day-42 fold changes; WT: 0.5342 vs. V620I: 0.6808, p=0.6882 and T89I:
0.3158, p>0.9999; Figure 5.3H).
Page 226
207
Figure 5.3 V620I and T89I had differing effects on gene expression during chondrogenic
differentiation. (A) T89I and V620I had increased ACAN gene expression at day 28 and 42,
respectively, compared to WT. (B) Day-42 T89I chondrocytes had decreased expression of
COL2A1. (C-D) V620I increased expression of SOX9 (C) and TRPV4 (D) throughout
chondrogenesis. (E-F) T89I increased expression of S100B (E) and COL1A1 (F) throughout
chondrogenesis. (G) Both mutations decreased COL10A1 gene expression at day 28 and 42,
compared to WT. (H) There were no differences in FST expression at later time points day 28
and 42. Mean ± SEM. n=10-12. *p<0.05, **p<0.01, ***p<0.001, ****p<0.0001 Significance
determined by one-way ANOVA with Tukey’s post-hoc test for each time point.
To obtain comprehensive transcriptomic profiles of WT and TRPV4 mutated cell lines,
we performed bulk RNA sequencing of day-28 chondrogenic pellets. We compared V620I and
T89I gene expression to WT and plotted the log2 fold change in heatmaps (Figure 5.4A-B).
While many chondrogenic and hypertrophic genes had similar levels of expression between the
lines, the mutants had increased expression of cartilage ECM genes cartilage oligomeric matrix
protein (COMP), collage type 6 alpha chains 1 and 3 (COL6A1, COL6A3), growth differentiation
Page 227
208
factor 5 (GDF5), high-temperature requirement A serine peptidase 1 (HTRA1), and secreted
protein acidic and cysteine rich (SPARC) (Figure 5.4A). In contrast, the mutants had decreased
expression of hypertrophic markers COL10A1, secreted phosphoprotein 1 (SPP1), and alkaline
phosphatase, biomineralization associated (ALPL) in addition to SST (Figure 5.4B). The
mutations up-regulated expression levels of bone morphogenic protein 6 (BMP6), transforming
growth factor 3 (TGFB3), nuclear factor of activated T-Cells C2 (NFATC2), Twist family BHLH
transcription factor 1 (TWIST1), ADAM metallopeptidase with thrombospondin type 1 motif 4
(ADAMTS4), and Wnt3A (Figure 5.4B). The mutations also downregulated osteoblastogenesis
transcription factors SOX2 and SOX11 and previously identified genes governing off-target
differentiation during hiPSC chondrogenesis including nestin (NES), orthodenticle homeobox 2
(OTX2), Wnt7A, and Wnt7B (Figure 5.4B). Interestingly, BMP4 was downregulated to a greater
extent in V620I than T89I when compared to WT.
5.4.4 V620I and T89I mutants demonstrate similar gene expression profiles
First, to evaluate the similarities and differences in transcriptomic profiles between the hiPSC-
derived chondrocytes with and without the TRPV4 mutations, we computed the Euclidean
distance between day-28 samples of each cell line. The WT samples clustered away from the
mutants, and the V620I samples were the most variable. (Figure 5.4C). In terms of total
differentially expressed genes (DEGs) compared to WT, V620I had 8% fewer DEGs than T89I
(2459 vs. 2671; Figure 5.4D). Mutants had only about half of the number of up-regulated genes
compared to down-regulated genes (V620I: 884 vs. 1575, T89I: 978 vs. 1693; Figure 5.4D). The
majority of the down-regulated DEGs were shared between the two mutants when compared to
WT, comprising 76% and 71% of V620I’s and T89I’s total down-regulated DEGs, respectively
(Figure 5.4E). We plotted the top 25 most down-regulated DEGs for each line in a heatmap.
Page 228
209
These included antioxidant catalase (CAT), anti-inflammatory nucleotide-binding and leucine-
rich repeat receptor family pyrin domain containing 2 (NLRP2), and kruppel like factor 8 (KLF8)
(Figure 5.4F). Interestingly, many of the down-regulated DEGs, both unique and shared between
V620I and T89I, were associated with Gene Ontology (GO) terms related to nervous system
development, including many potassium channel genes (i.e., KCN family; Figure 5.4G).
In contrast, 686 up-regulated DEGs were shared by both mutants, while 22% of V620I’s
and 30% of T89I’s up-regulated DEGs were unique to each mutation (198 vs. 292; Figure 5.4H).
A heatmap of the top 25 up-regulated DEGs showed that several homeobox (HOX) genes were
highly expressed in chondrocytes with the TRPV4 mutations (Figure 5.4I). These included
HOXA2 to HOXA7, HOXA-AS2, HOXB2 to HOXB4, and HOXB-AS1, which are associated with
morphogenesis and anterior patterning (57). Furthermore, the shared, up-regulated DEGs
between two mutants are associated with extracellular matrix production and organization and
growth factor binding in GO term analysis, while V620I genes were associated with type I
interferon (Figure 5.4J). These data highlight an early morphogenic genetic profile in hiPSC-
derived chondrocytes with the V620I and T89I mutations.
5.4.5 The severe T89I mutation inhibits chondrocyte hypertrophy more than
moderate V620I mutation
Following an additional 4 weeks of chondrogenic culture, we performed RNA sequencing to
investigate how the differences between the WT and the two mutants change with further
differentiation. Using Euclidean distances, we compared the WT, V620I, and T89I hiPSC-
derived chondrocytes at both day 28 and 56 (Figure 5.4K). WT clustered together at both day 28
and 56; however, the mutants clustered by time point. Again, there were more down-regulated
genes than up-regulated at day 56 (Figure 5.4L). T89I had the most DEGs, and the number
increased from day 28 to 56. In contrast, V620I’s DEGs decreased at day 56. 74% of V620I up-
Page 229
210
regulated DEGs, but only 24% of T89I DEGs, were shared between the two lines (424 total
genes; Figure 5.4M). These intersecting, up-regulated genes were associated with the biological
processes of skeletal development, morphogenesis, and patterning due to the up-regulation of
many HOX genes (Figure S5.1A). Most of the top up- and down-regulated genes were consistent
between day 28 and 56 (Figure S5.1A-B), including both anterior and posterior HOX genes (i.e.,
HOXA1 to HOXA7, HOXB2 to HOXB4, HOXB6 to HOXB8, HOXC4, HOXD8, HOXA-AS2-3,
and HOXB-AS1-2)(57). Although V620I and T89I TRPV4 mutants continued to share the up-
regulated HOX genes, which may be responsible for dysfunctional chondrogenic hypertrophy
compared to WT cells, our results also indicate that these two mutated lines started to
demonstrate divergent transcriptomic profiles in later chondrogenesis.
Page 230
211
Figure 5.4 Dynamic changes in transcriptomic profiles of V620I and T89I mutants during
chondrogenesis. (A-B) Heatmaps comparing the log2 fold change of common chondrogenic and
hypertrophic genes (A) and growth factor and signaling genes (B) in day-28 V620I and T89I
Page 231
212
chondrocytes compared to WT. (C) Clustering of the samples using Euclidean distances reveals
that V620I and T89I hiPSC-derived chondrocytes are more similar to each other than WT. (D)
The number of up- and down-regulated DEGs in V620I and T89I day-28 chondrocytes compared
to WT. (E-G) Analysis of the down-regulated genes compared to WT. (E) A Venn diagram
reveals the number of similar and different down-regulated DEGs between V620I and T89I,
where most genes are shared. (F) A heatmap showing the log2 fold change, compared to WT, of
the top 25 down-regulated genes for each line. (G) The top 3 GO Terms (biological process)
associated with the DEGs unique to V620I, shared between V620I and T89I, and unique to T89I.
(H-J) Analysis of the up-regulated genes compared to WT. (H) A Venn diagram reveals the
number of similar and different up-regulated DEGs between V620I and T89I, where most genes
are shared. (I) A heatmap showing the log2 fold change, compared to WT, of the top 25 up-
regulated genes for each line. (J) The top 3 GO Terms (biological process) associated with the
DEGs unique to V620I, shared between V620I and T89I, and unique to T89I. (K) Clustering of
the day-28 and day-56 samples using Euclidean distances reveals that the WT chondrocytes, at
both day 28 and 56, cluster together while mutants cluster by time point. (L) The number of up-
regulated and down-regulated DEGs for V620I and T89I compared to WT at day 28 and day 56.
(M) A Venn diagram reveals the number of similar and different up-regulated DEGs between
V620I and T89I, with T89I becoming more unique at day 56.
5.4.6 TRPV4 mutations exhibit dysregulated BMP4-induced chondrocyte
hypertrophy
To evaluate how TRPV4 mutations may affect hypertrophy, BMP4 was added to the
chondrogenic medium with and without TGFβ3 to stimulate hypertrophic differentiation starting
at day 28 of chondrogenic pellet culture (58). At day 56, Safranin-O staining indicated the
BMP4-treated WT had developed a more hypertrophic phenotype compared to TGFβ3- and
TGFβ3+BMP4-treated pellets with enlarged chondrocytes (cell diameter; WT-BMP4: 27.6 µm
vs. WT-TGFβ3: 11.8 µm, V620I-BMP4: 12.5 µm, and T89I-BMP4: 11.3 µm; p<0.0001; Figure
5.5A-B). This phenotype was not present in any of the groups from the V620I and T89I lines.
Western blot further confirmed this with an increase in hypertrophic cartilage protein COL10A1
secretion in the WT-BMP4 group (Figure 5.5C), consistent with the day-28 gene expression data
(Figure 5.3G, 5.4A). RNA sequencing and PCA revealed that the WT line was more sensitive to
BMP4, as indicated by the arrows (Figure 5.5D). Given that the BMP4-treated WT
chondrocytes had the most apparent hypertrophic phenotype, later analyses were performed
comparing the BMP4- and TGFβ3-treated chondrocytes for simplification.
Page 232
213
Figure 5.5 WT chondrocytes are more sensitive to BMP4 treatment. (A) WT chondrocytes
treated with BMP4 developed a hypertrophic phenotype with enlarged lacunae, which was not
present in the mutant cell lines or other conditions, as shown by Safranin-O and hematoxylin
staining. Scale bar = 500 µm. (B) Cell diameter was significantly increased in the WT with
BMP4 treatment compared to all other groups indicating a hypertrophic phenotype. Mean ±
SEM. n = 249-304 cells from 2 pellets. Different letters indicate statistical significance (p<0.05)
between groups as determined by Kruskal-Wallis test with multiple comparisons since data was
not normally distributed. (C) Western blot shows that WT had increased production COL10A1
in response to BMP4 treatment. (D) PCA of bulk RNA-seq reveals an increased sensitivity to
BMP4 (and TGFβ3+BMP4) treatment in WT hiPSC-derived chondrocytes compared to V620I
and T89I.
Hierarchical K-means clustering of gene expression profiles of BMP4- and TGFβ3-
treated chondrocytes resulted in 9 unique clusters, as determined using the gap statistics method
(Figure 5.6A). Most of the clusters, including the largest (i.e., cluster 1), showed up-regulation of
gene expression with BMP4 treatment, while clusters 4, 5, and 9 showed down regulation. The
Page 233
214
gene expression per group for each cluster is listed in Table S5.1. Overall, WT responded to
BMP4 treatment with the largest number of DEGs, over 2500, with only 22% of them shared
among all three lines (Figure 5.6B). Although cluster 1 shows an overall increase in gene
expression with BMP4 treatment, WT had a larger increase in expression than the mutants
(Figure 5.6C). In fact, some of the genes that were up-regulated with BMP4 treatment in WT
may have no change or down-regulation in mutants (cluster 1, Figure 5.6A).
As cluster 1 represents the primary response to BMP4 treatment and may highlight how
the TRPV4 mutations inhibit chondrocyte hypertrophy, we constructed a gene network of this
cluster (Figure 5.6D). The log fold change of each gene per cell line is represented by a color
scale, which is consistent with WT having overall higher expression of the genes (as indicated by
the white arrows in the legend; Figure 5.6D). With GO term analysis, the cluster 1 gene network
is highly associated with ossification, biomineral tissue development, skeletal system
development, tissue development, and osteoblast differentiation (Figure 5.6D). Alkaline
phosphatase, biomineralization associated (ALPL), amelogenin X-linked (AMELX), fibroblast
growth factor receptor 3 (FGFR3), interferon induced transmembrane protein 5 (IFITM5), Indian
hedgehog (IHH), parathyroid hormone 1 receptor (PTH1R), and noggin (NOG) were connected
to at least 4 of the top 5 GO terms. Of those, ALPL, AMELX, and IFITM5 showed much higher
expression in WT than the mutants alongside antioxidant glutathione S-transferase alpha 1
(GSTA1) and bone ECM proteins integrin binding sialoprotein (IBSP) and matrix extracellular
phosphoglycoprotein (MEPE). Lack of expression of these key genes may be responsible for the
inhibited hypertrophy in TRPV4 V620I- and T89I-mutated chondrocytes.
We next investigated and plotted the top 25 up-regulated genes for each line with BMP4
treatment (compared to their respective TGFβ3 control) (Figure 5.6E). 88% of these genes were
Page 234
215
also present in cluster 1. The key genes ALPL, AMELX, IFITM5, GSTAI, IBSP, and MEPE had
distinctly higher expression in WT than mutants, in agreement with the network analysis. Both
mutants showed higher expression than WT of ankyrin repeat and SOCS box containing 10
(ASB10), GTPase, IMAP family member 6 (GIMAP6), and adhesion G protein-coupled receptor
D1 (ADGRD1) when compared to their corresponding TGFβ3 control group. GO term analysis
was further performed on all BMP4 up-regulated DEGs for each line (Figure 5.6F). WT was
highly associated with skeletal system development, ossification, endochondral ossification, and
extracellular structure organization, followed by V620I mutants, while T89I showed little to no
association with these concepts.
Page 236
217
Figure 5.6 V620I and T89I had an inhibited hypertrophic response to BMP4 treatment. (A)
There are 9 clusters of genes based on expression and hierarchical k-means clustering of the
samples. (B) Venn diagram shows similar and distinct DEGs in response to BMP4 treatment in
all three lines. (C) Cluster 1 represented increasing in expression from TGFβ3-treatment to
BMP4-treatment (left to right on x-axis). Y-axis scale (-1.5 to 2) represents the scaled mean
counts. (D) A protein-protein interaction network with functional enrichment analysis of cluster
1 reveals the top regulating genes and their associated concepts. Connections between protein-
coding genes and GO processes are based on the average log fold change between cell lines.
Coloring of the protein-coding gene circles is divided into three to represent the log fold change
for each cell line as shown in the legend. The white arrows in the legend indicates the location of
the maximum log fold change for each respective cell line. The grey boxes represent the top 5
GO terms (biological process) identified for the network with the log10(false discovery rate)
underneath the term. (E) A heatmap of the top 25 up-regulated genes, and their log2 fold change,
in each line compared to their respective TGFβ3 controls. (F) The top GO terms and biological
pathways associated with the up-regulated DEGs with BMP4 treatment. Symbol color represents
the cell line, and size represents the -Log10(padj).
5.5 Discussion
To elucidate the detailed molecular mechanisms underlying the distinct severity of skeletal
dysplasias caused by two TRPV4 mutations (brachyolmia-causing V620I vs. metatropic
dysplasia-causing T89I), we used CRISPR-Cas9 gene editing to generate hiPSC-derived
chondrocytes bearing these two mutations. We observed that day-28 chondrocytes exhibited
differences in channel function and gene expression between the mutants and WT control.
Differences in transcriptomic profiles between V620I and T89I and from WT became more
apparent with maturation following 4 additional weeks of culture with TGFβ3 or hypertrophic
differentiation with BMP4 treatment. Of note, WT was significantly more sensitive to BMP4-
induced hypertrophy. At the transcriptomic level, TRPV4 mutations inhibited chondrocyte
hypertrophy, particularly with the T89I mutation, whereas V620I exhibited a milder phenotype,
consistent with the clinical presentation of these two conditions. Our results suggest that skeletal
dysplasias may be, at least in part, resulting from improper chondrocyte hypertrophy downstream
of altered TRPV4 function. Furthermore, with our genome-wide RNA sequencing analysis, we
also identified several putative genes that may be responsible for these dysregulated pathways in
Page 237
218
human chondrocytes bearing V620I or T89I TRPV4 mutations.
Our findings are generally consistent with previous non-human models of V620I and
T89I mutations. Two other models that have studied the V620I and T89I mutations include X.
laevis oocytes injected with rat TRPV4 cRNA (11) or primary porcine chondrocytes transfected
with human mutant TRPV4 (12). Both reports and our current study investigated the baseline
currents of the mutant TRPV4 compared to WT. Here, we used patch clamping and observed
high basal currents in V620I with a significant decrease when TRPV4 was inhibited. However,
this characteristic was trending, but not significant, in T89I, despite both V620I and T89I being
reported as gain-of-function mutations (8, 10). Both the X. laevis oocyte and porcine chondrocyte
models confirmed high basal currents through V620I-TRPV4 (11, 12). Interestingly, X. laevis
oocytes, but not the humanized porcine chondrocytes, showed an increase in basal Ca2+ signaling
through T89I (11, 12). Furthermore, our results were consistent with a summary of TRPV4
channelopathies reporting an increase in conductivity in V620I but no change in T89I (6). The
conflicting basal current results could be due to the species of the TRPV4, but this was not the
case regarding channel activation. As mentioned, the hiPSC-derived chondrocytes with V620I
and T89I TRPV4 had reduced currents and Ca2+ signaling in response to chemical agonist
GSK101. However, our previous study showed the porcine chondrocytes with mutant human
TRPV4 had increased peak Ca2+ signaling in response to hypotonic changes (12). This
discrepancy could be due to the mode of activation of TRPV4 (i.e., osmotic vs. chemical
agonist). In contrast, the oocytes with mutant rat TRPV4 had lower currents in response to both
hypotonic and chemical (GSK101) TRPV4 activation compared to WT-TRPV4, consistent with
our findings. It can be speculated that there is decreased sensitivity to the antagonist because the
mutated hiPSC-derived chondrocytes are compensating for the increased basal activity by
Page 238
219
reducing the number of TRPV4 channels, or other ion channels and signaling transducers as
shown with the RNAseq data and associated GO terms. The increased basal currents and
decreased channel sensitivity to TRPV4 agonist GSK101 with mutated TRPV4 is also likely due
to an increased open probability of TRPV4 making the channels less likely to open due to an
agonist (11). The obvious differences in both resting and activated states confirm functional
differences with TRPV4 mutations that may ultimately lead to changes downstream of the
channel, which alter joint development and result in skeletal dysplasias.
It was hypothesized, in the porcine chondrocyte study, that the increased Ca2+ signaling
due to the V620I and T89I TRPV4 mutations increased FST expression that inhibited BMP
signaling and hypertrophy (12, 25). Surprisingly, we found no differences in FST expression in
mutant hiPSC-derived chondrocytes compared to WT. However, our previous study used non-
human cells, which could alter the effects of the human TRPV4 mutations and downstream gene
expression. Another previous hypothesis made was that the altered TRPV4 signaling increased
SOX9 expression, a known regulator of resting and proliferating chondrocytes upregulated by
TRPV4 activation (13), thus decreasing hypertrophy (8). SOX9-knockin mice exhibit a dwarfism
phenotype (20), and SOX9 overexpression inhibits hypertrophy and endochondral ossification
(22, 23), likely via parathyroid hormone-related protein (PTHrP) (18, 20). However, PTHrP was
not strongly regulated in our data set. Furthermore, our RT-qPCR revealed that only V602I
significantly upregulated SOX9, and the RNAseq data showed that SOX9 had a smaller fold
change compared to other chondrogenic genes, such as GDF5, COL6A1, COL6A3, and COMP.
In fact, these genes, which were upregulated in V620I- and T89I-hiPSC-derived chondrocytes,
have a pro-chondrogenic but anti-hypertrophic phenotype (59-61). Therefore, these results
suggest additional and alternative pathways to FST and SOX9 that are responsible for the V620I
Page 239
220
and T89I skeletal dysplasias.
Our results are also generally consistent with previous reports on the effects of other
TRPV4 mutations such as lethal and non-lethal metatropic dysplasia-causing I604M (29) and
L619F (30). The data also reveal potential differences in the effects of these varying TRPV4
mutations on cell electrophysiology or differentiation. For example, we saw an increase in SOX9
expression in V620I, while no change in T89I. Gain-of-function mutation L619F also increased
SOX9 expression (30), while I604M, which has been reported to not alter conductivity like T89I
(6), decreased SOX9 (29). I604M also decreased COL2A1, COL10A1, and RUNX2 expression
consistent with our T89I results (29). Intriguingly, the L619F mutation was reported to increase
Ca2+ signaling with activation via a TRPV4 agonist (30). However, we observed that V620I and
T89I had significantly reduced Ca2+ signaling compared to WT in response to chemical agonist
GSK101, as confirmed by both confocal imaging and patch clamping. These results highlight
that TRPV4 mutations have heterogeneous effects on downstream signaling pathways and thus
lead to diverse disease phenotypes, despite similar classification of these mutations as “gain-of-
function.” It is also important to note that in previous studies, chondrogenic differentiation of
iPSCs (29) or dental pulp cells (30) were performed in short-term micromass culture, and not
long-term pellet culture as in our study, potentially leading to different levels of chondrogenesis
and maturation of the cells.
Our transcriptomic analysis showed significant changes in various HOX family genes due
to TRPV4 mutations, suggesting a potential role of these genes in maintaining the immature,
chondrogenic phenotype in the mutated lines. At both day 28 and 56, the top 25 up-regulated
genes in the V620I and T89I lines included genes from the anterior HOX family (57, 62). The
high expression of anterior HOX genes indicates that the mutants are maintaining the
Page 240
221
chondrocytes in an early developmental stage with axial patterning. At day 28 and 56, HOXA2,
HOXA3, and HOXA4 were in the top upregulated genes, with HOXA4 having the largest fold
change. Interestingly, gain-of-function mutations or overexpression of HOXA2, HOXA3, and
HOXA4 impair chondrogenesis, limit skeletal development, decrease endochondral ossification
regulators, and delay mineralization in animal models (57, 63-67). HOXA5 was also highly
upregulated at both day 28 and 56, and mutations in this gene showed disordered patterning of
limb bud development (68). Finally, the rib and spine phenotypes associated with brachyolmia
and metatropic dysplasia could be contributed to the altered expression of HOXA4 to HOXA7 as
it has been shown that these genes are associated with rib and spine patterning, and alterations in
expression have led to defects (69, 70). The only up-regulated posterior HOX genes were
HOXC8 and HOXD8 at day 56 (57, 62). The absence of posterior HOX9, HOX11, and HOX13,
which are associated with limb development and hypertrophic RUNX2/3 expression (68, 71),
may be at least partially responsible for the improper development in skeletal dysplasias.
Interestingly, many links have been identified between HOX genes and TGFβ3-family signaling,
specifically through SMAD proteins, both within skeletal development and other processes (e.g.,
murine lung development) (67, 72, 73).
In fact, TRPV4 and TGF-β signaling have recently been shown to interact, with effects
specific to the order in which they occur (14, 74, 75). Consistent with previous finding with
hiPSCs housing the I604M TRPV4 mutations (29), the altered TRPV4 activity in our hiPSC-
derived chondrocytes could be altering their response to the TGFβ3 and BMP4 treatments.
Furthermore, the V620I and T89I mutations increased expression of HTRA1, which has been
shown to bind to and alter the response to members of the TGFβ family (76). Furthermore,
TGFβ3 and TWIST, which is downstream of TGFβ3-signaling, were both upregulated in TRPV4-
Page 241
222
mutated hiPSC-derived chondrocytes. It has been reported that TGFB3 expression and signaling
prevent osteoblastogenesis of mesenchymal stem cells (18, 21), while TWIST inhibits
hypertrophy regulators RUNX2 and FGFR2 (77, 78). Therefore, another mechanism of
hypertrophic dysregulation with these mutations could be altered response to TGFβ family
signaling.
Furthermore, significantly lower expression of ALPL, AMELX, IFITM5, GSTA1, IBSP,
and MEPE in mutated chondrocytes compared to WT suggest that mutated cells had altered
response to BMP4-induced hypertrophy. Indeed, mutations in ALPL have been shown to lead to
hypophosphatasia with deformed long bones (79), while mutations in IFITM5 lead to osteogenic
imperfecta (80). Our results indicate a connection between these genes and delayed
endochondral ossification in chondrocytes bearing V620I and T89I mutations; however, how the
expression levels of these genes are associated with TRPV4 function and mutations still warrants
further investigation.
Another gene increased in BMP4-treated WT, but less in mutants, was GSTA1, which
produces the antioxidant glutathione (81, 82). The TRPV4-mutated chondrocytes also had
significant downregulation of catalase (CAT), another antioxidizing gene (82). Interestingly,
BMP4 treatment of T89I-mutated chondrocytes was able to significantly increase CAT
expression, potentially indicating an association between antioxidant expression and maturation.
One study observed that chondrocyte maturation is associated with decreasing catalase (83).
However, many others report that reactive oxygen species (ROS; e.g., H2O2), which can be
removed by CAT and GSTA1, prevent endochondral ossification, potentially via inhibition of the
hedgehog pathways (82, 84, 85). Interestingly, IHH also had the lowest expression level in our
T89I mutant chondrocytes. These findings suggest that decreased expression of CAT and GSTA1
Page 242
223
in TRPV4 mutants may also be involved in dysregulating endochondral ossification in these
cells.
The decrease in mechanical properties with increased basal current of the V620I mutant
was unexpected since TRPV4 activation was previously shown to increase matrix production and
properties (14). Furthermore, genes uniquely upregulated in V620I were associated with
interferon type I (IFNβ). IFNβ has been reported to decrease inflammatory markers and matrix
degradation (86-89), despite the decrease in moduli observed in the day-42 V620I chondrogenic
pellets. Interestingly, a study comparing bone marrow-derived MSCs from healthy and systemic
lupus erythematous patients found that IFNβ inhibited osteogenesis via suppression of RUNX2
and other osteogenic genes (90). Highlighting a potential, unique regulator of the delayed
hypertrophy in V620I leading to brachyolmia. In contrast, T89I became more unique at later time
points of chondrogenesis and was not associated with many of the same biological processes as
WT and V620I, especially those regarding endochondral ossification, when treated with BMP4.
This, in conjunction with the high number of unique DEGs, represents a potential inhibition of
hypertrophy, particularly in response to BMP4 treatment, with the T89I mutation leading to
severe metatropic dysplasia.
Here, we present multiple putative genes and pathways that could be involved in
delaying, and potentially inhibiting, chondrocyte hypertrophy in V620I- and T89I-TRPV4
mutants. It should be noted, however, that this study has some potential limitations. It is well-
recognized that Wnt/β-catenin signaling plays an important role in chondrocyte hypertrophy (78,
91, 92). However, we may be preventing some hypertrophy since our chondrogenic protocol uses
a pan-Wnt inhibitor to prevent off-target differentiation and promote a homogenous chondrocyte
population (33). Nevertheless, our WT chondrocytes, but not TRPV4 mutants, exhibited
Page 243
224
hypertrophic differentiation with BMP4 treatment, suggesting that DEGs/pathways detected in
our sequencing analysis are still robust. Since this study focuses on TRPV4 gain-of-function
mutations, future studies could fully or partially inhibit TRPV4 signaling to determine if that
would increase similarity between the mutant and WT lines at various stages of chondrogenic
and hypertrophic differentiation. Additionally, this study only activated TRPV4 using the
pharmacological activator GSK101. Other future experiments could activate the channel
osmotically or with mechanical loading to investigate additional differences in TRPV4 function
leading to skeletal dysplasias during development.
5.6 Supplemental Figures and Tables
Figure S5.1 Top DEGs of V620I and T89I chondrocytes compared to WT remain from day 28
to day 56. (A) The top 25 up-regulated genes, and their log2 fold change, for day-56 TGFβ3-
treated V620I and T89I chondrocytes compared WT. (B) The top 25 down-regulated genes, and
their log2 fold change, for day-56 TGFβ3-treated V620I and T89I chondrocytes compared WT.
Table S5.1 Clustering of BMP4 treatment. The top 10 genes of each cluster with normalized
gene counts for each group. The top upregulated genes were determined for the group with the
highest expression in that cluster: 1 – WT BMP4, 2 – T89I BMP4, 3 – T89I BMP4, 4 – T89I
Page 244
225
TGFβ3, 5 – WT TGFβ3, 6 – WT TGFβ3, 7 – V620I BMP4, 8 – T89I BMP4, and 9 – WT
TGFβ3. Related to Figure 5.6A.
Ensembl Gene ID Symbol WT
TGFβ3
WT
BMP4
V620I
TGFβ3
V620I
BMP4
T89I
TGFβ3
T89I
BMP4
Cluster 1
ENSG00000136630 HLX -0.4407717 2.0402195 -0.5407056 -0.3272783 -0.535553 -0.4414497
ENSG00000134215 VAV3 -0.4322642 2.0374974 -0.5033759 -0.389187 -0.4886749 -0.4664525
ENSG00000154143 PANX3 -0.4953438 2.03064846 -0.4974411 -0.3205407 -0.4982932 -0.4578532
ENSG00000162551 ALPL -0.4919204 2.03056528 -0.5327131 -0.2125114 -0.5488725 -0.5036349
ENSG00000103056 SMPD3 -0.1974815 2.02602223 -0.5671042 -0.2903093 -0.6396414 -0.6310159
ENSG00000176842 IRX5 -0.465913 2.02293985 -0.5606691 -0.2921023 -0.5380299 -0.4085238
ENSG00000170962 PDGFD -0.1915284 2.01873261 -0.659709 -0.4009481 -0.6770205 -0.3392717
ENSG00000153446 C16orf89 -0.4773729 2.01744291 -0.5845101 -0.2737777 -0.5435154 -0.3791925
ENSG00000163501 IHH -0.5298648 2.01702244 -0.5431994 -0.2002987 -0.5405259 -0.4519113
ENSG00000101280 ANGPT4 -0.5302453 2.01695715 -0.5428197 -0.1350517 -0.603895 -0.4542005
Cluster 2
ENSG00000134061 CD180 -0.4622938 -0.5288295 -0.3577376 -0.3482325 -0.1581304 2.35438578
ENSG00000230815 -0.4489383 -0.8685342 0.18583502 -0.1584488 -0.2552786 2.12243149
ENSG00000267529 -0.444944 -0.8809379 -0.4730726 0.3989153 -0.1495932 1.90848578
ENSG00000250250 CTD-
2350J17.1 0.24000783 -0.9939455 -0.1426133 -0.1043512 -0.3913171 1.80875466
ENSG00000129422 MTUS1 -0.4016571 0.49891994 -0.654169 0.56752143 -1.3036937 1.50604821
ENSG00000231104 0.29347029 -1.0471918 0.46399309 0.15234796 -0.817868 1.42832896
ENSG00000261997 -0.3339501 -0.7616808 -0.1494389 0.64731428 -0.4849139 1.39374618
ENSG00000148680 HTR7 0.36576125 -0.0299804 -0.5503075 0.4317182 -1.371105 1.35511546
ENSG00000232903 LINC01166 0.37813758 0.11002898 -0.8602688 0.50836176 -1.3454177 1.32545463
ENSG00000243175 RPSAP36 0.13741559 -0.890453 -0.0641273 0.59088704 -0.7695273 1.30636422
Cluster 3
ENSG00000162078 ZG16B -0.8551802 -0.1800379 -0.930196 0.12377608 0.12377608 1.98041735
Page 245
226
ENSG00000116455 WDR77 -1.2364286 -0.3366992 -0.5494202 0.15785895 0.34689005 1.97392514
ENSG00000170006 TMEM154 -1.2573605 -0.0147801 -0.5923283 0.10134896 0.15941346 1.94083253
ENSG00000136943 CTSV -0.8907691 -0.6416754 -0.7378985 0.30115571 0.41522664 1.82598136
ENSG00000171428 NAT1 -0.9289641 -0.097933 -0.8605664 0.29193349 0.12777919 1.67014557
ENSG00000169504 CLIC4 -1.4859539 0.13092627 -0.3119891 0.22835859 0.11867718 1.65597823
ENSG00000153029 MR1 -1.4531496 -0.1979707 -0.5965094 0.31339853 0.56036661 1.63298287
ENSG00000155918 RAET1L -0.6734798 -1.1691676 -0.4812131 0.34493311 0.64234574 1.62170451
ENSG00000114450 GNB4 -1.3812791 0.4524834 -0.3327172 0.18743492 -0.2225245 1.61789756
ENSG00000203392 -0.880589 -0.5792242 -0.9690578 0.62794695 0.35569132 1.60395769
Cluster 4
ENSG00000142661 MYOM3 -0.1800364 -0.5676659 -0.3980397 -0.6631954 2.02449127 -0.420085
ENSG00000265190 ANXA8 -0.4662521 -0.6012199 -0.2862952 -0.5472328 2.01715398 -0.2503038
ENSG00000188015 S100A3 -0.4862037 -0.7025085 -0.2076937 -0.4734799 2.01614534 -0.2642439
ENSG00000164764 SBSPON -0.6366146 -0.4165159 -0.5056698 -0.4938291 2.01153508 -0.1137641
ENSG00000065325 GLP2R -0.4285246 -0.7675511 -0.1872943 -0.5589194 2.00985763 -0.1525224
ENSG00000196154 S100A4 -0.3852601 -0.5834099 0.04349122 -0.6381075 2.0018262 -0.5702228
ENSG00000007171 NOS2 -0.3798747 -0.5060131 -0.2511371 -0.4794094 2.00161854 -0.5972914
ENSG00000174946 GPR171 -0.2568739 -0.6297553 -0.0524796 -0.6711866 2.00113036 -0.5386065
ENSG00000214688 C10orf105 -0.4068724 -0.7431708 -0.1763876 -0.3974435 1.99436058 -0.4194443
ENSG00000177283 FZD8 -0.396451 -0.7014113 -0.0357477 -0.6369388 1.98680373 -0.3002558
Cluster 5
ENSG00000244953 1.93036295 -0.4874654 -0.1516559 -0.4744663 -0.42247 -0.5762924
ENSG00000125869 LAMP5 1.9113851 -0.3544688 -0.2506172 -0.5999363 -0.2128529 -0.7415522
ENSG00000259881 LOC101927793 1.88877557 -0.4321825 0.15904637 -0.4519634 -0.4255889 -0.9311006
ENSG00000263155 MYZAP 1.84143074 -0.751481 -0.3599587 -0.5963496 -0.0644702 -0.2122145
ENSG00000141750 STAC2 1.75760823 -0.8245062 -0.3863292 -0.6367161 0.24311552 -0.3330061
ENSG00000101938 CHRDL1 1.72579926 -0.1375551 -0.2522428 -0.8218159 0.09439777 -0.8955253
Page 246
227
ENSG00000120057 SFRP5 1.70244888 -0.2222804 0.03070915 -0.944713 0.20955956 -1.0240626
ENSG00000139292 LGR5 1.65667334 -0.5917232 0.15125745 -0.8029446 0.11975952 -0.6602775
ENSG00000270228 1.64512369 -0.0663858 -0.3402273 -0.0663858 -0.1804865 -1.4355934
ENSG00000106327 TFR2 1.64094873 -0.7710817 0.04517224 -0.4726389 0.42422017 -1.1404366
Cluster 6
ENSG00000185742 C11orf87 1.54928318 0.52412284 -0.068401 -0.5339555 -0.6750326 -1.0841562
ENSG00000122254 HS3ST2 1.54484352 0.69539965 -0.1085645 -0.4269226 -0.8670489 -1.1531311
ENSG00000125804 FAM182A 1.49677851 0.46950232 0.61491584 -0.6562798 -0.9517976 -1.0925204
ENSG00000184828 ZBTB7C 1.48468335 0.81548377 -0.2924263 -0.6119857 -0.6213616 -1.1300001
ENSG00000239268 1.47666919 0.59588969 0.12571513 -0.7540006 -0.5880567 -1.0997172
ENSG00000129151 BBOX1 1.41603923 0.14942686 -0.1857581 -0.6965929 0.00922931 -0.9850453
ENSG00000187135 VSTM2B 1.37532225 0.98960864 -0.5246744 -0.5675315 -0.6103885 -1.0580068
ENSG00000133636 NTS 1.34744728 0.67247136 -0.4800385 -0.4433051 -0.4708552 -0.9943059
ENSG00000184492 FOXD4L1 1.33955469 0.06928731 -0.3541351 -0.9151699 0.51388089 -0.9892688
ENSG00000243319 FGF14-IT1 1.31866392 0.56172241 0.18599419 -0.3268611 -1.273038 -0.5599772
Cluster 7
ENSG00000183644 HOATZ -0.8453249 -0.4201194 -0.3940103 1.73947729 -0.10681 -0.0956204
ENSG00000154342 Wnt3A -1.0716829 -0.5651792 -0.01912 1.72421754 -0.2873257 0.28574702
ENSG00000138356 AOX1 -0.7979798 -0.4018139 -0.6671427 1.7178925 -0.6232867 0.80739331
ENSG00000141448 GATA6 -1.0975583 -0.402573 0.21816165 1.71356796 -0.3802979 0.00432003
ENSG00000189001 SBSN -1.1766072 -0.414439 0.04404355 1.69481709 0.06058673 -0.263187
ENSG00000152669 CCNO -1.0056734 -0.2531982 -0.0784151 1.67736047 -0.4030122 0.05777953
ENSG00000120949 TNFRSF8 -0.8457057 -0.525458 -0.5571943 1.67473023 -0.5462308 0.88074675
ENSG00000256673 -0.7951926 -0.4642983 -0.5650053 1.66493452 -0.6800989 0.9312124
ENSG00000212993 POU5F1B -0.8110902 -0.48146 -0.3129823 1.6501491 -0.3276325 0.27302709
ENSG00000115363 EVA1A -1.3417184 -0.2438053 -0.5302174 1.60919416 0.35505632 0.02524845
Cluster 8
Page 247
228
ENSG00000154080 CHST9 0.79674683 -0.3558075 -0.6039268 -0.8960673 -0.4158364 1.76521261
ENSG00000109193 SULT1E1 -0.2211121 0.92346818 -1.0657016 -0.7472498 -0.3088017 1.5372955
ENSG00000268089 GABRQ 1.05785547 0.0056823 -0.5794371 -0.4526902 -1.1845235 1.34433826
ENSG00000129159 KCNC1 1.14171692 -0.402278 -0.2372079 -0.0078783 -1.3714752 1.09042729
ENSG00000162645 GBP2 1.23597668 -0.4515684 0.04491227 -0.5396142 -1.060552 1.042765
ENSG00000164093 PITX2 -0.1260545 1.24124219 -1.0665402 -1.0719021 0.1184503 0.85089238
ENSG00000129824 RPS4Y1 0.35003319 0.82149811 -1.3769648 -1.3832455 0.60788477 0.8487374
ENSG00000175084 DES 1.28288386 -0.2443785 -1.1495016 -1.0843542 0.30456241 0.80455019
Cluster 9
ENSG00000171722 SPATA46 1.97614501 -0.3838787 0.08643424 -0.5006111 -0.6071928 -0.732384
ENSG00000087250 MT3 1.97175135 -0.2804736 -0.0235548 -0.5370286 -0.5806975 -0.7411808
ENSG00000146360 GPR6 1.96269185 -0.2126427 0.00307151 -0.5245186 -0.6531674 -0.7662224
ENSG00000257126 1.94280226 -0.1402269 -0.232513 -0.57529 -0.5621063 -0.6543924
ENSG00000115155 OTOF 1.936001 -0.0992158 -0.3563582 -0.3942778 -0.6555677 -0.6928948
ENSG00000100078 PLA2G3 1.93320458 -0.2334559 0.10590057 -0.4635004 -0.6641775 -0.8686616
ENSG00000144119 C1QL2 1.93116843 -0.3228628 -0.1106777 -0.4724358 -0.6324442 -0.5605564
ENSG00000186960 LINC01551 1.92885289 -0.2396521 -0.1617074 -0.512869 -0.5768657 -0.6375806
ENSG00000105509 HAS1 1.92860762 0.15041891 -0.5956422 -0.5807668 -0.4880813 -0.7512624
ENSG00000127329 PTPRB 1.92160498 0.00830095 -0.3770758 -0.5227041 -0.6449196 -0.6393005
5.7 Conclusion
In summary, our study found that dysregulated skeletal development in the V620I- and
T89I-TRPV4 dysplasias is likely due, at least in part, to delayed and inhibited chondrocyte
hypertrophy. The gain-of-function mutations may lead to increased HOX gene expression,
altered TGFβ signaling, decreased hypertrophic and biomineralization gene expression (e.g.,
ALPL, AMELX, IFITM5, IBSP, and MEPE), and genes regulating hedgehog pathways and ROS
accumulation (e.g., GSTA1, CAT). These findings lay a foundation for the development of
Page 248
229
therapeutics for these diseases and give insights into the regulation of endochondral ossification
via TRPV4.
5.8 References
1. A. Superti-Furga, S. Unger, Nosology and classification of genetic skeletal disorders: 2006
revision. Am J Med Genet A 143A, 1-18 (2007).
2. D. Krakow, D. L. Rimoin, The skeletal dysplasias. Genet. Med. 12, 327-341 (2010).
3. A.-V. Ngo, M. Thapa, J. Otjen, S. Kamps, Skeletal Dysplasias: Radiologic Approach with
Common and Notable Entities. Seminars in Musculoskeletal Radiology 22, 066-080 (2018).
4. S. F. Nemec et al., The importance of conventional radiography in the mutational analysis of
skeletal dysplasias (the TRPV4 mutational family). Pediatr. Radiol. 42, 15-23 (2012).
5. I. M. Orioli, E. E. Castilla, J. G. Barbosa-Neto, The birth prevalence rates for the skeletal
dysplasias. J. Med. Genet. 23, 328-332 (1986).
6. S. Sun, in Mutagenesis, Kang, Ed. (InTech, 2012).
7. E. Andreucci et al., TRPV4 related skeletal dysplasias: a phenotypic spectrum highlighted
byclinical, radiographic, and molecular studies in 21 new families. Orphanet J. Rare Dis. 6,
37 (2011).
8. M. J. Rock et al., Gain-of-function mutations in TRPV4 cause autosomal dominant
brachyolmia. Nat. Genet. 40, 999-1003 (2008).
9. S. S. Kang, S. H. Shin, C.-K. Auh, J. Chun, Human skeletal dysplasia caused by a
constitutive activated transient receptor potential vanilloid 4 (TRPV4) cation channel
mutation. Exp. Mol. Med. 44, 707 (2012).
10. N. Camacho et al., Dominant TRPV4 mutations in nonlethal and lethal metatropic dysplasia.
Am J Med Genet A 152A, 1169-1177 (2010).
11. S. Loukin, Z. Su, C. Kung, Increased basal activity is a key determinant in the severity of
human skeletal dysplasia caused by TRPV4 mutations. PLoS One 6, e19533 (2011).
12. H. A. Leddy et al., Follistatin in chondrocytes: the link between TRPV4 channelopathies and
skeletal malformations. FASEB J. 28, 2525-2537 (2014).
13. S. Muramatsu et al., Functional gene screening system identified TRPV4 as a regulator of
chondrogenic differentiation. J. Biol. Chem. 282, 32158-32167 (2007).
14. C. J. O'Conor, H. A. Leddy, H. C. Benefield, W. B. Liedtke, F. Guilak, TRPV4-mediated
mechanotransduction regulates the metabolic response of chondrocytes to dynamic loading.
Proc. Natl. Acad. Sci. U. S. A. 111, 1316-1321 (2014).
15. D. L. Rimoin et al., The Skeletal Dysplasias: Clinical Molecular Correlations. Ann. N. Y.
Acad. Sci. 1117, 302-309 (2007).
16. G. Breeland, M. A. Sinkler, R. G. Menezes, Embryology, Bone Ossification. (Treasure
Island (FL): StatPearls Publishing, SttatPearls (Internet), 2021).
Page 249
230
17. A. J. Sophia Fox, A. Bedi, S. A. Rodeo, The basic science of articular cartilage: structure,
composition, and function. Sports Health 1, 461-468 (2009).
18. R. Nishimura et al., Regulation of endochondral ossification by transcription factors. Front
Biosci (Landmark Ed) 17, 2657-2666 (2012).
19. C. Prein, F. Beier, ECM signaling in cartilage development and endochondral ossification.
Curr. Top. Dev. Biol. 133, 25-47 (2019).
20. K. Amano et al., Sox9 Family Members Negatively Regulate Maturation and Calcification of
Chondrocytes through Up-Regulation of Parathyroid Hormone–related Protein. Mol. Biol.
Cell 20, 4541-4551 (2009).
21. R. Nishimura, K. Hata, T. Matsubara, M. Wakabayashi, T. Yoneda, Regulation of bone and
cartilage development by network between BMP signalling and transcription factors. J.
Biochem. 151, 247-254 (2012).
22. T. Hattori et al., SOX9 is a major negative regulator of cartilage vascularization, bone
marrow formation and endochondral ossification. Development 137, 901-911 (2010).
23. J. C. Lui et al., Persistent Sox9 expression in hypertrophic chondrocytes suppresses
transdifferentiation into osteoblasts. Bone 125, 169-177 (2019).
24. M. M. Weinstein, S. W. Tompson, Y. Chen, B. Lee, D. H. Cohn, Mice expressing mutant
Trpv4 recapitulate the human TRPV4 disorders. J Bone Miner Res 29, 1815-1822 (2014).
25. H. A. Leddy, A. L. McNulty, F. Guilak, W. Liedtke, Unraveling the mechanism by which
TRPV4 mutations cause skeletal dysplasias. Rare Dis 2, e962971 (2014).
26. K. Takahashi et al., Induction of Pluripotent Stem Cells from Adult Human Fibroblasts by
Defined Factors. Cell 131, 861-872 (2007).
27. S. S. Adkar et al., Genome Engineering for Personalized Arthritis Therapeutics. Trends Mol.
Med. 23, 917-931 (2017).
28. M.-S. Lee et al., Comparative evaluation of isogenic mesodermal and ectomesodermal
chondrocytes from human iPSCs for cartilage regeneration. Science Advances 7, eabf0907
(2021).
29. B. Saitta et al., Patient-derived skeletal dysplasia induced pluripotent stem cells display
abnormal chondrogenic marker expression and regulation by BMP2 and TGFbeta1. Stem
Cells Dev. 23, 1464-1478 (2014).
30. K. Nonaka et al., Novel gain-of-function mutation of TRPV4 associated with accelerated
chondrogenic differentiation of dental pulp stem cells derived from a patient with metatropic
dysplasia. Biochem Biophys Rep 19, 100648 (2019).
31. S. S. Adkar et al., Step-Wise Chondrogenesis of Human Induced Pluripotent Stem Cells and
Purification Via a Reporter Allele Generated by CRISPR-Cas9 Genome Editing. Stem Cells
37, 65-76 (2019).
32. A. Dicks et al., Prospective isolation of chondroprogenitors from human iPSCs based on cell
surface markers identified using a CRISPR-Cas9-generated reporter. Stem Cell. Res. Ther.
11, 66 (2020).
33. C. L. Wu et al., Single cell transcriptomic analysis of human pluripotent stem cell
Page 250
231
chondrogenesis. Nat Commun 12, 362 (2021).
34. L. Votava, A. G. Schwartz, N. S. Harasymowicz, C. L. Wu, F. Guilak, Effects of dietary fatty
acid content on humeral cartilage and bone structure in a mouse model of diet-induced
obesity. J. Orthop. Res. 37, 779-788 (2019).
35. R. E. Wilusz, S. Zauscher, F. Guilak, Micromechanical mapping of early osteoarthritic
changes in the pericellular matrix of human articular cartilage. Osteoarthritis Cartilage 21,
1895-1903 (2013).
36. E. M. Darling, R. E. Wilusz, M. P. Bolognesi, S. Zauscher, F. Guilak, Spatial mapping of the
biomechanical properties of the pericellular matrix of articular cartilage measured in situ via
atomic force microscopy. Biophys. J. 98, 2848-2856 (2010).
37. E. M. Darling, S. Zauscher, F. Guilak, Viscoelastic properties of zonal articular chondrocytes
measured by atomic force microscopy. Osteoarthritis Cartilage 14, 571-579 (2006).
38. N. A. Zelenski et al., Type VI Collagen Regulates Pericellular Matrix Properties,
Chondrocyte Swelling, and Mechanotransduction in Mouse Articular Cartilage. Arthritis
Rheumatol 67, 1286-1294 (2015).
39. K. J. Livak, T. D. Schmittgen, Analysis of relative gene expression data using real-time
quantitative PCR and the 2(-Delta Delta C(T)) Method. Methods 25, 402-408 (2001).
40. A. Dobin et al., STAR: ultrafast universal RNA-seq aligner. Bioinformatics 29, 15-21 (2013).
41. Y. Liao, G. K. Smyth, W. Shi, featureCounts: an efficient general purpose program for
assigning sequence reads to genomic features. Bioinformatics 30, 923-930 (2014).
42. R. Patro, G. Duggal, M. I. Love, R. A. Irizarry, C. Kingsford, Salmon provides fast and bias-
aware quantification of transcript expression. Nat. Methods 14, 417-419 (2017).
43. L. Wang, S. Wang, W. Li, RSeQC: quality control of RNA-seq experiments. Bioinformatics
28, 2184-2185 (2012).
44. M. I. Love, W. Huber, S. Anders, Moderated estimation of fold change and dispersion for
RNA-seq data with DESeq2. Genome Biol. 15, 550 (2014).
45. R. Kolde. (2015).
46. H. Wickham, ggplot2: Elegant Graphics for Data Analysis. Use R! (Springer-Verlag New
York, ed. 1, 2009).
47. H. Chen, P. C. Boutros, VennDiagram: a package for the generation of highly-customizable
Venn and Euler diagrams in R. BMC Bioinformatics 12, 35 (2011).
48. U. Raudvere et al., g:Profiler: a web server for functional enrichment analysis and
conversions of gene lists (2019 update). Nucleic Acids Res. 47, W191-W198 (2019).
49. N. Altman, M. Krzywinski, Clusterinig. Nat. Methods 14, 545-546 (2017).
50. N. T. Doncheva, J. H. Morris, J. Gorodkin, L. J. Jensen, Cytoscape StringApp: Network
Analysis and Visualization of Proteomics Data. J. Proteome Res. 18, 623-632 (2019).
51. P. Shannon, Cytoscape: A Software Environment for Integrated Models of Biomolecular
Interaction Networks. Genome Res. 13, 2498-2504 (2003).
Page 251
232
52. D. Merico, R. Isserlin, O. Stueker, A. Emili, G. D. Bader, Enrichment Map: A Network-
Based Method for Gene-Set Enrichment Visualization and Interpretation. PLoS One 5,
e13984 (2010).
53. P. Kanju et al., Small molecule dual-inhibitors of TRPV4 and TRPA1 for attenuation of
inflammation and pain. Sci. Rep. 6, 26894 (2016).
54. M. Jin et al., Determinants of TRPV4 activity following selective activation by small
molecule agonist GSK1016790A. PLoS One 6, e16713 (2011).
55. B. O. Diekman et al., Cartilage tissue engineering using differentiated and purified induced
pluripotent stem cells. Proc. Natl. Acad. Sci. U. S. A. 109, 19172-19177 (2012).
56. R. R. Yammani, S100 proteins in cartilage: role in arthritis. Biochim Biophys Acta 1822, 600-
606 (2012).
57. A. Seifert, Role of Hox genes in stem cell differentiation. World J. Stem Cells 7, 583 (2015).
58. A. M. Craft et al., Generation of articular chondrocytes from human pluripotent stem cells.
Nat. Biotechnol. 33, 638-645 (2015).
59. W. C. Chu et al., Distribution of pericellular matrix molecules in the temporomandibular
joint and their chondroprotective effects against inflammation. International Journal of Oral
Science 9, 43-52 (2017).
60. M. M. J. Caron et al., Aggrecan and COMP Improve Periosteal Chondrogenesis by Delaying
Chondrocyte Hypertrophic Maturation. Frontiers in Bioengineering and Biotechnology 8,
(2020).
61. J. T. Hecht, E. H. Sage, Retention of the Matricellular Protein SPARC in the Endoplasmic
Reticulum of Chondrocytes from Patients with Pseudoachondroplasia. J. Histochem.
Cytochem. 54, 269-274 (2006).
62. T. Iimura, O. Pourquié, Hox genes in time and space during vertebrate body formation.
Development, Growth & Differentiation 49, 265-275 (2007).
63. P. M. Deprez, M. G. Nichane, B. G. Lengele, R. Rezsohazy, C. Nyssen-Behets, Molecular
study of a Hoxa2 gain-of-function in chondrogenesis: a model of idiopathic proportionate
short stature. Int. J. Mol. Sci. 14, 20386-20398 (2013).
64. L. Massip et al., Expression of Hoxa2 in cells entering chondrogenesis impairs overall
cartilage development. Differentiation 75, 256-267 (2007).
65. B. Kanzler, S. J. Kuschert, Y. H. Liu, M. Mallo, Hoxa-2 restricts the chondrogenic domain
and inhibits bone formation during development of the branchial area. Development 125,
2587-2597 (1998).
66. S. Creuzet, G. Couly, C. Vincent, N. M. Le Douarin, Negative effect of Hox gene expression
on the development of the neural crest-derived facial skeleton. Development 129, 4301-4313
(2002).
67. X. Li, BMP Signaling and Skeletogenesis. Ann. N. Y. Acad. Sci. 1068, 26-40 (2006).
68. K. M. Pineault, D. M. Wellik, Hox Genes and Limb Musculoskeletal Development. Current
Osteoporosis Reports 12, 420-427 (2014).
Page 252
233
69. F. Chen, J. Greer, M. R. Capecchi, Analysis of Hoxa7/Hoxb7 mutants suggests periodicity in
the generation of the different sets of vertebrae. Mech. Dev. 77, 49-57 (1998).
70. D. M. Wellik. (Elsevier, 2009), pp. 257-278.
71. F. Qu, I. C. Palte, P. M. Gontarz, B. Zhang, F. Guilak, Transcriptomic analysis of bone and
fibrous tissue morphogenesis during digit tip regeneration in the adult mouse. The FASEB
Journal 34, 9740-9754 (2020).
72. X. Li, X. Cao, BMP signaling and HOX transcription factors in limb development. Front.
Biosci. 8, s805-812 (2003).
73. M. V. Volpe et al., Regulatory Interactions between Androgens, Hoxb5, and TGFβSignaling
in Murine Lung Development. BioMed Research International 2013, 1-12 (2013).
74. S. Woods et al., Regulation of TGFβ Signalling by TRPV4 in Chondrocytes. Cells 10, 726
(2021).
75. R. J. Nims et al., A synthetic mechanogenetic gene circuit for autonomous drug delivery in
engineered tissues. Science Advances 7, eabd9858 (2021).
76. I. Polur, P. L. Lee, J. M. Servais, L. Xu, Y. Li, Role of HTRA1, a serine protease, in the
progression of articular cartilage degeneration. Histol. Histopathol. 25, 599-608 (2010).
77. H. Miraoui, P. J. Marie, Pivotal role of Twist in skeletal biology and pathology. Gene 468, 1-
7 (2010).
78. T. Michigami, Current understanding on the molecular basis of chondrogenesis. Clin Pediatr
Endocrinol 23, 1-8 (2014).
79. A. Taillandier et al., Molecular diagnosis of hypophosphatasia and differential diagnosis by
targeted Next Generation Sequencing. Mol Genet Metab 116, 215-220 (2015).
80. N. Hanagata, IFITM5 mutations and osteogenesis imperfecta. Journal of Bone and Mineral
Metabolism 34, 123-131 (2016).
81. J. D. Hayes, J. U. Flanagan, I. R. Jowsey, GLUTATHIONE TRANSFERASES. Annual
Review of Pharmacology and Toxicology 45, 51-88 (2005).
82. C.-T. Chen, Y.-R. V. Shih, T. K. Kuo, O. K. Lee, Y.-H. Wei, Coordinated Changes of
Mitochondrial Biogenesis and Antioxidant Enzymes During Osteogenic Differentiation of
Human Mesenchymal Stem Cells. Stem Cells 26, 960-968 (2008).
83. K. Morita et al., Reactive oxygen species induce chondrocyte hypertrophy in endochondral
ossification. J. Exp. Med. 204, 1613-1623 (2007).
84. E. Fragonas et al., Sensitivity of chondrocytes of growing cartilage to reactive oxygen
species. Biochimica et Biophysica Acta (BBA) - General Subjects 1425, 103-111 (1998).
85. F. Atashi, A. Modarressi, M. S. Pepper, The Role of Reactive Oxygen Species in
Mesenchymal Stem Cell Adipogenic and Osteogenic Differentiation: A Review. Stem Cells
Dev. 24, 1150-1163 (2015).
86. J. van Holten et al., Treatment with recombinant interferon-beta reduces inflammation and
slows cartilage destruction in the collagen-induced arthritis model of rheumatoid arthritis.
Arthritis Res. Ther. 6, R239-249 (2004).
Page 253
234
87. R. Zhao et al., Exogenous IFN-beta regulates the RANKL-c-Fos-IFN-beta signaling pathway
in the collagen antibody-induced arthritis model. J. Transl. Med. 12, 330 (2014).
88. G. Palmer et al., Interferon beta stimulates interleukin 1 receptor antagonist production in
human articular chondrocytes and synovial fibroblasts. Ann. Rheum. Dis. 63, 43-49 (2004).
89. X. Hu, H. H. Ho, O. Lou, C. Hidaka, L. B. Ivashkiv, Homeostatic role of interferons
conferred by inhibition of IL-1-mediated inflammation and tissue destruction. J. Immunol.
175, 131-138 (2005).
90. L. Gao, J. Liesveld, J. Anolik, A. McDavid, R. J. Looney, IFNβ signaling inhibits
osteogenesis in human SLE bone marrow. LUPUS 29, 1040-1049 (2020).
91. X. Huang, L. Zhong, J. Hendriks, J. N. Post, M. Karperien, The Effects of the Wnt-Signaling
Modulators BIO and PKF118-310 on the Chondrogenic Differentiation of Human
Mesenchymal Stem Cells. Int. J. Mol. Sci. 19, (2018).
92. W. Hou et al., Cation Channel Transient Receptor Potential Vanilloid 4 Mediates
Topography-Induced Osteoblastic Differentiation of Bone Marrow Stem Cells. ACS
Biomaterials Science & Engineering 5, 6520-6529 (2019).
Page 254
235
Chapter 6
Skeletal Dysplasia-causing TRPV4 Mutations
Increase Mechanosensitivity of
Human iPSC-derived Chondrocytes
6.1 Abstract
Transient receptor potential vanilloid 4 (TRPV4) is a mechanically sensitive ion channel highly
expressed in chondrocytes. Mutations in TRPV4 prevent proper skeletal development and cause
skeletal dysplasias, such as V620I and T89I that lead to brachyolmia and metatropic dysplasia,
respectively. However, how these mutations alter mechanotransduction and inhibit chondrocyte
hypertrophy and endochondral ossification has yet to be elucidated. Therefore, we
chondrogenically differentiated human induced pluripotent stem cells (hiPSCs) harboring the
moderate V620I and severe T89I TRPV4 mutations. We cultured the derived chondrocytes in an
agarose hydrogel prior to compressive loading of 10% strain at 1 Hz for 3 hours. Using mRNA
sequencing and bioinformatic analyses, we assessed the transcriptomic response of chondrocytes
0, 3, 12, and 24 hours after loading. hiPSC-derived chondrocytes synthesized cartilaginous
matrix in agarose hydrogels. We observed an increased mechanosensitivity of mutant TRPV4
with higher fold changes and more differentially expressed genes compared to the wildtype
control. From the transcriptomic data, we propose that TRPV4 mutations V620I and T89I
increase cell cycle regulating genes (e.g., E2F1, TP53, NFKB1) resulting in continued
proliferation of chondrocytes and inhibition of hypertrophy, ultimately leading to the
dysfunctional developmental phenotype in skeletal dysplasias.
Page 255
236
6.2 Introduction
Articular cartilage lines the ends of long bones and provides a nearly frictionless surface for joint
movements (1). Interestingly, not only does cartilage withstand millions of cycles of loading, but
loading maintains the homeostasis of the tissue (2, 3). Chondrocytes, the primary residing cell
type, synthesize and degrade extracellular matrix (ECM) proteins, including glycosaminoglycans
(GAGs) and type II collagen (COL2A1), in response to physiologic loading (1, 4). Chondrocyte
mechanotransduction occurs as compressive, shear, hydrostatic pressure, and osmotic forces are
filtered through the pericellular matrix surrounding the chondrocyte to mechanosensors, such as
integrins, primary cillium, and ion channels (5, 6). The signal is then converted into downstream
pathways (e.g., Indian hedgehog, Wnt, TGFβ, MAPK-ERK) and results in transcriptomic
changes (5). One mechanosensor of particular interest is ion channel transient receptor potential
vanilloid 4 (TRPV4).
TRPV4 is a non-selective cation channel activated by, but not limited to, heat, acidity,
chemical agonists (e.g., 4α-phorbol 12,13-didecanoate, ruthenium red, GSK1016790A),
osmolarity, and mechanical loading (7, 8). The channel is expressed throughout the body with
high expression in chondrocytes (7). In fact, TRPV4 is essential to the development and
homeostasis of cartilage. TRPV4 activation increased expression of chondrogenic transcription
factor SRY-box transcription factor 9 (SOX9) promoting chondrogenesis in ATDC5 cells (9) and
increased matrix production and Young’s modulus in primary porcine chondrocytes (4).
However, knockout of TRPV4 in murine adipose-derived stem cells decreased chondrogenic
potential (10). To better understand the downstream effects of TRPV4 activation on
chondrocytes, our recent study identified the shared transcriptome between TRPV4 activation via
loading and chemical agonist GSK1016790A (GSK101; 11). The primary porcine chondrocytes
Page 256
237
had increased gene expression associated with rheumatoid arthritis, TGFβ signaling, and PPAR
signaling (11). These results highlight the essential function of mechanical loading on cartilage
development and homeostasis, particularly via TRPV4 and its downstream signaling cascades.
In fact, mutations in TRPV4 have been shown to cause skeletal dysplasias, diseases of
improper skeletal development (12, 13). For example, the V620I substitution causes moderate
autosomal dominant brachyolmia, and the T89I substitution causes severe, neonatally lethal
metatropic dysplasia. Both mutations lead to a disproportionate skeletal phenotype with scoliosis
and deformed long bones (14, 15). Previous studies, including ours, showed increased basal
membrane currents with V620I and T89I TRPV4 (16-18). However, there have been conflicting
results as to whether the mutant channel has increased or decreased sensitivity to activation via
chemical agonist GSK101 and hypotonic solutions (16-18). Using human induced pluripotent
stem cells (hiPSC)-derived chondrocytes, we found that V620I and T89I mutations decrease
channel sensitivity to GSK101 and delay and inhibit chondrocyte hypertrophy (18). However,
how the mutations alter the response to mechanical, compressive loading, has not been
elucidated. Here, we investigate the transient, transcriptomic response of hiPSC-derived
chondrocytes to physiologic, cyclic loading and the differences in the response due to dysplasia-
causing gain-of-function mutations. These results will provide insights into TRPV4
mechanotransduction, hiPSC-derived tissue-engineered cartilage optimization, and skeletal
dysplasia treatments.
6.3 Methods
6.3.1 hiPSC culture
BJFF.6 (BJFF; Washington University Genome Engineering and iPSC Center (GEiC)) was the
isogenic, wildtype control hiPSC line used in this study. V620I and T89I substitutions were
Page 257
238
added to BJFF using CRISPR-Cas9 to create the two mutated hiPSC lines as previously
described (19). The hiPSCs were cultured on vitronectin (VTN-N; Fisher Scientific, A14700)-
coated plates and fed Essential 8 Flex medium (E8; Gibco, A2858501) daily. For expansion,
cells were passaged at 80-90% confluency using ReLeSR (STEMCELL Technologies, 05872)
and cultured with rock inhibitor Y-27632 (STEMCELL Technologies, 72304) for 24 hours. For
mesodermal differentiation, cells were induced at 30-40% confluency.
6.3.2 Mesodermal differentiation
The hiPSCs were differentiated along the mesodermal lineage to chondroprogenitors in
monolayer for 12 days as previously described (19-21). In brief, the cells were fed daily with
mesodermal differentiation medium: Iscove’s Modified Dulbecco’s Medium, glutaMAX
(IMDM; Gibco, 31980097) and Ham’s F-12 nutrient mix, glutaMAX (F12; Gibco, 31765092) in
equal parts supplemented with 1% penicillin-streptomycin (P/S; Gibco, 15140122), 1% Insulin-
Transferrin-Selenium (ITS+; Gibco, 41400045), 1% chemically defined concentrated lipids
(Thermo Fisher Scientific, 11905031), and 450 µM 1-thioglycerol (Millipore Sigma, M6145).
Various combinations of growth factors and small molecules were used each day for specified
differentiation: day 1, anterior primitive streak, 30 ng/ml Activin (R&D Systems, 338-AC), 20
ng/ml FGF2 (R&D Systems, 233-FB-025/CF), 4 µM CHIR99021 (Reprocell, 04-0004-02); day
2, paraxial mesoderm, 20 ng/ml FGF2, 3 µM CHIR99021, 2 µM SB505124 (Tocris Bioscience,
3263), 4 µM dorsomorphin (DM; Reprocell, 04-0024); day 3, early somite, 2 µM SB505124, 4
µM dorsomorphin, 500 nM PD173074 (Tocris Bioscience, 3044), 1 µM Wnt-C59 (Cellagen
Technologies, C7641-2s); days 4-6, sclerotome, 1 µM Wnt-C59, 2 µM purmorphamine
(Reprocell, 04-0009); and days 7-12, chondroprogenitor cells, 20 ng/ml BMP4 (R&D Systems,
314-BP-010CF)). The chondroprogenitor cells were then disassociated with TrypLE™ Select
Page 258
239
Enzyme (1X), no phenol red (Gibco, 12563029) for chondrogenic differentiation.
6.3.3 Chondrogenic differentiation
Chondroprogenitor cells were chondrogenically differentiated for 28 days in a high-density, 3D
pellet culture as previously described (19-21). Chondroprogenitor cells were resuspended at 5 x
105 cells/mL in chondrogenic medium: Dulbecco’s Modified Eagle Medium/F12, glutaMAX
(DMEM/F12; Gibco, 10565042), 1% P/S, 1% ITS+, 1% Modified Eagle Medium (MEM) with
nonessential amino acids (NEAA; Gibco, 11140050), 0.1% dexamethasone (Dex; Millipore
Sigma, D4902), and 0.1% 2-Mercaptoethnol (2-ME; Gibco, 21985023) supplemented with 0.1%
L-ascorbic acid (ascorbate; Millipore Sigma, A8960), 0.1% L-proline (proline; Millipore Sigma,
P5607), 10 ng/ml human transforming growth factor beta 3 (TGFβ3; R&D Systems, 243-B3-
010/CF), 1 µM Wnt-C59, and 1 µM ML329 (Cayman Chemical, 22481). Pellets were formed by
centrifuging 1 mL of the cell solution in a 15-mL conical tube and fed every 3-4 days.
6.3.4 Digestion of chondrogenic pellets to obtain hiPSC-derived chondrocytes
A 0.4% w/v type II collagenase (Worthington Biochemical, LS00417) digestion solution was
created in DMEM/F12 with 10% fetal bovine serum (FBS; Atlanta Biologicals, S11550). Day-28
chondrogenic pellets were then rinsed and digested in an equal volume of digestion solution (1
mL per pellet) on an orbital shaker at 37 ºC. Digestion solution with pellets was vortexed every
20 minutes until tissue was no longer visible and was neutralized with an equal volume of
DMEM/F12 with 10% FBS.
6.3.5 Casting of hiPSC-derived chondrocytes in agarose
A 4% (w/v) agarose (low gelling temperature Type VII-A; Sigma, A0701) solution was made in
PBS and autoclaved. hiPSC-derived chondrocytes were resuspended in chondrogenic medium at
6 x 10⁷ cells/mL and mixed with an equal volume of 60 ºC agarose. The 3 x 10⁷ cells per 1 mL of
Page 259
240
2% agarose solution was cast in a mold for 10 min at room temperature before creating disks
with a 3 mm diameter biopsy punch. Agarose constructs were fed every 3-4 days with
chondrogenic medium for 2 weeks to allow for matrix production.
6.3.6 Inhibition of TRPV4 during culture
Some agarose constructs were continued in culture for an addition 2 weeks. The chondrogenic
medium was supplemented with 20 µM GSK205 (cat. num. AOB1612 1263130-79-5;
AOBIOUS, Gloucester, MA) or an equal volume of DMSO for 1 hour per day, 5 days per week
for 2 weeks.
6.3.7 Analysis of elastic modulus
Agarose constructs were transferred to PBS and stored at 4 ºC for mechanical testing. Using the
ELF 3220 (ELectroForce with WinTest Software, EnduraTEC Systems Corporation), a 2 g tare
was applied to the constructs before undergoing a stress relaxation test with a 10% displacement
at a rate of 1 µm/s for 20 min to calculate the elastic modulus of the constructs.
6.3.8 Histology
Agarose constructs were fixed and dehydrated in sequential steps of increasing ethanol and
xylene solutions until embedded in paraffin wax. Wax blocks were cut into 8 µm sections on
microscope slides, and slides were rehydrated in ethanol and water. Nuclei were stained with
Harris hematoxylin and sGAGs with Safranin-O. Antigen retrieval was performed on rehydrated
slides followed by blocking, the addition of primary and secondary antibodies, and AEC
development to label type II collagen proteins and Vector Hematoxylin QS counterstain.
6.3.9 Biochemical analysis
Agarose were rinsed in PBS and digested in a papain solution at 65 ºC overnight. Sulfated
glycosaminoglycan (sGAG) content was measured using a dimethylmethylene blue (DMMB)
Page 260
241
solution. Double-stranded DNA (dsDNA) was measured using the PicoGreen assay (Quant-iT™
PicoGreen™ dsDNA Assay Kit, P7589). sGAG content was normalized to dsDNA.
6.3.10 Sinusoidal compressive loading
After 2 weeks, agarose constructs were switched to chondrogenic medium without TGFβ3.
Constructs were sinusoidally loaded with a 10% peak-to-peak strain at 1 Hz for 3 hours at 37 ºC
alongside a free swelling control. The loading was performed with a custom-made bioreactor (4,
11). The loaded agarose constructs were incubated until harvested in chondrogenic medium
without TGFβ3. Agarose constructs were rinsed and snap frozen 0, 3 (2 samples), 12, or 24
hours after loading completed. The free-swelling constructs were harvested at 0 hours,
immediately after loading. Constructs were stored at -80 ºC until RNA isolation.
6.3.11 RNA isolation
Samples were thawed on ice, lysed, and homogenized. RNA was isolated using the Quiagen
Total RNA Purification Plus Kit (Norgen Biotek, 48400) according to manufacturer instructions
and immediately submitted for mRNA sequencing with the Genome Technology Access Center
at Washington University in St. Louis (GTAC).
6.3.12 Genome-wide mRNA sequencing
Libraries were prepared according to manufacturer’s protocol. Samples were indexed, pooled,
and sequenced at a depth of 30 million reads per sample on an Illumina NovaSeq 6000. Basecalls
and demultiplexing were performed with Illumina’s bcl2fastq software and a custom python
demultiplexing program with a maximum of one mismatch in the indexing read. RNA-seq reads
were then aligned to the Ensembl release 76 primary assembly with STAR version 2.5.1a (22).
Gene counts were derived from the number of uniquely aligned unambiguous reads by
Subread:featureCount version 1.4.6-p5 (23). Isoform expression of known Ensembl transcripts
Page 261
242
were estimated with Salmon version 0.8.2 (24). Sequencing performance was assessed for the
total number of aligned reads, total number of uniquely aligned reads, and features detected. The
ribosomal fraction, known junction saturation, and read distribution over known gene models
were quantified with RSeQC version 2.6.2 (25).
6.3.13 Transcriptomic analysis of sequencing datasets
Working in RStudio, we used the DESeq package to read un-normalized gene counts and remove
the genes if they had counts lower than 200 (26). Regularized-logarithm transformed data of the
samples were visualized with the ggplot2 package (27) to create a principal component analysis
(PCA). The two 3-hour replicates clustered together confirming reproducibility and were then
averaged together. The up-regulated differentially expressed genes (DEGs) were determined at
each time point compared to the free swelling control for each line and the total number were
plotted using GraphPad Prism. Genes were considered differentially expressed if adjusted p
value (padj) < 0.1 and log2(fold change) ≥ 1 or ≤ -1. The intersecting and unique DEGs between
time points for each cell lines and between cell lines at each time point were determined and
plotted with the intersect and setdiff, and venn.diagram functions (VennDiagram package (28)).
The fold change of top 25 genes in the intersection of the two mutants, but not WT, for each time
point were determined and the 0 and 3 hour gene lists and 12 and 24 hour gene lists were
visualized with the Pheatmap package (29). The fold changes at each time point of cAMP/Ca2+
transcription factors and TRPV4-responsive genes (11) were plotted using GraphPad Prism and
significance was indicated based on p values. The upregulated genes at 0, 3, 12, and 24 hours
were ordered based on log2(fold change) and analyzed with g:Profiler (30) and Transcriptional
Regulatory Relationships Unraveled by Sentence-based Text Mining (TRRUST) (31). gProfiler
identified KEGG and reactome pathways associated with the ordered gene set. Then, we plotted
Page 262
243
the negative log10 of the adjusted p value for each term using a function to scale circle diameter
to the p value in Illustrator. TRRUST identified associated transcription factors with the gene set,
and we plotted the log10(p value) of association for each transcription factor for either V620I or
T89I vs. WT on a scatter plot using GraphPad Prism. The transcription factors with the strongest
association to one line compared to the other on the graph were highlighted in that cell line’s
color and labeled. If the transcription factor was strongly associated with both lines, it was
labeled in grey. We also performed k-means clustering with 4 clusters and plotted the gene
expression trends (scaled mean counts) for each gene within the cluster with the average
expression trend overlaying for each cell line of the largest cluster using the tidyverse package
(32). Cluster 1 represented increased expression at 12 and 24 hours, and cluster 2 and 3
represented increased expression at 0 and 3 hours. The top 20 up-regulated genes from cluster 1
or clusters 2 and 3 for each cell line were determined. The log2(fold change) of that gene for each
group was plotted with pheatmap.
6.3.14 Statistical analysis
Replicates were graphed and analyzed using GraphPad Prism (Version 9.1.0). Outliers were
removed from the data using the ROUT method (Q = 1%), and the data were tested for normality
with the Shapiro-Wilk test ( = 0.05). A Kruskal-Wallis test was used if data was not normally
distributed. For biochemical analysis and mechanical properties, data were analyzed using an
ordinary two-way ANOVA, comparing each cell with all other cells, with Tukey’s post-hoc
multiple comparison test.
6.4 Results
6.4.1 hiPSC-derived chondrocytes secrete a cartilaginous matrix in agarose
hiPSC chondrogenesis occurs in a 3D, spherical pellet culture; however, compressive loading of
Page 263
244
a sphere results in an uneven distribution of stress throughout the tissue. Therefore, we digested
the day-28 chondrogenic pellets to obtain hiPSC-derived chondrocytes at a single-cell level that
were then cast in 2% agarose, cylindrical constructs and cultured for 2 weeks. This culture
system has been used extensively for mechanical loading studies with primary chondrocytes (4,
11). Like primary chondrocytes, the hiPSC-derived chondrocytes secreted cartilaginous matrix
(Figure 6.1A-C). Safranin-O staining of sGAGs showed the chondrocytes began secreting matrix
directly around the cell, which was more distributed throughout the agarose in mutant lines
(Figure 6.1A). All lines also showed COL2A1 labeling, which appeared more localized around
the cell in WT (Figure 6.1B). The ratio of sGAG to dsDNA, as determined by biochemical
analysis, was not significantly different between lines, but T89I trended higher (T89I: 45.4 µg/µg
vs. WT: 22.2 µg/µg, p=0.4248 and V620I: 24.3 µg/µg, p=0.4720; Figure 6.1C).
Figure 6.1 hiPSC-derived chondrocytes secrete cartilaginous matrix in agarose after 2 weeks of
culture. (A-B) Day-28 hiPSC-derived chondrocytes seeded in agarose and cultured in
chondrogenic medium for 14 days secrete matrix rich in sGAGs as shown by Safranin-O staining
(A) and COL2A1 as labeled by IHC (B). Scale bar = 500 µm. (C) The three lines have similar
sGAG/DNA ratios between 20-40 µg/µg. Mean ± SEM. n-4. No significance after ordinary one-
way ANOVA.
Next, we investigated whether TRPV4 signaling was responsible for the matrix
Page 264
245
production within the agarose since severe mutation T89I appeared to increase sGAG secretion.
We continued to culture the agarose for an additional 2 weeks with and without TRPV4-specific
antagonist GSK205. The differences between lines with localization of Safranin-O staining were
no longer present at 4 weeks; however, WT had showed somewhat increased labeling for
COL2A1 (Figure 6.2A-B). Treatment with GSK205 appeared to slightly decrease sGAG staining
with no effect on COL2A1 labeling (Figure 6.2C-D). When quantified, TRPV4 inhibition
trended toward decreasing sGAG/DNA in T89I (veh vs. GSK205 (µg/µg) – WT: 57.7 vs. 52.5;
V620I: 52.3 vs. 59.9; T89I: 55.8 vs. 37.4; ns). The additional two weeks of culture did however
increase the sGAG/DNA ratio for all lines from an average of 20 to 50 µg/µg. We also observed
a trend of higher elastic moduli in mutants compared to WT, which was slightly attenuated by
GSK205 in T89I (veh vs. GSK205 (kPa) – WT: 98.8 vs. 83.9; V620I: 134.1 vs. 116.6; T89I:
140.8 vs. 70.4; ns).
Page 265
246
Figure 6.2 TRPV4 inhibition during hiPSC-derived chondrocyte agarose culture. (A-B) WT,
V620I, and T89I had similar matrix production after 4 weeks in culture as shown by Safranin-O
staining of sGAG (A) and IHC labeling of COL2A1 (B). (C-D) TRPV4 inhibition with GSK205
did not have a major effect on Safranin-O staining of sGAG (C) or IHC labeling of COL2A1
(D). Scale bar = 500 µm. (E) Quantification of the matrix production showed all three lines, with
and without GSK205, had an sGAG/DNA ratio of approximately 50 µg/µg. Mean ± SEM. n=3-
4. No significance with an ordinary two-way ANOVA. (F) V620I and T89I have slightly higher
elastic moduli (approximately 150 kPa) compared to WT (approximately 100 kPa), which
trended lower with GSK205 treatment. Mean ± SEM. n=3-4. No significance with an ordinary
two-way ANOVA.
6.4.2 Mutant chondrocytes are more responsive to loading
WT, V620I, and T89I 2-week agarose constructs were loaded with 10% strain at 1 Hz for 3
hours alongside a free swelling control (Figure 6.3A). The constructs were collected for mRNA
sequencing 0, 3, 12, and 24 hours after loading completed (Figure 6.3A). Principal component
analysis (PCA) shows that the 3 cell lines followed a similar trajectory over time post-loading;
Page 266
247
however, WT samples were more similar to each other at each time point than mutants (Figure
6.3B). This was further confirmed when comparing the number of upregulated DEGs at each
time point; in fact, T89I has more than double the number of upregulated DEGs than WT (WT:
887 vs. V620I: 1672 vs. T89I: 2379; Figure 6.3C). We then compared the DEGs at each time
point within each line (Figure 6.3D). Interestingly, WT showed an increase in DEGs over time
with the largest response at 24 hours (0hr: 92 vs. 3hr: 237 vs. 12hr: 233 vs. 24 hr: 325; Figure
6.3D). However, V620I showed the largest response at 3 and 12 hours, with fewer DEGs than
WT at 24 hours (0hr: 157 vs. 3hr: 549 vs. 12hr: 676 vs. 24 hr: 290; Figure 6.3D). T89I had a
larger response at 0 hours than WT did at 24 hours, which continued to increase through 3, 12,
and 24 hours (0hr: 464 vs. 3hr: 656 vs. 12hr: 567 vs. 24 hr: 692; Figure 6.3D). For all lines,
many DEGs were unique to the time point, but the largest intersections were between 0 and 3
hours or 12 and 24 hours (Figure 6.3D). V620I also showed significant overlap between 3 and 12
hours (Figure 6.3D).
Page 267
248
Figure 6.3 Mechanical loading response of hiPSC-derived chondrocyte agarose. (A) The loading
regimen and sample collection timeline. Agarose constructs were loaded with 10% compressive
strain at 1 Hz for 3 hours alongside a free swelling control. Loaded constructs were harvested 0,
3, 12, and 24 hours after loading. (B) PCA comparing the free swelling and 0, 3, 12, and 24
hour-post-loading samples for WT, V620I, and T89I. Arrows indicate the trajectory over time for
each cell line. Two samples at 3 hours to show reproducibility. (C) The number of up-regulated
differentially expressed genes at each time point after loading compared to respective lines’ free
swelling control. T89I had more than twice the number of up-regulated DEGs in WT. (D) Venn
diagrams comparing the up-regulated DEGs at each time point for each cell line. Genes were
typically unique to each time point; however, 0 and 3 hours and 12 and 24 hours showed the
most similarity.
We compared expression over time of each of the three lines for cyclic adenosine
monophosphate (cAMP) and Ca2+ responsive transcription factors and other TRPV4-responsive
target genes as previously identified in porcine chondrocytes (11) (Figure 6.4A-I). There was
Page 268
249
immediate upregulation after loading, with higher expression in the severe T89I line, of
transcription factors jun proto-oncogene, AP-1 transcription factor subunit (JUN: 0 hr, T89I vs.
WT p<0.0001, T89I vs. V620I p<0.0001) and early growth response 1 and 2 (EGR1: 0 hr, T89I
vs. WT p <0.0001, T89I vs. V620I p=0.0043; EGR2: 0 hr, T89I vs. WT p < 0.0001; Figure 6.4A-
C). Nuclear receptor subfamily 4 group A member 2 (NR4A2) showed upregulation at 0 hours in
T89I (T89I vs. WT p<0.0001) but 3 hours in WT (WT vs. V620I p=0.0004, WT vs. T89I
p=0.0003; Figure 6.4D). Bone morphogenic proteins 2 and 6 (BMP2 and BMP6) had peak
expression at 3 hours post loading, with slightly higher expression in mutants (3 hr BMP2, T89I
vs. WT p=0.0009; Figure 6.4E-F). However, WT had higher BMP2 expression at 24 hours (WT
vs. V620I p<0.0001). Fos proto-oncogene, AP-1 transcription factor subunit (FOS) was
upregulated immediately after loading but had much lower expression in T89I (3 hr, T89I vs.
WT p=0.0019; Figure 6.4G). Nuclear receptor subfamily 4 group A member 3 (NR4A3; also
known as NOR-1; 3 hr, WT vs. V620I p=0.0018, WT vs. T89I p<0.0001) and CAMP responsive
element binding protein 1 (CREB1; ns) both had higher expression in WT compared to mutants
and were upregulated short- and long-term, respectively (Figure 6.4H-I).
Given that the TRPV4 mutants and WT showed similar trends, with varying expression
levels, we next investigated how similar the DEGs were between lines at each time point. The
majority of WT’s DEGs were shared with at least one mutant at each time point other than 12
hours with 74%, 81%, 36%, and 57% of the WT DEGs shared with both V620I and T89I at 0, 3,
12, and 24 hours, respectively (Figure 6.4J). V620I also shared the majority of the DEGs with
the other two lines and shared 43%, 41%, 44%, 24% of its total DEGs with T89I alone at 0, 3,
12, and 24 hours, respectively (Figure 6.4J). However, T89I was the most unique of the 3 lines
with 68%, 35%, 32%, and 54% of the total DEGs being unique to T89I at 0, 3, 12, and 24 hours,
Page 269
250
respectively (Figure 6.4J). These data indicate that the TRPV4 mutations were more sensitive to
loading with an increase in the number of upregulated genes as opposed to an altered response to
loading by changing the upregulated genes.
To investigate the overall expression pattern of the loading response and the expression
levels of the shared DEGS, we used hierarchical k means clustering. The loading response
resulted in 4 clusters (Figure 6.4K-O). The largest cluster (i.e., cluster 1) represented a long-term
response with genes that are upregulated at 12 and 24 hours post loading (Figure 6.4K-L). WT
had the highest mean counts by 24 hours; however, it also had the highest counts in the free
swelling control (Figure 6.4K-L). Cluster 2 and 3 represented the short-term response (Figure
6.4K, M-N). Genes in cluster 2 had an increase in expression 3 hours after loading and had
highest expression in T89I chondrocytes (Figure 6.4K, M). Genes in cluster 3 had increased
expression at 0 and 3 hours in V602I and T89I and decreased expression at 12 and 24 hours in all
lines (Figure 6.4K, N). Finally, cluster 4 represented genes downregulated by loading with the
highest expression in WT (Figure 6.4K, O).
Page 271
252
Figure 6.4 TRPV4 mutants had an altered and increased response to loading. (A-I) CAMP, Ca2+
responsive, and TRPV4 target genes JUN (A), EGR1 (B), EGR2 (C), NR4A2 (D), BMP2 (E),
BMP6 (F), FOS (G), NR4A2/NOR-1 (H), CREB1 (I) show altered response profiles between
WT, V620I, and T89I. *p<0.01 for T89I vs. WT; †p<0.01 for T89I vs. V620I; #p<0.01 for
V620I vs. WT. (J) Venn diagrams comparing cell lines at each time point indicate TRPV4
mutations upregulate many of the same as and additional genes compared to WT. (K)
Hierarchical clustering of the DEGs into 4 clusters. (L-O) The scaled mean count profile of each
line within the long-term upregulation cluster (L), 3-hour upregulation cluster (M), 0-hour
upregulation cluster (N), and the downregulation cluster (O).
6.4.3 Proliferative genes are upregulated long-term after loading
We investigated cluster 1 to understand the long-term response to loading (i.e., 12 and 24 hours
post-loading). Using the genes in cluster 1, we identified the top 20 upregulated genes for each
line at 12- and 24-hours post-loading and plotted the LogFC in a heatmap (Figure 6.5A). Despite
the mean count trends, mutants typically had higher LogFC of the top DEGs compared to WT,
likely because WT had higher expression of these genes in the free swelling control. There were
a few genes with the highest expression in V620I; these included cell adhesion genes integrin
subunit alpha 5 (ITGA5) and CXADR like membrane protein (CLMP), cell proliferation
regulator ALK and LTK ligand 2 (ALKAL2), and ECM remodeling protein matrix
metallopeptidase 10 (MMP10). WT had high expression, despite little to no expression in
mutants, of a few genes such as SRY-box transcription factor 12 (SOX12) and vascular
endothelial growth factor B (VEGFB). However, most of the genes showed increasing expression
from WT to the severe T89I mutant line. For example, many histone genes (e.g., H1-2 through 5,
H2BC14, H4C1) had high expression at 24 hours for all lines but was highest for T89I. These
genes also started increasing in expression at 12 hours in V620I and T89I but not in WT. Some
helicase genes (e.g., MCM2, MCM5, MCM6, MCM10) had high expression at 12 hours, which
slightly decreased at 24 hours, and was stronger in the mutants than WT.
Since many of the top up-regulated DEGs from cluster 1 were shared among the three
cell lines, albeit higher expression in mutants, we next investigated genes that were uniquely
Page 272
253
upregulated long-term in the mutants but not WT. We plotted the LogFC of top 25 upregulated
DEGs unique to V620I and T89I at 12 and 24 hours in a heatmap (Figure 6.5B). Similar to the
top genes in cluster 1, many of the long-term DEGs in mutants also showed increased expression
in WT, although not significant. We observed that for many genes, there was increased
expression at more time points in T89I compared to V620I and WT. An increase in expression
and time of expression was associated with an increase in disease severity in many genes,
including Ca2+ binding proteins S100A3 and S100A4, anti-synthetic insulin growth factor binding
protein 3 (IGFBP3), metalloproteases tolloid like 1 (TLL1) and pappalysin 1 (PAPPA), and
inflammatory interleukin 17 receptor C (IL17RC). Additionally, we observed that common
biological processes and pathways associated with the mutant-specific DEGs were associated
with cell cycle, mitosis, proliferation, and DNA elongation and replication, such as proliferative
histone H1-2 and transcription factor E2F1 and mini-chromosome maintenance protein MCM3.
To determine the transcription factors that are driving the response to loading at 12 and
24 hours, particularly those driving the differing responses between lines, we determined the
transcription factors associated with the upregulated genes at each time point using TRRUST
(Figure 6.5C-D). E2F1 and E2F4 were both strongly associated with V620I and T89I, but not
WT, at 12 hours; however, at 24 hours, they became associated with all three lines (Figure 6.5C-
D). TP53 had a similar pattern but remained stronger in the mutants despite an increase in
association in WT at 24 hours. All three are tumor suppressors and play a role in cell cycle
control. Interestingly, the association of transcription factors between mutants and WT is more
correlated at 24 hours (V620I vs. WT r2=0.8081, T89I vs. WT r2=0.8118) than 12 hours (V620I
vs. WT r2=0.1822, T89I vs. WT r2=0.0999), indicating the differences in response due to mutant
TRPV4 is occurring earlier.
Page 273
254
To better understand what pathways the upregulated genes were associated with, we used
g:Profiler to identify top KEGG and REAC pathways. V620I and T89I had higher association
with many DNA replication and stress and cell cycle processes compare to WT, both at 12 and
24 hours (Figure 6.5E-F). The upregulation of many histone genes resulted in an association with
DNA damage disorders such as systemic lupus erythematosus and alcoholism. Interestingly,
lupus was only associated with T89I at 12 hours (Figure 6.5E); however, at 24 hours, it was more
strongly associated with WT and V620I (Figure 6.5F).
Page 275
256
Figure 6.5 Long-term response to loading. (A) Top 20 up-regulated long-term genes from
cluster 1. Most of the genes show higher, and earlier, expression in mutants than WT. (B) The
top 25 genes upregulated in V620I and T89I, but not WT, at 12 and 24 hours. (C-D) Associated
transcription factors with the upregulated DEGs at 12 hours (C) and 24 hours (D). Log10(p value
of association) based on TRRUST data base plotted for V620I vs. WT and T89I vs. WT. Colored
transcription factors indicate a stronger association with one line or the other. Linear fit indicates
how correlated the mutant’s associated transcription factors are to WT’s. (E-F) The top
associated KEGG and REAC pathways to the upregulated DEGs at 12 hours (E) and 24 hours
(F) for each line. Circle color represents the cell line, and circle size represents the -log10(padj).
6.4.4 Loading upregulates ECM-related proteins, particularly with mutant
TRPV4
Next, we investigated clusters 2 and 3 to understand the short-term response (i.e., 0 and 3 hours
post loading). We plotted a heatmap with the LogFC of the top 20 upregulated genes in clusters 2
and 3 for each line 0- and 3-hours post-loading (Figure 6.6A). Most genes showed increased
expression at both 0 and 3 hours with higher expression at 3 hours. Interestingly, many of these
genes also showed high expression at 12 hours but only in the V620I line. Interleukin 1 receptor
like 1 (IL1RL1) was upregulated at 0, 3, and 12 hours for all lines but had the highest expression
in V620I. In fact, most genes had higher expression in mutants than WT. Some of the top
upregulated genes included actin filament protector xin actin binding repeat containing 1
(XIRP1), integrin signaling and actin linker FERM domain containing kindlin 1 (FERMT1),
tyrosine phosphorylation-dependent regulator CUB domain containing protein 1 (CDCP1),
TGFβ family member inhibin subunit beta A (INHBA), mechanoresponsive FOS family member
FosB proto-oncogene, AP-1 transcription factor subunit (FOSB), mechanoresponsive
transcription factors early growth response 1 and 2 (EGR1 and EGR2), negative regulator of the
MAPK family dual specificity phosphatase 2 (DUSP2), heparin binding epidermal growth factor
like growth factor (HBEGF), and interleukin 6 family cytokine LIF.
Furthermore, we explored the DEGs unique to V620I and T89I at 0 and 3 hours. The top
25 mutant-specific, short-term DEGs and their LogFC were plotted in a heatmap (Figure 6.6B).
Page 276
257
As expected, there was a slight, non-significant upregulation of many genes in WT as well.
There was also more sustained upregulation of a few genes in T89I compared to V620I. Short-
term genes were typically upregulated at either 0 and 3 hours or at 3 and 12 hours. However,
interestingly, some genes showed upregulation and 0 and 3 for T89I but 3 and 12 for V620I,
showing a faster response of the severely mutated TRPV4. Nuclear factor kappa B (NFκB)
regulator long non-coding RNA MIR31HG, BMP/SMAD-regulated keratin 16 (KRT16), and
mechanical signal transducer laminin subunit alpha 3 (LAMA3) were among the top mutant-
specific genes. Proliferation was a common theme for both short- and long-term with
upregulation of cell cycle progression oncogene MYC and chondrocyte proliferation gene high
mobility group AT-hook 2 (HMGA2) at 0 and 3 hours and 3 and 12 hours, respectively. The
short-term, mutant-specific genes also showed association with IL4/IL13 signaling, cell
migration and mobility, integrins, ligands, and ECM (e.g., upregulation of collagen chain
assembly gene prolyl 3-hydroxylase 2 [P3H2] at 3 and 12 hours). Despite the dysregulated
endochondral ossification associated with brachyolmia and metatropic dysplasia, many
hypertrophy-associated genes were upregulated with loading in V620I and T89I, including
RUNX Family Transcription Factor 3 (RUNX3), Indian hedgehog (IHH), and fibroblast growth
factor 1 (FGF1), which is found in growth plate cartilage.
We then looked at the transcription factors associated with upregulated genes at 0 and 3
hours for each line using TRRUST. Both 0 and 3 hours showed less correlation between the
mutants and WT than at 24 hours; however, the 3 lines were more similar at 3 hours (0 hr: V620I
vs. WT r2=0.4638, T89I vs. WT r2=0.4948; 3 hr: V620I vs. WT r2=0.4908, T89I vs. WT
r2=0.5639; Figure 6.5C, 6.6C-D). Pro-inflammatory nuclear factor kappa B subunit 1 (NFKB1)
was strongly associated with the two mutant lines at 0 hours and became more associated with
Page 277
258
WT at 3 hours, especially compared to T89I. T89I was highly associated with transcription factor
SP1 at both 0 and 3 hours while V620I was associated with SP1 at 3 hours. Enhancer of zeste
homolog 2 (EZH2), an epigenetic regulator of development and differentiation, was associated
with T89I and V620I, but not WT, at 0 and 3 hours, respectively. V620I and T89I also showed
unique association compared to WT with TGFβ family signaling antagonist SMAD family
member 7 (SMAD7) and NFκB inhibitor zinc finger protein 382 (ZNF382), respectively, at 3
hours. WT, however, had a stronger association with cytokine and chemokine transcription
factor ETS proto-oncogene 1 (ETS1) than both mutations at 0 hours. MEF2D was also unique to
WT’s upregulated genes at 3 hours.
Again, we assessed the top associated KEGG and REAC pathways with the upregulated
genes in each line at 0 and 3 hours (Figure 6.6E-F). The three lines shared a similar association
with nerve growth factor (NGF)-stimulated transcription at 0 hours, which was slightly
decreased at 3 hours in the mutant lines. At 0 hours, WT showed an association with
inflammatory pathways such as interleukin 17 (IL-17) and tumor necrosis factor (TNF) signaling
and cytokine-cytokine receptors unlike the mutations. In contrast, T89I uniquely had a strong
association with ECM organization and receptors, collagen formation, and proteoglycan
synthesis at 0 and 3 hours.
Page 279
260
Figure 6.6 Short-term response to loading. (A) Top 20 up-regulated genes short-term from
clusters 2 and 3. There is a similar expression profile between the three cell lines with slightly
higher expression in mutants than WT. (B) The top 25 genes upregulated in V620I and T89I, but
not WT, at 0 and 3 hours. (C-D) Associated transcription factors with the upregulated DEGs at 0
hours (C) and 3 hours (D). Log10(p value of association) based on TRRUST data base plotted for
V620I vs. WT and T89I vs. WT. Colored transcription factors indicate a stronger association
with one line or the other. Linear fit indicates how correlated the mutant’s associated
transcription factors are to WT’s. (E-F) The top associated KEGG and REAC pathways to the
upregulated DEGs at 0 hours (E) and 3 hours (F) for each line. Circle color represents the cell
line, and circle size represents the -log10(padj).
6.5 Discussion
To investigate how skeletal dysplasia-causing mutations alter TRPV4 mechanotransduction, we
used CRISPR-Cas9-edited hiPSCs harboring the moderate V620I and severe, neonatally lethal
T89I mutations. hiPSC-derived chondrocytes produced matrix rich in sGAGs and COL2A1 after
2 weeks of culture in agarose, and the constructs were then mechanically loaded to
physiologically mimic TRPV4 activation during development. V620I and T89I increased
TRPV4 mechanosensitivity and resulted in increased upregulation both in fold change and
number of differentially expressed genes (vs. free swelling controls) compared to WT. When we
evaluated the associated transcription factors and pathways with the up-regulated genes, mutant-
specific genes were associated with ECM, inflammation, and cell mobility at 0 and 3 hours post-
loading and proliferation and cell cycle at 12 and 24 hours post-loading. The mutant associated
transcription factors were the most different from WT 12 hours post loading; however, the three
lines became more similar at 24 hours. Our results indicate that gain-of-function mutations
V620I and T89I are hypersensitive to mechanical stimulus. The increased transcriptomic profiles
and downstream signaling likely lead to dysfunctional skeletal development resulting in
moderate brachyolmia and severe metatropic dysplasia.
To the best of our knowledge, this is the first study to mechanically load hiPSC-derived
chondrocytes and investigate mechanotransduction of mutant TRPV4. After 4 weeks in culture,
Page 280
261
WT hiPSC-derived chondrocyte-ridden agarose constructs achieved an elastic modulus of 100
kPa. These values are lower than what has been reported for adult cartilage tissue and tissue-
engineered cartilage with fibrous scaffold systems (compressive Young’s modulus = 240-850
kPa; aggregate modulus = 100-2000 kPa; Poisson’s ratio = 0.06-0.3) (33). However, the modulus
is greater than free-swelling primary porcine chondrocytes in agarose for 6 weeks, which had a
Young’s modulus of approximately 65 kPa (4), and hiPSC-derived chondrocytes in a collagen
type I scaffold, which had an average aggregate modulus of 85 kPa (Young’s modulus = 62.4-
83.4 kPa, assuming Poisson’s ratio is consistent with reported values of primary cartilage (33))
(34). The increase in modulus from 100 kPa to 150 kPa with mutant hiPSC-derived
chondrocytes, despite it not being significant, is indicative of increased TRPV4 activation. Not
only did GSK205 inhibition of TRPV4 slightly decrease the mechanical properties, but TRPV4
activation via mechanical, osmotic, and chemical stimuli has been shown to increase mechanical
properties of cartilage (4, 35).
The increased activation of mutant TRPV4 was further supported in this study with the
increase in upregulated DEGs and fold change of DEGs in response to cyclical, compressive
loading. Interestingly, there is conflicting evidence of the role of the gain-of-function V620I and
T89I mutations on channel activity. Studies using Xenopus oocytes, porcine chondrocytes, and
hiPSC-derived chondrocytes previously found both increases and decreases in basal, chemically
activated, and osmotically activated V620I-TRPV4 and T89I-TRPV4 compared to WT (16-18).
While it is well known that TRPV4 is activated by mechanical and osmotic loading and chemical
agonists, among other stimuli, the mechanisms of action are not well understood. Therefore,
TRPV4 may be activated and respond differently to various agonists. Additionally, the mutation
may alter sensitivity to these agonists differently. In fact, the effects of mutations on TRPV4
Page 281
262
mechanotransduction in chondrocytes has not been studied before despite studies in primary and
derived (e.g., hiPSC, dental pulp mesenchymal cells) chondrogenic, osteogenic, and neurogenic
cell types and model systems (e.g., oocytes) (16, 17, 36-40).
Histology from patients with brachyolmia and metatropic dysplasia show fewer
hypertrophic chondrocytes with cartilage islands within immature, woven bone, likely due to
dysfunctional endochondral ossification (12, 15, 41). Additionally, our previous study showed
that V620I and T89I inhibited BMP4-induced hypertrophy of hiPSC-derived chondrocytes (18).
In contrast, osteoblasts derived from dental pulp mesenchymal stem cells harboring metatropic
dysplasia-causing TRPV4 mutation L619F showed increased calcification and expression of
osteogenic genes runt-related transcription factor 2 (RUNX2), osteocalcin (OCN), and nuclear
factor of activated T cells 1 (NFATC1) (38). Therefore, it was hypothesized that ectopic
ossification occurs after direct osteoblastic differentiation of mesenchymal cells (15, 38),
indicative of dysfunction in the chondrocyte, hypertrophy, endochondral ossification pathway.
This was again highlighted in our results with both pro- and anti-hypertrophic gene expression in
response to loading in mutant chondrocytes compared to WT. For example, mutants had lower
expression compared to WT of skeletal development regulator SOX12 (42) 12 and 24 hours post
loading. In contrast, growth plate protein FGF1 (43) and endochondral ossification regulators
IHH and RUNX3 (44) were upregulated at 0 and 3 hours post loading. Despite the conflicting
expression of hypertrophy-associated genes, we observed an increase in expression of genes
associated with inflammation, cell mobility, and proliferation in V620I and T89I chondrocytes,
which may be responsible for the dysregulated skeletal development.
Given that proliferation inhibits chondrocyte maturation (45), the increased expression
and association with proliferative genes, such as E2F1, TP53, SP1, and MYC in mutants could be
Page 282
263
preventing chondrocyte hypertrophy. There was a unique upregulation of E2F1 in mutants at 12
and 24 hours, particularly in T89I. Additionally, association between the transcription factor and
the upregulated genes occurred earlier (i.e., 12 hours vs. 24 hours) in mutants compared to WT.
Beyond E2F1’s role in increasing proliferation, overexpression of the gene has been found to
suppress endochondral ossification with reduced chondrocyte maturation, collagen type X
expression and secretion, hypertrophic zones, and organization of the growth plate (46, 47). We
also saw a similar association between upregulated genes and TP53 with the association
occurring in mutants at 12 and 24 hours but only a small association with WT at 24 hours.
Interestingly, unlike E2F1, TP53 was not a top upregulated gene; however, it is associated with
many processes and genes involved in proliferation and endochondral ossification. TP53 is
regulated by cell cycle checkpoint kinase ATM, which was uniquely associated with V620I
DEGs compared to WT immediately after loading. Signaling from and overexpression of p53,
the protein encoded by TP53, has been shown to inhibit chondrocyte and osteoblast
differentiation (48-51). In fact, an increase in TP53 expression in MSCs promoted adipogenic
but inhibited osteogenic differentiation (52). This anti-osteogenic effect was rescued by FGF2-
induced TWIST2 expression (52), which is also uniquely associated with WT at 24 hours.
Furthermore, members of the p53 family have been found to promote SMAD7 expression
(53). Upregulated genes in V620I at 3 hours showed high association with SMAD7, which
inhibits TGFβ and activin signaling, and T89I had the highest expression of the transcription
factor. While SMAD7 is required to mediate cell stress in the growth plate (54), overexpression
inhibited chondrocyte hypertrophy (55). Interestingly, absence of SMAD7 increased HIF1α
levels (54), and HIF1A was strongly and uniquely associated with WT DEGs at 24 hours,
opposite of the association with SMAD7 at 3 hours. MYC, an oncogene, had increased expression
Page 283
264
in and association with mutants compared to WT short- and long-term, respectively. MYC has
been found to be present in proliferating, but not hypertrophic, chondrocytes (56, 57). SP1, a
proliferative gene with decreased expression in hypertrophic chondrocytes (51, 58), also had
increased association with mutants compared to WT at 0 and 3 hours. Despite SP1’s role in
proliferation, a member of its family, KLF10, inhibited chondrocyte proliferation through
downregulation of INHBB (59). We did observe increased, unique expression of INHBB in
mutants. These results are indicative of a proliferative effect of the TRPV4 mutations, which
ultimately prevents proper hypertrophy.
We also observed increased association with and expression of NFKB1 in the mutant
lines in response to loading. The increase in NFKB1 with GOF TRPV4 mutations is consistent
with our previous study that used a NF-κB circuit stimulated by TRPV4 activation for drug
delivery (11). Interestingly, the pro-inflammatory gene has been shown to promote both
proliferation and apoptosis, including regulation of TP53 (60-62). Furthermore, RELA, which is
bound with NFKB1 to form the most common NF-κB complex, prevents chondrocyte apoptosis,
is active in early stage chondrogenesis, and increases degradative ADAMTS5 expression (63, 64).
Additionally, a study found NF-κB to inhibit osteogenic gene transcription and transcription
factor binding (65). Despite the increase in inflammatory NF-κB signaling cascades in TRPV4
mutants in response to loading, other studies have found TRPV4 activation to have an anti-
inflammatory effect. In fact, TRPV4 activation attenuated loading-induced ADAMTS4 and IL-1R
expression or IL-1β-induced degradation (66, 67). Therefore, TRPV4 activation, particularly in
response to compressive loading, likely has both pro- and anti-inflammatory components due to
differences in the activation of inflammatory signaling cascades.
This study provides novel insights into hiPSC-derived chondrocyte mechanotransduction
Page 284
265
on a transcriptomic level in addition to how this signaling is altered by dysplasia-causing TRPV4
mutations V620I and T89I. However, it must be noted that this study has a few limitations. First,
we had limited sample size due to the complexity of the experiment and the number of groups.
The three-hour time point had two replicates that confirmed consistent results between samples.
Also, the potential pathways responsible for the altered mechanotransduction that leads to the
dysfunctional skeletal development have not been validated. In future experiments, we will
repeat the loading. We will increase the sample size and inhibit TRPV4 and specific pathways
(e.g., E2F1, p53, NF-κB/cMYC) to investigate gene expression. We will also analyze
proliferation with an EdU assay as another output to validate the proposed pathways.
6.6 Conclusion
The results of the current and future experiments will offer better understandings of hiPSC-
derived tissue-engineered cartilage and the role of mechanical loading and TRPV4
mechanotransduction on the tissue. Furthermore, this work will provide therapeutic targets for
brachyolmia and metatropic dysplasia.
6.7 References
1. A. J. Sophia Fox, A. Bedi, S. A. Rodeo, The Basic Science of Articular Cartilage: Structure,
Composition, and Function. Sports Health: A Multidisciplinary Approach 1, 461-468 (2009).
2. F. Guilak, Biomechanical factors in osteoarthritis. Best Practice & Research Clinical
Rheumatology 25, 815-823 (2011).
3. J. Sanchez-Adams, H. A. Leddy, A. L. McNulty, C. J. O’Conor, F. Guilak, The
Mechanobiology of Articular Cartilage: Bearing the Burden of Osteoarthritis. Current
Rheumatology Reports 16, (2014).
4. C. J. O'Conor, H. A. Leddy, H. C. Benefield, W. B. Liedtke, F. Guilak, TRPV4-mediated
mechanotransduction regulates the metabolic response of chondrocytes to dynamic loading.
Proc Natl Acad Sci U S A 111, 1316-1321 (2014).
5. Z. Zhao et al., Mechanotransduction pathways in the regulation of cartilage chondrocyte
homoeostasis. Journal of Cellular and Molecular Medicine 24, 5408-5419 (2020).
Page 285
266
6. F. Guilak, R. J. Nims, A. Dicks, C. L. Wu, I. Meulenbelt, Osteoarthritis as a disease of the
cartilage pericellular matrix. Matrix Biol 71-72, 40-50 (2018).
7. W. Everaerts, B. Nilius, G. Owsianik, The vanilloid transient receptor potential channel
TRPV4: From structure to disease. Progress in Biophysics and Molecular Biology 103, 2-17
(2010).
8. M. Jin et al., Determinants of TRPV4 Activity following Selective Activation by Small
Molecule Agonist GSK1016790A. PLoS ONE 6, e16713 (2011).
9. S. Muramatsu et al., Functional Gene Screening System Identified TRPV4 as a Regulator of
Chondrogenic Differentiation. Journal of Biological Chemistry 282, 32158-32167 (2007).
10. C. J. O'Conor, T. M. Griffin, W. Liedtke, F. Guilak, Increased susceptibility ofTrpv4-
deficient mice to obesity and obesity-induced osteoarthritis with very high-fat diet. Annals of
the Rheumatic Diseases 72, 300-304 (2013).
11. R. J. Nims et al., A synthetic mechanogenetic gene circuit for autonomous drug delivery in
engineered tissues. Science Advances 7, eabd9858 (2021).
12. D. Krakow, D. L. Rimoin, The skeletal dysplasias. Genetics in Medicine 12, 327-341 (2010).
13. S. Sun, in Mutagenesis, Kang, Ed. (InTech, 2012).
14. M. J. Rock et al., Gain-of-function mutations in TRPV4 cause autosomal dominant
brachyolmia. Nat Genet 40, 999-1003 (2008).
15. N. Camacho et al., Dominant TRPV4 mutations in nonlethal and lethal metatropic dysplasia.
Am J Med Genet A 152A, 1169-1177 (2010).
16. H. A. Leddy et al., Follistatin in chondrocytes: the link between TRPV4 channelopathies and
skeletal malformations. FASEB J 28, 2525-2537 (2014).
17. S. Loukin, Z. Su, C. Kung, Increased basal activity is a key determinant in the severity of
human skeletal dysplasia caused by TRPV4 mutations. PLoS One 6, e19533 (2011).
18. A. R. Dicks et al., Skeletal dysplasia-causing TRPV4 mutations suppress the hypertrophic
differentiation of human iPSC-derived chondrocytes. bioRxiv, 2021.2006.2015.448562
(2021).
19. S. S. Adkar et al., Step-Wise Chondrogenesis of Human Induced Pluripotent Stem Cells and
Purification Via a Reporter Allele Generated by CRISPR-Cas9 Genome Editing. Stem Cells
37, 65-76 (2019).
20. A. Dicks et al., Prospective isolation of chondroprogenitors from human iPSCs based on cell
surface markers identified using a CRISPR-Cas9-generated reporter. Stem Cell Res Ther 11,
66 (2020).
21. C. L. Wu et al., Single cell transcriptomic analysis of human pluripotent stem cell
chondrogenesis. Nat Commun 12, 362 (2021).
22. A. Dobin et al., STAR: ultrafast universal RNA-seq aligner. Bioinformatics 29, 15-21 (2013).
23. Y. Liao, G. K. Smyth, W. Shi, featureCounts: an efficient general purpose program for
assigning sequence reads to genomic features. Bioinformatics 30, 923-930 (2014).
24. R. Patro, G. Duggal, M. I. Love, R. A. Irizarry, C. Kingsford, Salmon provides fast and bias-
Page 286
267
aware quantification of transcript expression. Nat Methods 14, 417-419 (2017).
25. L. Wang, S. Wang, W. Li, RSeQC: quality control of RNA-seq experiments. Bioinformatics
28, 2184-2185 (2012).
26. M. I. Love, W. Huber, S. Anders, Moderated estimation of fold change and dispersion for
RNA-seq data with DESeq2. Genome Biol 15, 550 (2014).
27. H. Wickham, ggplot2: Elegant Graphics for Data Analysis. Use R! (Springer-Verlag New
York, ed. 1, 2009).
28. H. Chen, P. C. Boutros, VennDiagram: a package for the generation of highly-customizable
Venn and Euler diagrams in R. BMC Bioinformatics 12, 35 (2011).
29. R. Kolde. (2015).
30. U. Raudvere et al., g:Profiler: a web server for functional enrichment analysis and
conversions of gene lists (2019 update). Nucleic Acids Res 47, W191-W198 (2019).
31. H. Han et al., TRRUST v2: an expanded reference database of human and mouse
transcriptional regulatory interactions. Nucleic Acids Res 46, D380-D386 (2018).
32. N. Altman, M. Krzywinski, Clusterinig. Nature Methods 14, 545-546 (2017).
33. C. J. Little, N. K. Bawolin, X. Chen, Mechanical properties of natural cartilage and tissue-
engineered constructs. Tissue Eng Part B Rev 17, 213-227 (2011).
34. J. M. Middendorf et al., Multiscale mechanics of tissue‐engineered cartilage grown from
human chondrocytes and human‐induced pluripotent stem cells. Journal of Orthopaedic
Research 38, 1965-1973 (2020).
35. J. K. Lee, C. A. Gegg, J. C. Hu, P. H. Kass, K. A. Athanasiou, Promoting increased
mechanical properties of tissue engineered neocartilage via the application of
hyperosmolarity and 4alpha-phorbol 12,13-didecanoate (4alphaPDD). J Biomech 47, 3712-
3718 (2014).
36. K. Nonaka et al., Novel gain-of-function mutation of TRPV4 associated with accelerated
chondrogenic differentiation of dental pulp stem cells derived from a patient with metatropic
dysplasia. Biochem Biophys Rep 19, 100648 (2019).
37. B. Saitta et al., Patient-derived skeletal dysplasia induced pluripotent stem cells display
abnormal chondrogenic marker expression and regulation by BMP2 and TGFbeta1. Stem
Cells Dev 23, 1464-1478 (2014).
38. X. Han et al., Accelerated osteoblastic differentiation in patient-derived dental pulp stem
cells carrying a gain-of-function mutation of TRPV4 associated with metatropic dysplasia.
Biochem Biophys Res Commun 523, 841-846 (2020).
39. R. Das, C. Goswami, TRPV4 expresses in bone cell lineages and TRPV4-R616Q mutant
causing Brachyolmia in human reveals "loss-of-interaction" with cholesterol. Biochem
Biophys Res Commun 517, 566-574 (2019).
40. X. Sun et al., Impaired neurite development and mitochondrial dysfunction associated with
calcium accumulation in dopaminergic neurons differentiated from the dental pulp stem cells
of a patient with metatropic dysplasia. Biochem Biophys Rep 26, 100968 (2021).
Page 287
268
41. D. L. Rimoin et al., The Skeletal Dysplasias: Clinical Molecular Correlations. Annals of the
New York Academy of Sciences 1117, 302-309 (2007).
42. P. Bhattaram et al., SOXC proteins amplify canonical Wnt signaling to secure
nonchondrocytic fates in skeletogenesis. Journal of Cell Biology 207, 657-671 (2014).
43. P. Krejci, D. Krakow, P. B. Mekikian, W. R. Wilcox, Fibroblast Growth Factors 1, 2, 17, and
19 Are the Predominant FGF Ligands Expressed in Human Fetal Growth Plate Cartilage.
Pediatric Research 61, 267-272 (2007).
44. C. Prein, F. Beier. (Elsevier, 2019), pp. 25-47.
45. A. Shimazu et al., Syndecan-3 and the control of chondrocyte proliferation during
endochondral ossification. Exp Cell Res 229, 126-136 (1996).
46. B. Scheijen, M. Bronk, T. van der Meer, R. Bernards, Constitutive E2F1 overexpression
delays endochondral bone formation by inhibiting chondrocyte differentiation. Mol Cell Biol
23, 3656-3668 (2003).
47. T. Yanagino, K. Yuasa, M. Nagahama, Y. Matsuda, A. Tsuji, Transcriptional regulation of
fibrillin-2 gene by E2F family members in chondrocyte differentiation. Journal of Cellular
Biochemistry 106, 580-588 (2009).
48. J. Wu et al., EFTUD2 gene deficiency disrupts osteoblast maturation and inhibits
chondrocyte differentiation via activation of the p53 signaling pathway. Human Genomics
13, (2019).
49. N. Artigas et al., p53 inhibits SP7/Osterix activity in the transcriptional program of osteoblast
differentiation. Cell Death & Differentiation 24, 2022-2031 (2017).
50. X. Wang et al., p53 functions as a negative regulator of osteoblastogenesis, osteoblast-
dependent osteoclastogenesis, and bone remodeling. Journal of Cell Biology 172, 115-125
(2006).
51. F. Oliver et al., Transcription factors TP53 and SP1 and the osteogenic differentiation of
dental stem cells. Differentiation 83, 10-16 (2012).
52. S. V. Boregowda et al., Basal p53 expression is indispensable for mesenchymal stem cell
integrity. Cell Death & Differentiation 25, 679-692 (2018).
53. L. De Rosa et al., p63 Suppresses Non-epidermal Lineage Markers in a Bone Morphogenetic
Protein-dependent Manner via Repression of Smad7. Journal of Biological Chemistry 284,
30574-30582 (2009).
54. K. D. Estrada et al., Smad7 regulates terminal maturation of chondrocytes in the growth
plate. Developmental Biology 382, 375-384 (2013).
55. T. Iwai, J. Murai, H. Yoshikawa, N. Tsumaki, Smad7 Inhibits Chondrocyte Differentiation at
Multiple Steps during Endochondral Bone Formation and Down-regulates p38 MAPK
Pathways. Journal of Biological Chemistry 283, 27154-27164 (2008).
56. M. Iwamoto et al., Expression and role of c-myc in chondrocytes undergoing endochondral
ossification. J Biol Chem 268, 9645-9652 (1993).
57. O. Ishida, Y. Tanaka, I. Morimoto, M. Takigawa, S. Eto, Chondrocytes Are Regulated by
Cellular Adhesion Through CD44 and Hyaluronic Acid Pathway. Journal of Bone and
Page 288
269
Mineral Research 12, 1657-1663 (1997).
58. C. Magee, M. Nurminskaya, L. Faverman, P. Galera, T. F. Linsenmayer, SP3/SP1
Transcription Activity Regulates Specific Expression of CollagenType X in
HypertrophicChondrocytes. Journal of Biological Chemistry 280, 25331-25338 (2005).
59. L. Zheng, H. Lu, H. Li, X. Xu, D. Wang, KLF10 is upregulated in osteoarthritis and inhibits
chondrocyte proliferation and migration by upregulating Acvr1 and suppressing inhbb
expression. Acta Histochem 122, 151528 (2020).
60. S. Tilborghs et al., The role of Nuclear Factor-kappa B signaling in human cervical cancer.
Crit Rev Oncol Hematol 120, 141-150 (2017).
61. L. Zhang et al., Effects of the NF‑κB/p53 signaling pathway on intervertebral disc nucleus
pulposus degeneration. Molecular Medicine Reports 22, 1821-1830 (2020).
62. R. K. Wang, X. M. Shao, J. P. Yang, H. L. Yan, Y. Shao, MicroRNA-145 inhibits
proliferation and promotes apoptosis of HepG2 cells by targeting ROCK1 through the
ROCK1/NF-kappaB signaling pathway. Eur Rev Med Pharmacol Sci 23, 2777-2785 (2019).
63. H. Kobayashi et al., Biphasic regulation of chondrocytes by Rela through induction of anti-
apoptotic and catabolic target genes. Nat Commun 7, 13336 (2016).
64. S. Itoh et al., GSK-3alpha and GSK-3beta proteins are involved in early stages of
chondrocyte differentiation with functional redundancy through RelA protein
phosphorylation. J Biol Chem 287, 29227-29236 (2012).
65. R. S. Tarapore et al., NF-κB Has a Direct Role in Inhibiting Bmp- and Wnt-Induced Matrix
Protein Expression. Journal of Bone and Mineral Research 31, 52-64 (2016).
66. Y. Takeda et al., Compressive mechanical stress enhances susceptibility to interleukin-1 by
increasing interleukin-1 receptor expression in 3D-cultured ATDC5 cells. BMC
Musculoskeletal Disorders 22, (2021).
67. S. Fu et al., Activation of TRPV4 by mechanical, osmotic or pharmaceutical stimulation is
anti-inflammatory blocking IL-1beta mediated articular cartilage matrix destruction.
Osteoarthritis Cartilage 29, 89-99 (2021).
Page 289
270
Chapter 7
Conclusions and Future Directions Human induced pluripotent stems cells (hiPSCs) offer great potential in the field of cartilage
tissue engineering. Beyond their extensive proliferation and differentiation capacity, hiPSCs are
derived from adult somatic cells that can be harvested from a patient with minimal donor site
morbidity. Here, we addressed the heterogeneity and off-target differentiation challenges
associated with hiPSC chondrogenesis using a chemically defined, serum-free medium in
Chapters 2-4. This improved, novel protocol creates possibilities for personalized medicine,
disease modeling, and regenerative therapies.
In Chapters 5 and 6, we used the hiPSC chondrogenesis protocol for in vitro disease
modeling. Using CRISPR-Cas9 gene editing technology, we created hiPSC lines harboring the
V620I or T89I TRPV4 mutations, which cause mild brachyolmia and severe, neonatally lethal
metatropic dysplasia. We differentiated the hiPSCs through chondrogenesis and into hypertrophy
and tested TRPV4 activation in the hiPSC-derived chondrocytes to investigate how these
mutations lead to skeletal dysplasias. We used mRNA sequencing and transcriptomic analysis to
identify many key genes whose expression is altered by the mutations during chondrogenesis,
hypertrophy, and loading. We found that the mutations suppressed hypertrophic differentiation,
likely preventing proper endochondral ossification and long bone development. Furthermore, the
mutations increased sensitivity of TRPV4 to loading with an increase in gene expression,
especially of proliferative genes.
These key genes can be investigated in future studies as potential therapeutic strategies.
For example, inhibition of genes upregulated in the mutants, such as HOX genes, could promote
Page 290
271
chondrocyte maturation. Additionally, the BMP/TGFβ signaling pathway could be modulated to
allow for chondrocyte hypertrophy. Mutant hiPSC-derived chondrocytes appeared to be more
prolific than wildtype; therefore, inhibition of these proliferation pathways may restore proper
mechanotransduction. In fact, we are preparing an experiment to inhibit TRPV4 signaling and
other pathways identified during loading. We will investigate if this inhibition decreases
proliferation and increases similarity between mutants and WT. Furthermore, it would be
interesting to continue the differentiation of TRPV4-mutant chondrocytes through osteogenesis
to determine additional therapeutic targets. TRPV4 is a well-known signal regulator in both bone
and cartilage. Apart from skeletal dysplasia therapeutic development, these findings may also be
applicable for optimizing tissue engineering, particularly from hiPSCs. In fact, the proliferative
and anti-hypertrophic properties of mutant hiPSC-derived chondrocytes are ideal for cartilage
tissue engineering.
Other genetic mutations can also be studied using this protocol. For example, a mutation
in collagen type VI alpha chain 3 (COL6A3) has been found to increase predisposition to
osteoarthritis. Therefore, we created a mutant hiPSC line, and an isogenic control, to differentiate
into chondrocytes and study how this mutation leads to disease. Since COL6A3 is a primary
component of the pericellular matrix, a biochemical and biomechanical filter for chondrocytes,
we hypothesize that the mutation alters PCM properties rendering the chondrocyte more
susceptible to injurious loading and pro-inflammatory cytokines. Our lab and collaborators are
currently using these hiPSC-derived chondrocytes in an inflammatory and loading model to
investigate transcriptomic and epigenetic changes and differences in mutant chondrocytes.
The large volume of chondrocytes produced in a single round of differentiation is ideal
for high throughput drug screening. hiPSCs can be made from a patient suffering from a cartilage
Page 291
272
disease, such as degenerative arthritis. The resulting hiPSC-derived chondrocytes can then be
used for drug screening to identify the therapeutic the patient will best respond to. Ideally, in the
future, the hiPSC-derived cartilage will not only be applicable in vitro but also in vivo. For that
to happen, there remains many obstacles. hiPSC-derived cartilage addresses the issue of immune
rejection since it can be derived from the patient’s own cells. However, the mechanical
properties are an order of magnitude lower than native cartilage. Moreover, due to their
pluripotency, hiPSCs and hiPSC-derived cells are tumorigenic; therefore, this must be
preventable prior to human implantation.
In summary, we believe the work in this thesis has made a significant contribution to the
fields of tissue engineering and orthopedics. We have developed a novel hiPSC chondrogenesis
protocol that addresses many current issues. We demonstrated one of the many uses for the
protocol, disease modeling, to elucidate underlying mechanisms of skeletal dysplasias caused by
mutations in ion channel TRPV4. We hope that the findings of these studies will be applied to
the development of skeletal dysplasia therapeutics and continued in vitro disease modeling, drug
screening, and tissue engineering for many other cartilage diseases.
Page 292
273
Curriculum Vitae Amanda Dicks
[email protected]
(330) 692-0277
Professional Profile
• Biomedical Engineering PhD candidate at Washington University in St. Louis using human
induced pluripotent stem cells, molecular and cellular biology techniques, including RNA
sequencing, and mechanical bioreactors to study skeletal dysplasia-causing mutations in cartilage
• Project manager for a student-run nonprofit consulting group in St. Louis
• Editor-in-Chief of a trainee-run scientific communication network at Washington University
• Incoming Strategy Insights and Planning Associate at ZS Associates
Education
Washington University in Saint Louis St. Louis, MO
Biomedical Engineering, Doctor of Philosophy Candidate, NIH T32 Fellow Aug 2021
Indiana Institute of Technology (Indiana Tech) Fort Wayne, IN
Biomedical Engineering, Bachelor of Science, Summa Cum Laude May 2016
Johns Hopkins University Coursera
Certificate, Clinical Trial Design 2020
Scientific Research Experience
Department of Orthopedic Surgery, Center of Regenerative Medicine, Musculoskeletal Research
Center, and Shriners Hospital for Children
Washington University School of Medicine, St Louis, MO Aug 2016 – present
• Study skeletal dysplasia and osteoarthritis-causing mutations to understand cartilage
development, homeostasis, and function in an effort to identify therapeutic targets
• Lead a team, organize collaboration, schedule experiments, and mentor junior graduate students
• Publish peer-reviewed articles in academic journals, most notably Nature Communications
• Presented work at 6 international and institutional conferences and received a poster award
• Skills: project management, experimental design, data analysis, cell culture, human iPSC
differentiation, RNA sequencing, histology, immunohistochemistry, RT-qPCR, biochemical
analysis, mechanical loading & testing, Microsoft Office Suite, RStudio, Adobe Illustrator,
GraphPad Prism
Department of Biomedical Engineering, Undergraduate Researcher
Indiana Tech, Fort Wayne, IN Aug 2014 – May 2016
• Led a team in the R&D of a total revision knee arthroplasty system and individually developed a
tracheostomy tube system making modifications and improvements compared to current systems
on the market
• Developed a design history file (DHF) and mock FDA 510(k) submission including all regulatory
documentation
• Presented work and won a presentation award at national honor society conference
Page 293
274
Life Science and Healthcare Professional Experience
The BALSA Group, Project Manager, Consultant
St. Louis, MO July 2019 – present
• Manage projects and workstreams from client engagement kickoff to delivery by supervising
and assigning weekly tasks for three junior team members to meet external stakeholder needs
• Synthesize quantitative and qualitative results and assembles strategic recommendations via
written communications and visual and verbal presentations at client meetings
• Performed comprehensive primary and secondary market research and competitor analysis for
emerging and mid-size pharmaceutical and medical device companies as a consultant
• Promoted to project manager after three projects due to high performance consultant track
record and strong understanding of client business needs – awarded Project Manager of the
Year 2020
InPrint – A Scientific Editing Network, Editor-in-Chief, Associate Editor-in-Chief, Secretary,
Editor, Designer
Washington University School of Medicine, St. Louis, MO Feb 2019 – present
• Provide organizational, conceptual, structural, and grammatical advice, constructive criticism,
and edits for abstracts, manuscripts, grants, and other types of scientific writing
• Design vector graphic figures and supervise junior designers to visually communicate research
studies for clients
• Develop content for and present workshops and instruct scientists on effective science
communication including data visualization
• Lead a team of 50+ editors and designers, implement new external services and internal
programming, initiate new collaborations and events, review applications, and conduct
interviews as Editor-in-Chief
• Launched the annual Scientific Communication Workshop Series with approximately 100
attendees per workshop
• Facilitated the commencement of the Presentation Consulting Service
• Processed submissions, communicated with clients, reviewed applications, conducted
interviews, and initiated collaborations and events with other departments and groups at the
university as Associate Editor-in-Chief
• Organized meetings, booked locations, scheduled events, and recorded meetings and
membership as Secretary
Engineering Product Development, Intern
K2M (Acquired by Stryker), Leesburg, VA May 2015 – Aug 2015
• Collaborated with R&D engineers to 3D design a new implant system satisfying customer
requirements
• Restructured and revised FDA regulatory submission support material such as traceability
matrices, risk forms, and clinical evaluation reports
State Tested Nurses Aid, Masternick Memorial Health Care
Windsor House, New Middletown, OH July 2013; May 2014 – Aug 2014; Dec 2014 – Jan 2015
• Assisted residents in activities of daily living while monitoring and documenting vitals, inputs,
and outputs
• Collaborated with, mentored, and trained co-workers to provide optimal care
• Observed healthcare in long-term facilities to understand needs of patients and health providers
Page 294
275
Publications
Dicks AR, Maksaev GI, Harissa Z, Savadipour A, Tang R, Steward N, Liedtke W, Nichols CG, Wu
CL*, Guilak F*. Skeletal dysplasia-causing TRPV4 mutations suppress the hypertrophic differentiation
of human iPSC-derived chondrocytes. bioRxiv (2021). doi: 10.1101/2021.06.15.448562. eLife
(submitted).
Dicks AR, Steward N, Guilak F*, Wu CL.* Chondrogenic differentiation of human induced pluripotent
stem cells. Methods in Molecular Biology: Cartilage Tissue Engineering (submitted).
Dicks AR*, Harissa Z*, Kim Y, Steward N, Liedtke W, Wu CL, Guilak F. Skeletal dysplasa-causing
TRPV4 mutations increase mechanosensitivity of human iPSC-derived chondrocytes. (in preparation).
Dicks A*, Wu CL*, Steward N, Adkar SS, Gersbach CA, Guilak F. Prospective isolation of
chondroprogenitors from human iPSCs based on cell surface markers identified using a CRISPR-Cas9-
generated reporter. Stem Cell Research & Therapy (2020).
Wu CL*, Dicks A*, Steward N, Tang R, Katz DB, Choi YR, Guilak F. Single cell transcriptomic
analysis of human pluripotent stem cell chondrogenesis. Nature Communications (2021).
Dicks A, Bhatia H, Clemens A, Locke M, Mueller E, Murphy D, Pomper N, Robinson A, Schoch K.
Improving scientific communication with service, education, and career development. Nature
Biotechnology (submitted).
Rodríguez Ruiz A, Dicks A, Tuerlings M, Schepers K, van Pel M, Nelissen RGHH, Freund C,
Mummery C, Orlova V, Guilak F, Meulenbelt I, Ramos YFM. Cartilage from human induced
pluripotent stem cells: comparison with neo-cartilage from chondrocytes and bone marrow
mesenchymal stromal cells. Cell and Tissue Research (2021).
Rai MF, Wu CL, Capellini TD, Guilak F, Dicks AR, Muthuirulan P, Grandi F, Bhutani N, Westendorf
JJ. Single Cell Omics for musculoskeletal Research. Current Osteoporosis Reports (2021).
Harasymowicz NS, Dicks A, Wu CL, Guilak F. Physiologic and pathologic effects of dietary free fatty
acids on cells of the joint. Ann. N.Y. Acad. Sci Marrow (2019).
Guilak F, Nims R, Dicks A, Wu CL, Meulenbelt I. Osteoarthritis as a disease of the cartilage
pericellular matrix. Matrix Biology (2018).
Adkar SS, Wu CL, Willard VP, Dicks A, Ettyreddy A, Steward N, Bhutani N, Gersbach CA, Guilak F.
Highly efficient chondrogenic differentiation of human iPSCs and purification via a reporter allele
generated by CRISPR-Cas9 genome editing. Stem Cells (2018).
*authors contributed equally
Posters and Presentations
Dicks A, Wu CL, Harissa Z, Steward N, Guilak F. Differentiation and disease modeling using human
iPSC-derived chondrocytes. Human Pluripotent Stem Cell Differentiation Work-in-Progress.
Washington University School of Medicine, St. Louis, MO. March 2021. Virtual presentation.
Page 295
276
Dicks A, Wu CL, Harissa Z, Steward N, Liedtke W, Guilak F. Skeletal dysplasia-causing mutations in
the ion channel TRPV4 alter human iPSC chondrogenic differentiation and calcium signaling.
Orthopedic Research Society Annual Meeting, Virtual. February 2021. Podium presentation.
Dicks A, Schoch K, Robinson A. Data Visualization: how to effectively communicate science through
easily digestible data visuals. Presentation and interactive workshop.
• Washington University School of Medicine Pediatric Fellowship. St. Louis, MO. January 2020.
• Publication Writing Course, Engineering Communication Center. St. Louis, MO. February 2020,
October 2020, February 2021.
• Probability & Statistics Course, Engineering Communication Center. St. Louis, MO. February 2020.
• Technical Writing, Engineering Communication Center. St. Louis, MO. February 2021.
• Mechanical Engineering Lab, School of Engineering. St. Louis, MO. April 2021.
• Scientific Communication Workshop Series, Washington University School of Medicine. St. Louis,
MO. June 2021.
Dicks A, Schoch K, Cimpean M, Clemens A, Locke M, Pomper N. How to write a strong qualifying
exam document. Washington University Division of Biological and Biomedical Sciences. St. Louis,
MO. March 2020. Virtual presentation.
Schoch K, Alspach E, Dicks A, Locke M. How to write an abstract: conference vs. manuscript.
Pediatric Fellowship. November 2019, October 2020. Presentation and interactive workshop.
Dicks A, Mack M, Robinson A. Using Adobe Illustrator for Scientific Schema Design. Washington
University School of Medicine. September 2019. Presentation and interactive workshop.
Wu CL, Dicks A, Steward N, Tang R, Katz DB, Choi YR, Guilak F. Single Cell Transcriptomic
Analysis of Human Pluripotent Stem Cell Chondrogenesis. Orthopedic Research Society Annual
Meeting, Phoenix, AZ. February 2020. Presentation. Orthoregeneration Award.
Dicks A, Wu CL, Harissa Z, Steward N, Guilak F. Mechanotransduction of hiPSC-derived
Chondrocytes. Washington University Biomedical Engineering Annual Retreat. September 2019.
Presentation.
Dicks A, Wu CL, Steward N, Adkar S, Willard V, Gersbach CA, Guilak F. Prospective Isolation of
Chondroprogenitors from Human iPSCs Based on a Collagen II Reporter Allele Generated by CRISPR-
Cas9 Genome Editing.
• Orthopedic Research Society Annual Meeting, Austin, TX. February 2019. Moderated ePoster and
poster.
• Musculoskeletal Winter Symposium, Washington University, St. Louis, MO. February 2019. Poster.
• Center of Regenerative Medicine Symposium, Washington University, St. Louis, MO. March 2019.
Poster.
Wu CL, Dicks A, Steward N, Guilak F. Dissecting molecular and cellular heterogeneity in human iPSC
chondrogenesis using single-cell RNA sequencing. Orthopedic Research Society Annual Meeting,
Austin, TX. February 2019. Poster.
Page 296
277
Dicks A, Wu CL, Nims R, Steward N, Guilak F. Role of TRPV4 Mechanotransduction in Diabetes-
associated Osteoarthritis. Interdisciplinary Training in Mechanobiology from nm to cm Retreat,
Washington University, St. Louis, MO. June 2018. Poster.
Dicks A, Wu CL, Steward N, Adkar S, Willard V, Guilak F. Highly Efficient Stepwise
Differentiation of human iPSCs into Chondrocytes.
• Center of Investigation of Membrane Excitability Diseases Research Day, Washington University,
St. Louis, Mo. June 2018. Poster.
• Musculoskeletal Winter Symposium, Washington University, St. Louis, MO. February 2018.
Poster. Poster presenter award.
Wu CL, Dicks A, Steward N, Adkar S, Willard V, Guilak F. Highly Efficient Stepwise Differentiation
of Human iPSCs into Chondrocytes. Orthopedic Research Society Annual Meeting, New Orleans, LA.
March 2018. Poster and presentation. New investigator recognition award.
Adkar SS, Willard VP, Wu CL, Dicks A, Ettyreddy A, Steward N, Bhutani N, Gersbach CA, Guilak F.
Purification of hiPSC-derived chondrocyte-like cells using a CRISPR-Cas9-generated collagen II
reporter enhances chondrogenesis and cartilaginous matrix production. Orthopedic Research Society
Annual Meeting, New Orleans, LA. March 2018. Presentation.
Dicks A, Phlipot J. Developing the Next-generation Tracheostomy Tube: Design, Modeling, and
Analysis. Alpha Chi National College Honor Society Convention, Alexandria, VA. April 2016.
Presentation. Computer science and engineering presentation award.
Dicks A, Phlipot J. Developing the Next-generation Tracheostomy Tube: Research to Design. Annual
Northeast Bioengineering Conference, Binghamton University, NY. April 2016. Poster.
Teaching, Mentorship, and Volunteering
Intermediate Biomechanics, Assistant to the Instructor Aug 2018 – Dec 2018
Young Scientists Program, Continuing Mentor for High Schoolers Oct 2016 – Apr 2020
Young Scientists Program, Summer Focus Tutor for High Schoolers June 2019 – Aug 2019
Moving and Shaking: An Intro to Engineering for Middle Schoolers, Teaching Assistant
Oct 2017 – Nov 2017
Engineering and Science Summer Camp for High Schoolers, Counselor, Organizer June 2016
Build and Learn Summer Day Camp for Middle Schoolers, Counselor, Organizer June 2016
Office of Student Success, Peer Tutor Aug 2013 – May 2016
Bard Life Sciences Cadaver Lab, Technician Aug 2014 – June 2016
Student Support Services, Peer Tutor Aug 201 – May 2016
Anatomy & Physiology Cadaver Lab, Teaching Assistant Aug 2014 – May 2016
BME 3600 Medical Device Design, Course Preparation May 2016 – July 2016
Indiana Tech Residential Life, Resident Assistant Aug 2014 – May 2016
Professional Societies
International Society of Stem Cell Research
Orthopedic Research Society
Biomedical Engineering Society
Page 297
278
Honors and Awards
Project Manager of the Year, The BALSA Group 2020
T32: Imaging, Modeling and Engineering of Diabetic Tissues, Fellow Jan 2018 – Dec 2019
T32: Mechanobiology from nm to cm, Affiliate Fellow Sept 2017 – Aug 2018
Professional Development Workshop, NSF Science and Technology Centers Aug 2018
Poster Presenter Travel Award, Musculoskeletal Winter Symposium Feb 2018
Most Outstanding Graduate, College of Engineering & Biomedical Engineering May 2016
Floyd Tesmer and Strayer University Prize in Computer Science and Engineering,
Alpha Chi National Honor Society Convention April 2016
Alpha Chi, National Honor Society March 2015 – present
Alpha Eta Mu Beta, National Biomedical Engineering Honor Society Aug 2015 – present
Who’s Who Among Students in American Colleges and Universities 2015, 2016
Peer Tutor of the Year 2016
Student Ambassador of the Year 2014, 2016