15
Human Resource Capability Survey of Public Service Departments As at 30 June 2005
| Date post: | 26-Apr-2018 |
| Category: |
Documents |
| Upload: | hoangquynh |
| View: | 218 times |
| Download: | 3 times |
Human Resource Capability Survey of Public Service Departments As at 30 June 2005

ISBN 0-478-24453-3 Published in November 2005 by the State Services Commission, Wellington, New Zealand Crown Copyright reserved 2005 This publication is available on the website of the State Services Commission at: http://www.ssc.govt.nz
2
Index of Contents Executive summary....................................................................................................................4 Background................................................................................................................................5 Staff numbers .............................................................................................................................5 Pay movement............................................................................................................................6 Superannuation ..........................................................................................................................8 Collective bargaining .................................................................................................................8 Gender pay gaps.........................................................................................................................8 Pay gaps for ethnic groups.........................................................................................................9 Employment stability and security.............................................................................................9
Turnover.............................................................................................................................9 Redundancy......................................................................................................................10 Part-time employees.........................................................................................................10 Parental leave ...................................................................................................................10 Annual leave ....................................................................................................................10
Recruitment difficulties, skill shortages and skill gaps ...........................................................10 Equal employment opportunities .............................................................................................11 Appendix 1: Full-time Equivalent Number of Employees, 2003–2005 ..................................14 Appendix 2: Collective Bargaining and Employment Term – June 2005 ...............................15 List of Figures Figure 1. Number of filled jobs in the State sector, 2000 and 2005 ..........................................6 Figure 2. Pay movement, 1994–2005 ........................................................................................7 Figure 3. Pay movement, 2002–2005 ........................................................................................7 List of Tables Table 1. Public Service Employment, 2004–2005.....................................................................5 Table 2. Representation of EEO groups, 1998–2005 ..............................................................12 Table 3. Representation of EEO groups in senior management, 1998–2005 ..........................13
3

Public Service Human Resource Capability Survey – 2005
Executive summary Employment growth. Public Service employment increased by 6% or 2,460 people in the June 2005 year, giving a total of 40,325 people employed in the Public Service at 30 June 2005. This growth is the same as the previous year after adjusting for changes to the scope of the 2004 survey. Pay movement. For the 48% of permanent staff identified as being in the same job as in 2004, the average pay movement was 5.7%. This was lower than last year (6.1%) and the movement was not uniform, with 14% of this group receiving no pay increase. 21% of employees received lump sum performance payments. State Sector Retirement Savings Scheme (SSRSS). At 30 June 2005, 48% of public servants were members of an employer subsidised superannuation scheme with 37% belonging to the SSRSS. 81% of SSRSS members in the Public Service contributed 3% or more of their salary to the scheme after the maximum employer subsidy increased to 3%. Turnover rates. Turnover rates were higher this year than in recent years. Unplanned turnover rates in departments averaged 14% in 2005 compared with 12% last year and around 11% for 2003 and 2002. About 9% of the permanent employees who resigned during the year moved to another Public Service department. Redundancies. The number of employees receiving redundancy payments increased in 2005 after falling for four years. In 2005, 218 people received redundancy payments, up from 168 in 2004. EEO groups. Asian peoples have been the fastest growing ethnic group in the Public Service over the last three years, while the proportions of women, Māori and Pacific peoples have shown little change. The proportion of women and Māori in senior management fell, while increases were recorded for Asian and Pacific senior managers. Gender pay gap. The occupation and age adjusted gender pay gap in the Public Service in 2005 was 8% (8% in 2004) compared with 17% (16% in 2004) for the employed labour force as a whole. Collective bargaining. The proportion of employees covered by current Collective Agreements fell from 51% in 2004 to 49% in 2005 due to a rise in the number on expired collectives. Skill shortages. Many departments reported recruitment difficulties and skill shortages, in the face of a tight labour market.
4

Background The information in this report comes mainly from the Human Resource Capability (HRC) survey, which gathers anonymous unit-record data on staff1 in Public Service departments. This year, the Human Resource Capability survey data expanded to include ‘lump sum performance payments’ and annual leave taken. The report also includes data from Statistics New Zealand’s labour market surveys to allow comparisons with the labour force as a whole.
Staff numbers The number of permanent staff in the Public Service increased for the fifth consecutive year. The percentage increase over the year to 30 June 2005 was the same as the increase for the previous year after adjusting for changes to the scope2 of the survey in 2004. Table 1 shows that the total number of public servants increased by 6% over the year with permanent (open term) staff increasing by 2,135 employees (6%). 27 departments reported an increase in their number of permanent staff, one stayed the same and seven departments decreased in size.
Table 1. Public Service Employment, 2004–2005 Open-term Fixed-Term Total
FTE Headcount FTE Headcount FTE Headcount
2005 35,231 36,612 2,801 3,713 38,032 40,325
2004 33,131 34,477 2,514 3,388 35,645 37,865
% change 6 6 11 10 7 6
The increase in staff in 2005 was spread over a wide range of occupations. The Ministry of Social Development and the Department of Corrections each contributed about 20% to the increase in staff numbers in the 2005 year. The Ministry of Social Development increase resulted from extra functions and extra agreed activities given to the Ministry, including Community Labour Market Development (the responsibilities of the former Community Employment Group), building the new Family and Community service line, Working for Families, and building regional responsiveness capability. The growth in staff numbers in the Department of Corrections was largely attributable to its recruitment campaign to fill vacancies in the Public Prisons Service and staff new facilities (Northland Region Corrections Facility), and increased prison capacity. Machinery of government changes3 that occurred during the year to 30 June 2005 contributed only a small proportion (5%) of the increase in staff numbers in the latest year. The Public Service makes up a small proportion of total State sector employment (14%) but it has grown faster than the other services since 2000. Figure 1 shows the number of filled jobs in 2000 and 2005 for the different services in the State sector. Over this period the Public Service increased by 34%, whereas Health and Education services only increased by 15% and 8% over the same period. Some of the Public Service growth is attributable to movement from the other services rather than solely the creation of new jobs. 1 The survey includes all permanent and temporary employees but does not include employees who work on a casual
or as-required basis. 2 In 2004, 1035 employees in the Ministry of Education and the Department of Corrections were reclassified from
casual employees (outside the scope of the survey) to either permanent or temporary employees. 3 The Ministry of Housing was renamed the Department of Building Housing and additional functions were added.
The Ministry of Transport also took on extra functions.
5
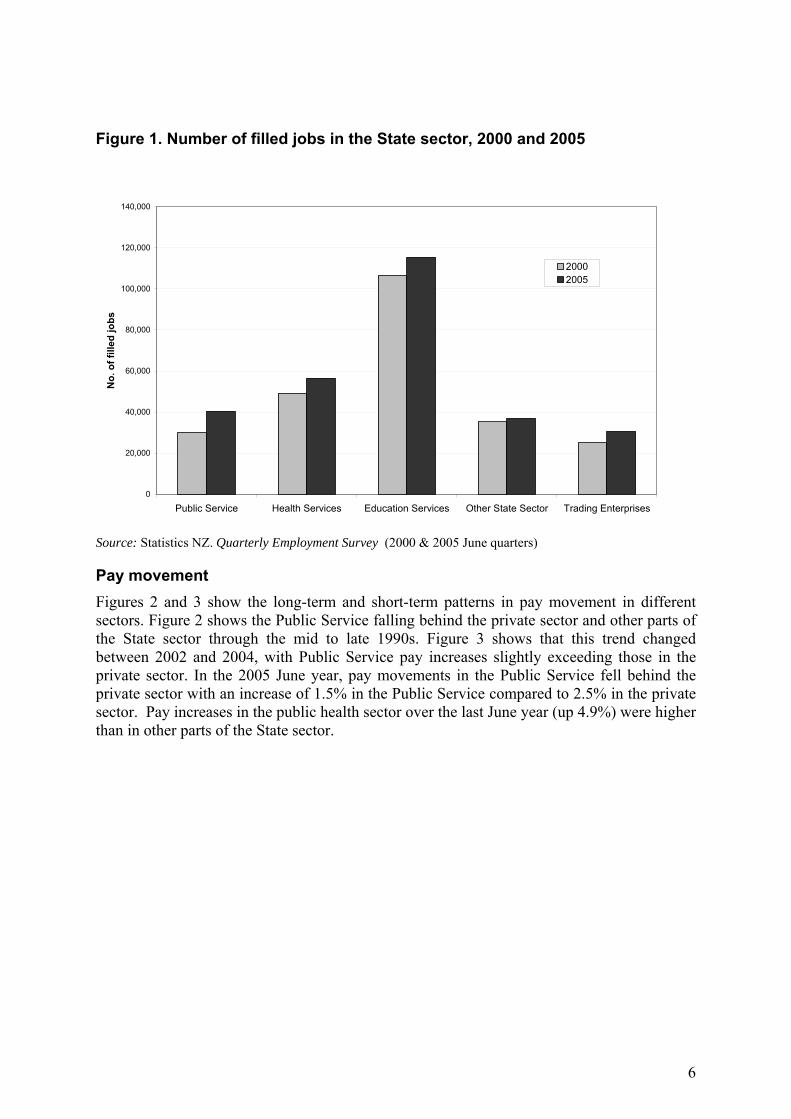
Figure 1. Number of filled jobs in the State sector, 2000 and 2005
0
20,000
40,000
60,000
80,000
100,000
120,000
140,000
Public Service Health Services Education Services Other State Sector Trading Enterprises
No.
of f
illed
jobs
20002005
Source: Statistics NZ. Quarterly Employment Survey (2000 & 2005 June quarters)
Pay movement Figures 2 and 3 show the long-term and short-term patterns in pay movement in different sectors. Figure 2 shows the Public Service falling behind the private sector and other parts of the State sector through the mid to late 1990s. Figure 3 shows that this trend changed between 2002 and 2004, with Public Service pay increases slightly exceeding those in the private sector. In the 2005 June year, pay movements in the Public Service fell behind the private sector with an increase of 1.5% in the Public Service compared to 2.5% in the private sector. Pay increases in the public health sector over the last June year (up 4.9%) were higher than in other parts of the State sector.
6
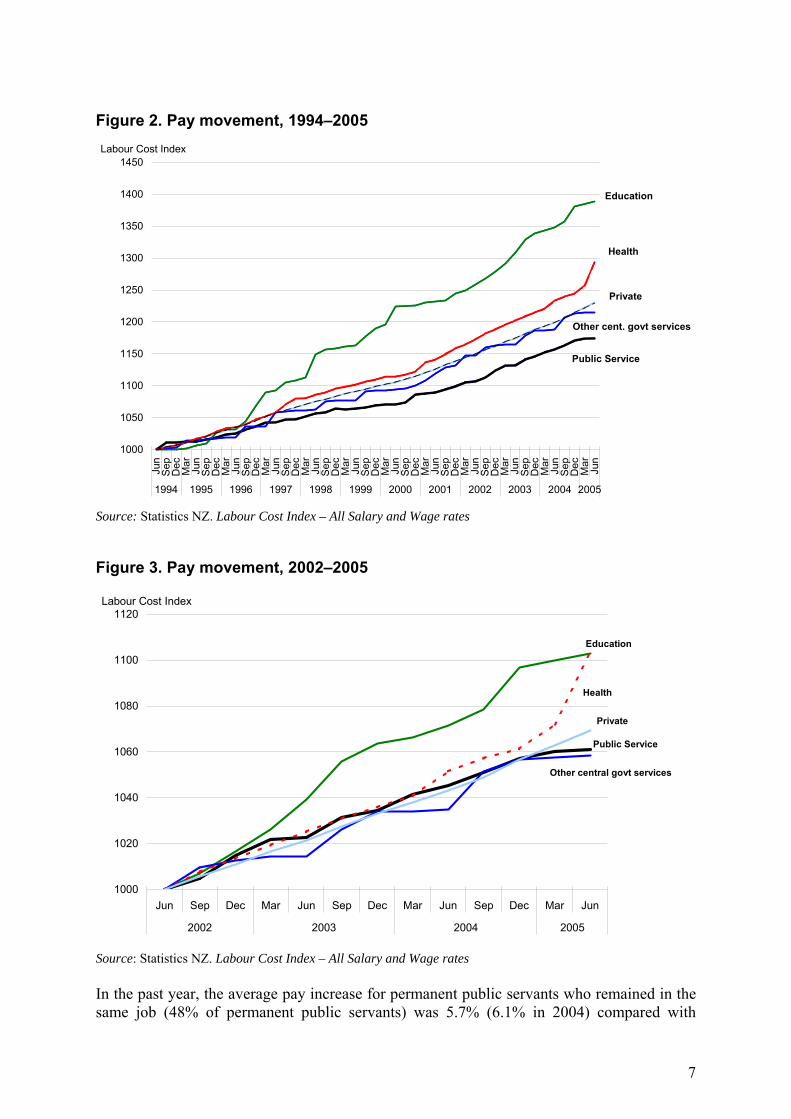
Figure 2. Pay movement, 1994–2005
1000
1050
1100
1150
1200
1250
1300
1350
1400
1450Ju
nS
epD
ec Mar
Jun
Sep
Dec Mar
Jun
Sep
Dec Mar
Jun
Sep
Dec Mar
Jun
Sep
Dec Mar
Jun
Sep
Dec Mar
Jun
Sep
Dec Mar
Jun
Sep
Dec Mar
Jun
Sep
Dec Mar
Jun
Sep
Dec Mar
Jun
Sep
Dec Mar
Jun
1994 1995 1996 1997 1998 1999 2000 2001 2002 2003 2004 2005
Labour Cost Index
Education
Health
Public Service
Private
Other cent. govt services
Source: Statistics NZ. Labour Cost Index – All Salary and Wage rates
Figure 3. Pay movement, 2002–2005
1000
1020
1040
1060
1080
1100
1120
Jun Sep Dec Mar Jun Sep Dec Mar Jun Sep Dec Mar Jun
2002 2003 2004 2005
Labour Cost Index
Education
Health
Public Service
Private
Other central govt services
Source: Statistics NZ. Labour Cost Index – All Salary and Wage rates In the past year, the average pay increase for permanent public servants who remained in the same job (48% of permanent public servants) was 5.7% (6.1% in 2004) compared with
7
estimates of between 4.3% and 5.0% for the labour market as a whole (3.8% and 5.1% in 2004). This movement was not uniform with many employees receiving smaller increases and 14% of this group receiving no increase. These figures include performance or service related pay increases as well as increases in the ‘rate for the job’. Data from remuneration survey companies for jobs at the median Public Service job size vary but indicate that overall at this job size, salaries across the labour market were similar to those in the Public Service. This is a change from the 4% gap (Public Service behind) reported last year at the median Public Service job size. 21% of public servants received lump sum performance payments during the year to 30 June 2005. Lump sum performance payments were made by 31 organisations and the average payment4 was $2,600.
Superannuation At 30 June 2005, 52% of permanent (48% of all) public servants were members of an employer subsidised superannuation scheme and 40% belonged to the State Sector Retirement Savings Scheme (SSRSS). Ten percent of fixed term public servants were members of an employer subsidised superannuation scheme, with most belonging to the SSRSS. The number of SSRSS members in the Public Service at 30 June 2005 was 3% higher than in July 2004. At 30 June 2005, 37% of these members were contributing more than 1.5% of their salary to the SSRSS with 31% contributing 3% or more. After the maximum employer subsidy for SSRSS schemes increased to 3% in July 2005, 81% of SSRSS members in the Public Service contributed 3% and qualified for the increased employer subsidy. This included a further 396 public servants who joined the SSRSS after 1 July 2005. 22% of the new joiners moved from other employer subsidised schemes to the SSRSS.
Collective bargaining The proportion of employees covered by current collective agreements fell from 51% to 49%, due to an increase in the proportion on expired collectives from 3% in 2004 to 6% in 2005. 58% of employees were union members, the same level as at 30 June 2004. 76% of union members belonged to the Public Service Association.
Gender pay gaps Because pay varies considerably between occupations, simple pay gap comparisons between sectors that have different occupational compositions are problematic. Controlling for the effect of the occupational structure of the Public Service gives an adjusted gender pay gap* of 10% (10% in 2004) in the Public Service, compared with 19% (17% in 2004) for the employed labour force as a whole. When adjusted for both age and occupation, the gender pay gaps reduce to 8% (8% in 2004) in the Public Service and 17% (16% in 2004) in the labour force as a whole.
4 The average payment excludes lump sum performance payments made to Chief Executives. * The unadjusted gender pay gap in the Public Service in 2005 was 17% (which is the same as 2004). [Added
February 2006.]
8
Pay gaps5 for ethnic groups For Māori the occupation-adjusted pay gap in the Public Service was 6% (6% in 2004) and 8% (10% in 2004) in the employed labour force as a whole. For Pacific peoples, the gaps were 11% (10% in 2004) in the Public Service and 15% (14% in 2004) in the employed labour force. The occupation-adjusted pay gap for Asian public servants was 7% (5% in 2004). Figures for Asian peoples in the labour force are not available. The younger age profile of each of these ethnic groups in the Public Service (and the wider population) has an effect on pay gaps. When adjusted for age and occupation, the pay gaps in the Public Service reduce to 5% for Māori, 8% for Pacific peoples and 4% for Asian peoples. Comparable figures from the labour force are not available. There are also gender pay gaps (adjusted for age and occupation) within different ethnic groups in the Public Service: • Māori women were paid on average 4% less than Māori men and 11% less than all
men.
• Pacific women were paid 2% less than Pacific men and 15% less than all men.
• Asian women were paid 3% less than Asian men and 11% less than all men.
Employment stability and security Permanent and full time employment continue to characterise the Public Service. About a third of permanent public servants have been with their department for more than 10 years. Turnover rates this year are slightly higher than seen in previous years, with turnover rates for younger employees continuing to be about 10% higher than the Public Service average. Cohort analysis6 on employees in the Public Service between 2000 and 2005 shows that 51% of permanent staff in 2000 were still employed in the Public Service in 2005. Retention was highest in the Personal & Protective Services Workers7 (67%) occupation group and lowest in the Associate Professionals8 (45%) occupation group.
Turnover
The core unplanned turnover9 rate for the Public Service was 14% (14% for women, 12% for men) and the gross turnover rate (which includes people on fixed term employment) was 21%
5 Pay gap by ethnicity is the average salary for an ethnic group as a percentage of the average salary of those not in
that ethnic group. 6 The method used for identifying the 2000 cohort involved: 1) matching records for permanent employees who
remained in the same department throughout the 2000-2005 period, using their employee number or start and birth date where the employee number was not consistent 2) identifying people who moved between departments, using date of birth and gender where their start date with the new department was no later than one month after their end date with the previous department.
7 The Personal & Protective Services Workers occupation group are mostly prison officers. 8 The Associate Professionals occupation group includes social workers, case managers, administration officers,
customs officers and call centre operators. 9 Core unplanned turnover is primarily due to resignations of open-term employees, but also includes retirements,
dismissals, and death. Planned turnover includes cessations of staff on fixed-term employment agreements and cessations due to restructuring. The turnover rate for the Public Service is derived from the exits from departments. As a result it includes movements between departments and so the actual level of “loss” to the Public Service through unplanned exits is below the 14% reported here.
9
for the year to 30 June 2005. These rates are higher than those in the previous few years, which have hovered around 11%. Managers, Personal and Protective Services Workers and Trades and Production Workers (the smallest occupation group) had relatively low turnover (10%), while other groups such as Associate Professionals and Professionals had turnover rates consistent with the overall Public Service rate in 2005. Customer Service Clerks (who account for 4% of permanent public servants) had the highest turnover rate (18%). About 9% of the permanent employees who left their department in the June 2005 year moved to another Public Service department. Higher proportions of terminating staff in the Professional (16%) and Managerial (15%) occupation groups stayed in the Public Service compared with the other occupation groups.
Redundancy
The number of redundancy payments this year was the highest since 2002. This comes after four years of declining numbers of payments. In the year to June 2005, 218 people received redundancy payments, an increase of 50 from the previous year. These payments had an average value of $40,621, up from $37,133 in 2004. Redundancy payments were made by 21 departments with three departments accounting for more than 50% of the redundancies.
Part-time employees
9% of public servants worked part-time (less than 30 hours per week) compared to 24% of employees in the labour force10 as a whole. This is the same as for the 2004 year.
Parental leave
486 employees completed a period of parental leave during the year to 30 June 2005. 82 (17%) of these were men. The average length of parental leave for women was 197 calendar days (approximately 6.5 months) compared with 40 days for men. 21% of men took more than six weeks compared with 13% last year.
Annual leave
76% of permanent public servants were entitled to four weeks annual leave or more.
Recruitment difficulties, skill shortages and skill gaps Remuneration was the most commonly reported cause of recruitment difficulties in 2005. More departments reported this as a recruitment difficulty in 2005 (22 departments), than in 2004 (18 departments). Some strategies reported for dealing with this were to appoint a person with a lower level of skills with the view to developing them, revise the salary range, or to pay a premium above the salary range. Negative perceptions of working for the Public Service, a particular department or in a particular role, was the second most common cause of recruitment difficulties. Skill shortages exist when employers have difficulty filling vacancies for positions where pay and conditions are reasonable. Policy analysts continued to be the most commonly reported skill shortage, particularly senior policy analysts. The 12 departments that reported
10 Source: Statistics NZ. New Zealand Income Survey (June 2005)
10
this said there was a lack of suitably qualified or experienced candidates for these positions and there was strong competition between departments for people with these skills. Methods for dealing with the skill shortage for policy analyst roles included hiring contractors, continuous advertising and recruiting from overseas, as well as developing existing staff through secondments and internal leadership programmes. Other skill shortages reported by several departments included a range of IT, human resource and administration roles. Five departments reported a shortage of people suitable to fill roles related to Māori language and /or culture or land issues. Reported skill shortages that were department specific were social workers, archivists, veterinarians, surveyors and legal support staff. The information departments provided on skill gaps supported that already provided for recruitment difficulties and skill shortages. The most common skill gap across departments was in the area of high-level policy analysis, followed by the related skills of project management and relationship management. The main factors departments saw as affecting their future staffing capability were: the tight labour market and competition for staff within the Public Service and with other sectors, remuneration levels, and bureaucratic recruitment processes hindering their ability to react quickly to changing market conditions.
Equal employment opportunities Table 2 shows the overall representation of EEO groups in the Public Service and the employed labour force, where available. It shows that the Public Service continues to employ high proportions of EEO group members when compared with the employed labour force. While the representation of each of these groups in the Public Service has increased since 1998, these increases have been broadly in line with the change in their representation in the wider workforce. Asian peoples have been the fastest growing ethnic group in the Public Service over the last three years, while the proportions of Māori and Pacific peoples have levelled out. The State Services Commission has recently published an analysis of ethnic groups employed in the Public Service in the EEO Progress in the Public Service 2000-2004 report. The relatively high proportion of women in the Public Service occurs mostly because the Public Service employs people in occupations that women tend to work in (such as social workers, case workers and clerical staff). Māori had a high level of representation in the Public Service across all major occupation groups when compared with the employed labour force as a whole. Pacific peoples were also more highly represented in the major occupation groups in the Public Service than in the labour force as a whole, particularly in the associate professional, customer service, clerical and personal and protective services occupation groups. Cohort analysis between 2000 and 2005 shows that the retention rates for women were lower than for men. 46% of female public servants who were employed in 2000 were continuously employed during this period, including periods of parental leave up to June 2005, compared
11
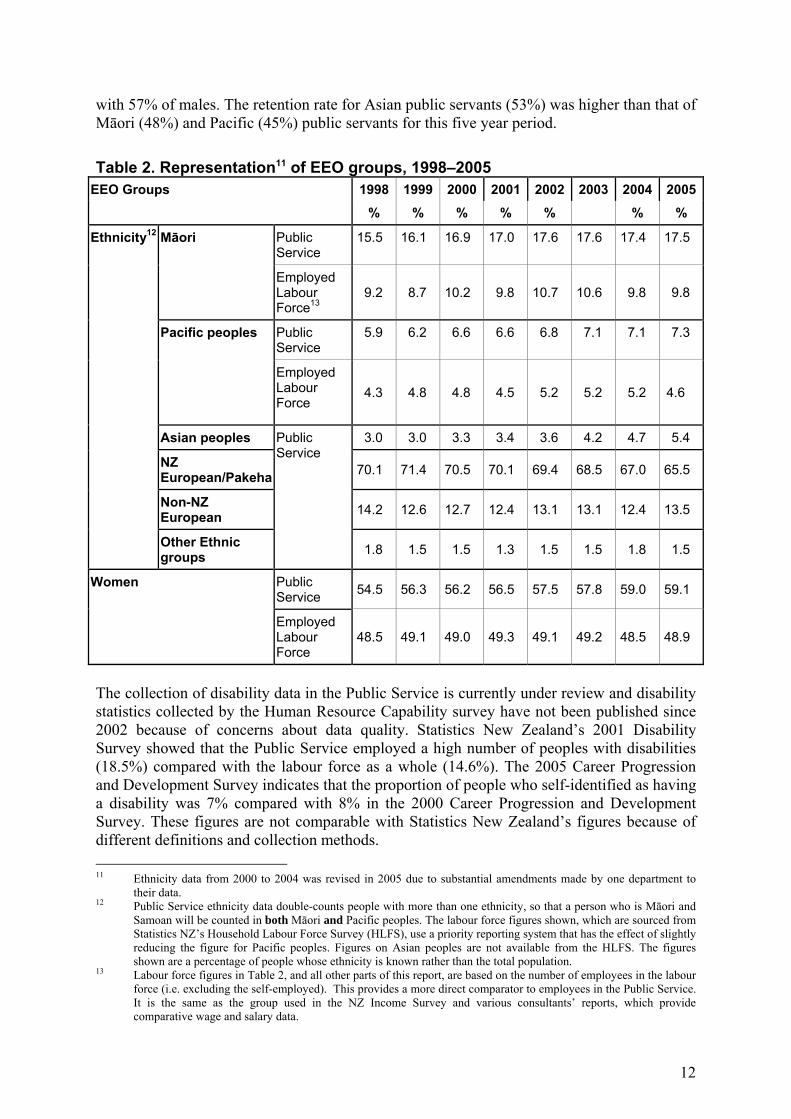
with 57% of males. The retention rate for Asian public servants (53%) was higher than that of Māori (48%) and Pacific (45%) public servants for this five year period.
Table 2. Representation11 of EEO groups, 1998–2005 EEO Groups 1998 1999 2000 2001 2002 2003 2004 2005
% % % % % % %
Public Service
15.5 16.1 16.9 17.0 17.6 17.6 17.4 17.5 Māori
Employed Labour Force13
9.2
8.7
10.2
9.8
10.7
10.6
9.8 9.8
Public Service
5.9 6.2 6.6 6.6 6.8 7.1 7.1 7.3 Pacific peoples
Employed Labour Force
4.3 4.8 4.8 4.5 5.2 5.2 5.2 4.6
Asian peoples 3.0 3.0 3.3 3.4 3.6 4.2 4.7 5.4
NZ European/Pakeha 70.1 71.4 70.5 70.1 69.4 68.5 67.0 65.5
Non-NZ European 14.2 12.6 12.7 12.4 13.1 13.1 12.4 13.5
Ethnicity12
Other Ethnic groups
Public Service
1.8 1.5 1.5 1.3 1.5 1.5 1.8 1.5
Public Service 54.5 56.3 56.2 56.5 57.5 57.8 59.0 59.1 Women
Employed Labour Force
48.5 49.1 49.0 49.3 49.1 49.2 48.5 48.9
The collection of disability data in the Public Service is currently under review and disability statistics collected by the Human Resource Capability survey have not been published since 2002 because of concerns about data quality. Statistics New Zealand’s 2001 Disability Survey showed that the Public Service employed a high number of peoples with disabilities (18.5%) compared with the labour force as a whole (14.6%). The 2005 Career Progression and Development Survey indicates that the proportion of people who self-identified as having a disability was 7% compared with 8% in the 2000 Career Progression and Development Survey. These figures are not comparable with Statistics New Zealand’s figures because of different definitions and collection methods. 11 Ethnicity data from 2000 to 2004 was revised in 2005 due to substantial amendments made by one department to
their data. 12 Public Service ethnicity data double-counts people with more than one ethnicity, so that a person who is Māori and
Samoan will be counted in both Māori and Pacific peoples. The labour force figures shown, which are sourced from Statistics NZ’s Household Labour Force Survey (HLFS), use a priority reporting system that has the effect of slightly reducing the figure for Pacific peoples. Figures on Asian peoples are not available from the HLFS. The figures shown are a percentage of people whose ethnicity is known rather than the total population.
13 Labour force figures in Table 2, and all other parts of this report, are based on the number of employees in the labour force (i.e. excluding the self-employed). This provides a more direct comparator to employees in the Public Service. It is the same as the group used in the NZ Income Survey and various consultants’ reports, which provide comparative wage and salary data.
12
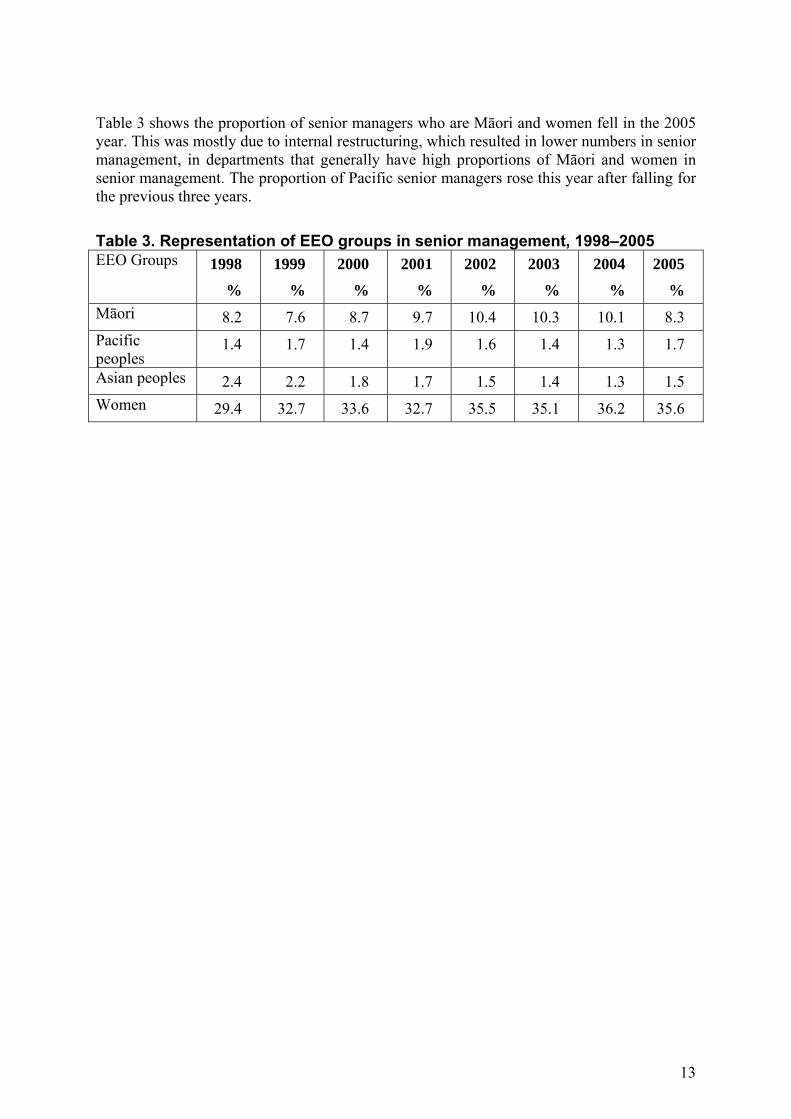
Table 3 shows the proportion of senior managers who are Māori and women fell in the 2005 year. This was mostly due to internal restructuring, which resulted in lower numbers in senior management, in departments that generally have high proportions of Māori and women in senior management. The proportion of Pacific senior managers rose this year after falling for the previous three years.
Table 3. Representation of EEO groups in senior management, 1998–2005 EEO Groups 1998
%
1999
%
2000
%
2001
%
2002
%
2003
%
2004
%
2005
% Māori 8.2 7.6 8.7 9.7 10.4 10.3 10.1 8.3 Pacific peoples
1.4 1.7 1.4 1.9 1.6 1.4 1.3 1.7
Asian peoples 2.4 2.2 1.8 1.7 1.5 1.4 1.3 1.5 Women 29.4 32.7 33.6 32.7 35.5 35.1 36.2 35.6
13
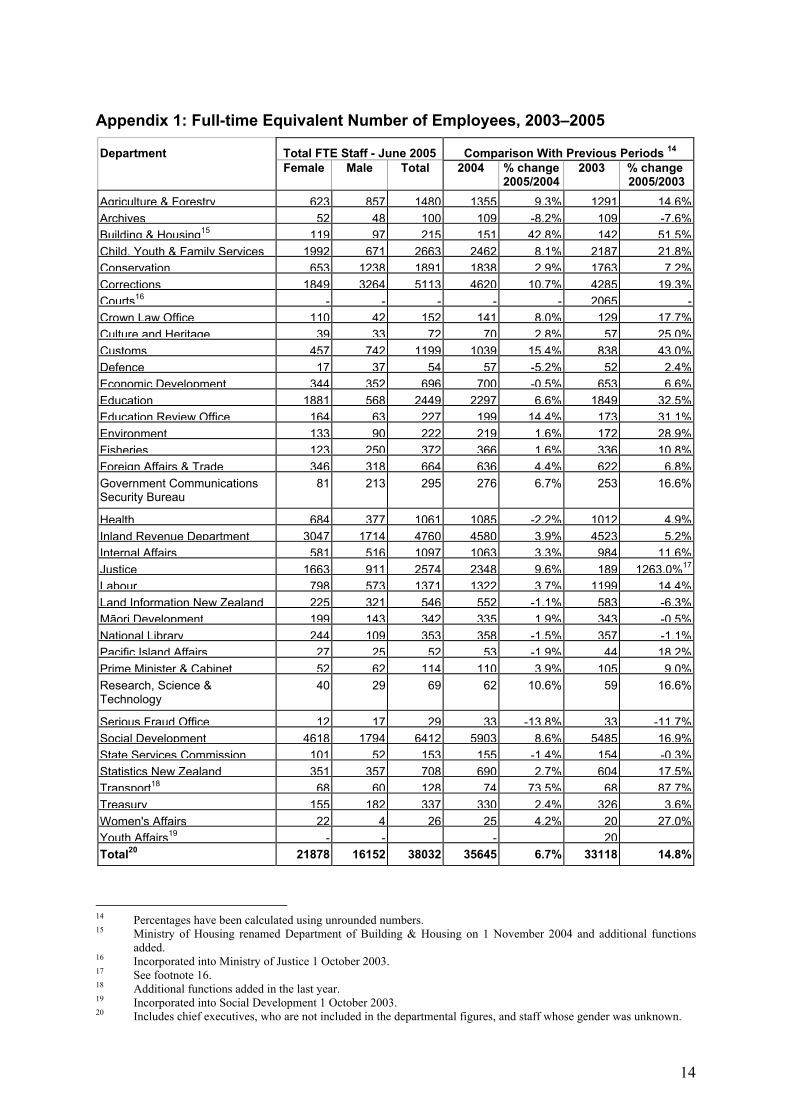
Appendix 1: Full-time Equivalent Number of Employees, 2003–2005
Total FTE Staff - June 2005 Comparison With Previous Periods 14Department Female Male Total 2004 % change
2005/2004 2003 % change
2005/2003 Agriculture & Forestry 623 857 1480 1355 9.3% 1291 14.6%Archives 52 48 100 109 -8.2% 109 -7.6%Building & Housing15 119 97 215 151 42.8% 142 51.5%Child, Youth & Family Services 1992 671 2663 2462 8.1% 2187 21.8%Conservation 653 1238 1891 1838 2.9% 1763 7.2%Corrections 1849 3264 5113 4620 10.7% 4285 19.3%Courts16 - - - - - 2065 -Crown Law Office 110 42 152 141 8.0% 129 17.7%Culture and Heritage 39 33 72 70 2.8% 57 25.0%Customs 457 742 1199 1039 15.4% 838 43.0%Defence 17 37 54 57 -5.2% 52 2.4%Economic Development 344 352 696 700 -0.5% 653 6.6%Education 1881 568 2449 2297 6.6% 1849 32.5%Education Review Office 164 63 227 199 14.4% 173 31.1%Environment 133 90 222 219 1.6% 172 28.9%Fisheries 123 250 372 366 1.6% 336 10.8%Foreign Affairs & Trade 346 318 664 636 4.4% 622 6.8%Government Communications Security Bureau
81 213 295 276 6.7% 253 16.6%
Health 684 377 1061 1085 -2.2% 1012 4.9%Inland Revenue Department 3047 1714 4760 4580 3.9% 4523 5.2%Internal Affairs 581 516 1097 1063 3.3% 984 11.6%Justice 1663 911 2574 2348 9.6% 189 1263.0%17
Labour 798 573 1371 1322 3.7% 1199 14.4%Land Information New Zealand 225 321 546 552 -1.1% 583 -6.3%Māori Development 199 143 342 335 1.9% 343 -0.5%National Library 244 109 353 358 -1.5% 357 -1.1%Pacific Island Affairs 27 25 52 53 -1.9% 44 18.2%Prime Minister & Cabinet 52 62 114 110 3.9% 105 9.0%Research, Science & Technology
40 29 69 62 10.6% 59 16.6%
Serious Fraud Office 12 17 29 33 -13.8% 33 -11.7%Social Development 4618 1794 6412 5903 8.6% 5485 16.9%State Services Commission 101 52 153 155 -1.4% 154 -0.3%Statistics New Zealand 351 357 708 690 2.7% 604 17.5%Transport18 68 60 128 74 73.5% 68 87.7%Treasury 155 182 337 330 2.4% 326 3.6%Women's Affairs 22 4 26 25 4.2% 20 27.0%Youth Affairs19 - - - 20Total20 21878 16152 38032 35645 6.7% 33118 14.8%
14 Percentages have been calculated using unrounded numbers. 15 Ministry of Housing renamed Department of Building & Housing on 1 November 2004 and additional functions
added. 16 Incorporated into Ministry of Justice 1 October 2003. 17 See footnote 16. 18 Additional functions added in the last year. 19 Incorporated into Social Development 1 October 2003. 20 Includes chief executives, who are not included in the departmental figures, and staff whose gender was unknown.
14

Appendix 2: Collective Bargaining and Employment Term – June 2005
% of staff % of staff Department
IEA CA Expired CA21 Fixed-term Open-term
Agriculture & Forestry 44 8 48 3 97
Archives 25 75 0 4 96
Child, Youth & Family Services 48 52 0 12 88
Conservation 40 60 0 17 83
Corrections 38 59 3 4 96
Crown Law Office 87 0 13 6 94
Culture and Heritage 52 48 0 25 75
Customs 29 71 0 1 99
Defence 100 0 0 4 96
Economic Development 76 24 0 6 94
Education 56 43 1 34 66
Education Review Office 31 69 0 6 94
Environment 52 48 0 13 87
Fisheries 70 0 30 4 96
Foreign Affairs & Trade 35 65 0 5 95
Government Communications Security Bureau
37 3 60 0 100
Health 83 17 0 11 89
Housing 65 35 0 18 82
Inland Revenue Department 32 68 0 3 97
Internal Affairs 60 40 0 6 94
Justice 38 57 5 11 89
Labour 68 21 11 8 92
Land Information New Zealand 49 0 51 5 95
Māori Development 98 0 2 20 80
National Library 37 63 0 8 92
Pacific Island Affairs 100 0 0 4 96
Prime Minister & Cabinet 100 0 0 19 81
Research, Science & Technology 100 0 0 9 91
Serious Fraud Office 100 0 0 0 100
Social Development 36 58 6 5 95
State Services Commission 100 0 0 14 86
Statistics New Zealand 52 48 0 13 87
Transport 98 2 0 3 97
Treasury 100 0 0 3 97
Women's Affairs 59 0 41 7 93 Total22 46 49 6 9 91
21 Includes agreements that have been expired for more than 12 months but which are still in active bargaining. 22 Includes chief executives, who are not included in the departmental figures.
15


