83
HUMAN RESPONSE TO VIBRATION IN RESIDENTIAL ENVIRONMENTS (NANR209) TECHNICAL REPORT 5 ANALYSIS OF THE SOCIAL SURVEY FINDINGS 31 ST MARCH 2011 Jenna Condie and Andy Steele

HUMAN RESPONSE TO VIBRATION IN RESIDENTIAL ENVIRONMENTS (NANR209)
TECHNICAL REPORT 5
ANALYSIS OF THE SOCIAL SURVEY FINDINGS
31ST MARCH 2011
Jenna Condie and Andy Steele

NANR209 Technical report 5
2
Foreword This research was commissioned by the previous government.
The work was funded by the Department for Environment Food and Rural Affairs.
The views and analysis expressed in this report are those of the authors and do not necessarily reflect those of the Department for Environment Food and Rural Affairs.
Please cite this document as follows:
Condie, J., & Steele, A. (2011) Human Response to Vibration in Residential Environments (NANR209), Technical Report 5: Analysis of Social Survey Findings, Defra (London)

NANR209 Technical report 5
3
Preface This document is one component of the Defra project NANR209 ‘Human response to vibration in residential environments’ final report.
The NANR209 Final Report consists of the following documents:
• Executive summary • Final project report • Technical report 1: Measurement of vibration exposure • Technical report 2: Measurement of response • Technical report 3: Calculation of vibration exposure • Technical report 4: Measurement and calculation of noise exposure • Technical report 5: Analysis of the social survey findings • Technical report 6: Determination of exposure-response relationships
The project was performed at the University of Salford between January 2008 and March 2011. During that time the following University of Salford researchers worked on the project. David Waddington, Andy Moorhouse, Mags Adams, Geoff Kerry, Rodolfo Venegas, Andy Elliott, Victoria Henshaw, Eulalia Peris, Phil Brown, Andy Steele, Jenna Condie, Gennaro Sica, James Woodcock, Deborah Atkin, Nathan Whittle, Zbigniew Koziel, George Perkins, Natalia Szczepanczyk, Sharron Henning, Ryan Woolrych, Heather Dawes, Amy Martin, Maria Beatrice Aquino-Petkos, Laura Jane Buckley, Catherine McGee, Andrew Caunce, Valentin Le Bescond, Stephanie Jones, Dawn Smail, Andrew King, Lauren Hunt, Michael Gerard Smith, Tomos Evans.
The work by the University of Salford benefited from guidance by the Defra project steering group. The Defra project steering group consisted of Richard Perkins and Colin Grimwood on behalf of Defra, Colin Stanworth representing the interests of the British Standards Institution working group for BS6472, Rupert Thornely-Taylor representing the interests of the Association of Noise Consultants, and Henk Miedema, Sabine Janssen and Henk Vos from TNO (Netherlands Organization for Applied Scientific Research).
This project benefited from guidance in the design of the vibration measurement equipment from the suppliers Guralp Ltd.
The peer review of the railway questionnaire was performed by Jim Fields, Larry Finegold, Evy Öhrström, Peter Brooker, and Gary J Raw.
This research would not have been possible without the kind cooperation of the residents that took part in the field trials.
The work presented is research performed by the University of Salford funded by Defra.

NANR209 Technical report 5
4
CONTENTS Executive summary .................................................................................................................... 9
1 Introduction ...................................................................................................................... 10
1.1 Outline of this technical report ................................................................................ 10
1.2 Overall respondent characteristics ........................................................................... 10
2 The railway data ............................................................................................................... 14
2.1 Success rate .............................................................................................................. 15
2.2 Survey implementation ............................................................................................ 15
3 Vibration from railways: social survey findings .............................................................. 16
3.1 Sample characteristics .............................................................................................. 16
3.2 Vibration response ................................................................................................... 17
3.3 Noise response ......................................................................................................... 35
3.4 Vibration and noise .................................................................................................. 40
3.5 Other data ................................................................................................................. 41
3.6 Co-ordination of vibration measurements and social survey ................................... 43
4 The construction data ....................................................................................................... 44
4.1 Success rate .............................................................................................................. 44
4.2 Survey implementation ............................................................................................ 45
5 Vibration from construction activity: social survey findings .......................................... 45
5.1 Sample characteristics .............................................................................................. 45
5.2 Vibration response ................................................................................................... 47
5.3 Noise response ......................................................................................................... 60
5.4 Vibration and noise .................................................................................................. 65
5.5 Other data ................................................................................................................. 66
5.6 Co-ordination of vibration measurements and social survey ................................... 69
6 The internal sources data ................................................................................................. 69
6.1 Success rate .............................................................................................................. 69

NANR209 Technical report 5
5
6.2 Survey implementation ............................................................................................ 70
7 Vibration from internal sources: social survey findings .................................................. 71
7.1 Sample characteristics .............................................................................................. 71
7.2 Vibration response ................................................................................................... 72
7.3 Noise response ......................................................................................................... 77
7.4 Other data ................................................................................................................. 79
7.5 Co-ordination of vibration measurements and social survey ................................... 80
8 Discussion ........................................................................................................................ 80
9 Conclusions ...................................................................................................................... 82
10 References ........................................................................................................................ 83
11 Appendices ....................................................................................................................... 83

NANR209 Technical report 5
6
List of Figures
Figure 1: Percentages of respondents by age group (N = 1431) .............................................. 11
Figure 2: Percentages of respondents by type of dwelling (N = 1431) ................................... 12
Figure 3: Percentages of respondents by tenure (N = 1431) .................................................... 12
Figure 4: Percentages of respondents by employment status (N = 1431) ................................ 13
Figure 5: Percentages of respondents by length of time living in property (N = 1431) .......... 14
Figure 6: percentage of respondents feeling vibration from all sources (N = 931) ................. 18
Figure 7: percentage of people hearing or seeing vibration from all sources (N = 931) ......... 19
Figure 8: Percentage of respondents feeling vibration through structures (N = 684) .............. 20
Figure 9: Percentage of respondents hearing or seeing objects vibrate (N = 353) .................. 21
Figure 10: Activities affected by feeling vibration (N = 684) ................................................. 22
Figure 11: Activities affected by hearing or seeing vibration (N = 396) ................................. 23
Figure 12: Annoyance ratings for railway vibration on the five-point semantic scale (N = 666) .......................................................................................................................................... 24
Figure 13: Numbers of people and vibration annoyance ratings for other vibration sources .. 26
Figure 14: Annoyance ratings on the five-point semantic scale for passenger trains (N = 265) .................................................................................................................................................. 27
Figure 15: Annoyance ratings on the five-point semantic scale for freight trains (N = 270) .. 29
Figure 16: Annoyance ratings on the five-point semantic scale for railway maintenance (N = 244) .......................................................................................................................................... 31
Figure 17: Annoyance ratings for railway vibration on the five-point semantic scale for day, evening, and night (N = 278) ................................................................................................... 33
Figure 18: Noise sources heard by respondents (N = 931) ...................................................... 36
Figure 19: Percentage of respondents bothered, annoyed, or disturbed by activity (N = 850) 37
Figure 20: Annoyance ratings for railway noise on the five-point semantic scale (N = 782) . 37
Figure 21: Numbers of people and annoyance ratings for other noise sources ....................... 39
Figure 22: Annoyance ratings for railway noises on the five-point semantic scale (N = 355) 40
Figure 23: Respondents self-reported ratings of vibration sensitivity ..................................... 43

NANR209 Technical report 5
7
Figure 24: Percentages of respondents feeling vibration from all vibration sources (N = 350) .................................................................................................................................................. 48
Figure 25: percentage of people hearing or seeing vibration from all vibration sources (N = 350) .......................................................................................................................................... 49
Figure 26: Percentages of respondents and structures vibration felt through (N = 283) ......... 50
Figure 27: Percentages of respondents hearing or seeing objects vibrate (N = 176) ............... 51
Figure 28: Activities affected by feeling vibration (N = 283) ................................................. 52
Figure 29: Activities affected by hearing or seeing vibration (N = 176) ................................. 53
Figure 30: Annoyance ratings for construction vibration on the five-point semantic scale (N=235) .................................................................................................................................... 54
Figure 31: Annoyance ratings on the five-point semantic scale for demolition (N=164) ....... 56
Figure 32: Annoyance ratings on the five-point semantic scale for piling (N=164) ............... 56
Figure 33: Annoyance ratings on the five-point semantic scale for roadworks (N = 164) ...... 57
Figure 34: Annoyance ratings on the five-point semantic scale for drilling (N = 164) ........... 57
Figure 35: Annoyance ratings on the five-point semantic scale for surface activity (N=164) 58
Figure 36: Annoyance ratings for construction vibration on the five point semantic scale for day, evening and night (N = 164) ............................................................................................ 60
Figure 37: Noise sources heard by respondents (N = 350) ...................................................... 61
Figure 38: Annoyance ratings on the five-point semantic scale for construction noise (N = 272) .......................................................................................................................................... 62
Figure 39: Annoyance ratings on the five point semantic scale for construction noises (N=193) .................................................................................................................................... 64
Figure 40: Respondents self reported ratings of acceptability of vibration (N=275) .............. 68
Figure 41: Respondents self-reported ratings of vibration sensitivity (N = 275) .................... 69
Figure 42: Percentage of respondents by structures vibration felt through (N = 56) .............. 73
Figure 43: Activities affected by feeling vibration (n = 56) .................................................... 74
Figure 44: Activities affected by hearing or seeing vibration (N = 26) ................................... 75
Figure 45: Annoyance ratings for internal vibration on the five-point semantic scale (N = 30) .................................................................................................................................................. 76
Figure 46: Noise sources heard by respondents (N = 150) ...................................................... 77

NANR209 Technical report 5
8
Figure 47: Annoyance ratings for noise from internal sources on the five-point semantic scale (N = 90) .................................................................................................................................... 78

NANR209 Technical report 5
9
EXECUTIVE SUMMARY
Social survey questionnaires were carried out with 1431 residents in order to explore the human response to vibration in residential environments. Three different sources of vibration were investigated – railways (931 respondents), construction activity (350 respondents), and internal sources of vibration (150 respondents). This report provides an overview of respondent characteristics for each sample, a review of self-reported vibration and noise annoyance ratings for each of the three sources, whilst exploring how contextual and other personal and social factors may shape residents’ responses to vibration in their homes. Differences between sources of vibration and the responses elicited are also discussed.
Annoyance responses were gathered on five-point semantic and eleven-point numerical scales (see Technical Report 2: Measurement of Response for the development of the social survey questionnaire). Drawing on the recommendation of Schultz (1978) to take the top 27-29% of a response scale to create highly annoyed categories, those respondents giving a rating of 8, 9, or 10 on the eleven-point numerical scale (27.3% of the scale) for vibration and noise were considered to be highly annoyed. For vibration from railways (N = 931) 9.7% were highly annoyed and for vibration from construction activity (N = 350) 37.9% were highly annoyed. For internal sources of vibration (N = 150) a highly annoyed category could not be created as no respondents gave a rating of 8, 9, or 10 on the eleven-point scale. Such findings can be explained by the levels of vibration residents of vibration were exposed to (see Technical Report 6: Determination of Exposure-Response Relationships). However, other factors such as the daily activities vibration disturbs, how acceptable levels of vibration and noise are perceived to be, how sensitive respondents report they are to vibration and noise, and other qualitative data about the respondents relationship with their residential environment, further understandings of annoyance ratings given by those living near railways and construction activity.

NANR209 Technical report 5
10
1 INTRODUCTION
1.1 OUTLINE OF THIS TECHNICAL REPORT
This technical report presents the results of the social survey questionnaire data collected from 931 residents living next to a railway, 350 residents living near construction works, and 150 residents living in apartment blocks where internal sources of vibration may be present. The analysis was undertaken using SPSS (Statistical Package for the Social Sciences) and as such the totals will not necessarily add up to 100% as the software automatically rounds percentages to the nearest whole unit.
To give an idea as to how such samples have been achieved, an analysis of the success rates of carrying out social surveys with residents is presented for each source. Descriptive analyses of the sample characteristics and the responses given are also presented, alongside the qualitative data collected in the social survey questionnaire to explore and further enhance understanding of the response to vibration in residential environments. Essentially, this report presents a narrative account of the ‘response’ data by contextualising the social survey findings.
Where data is discussed, the corresponding question number (e.g. A1) from the social survey questionnaire is included for reference. The development of the social survey questionnaire used to gather responses is not outlined in this technical report as it is discussed elsewhere in Technical Report 2: Measurement of Response. Three versions of the social survey questionnaire are available in the Appendices: Appendix 1 (railway specific questionnaire), Appendix 2 (construction specific questionnaire), and Appendix 3 (internal sources specific questionnaire). For more in depth inferential analyses of the data, and for exposure-response relationships see Technical Report 6: Determination of exposure-response relationships.
1.2 OVERALL RESPONDENT CHARACTERISTICS
This section outlines the characteristics of respondents who participated in this research project. A total of 1431 social survey questionnaires were carried out with residents living near or with sources of vibration in the residential environment. Three sources of vibration were explored: railway (931 respondents), construction activity (350 respondents) and internal sources of vibration (150 respondents). Missing values, where respondents did not provide information for particular questions, were excluded from the analysis.
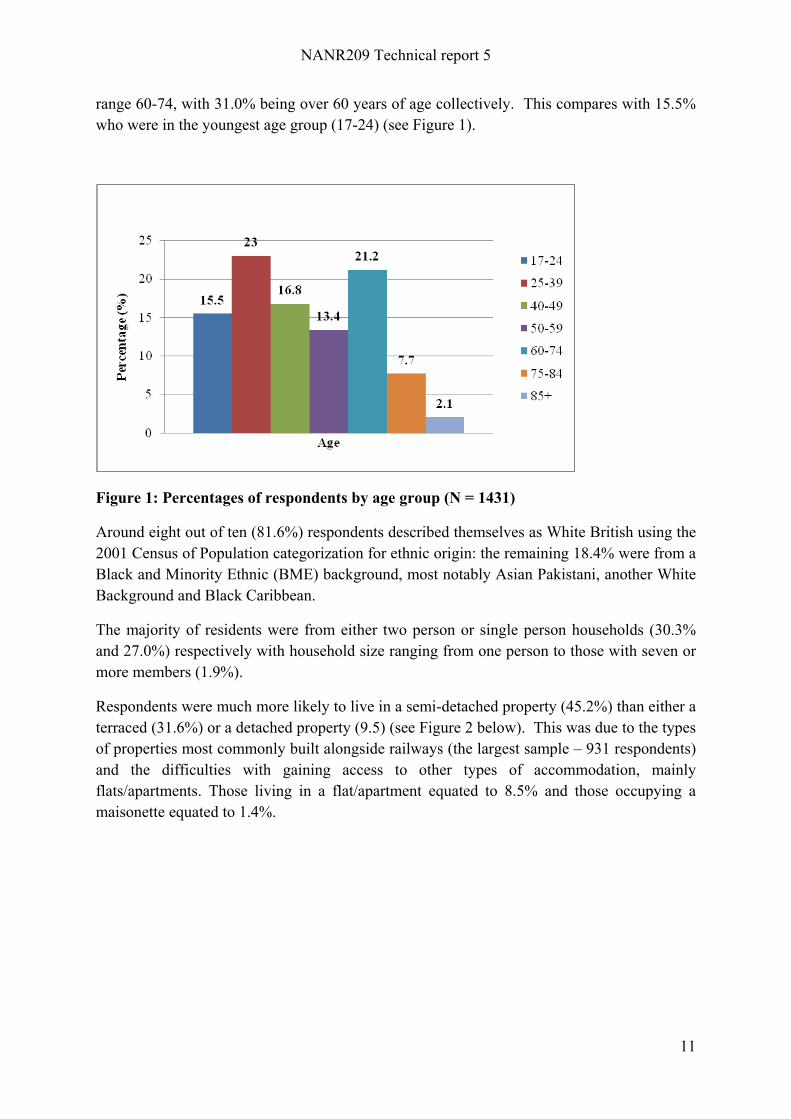
There were slightly more women (56.6%) than men in the sample. In terms of the age profile of the respondents, the largest group (23.0%) was aged 35-39, followed by 21.2% in the age
NANR209 Technical report 5
11
range 60-74, with 31.0% being over 60 years of age collectively. This compares with 15.5% who were in the youngest age group (17-24) (see Figure 1).
Figure 1: Percentages of respondents by age group (N = 1431)
Around eight out of ten (81.6%) respondents described themselves as White British using the 2001 Census of Population categorization for ethnic origin: the remaining 18.4% were from a Black and Minority Ethnic (BME) background, most notably Asian Pakistani, another White Background and Black Caribbean.
The majority of residents were from either two person or single person households (30.3% and 27.0%) respectively with household size ranging from one person to those with seven or more members (1.9%).
Respondents were much more likely to live in a semi-detached property (45.2%) than either a terraced (31.6%) or a detached property (9.5) (see Figure 2 below). This was due to the types of properties most commonly built alongside railways (the largest sample – 931 respondents) and the difficulties with gaining access to other types of accommodation, mainly flats/apartments. Those living in a flat/apartment equated to 8.5% and those occupying a maisonette equated to 1.4%.

NANR209 Technical report 5
12
Figure 2: Percentages of respondents by type of dwelling (N = 1431)
With regard to the tenure of the property (see Figure 3), nearly two thirds of the sample (64.8%) owned their property outright or with a mortgage. The second largest group rented in the private sector (17.0%), followed by 14.2% who rented their home either from a Council or a Housing Association. Smaller numbers had a shared ownership property (part owned and part rented) or referred to ‘other’.
Figure 3: Percentages of respondents by tenure (N = 1431)
At the time of the interview, slightly less than four out of ten (38.1%) respondents were in employment and a further 5.8% were either self-employed or owned their own business (see Figure 4). The proportion who were retired from work accounted for 28.4%, and slightly

NANR209 Technical report 5
13
more than one out of ten (11.0%) respondents were students. Smaller numbers described themselves as a carer/homemaker, as unemployed, or referred to other activities (e.g. volunteering). Around one quarter of those in some form of employment (24.8%) undertook shift work.
Figure 4: Percentages of respondents by employment status (N = 1431)
The length of time respondents had been living at their current address varied from less than 1 year (9.7%) to 20 or more years (30.6%), with this latter group equating to the largest proportion. A further 17.2% referred to a time period of more than 5 years but less than 10 years (see Figure 5 below).

NANR209 Technical report 5
14
Figure 5: Percentages of respondents by length of time living in property (N = 1431)
Within this report, the respondent characteristics are also described for each vibration source investigated – railways, construction activity, and internal sources. The social survey findings for each source are now discussed separately. Firstly, the social survey findings from respondents living near railways are explored followed by the analysis of the construction activity social survey findings. The findings of the social survey questionnaires carried out with residents living in buildings where internal sources of vibration are more likely to occur are then presented. Following these analyses, the findings from all three datasets are discussed and explored.
2 THE RAILWAY DATA
Throughout the railway specific social survey questionnaire, the railway was defined as ‘the railway, including passenger trains, freight trains, track maintenance or any other activity from the railway’ to ensure all possible railway related activities were considered by respondents when providing their answers. The source-specific sections relevant to railway are Section F: Railway Vibration, and Section G: Railway Noise (see Appendix 1 – railway specific questionnaire). When the others sources of vibration (i.e. construction activity and internal sources) were being researched, a more concise definition for railway was used (for more information see Technical Report 2: Measurement of response, Section 2.7.5. Definitional issues and comparisons across the data).
NANR209 Technical report 5
15
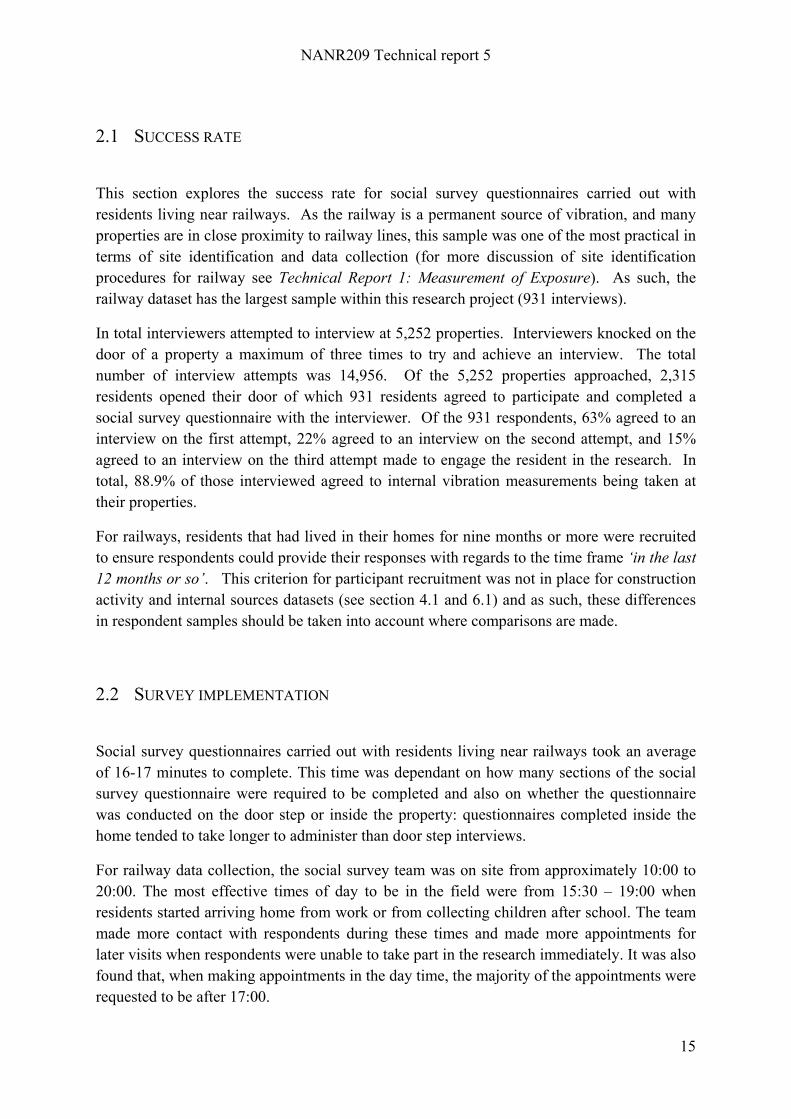
2.1 SUCCESS RATE
This section explores the success rate for social survey questionnaires carried out with residents living near railways. As the railway is a permanent source of vibration, and many properties are in close proximity to railway lines, this sample was one of the most practical in terms of site identification and data collection (for more discussion of site identification procedures for railway see Technical Report 1: Measurement of Exposure). As such, the railway dataset has the largest sample within this research project (931 interviews).
In total interviewers attempted to interview at 5,252 properties. Interviewers knocked on the door of a property a maximum of three times to try and achieve an interview. The total number of interview attempts was 14,956. Of the 5,252 properties approached, 2,315 residents opened their door of which 931 residents agreed to participate and completed a social survey questionnaire with the interviewer. Of the 931 respondents, 63% agreed to an interview on the first attempt, 22% agreed to an interview on the second attempt, and 15% agreed to an interview on the third attempt made to engage the resident in the research. In total, 88.9% of those interviewed agreed to internal vibration measurements being taken at their properties.
For railways, residents that had lived in their homes for nine months or more were recruited to ensure respondents could provide their responses with regards to the time frame ‘in the last 12 months or so’. This criterion for participant recruitment was not in place for construction activity and internal sources datasets (see section 4.1 and 6.1) and as such, these differences in respondent samples should be taken into account where comparisons are made.
2.2 SURVEY IMPLEMENTATION
Social survey questionnaires carried out with residents living near railways took an average of 16-17 minutes to complete. This time was dependant on how many sections of the social survey questionnaire were required to be completed and also on whether the questionnaire was conducted on the door step or inside the property: questionnaires completed inside the home tended to take longer to administer than door step interviews.
For railway data collection, the social survey team was on site from approximately 10:00 to 20:00. The most effective times of day to be in the field were from 15:30 – 19:00 when residents started arriving home from work or from collecting children after school. The team made more contact with respondents during these times and made more appointments for later visits when respondents were unable to take part in the research immediately. It was also found that, when making appointments in the day time, the majority of the appointments were requested to be after 17:00.

NANR209 Technical report 5
16
3 VIBRATION FROM RAILWAYS: SOCIAL SURVEY FINDINGS
This section presents the analysis of the social survey data collected with respondents living near railways. Firstly, the characteristics (e.g. age, gender, tenure) of the sample are presented followed secondly, by an analysis of the annoyance ratings given by respondents for all potential sources of vibration within the residential environment, with annoyance responses to railway explored in further detail. Noise annoyance responses for all potential sources of noise present within the residential environment are then subsequently explored, with railway noise annoyance examined in more detail. Beyond annoyance, the questionnaire collected other data from respondents to further explore response to vibration in the residential environment such as sensitivity to vibration, acceptability of vibration exposure, and satisfaction with the neighbourhood and home.
3.1 SAMPLE CHARACTERISTICS
Social survey questionnaires were completed with 931 residents living near railways. In terms of the demographic profile of the respondents, 55.3% were women with the largest proportion (25.6%) being aged 25-39, followed by 23.2% in the age range 60-74. Collectively, those aged 60 or over accounted for 31.9% which contrasts with slightly less than one out of ten (9.7%) who were in the youngest age group, between 17 and 24 years of age.
In line with the 2001 Census of Population classification of ethnicity, the vast majority described themselves as being White British while the remainder were from a BME background, of which the largest number were Asian Pakistani (6.3%), Asian Indian (1.3%), White Irish (1.2%) and those from another White background (1.2%).
The largest proportion of respondents (35.5%) were from two person households with the size of household ranging from a single person (19.1%) to those with seven or more members (1.8%).
At the time of the survey 44.0% of respondents were in some form of paid employment and a further 6.4% were either self-employed or an owner of a business. This compares with 28.6% who were retired from work and smaller numbers who were either a carer/homemaker (8.1%) or unemployed (6.5%). Slightly less than one quarter of those in work did shift work (23.8%) and this was more likely to be the case among the employed as opposed to self-employed.
Slightly less than half of the respondents (48.7%) lived in semi-detached properties as opposed to a terraced property (30.1%), a detached house (14.0%), an apartment or flat (1.4%) or maisonette (0.8%). Three-quarters of those surveyed (75.1%) were owner-

NANR209 Technical report 5
17
occupiers, 10.7% rented their home from either the Council or a Housing Association and a slightly smaller proportion (9.8%) were renting privately. Only two respondents lived in apartments which had been converted from an existing building. The majority of flat/apartment dwellers lived on the ground floor of a block with up to three floors.
The majority of home owners occupied a semi-detached property (53.2% of all owner occupiers), followed by a terraced property (25.1%). Those renting privately were more likely to live in a terraced property (51.6%) or a semi-detached (31.9%) than other housing types and similarly those renting in the social housing sector also tended to live in terraced property followed by a semi-detached (51.5% and 27.3% respectively). The majority of flat/apartment dwellers rented their home from either the Council or a Housing Association.
The largest proportion of residents (32.9%) had been living in their current home for over 20 years, followed by one out of five (20.1%) who mentioned a time frame of between 5 or more years but less than 10 and 15.4% who referred to a time period of between 1 and 3 years. In contrast, just 2.5% had been living at their current address for less than 12 months prior to the social survey taking place.
Alongside length of time living in the property, data was also collected on length of time living in the neighbourhood. The largest proportion of respondents, equating to four out of ten (40.8%) had lived in their neighbourhood for 20 or more years while 18.0% referred to a time period of 3 or more years but less than 5 and a small group (2.5%) mentioned having moved to the neighbourhood within the last 12 months. Those from the BME community were much more likely to have lived in the neighbourhood for a shorter period of time than the White British residents: 32.2% as compared with 12.7%. In contrast, 44.9% of the White British had lived in the neighbourhood for 20 or more years compared with 19.9% of the BME sample group.
With regard to what first attracted them to live in the neighbourhood, 42.7% mentioned that they had found the area attractive, 20.5% referred to wanting to near family or friends and 15.7% were born in the area. Smaller numbers also referred to: wanting to be near work (13.1%) and wanting to nearer their own community. A further 6.5% stated that they did not have a choice. The majority of this group were living in social housing and had been ‘allocated’ a property by their landlord.
3.2 VIBRATION RESPONSE
Firstly, the social survey questionnaire determined what vibration respondents could feel when inside their homes (D1) to explore the primary effect of vibration in the home. The sites where fieldwork was carried out were specifically identified as places where residents would feel vibration from the railway. Site identification was successful in that 665

NANR209 Technical report 5
18
respondents (71.4% of respondents interviewed)1 could feel vibration from the railway. All other sources of vibration that could potentially be present in a residential environment were felt by a much smaller number of respondents (see Figure 6) below. In total, 684 respondents felt vibration from one of the sources enquired about (73.4%).
Figure 6: percentage of respondents feeling vibration from all sources (N = 931)2
After railway vibration, 7.5% of respondents felt vibration from vehicles (cars, lorries, buses, and other road vehicles), 5.6% felt vibration from neighbouring homes, and 4% of respondents felt vibration from aeroplanes and helicopters. None of the 931 railway respondents felt vibration from underground railway (i.e. tube or metro), quarrying or mining, or from a source that they could not identify. Other sources of vibration felt by respondents (0.4%) were an earthquake, drum playing from a neighbouring property, and vibration from a nearby industrial estate. For the large majority of respondents, railway was the only or main source of vibration in the residential environment. In terms of feeling vibration, age and gender were not influential to response.
Respondents were also asked whether they could hear or see vibration within their homes (D5). Again, site identification was successful in that 344 respondents (36.9%) could hear or see vibration from the railway, with all other potential sources of vibration being seen or heard by a much smaller number of respondents (see Figure 7). In total, 353 respondents (37.9%) reported hearing or seeing the effects of vibration in their homes.
1 This percentage is for those living in close proximity to railways and is not reflective of the general population 2 Percentages do not total 100% due to more than one response being permitted for this question

NANR209 Technical report 5
19
Figure 7: percentage of people hearing or seeing vibration from all sources (N = 931)3
Like feeling vibration, the likelihood of hearing or seeing vibration within the home was not influenced by age or gender. In comparison to the respondents feeling vibration from the railway (71.4%), much fewer reported hearing or seeing things rattle, vibrate or shake from the railway (36.9%). Such a result suggests that respondents may be able to differentiate between the primary (feeling) and secondary (hearing or seeing) effects of vibration. With the exception of one respondent, all of those who reported that they could hear or see the effects of vibration could also feel vibration in their home.
Those that reported feeling vibration from one or more of the vibration sources enquired about were asked how they felt the vibration (D2) through the floor, chair, bed, when touching any surfaces with their hands, and from any other surfaces in their home. In total, 684 respondents were routed to this question (73.5% of the total sample).
3 Percentages do not total 100% due to more than one response being permitted for this question

NANR209 Technical report 5
20
Figure 8: Percentage of respondents feeling vibration through structures (N = 684)4
Of those that could feel vibration, from one or more of the sources enquired about, 70.5% felt vibration through the floor, 51.3% felt vibration through a chair, 63.6% felt vibration through a bed, and 29.4% reported that they felt vibration when touching surfaces in their home.
Eighty respondents (11.7%) reported feeling vibration through other surfaces in their home. In the latter cases, respondents were required to specify what other surfaces vibration was felt through. As such, a number of qualitative responses were collected, elaborating on the other surfaces such as walls, kitchen surfaces/worktops, and windows, with the majority of comments referring to railway vibration. A number of respondents reported that the whole house shook e.g. ‘all the house’, ‘everywhere, lamps, everything’, ‘whole house shakes’, yet were unable to pinpoint which surface or object they felt vibration through. One respondent stated that they felt ‘general vibration at times around the apartment, normally when a freight train is passing’. Another respondent felt this question difficult to answer: ‘not sure, can just sense it’. Such comments suggest that it is difficult to describe the sensory experience of vibration, and which structures vibration is sensed through. Alternatively, it could be that how vibration is sensed is not something people are overtly aware of, or pay attention to.
Interestingly, some of the other comments (D2) related to hearing and seeing the effects of vibration e.g. ‘can see ripples in the pond, the train at 1.30 is really bad’, ‘vibrations set the house alarm off’, and ‘handles on bedroom furniture rattle’. This could be indicative that respondents find it difficult to articulate and describe the differences between what they can feel, and what they can hear or see vibration.
4 Percentages do not total 100% due to more than one response being permitted for this question

NANR209 Technical report 5
21
Respondents (N = 353) who reported hearing or seeing things rattle, vibrate, or shake were asked (D6) to specify the structures and objects they had heard or seen vibrate. Figure 9 below shows the percentage of respondents that reported hearing or seeing windows, doors, other parts of the home, crockery and other objects in the home rattle, vibrate or shake.
Figure 9: Percentage of respondents hearing or seeing objects vibrate (N = 353)5
Windows (42.5%) were the most likely object that respondents reported hearing or seeing vibrate, followed by doors (41.1%), other parts of the home (36.3%), crockery (34.3%) and other objects (28.6%). Respondents specified the other objects and parts as cupboards, light fittings, lamps, mirrors, ornaments, pictures (on walls), radiators, televisions, and wardrobes. Other responses included ‘anything that’s loose, things on the floor’, ‘bedside cabinet mirror shakes with the trains’, lights moving, [I am] most aware when visitors are around, they notice it more’ and ‘wardrobe doors, toilet pipes come loose, think it may be the trains’. As was the case for the question (D2) exploring which structures vibration was felt through, some of the responses in this question (D6) overlapped and reflected responses given to feeling vibration through other surfaces e.g. ‘everything, the whole building, especially when the steam engines pass’ and ‘ bed will shake’.
Residents were also asked whether feeling vibration (D4) or hearing or seeing (D8) things rattle, vibrate, or shake bothered, annoyed, or disturbed them during the following activities:
• watching the television, • listening to the radio or music, • talking to someone in person or on the telephone, • reading or doing any other quiet activities,
5 Percentages do not total 100% due to more than one response being permitted for this question

NANR209 Technical report 5
22
• writing, drawing, painting or doing any other activity requiring a steady surface (D4 only),
• resting, • sleeping, • using any rooms in this home, • doing anything else.
684 respondents (73.5% of the sample) were routed to the question on whether they were annoyed by feeling vibration (D4) whilst carrying out a number of activities in their homes (see Figure 10 below).
Figure 10: Activities affected by feeling vibration (N = 684)6
Feeling vibration most annoyed people when resting (28.4%) or sleeping (32.8%). Following these, the activities of watching television (18.4%) and talking on the phone or in person (14.2%) were reported by respondents. The activities reported for ‘doing anything else’ included sitting in the garden, using an iPod, and having to retune radio channels. One respondent reported that vibration from the railway might be the cause of them waking up in the middle of the night but they were not sure.
A total of 353 respondents (37.9% of the sample) were routed to answer the same question about which, if any, activities vibration disturbed for hearing or seeing things rattle, vibrate or shake (D8) (see Figure 11 below).
6 Percentages do not total 100% due to more than one response being permitted for this question

NANR209 Technical report 5
23
Figure 11: Activities affected by hearing or seeing vibration (N = 396)7
Again, hearing or seeing vibration (things rattle, vibrate, or shake) most annoyed respondents when resting (24.6%) or sleeping (28.3%). Following these activities, respondents reported being bothered, annoyed, or disturbed while watching the television (17.8%) and talking on the phone or in person (13.9%). However, caution should be taken when interpreting theses results as the activities reported as being most affected are likely to be the activities that respondents carry out the most frequently.
Those respondents that reported feeling, hearing, or seeing vibration from any of the sources enquired about were asked to rate their annoyance on two scales – the five-point semantic (D9) and eleven-point numerical scale (D10). For a discussion of these scales see Technical Report 2 – Measurement of Response. In total, 666 respondents reported either feeling (D1), and/or hearing or seeing (D4) vibration from railway activity. As such, these respondents were asked to report their level of annoyance for railway vibration.
7 Percentages do not total 100% due to more than one response being permitted for this question

NANR209 Technical report 5
24
Figure 12: Annoyance ratings for railway vibration on the five-point semantic scale (N = 666)
The majority of respondents were not at all annoyed (62.3%), with fewer respondents being slightly (16.1%), moderately (11.4%), very (7.5%) and extremely (2.7%) annoyed by vibration from the railway. Those that gave a rating of not at all annoyed (62.5%) were not routed to the further source-specific section on railway vibration annoyance. Those giving ratings of slightly and above (37.7%) were routed to the source-specific railway vibration annoyance section. Subsequently, 278 people completed the more specific questions exploring railway vibration annoyance.
Respondents were also asked to give their annoyance ratings on the eleven-point numerical scale (D10). For railway, the annoyance ratings given are in Table 1 below.

NANR209 Technical report 5
25
Table 1: Annoyance ratings for railway vibration on the eleven-point numerical scale (N = 666)
Rating on eleven-point scale (0 – 10)
Percentage (%)
0 40.8
1 9.2
2 9.0
3 8.6
4 7.1
5 6.0
6 5.1
7 4.7
8 4.7
9 2.4
10 2.6
Total 100.2
The majority of respondents (40.8%) reported being not at all annoyed by railway vibration on the eleven-point scale, with fewer respondents giving any other rating. Drawing on the work of Schultz (1978), it is possible to use the eleven-point numerical scale to identify those who are ‘highly annoyed’ by vibration and noise. Schultz (1978) stated that the upper 27 – 29% of an annoyance scale can be used to identify those respondents that are highly annoyed by the environmental condition in question. This cannot be done with the five-point semantic scale as each modifier represents 20% of the scale: taking those that have given a very or extremely annoyed rating would equate to 40% of the scale. However, when applying Schultz’s recommendation to an eleven-point numerical scale, the highly annoyed category equates to those who rate their annoyance as 8, 9 or 10, the top 27.3% of the scale. If a highly annoyed category is created by taking the top three points on the scale, 9.7% of those who reported noticing railway vibration (feeling, hearing and/or seeing) in the residential environment can be considered as highly annoyed.

NANR209 Technical report 5
26
Figure 13: Numbers of people and vibration annoyance ratings for other vibration sources
Some respondents also reported feeling, hearing or seeing vibration from sources other than the railway. Figure 13 shows that these numbers are relatively few in comparision to railway, and only small numbers of people were either very, or extremely annoyed by vibration from sources other than railways.
In order to further understand the responses of those giving a rating of slightly or above for railway vibration annoyance, 278 respondents were asked to rate their annoyance for the following specific railway activities: passing passenger trains, passing freight trains, railway maintenance, and other railway activity. These annoyance ratings were collected on the five-point semantic (F1) and the eleven-point numerical scale (F2). Thirteen respondents (4.7%) did not notice vibration from passing passenger trains.

NANR209 Technical report 5
27
Figure 14: Annoyance ratings on the five-point semantic scale for passenger trains (N = 265)8
The largest proportion of respondents were slightly annoyed (34.2%), followed by not at all (23.7%), moderately (22.6%), very (10.1%) and extremely (4.0%) annoyed.
Respondents were also asked how bothered, annoyed or disturbed they were by passing passenger trains on the eleven-point numerical scale (see table 2 below).
8 4.7% of respondents did not notice vibration from passenger trains

NANR209 Technical report 5
28
Table 2: Respondents ratings for passenger trains on the eleven-point numerical scale (N = 265)
Rating on eleven-point scale (0 – 10)
Percentage (%)
Do not notice 4.7
0 18.7
1 7.6
2 11.2
3 14.4
4 9.7
5 9.4
6 9.4
7 6.1
8 4.7
9 1.4
10 2.8
Total 100.1
If a highly annoyed category is created by taking the top three points on the scale, 8.9% of those who noticed vibration from passenger trains can be considered as highly annoyed.
Eight respondents (2.9%) reported not feeling vibration from passing freight trains. The largest proportion of respondents rated freight trains as very annoying (30.9%), followed by moderately (27.3%), slightly (18.0%) extremely (15.5%) and not at all (5.4%) (see Figure 15 below).

NANR209 Technical report 5
29
Figure 15: Annoyance ratings on the five-point semantic scale for freight trains (N = 270)9
Vibration annoyance ratings for passing freight trains were also collected on the eleven-point semantic scale (see Table 3 below).
9 2.9% of respondents did not notice vibration from freight trains

NANR209 Technical report 5
30
Table 3: Respondents ratings for freight trains on the eleven-point numerical scale (N = 270)
Rating on eleven-point scale (0 – 10)
Percentage (%)
Do not notice 2.9
0 3.2
1 2.5
2 7.2
3 9.4
4 10.1
5 9.0
6 9.7
7 9.7
8 18.3
9 8.3
10 9.7
Total 100
The largest proportion of respondents gave a rating of 8 (18.3%) for vibration annoyance from freight traffic. If, as above, a highly annoyed category is created 36.3% of respondents were highly annoyed by passing freight trains, which is much higher than passenger trains (8.9%).
Annoyance ratings were also gathered for vibration caused by railway maintenance. Thirty-four respondents (12.2%) reported not noticing vibration from railway maintenance activity.

NANR209 Technical report 5
31
Figure 16: Annoyance ratings on the five-point semantic scale for railway maintenance (N = 244)10
The percentages of respondents annoyed was quite similar for not at all (20.1%), slightly (19.1%), moderately (20.1%) and very (18.0%). Fewer respondents (9.7%) rated vibration from railway maintenance work as extremely annoying.
Again, annoyance ratings were collected on the eleven point numerical scale (see Table 4 below).
10 12.2% of respondents did not notice vibration from railway maintenance work

NANR209 Technical report 5
32
Table 4: Respondents ratings for railway maintenance on the eleven-point numerical scale (N = 244)
Rating on eleven-point scale (0 – 10)
Percentage (%)
Do not notice 12.2
0 14.4
1 5.0
2 6.1
3 8.3
4 10.8
5 9.0
6 6.9
7 7.9
8 7.2
9 2.9
10 9.4
Total 100.1
The largest proportion of respondents gave a rating of 0 (not at all annoyed) (14.4%), followed by 4 (10.8%) and 10 (extremely annoyed) (9.4%). Those highly annoyed (8, 9, and 10) equated to 19.5% - more respondents were highly annoyed by vibration from train maintenance than for passenger trains, but less than for freight trains.
Four respondents also mentioned other aspects of the railway that caused vibration annoyance. For example, one respondent gave a slightly annoyed rating for high speed trains, where the ‘speed causes the vibration’, and another respondent gave an extremely annoyed rating for when a ‘train stops on the line for 15, 20 minutes at 3.30am’.
Respondents’ annoyance levels were also gathered for day (7am-7pm), evening (7pm-11pm) and night (11pm-7am). The Figure below shows annoyance ratings on the five-point semantic scale for railway vibration during the day, evening, and night.

NANR209 Technical report 5
33
Figure 17: Annoyance ratings for railway vibration on the five-point semantic scale for day, evening, and night (N = 278)
More respondents (12.6%) were extremely annoyed or very annoyed (25.9%) by railway vibration at night than during the evening (2.5% extremely, 15.8% very) and day (1.1% extremely, 9.0% very). Furthermore, fewer respondents were not at all annoyed by railway vibration at night (10.1%) than during the evening (23.0%) and day (45.3%). This suggests that vibration from railways during the night (11pm – 7am) is the most annoying and disturbing for respondents. Those that reported sleeping as an activity disturbed by vibration were more likely to give an extremely annoyed rating for railway vibration at night (18.8%) (see Table 5 below).

NANR209 Technical report 5
34
Table 5: Respondents annoyance ratings for railway vibration at night and sleep disturbance
Bothered, annoyed or disturbed during sleep
Annoyance rating (night)
Not at all Slightly Moderately Very Extremely
Yes
(N = 160) 5% 18.1% 23.1% 3.4% 18.8%
No
(N = 117) 19.7% 29.9% 31.6% 14.5% 4.3%
The qualitative data collected can provide some further context here, particularly with regards to the prevalence of freight trains and track maintenance work carried out during the night:
‘Freight trains slightly worse, when partner used to come and stay, there was one train about 9.10pm that shook the whole house every night.’
‘Don’t like the disturbances from the freight trains at night.’
‘Freight trains can be a problem but mostly maintenance trains, move slowly down the track and make the most noise.’
‘It’s the level of vibration we get from the maintenance of trains, it is at 2 or 3am when you’re asleep.’
Such comments also relate to the earlier reported findings that vibration from freight trains (highly annoyed - 36.3%) and from track maintenance (highly annoyed - 19.5%) were reported as more annoying than passenger trains (highly annoyed - 8.9%). Annoyance ratings for the three time periods were also collected on the eleven-point scale (see Table 6 below).

NANR209 Technical report 5
35
Table 6: Annoyance ratings for railway vibration on the eleven-point numerical scale for day, evening, and night (N = 278)
Annoyance rating (0 – 10)
Time of day
Day (7am – 7pm)
Evening (7pm – 11pm)
Night (11pm – 7am)
0 36.3 19.4 9
1 7.6 4.3 4.7
2 12.9 11.2 7.6
3 10.1 14 8.6
4 4 6.5 11.2
5 10.4 12.6 9.7
6 7.6 11.2 10.4
7 3.6 9.4 8.3
8 4.7 6.8 15.5
9 1.8 2.5 5.4
10 1.1 2.2 9.7
Total 100.1 100.1 100.1
The time period of night (11pm – 7am) had the highest number of respondents highly annoyed (30.6%), followed by evening (7pm to 11pm) (11.5%) and day (7am – 7pm) (7.6%).
3.3 NOISE RESPONSE
Noise was heard by more respondents (E1), and from more sources, than vibration was felt or heard/seen in the residential environment. The vast majority of respondents (79.9%) heard noise from one to four different sources. Eighty-one respondents reported hearing no noise from the sources enquired about in the social survey questionnaire.

NANR209 Technical report 5
36
Figure 18: Noise sources heard by respondents (N = 931)11
The majority of respondents (84.0%) could hear noise from the railway. After railway noise, noise from vehicles (44.6%), aeroplanes (41.2%), and helicopters (42.4%) were the most likely sources to be heard. Noise from neighbouring homes was also heard by 19.3% of the sample. In terms of other noises (4%) respondents were asked to specify other noises that they heard in their residential environment. The qualitative data from thirty-seven respondents was coded into the following categories: local businesses (13 respondents), neighbours (12 respondents), youths (8 respondents), out of house other (4 respondents).
Like vibration, the activities respondents’ reported as being most affected by the noise they heard were sleeping (31.8%), resting (25.2%), and watching the television (22.9%) (see Figure 19 below).
11 Percentages do not total 100% due to more than one response being permitted for this question

NANR209 Technical report 5
37
Figure 19: Percentage of respondents bothered, annoyed, or disturbed by activity (N = 850)12
For the noises reported, respondents were asked to rate their level of annoyance. For railway, 782 respondents rated the noise as not at all annoying (54.6%), slightly annoying (18.0%), moderately (14.6%), very (8.6%), and extremely annoyed (4.0%).
Figure 20: Annoyance ratings for railway noise on the five-point semantic scale (N = 782)13
12 Percentages do not total 100% due to more than one response being permitted for this question
13 Percentages do not total 100% due to more than one response being permitted for this question

NANR209 Technical report 5
38
On the eleven-point scale, respondents were most likely to rate their annoyance for railway noise as not at all annoying (38.3%) (see Table 7 below).
Table 7: Respondents ratings for railway noise on the eleven-point numerical scale (N = 782)
Rating on eleven-point scale (0 – 10)
Percentage (%)
0 38.3
1 12.0
2 8.7
3 6.0
4 5.5
5 8.2
6 4.9
7 5.1
8 5.9
9 2.3
10 2.1
Total 99.9
If a highly annoyed category is created, 10.3% of respondents who heard noise from the railway were highly annoyed.
Other noise sources were heard by fewer people in comparison to the railway. The majority of respondents who heard noise from vehicles, aeroplanes, helicopters and neighbouring homes were not at all or slightly annoyed (see Figure 21).

NANR209 Technical report 5
39
Figure 21: Numbers of people and annoyance ratings for other noise sources
Only twenty-eight respondents were extremely annoyed by noise from the most common sources other than the railway.
Those respondents who gave a rating of slightly annoyed or above were routed to answer more specific questions about noise and annoyance. In order to determine which specific noises from the railway were annoying, respondents were asked to rate their annoyance for noise from passing passenger trains, train horns, goods yards, track maintenance, stations, noise from people going to and from the station (in cars or walking), and other noise.

NANR209 Technical report 5
40
Figure 22: Annoyance ratings for railway noises on the five-point semantic scale (N = 355)
Noise from goods yards was considered as most annoying: extremely (13.2%), very (25.6%), moderately (27.0%), slightly (23.9%) and not at all (10.1%). Noise from track maintenance was the second most annoying noise: extremely (10.4%), very (16.6%), moderately (20.8%), slightly (20.6%) and not at all (31.5%). Only 3.9% of respondents (N = 355) reported being slightly annoyed or above for noise from stations, and 2% reported being slightly annoyed or above by noise from people going to or from the station (in cars or walking).
Using the eleven-point numerical scale to form a highly annoyed category (points 8,9 and 10 of the scale), 5.4% were highly annoyed by noise from passing trains, 10.1% by train horns, 27.0% by noise from goods yards, and 26.5% by noise from railway maintenance. It is possible that the goods yards also reflects freight traffic passing by due to the qualitative comments collected: ‘freight trains at night. They are the only noise problem on the railway line’, ‘it’s [noise] annoying but get used to it, apart from freight trains - always loud’. This should be taken into consideration when interpreting the annoyance reported by noise from goods yards.
3.4 VIBRATION AND NOISE
To explore the relationship between vibration and noise annoyance, correlations (Spearman’s rho) were carried out between respondents’ ratings on the eleven-point scales for vibration

NANR209 Technical report 5
41
and noise from the railway. Spearman’s rho, the non-parametric equivalent of Pearson’s r, was used due to the data being of an ordinal level; therefore the assumptions of a parametric test were not met.
A strong positive correlation between annoyance ratings on the eleven-point scale for railway vibration and noise was found (rho = 0.624, N = 666, 782, p < 0.05) and was significant. The relationship between vibration and noise annoyance ratings for railway was also significant during the day (rho = 0.835, N = 278, 355, p < 0.05), evening rho = 0.836, N = 278, 355 p < 0.05) and night (rho = 0.851, N = 278, 355, p < 0.05). For day, evening, and night, all relationships between vibration and noise annoyance on the eleven-point scale were strong positive correlations. Such findings indicate that there is a relationship between annoyance from vibration and noise caused by railway activity. For further analysis see Technical Report 6: Determination of exposure-response relationships.
3.5 OTHER DATA
Alongside the annoyance data collected, respondents also answered a number of questions on other factors that potentially shape the experience of railway vibration in the residential environment. Furthermore, a number of open questions collected data which can be drawn upon to explore the quantitative findings further.
Respondents were asked about how they came to live in the property they do (C1). A number of key reasons were given by those that owned their properties outright or with a mortgage as to why they bought properties next to railways. Many respondents talked about their properties being affordable: ‘it was cheap and had some interesting features’, ‘affordable, garden [is] big compared to everyone else’s’. This was often the case for those who described themselves as first time buyers, and those who described the properties as their first marital home.
Many respondents talked about the advantages of extra space and that their property was not overlooked by other properties due to the railway line ‘decided it was time to move out of parents home, wanted to be close to the railway as it’s not overlooked, [I] enjoy the trains passing by’, ‘good plot, enough space to build on’, ‘space, privacy, green, the whole feeling of the area’, ‘plenty of space, not overlooked, large garden’. Other respondents also mentioned that they liked living near the railway ‘[I] love being near the railway and like hearing the trains’. Other respondents mentioned wanting to be near the railway for transport ‘close to railway station’, ‘close to railway for long distance travel’. These responses indicate that railway is not necessarily viewed as an annoyance by everyone and living next to a railway line has many advantages. Such advantages could outweigh any negative or unwanted aspects of living near a railway i.e. vibration, noise, dust, and could explain why many respondents were not at all annoyed by vibration from the railway.

NANR209 Technical report 5
42
Respondents often talked about the railway not being a particularly significant feature of the residential environment. For example many people reported that they ‘get used to it’ and ‘don’t notice’ the railway over time, and still considered the area as a quiet and peaceful place to live ‘[it’s] a quiet area, away from the main road, it’s spacious for kids with the garden’.
Respondents were asked how acceptable they found the level of vibration experienced from the railway: the majority of respondents (44.8%) found it either acceptable or very acceptable and 29.4% of respondents found it unacceptable or very unacceptable. Such findings reflect the advantages of living next to a railway given by respondents above. When asked to expand on their responses, a diverse range of qualitative answers were provided. Those that rated the vibration as acceptable gave reasons such as:
‘[It] can’t be helped [I]chose to live here.’
‘Got used to it. [It’s] better than a few years ago when the mail train used to be running. The track has improved vibrations a lot.’
‘They let us know when they are doing maintenance work. Network Rail send us a letter. Don’t mind, that is the only vibration we get.’
‘[I] don’t mind the vibration but I like watching the trains passing by so I’m not bothered.’
‘[It] happens very irregular, got used to it. Freight trains only come once in a while.’
Those who reported the vibration from the railway as unacceptable or very unacceptable gave reasons such as:
‘I’ve got used to it in some ways but structural damage to home is worrying, cracks in patio and exterior, interior walls, underlying effects are worrying.’
‘We are close to the intercity line and freight line. Intercity is no problem but freight line can be very bad. Periodically trains are very heavily laden, vibrations and all round noise.’
‘The vibration is terrible, interferes with whatever you are doing.’
‘[It’s] unacceptable on many occasions. All aspects of railway cause bad vibrations.’
A number of responses referred to structural damage as a main concern for residents who reported vibration as unacceptable. In an earlier question respondents (N = 738) were asked how concerned they were about damage to their property. 65% were not at all concerned, 16.7% were slightly concerned, 9.8% were moderately concerned, 6.5% were very concerned, and 2.0% were extremely concerned. The majority of those either very concerned or extremely concerned owned their own home outright or with a mortgage (7.1%, N = 738).

NANR209 Technical report 5
43
All respondents who reported feeling and/or hearing or seeing the effects of vibration (738 respondents) were asked ‘how sensitive would you say you are to vibration?’ on a five-point semantic scale. Figure 23 below:
Figure 23: Respondents self-reported ratings of vibration sensitivity
Over half (55.6%) reported being not at all sensitive to vibration. 23.8% reported being slightly sensitive, 15.4% were moderately sensitive, and 4.6% were very sensitive to vibration. Only 0.5% reported being extremely sensitive to vibration in the residential environment.
3.6 CO-ORDINATION OF VIBRATION MEASUREMENTS AND SOCIAL SURVEY
Of those that completed a social survey questionnaire with an interviewer, 88.9% agreed to internal measurements being taken at their property. The social survey questionnaire was designed to collect the ‘response’ data suitable for establishing exposure-response relationships between annoyance and vibration. Technical Report 6 – Determination of exposure-response relationships explores the social survey data in relation to the vibration measurement data.

NANR209 Technical report 5
44
4 THE CONSTRUCTION DATA
Throughout the social survey questionnaire the construction activity was defined as ‘construction activity, including demolition, piling road works, drilling, surface activity such as bulldozers and loading trucks and any other construction activity’ to ensure all possible construction related activities were considered by respondents when providing their responses. The source-specific sections relevant to construction activity are Section H: Construction Vibration, and Section I: Construction Noise (see Appendix 2).
When the others sources of vibration (i.e. railways and internal sources) were being researched, a more concise definition for construction activity was used (for more information see Technical Report 2: Measurement of response, Section 2.7.5. Definitional issues and comparisons across the data).
4.1 SUCCESS RATE
This section explores the success rate for social survey interviews carried out with residents living near construction activity. Construction activity is more likely to be a temporary source of vibration, which subsequently impacted upon site identification (see Technical Report 1: Measurement of Exposure) and data collection. As such, the construction dataset consists of 350 interviews carried out.
Overall, interviewers attempted to interview at 1,114 properties where construction work was being carried out for a new light-rail system. The total number of interview attempts was 2,967. Of the 1,114 properties approached, 801 residents opened their door, of which 350 agreed to participate and completed a social survey questionnaire with the interviewer. Of the 350 respondents, 42% agreed to an interview on the first attempt, 25% agreed to an interview on the second attempt, and 33% agreed to an interview on the third attempt made to engage the resident. Carrying out questionnaires with residents near construction activity proved more difficult than those relating to railway and internal sources of vibration due to weather conditions during the fieldwork period, the time of year interviews were attempted, as well as difficulties in identifying sites where there was a sufficient number of properties near to construction activity. In total, 86.9% of those interviewed agreed to internal vibration measurements being taken at their properties.
For construction activity, it was not a requirement for residents to have been living in their homes for nine months or more as was the case for railways (see section 2.1 for more information). This was mainly due to difficulties identifying sites with a high number of residential properties situated near construction activities. This had implications for success rates and it was decided to remove this criterion for this source. Also, as construction activity is likely to be a temporary feature, the time frame of ‘thinking about the last 12

NANR209 Technical report 5
45
months or so’ did not relate well to this vibration source. As such respondents were asked to consider their responses within the time frame of ‘thinking about the time you have been living here’ in the general sections, and in the source-specific sections ‘thinking about the duration of the construction activity’ (see Appendix 2). Such differences in time frames between the different versions of the social survey questionnaire should be noted when comparisons between datasets are carried out.
4.2 SURVEY IMPLEMENTATION
On average, the resident questionnaire took between 25 and 26 minutes to complete. This time was dependant on how many sections of the questionnaire were required to be completed and also whether the questionnaire was conducted on the door step or inside the property.
For construction activity data collection, the social survey team was on site from approximately 10:00 to 20:00. The most effective times of day to be in the field were from 15:30 – 19:00 when residents started arriving home from work or arriving home from collecting children from school. The team made more contact with respondents during these times and made more appointments for later visits when respondents were unable to take part in the research immediately. It was also found that, when making appointments in the day time, the majority of the appointments were requested to be after 17:00.
Due to the temporary nature of construction activity, some interviews were carried out while construction activity was ongoing, and some interviews were carried out when construction activity had recently concluded.
5 VIBRATION FROM CONSTRUCTION ACTIVITY: SOCIAL SURVEY FINDINGS
5.1 SAMPLE CHARACTERISTICS
This section outlines the sample characteristics of the construction sample (N = 350). Slightly more than six out of ten of the respondents (61.9%) were women. The largest proportion of those interviewed were in the age range 25-39 (26.3%) while 28.5% were in age range 60 or older. This compares with 9.4% who were aged between 17 and 24. The age profile of the two genders were very similar. With regards to the ethnic origin of the sample, 78.7% defined themselves as being White British with the remaining respondents being from a BME background, most notably, Asian Pakistani (4.6%), another White background (3.7%) and Black Caribbean (3.7%).

NANR209 Technical report 5
46
There was a significant representation of two person and single person households (27.8% and 18.6% respectively) among those who participated in the interviews which contrasts with 3.5% who were from households with seven or more members. Generally, BME household sizes were slightly larger than those of the White British.
With regards to their current economic status, 38.8% were in employment and a further 7.0% were either self-employed or owned their own business. In contrast, slightly more than one quarter of the respondents were retired (26.1%), with 11.9% being unemployed and one out of ten 910.4%) describing themselves as a carer/homeworker. Around three out of ten undertook shift work (29.3%) and this group were exclusively from among those who were employed (accounting for 33.7% of this group).
The majority of respondents (57.4%) lived in a semi-detached property with a further 30.4% occupying a terraced house: a further 8.0% lived in an end terrace. In contrast, 2.7% lived in a detached home and smaller numbers referred to living in either an apartment/flat (1.2%) or maisonette (0.3%). In the vast majority of these latter cases, the apartment/flat was purpose built, and located on the ground floor of a two storey block.
Nearly two-thirds of respondents (65.5%) owned their home outright or had a mortgage on their property: the proportion who either rented from the Council or a Housing Association and rented privately was 15.2% in each case. A small number (2.6%) had a shared ownership property (part rent and part owned). Slightly more than six out of ten homeowners (63.0%) lived in a semi-detached home while 25.5% occupied a terraced property. Those in the social housing sector were similarly more likely to live in a semi-detached house (56.6%) than a terraced (34.0%) or another type of property. In contrast, the largest proportion of those renting from a private landlord occupied a terraced property (45.1%) as opposed to a semi-detached house (37.3%).
Slightly more than one third of the respondents (35.1%) had been living at the same property for 20 or more years which compares with a small group (2.9%) who had moved to their current home within the last 12 months and 12.6% who referred to a time period of 1 or more years but less than 3 years.
Alongside length of time living in the property, data was also collected on length of time living in the neighbourhood. The largest proportion of respondents had been living in their neighbourhood for 20 or more years (44.0%) and 12.4% referred to 10 or more years but less than 15. This compares with 3.2% who had moved to the neighbourhood in the previous 12 month period. While the White British respondents were more likely to be long-standing residents of the neighbourhood (47.1% had been living their neighbourhood for period of 20 or more years compared with 32.4% among the BME group), similar proportion of both ethnic groups had moved into the neighbourhood within the last 3 years.
The main reasons for moving to the neighbourhood (B1) included a general liking for the neighbourhood (44.0%) and wanting to near family and friends (19.8%). Being born in the

NANR209 Technical report 5
47
area was mentioned by 19.0% and this was followed by 8.6% who reported not having a choice where they lived. This latter group, as noted above, were generally from the social housing sector. Other factors which attracted them to the neighbourhood, but which were less influential included wanting to be nearer their work (5.2%) and nearer their own community (1.7%).
Respondents were asked to rate a number of aspects about their neighbourhood on a five point scale from very good to very poor (B6). They were particularly positive about the closeness to shops (88.5%), public transport (85.4%), the standard of the schools (83.9%) and closeness to a place of worship (81.0%). Slightly smaller numbers were complimentary about childcare facilities (77.1%), how quiet it is (71.9%) and how peaceful it is (71.1%). In contrast, 50.8% were positive about parking facilities and just 36.5% reported similar views about the upkeep of the roads.
5.2 VIBRATION RESPONSE
All respondents were asked firstly, whether they feel vibration (D1), and secondly, whether they hear or see (D5) things rattle, vibrate, or shake in their homes. Respondents were asked to provide their answers in relation to ‘the time you have been living here’, rather than in relation to ‘in the last 12 months or so’. This wording was used for the construction activity sample only due to the temporary nature of construction in a residential context. The majority of respondents (67.1%)14
14 This percentage is for those living in close proximity to construction activity and is not reflective of the general population
reported feeling vibration from construction activity, indicating that site identification was successful, particularly as other sources of vibration were felt by much fewer respondents (see Figure 24 below).

NANR209 Technical report 5
48
Figure 24: Percentages of respondents feeling vibration from all vibration sources (N = 350)15
After construction activity, slightly over a third (34.3%) of respondents felt vibration from vehicles (cars, lorries, buses, and other road vehicles) and one in ten reported feeling vibration from railway (10.9%). Sources other than those on the Figure above were felt by very few people: underground was felt by six respondents, trains in tunnels by four respondents, quarrying by two respondents, and one respondent felt vibration from a source they could not identify. Sixty-three respondents (19.1%) reported feeling no vibration from any of the sources in their homes.
Fewer respondents (45.4%) reported hearing or seeing things rattle, vibrate or shake in their homes due to the construction activity in comparison to those that felt vibration from the construction activity (67.1%). However, hearing or seeing vibration from the construction activity was reported by significantly more respondents than any other source. Vibration from vehicles was reported by 15.7% of the sample, followed by railway (6.3%) (see Figure 25 below).
15 Percentages do not total 100% due to more than one response being permitted for this question

NANR209 Technical report 5
49
Figure 25: percentage of people hearing or seeing vibration from all vibration sources (N = 350)16
Very few respondents felt vibration from, helicopters (1.1%), underground (0.9%), aeroplanes (0.3%), trains in tunnels (0.3%) and quarrying (0.3%). Just under half (49.7%) reported not hearing or seeing things rattle, vibrate or shake from any of the sources in their homes. As the percentage of respondents who feel vibration (67.1%) and hear and see vibration (45.4%) differ, it could be suggested that residents can differentiate between the primary and secondary effects of vibration in the residential environment.
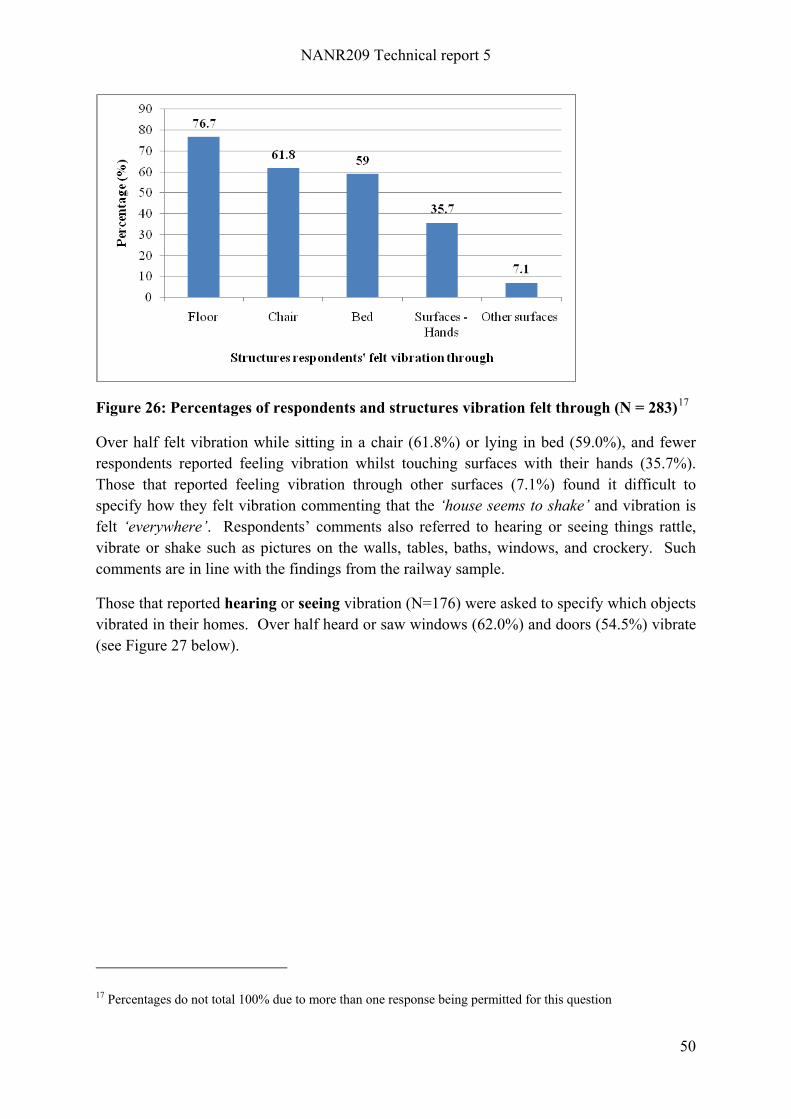
Those who reported feeling vibration (283 respondents) from one or more of the sources were asked how they felt the vibration: through the floor, chair or bed, or while touching surfaces with their hands, of any other surfaces. The majority of respondents reported feeling vibration through the floor (76.7%) (see Figure 26 below).
16 Percentages do not total 100% due to more than one response being permitted for this question
NANR209 Technical report 5
50
Figure 26: Percentages of respondents and structures vibration felt through (N = 283)17
Over half felt vibration while sitting in a chair (61.8%) or lying in bed (59.0%), and fewer respondents reported feeling vibration whilst touching surfaces with their hands (35.7%). Those that reported feeling vibration through other surfaces (7.1%) found it difficult to specify how they felt vibration commenting that the ‘house seems to shake’ and vibration is felt ‘everywhere’. Respondents’ comments also referred to hearing or seeing things rattle, vibrate or shake such as pictures on the walls, tables, baths, windows, and crockery. Such comments are in line with the findings from the railway sample.
Those that reported hearing or seeing vibration (N=176) were asked to specify which objects vibrated in their homes. Over half heard or saw windows (62.0%) and doors (54.5%) vibrate (see Figure 27 below).
17 Percentages do not total 100% due to more than one response being permitted for this question

NANR209 Technical report 5
51
Figure 27: Percentages of respondents hearing or seeing objects vibrate (N = 176)18
Some respondents also reported hearing or seeing crockery (31.3%), other parts of the home (30.1%) and other objects (26.7%) rattle, vibrate or shake. Other objects included beds, cabinets and pictures on the walls. One respondent reported that their ‘wall is starting to crack’. Some of the comments overlapped with responses about how vibration is felt (D2), ‘whole room is part of an extension so moves a lot’, and ‘the floors, especially at the back [of the property]’. This suggests that although there were differences between those who reported feeling vibration (67.1%) and those who reported hearing or seeing vibration (45.4%), descriptions of the sensory experience of vibration overlapped.
Respondents were also asked whether they were bothered, annoyed, or disturbed by the vibration they could feel (D4), and hear or see (D8) while in their homes when carrying out the following activities: watching the television; listening to the radio or music; talking to someone in person or on the telephone; reading or doing other activities; writing, drawing, painting, or doing any other activity requiring a steady surface; resting; sleeping; using any rooms in this home; and doing anything else. Those that felt vibration from any of the sources reported resting (40.2%), sleeping (38.8%) and watching the television (35.3%) as the activities most affected by vibration (see Figure 28 below).
18 Percentages do not total 100% due to more than one response being permitted for this question

NANR209 Technical report 5
52
Figure 28: Activities affected by feeling vibration (N = 283)19
Although it is important to note that these sources may have been reported as being the most affected because they are the most frequented activities that respondents carried out. Those that reported ‘doing anything else’ (4.2%) referred to when working from home and using a computer. A number of respondents reported feeling vibration affected the use of their gardens and leaving their back doors open.
Respondents were also asked what activities were affected by hearing or seeing things rattle, vibrate, or shake (N=176). Again, respondents reported resting (38.1%), watching the television (34.7%) and sleeping (30.1%) as the activities most affected (see Figure 29 below).
19 Percentages do not total 100% due to more than one response being permitted for this question

NANR209 Technical report 5
53
Figure 29: Activities affected by hearing or seeing vibration (N = 176)20
Those that reported hearing or seeing vibration affected ‘doing anything else’ (5.7%) referred to using their computers or generally trying to relax in their homes.
Respondents were also asked to rate how bothered, annoyed or disturbed they were on five-point semantic and eleven-point numerical scales for all of the sources of vibration they reported feeling, hearing or seeing in their homes. The most prevalent sources of vibration noticed by respondents – construction, vehicles, and railways, are the most important findings here. Of those that reported vibration from construction (N = 235), 30.2% were not at all annoyed and 26.8% were extremely annoyed (see Figure 30 below).
20 Percentages do not total 100% due to more than one response being permitted for this question

NANR209 Technical report 5
54
Figure 30: Annoyance ratings for construction vibration on the five-point semantic scale (N=235)
Fewer respondents reported being slightly (13.6%), moderately (16.2%) and very (13.2%) annoyed by the construction vibration. Compared to the findings of the railway sample, more respondents in the construction sample reported being extremely annoyed by the main source under investigation.
For other sources, vibration from vehicles (N=121) was rated as not at all annoying by 27.2% of respondents, slightly by 19.8%, moderately by 19.0%, very by 12.0%, and extremely by 21.5% of respondents. For railway (N=41), the majority of respondents were either not at all annoyed (34.1%) or slightly annoyed (31.7%). Fewer were moderately (12.2%), very (7.3%), or extremely annoyed (14.6%) by vibration from nearby railways.
Annoyance responses were also collected on the eleven-point numerical scale. Again, the three most prevelant sources in this sample were construction, vehicles and railway. Table 8 shows repondents annoyance ratings for construction (N=235).

NANR209 Technical report 5
55
Table 8: Respondents ratings for construction vibration on the eleven-point numerical scale (N = 235)
Rating on eleven-point scale (0 – 10)
Percentage (%)
0 20.9
1 2.6
2 9.4
3 6.8
4 3.4
5 6.8
6 7.7
7 4.7
8 8.1
9 6.8
10 23.0
Total 100
If a highly annoyed category is created using the top three points on the scale, 37.9% of respondents noticing vibration from nearby construction activity were highly annoyed.
Those that reported being slightly or more annoyed by vibration from construction activity (N=164) were asked further questions about their annoyance. Respondents were asked to rate their annoyance, again on the five-point semantic and eleven-point numerical scales, for the following construction-related activities: demolition, piling, road works, drilling, surface activity such as bulldozers and loading trucks, and other construction activities.
Over half (51.8%) of the respondents (N=164) felt vibration from demolition. Of those, respondents were more likely to rate the demolition as extremely annoying (19.5%), followed by very (13.4%) moderately (7.3%), not at all (7.3%) and slightly (4.3%) (see Figure 31 below).

NANR209 Technical report 5
56
Figure 31: Annoyance ratings on the five-point semantic scale for demolition (N=164)
For piling, the majority (84.1%) noticed vibration, of which 35.4% were extremely annoyed, 23.2% were very annoyed, 14.0% were moderately annoyed, 6.7% were slightly annoyed, and 4.9% were not at all annoyed (see Figure 32 below).
Figure 32: Annoyance ratings on the five-point semantic scale for piling (N=164)
Over half (64.0%) reported noticing vibration from roadworks, of which 29.3% were extremely annoyed, 12.2% were very annoyed, 11.0% were moderately annoyed, 7.9% were slightly annoyed and 3.7% were not at all annoyed (see Figure 33 below).

NANR209 Technical report 5
57
Figure 33: Annoyance ratings on the five-point semantic scale for roadworks (N = 164)
The majority of the respondents (88.4%) reported noticing vibration from drilling. Over a third of respondents rated drilling as extremely annoying (36.6%), followed by very (21.3%), moderately (17.7%), slightly (7.9%) and not at all annoying (4.9%) (see Figure 34 below
Figure 34: Annoyance ratings on the five-point semantic scale for drilling (N = 164)
The majority of respondents noticed vibration from surface activity (87.2%), of which 32.9% were extremely annoyed, 21.3% were very, 18.9% were moderately, 9.8% were slightly, and 4.3% were not at all annoyed (see Figure 35 below).

NANR209 Technical report 5
58
Figure 35: Annoyance ratings on the five-point semantic scale for surface activity (N=164)
Twelve respondents reported other construction activities such as jack hammer, laying gravel/concrete, laying tracks, power generators, and passing construction traffic. Two respondents were extremely annoyed, three were very, two were moderately, one was slightly, and four were not at all annoyed by the other activities reported.
Respondents were also asked to give their annoyance ratings to the specific construction activities on the eleven point scale (see Table 9 below).

NANR209 Technical report 5
59
Table 9: Respondents ratings for vibration annoyance on the eleven-point numerical scale (N = 164)
Annoyance rating on eleven-point
scale (0 – 10)
Percentages of respondents (%)
Demolition Piling Road Works
Drilling Surface Activity
Other
Don’t notice 48.2 15.9 36.0 11.6 12.8 92.7
0 7.9 4.9 1.2 5.5 1.2 1.8
1 1.2 1.2 2.4 1.8 3.0 -
2 1.2 2.4 3.0 4.3 6.1 -
3 1.2 4.3 4.3 3.7 5.5 0.6
4 1.2 3.0 1.2 4.3 3.7 -
5 4.3 5.5 5.5 6.7 6.7 1.2
6 2.4 4.9 3.0 5.5 7.9 0.6
7 4.3 6.1 4.3 5.5 6.7 0.6
8 8.5 11.6 7.3 14.0 10.3 1.2
9 1.2 8.5 3.7 4.9 4.9 1.2
10 18.2 31.7 28.0 32.3 31.1 -
Total 99.8 100 99.9 100.1 99.9 99.9
If highly annoyed categories are created by taking the top three points of the scale (8,9,10), 51.8% were highly annoyed by piling, 51.2% were highly annoyed by drilling, 46.3% were highly annoyed by surface activity, 27.9% were highly annoyed by demolition, and 2.4% were highly annoyed by other activities. In comparison to the railway sample, respondents were more likely to be highly annoyed by construction vibration.
Respondents were also asked how annoyed they were by vibration from the construction activity during the day (7am – 7pm), evening (7pm – 11pm) and night (11pm – 7am) (see Figure 36 below).

NANR209 Technical report 5
60
Figure 36: Annoyance ratings for construction vibration on the five point semantic scale for day, evening and night (N = 164)
Respondents were more annoyed by construction vibration during the day, rather than in the evening and at night. However, this is due to construction work not being carried out during night hours (11pm – 7pm). Construction as a daytime activity might explain why resting was reported as being slightly more affected than sleeping.
5.3 NOISE RESPONSE
Respondents were also asked about the noise they hear in their homes. The majority (77.7%) reported hearing noise from the construction activity. More respondents heard noise from the construction activity than those that reported feeling vibration (67.1%) and hearing or seeing things vibrate, rattle or shake (45.4%). Fewer numbers of people reported hearing noise from other sources (see Figure 37 below). Again, this is indicative of a successful site identification procedure (see Technical Report 1: Measurement of exposure).

NANR209 Technical report 5
61
Figure 37: Noise sources heard by respondents (N = 350)21
After construction activity (77.7%), over half (54.9%) heard noise from vehicles, 42.6% heard noise from helicopters, and 21.8% heard noise from aeroplanes. Fewer respondents reported hearing noise from neighbouring homes (19.4%), railway activity (11.4%), noise from within their own homes (11.4%) and other noises (9.4%). Other noises included noise described as ‘anti-social behaviour, drinking’ and ‘drinking in the bars until 2am and then walking past house’. Others mentioned ‘youths on bikes’, ‘festivals, fireworks and parties’, and ‘neighbours speakers in the garden’. Noise from the construction workers was also mentioned. Some noise from industrial and commercial activity was also included such as the local supermarkets generator/extractor unit and noise from the waste processing plant. Very few respondents heard noise from underground (four respondents) and unidentified sources (two respondents).
Respondents were asked whether the noise affected a number of daily activities. Over a third (35.7%) of respondents reported that sleeping was affected by noise heard within their homes. Nearly a third (30.9%) reported resting to be affected by noise heard in their homes, and 30.2% reported watching the television was affected by the noise they experienced in their homes.
Respondents were also asked to rate their annoyance on the five-point and eleven-point scales for all the noise sources they reported hearing in their homes. A quarter (25.4%) of those who reported hearing noise from construction were extremely annoyed (see Figure 38 below).
21 Percentages do not total 100% due to more than one response being permitted for this question

NANR209 Technical report 5
62
Figure 38: Annoyance ratings on the five-point semantic scale for construction noise (N = 272)
Respondents were more likely to be not at all annoyed (29.0%) or extremely annoyed (25.4%) by construction noise. Fewer respondents reported being slightly (12.1%), moderately (17.6%) and very (15.8%) annoyed. For vehicles (N=192), 36.0% were not at all annoyed, with 21.4% slightly, 19.8% moderately, 8.3% very, 14.6% extremely annoyed by noise from vehicles. For helicopters (N=149), 53.0% were not at all annoyed, 18.8% slightly, 20.1% moderately, 6.0% very, and 2.0% were extremely annoyed.
Respondents also gave noise annoyance ratings on the eleven-point scale. Table 10 below depicts the percentages of respondents annoyed by noise from construction activity on the eleven-point scale.

NANR209 Technical report 5
63
Table 10: Respondents ratings for construction noise on the eleven-point numerical scale (N = 272)
Rating on eleven-point scale (0 – 10)
Percentage (%)
0 18.8
1 5.9
2 9.6
3 7.4
4 5.1
5 8.8
6 4.8
7 3.7
8 7.4
9 5.9
10 22.8
Total 100.2
In terms of those highly annoyed (8, 9, and 10 ratings on the scale), 36.1% were highly annoyed by construction noise. Of those respondents were more likely to give the highest possible rating of 10. In comparison to the railway sample, more people were highly annoyed by construction noise.
For construction noise, 193 respondents reported being slightly or more annoyed by construction noise and were asked more specific questions about their annoyance (Section I of the social survey questionnaire). Not all of the respondents could hear noise from all of the construction activities: demolition (43.5%), piling (17.1%), roadworks (32.1%), drilling (15.5%), and surface activity (12.4%). Fifteen respondents noted noise from other sources such as compacting gravel, construction traffic, jack hammers, laying the tracks, and shouting voices.

NANR209 Technical report 5
64
Figure 39: Annoyance ratings on the five point semantic scale for construction noises (N=193)
Overall, more respondents found all of the construction noises more annoying than not at all annoying. Annoyance responses were also collected on the eleven-point scale (see Table 11 below).

NANR209 Technical report 5
65
Table 11: Respondents ratings for construction noise on the eleven-point numerical scale (N=193)
Annoyance rating on eleven-point
scale (0 – 10)
Percentages of respondents (%)
Demolition Piling Road Works
Drilling Surface Activity
Other
Don’t notice 43.5 17.1 32.1 15.5 12.4 92.2
0 8.8 5.7 4.1 2.1 4.7 3.6
1 - 1.5 2.6 0.5 2.1 -
2 1.6 4.7 5.2 6.2 8.3 -
3 3.6 4.1 1.0 3.6 2.6 0.5
4 3.1 3.6 3.1 5.2 4.1 -
5 4.7 9.3 8.3 11.4 10.4 1.0
6 3.1 3.6 3.6 6.2 5.7 1.0
7 4.1 6.2 4.7 5.7 6.7 0.5
8 7.3 11.4 7.3 11.4 11.9 -
9 1.0 4.7 2.6 1.6 3.1 0.5
10 19.2 28.0 25.4 30.6 27.8 0.5
Total 100 99.9 100 100 99.8 99.8
More respondents reported hearing construction noise from drilling, piling and surface activities. Noise from piling caused the largest number of people to be highly annoyed (44.1%). For drilling, 43.6% of respondents were highly annoyed. Overall, for all of the noise sources, respondents were more likely to give the highest annoyance rating of 10 on the eleven-point scale.
5.4 VIBRATION AND NOISE
To explore the relationship between vibration and noise annoyance, correlations (Spearman’s rho) were carried out between respondents’ ratings on the eleven-point scales for vibration

NANR209 Technical report 5
66
and noise from the construction activity. Spearman’s rho, the non-parametric equivalent of Pearson’s r, was used due to the data being of an ordinal level; therefore the assumptions of a parametric test were not met.
A strong positive correlation between annoyance ratings on the eleven-point scale for construction vibration and noise was found (rho = 0.653, N =235, 272, p < 0.05) and was significant. Similarly, strong positive correlations were found between vibration and noise annoyance ratings for the specific construction activities: demolition (rho = 0.636, N = 85, 108, p < 0.05), piling (rho = 0.566, N = 138, 160, p < 0.05), roadworks (rho = 0.754, N = 105, 131, p < 0.05), drilling (rho = 0.684, N = 145, 163, p < 0.05) and surface activity (rho = 0.688, N =143, 169, p < 0.05). All of these correlations were significant. Such findings indicate that there is a relationship between annoyance from vibration and noise caused by railway activity, and support the decision to also research noise annoyance in a study of vibration annoyance within the residential setting. For further analysis see Technical Report 6: Determination of exposure-response relationships.
5.5 OTHER DATA
Beyond annoyance, other factors were also explored by the social survey questionnaire. Open questions also collected data from the respondents about the construction activity, and the vibration and noise they experience in their homes.
As the construction activity was a temporary feature of the respondents’ residential environments, data was collected on what they anticipated the vibration would be like in the future. Many respondents felt that the vibration they experienced would get better when the construction work finished ‘after the construction ends it should get better, can’t imagine that the trams will cause too much [vibration]’, and ‘because the construction will stop soon so the large vehicles carrying things to it will stop’. However others were concerned about the future vibration they would experience due to the new tram lines: ‘trams coming through will make it worse’, ‘when the tramline is running we will frequently be subjected to noise and vibrations’, and ‘[I’m] worried that when the trams start it might get worse because the depot is quite close to the house’. Others were unsure about how the tramline would affect them ‘don’t know what it will be like when the trams start’, and ‘[I’m] not sure, it will depend on how noisy the tramline is’. It is important to note that although respondents were asked to rate their annoyance in relation to the construction activity, such ratings may also be influenced by their expectations and evaluations of what the construction activity is for – in this case, the development of a new light-rail system.
Many respondents talked about other issues, beyond vibration and noise, with the construction activity, particularly the structural damage it may cause:
‘Now I can feel a draft in the bedroom windows so think the vibrations might be affecting the structure of the house’

NANR209 Technical report 5
67
‘Don’t know if the depot is going to increase or decrease the value of the house, vibrations have already damaged the house, cracks around the windows and downstairs in the ceilings, I’ve made complaints about this’
Others also mentioned being compensated for the new tram line being implemented in their neighbourhood:
‘I want to know if there is any compensation packages in place for residents in qthe area, the tram line is now causing an invasion of privacy as we are now overlooked, can’t sit in the garden anymore, [I’m] also a shift worker so no chance of getting any rest’.
‘I would now like help with the house and the damage that the construction is causing, structure and value of the house, would like some compensation’
Although some respondents were happy about a new tram line and accepted that the work was necessary e.g. ‘once construction is done it will be better, happy with the trams as I can go into the city centre’, ‘although its [the construction] is a pain, I’m happy to tolerate it because we are getting a tram line, short term annoyance with long term benefits’. Others talked about vibration and noise as part of living in an urban place ‘I don’t find it at all disturbing, accept it as part of living in a city, I’ve bought a dog so now he’s making most of the noise’.
Such contextual issues such as what is the construction activity for, how do residents feel about the new development, and how does the new development impact upon the neighbourhood and property values for example, are central to understanding the wider response to vibration in the residential environment. Such evaluations can go some way to explaining the higher annoyance ratings for the construction activity in comparison to the railway sample. The construction activity is changing the residential environment in this case whereas the railway as a source of vibration is often a long standing and stable residential feature in comparison.
Respondents were asked how acceptable they found the vibration (from all sources) in their homes (see Figure 41 below).

NANR209 Technical report 5
68
Figure 40: Respondents self reported ratings of acceptability of vibration (N=275)
Just over a third (36.1%) reported the vibration they experienced as acceptable. Respondents were more likely to give a rating of acceptable than very acceptable, and similarly were more likely to give a rating of unacceptable rather than very unacceptable. In the source-specific section, where only the respondents annoyed by construction vibration were required to provide their answers, a similar percentage of respondents (14.5%) however found the vibration from construction activitity acceptable (4.3%) in comparison (11.6%).
Respondents who reported feeling, hearing or seeing vibration from any of the sources were asked to rate how sensitive to vibration they were on a five-point scale (not at all – extremely).

NANR209 Technical report 5
69
Figure 41: Respondents self-reported ratings of vibration sensitivity (N = 275)
Interestingly, for the construction sample more people reported being very or extremely sensitive (13.1%) to vibration than those in the railway sample (5.1%). Such findings may reflect the differences between the two sources for example, the railway (and its effects – vibration and noise) is a permanent feature of the residential environment whereas the construction activity is temporary. However, such findings should be interpreted with caution, and further research is needed to explore sensitivity to vibration further.
5.6 CO-ORDINATION OF VIBRATION MEASUREMENTS AND SOCIAL SURVEY
Of those interviewed, 86.9% of those interviewed agreed to internal vibration measurements being taken at their properties. However, due to the temporary nature of construction activity, internal measurements of vibration were not taken inside residents properties as they were for the railway sample. For further information, see Technical Report 1: Measurement of exposure, and Technical Report 3: Calculation of vibration exposure. For analysis of the social survey and vibration measurement data for construction vibration see Technical Report 6: Determination of exposure-response relationships.
6 THE INTERNAL SOURCES DATA
Responses to internal sources of vibration in the residential environment were explored by the following definition included in the social survey questionnaire - ‘sources of vibration outside your home but from within the same building, from human activity such as footsteps, door slams or machinery such as air conditioning, washing machines, plumbing or any other activity’. For ease, ‘internal sources’ is used throughout this section. The source-specific sections relevant to internal sources are Section J: Internal Sources Vibration, and Section K: Internal Sources Noise (see Appendix 3).
When the others sources of vibration (i.e. railways and construction activity) were being researched, a more concise definition for internal sources was used (for more information see Technical Report 2: Measurement of response, Section 2.7.5. Definitional issues and comparisons across the data).
6.1 SUCCESS RATE

NANR209 Technical report 5
70
This section explores the success rate for social survey questionnaires carried out with residents living in apartment blocks where internal sources of vibration are more likely to be present than in other types of accommodation. Unlike the external sources of railway and construction activity, which are highly visible and more easily identifiable in site selection, the presence of internal vibration within buildings and properties, where residents may be exposed to internal sources of vibration, proved difficult and uncommon. As such, the internal sources dataset has the smallest sample within this research project (150 interviews).
In total interviewers attempted to interview at 524 properties. Interviewers only knocked on the door of a property a maximum of three times to try and achieve an interview. The total number of interview attempts was 659. Of the 524 properties approached, 299 residents opened their door, of which 150 agreed to participate and completed a social survey questionnaire with the interviewer. Of the 150 respondents, 87% agreed to an interview on the first attempt, 11% agreed to an interview on the second attempt, and 2% agreed to an interview on the third attempt made to engage the resident in the research. In total, 56.3% of those interviewed agreed to internal vibration measurements being taken at their properties. This lower internal agreement rate was due to the internal sources sample characteristics, particularly age (see Section 7.1) and difficulties with arranging access to the buildings for internal measurements to be taken.
Initially, residents that had lived in their homes for nine months or more were recruited for this sample, to ensure respondents could provide their responses with regards to the time frame ‘in the last 12 months or so’, in line with the recruitment method used for railways (see section 2.1 for more information). However, due to difficulties with gaining access to apartment blocks, university accommodation was included as a site to investigate response to vibration from internal sources. As such, a high number of respondents had been living in their current homes for less than nine months. In order to increase participation, the criterion for participant recruitment of living in the property of nine months or more was removed, and the approach taken for the construction activity sample was adopted (see section 4.1). Although not ideal, this approach ensured a better success rate for this source of vibration. Such differences between samples should be noted where comparisons between the datasets are made. For more discussion of site identification procedures for internal sources see: Technical Report 1: Measurement of Exposure and Technical Report 2: Measurement of Response.
6.2 SURVEY IMPLEMENTATION
On average the face-to-face interviews took 18-19 minutes to complete. This time was dependant on how many sections of the social survey questionnaire were required to be completed and also whether the social survey questionnaire was conducted on the door step, inside the property, or within a social space such as a communal kitchen or lounge area

NANR209 Technical report 5
71
within the building. Social survey questionnaires that were completed inside the home or in a communal area tended to take longer to administer than door step interviews.
For internal sources data collection, the social survey team was on site from approximately 09:30 to 20:00. In order to increase participation, interviewers liaised with sheltered housing scheme wardens to attend coffee mornings and other social events to introduce themselves to residents and arrange times for interviews. In the case of interviewing in University student halls, interviewers liaised with site wardens and attempted to interview at various times of the day and evening to increase participation.
7 VIBRATION FROM INTERNAL SOURCES: SOCIAL SURVEY FINDINGS
7.1 SAMPLE CHARACTERISTICS
There were slightly more women (51.7%) than men in the sample. Reflecting the type of properties identified for inclusion within the sample, namely University student halls of residence and older people sheltered housing schemes, the age profile of the respondents was such that around two-thirds (66.0%) were in the youngest age range (17-24 years of age) while 31.3% were aged 60 or over including 7.3% aged 85 or older. The overwhelming majority of respondents (96.0%) were from single person households with the remaining 4.0% from two person households.
Slightly less than three-quarters of the residents (73.8%) described themselves as White British according to the Census of Population 2001 ethnicity categories with the remainder being from a BME background, including 14.8% from another White background, 4.0% Chinese and 2.7% White Irish.
Reflecting the demographic characteristics noted above, in terms of economic status, 65.3% of those interviewed were students and 32.7% reported being retired from work. The group also included one individual who was in employed, and a second who was unemployed.
The vast majority lived in an apartment or flat (73.4%), one out of ten (10.3%) mentioned living in a bedsit and 9.1% referred to a maisonette. This compares with a small number who occupied a detached or semi-detached property (1.4% in each case). All those who lived in a flat/apartment or bedsit suggested that it was a purpose built building rather than a conversion, that their property was located on the ground floor (54.3%) as opposed to the first or second floor (39.7% and 15.0% respectively) of what were generally two storey properties.

NANR209 Technical report 5
72
The proportion who rented from a private landlord was nearly twice that who rented their home from either the Council or a Housing Association (66.0% as compared with 34.0%). While the vast majority of those renting privately (78.3%) lived in an apartment or flat, 12.0% lived in a maisonette and 9.8% occupied a bedsit, the majority of those renting from the Council or a housing Association also lived in an apartment or flat (64.7%), followed by 11.8% who live in a bedsit and 3.9% who cited a maisonette.
In terms of how long respondents had been living at their current address, the vast majority referred to a period of less than 12 months (68.0%) with 10.7% mentioning 5 or more years but less than 10 and 6.0% cited a time frame of more than 20 years. Data was also collected on the length of time respondents had lived in the neighbourhood. Reflecting the inclusion of University students within the sample, around two-thirds of the respondents had only been living in the neighbourhood for less than 12 months. In contrast, 14.8% referred to a time period of 20 years of more: these were most likely to be sheltered housing residents.
Not surprisingly, being nearer to work was seen as an important factor in attracting respondents to the neighbourhood (30.9%) again reflecting the student body within the sample. Much smaller numbers made reference to liking the area (7.4%), wanting to be near family and friends (6.0%) and having been born in the area (6.0%). Less influential was wanting to be nearer their own community (0.7%) and 2.7% said that they did not have a choice where they lived (B1).
Among the fourteen neighbourhood aspects presented to the respondents who were asked to rate each of them on a five point scale from very good to very poor (B6), the most positive views were elicited in relation to the closeness to a place of worship (92.0%) and the standard of healthcare services (90.2%) and leisure facilities (86.1%). This was followed by public transport (79.2%), the standard of the schools (70.0%), the standard of the parks and other open spaces (68.8%), how peaceful it is (68.5%), the appearance of the buildings (65.8%), how quiet it is (64.6%) and closeness to the shops (59.4%). Respondents tended to be least complementary about the upkeep of the roads (50.5%).
7.2 VIBRATION RESPONSE
Of the 150 respondents interviewed, 18.7% reported being able to feel vibration (D1) from internal sources of vibration from outside of the home but from within the same building. More respondents (21.3%) reported feeling vibration from footsteps within their own home. This suggests that site identification for internal sources was not as successful in comparison to the other samples. In the construction and railway samples, the target source of investigation exposed more residents to vibration than all other potential sources.
Very few respondents reported feeling vibration from the other sources of vibration enquired about, although 8.7% felt vibration from the railway and 4.7% felt vibration from other sources. The ‘other’ sources were reported as boilers switching on, tremors from

NANR209 Technical report 5
73
earthquakes, and music from neighbouring homes. Vehicles (cars, lorries, buses, and other road vehicles), and construction activity were each felt by four respondents. Vibration from aeroplanes, helicopters, and unidentified sources were each felt by one respondent.
Figure 42: Percentage of respondents by structures vibration felt through (N = 56)22
Those who felt vibration were asked which about the structures they felt it through – the floor, chair, bed and surfaces (see Figure 42 above). More respondents felt vibration through the floor (18.0%), then a bed (14.7%), when touching surfaces with their hands (12.7%) and a chair (11.3%). Other surfaces included feeling vibration at a desk while working/studying, through the ceiling, and generally throughout the house.
In terms of hearing or seeing the effects of vibration, 8.7% of respondents reported hearing or seeing the effects of vibration from internal sources. More respondents (18.0%) reported hearing or seeing the effects of vibration from footsteps inside their home. Six respondents reported hearing or seeing the effects of vibration from other sources such as ‘music blaring’, ‘tremors’ from earthquakes, and three respondents mentioned that their windows rattled and vibrated when it was windy. Four respondents reported hearing or seeing the effects of railway vibration.
Twenty-six respondents were asked (D6) whether they had personally heard or seen anything rattle, vibrate or shake in their home. The Figure below shows the percentage of respondents that reported hearing or seeing windows, doors, other parts of the home, crockery and other objects in the home rattle, vibrate or shake. Eight respondents (30.8%) heard or saw doors vibrate, and fourteen respondents heard or saw windows (53.8%) vibrate. Four respondents reported hearing or seeing other objects vibrate such as the floor and objects on the shelf. Only two respondents heard or saw crockery vibrate, and one respondent reported hearing or seeing other parts of the house vibrate. 22 Percentages do not total 100% due to more than one response being permitted for this question

NANR209 Technical report 5
74
Residents were also asked whether feeling vibration (D4) or hearing or seeing (D8) things rattle, vibrate, or shake bothered, annoyed, or disturbed them during the following activities:
• watching the television, • listening to the radio or music, • talking to someone in person or on the telephone, • reading or doing any other quiet activities, • writing, drawing, painting or doing any other activity requiring a steady surface (D4
only), • resting, • sleeping, • using any rooms in this home, • doing anything else.
Figure 43: Activities affected by feeling vibration (n = 56)23
Resting (25.0%) and sleeping (40.0%) were the daily activities that respondents reported as being most disturbed by vibration. Unlike railway and construction findings, watching the television was reported by fewer respondents (10.7%) than reading and doing other quiet activities. Reading and doing other quiet activities was reported by 17.9% of respondents, which could be explained by the sample including a large proportion of students and older people.
Respondents (N = 26) were also asked whether hearing or seeing (D8) the effects of vibration bothered, annoyed, or disturbed them while carrying out daily activities (see Figure 45 below). Again resting (46.2%) and sleeping (46.2%) were the most disturbed activities.
23 Percentages do not total 100% due to more than one response being permitted for this question

NANR209 Technical report 5
75
Figure 44: Activities affected by hearing or seeing vibration (N = 26)24
Those respondents that reported feeling, hearing, or seeing vibration from any of the sources enquired about were asked to rate their annoyance on two scales – the five-point semantic (D9) and eleven-point numerical scale (D10). For a discussion of these scales see Technical Report 2 – Measurement of Response.
Thirty respondents (20%) reported feeling vibration and/or hearing or seeing its effects from internal sources and as such were asked about their annoyance.
24 Percentages do not total 100% due to more than one response being permitted for this question

NANR209 Technical report 5
76
Figure 45: Annoyance ratings for internal vibration on the five-point semantic scale (N = 30)
The vast majority were either not at all (40.0%) or slightly annoyed (43.3%). One in three were very annoyed (10.0%) and 3.3%, in both cases, were moderately or extremely annoyed. Respondents also gave their annoyance ratings on the eleven-point scale (see Table 12 below).
Table 12: Respondents ratings for construction vibration on the eleven-point numerical scale (N = 30)
Rating on eleven-point scale (0 – 10)
Percentage (%)
0 30.0
1 10.0
2 26.7
3 16.7
4 3.3
5 3.3
6 3.3
7 6.7
8 -
9 -
10 -
Total 100
In the case of internal sources, a highly annoyed category cannot be created using the top three intervals (8, 9, 10) on the eleven-point scale as no one gave a rating above 7, indicating internal sources of vibration are not highly annoying. However, the lower levels of annoyance for internal sources of vibration may be due to the difficulties in identifying sites where internal sources of vibration produce significant levels of vibration exposure. For further discussions of the internal sources of vibration exposure see Technical Report 6: Determination of Exposure-Response Relationships.
Respondents reported being very or extremely annoyed by internal sources of vibration but did not give ratings above 7 on the 11-point numerical scale. Such findings raise questions

NANR209 Technical report 5
77
about the need for two scales, and whether the two scales are the most appropriate to use. Further research is needed to explore response scales in socio-vibration surveys.
7.3 NOISE RESPONSE
More respondents heard more noise, from a wider range of sources, than they felt, heard or saw vibration and its effects. Internal sources were heard by 60.0% of respondents, followed by noise from footsteps, slamming doors, domestic appliances (within home) (58.7%). Railway noise was heard by over a quarter of respondents (28.0%), followed by noise from vehicles (25.3%) and other noise sources (18.0%) (see Figure 46 below).
Figure 46: Noise sources heard by respondents (N = 150)25
Looking at the ‘other’ noise sources by accommodation type i.e. sheltered accommodation and student halls, some similarities and differences become evident. Some of the noise sources overlap such as neighbours playing music and noise from refuse collection. However there were also noise sources specific to the accommodation. For example, two respondents living in student halls reported hearing noise from leaf blowers for University estate maintenance. Those living in sheltered accommodation mentioned noise from dogs barking and noise from people walking past on a boardwalk adjacent to one of the buildings included in the study.
25 Percentages do not total 100% due to more than one response being permitted for this question

NANR209 Technical report 5
78
For the noise sources reported, respondents were asked to rate their annoyance ratings on the five- and eleven-point scales. For internal sources, the majority of respondents were not at all (38.9%) or slightly annoyed (33.0%) (see Figure 47 below).
Figure 47: Annoyance ratings for noise from internal sources on the five-point semantic scale (N = 90)
Fewer respondents reported being moderately (14.4%), very (8.9%) and extremely (1.1%) annoyed. Respondents also gave their ratings of annoyance on the eleven-point scale for internal sources (see table 13 below).

NANR209 Technical report 5
79
Table 13: Annoyance ratings for noise from internal sources on the eleven-point scale (N = 90)
Rating on eleven-point scale (0 – 10)
Percentage (%)
0 22.2
1 10.0
2 23.3
3 15.6
4 5.6
5 7.8
6 5.6
7 4.4
8 1.1
9 4.4
10 -
Total 100
Unlike vibration from internal sources, a highly annoyed category can be created for noise from internal sources using the top three ratings on the scale (8, 9, 10). For noise from internal sources, 5.5% of respondents were highly annoyed. Interestingly no respondents gave a rating of 10 for noise from internal sources.
7.4 OTHER DATA
The social survey questionnaire also collected data other than annoyance ratings on response to vibration and noise from internal sources. Respondents were asked whether they were concerned about structural damage to their properties, whether the level of vibration and noise they experienced was acceptable, and how sensitive they felt they were to vibration and noise in general. Some of this data can be used to further understand annoyance ratings given.

NANR209 Technical report 5
80
All but three respondents were not at all concerned about damage to their properties. One respondent was extremely concerned, and two were slightly concerned about damage to their property from the vibration they experienced within their homes. This could, in part, go some way to explaining the lower levels of annoyance for this source of vibration.
In terms of sensitivity, respondents were asked to rate how sensitive there were to vibration and noise in general. For vibration (N = 56), 36.5% were not at all, 24.0% were slightly, 4.7% were moderately and 2.0% rated themselves as very sensitive. No respondents were extremely sensitive to vibration. For noise (N = 127), 28.0% were not at all, 24.7% were slightly, 23.3% were moderately, 4.0% were very, and 4.7% rated themselves as extremely sensitive.
Respondents were also asked about how acceptable the vibration and noise they experience was (D16, E6), both in general, and specifically (J3, K3) for those internal sources of vibration (annoyed respondents only). Respondents (N = 101) were more likely to rate the vibration (from all the sources) they notice as acceptable (42.0%): other respondents rated the vibration as very acceptable (18.7%), neither acceptable nor unacceptable (4.7%), unacceptable (1.3%) and very unacceptable (0.7%). For those annoyed by vibration from internal sources (N = 30), the vibration was rated as very acceptable (40.0%), acceptable (33.3%), neither acceptable nor unacceptable (23.3%) and unacceptable 3.3%). No respondents rated the vibration from internal sources as very unacceptable. For noise (N = 127), over half of the respondents found it acceptable (56.7%): 15.0% found it very acceptable, 16.5% gave a rating of neither acceptable nor unacceptable, 8.7% found it unacceptable and 2.7% found it very unacceptable.
7.5 CO-ORDINATION OF VIBRATION MEASUREMENTS AND SOCIAL SURVEY
In comparison to the other two samples, fewer respondents (56.3%) agreed to internal vibration measurements being taken at their properties. This was largely due to difficulties in arranging further access to the buildings or due to the sample containing a large proportion of older people living in sheltered accommodation schemes. In the case of sheltered housing, wardens were cooperative in arranging access to their schemes, as were site managers in student halls. For results and analysis of the social survey and vibration measurement data for internal sources of vibration, see Technical Report 6 – Determination of Exposure-Response Relationships.
8 DISCUSSION
For all three sources of vibration investigated, respondent had difficulties describing the sensory experience of vibration in the residential environment. The primary effect of feeling vibration was explored separately to the secondary effects of vibration i.e. hearing and seeing

NANR209 Technical report 5
81
things rattle, vibrate or shake. The analysis indicates that respondents could differentiate between the primary and secondary effects of vibration in all three datasets, however when asked to describe the effects, much overlap occurred. The qualitative data collected suggests that describing auditory and visual sensory aspects of vibration is easier than describing the haptic and kinesthetic sensory aspects of vibration, and as such respondents gave auditory/visual descriptions in response to the question exploring feeling vibration through structures. As the experience of vibration is complex, further research using social survey questionnaires to gather responses could ask about feeling vibration, and hearing and seeing the effects of vibration in one question. Alternatively, future research could adopt a more longitudinal methodology that would allow respondents to reflect on their sensory experiences over a period of time, for example, diary methods or multiple interviews.
The analysis showed that vibration from construction activity caused more people to be highly annoyed (37.9%HA) than vibration from railway activities (9.7%HA). These findings can in part be explained by the differing levels of vibration respondents were exposed to from railway and construction activity (see Technical Report 6: Determination of Exposure-Response Relationships). However having an understanding of the context within which vibration is experienced can also offer valuable insight in the response to vibration in residential settings. For railways, residents talked about getting used to the vibration and noise, and living in a home next to a railway line in general. The railway is a permanent enduring feature of the residential environment that respondents accept as part of where they live. Whereas for construction, although some respondents mentioned getting used to the vibration and noise they experience, it was more likely to be considered unacceptable by respondents.
Internal sources of vibration proved difficult to research, with few respondents reporting being able to feel or hear or see vibration, and fewer reporting annoyance for this source. The social survey data collected is not sufficient enough for the development of an exposure-response relationship between levels of annoyance and levels of vibration exposure. Future research on internal sources could adopt a different approach to site identification, perhaps interviewing in places where internal sources of vibration are known. Working with local authorities, environmental health departments could assist by identifying sites where complaints about internal sources of vibration have been received. However, this participant recruitment method could result in higher self-reported annoyance levels.
It is also important to note that when gathering data specifically from those living near railways and construction activity, a number of respondents reported feeling, hearing, or seeing vibration from internal sources of vibration from ‘footsteps, slamming doors, domestic appliances in neighbouring homes’ (railways N = 53, construction activity N = 14). Although working in a source specific way was practical in terms of site identification and managing survey timing and implementation, future research should endeavour to explore such data in more depth. As internal sources of vibration are difficult to locate for research fieldwork, future research should take advantage of instances where respondents report noticing vibration and noise from internal sources at sites where another source of vibration is the primary focus.

NANR209 Technical report 5
82
For this research, one of the difficulties with exploring one particular source of vibration in depth (i.e. railways, construction activity, and internal sources) was that fuller definitions for each source were used (see Technical Report 2: Measurement of Response) which did not appear in the other versions of the social survey questionnaires (see Appendix 1, 2, and 3 for examples). This makes comparisons of the datasets difficult for these particular sources as the definitions of the sources used impact upon how the resident responds to the question. Future research should determine from the outset which sources of vibration will be investigated in depth, and use the fuller definitions in all versions of the social survey questionnaires in use.
As expected, noise was heard by more respondents, and from more sources than vibration in the residential environment. This finding was in line with the Pilot Study suggestion that ‘vibration effects may be more subtle and less noticeable than noise’ (Defra, 2007, p.22); vibration is also a less common occurrence than noise in the residential environment. The analysis showed that noise from construction activity was more annoying (31.6%HA) than noise from railway activity (10.3%HA) and noise from internal sources (5.5%HA). Again, these differences in those highly annoyed for vibration from the three sources could be explained by the noise exposure from these sources (see Technical Report 4: Calculation of Noise Exposure, and Technical Report 6: Determination of Exposure-Response Relationships for further information on annoyance and noise exposure). However the findings within the social survey data can offer an explanation of the differences in annoyance for each of the sources investigated.
9 CONCLUSIONS
The range of reported annoyance ratings for railway and construction activity was sufficient for the determination of exposure-response relationships (see Technical Report 6: Determination of Exposure-Response Relationships). However for internal sources, very few respondents reported being exposed to vibration, and of those that were, few reported were annoyed. Such difficulties in gathering the range of responses needed to investigate a particular source in depth should be taken into consideration for future research. Although it is important to standardise the methodology taken, each source of vibration is different, and different approaches may be required to gather data suitable to develop exposure-response relationships.

NANR209 Technical report 5
83
10 REFERENCES
Defra (2007) Human response to vibration in residential environments (NANR172), London: Department for Environment, Food and Rural Affairs
Schultz, T. J. (1978) Synthesis of social surveys on noise annoyance. Journal of the Acoustical Society of America., 64, pp. 377-405
11 APPENDICES
Appendix 1: NANR209 – Human Response to Vibration in Residential Environments: Railway specific questionnaire
Appendix 2: NANR209 – Human Response to Vibration in Residential Environments: Construction specific questionnaire
Appendix 3 : NANR209 – Human Response to Vibration in Residential Environments: Internal sources specific questionnaire


