computer programs 1042 http://dx.doi.org/10.1107/S1600576716005926 J. Appl. Cryst. (2016). 49, 1042–1047 Received 18 February 2016 Accepted 9 April 2016 Edited by N. D. Loh, National University of Singapore 1 This article will form part of a virtual special issue of the journal on free-electron laser software. Keywords: X-ray free-electron lasers; XFELs; flash X-ray imaging; real-time data analysis; computer programs. Hummingbird: monitoring and analyzing flash X-ray imaging experiments in real time 1 Benedikt J. Daurer, a Max F. Hantke, a Carl Nettelblad a,b and Filipe R. N. C. Maia a * a Laboratory of Molecular Biophysics, Department of Cell and Molecular Biology, Uppsala University, Sweden, and b Division of Scientific Computing, Department of Information Technology, Science for Life Laboratory, Uppsala University, Sweden. *Correspondence e-mail: [email protected]Advances in X-ray detectors and increases in the brightness of X-ray sources combined with more efficient sample delivery techniques have brought about tremendous increases in the speed of data collection in diffraction experiments. Using X-ray free-electron lasers such as the Linac Coherent Light Source (LCLS), more than 100 diffraction patterns can be collected in a second. These high data rates are invaluable for flash X-ray imaging (FXI), where aerosolized samples are exposed to the X-ray beam and the resulting diffraction patterns are used to reconstruct a three-dimensional image of the sample. Such experiments require immediate feedback on the quality of the data collected to adjust or validate experimental parameters, such as aerosol injector settings, beamline geometry or sample composition. The scarcity of available beamtime at the laser facilities makes any delay extremely costly. This paper presents Hummingbird, an open-source scalable Python-based software tool for real-time analysis of diffraction data with the purpose of giving users immediate feedback during their experiments. Hummingbird provides a fast, flexible and easy-to-use framework. It has already proven to be of great value in numerous FXI experiments at the LCLS. 1. Introduction More than a decade ago, it was first suggested that the very short and intense pulses of X-ray free-electron lasers (XFELs) have the potential to determine the structure of noncrystalline bioparticles from a large collection of single-shot diffraction patterns (Neutze et al. , 2000). This flash X-ray imaging (FXI) concept has been used to reconstruct two-dimensional projections of mimivirus (Seibert et al., 2011), whole cells (van der Schot et al., 2015), cell organelles (Hantke et al. , 2014) and soot particles (Loh et al., 2012). More recent advances include the characterization of the three-dimensional struc- ture of silver particles (Barke et al. , 2015) and even a full three-dimensional reconstruction of mimivirus (Ekeberg et al., 2015). In a typical FXI experiment, a stream of biological particles is injected into the focus of a pulsed X-ray source. Far-field diffraction data are collected downstream of the interaction region. A more detailed description of the experimental setup, using an aerosol particle injector, has been given for example by Hantke et al. (2014). Currently, a considerable amount of time during FXI experiments is spent on alignment and optimization of the X-ray source, background reduction and finding the inter- section between the particle stream and the X-ray beam. These tasks get increasingly harder as we move towards harder X-rays (>2 keV) in a smaller focus (<200 nm), with ever smaller bioparticles (<100 nm). Yet such changes are ISSN 1600-5767
Transcript
computer programs
1042 http://dx.doi.org/10.1107/S1600576716005926 J. Appl. Cryst. (2016). 49, 1042–1047
Received 18 February 2016
Accepted 9 April 2016
Edited by N. D. Loh, National University of
Singapore
1This article will form part of a virtual special
issue of the journal on free-electron laser
software.
Keywords: X-ray free-electron lasers; XFELs;
flash X-ray imaging; real-time data analysis;
computer programs.
Hummingbird: monitoring and analyzing flash X-rayimaging experiments in real time1
Benedikt J. Daurer,a Max F. Hantke,a Carl Nettelblada,b and Filipe R. N. C. Maiaa*
aLaboratory of Molecular Biophysics, Department of Cell and Molecular Biology, Uppsala University, Sweden, andbDivision of Scientific Computing, Department of Information Technology, Science for Life Laboratory, Uppsala
necessary steps towards the goal of imaging single molecules
with atomic resolution using a free-electron laser. The avail-
ability of immediate feedback on the quality of the data
collected helps reduce the amount of time required for the
above steps. For this purpose we developed Hummingbird, an
open-source, modular and scalable Python-based software
tool designed for monitoring and analyzing FXI experiments
in real time. Similar projects like Cheetah (a comprehensive
data reduction and analysis tool for diffraction data written in
C/C++; Barty et al., 2014), CASS (a data analysis and visuali-
zation tool developed for XFEL experiments; Foucar et al.,
2012), cctbx.xfel [a Python-based data processing tool for
serial femtosecond crystallography (SFX); Sauter et al., 2013]
and OnDA (a real-time monitoring tool mainly developed for
the needs of SFX; Mariani, 2016) show the need for robust and
fast data analysis tools able to cope with the large stream of
data produced with XFELs.
Hummingbird abstracts away the technical details required
to access data at different light sources in a scalable manner,
presenting the user with a consistent interface for processing
individual shots. It is lightweight and can scale to processing
rates above 100 Hz by distributing the load among multiple
workers on multiple computation nodes. Its Python-based
configuration files make it simple to use, while allowing great
flexibility. We demonstrate the versatility and speed of
Hummingbird using an example that reflects typical data
taken at FXI experiments. Although Hummingbird has been
developed and tested mainly for experiments performed at the
Linac Coherent Light Source (LCLS), its modular archi-
tecture allows it to be easily adapted to any other light source.
2. Architecture
Hummingbird’s architecture (see Fig. 1) is based on a simple
client–server model written mainly in Python. The server can
be split over multiple processes, communicating across MPI
(Forum, 1994) using OpenMPI (Gabriel et al., 2004), to
maximize performance. Each process reads independently
from a common data source, translating raw data into
Hummingbird’s common event structure. For every event,
user-specific data analysis is performed. The server commu-
nicates the results to the client using ZeroMQ’s publish/
subscribe pattern (Hintjens, 2010). The client subscribes to
available data sources and output is visualized in a graphical
user interface (GUI).
Customization of the backend is possible through a Python-
based configuration file, as shown in Fig. 2, which specifies the
data source and defines the analysis and plotting modules to
be used. Upon changes, the configuration can easily be
reloaded by sending a signal to the server, either using the
terminal or remotely using the ‘reload’ button in the GUI.
This makes the common procedure of tuning parameters, such
as hit-finding thresholds, convenient and fast.
This section describes the individual parts of Humming-
bird’s architecture, namely the configuration file, translation
layer, event variable, analysis/plotting modules and GUI. A
complete example based on experimental data followed by a
simple benchmark to test Hummingbird’s speed and scal-
ability is given in x3.
2.1. Configuration file
A typical Hummingbird configuration file (see Fig. 2) is
divided into three sections. In the first section, necessary
modules for analysis and plotting are imported. A complete
list of available modules can be found in the API docu-
mentation (see Usage notes). The second section defines the
data source, using the state variable. In the third section,
inside the function onEvent, user-specific steps of analysis and
plotting are performed, triggered by individual events. Global
parameters can be defined outside the onEvent function, e.g.
using the state variable, which is used to keep track of things
that do not change between consecutive onEvent invocations.
2.2. Translation layer
Hummingbird’s architecture (see Fig. 1) is designed such
that all code parts downstream of the translation layer are
intended to be facility agnostic. Native events are translated
into Hummingbird events, represented by the event variable
computer programs
J. Appl. Cryst. (2016). 49, 1042–1047 Benedikt J. Daurer et al. � Hummingbird 1043
Figure 1The client–server architecture of Hummingbird. Depending on theconfiguration (conf.py), the backend workers (master in red, slaves ingreen) read in data, translate native events based on the facility, performuser-specific data analysis and send plots off to the frontend.
Figure 2The backbone structure of a Hummingbird configuration file. In theheader, analysis/plotting modules are imported, accompanied by adefinition of the data source. Inside the event function, user-specific dataanalysis and plotting is defined. Global parameters can be defined outsidethe event function.
evt. In its current implementation Hummingbird provides
translation services for data produced at the LCLS using
Python-based psana (Damiani et al., 2016). This tool supports
reading from the native XTC files at LCLS, as well as from live
shared memory streams provided by the LCLS data acquisi-
tion infrastructure. The shared memory stream gives access to
live LCLS data through a buffer which gets filled by the data
acquisition system (DAQ) during data collection and is
available to applications until it is overwritten by a subsequent
event. The shared memory streams are only available from
dedicated online monitoring nodes. In the future we plan to
add more translation modules for other facilities like SACLA,
and the upcoming European XFEL, which uses Karabo
(Heisen et al., 2013).
2.3. Event variable (evt)
The evt variable provides access to all available data
entries, e.g. pixel detector images, pulse energies, motor
positions. evt is a nested dictionary with two levels, the first
defining a data type and the second defining a data key.
Individual data records, like evt½0type0�½0key0� have name and
data attributes, the former being an identifier 0type=key0 and
the latter giving access to the data.
2.4. Analysis/plotting modules
On the basis of their experimental needs, a user can
customize individual data processing steps using analysis
modules and define graphs to be presented in the GUI using
plotting modules. An analysis module takes the evt along with
a data type and a data key as positional arguments. Some
modules expect a data record as second argument. The output
is attached to evt as a new data record with the data type0analysis0 and a new data key based on the combination of
the input data type/key and an additional string labelling the
analysis performed. Additional input parameters can be
passed to the module as a keyword argument.
A plotting module takes at least one data record as a
positional argument and additional parameters as keyword
arguments. The purpose of the plotting module is to send data
together with plotting instructions to the interface. These
plotting instructions include the kind of data to be plotted (e.g.
on different machines can subscribe to the same backend
without interfering with each other, allowing for specialized
viewports.
For all data sources with active subscriptions, the interface
keeps a buffer which can be dynamically resized at any time.
Using this buffer, it is possible to show trends as well as go
back in history in case an interesting event passed by too
quickly. A more complete list of features is given in the GUI
documentation (see Usage notes).
The GUI is written in Python using Qt (The Qt Company,
2016) through PyQt (Riverbank Computing, 2016) and
PyQtGraph (Campagnola, 2016).
computer programs
1044 Benedikt J. Daurer et al. � Hummingbird J. Appl. Cryst. (2016). 49, 1042–1047
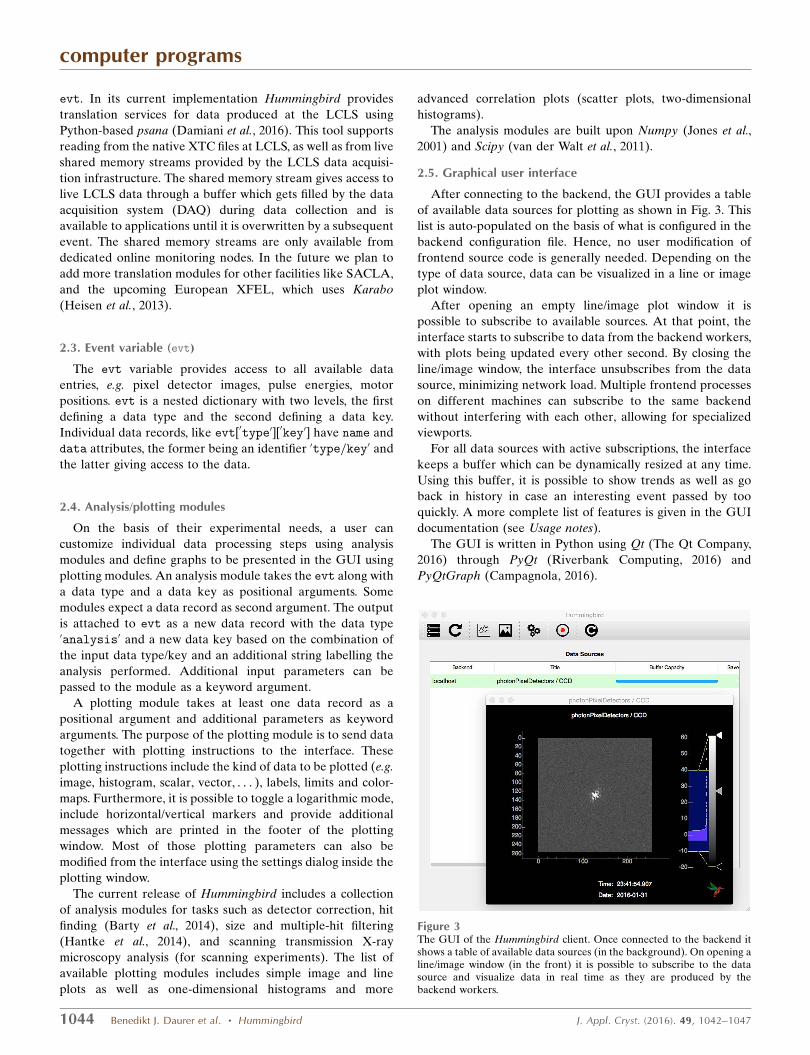
Figure 3The GUI of the Hummingbird client. Once connected to the backend itshows a table of available data sources (in the background). On opening aline/image window (in the front) it is possible to subscribe to the datasource and visualize data in real time as they are produced by thebackend workers.
3. Practical example
We demonstrate the usage and capability of Hummingbird
using data from an FXI experiment on mimivirus collected at
the LCLS (Ekeberg et al., 2016). The dataset is deposited in
the CXIDB (http://www.cxidb.org/; entry 30). A list of used
raw XTC and index files is provided in Table 1.
With all files listed in Table 1 in the same folder and a
working psana setup, it is possible to run Hummingbird with
the configuration described in Fig. 4. This example starts by
calculating the average dark image, which then is subtracted
from the raw pedestal values of diffraction frames. Running
Hummingbird on the ‘dark’ configuration file (Fig. 4a) in a
single process will produce an HDF5 file with an averaged
dark image.
When Hummingbird is run on the ‘diffraction’ configura-
tion file (Fig. 4b) in a single process, or with multiple processes,
each worker grabs a raw frame from the back detector,
subtracts the average dark image, corrects for the common
mode within the pnCCD detector rows (Hantke et al., 2014)
and finally counts the number of lit pixels, i.e. pixels containing
photons. We call this metric hitscore and use it to determine
whether the current diffraction event is a hit or not. The
backend sends three plots to the interface; the histogram of
the current detector event, the current hitscore which is
displayed as a history plot and the full detector image for hits.
After connecting the interface to the main worker of the
backend, and subscribing to the three available data sources,
updates on the histogram, hitscore and hit images are
displayed in the interface as shown in Fig. 5. Watching the
progress of histogram and hitscore history helps the user to
optimize the lit pixel hit finder, namely the threshold for
defining a lit pixel (shown as a vertical red line in the top right
panel) and the hitscore threshold defining a hit (shown as a
horizontal green line in the bottom left panel). When running
from a dynamic data source (e.g. a shared memory stream), it
is possible to change parameters in the backend configuration
file and simply reload the configuration using the ‘Reload’
button in the interface without restarting the backend.
computer programs
J. Appl. Cryst. (2016). 49, 1042–1047 Benedikt J. Daurer et al. � Hummingbird 1045
Figure 4Example of Hummingbird configuration files reading data from raw XTCand index files. The configuration in (a) reads dark frames and saves theaverage to a file. The configuration in (b) reads diffraction frames, applieshit-finding analysis and sends detector images of hits along withadditional information to the GUI client.
Table 1List of raw XTC and index files downloaded from the CXIDB (entry 30):files containing dark frames (left column) and diffraction frames (rightcolumn) are used for demonstration of Hummingbird.
The performance of Hummingbird running the ‘diffraction’
configuration example when reading from XTC files is given in
Table 2, showing processing rates above 100 Hz using up to 90
CPU workers distributed across five computing nodes. Each
node has two Intel Xeon E5-2620 CPUs with six cores each.
With low worker counts, the processing speed scales linearly.
For higher counts, the disk I/O subsystem of our cluster
becomes the limiting factor. When running the same example
live (i.e. from shared memory streams at LCLS), the intent
would be to choose a number of nodes (with the number of
workers per node roughly corresponding to the number of
cores) that would guarantee real-time processing of all data.
During numerous experiments at the LCLS using similar
configurations, Hummingbird has been reading from multi-
plexed shared memory streams approaching the real-time rate
of 120 Hz.
4. Usage notes
Hummingbird is an open-source project, available under the
Simplified BSD license. The current release can be down-
loaded from http://lmb.icm.uu.se/hummingbird. The project is
also available on Github (https://github.com/FXIhub/
hummingbird). Detailed installation instructions and exam-
ples are provided on a documentation page (http://lmb.icm.uu.
se/hummingbird/docs).
5. Future work
In future releases of Hummingbird we are planning to add
more event translators for other XFEL data sources, in
particular for SACLA and the European XFEL. Besides its
main focus on real-time monitoring, we are improving the
capabilities of running Hummingbird as a tool for offline
analysis of X-ray diffraction data. We continue to implement
new data analysis and plotting modules. Furthermore, we are
constantly adding new features to the GUI. This is an open-
source project, so we encourage users to contribute and
extend Hummingbird by adding new modules.
6. Conclusion
We have introduced Hummingbird, a versatile data analysis
and monitoring tool which is able to cope with the current
frame rates at which data are produced in FXI experiments
performed at free-electron lasers. With Hummingbird, users
are able to monitor and thus adjust crucial experimental
parameters in real time. With its simple and modular Python
implementation, users can easily build their own tailored
computer programs
1046 Benedikt J. Daurer et al. � Hummingbird J. Appl. Cryst. (2016). 49, 1042–1047
Figure 5Snapshot of the Hummingbird interface showing available data sources and plots for the ‘diffraction’ configuration example. It monitors the hitscore(bottom left), detector histogram (top right) and latest hit image (bottom right). The current parameters of the hit finder (counting lit pixels) are shownas a vertical red line in the top right panel and as a horizontal green line in the bottom left panel.
analysis pipeline for their experiments and run it in real time
over multiple cores and nodes.
Acknowledgements
This work was supported by the Swedish Research Council,
the Knut and Alice Wallenberg Foundation, the European
Research Council, the Swedish Foundation for Strategic
Research, and the Helge Ax:son Johnsons Stiftelse.
References
Barke, I., Hartmann, H., Rupp, D., Fluckiger, L., Sauppe, M., Adolph,M., Schorb, S., Bostedt, C., Treusch, R., Peltz, C., Bartling, S.,Fennel, T., Meiwes-Broer, K.-H. & Moller, T. (2015). Nat.Commun. 6, 6187.
Barty, A., Kirian, R. A., Maia, F. R. N. C., Hantke, M., Yoon, C. H.,White, T. A. & Chapman, H. (2014). J. Appl. Cryst. 47, 1118–1131.
Campagnola, L. (2016). PyQtGraph, http://pyqtgraph.org.Damiani, D., Dubrovin, M., Gaponenko, I., Kroeger, W., Lane, T. J.,
Mitra, A., O’Grady, C. P., Salnikov, A., Sanchez-Gonzalez, A.,Schneider, D. & Yoon, C. H. (2016). J. Appl. Cryst. 49, 672–679.
Ekeberg, T., Svenda, M., Abergel, C. et al. (2015). Phys. Rev. Lett. 114,098102.
Ekeberg, T., Svenda, M., Seibert, M. M. et al. (2016). Submitted.Forum, M. P. (1994). MPI: A Message-Passing Interface Standard.
Technical Report. University of Tennessee, Knoxville, TN, USA.Foucar, L., Barty, A., Coppola, N., Hartmann, R., Holl, P., Hoppe, U.,
Kassemeyer, S., Kimmel, N., Kupper, J., Scholz, M., Techert, S.,
White, T. A., Struder, L. & Ullrich, J. (2012). Comput. Phys.Commun. 183, 2207–2213.
Gabriel, E., Fagg, G. E., Bosilca, G., Angskun, T., Dongarra, J. J.,Squyres, J. M., Sahay, V., Kambadur, P., Barrett, B., Lumsdaine, A.,Castain, R. H., Daniel, D. J., Graham, R. L. & Woodall, T. S. (2004).Recent Advances in Parallel Virtual Machine and Message PassingInterface, 11th European PVM/MPI Users’ Group Meeting,Budapest, Hungary, September 19–22, 2004, Proceedings, pp. 97–104. Berlin, Heidelberg: Springer.
Hantke, M. F. et al. (2014). Nat. Photon. 8, 943–949.Heisen, B., Boukhelef, D., Esenov, S., Hauf, S., Kozlova, I., Maia, L.,
Parenti, A., Szuba, J., Weger, K., Wrona, K. & Youngman, C.(2013). 14th International Conference on Accelerator and LargeExperimental Physics Control Systems, San Francisco, USA, 6–11October 2013, FRCOAAB02.
Hintjens, P. (2010). ZeroMQ: The Guide, http://zguide.zeromq.org/page:all.
Jones, E. et al. (2001). SciPy, http://www.scipy.org/.Loh, N. D. et al. (2012). Nature, 486, 513–517.Mariani, V., Morgan, A., Yoon, C. H., Lane, T. J., White, T., O’Grady,
C., Kuhn, M., Aplin, S., Koglin, J. & Chapman, H. N. (2016). J. Appl.Cryst. 49, 1073–1080.
Neutze, R., Wouts, R., van der Spoel, D., Weckert, E. & Hajdu, J.(2000). Nature, 406, 752–757.
Sauter, N. K., Hattne, J., Grosse-Kunstleve, R. W. & Echols, N. (2013).Acta Cryst. D69, 1274–1282.
Schot, G. van der et al. (2015). Nat. Commun. 6, 5704.Seibert, M. M. et al. (2011). Nature, 470, 78–81.The Qt Company (2016). Qt, http://www.qt.io.Walt, S. van der, Colbert, S. C. & Varoquaux, G. (2011). Comput. Sci.
Eng. 13, 22–30.
computer programs
J. Appl. Cryst. (2016). 49, 1042–1047 Benedikt J. Daurer et al. � Hummingbird 1047