43
Hungry Seniors in Washington: An Update Washington Food Coalition Annual Conference Martha Peppones MS, RDN, CSG, CD Nutrition Director Senior Services of Snohomish County
| Date post: | 18-Dec-2015 |
| Category: |
Documents |
| Upload: | robyn-dixon |
| View: | 220 times |
| Download: | 2 times |

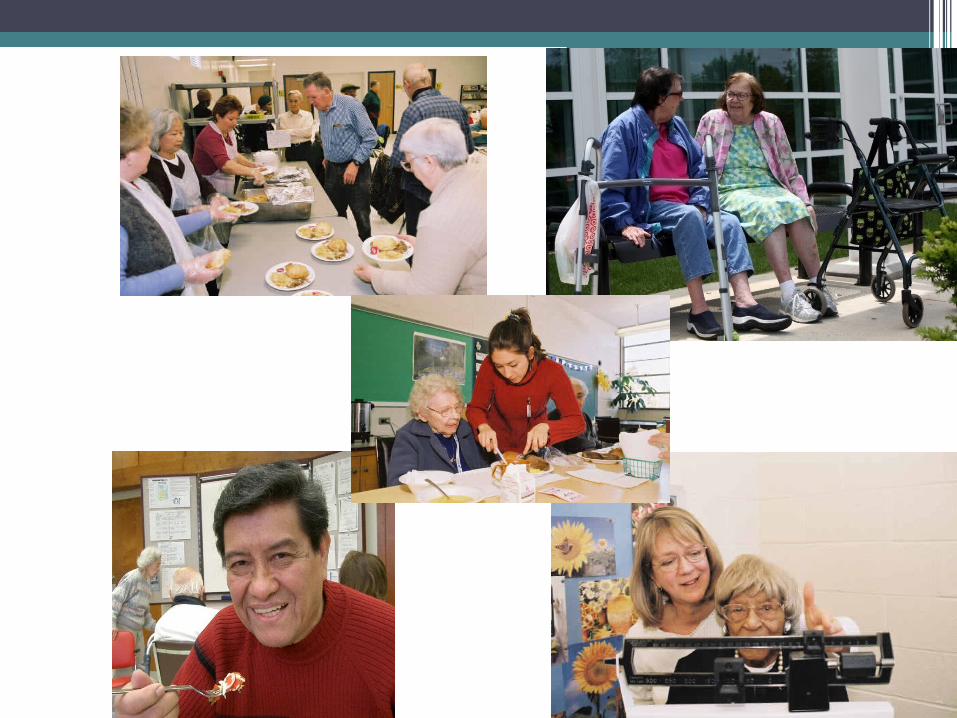
Hungry Seniors in Washington: An UpdateWashington Food CoalitionAnnual Conference
Martha Peppones MS, RDN, CSG, CDNutrition DirectorSenior Services of Snohomish County

Overview
•Demographics
•Nutritional needs of older adults
•Senior hunger
•Impacts of hunger
•Solutions ▫Food assistance programs▫Other types of assistance▫Resources

Number of Older Americans

Older Americans in Poverty•8.7% live below FPL
•15% are below the Supplemental Poverty Measure▫Considers regional variations of housing
costs, non-discretionary expenditures, medical out-of-pocket expenses
Source: Administration on Aging. A Profile of Older Americans: 2012http://www.aoa.gov/aoaroot/aging_statistics/Profile/2012/Index.aspx

Older Americans in Poverty
•Racial/ethnic▫6.7% of elderly whites▫17.3% of elderly
African Americans▫11.7% of elderly
Asians▫18.7% of elderly
Hispanics
•Gender▫10.7% women▫6.2% men
Source: Administration on Aging. A Profile of Older Americans: 2012http://www.aoa.gov/aoaroot/aging_statistics/Profile/2012/Index.aspx

Older Americans in Poverty•Living arrangements
▫5 % living with families
▫16.5% living alone
•Location▫11.7% in principal
cities▫10.1% South
•Highest poverty rates▫Hispanic women
who live alone (38.8%)
▫African American women living alone (32.2%)
Source: Administration on Aging. A Profile of Older Americans: 2012http://www.aoa.gov/aoaroot/aging_statistics/Profile/2012/Index.aspx

Nutrition & Health
•Adequate nutrition is essential for▫Health▫Functionality▫Independence▫Quality of life

Nutrients of concern in older adults
•Energy needs
•Vitamins and minerals or
•Fluid
•Protein

Nutrient Concerns – con’t•Fiber
•Vitamin D and Calcium
•Vitamins B12, folic acid, and B6
•Antioxidants

Factors Affecting Nutritional Well Being of Older Adults

Washington Report Card for Health• 42.7% report having a disability
• 60% are not eating recommended 2 servings of fruit per day
• 70% not eating 3 servings of vegetables per day
• One in four older adults are obese
• 32% older adults have lost ≥ 5 natural teeth
Source: The State of Aging and Health in America 2013 CDC http://nccd.cdc.gov/DPH_Aging/default.aspx
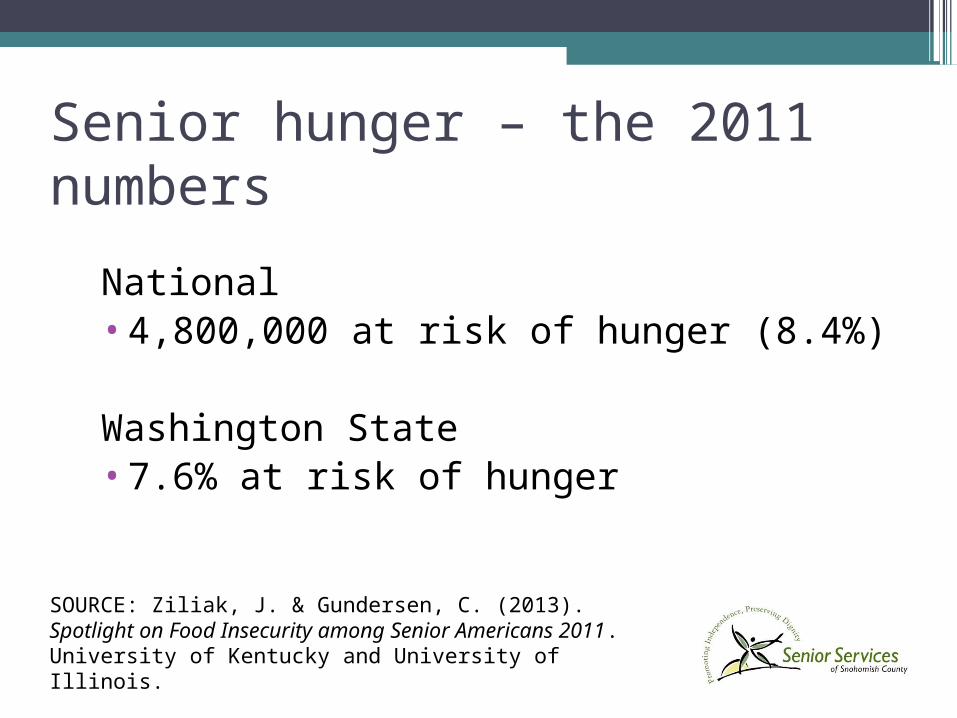
Senior hunger – the 2011 numbers
National•4,800,000 at risk of hunger (8.4%)
Washington State•7.6% at risk of hunger
SOURCE: Ziliak, J. & Gundersen, C. (2013). Spotlight on Food Insecurity among Senior Americans 2011. University of Kentucky and University of Illinois.

Hunger will continue to increase
•The senior food insecurity rate has more than doubled since 2001
•10,000 adults will turn 65 every day until 2030

Hunger is increasing….


Who’s more likely to be hungry?• Poor, near poor (up to
200% FPL)• African American
(17%), Hispanic (18%)• Single – widowed,
divorced• Unemployed
• Younger than 74 – especially 60-64
• Disabled• Female• Living with grandkids• Lives in southern US
Ziliak et al. Causes, Consequences & Future of Senior Hunger in America, Meals on Wheels Foundation. March 2008. www.mowaa.org/
Being food insecure is like being functionally 14 years older.

Chronic illness and food insecurity•80% of older adults have one chronic
condition
•50% have at least two•Increased number of chronic conditions
related to higher level of food insecurity▫Additional health care costs▫Limited ability to manage with
scarce resourcesTarasuk V, et al. Chronic Physical and Mental Health Conditions Among Adults May Increase Vulnerability to Household Food Insecurity. J Nutr. Doi:10.3945/jn.113.178483. 2013

Impacts of food and nutrition on health
POOR DIETS
CHRONIC DISEASES
(Heart Disease; Hypertension; Diabetes; Osteoporosis; Some Cancers: colon and breast; Arthritis; COPD; Renal Disease)
ACUTE CONDITIONS
(Dehydration; Pressure Ulcers; Infections; Pneumonia; Influenza; Fractures; Tooth Abscesses; Gum Disease)
AGE-RELATED CONDITIONS / DISEASES
(Hearing Loss; Macular Degeneration; Destructive Joint Disease: knees and hips; Loss of Muscle Mass: Sarcopenia; Cognition / Mental Health)
Slower recovery
Longer hospital stays
Hospital readmission
Premature institutionali-zation
Increased morbidity & mortality
Poor appetite
Depression & anxiety
Sleep disturbance
Low stamina
WITHOUT ADEQUATE HEALTHY, SAFE FOOD AND NUTRITION SERVICES

Threatens Independence Reduces Quality of Life Increases Healthcare Costs
Limits Muscle Strength Reduces Stamina Prevents Physical Activity
Decreases ability to:Perform ADLs & IADLs: Eat, Walk, Grocery Shop, Prepare Meals
Grip Items & Lift Heavy Objects
Increases Dependency Increases Need for Caregiver AssistanceIncreases Risk for Falls & Fractures
MalnutritionMalnutritionUnderweightUnderweight ObesityObesity
IMPACT OF MALNUTRITION ON FUNCTIONALITY
2020


Solutions?
• Access to coordinated, comprehensive food and nutrition services
• Federal food and nutrition programs▫SNAP▫OAA▫CSFP▫CACFP▫SFMNP▫TEFAP - Local food banks and pantries

SNAP and older adults

Barriers to SNAP participation
•Perceived low benefits▫In 2009, actual monthly benefit for 60+ was
$102
•Less aware of eligibility requirements
•Stigma
•Mobility/technologyhttp://frac.org/initiatives/addressing-senior-hunger/seniors-and-snapfood-stamps/
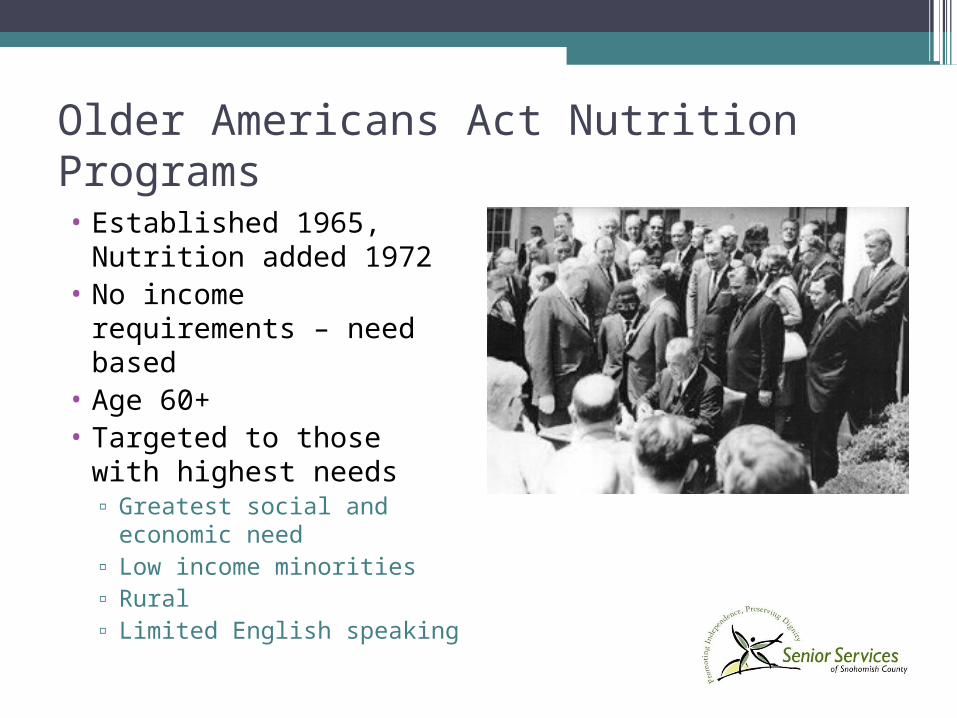
Older Americans Act Nutrition Programs• Established 1965,
Nutrition added 1972• No income
requirements – need based
• Age 60+• Targeted to those with
highest needs▫ Greatest social and
economic need▫ Low income minorities ▫ Rural▫ Limited English speaking

More than a meal….•Nutrition Services – includes meals,
nutrition screening, assessment, education, Medical Nutrition Therapy to older adults and caregivers
•Socialization and access to services
•Promote independence….Aging in Place

OAA Purpose
• Reduce hunger and food insecurity
• Promote socialization of older individuals
• Promote the health and well-being of older individuals through disease prevention and health promotion services

OAA Home Delivered Meals • Age 60+
• Spouse of any age
• Homebound
• Lacking support
• Unable to prepare own meals

OAA Congregate Meals• Age 60+ (Native
Americans, 50+)
• Spouse of any age
• Younger disabled person living with eligible person

OAA Participant Profile• 66% - meal provides half
of daily intake
• Half are at nutrition risk
• 84% need help with IADLs
• 1:3 Meals on Wheels clients need help with 3+ ADLs and are nursing home eligible
• 8% congregate, 19% HDM use SNAP
• 61% live alone
• 73% age 75+
• 29% rate own health as poor
• 58% HS grad, 7% college
• One-third at or below poverty level; 85% low income (< $20,000)

The problem with funding…

Commodity Supplemental Food Program•Low income
▫Pregnant and breastfeeding women▫Other new mothers <1 yr postpartum▫Infants and kids up to 6 yrs▫Age 60+
•Older adults have to be poorer ▫< 130% poverty for older adults▫<185% poverty for all others

Commodity Supplemental Food Program• Food packages include:
▫ Infant formula and cereal
▫ NFDM and UHT fluid milk; juice
▫ Cereals, rice, pasta
▫ Peanut butter, dry beans
▫ Canned meat/poultry/fish
▫ Canned fruits/vegetables
• In 36 States and 2 Tribal Organizations
• Serves >518,000 per year▫ 96% are age 65+
• But….the quantities are often impractical for 1-2 person households

Child and Adult Care Food Program• Low income children
• Functionally impaired adults or age 60+
• Serves 3.2 M children, 112,000 adults
• Reimbursement tiers as in free/reduced/full school meals
• Federally regulated, State administered

Senior Farmers Market Nutrition Program• Goal: Help farmers and improve
nutrition for seniors
• Age 60+, income < 185% poverty
• Washington State• Served 20,700 people in 2013• $40/year per person

TEFAP•3 million seniors served by Feeding America
•18.6% households have 1 member age 65+
•Difficult choices▫30% chose between food and medical care▫35% chose between food and paying for
heat/utilities

Barriers to Participation •Lack of awareness
•Reluctance to accept help
• Inadequate funding of programs, wait lists
•Lack of transportation

Getting By with Federal Nutrition Assistance
• BK - 79 years old• Widow• Generally good health, overweight, hypertensive,
arthritis• Worked part-time• Lives alone, has children who live near by• Relies on husband’s social security and small
pension
Wellman, N.S. & B. Kamp. Federal Food and Nutrition Assistance Programs for Older People. Generations. Fall. 2004

DESCRIPTIONMonthly Income
Monthly Expenses
Social Security $920
Widow’s Pension $420
Rent $600
Food $155
Utilities $120
Misc., transportation, clothing, etc. $ 80
Health insurance $157
Drugs/Medications $ 80
Medical Services $ 50
Medical Supplies $ 14
BALANCE $84
FEDERAL NUTRITION ASSISTANCE
OA Nutrition Programs: Value of meals $100
Food Stamps $ 50
CSFP: Actual retail value generally higher $ 17
SFMNP: $40 annual benefit divided by 12 $ 3
TOTAL VALUE $170
BK’s Finances

Other services available•Senior Information and Assistance/Referral
▫Connects older adults to services
•SHIBA▫Information about affordable health care
•Elder Abuse Prevention
•Call your local Area Agency on Aging or use the Eldercare Locator 800-677-1116

One last note on funding…..
•OAA▫Serves < 5% of
older adults
▫$125 M in 1975
▫$816 M in 2012
•7-fold increase
•WIC▫Serves 53% of all
infants born in the US
▫$20.6 M in 1974
▫$7.1 B in 2012
•344-fold increase
Nutrition and Aging ResourcesUS Administration on Aging
www.aoa.gov www.gpra.net
• Food and Nutrition Programs for Community-Residing Older AdultsPosition of the American Dietetic Association, the American Society
for Nutrition, and the Society for Nutrition Education – March 2010http://www.eatright.org/About/Content.aspx?id=6442451115
Position of the Academy of Nutrition and Dietetics: Food and Wellness for Older Adults: Promoting Health and Wellness 2012 http://www.eatright.org/About/Content.aspx?id=8374