25
Hurricane Harvey Relief Fund Needs Assessment Phase One

Hurricane Harvey Relief Fund Needs Assessment Phase One

November 2017.
Produced on Behalf of the Greater Houston Community Foundation and the Hurricane
Harvey Relief Fund
Rice University Kinder Institute for Urban Research
MS 208 6100 Main St., Houston, Texas 77005
Telephone: 713-348-4132
http://kinder.rice.edu
For more information, contact us at [email protected].
Copyright ©2017 by Rice Kinder Institute for Urban Research. All rights reserved.
Contributors: Jie Wu, Mingming Zhang, Carlos Villegas, Samantha Love, Grant Patterson,
Jesseca Lightbourne, Kyle Shelton and Katya Wowk (Harte Research Institute)

Contents
Executive Summary 4
FEMA Individual Assistance Data with 211 and 311 5
211 Calls 5
FEMA Individual Disaster Assistance (IA) 9
FEMA Individuals and Households Program (IHP) -- Housing Assistance 12
311 Service 14
Relief and Recovery Funding Primer 16
Vulnerable Populations 22

4 Kinder Institute for Urban Research
Executive SummaryThe following document represents the first phase of the Kinder Institute for Urban Research’s needs assess-ment work on behalf of the Greater Houston Community Foundation and the Hurricane Harvey Relief Fund. This fund was jointly created by Harris County Judge Ed Emmett and Houston Mayor Sylvester Turner to accept private donations to aid in hurricane relief and recovery.
This document includes an analysis of 211, 311, and Federal Emergency Management Agency (FEMA) Individual Assistance (IA) data. These three datasets begin the process of identifying key needs post-Harvey and areas that were hardest hit. This analysis is the first step in what will be a much deeper damage assessment intended for phase two.
Also contained here is a relief and recovery funding primer and discussion of post-storm vulnerable popula-tions rounds out this document. These pieces intend to inform the Advisory Board of what needs federal, state, and local funding have provided and will provide going forward. Knowing this should allow for more direct deci-sion-making about the most effective use of philanthropic funds. The vulnerable populations section discusses some of the challenges certain populations face in trying to access relief and recovery resources.
Key Findings: • 211/311/FEMA data show a definite impact in the
west part of Harris County toward the reservoirs, to the northeast of downtown Houston, and to the southeast of downtown Houston.
• Concentrated areas with the most 211 calls are similar to those with high numbers of FEMA registrants. However, no such pattern exists with 311 when it is compared to either 211 or FEMA registrants.
• FEMA data also shows that the approval rate for renters is much lower than for homeowners. Renters, especially those without proof of residency such as a lease, have a far more difficult time securing FEMA assistance.
• Food aid and Disaster Supplemental Nutrition Assistance Program (DSNAP) assistance, shelter needs, and direct housing assistance are consistent needs across 211, FEMA data, and the completed needs assessments from other organizations. These needs have remained at the top of requested needs since the beginning of the storm.
• At the same time, the process for allocating DSNAP (food assistance), Red Cross assistance (direct aid), and FEMA individual assistance have all received criticism locally. There are gaps in ensuring that affected populations are aware of and have access to these forms of assistance.
• No comprehensive door-to-door surveys have been conducted to identify impacted individuals or to ensure that all impacted understand the relief and recovery options available to them.
• Numerous residents, especially the elderly or immi-grants, living in smaller pockets of the city have not registered for FEMA or other forms of assistance. Many continue to live in damaged homes.
• The deadline to apply for FEMA and Small Business Administration (SBA) assistance has been extended until November 24, 2017. Efforts intended to aid vulnerable populations in the navigation of the regis-tration system could help bring resources to affected groups.
• Few large scope needs assessments are underway. Many data collection efforts are either focused on smaller areas or populations or on tracking the services individual non-profits or organizations are providing to clients.
• Federal funding mechanisms paid for through the pending supplemental allocation from Congress such as the bulk of funding for Community Development Block Grant Disaster Recovery Funds (CDBG-DR), will not bring major recovery dollars to the region for upwards of 12-18 months. This will likely put major strains on the regional housing supply.
• Some near-term funding, such as FEMA direct housing aid and smaller amounts of HUD dollars, will begin to flow in the coming weeks and provide access to manufactured homes and home repairs. However, FEMA funding is only available to FEMA registrants, leaving undocumented populations who cannot qualify for FEMA aid and those populations likely to be under-registered for FEMA (elderly, people with disabilities, low-income populations, renters, and immigrants) without many options.
Harvey Needs Assessment: Phase I 5
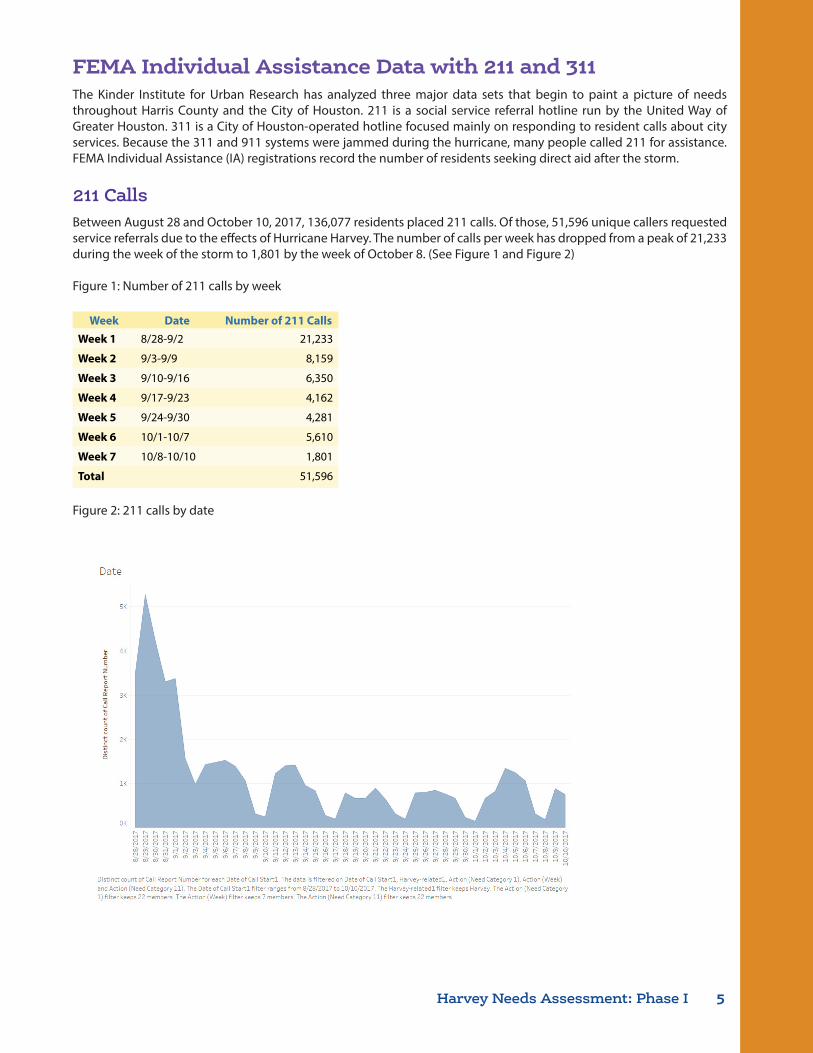
FEMA Individual Assistance Data with 211 and 311The Kinder Institute for Urban Research has analyzed three major data sets that begin to paint a picture of needs throughout Harris County and the City of Houston. 211 is a social service referral hotline run by the United Way of Greater Houston. 311 is a City of Houston-operated hotline focused mainly on responding to resident calls about city services. Because the 311 and 911 systems were jammed during the hurricane, many people called 211 for assistance. FEMA Individual Assistance (IA) registrations record the number of residents seeking direct aid after the storm.
211 CallsBetween August 28 and October 10, 2017, 136,077 residents placed 211 calls. Of those, 51,596 unique callers requested service referrals due to the effects of Hurricane Harvey. The number of calls per week has dropped from a peak of 21,233 during the week of the storm to 1,801 by the week of October 8. (See Figure 1 and Figure 2)
Figure 1: Number of 211 calls by week
Week Date Number of 211 CallsWeek 1 8/28-9/2 21,233
Week 2 9/3-9/9 8,159
Week 3 9/10-9/16 6,350
Week 4 9/17-9/23 4,162
Week 5 9/24-9/30 4,281
Week 6 10/1-10/7 5,610
Week 7 10/8-10/10 1,801
Total 51,596
Figure 2: 211 calls by date

6 Kinder Institute for Urban Research
Figure 3: Zip codes and 211 calls
Figure 3 shows the distribution of 211 calls across the service area. Heavy concentrations of calls came near Addicks Reservoir and on the Northeast side of Houston. Figure 4 compares the number of 211 calls by zip code to both FEMA IA registrants and 311 calls. There is clear overlap between 211 call volume and FEMA IA registrants.
Figure 4: Zip codes with greatest number of 211 calls (with FEMA and 311)
Zip code Name of the NeighborhoodNumber of 211
CallsNumber of FEMA IA
registrantsNumber of 311
Calls
77028 Trinity/Houston Gardens, East Houston 1,207 5,939 1,168
77084 Bear Creek, Cullen Park near Addicks Reservoir
1,202 12,538 249
77016 East Little York/Homestead 1,176 6,798 1,231
77088 Inwood Pines, Acres Homes 1,167 7,307 990
77044 Area near Lake Houston and Sheldon Lake
1,156 8,204 43
77090 Cypress Station 1,120 8,031 18
77026 Kashmere Gardens 1,105 6,212 1,210
211 Needs by week
• Overall, most calls have requested referrals for DSNAP, other food needs, temporary financial aid, shelter, and unem-ployment assistance. Needs changed week-to-week, however, and reflect the process of recovery.

Harvey Needs Assessment: Phase I 7
• Week 1 and Week 2: callers asked for DSNAP, shelter and DRC information, and FEMA disaster assistance registration information.
• Week 3 through Week 5: callers requested temporary financial aid, DSNAP, FEMA registration and DRC information, unemployment assistance, and post disaster cleanup supplies.
• Week 6 through Week 7: callers continued to seek DSNAP information, but temporary housing and utility assistance rose as well.
Figure 5. 211 calls by week and needs category
Week Needs category Number of 211 CallsWeek 1 Disaster food stamps 11,500
Food 2,768
Mass Care Shelters 2,795
FEMA Disaster Assistance Registration 2,494
Disaster Unemployment Assistance 2,354
311/911 757/669
Week 2 Food 2,586
Disaster food stamps 1,682
FEMA Disaster Assistance Registration 1,861
Disaster Unemployment Assistance 1,521
Post Disaster Points of Distribution/Recovery Centers 787
Mass Care Shelters 733
Week 3 Temporary Financial Aid 1,520
Food 1,433
Post Disaster Points of Distribution/Recovery Centers 1,034
FEMA Disaster Assistance Registration 1,009
Disaster food stamps 925
Disaster Relief Organization 719
Disaster Unemployment Assistance 600
Week 4 Disaster food stamps 992
Temporary Financial Aid 941
Food 654
Post Disaster Points of Distribution/Recovery Centers 588
FEMA Disaster Assistance Registration 620
Disaster Relief Organization 344
Disaster Unemployment Assistance 293
Week 5 Disaster food stamps 1,767
Temporary Financial Aid 652
Food 384
Post Disaster Points of Distribution/Recovery Centers 523
Disaster Relief Organization 303
FEMA Disaster Assistance Registration 495
Disaster Unemployment Assistance 235
Disaster related case management 198
Week 6 Disaster food stamps 1,977
Disaster related case management 1,462
Temporary Financial Aid 913
Housing Assistance 276

8 Kinder Institute for Urban Research
Food 264
Utility 249
FEMA Disaster Assistance Registration 453
Post Disaster Points of Distribution/Recovery Centers 346
Week 7 (3 days)
Disaster food stamps 414
Disaster related case management 400
Temporary Financial Aid 337
Utility 228
Housing Assistance 210
FEMA Disaster Assistance Registration 137
Food 121
Figure 6: 211 calls by age group
Figure 6 shows the breakdown of 211 calls by caller age. Figure 7 shows how the requested referrals broke down by age group. Again, food needs, FEMA assistance, and temporary financial aid were consistent needs.
Figure 7: 211 needs by age group
Age (Group)Number of 211
CallsTop Needs Categories
Under 18 81 DSNAP, Food, Mass Care Shelters, FEMA Disaster Assistance
18 to 29 6,605 DSNAP, Food, Disaster Unemployment Assistance, Mass Care Shelters
30 to 49 18,893 DSNAP, Food, Disaster Unemployment Assistance, FEMA Disaster Assistance, Temporary Financial Aid
50 to 64 9,972 DSNAP, Food, Temporary Financial Aid, FEMA Disaster Assistance
65 and over 3,754 DSNAP, Food, Temporary Financial Aid, FEMA Disaster Assistance
N/A 12,085
Refused 206
Total 51,596

Harvey Needs Assessment: Phase I 9
FEMA Individual Disaster Assistance (IA)1
Individual Assistance (IA) is provided by FEMA to individuals and families who have sustained losses due to disasters. Homeowners, renters and business owners in designated counties who sustained damage to their homes, vehicles, personal property, businesses or inventory as a result of a federally declared disaster may apply for disaster assistance.
Figure 8: FEMA IA valid registrations by zip code
There were 436,307 valid FEMA IA registrants for 136 zip codes that cover some part of Harris County as of October 11, 2017. FEMA aggregated these numbers by zip code. Figure 8 shows the density of these requests at the zip code level. Residents of 78 zip codes, roughly 57% of all zip codes in Harris County, submitted at least 2,500 completed applications, showing the reach of the storm. Four zip codes had more than 8,000 applications. (See Figure 9)
Figure 9: Zip codes with highest FEMA IA registration (with 211 and 311)
Zip code Name of the NeighborhoodNumber of FEMA
IA registrants Number of 211
CallsNumber of 311
Calls77084 Bear Creek, Cullen Park near Addicks Reservoir 12,538 1,202 249
77089 Southbelt/Ellington (Brio Superfund Site) 8,928 786 890
77044 Area near Lake Houston and Sheldon Lake 8,204 1,156 43
77090 Cypress Station 8,031 1,120 18
77449 Katy (North of I-10 near Grand Pkwy) 7,715 774 16
77088 Inwood Pines, Acres Homes 7,307 1,167 990
77077 Briarforest east to Barker Reservoir 7,260 548 1,471

10 Kinder Institute for Urban Research
In addition to showing the overall registrations, the IA process also allows registrants to identify major needs that go beyond home damage. Figure 10 displays the distribution of identified needs across several categories. Access and functional needs usually relates to people with disabilities. As with 211, food needs, housing, and emergency needs are at the top of the list.
Figure 10: FEMA IA Distribution of Needs
Figure 11: Zip codes with greatest number of FEMA IA registrations and additional needs
Zip code
Name of the Neighborhood
Number of FEMA IA
registrants
Home Damage
Access / Functional
Need
Utility outage
Auto Damage
Emergency Need
Food NeedShelter
Need
77084 Bear Creek, Cullen Park near Addicks Reservoir
12,538 8,047 315 4,654 1,665 8,179 6,801 4,237
77089 Southbelt/Ellington (Brio Superfund Site)
8,928 6,816 234 2,972 1,542 5,084 4,266 2,469
77044 Area near Lake Houston and Sheldon Lake
8,204 6,230 288 4,127 1,731 5,882 5,179 3,301
77090 Cypress Station 8,031 4,055 319 3,379 1,283 6,265 5,678 2,370
77449 Katy (North of I-10 near Grand Pkwy)
7,715 4,294 213 1,792 760 4,475 4,173 1,250
77088 Inwood Pines, Acres Homes
7,307 4,630 336 2,459 1,105 5,059 4,576 1,623
77077 Briarforest east to Barker Reservoir
7,260 3,601 204 3,187 997 4,798 4,177 2,002

Harvey Needs Assessment: Phase I 11
Heat maps can be created for each needs category. For example, Figure 12 shows those IA registrants who also reported an Access and Functional Need (AFN). The top three zip codes with most registrants who have AFN are 77026, 77016 and 77028.
Figure 12: FEMA IA applications and access and functional needs by zip code

12 Kinder Institute for Urban Research
FEMA Individuals and Households Program (IHP) -- Housing Assistance2
Another way to break down the IA Assistance is to look at the Individuals and Households Program (IHP). This program provides money for necessary housing-related expenses and serious needs that cannot be met through other means. FEMA has provided more detailed breakdowns of those who registered and were approved for IHP funds. This includes breaking it down by renters and owners.
Figure 13 shows that 44% of owners who applied for FEMA housing assistance received some financial assistance. At the same time, only 32% of the larger pool of renter registrants received any funds.
Figure 13: FEMA IHP registrants and approval
Number of Valid
Registrants
Approved for FEMA
Assistance
Total Approved IHP Amount
Owner 178,951 79,389 $478,179,880.70
Renter 260,286 83,324 $128,793,230.00
The average number of valid homeowner registrants for FEMA assistance per zip code was 1,316. The zip codes with the lowest approval rates for housing assistance among homeowners were 77072 (20%), 77014 (22%), 77082 (23%), 77083 (23%), and 77066 (23%).
Figure 14: FEMA IHP valid registrants (owners) by zip code

Harvey Needs Assessment: Phase I 13
Figure 14 displays the zip codes with the highest number of valid owner registrants. This map mirrors the overall breakdown of the IA registrations shown in Figure 8.
Figure 15: Zip codes with greatest number of FEMA IHP homeowner registrants (and 211)
Zip code Name of the NeighborhoodNumber of FEMA IHP registrants
(Owners)Number of 211 Calls
77084 Bear Creek, Cullen Park near Addicks Reservoir
5,631 1,202
77089 Southbelt/Ellington (Brio Superfund Site) 4,869 786
77044 Area near Lake Houston and Sheldon Lake 4,774 1,156
77449 Katy (North of I-10 near Grand Pkwy) 4018 774
77521 East to Lynchburg 3449 718
77099 Alief/Belknap Acres 3098 625
The average number of valid renter registrants for FEMA assistance per zip code was 1,913. The zip codes with the lowest approval rates for FEMA assistance among renters were 77055 (22%), 77040 (23%), 77081 (24%), 77031 (25%), and 77058 (25%).
Figure 16: FEMA IHP valid registrants (Renters) by zip code

14 Kinder Institute for Urban Research
Figure 17. Zip codes with greatest number of FEMA IHP valid renter registrants (and 211)
Zip code Name of the NeighborhoodNumber of FEMA IHP registrants (Renters)
Number of 211 Calls
77084 Bear Creek, Cullen Park near Addicks Reservoir 6,953 1,202
77090 Cypress Station 6,936 1,120
77077 Briarforest east to Barker Reservoir 5,297 548
77082 Oakpark Place, Oak Park Ridge next to Baker Reservoir 5,087 626
77042 Briarforest/Westchase area 4,857 556
77060 Greater Greenspoint 4,796 910
311Between August 25 and October 10, 2017, the city received 31,556 calls through the 311 system reporting Harvey-related issues or requesting city services due to the hurricane. Most of the phone calls reported flooding incidents and requested storm debris collection. Drainage issues were also a big component.
Figure 18: 311 calls by zip code
The concentrated areas with the most 311 calls are very different from the areas with the most FEMA IA registrants. As Figure 19 shows, the areas with the most 311 calls are not as tightly connected to the areas with most 211 calls or FEMA registrants.

Harvey Needs Assessment: Phase I 15
Figure 19: Zip codes with greatest number of 311 calls (with FEMA IA registrants and 211 calls)
Zip code Name of the NeighborhoodNumber of 311
CallsNumber of FEMA IA
registrantsNumber of 211
Calls77096 Meyerland & Westbury 2,669 6,077 468
77079 Memorial 2,334 6,360 307
77007 Washington Avenue/Memorial Park, Rice Military
1,549 1,815 135
77009 Near Northside 1,512 2,822 358
77077 Briarforest east to Barker Reservoir 1,471 7,260 548
Figure 20: Number of 311 calls by date
Figure 20 shows a similar declining pattern with the number of overall 311 calls as was seen with 211. The lulls in the numbers are weekends. Figure 21 breaks down call types by week and shows a clear focus during week zero on flooding issues. Through October 27, 2017, debris cleanup topped the list of flooding-related issues.
Figure 21: Number of 311 calls by week by service category
Week DateNumber
of 311 Calls
Flooding DrainageStorm Debris
Collection
Street Hazard
Crisis Cleanup
Sewer Wastewater
Water Leak
Week 0 8/25-8/27 2,669 795 345 159 306 296 210 167
Week 1 8/28-9/2 4,033 593 265 781 476 355 564 324
Week 2 9/3-9/9 4,535 839 204 1,126 258 249 594 538
Week 3 9/10-9/16 6,505 1,369 184 2,504 261 343 504 467
Week 4 9/17-9/23 5,782 659 265 2,579 297 207 468 489
Week 5 9/24-9/30 3,884 81 166 1,485 250 55 410 537
Week 6 10/1-10/7 3,083 28 156 980 271 17 372 435
Week 7 (3 days)
10/8-10/10 1,065 5 49 172 114 1 173 225

16 Kinder Institute for Urban Research
The funding of disaster relief and recovery is a compli-cated endeavor. It involves federal, state, and local dollars. The use of those dollars requires the coordination of each unit of government. This primer explains some of the key programs that will be in play during the immediate relief and recovery process for Hurricane Harvey.
Disaster DeclarationInitiated from a request by Governor Abbott, on August 25, 2017 the Trump Administration approved a Major Disaster Declaration for Texas, which triggered allocation of the emergency Disaster Relief Fund (DRF), administered by the Federal Emergency Management Agency (FEMA).
Harvey-Related Federal Funding Allocations
$15.25 billion. September 7, 2017. • The bill allocated $7.4 billion to the DRF; $450 million
for the Small Business Administration’s (SBA) Disaster Loan Program; and $7.4 billion in Community Development Block Grant (CDBG) funding, adminis-tered through the Department of Housing and Urban Development (HUD) for rebuilding and recovery.
• None of this funding was directly earmarked for Texas, but funded programs that did address immediate needs in Texas.
$36.5 billion. October 24, 2017.• Also, not Texas specific. Does not address the $18
billion in aid requested by Texas Congressional leaders on October 5, 2017.3
• $18.7 billion for the DRF; $4.9 billion earmarked for loans to Puerto Rico.
• $576.5 million to respond to wildfires. • $16 billion to erase debt owed by National Flood
Insurance Program, which is facing an influx of claims from the recent hurricanes.
Future Supplemental Funding (Long-term Recovery Funding)
• Pending, likely December 2017. Amount and timing are complicated by other storms, the California wildfires, and political challenges.
• The supplemental request is formulated by Congress based on the damage assessments and needs assess-ments submitted by relevant federal agencies. The federal estimates are likewise informed by state and local assessments.
• On October 31, 2017, Texas Governor Greg Abbott submitted a formal $61 billion request to the federal government. This request is intended to influence the final numbers of the supplemental bill.4
• This request will provide the bulk of long-term recovery funding from the federal government.
• The timeline for distribution of this funding is not immediate. For example, any Community Development Block Grant Disaster Relief (CDBG-DR) money distributed through the Housing and Urban Development Department (HUD) will not likely be available to localities for 12 to 18 months after allocation.
Federal Relief and Recovery Programs
The Disaster Recovery Fund • The DRF is the major source of funding in relief and
recovery. Congress appropriates money each year to this fund to ensure assistance is available to impacted communities. However, the amount appropriated does not usually meet disaster relief and recovery needs, so Congress adds appropriations to the fund on a case-by-case basis. The initial September 7, 2017 allocation included a $7.4 billion allocation for this purpose.
Relief and Recovery Funding Primer
Individuals
Division of Emergency Management
Local Agencies
Individual Assistance
Public AssistanceHMGP
Federal Emergency Management Agency
Immediate Relief
(local administrator of funds)
Harvey Needs Assessment: Phase I 17
• The DRF for Harvey will continue to pay years into the future. For example, DRF obligations are still being paid out for Hurricane Ike recovery.5
Federal Emergency Management Administration (FEMA)
FEMA is the federal government’s first responder to disasters, relying on DRF funds to provide for immediate individual and public needs. It is important to emphasize that grants for Texas residents and business owners for FEMA aid continue to be available until November 24, 2017.6 The aid is concentrated into three main programs.
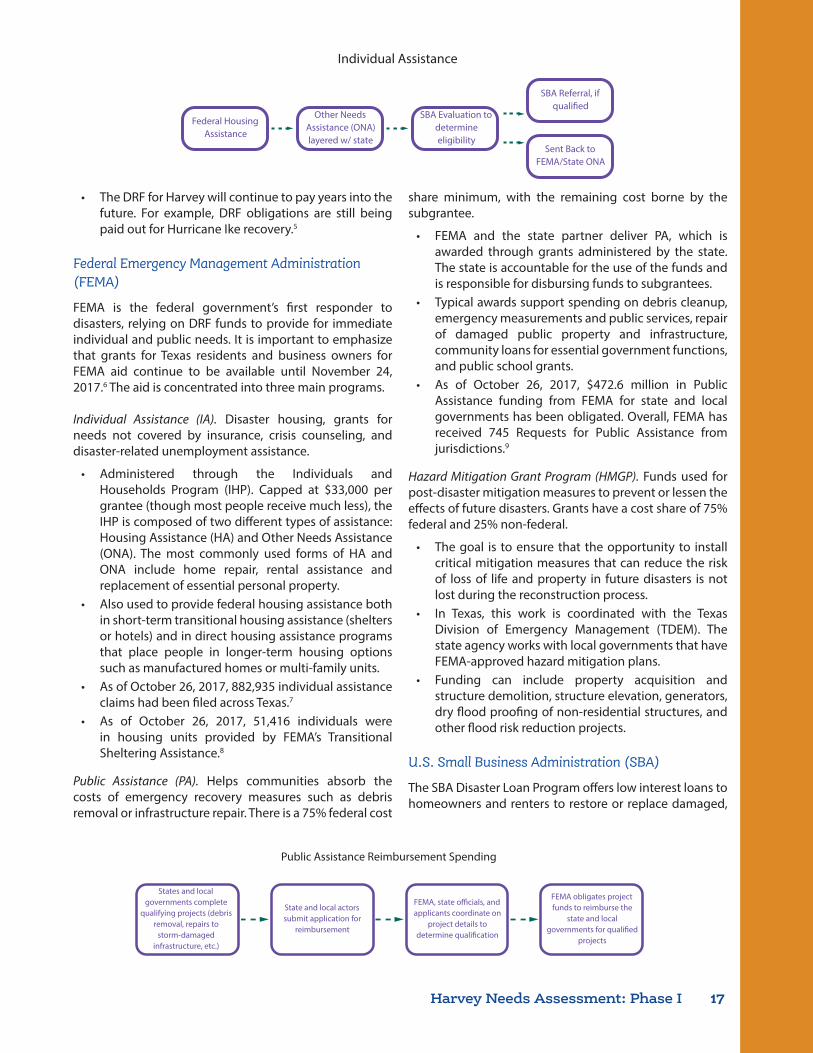
Individual Assistance (IA). Disaster housing, grants for needs not covered by insurance, crisis counseling, and disaster-related unemployment assistance.
• Administered through the Individuals and Households Program (IHP). Capped at $33,000 per grantee (though most people receive much less), the IHP is composed of two different types of assistance: Housing Assistance (HA) and Other Needs Assistance (ONA). The most commonly used forms of HA and ONA include home repair, rental assistance and replacement of essential personal property.
• Also used to provide federal housing assistance both in short-term transitional housing assistance (shelters or hotels) and in direct housing assistance programs that place people in longer-term housing options such as manufactured homes or multi-family units.
• As of October 26, 2017, 882,935 individual assistance claims had been filed across Texas.7
• As of October 26, 2017, 51,416 individuals were in housing units provided by FEMA’s Transitional Sheltering Assistance.8
Public Assistance (PA). Helps communities absorb the costs of emergency recovery measures such as debris removal or infrastructure repair. There is a 75% federal cost
share minimum, with the remaining cost borne by the subgrantee.
• FEMA and the state partner deliver PA, which is awarded through grants administered by the state. The state is accountable for the use of the funds and is responsible for disbursing funds to subgrantees.
• Typical awards support spending on debris cleanup, emergency measurements and public services, repair of damaged public property and infrastructure, community loans for essential government functions, and public school grants.
• As of October 26, 2017, $472.6 million in Public Assistance funding from FEMA for state and local governments has been obligated. Overall, FEMA has received 745 Requests for Public Assistance from jurisdictions.9
Hazard Mitigation Grant Program (HMGP). Funds used for post-disaster mitigation measures to prevent or lessen the effects of future disasters. Grants have a cost share of 75% federal and 25% non-federal.
• The goal is to ensure that the opportunity to install critical mitigation measures that can reduce the risk of loss of life and property in future disasters is not lost during the reconstruction process.
• In Texas, this work is coordinated with the Texas Division of Emergency Management (TDEM). The state agency works with local governments that have FEMA-approved hazard mitigation plans.
• Funding can include property acquisition and structure demolition, structure elevation, generators, dry flood proofing of non-residential structures, and other flood risk reduction projects.
U.S. Small Business Administration (SBA)
The SBA Disaster Loan Program offers low interest loans to homeowners and renters to restore or replace damaged,
Public Assistance Reimbursement Spending
States and local governments complete
qualifying projects (debris removal, repairs to
storm-damaged infrastructure, etc.)
State and local actors submit application for
reimbursement
FEMA, state o�cials, and applicants coordinate on
project details to determine quali�cation
FEMA obligates project funds to reimburse the
state and local governments for quali�ed
projects
Individual Assistance
Federal Housing Assistance
Other Needs Assistance (ONA) layered w/ state
SBA Evaluation to determine eligibility
SBA Referral, if quali�ed
Sent Back to FEMA/State ONA

18 Kinder Institute for Urban Research
uninsured real and personal property at homes and businesses.
• Individuals can take a loan of up to $200,000 at 1.6 percent interest for 30 years. Businesses can take a loan of up to $2 million. Applicants are assessed based on income and ability to repay. If they do not qualify, they are referred back to FEMA for ONA.
• Specific to Hurricane Harvey, the SBA has approved $367 million in low-interest disaster loans to more than 4,340 Texas businesses, homeowners and renters.
• Deadline to apply extended to November 24, 2017
Community Development Block Grant Disaster Recovery (CDBG-DR)
The Housing and Urban Development Department (HUD) runs the CDBG-DR program to support rebuilding efforts. These funds provide flexible funding to localities to spend on housing, infrastructure, and planning efforts after a disaster.
• Critical funding that is intended to pay for both indi-vidual and public needs not covered by insurance, the DRF or SBA.
• These funds typically require that 70 percent of spending be allocated to low-income households or areas. However, this requirement can be altered through a waiver as has been done in some recent disaster recoveries. And the initial bill replenishing the CDBG-DR fund does not require a specific split. The Texas delegation to Congress has requested that HUD shift post-Harvey CDBG-DR to a 50-50 breakdown, which would mean more money could be spent in higher-income areas.10
• HUD recently allocated $58 million in CDBG-DR funding specifically for Harvey recovery. While this flexible funding can support varied recovery activi-ties to meet community needs, given the magnitude of the problem, it is likely the state will target the funding to address housing damages.11
• No major allocation directly to Texas. Would be a key component of the supplemental allocation. This allocation would take between 12-18 months to be distributed.
• The allocation of CDBG-DR funds can either go directly to the state and then is distributed by the Texas General Land Office (GLO) (as was done in for Hurricane Ike recovery) or it can go directly to a municipality or county (as was done in the 2015 Memorial Day flood with Houston.)
National Flood Insurance Program (NFIP)
Created in 1968 and managed by FEMA, the NFIP makes flood insurance available to any homeowner, renter, or business within a participating jurisdiction. Policies are
usually purchased through private insurers and backed by the NFIP. Homes and buildings cannot be built in flood-prone areas without flood insurance and even those outside of floodplains are encouraged to purchase policies.
• Since Harvey, more than 87,000 flood insurance claims have been supported with $608 million in expedited claims payments through NFIP.12
• Only 17% percent of homes in the most affected eight counties have flood insurance. 13
• Today, NFIP does not capture the real risk of living in disaster prone areas, leading to significant program debt as well as a host of other challenges. Even before this year’s storms, the program was deeply in debt to the U.S. Treasury, reaching its $30.4 billion borrowing limit.
State Relief and Recovery Programs
The state serves as an extension of FEMA to provide relief in disaster-impacted areas. The Texas Division of Emergency Management (TDEM) coordinates with FEMA to distribute the initial PA and IA programs.14 Others operate as pass-through agencies for federal funding and coordinate on-ground delivery. For example, the Texas Health and Human Services Commission receives USDA funding (via the DRF) for expanding the Supplemental Nutrition Assistance Program (SNAP) into Disaster-SNAP (DSNAP) and coordinates its dispersal. The state also has
Community Development Block Grant − Disaster Relief
Housing and Urban Development
CDBG - Disaster
Relief
General Land O�ce
information and assessments from
non-federal agencies
Councils of Governments Counties or Cities
Local Disaster Recovery Projects

Harvey Needs Assessment: Phase I 19
several available approaches to funding and responding to a disaster.
State of Texas Disaster Relief Fund
Governor Abbott has approved the spending of $103 million from the state disaster relief fund. Of this spending, $50 million has already gone to the City of Houston to pay for debris removal, $43 million for the National Guard, and $10 million for public safety expenses.
Rainy Day Fund
Texas also has a budget stabilization fund, commonly known as the “Rainy Day Fund” with broad potential appli-cation. Governments typically use such funds to respond to emergencies and avert interruptions to normal services and activities. The State of Texas closed FY2016 with $9.7 billion in its rainy day account.15
• This fund has not been used for recovery to this date (November 3, 2017). To do so, the Governor would need to call a special session of the legislature or take up the matter in the next regular session scheduled for 2019.
FEMA Public Assistance Reimbursement Spending
State and local agencies coordinate requests of PA and then pay those costs up front looking for reimbursement. In Houston, debris removal was an example of this, with the state providing some funding to augment the City’s spending. FEMA PA reimbursement should compensate both. FEMA pays 75%, local 25%.
Disaster Unemployment Assistance (DUA)
The Texas Workforce Commission provides DUA. It is paid for through state collected employer’s taxes. Enrollment in DUA is open during the formal Disaster Assistance Period. Weekly payments are made to recipients throughout the assistance period based on previous wages.
• To be eligible, applicants must be:• Unemployed as a result of the disaster (injury or
closed place of work) • Legally authorized to work in the United States.
• Deadline to apply was October 31, 2017.
State Agencies as Pass-Through or Coordinator.• CDBG-DR. When the supplemental recovery bill
is passed, HUD will allot the funds via the Federal Register and designate their management to either the state or directly to local jurisdictions. If the state is designated, the GLO will likely be the responsible agency as it was in both stages of recovery funding after Hurricane Ike. If GLO is designated, it will create
an action plan for CDBG-DR money and distribute the funds to localities via local councils of government.
• Texas Rebuilds Direct Housing. Funded by FEMA and administered by the GLO. This program provides longer-term housing to those who applied for FEMA assistance. Though run by the state it is locally admin-istered by the Houston-Galveston Area Council in Harris County and by the Housing and Community Development Department in the City of Houston.
• This program provides support to eligible applicants in the form of direct leasing of homes, leasing of multi-family housing units, the provision of manufac-tured homes, and partial repair programs.16 • Funding for this program is being released now,
but full distribution will likely take 3-6 months.• Restricted to accepted FEMA applicants
• Disaster Supplemental Nutritional Assistance Program (DSNAP). The Texas Health and Human Services Commission oversees the application process and dispersal of the U.S. Department of Agriculture’s DSNAP program. The program provides direct monetary assistance for the purchase of food. • To qualify, applicants must not already be
receiving SNAP, live in a declared disaster zone, and have been negatively impacted by the storm – home damage, loss of income, temporary shelter expenses, clean-up expenses, personal injury.17
• Initial estimates are that nearly 932,000 individ-uals applied for DSNAP in Harris County.18 As reference, the existing number of SNAP recipi-ents in Harris County is 197,818 according to the American Community Survey
• Deadline to apply was October 20, 2017.
Local Government Funding and Programs
Local governments have immediate methods to respond to disaster such as tax rate increases and contingency funds but they also rely on state and federal programs during recovery.
Tax Rate Increase
In wake of Hurricane Harvey, Houston Mayor Turner proposed a tax increase of nine percent, which would have generated approximately $113 million to cover expenses for debris removal and to ensure the City had adequate matching funds for PA funds from FEMA. Mayor Turner rolled back this proposal after Governor Abbott allocated $50 million from the state’s Disaster Relief Fund to cover debris cleanup efforts.
Local Contingency Funds
Similar to the state’s Rainy Day Fund, local municipali-ties can set aside money in a budget stabilization fund

20 Kinder Institute for Urban Research
to preserve operations of government in the event of a disaster.
• Harris County has a Public Improvement Contingency Fund to assist with capital projects and unforeseen catastrophic events.
• The City of Houston sets aside $20 million (approxi-mately one percent of the operating budget) in the event of an emergency. • This funding was appropriated by the City
Council immediately after Harvey to help pay for debris cleanup.
Philanthropy
A significant component to filling the holes left by public funding will be the efforts of philanthropy. Several major relief funds were set up in the wake of the storm and those funds have been actively providing funding to non-profits and individuals.
United Way of Greater Houston – $49.54 million• Basic Needs Grants: $2,381,340
• Utilized to provide assistance in rent/mortgage, temporary housing, assistance, utilities, food, health care, and transportation
• Approximately 20,000 households will be served. • System Support Grants: $375,000
• Designed for organizations serving the overall system of care. Support the system of food, Spanish translators for traveling doctors, regis-tered nurses and medical assistants.
• Case Management: $2,920,000• Disaster Case Management funding to assess
client needs, organize and coordinate client resources, develop goal-oriented plans to achieve recovery, and monitor client progress toward reaching recovery plan goals.
• Approximately 6,000 households will be served.• Minor Home Repair Program: Pending Amount
Announcement• United Way will be making a large pool of funds
available for minor home repairs through its relief fund. This work will be directed by local non-profits and United Way will help support staffing needs.
• Total Disaster Response to date: $5,676,340
JJ Watt Foundation – $37 million • SBP – To rebuild homes• Save the Children – For child care and afterschool
programs• Feeding America – To distribute food• Americares – To address health needs• Total Disaster Response to date: $30 million
Greater Houston Community Foundation Hurricane Harvey Relief Fund $90 million
• Fund jointly created by Harris County Judge Ed Emmett and Houston Mayor Sylvester Turner to accept private donations to aid in hurricane relief and recovery
• Funding to nonprofit organizations working with traditionally vulnerable and underserved populations.
• Funding has been concentrated on focus areas related to basic needs, emergency financial assistance, home repair, temporary housing, case management, and counseling services.
• Total Disaster Response to date: $7,551,825
Rebuild Texas – $78.3 million• Focused on the long-term recovery and rebuilding of
Texas. Working with local communities for immediate needs, emerging gaps, and to support communi-ty-led priorities during recovery.
• Focus area for project funding includes health and housing, schools and childcare, and workforce and transportation.
• Total Disaster Response to Harris, Montgomery, and Waller Counties: $729,000
• Total Disaster Response to date: $2,154,000

Harvey Needs Assessment: Phase I 21
Initial assessments are conducted, the Governor
requests and the President approves major disaster
declaration.
Local governmental and philanthropic actors support e�orts to meet outstanding need.
Local, regional, state, nongovernmental, and
philanthropic actors assess remaining damage.
Congress allocates supplemental funds to
DRF, FEMA, HUD, SBA, and other federal agencies
Federal agencies coordinate grants with either state agencies or
localities.
FEMA, state and local agencies, philanthropic
groups, and private insurers provide immediate relief.
Local, regional, and state agencies assess remaining
damage and appeal to Congress for additional
funds.
Disaster Recovery Process
22 Kinder Institute for Urban Research
VULNERABLE POPULATIONSThe following is a discussion of the most vulnerable popu-lations after the storm. A number of populations cannot qualify for or have trouble accessing relief and recovery programs. Identifying those gaps can help direct philan-thropic dollars where they are most needed.
Vulnerable populations, according to the National Response Framework, are
“Populations whose members may have additional needs before, during, and after an incident in functional areas, including but not limited to: maintaining independence, communication, transportation, supervision, and medical care. Individuals in need of additional response assistance may include those who have disabilities; who live in institu-tionalized settings; who are elderly; who are children; who are from diverse cultures; who have limited English proficiency; or who are non-English speaking; or who are transportation disadvantaged.”
Using that definition, this report identifies the following populations as those most vulnerable to the impacts of Hurricane Harvey.19 These populations are by no means an exclusive list of populations in need of help or are currently under-served by recovery efforts, but rather a list of populations traditionally under-served during natural emergency disasters and recovery.
Vulnerable populations face information gaps and disproportionate responses largely from a lack of cultural competence in traditional emergency management protocols. Cultural competence is the ability to effectively communicate with heterogeneous populations. These groups face physical or social conditions that render them vulnerable to natural disasters and they are often rarely integrated into preparation, rescue, recovery, resilience, and mitigation efforts.
These populations are excluded from recovery both in explicit – by law or bureaucratic guidelines – and implicit – under-registration for aid, lacking legal assistance – ways.
Economically Disadvantaged Populations• The quality and speed of one’s recovery is driven by
the resources a population can access. • During recovery for Hurricane Katrina, economi-
cally disadvantaged populations held a high rate of distrust of the government, leading to less engage-ment with services. At the same time, government engagement throughout the disaster neglected these same groups. The combination led to major under-service issues.20
• Economically disadvantaged populations are more likely to rent than own homes, making them less likely
to benefit from insurance and resources available to homeowners.21
Ethnic and Racial Populations• Although race and ethnicity by themselves do not
establish vulnerability, barriers to obtaining and understanding information can be amplified by language or cultural practices. A lack of cultural competence on behalf of public entities worsens these barriers.
• Subpopulations can suffer from a lack of ties to their surrounding community and decision-makers, making accessing services more difficult.
• A large underserved population in the Houston region are undocumented individuals. The Houston Immigration Legal Services Collaborative identifies the following populations not eligible for FEMA assistance:• Undocumented Immigrants• Those with work, student, or travel visas• Those with temporary protected status• Those with Deferred Action for Childhood
Arrivals status• Individuals with temporary social security
numbers pending asylum petitions. • Children with legal status can qualify for FEMA aid,
even if the remainder of their household is undocu-mented. However, the U.S. Department of Homeland Security does not guarantee that applying will not jeopardize the position of an undocumented family member. This leads many undocumented families with legal family members to be fearful of seeking assistance.
• Migrant workers are also more likely to move into a disaster area to seek work opportunities during recovery; these individuals are vulnerable to being taken advantage of. During Hurricane Katrina, these individuals were lodged in deplorable conditions and hazardous work conditions and then were denied pay.22
Disabled Populations• This population generally faces shortfalls in
pre-emergency organization, including obtaining adequate medication and resources, having a reliable community network, receiving information about disasters and evacuation via traditional communica-tions strategies, reaching family or caregiver profes-sionals, and transportation issues to shelters.
• People with disabilities, including mental disabili-ties, often have trouble accessing shelters or other resources. In the aftermath of Hurricanes Katrina and Rita, many were turned away from shelters and those in shelters were kept in debilitating conditions.23
Elderly Populations

Harvey Needs Assessment: Phase I 23
Vulnerable Population Sub-CategoryHarris County Estimates of
Population Size[i]
Economically Disadvantaged Populations
Low to Moderate Income Renters/Owners N/A
Renter-occupied housing units (households) 675,882
Population below poverty level 774,568
Household receiving food stamps/SNAP 197,818
Unemployed 168,689
Without health insurance coverage 1,020,251
Homeless, sheltered 2,287[ii]
Homeless, unsheltered 1,078[iii]
Ethnic and Racial populations (transitional or temporary populations)
Undocumented 376,000[iv]
Undocumented ages 15 and older who reside with at least one U.S.-citizen child under 18
125,000[v]
Refugees N/A
Limited English-speaking households 178,157
Disabled Population Population with a disability 402,965
Number of FEMA valid registrations where an applicant reported they have Access and Functional Need (AFN)
63,713
Elderly Population 65 years and over (26.1% living alone) 389,431
Pediatric Population (children)
Pregnant Women N/A
Population under 18 years 1,190,283
Children in households (under 3 years) 195,967
Children in households (3-11 years) 617,094
Adolescents (12-17 years) 375,725
Population residing in unincorporated area
1,942,000[vi]
Total County Population 4,356,362
[i] Source: 2011-2015 American Community Survey 5-Year Estimates.
[ii] Source: The 2017 Homeless Count organized and led by the Coalition for the Homeless in consultation with the University of Texas School of Public Health and the Houston Department of Health and Human Services.
[iii] Ibid.
[iv] Source: Migration Policy Institute (MPI) analysis of U.S. Census Bureau data from the 2014 American Community Survey (ACS), 2010-2014 ACS pooled, and the 2008 Survey of Income and Program Participation (SIPP) by James Bachmeier of Temple University and Jennifer Van Hook of The Pennsylvania State University, Population Research Institute.
[v] Ibid.
[vi] Harris County Office of Budget Management, Population Report, February 2016.

24 Kinder Institute for Urban Research
• Elderly populations generally have a plethora of resources in emergency management protocol, however, they are also some of the first victims of a natural disaster. Issues related to preparedness with this population persist and creating action steps in times of disaster are lacking.24
• For nearly 6 months after Katrina, elderly populations continued to experience higher levels of aggravated health, strain and psychological stress.25
• Older adults often suffer from a profusion of chronic disease and financial constraints. Elderly individuals need added attention because of these vulnerabilities.
Pediatric Populations• The root of children’s vulnerability is their inability
to provide for their own basic needs. Generally, resources made available for children are an extension of resources given to adult populations.
• Improved collaboration with organizations and programs working with children can help monitor and evaluate the needs of this population.
• Pregnant women and infants need the attention of immediate medical care throughout their gestation period. Natural disasters disrupt the continued public health and medical infrastructure necessary for prenatal, intrapartum, and postpartum health.26
• The impact of natural disasters is long-standing; estimates of a study five-years post-Katrina estimate displaced children were 4.5 times more likely to have symptoms consistent with Serious Emotional Disturbance (SED) than comparable peers.27
Rural and Unincorporated Populations• Populations living in rural and unincorporated areas
generally face socioeconomic and geographical chal-lenges tied to lack of basic city services. These areas are often on septic systems and individual water treatment systems.
• Jurisdictional control of these areas is often a mix of county and special district government (such as municipal electricity or water districts) control. Some cities such as Houston have a modicum of control over areas within their extra-territorial jurisdiction. This overlapping situation ca make identifying which jurisdiction is responsible for response unclear, slowing relief and recovery.
• A primary challenge of addressing needs of residents living in rural and unincorporated areas is physical distance to relief and recovery resources.
Limited English Proficiency• As an example, Spanish-speaking populations are
generally lumped together when resources are disseminated in their native language. However,
decision makers must consider heterogeneity in national origin, vocabulary, and experience.
Observed Shortfalls • Red Cross’s Hurricane Harvey Immediate Assistance
Program has received a lot of public criticism because people are being denied assistance without a clear explanation for denial. Despite fitting all of the criteria for approval for cash assistance, applicants are being denied because Red Cross uses a private damage assessment to determine eligibility.
• For example, renters and individuals that have lived in the area for less than a year may be denied if their current address cannot be confirmed.
• Disaster Supplemental Nutrition Assistance (DSNAP), is a short-term food assistance program to benefit the families impacted by a recent disaster. During the Harris County dissemination of DSNAP, there were complaints of long lines and about the relatively short amount of time the program was available to Harvey victims.
• Numerous door-to-door canvassing actions have found several people who fall into the list of vulner-able populations who have not sought assistance or registered the damage of their homes with FEMA.
The true impact of Hurricane Harvey on Houston’s vulner-able populations may not be well known until a compre-hensive damage assessment is carried out. Although time and resource intensive, a door-to-door damage assess-ment is necessary to ensure all populations are reached and damage is documented. Further, there needs to be a greater push for legal assistance throughout this process. A lot of under-registration and misinformation could be resolved through case management and legal aid. The vulnerable populations are also those most likely to be detrimentally impacted by the slow pace of federal aid for housing.

Harvey Needs Assessment: Phase I 25
Endnotes
1 See Disaster Grants available through Texas Health and Human Services: https://hhs.texas.gov/about-hhs/communications-events/news/2017/08/disas-ter-grants-now-available and through the SBA https://www.sba.gov/funding-programs/disaster-assistance
2 The dataset used for this analysis is primarily composed of data from Housing Assistance Program reporting authority from FEMA registration renters and property owners within the zip code where the registration is valid. Data was retrieved from fema.gov on October 31, 2017. FEMA and the Federal Government cannot vouch for the data or analyses derived from these data after the data have been retrieved from the Agency’s website(s).
3 https://www.cornyn.senate.gov/sites/default/files/Texas%20Delegation%20Joint%20Letter%20to%20Appropriations.pdf
4 Commission to Rebuild Texas, October 31, 2017. https://www.rebuildtexas.today/texas-seeks-61-bil-lion-for-harvey-damages-to-public-infrastructure/
5 Disaster Relief Fund: Monthly Report as of September 30, 2017. Final Report to Congress for Fiscal Year 2017.
6 See Disaster Grants available through Texas Health and Human Services: https://hhs.texas.gov/about-hhs/communications-events/news/2017/08/disas-ter-grants-now-available and through the SBA https://www.sba.gov/funding-programs/disaster-assistance
7 Commission To Rebuild Texas Update: Issue 7, https://gov.texas.gov/news/post/commission-to-rebuild-texas-update-issue-7
8 Ibid.
9 Ibid.
10 Letter from the Texas Congressional Delegation to HUD Secretary Ben Carson, September 21, 2017. https://www.cornyn.senate.gov/content/news/cornyn-cruz-lead-bipartisan-letter-urging-hud-speed-allocation-harvey-relief-funds
11 Elliot, R. “HUD allocates initial $58 million for Harvey recovery,” Houston Chronicle, October 20, 2017
12 https://www.fema.gov/news-release/2017/09/22/historic-disaster-response-hurricane-harvey-texas
13 Long, H. “Where Harvey is hitting hardest, 80 percent lack flood insurance,” Washington Post, August 29, 2017.
14 State of Texas Emergency Management Executive Guide, 2017.
15 https://comptroller.texas.gov/economy/fiscal-notes/2016/september/rainy-day.php
16 www.texasrebuilds.org
17 https://www.disasterassistance.gov/get-assistance/forms-of-assistance/5778/0/d05
18 Straw, B. “D-SNAP Program Extended In Harris County,” Houston Public Media, October 16, 2017.
19 The list builds from vulnerable populations identified by the Association of Schools of Public Health during Hurricane Katrina (Wingate et al., 2007), as identi-fied through normative distributive justice arguments by legal scholar Sharona Hoffman (2008), the joint human
vulnerability assessment by the Center for Disease Control (CDC) and the Agency for Toxic Substances and Disease Registry, and the CDC Social Vulnerability Index (SVI).
20 Hoffma n, S. (2008). Preparing for disaster: Protecting the most vulnerable in emergencies. UC Davis L. Rev., 42, 1491.
21 Ibid.
22 Ibid.
23 Ibid.
24 Wingate, M. S., Perry, E. C., Campbell, P. H., David, P., & Weist, E. M. (2007). Identifying and Protecting Vulnerable Populations in Public Health Emergencies: Addressing Gaps in Education and Training. Public Health Reports, 122(3), 422–426.
25 Ibid.
26 Callaghan, W. M., Rasmussen, S. A., Jamieson, D. J., Ventura, S. J., Farr, S. L., Sutton, P. D., Posner, S. F. (2007). Health concerns of women and infants in times of natural disasters: Lessons learned from Hurricane Katrina. Maternal and Child Health Journal, 11, 307-311.
27 Redlener, I. E., DeRosa, C., & Parisi, K. (2010). Legacy of Katrina: The Impact of a Flawed Recovery on Vulnerable Children of the Gulf Coast.


