I 996 c,Z vice Assessment HURRICANE September 27 - October 6, 1995 U.S. Department of Commerce National Oceanic and Atmospheric Administration National Weather Service Silver Spring, MD June 1996
Transcript
I 996 c,Z v i c e Assessment
HURRICANE
September 27 - October 6, 1995
U.S. Department of Commerce National Oceanic and Atmospheric Administration National Weather Service Silver Spring, MD
June 1996
National Oceanic and Atmospheric Administration Weather Bureau Hurricane Series
ERRATA NOTICE
One or more conditions of the original document may affect the quality of the image, such as:
Discolored pages Faded or light ink Binding intrudes into the text
This has been a co-operative project between the NOAA Central Library and the Climate Database Modernization Program, National Climate Data Center (NCDC). To view the original document contact the NOAA Central Library in Silver Spring, MD at (301) 71 3-2607 x124 or Libra~y.Keference@,noaa.gov.
Front Cover: NOAA GOES image of Hurricane Opal taken at 4:59 p.m., CDT, on October 4, 1995, as it was making landfall on the Florida Panhandle.
Se mice Assessment
HURRICANE OPAL September 27 - October 6, 1995
U.S. Department of Commerce National Oceanic and Atmospheric Administration National Weather Service Silver Spring, MD
June 1996
Acknowledgments
The excellent efforts of our National Weather Service (NWS) employees under difficult circumstances ensured the safety of the citizens in the path of one of this country's costliest storms. In particular, the National Hurricane Center (NHC) staff worked long, hard hours during the near record setting season, yet continued to produce the excellent information required even near the end of this busy season. The NWS staff along the Gulf coast also had a busy hurricane season with Hurricane Opal being the latest and strongest storm that hit the area in 1995.
Once again, I congratulate those who made the NWS's response to this powerful storm another success story.
-++-Q,\
Dr. Elbert W. Friday, Jr.
June 1996
Preface
The primary purpose of this Service Assessment is to document the evaluation of the NWS's performance in fulfilling its mission of providing timely warnings and accurate forecasts for Hurricane Opal. The NWS's products and services used by emergency management planners are key to preparedness for and the mitigation of a tropical cyclone's impact. With the NWS modernization and restructuring efforts well underway, this was the first hurricane season experienced by some of the spin-up offices. In one case, NEXRAD (Next Generation Weather Radar) Weather Service Office (NWSO) Greenville-Spartanburg, South Carolina, had taken over warning responsibility only days before the remnants of Opal caused flooding and spawned tornadoes in their area. The additional Weather Surveillance Radars-1988 Doppler (WSR-88D) located throughout the Nation provided more reliable data with which to issue warnings. This was also the first experience with issuing the specific product "Inland High Wind Warnings" for hurricane-force winds. This product was developed to call attention to the dangerous winds associated with a tropical cyclone as the storm moves inland. This Assessment looked closely at these changes to ensure the NWS is making the best use of its resources in serving the American public.
Foreword
This Assessment was compiled by Weather Service Headquarters (WSH) staff from the outstanding reports written by the staffs of the field offices involved in the forecast of Hurricane Opal as well as reports prepared by individuals from organizations outside of the NWS. The NWS had each field office affected by Opal conduct its own survey of the damage and of the services they provided. In addition, assessments were written by the National Centers that provided products and services related to Opal. The field input was consolidated by the regional offices and WSH compiled all the documentation into this Assessment. Employees from the local NWS offices visited the damaged areas and gathered information from state and local officials. The authors of this Assessment are grateful to all those who took time from their urgent duties to provide their impressions of the events and services leading up to, during, and following the storm's onslaught.
The dedication and professionalism displayed by the NWS operational staff as well as other Federal, state, and local employees who remained at their posts under extreme conditions is to be commended. While this document is not intended to chronicle the entire history of the storm and its aftermath, it assesses the NWS's performance and recommends improvements where needed. The many people whose individual and collective efforts saved the lives of their fellow citizens are acknowledged with admiration and gratitude. To all whose participation made the response to Hurricane Opal a success, thank you.
Appendix E Report of Aerial Survey of Hurricane Opal, October 6-7, 1995 . . . . . . E-1 '
Acronyms
AFB AFOS AVN AWIPS AWSC CDT CWA DEM EDT ESPN Eta FEMA ft GEMA GOES HLS HPC kts m mb MIC mph MSL NAWAS NCEP NDBC NEXRAD NGM NGWLMS NHC nm NOAA NOS NOW NWR NWS NWSFO NWSO NWWS OGB PPS
Air Force Base Automation of Field Operations and Services Aviation Model Advanced Weather Interactive Processing System Agricultural Weather Service Center Central Daylight Time County Warning Area Department of Emergency Management Eastern Daylight Time Entertainment and Sports Programming Network Eta Model Federal Emergency Management Agency feet Georgia Emergency Management Agency Geostationary Operational Environmental Satellite Hurricane Local Statement Hydrometeorological Prediction Center knots meter millibar Meteorologist in Charge miles per hour Mean Sea Level National Warning System National Centers for Environmental Prediction National Data Buoy Center Next Generation Weather Radar Nested Grid Model Next Generation Water Level Measurement System National Hurricane Center nautical miles National Oceanic and Atmospheric Administration National Ocean Service Short Term Forecast NOAA Weather Radio National Weather Service NEXRAD Weather Service Forecast Office NEXRAD Weather Service Office NOAA Weather Wire Service Operational Guidance Branch Precipitation Processing System
Principal User Processor Quantitative Precipitation Forecast Sea, Lake, and Overland Surge from Hurricanes Storm Prediction Center Southern Region Headquarters Severe Weather Outlook-Day 1 Severe Weather Outlook-Day 2 Severe Weather Outlook-Mesoscale Convective Discussion Tropical Prediction Center U.S. Geological Survey Coordinated Universal Time Warning Coordination Meteorologist Weather Service Headquarters Weather Surveillance Radar- 1988 Doppler Severe Local Storm Watch Status Report
Service Assessment Team
This Assessment was produced by having those responsible for each portion of the NWS services provided write their own section. Information was also requested from personnel outside National Oceanic and Atmospheric Administration (NOAA) and those contributions are included as appendices. The individuals primarily responsible for this Assessment are as follows.
National Centers and Headquarters
Max Mayfield, Hurricane Specialist, National Hurricane Center, Miami, Florida.
James H. Henderson, Acting Director, Aviation Weather Center, Kansas City, Missouri.
Michael Eckert, Meteorologist, HydrometeorologicaI Prediction Center (HPC), Camp Springs, Maryland.
Laura A. Cook, Meteorologist, Office of Meteorology, WSH, Silver Spring, Maryland.
Linda Kremkau, Technical Editor, Office of Meteorology, WSH, Silver Spring, Maryland.
Southern Region
Judson W. Ladd, Regional Aviation Meteorologist, NWS Southern Region Headquarters (SRH), Fort Worth, Texas.
Additional input from:
Steven G. Cooper, Assistant Chief of Meteorological Services Division, NWS SRH, Fort Worth, Texas.
Gary Beeler, Warning Coordination Meteorologist.(WCM), NWSO Mobile, Alabama.
Barry Gooden, WCM, NEXRAD Weather Service Forecast Office (NWSFO) Atlanta, Georgia.
Robert Goree, WCM, NWSO Tallahassee, Florida.
Brian Peters, WCM, NWSFO Birmingham, Alabama.
Eastern Region
Harvey Thurm, Regional Hurricanemarine Program Leader, NWS Eastern Region Headquarters, Bohemia, New York.
Additional input from:
Bernard Palmer, Meteorologist in Charge (MIC), NWSFO Columbia, South Carolina.
Steven Naglic, WCM, NWSFO Columbia, South Carolina.
James Weyman, WCM, NWSFO Pittsburgh, Pennsylvania.
Kermit Keeter, Science and Operations Officer, NWSFO Raleigh, North Carolina.
George Lemons, WCM, NWSFO Raleigh, North Carolina.
Gary Szatkowski, Deputy MIC, NWSFO BaltimoreAVashington, D.C.
Barbara McNauglzt Watson, WCM, NWSFO BaltimoreAVashington, D.C.
Barry Goldsmith, Forecaster, NWSFO BaltimoreAVashington, D.C.
Thomas Dunham, WCM, NWSFO Central Pennsylvania.
Thomas Matheson, WCM, NWSO Wilmington, North Carolina.
Wayne Jones, Severe Weather Program Leader, NWSO Greenville/Spartanburg, South Carolina.
Michael Emlaw, WCM, NWSO Roanoke, Virginia.
Stephen Rich, WCM, NWSO Charleston, South Carolina.
Others
E. Jay Baker, Social Scientist and Associate Professor, Department of Geography, Florida State University, Tallahassee, Florida.
William Massey, Hurricane Program Manager, Federal Emergency Management Agency (FEMA) Region IVY Atlanta, Georgia.
William (Billy) Wagner, Jr., Emergency Management Director, County of Monroe, Key West, Florida.
Brian E. Smith, WCM, NWSFO Omaha, Nebraska.
Executive Summary
Hurricane Opal began as a tropical wave that emerged from the west coast of Africa on September 11, 1995, and became a tropical depression about 70 nautical miles (nm) south- southeast of Cozumel, Mexico, on September 27. The depression continued to strengthen and became Tropical Storm Opal on September 30, while centered near the north-central coast of the Yucatan Peninsula. The system gradually strengthened and moved westward into the Bay of Campeche and became a hurricane about 150 nm west of Merida, Mexico, on October 2. Opal then turned toward the north-northeast, accelerated, and rapidly intensified. On October 4, Opal was classified as a category 4 hurricane based on wind speed. Opal then began to weaken and was a marginal category 3 hurricane as the center made landfall at Pensacola Beach, Florida, near 5 p.m., Central Daylight Time (CDT), on October 4.
As the hurricane came ashore, maximum sustained surface winds were estimated at 100 knots (kts) in a narrow swath on the Florida coast near the eastern tip of Choctawhatchee Bay, about midway between Destin and Panama City. The storm surge reached approximately 10 feet (ft) above mean sea level (MSL), and breaking waves on top of the storm surge left debris lines up to 25 ft above MSL. Opal weakened rapidly after moving inland, becoming a tropical storm over southern Alabama and later a tropical depression over southeastern Tennessee. Opal was declared extratropical as it moved northeastward over the Ohio Valley and eastern Great Lakes. It then moved into southwestern Quebec.
Most of the severe structural damage occurred at the coastline, primarily as a result of the storm surge and waves. However, strong winds caused damage up to several hundred miles inland. Opal downed numerous trees and knocked out power to nearly two million people in Florida, Alabama, Georgia, and the Carolinas. Many people in Florida were without water for several days. Insured property damage for the United States was estimated at $2 billion or more, ranking Opal as one of the costliest twentieth century U.S. hurricanes. There were 50 deaths reported as a direct result of Opal in Guatemala and Mexico and 9 deaths in the United States.
Torrential rains associated with Opal began over land about 12 hours before landfall. The rainfall ranged from maximum amounts of 8 to 16 inches across parts of Alabama, Georgia, and much of the Florida Panhandle to 2-5 inches over the Ohio Valley and New England. Twelve tornadoes were reported from Florida to Maryland with severe weather as far north as Pennsylvania and New Jersey from Opal and its remnants.
The NWS performed very well prior to, during, and after Hurricane Opal. The NHC issued the Hurricane Watch approximately 31 hours prior to landfall and the Hurricane Warning 19 hours prior to landfall. The trend for the strengthening of Opal over water was correctly forecast, however, the rapid deepening during the early morning on October 4 was not anticipated.
Lightning struck NWSO Mobile, Alabama, on October 3 and severely damaged much of their electronic equipment, including the WSR-88D radar. However, the office was able to utilize backup equipment and, with the assistance from NWSO Tallahassee and Eglin Air Force Base (AFB), continued operations. Cooperation between the NWS and the U.S. Air Force ensured radar data was available as much as possible. Throughout this event, the NWS personnel supplied timely, high quality information to the public via NOAA Weather Radio (NWR), NOAA Weather Wire Service (NWWS), direct links with emergency management officials, and the mass media. However, several NWRs lost power during Opal's passage, rendering them useless for several hours. Offices that have World Wide Web home pages experienced a large number of accesses during the approach and passage of Hurricane Opal.
When hurricanes, especially major hurricanes such as Opal, approach the U.S. coastlines, they are generally given wide media attention. However, the day before Opal made landfall, the media focused most of its coverage on the 0. J. Simpson trial verdict and subsequent commentaries. Despite this, the local media in the threatened areas gave Opal the attention it needed to warn residents of its approach. There was also concern for the members of the Jewish community who would not be getting any news due to the observance of Yom Kippur. Advisories issued by NHC contained wording reminding the public to ensure their Jewish friends and neighbors were aware of the hurricane threat.
Many of the problems identified by the NWS offices were related to communications. These included disruptions in receipt of data while in operational backup mode, insufficient means by which to conduct intra-agency coordination, and difficulties in disseminating NWS products to emergency management officials in areas that do not subscribe to NWWS.
Finding 1:
Summary of Findings and Recommendations
Both numerical guidance and the official forecast did not catch Opal's rate of acceleration and intensification.
Finding 2: Within hours of sunrise on October 4, evacuation routes exhibited gridlock.
Recommendation 2:
Finding 3:
NOAA must continue aggressive research into tropical cyclone intensity change and acceleration so that significant warning improvements can be demonstrated as soon as possible. In the meantime, NHC, local Weather Service offices, and local officials must continue strong coordination efforts to ensure that warnings are posted as soon as possible by balancing current forecast capabilities with local response requirements.
NWSO Mobile lost the use of their radar due to a lightning strike the day before Opal's landfall, however, the PUP remained operational. The PUP gave them the capability to dial into the WSR-88D at nearby Eglin AFB.
Recommendation 3a: When lightning strikes the WSR-88D, often other peripheral equipment in the office is also damaged, as was the case at NWSO Mobile. While this was investigated each time it occurred, a detailed study must be done to determine how to protect the equipment from damage. Plans should be made to install any additional devices to lessen the chances of damage in the future.
Recommendation 3b: While extra equipment cannot be installed at all lightning susceptible locations, dedicated ports on adjacent WSR-88Ds need to be added to ensure ready access on a dial-up basis to support backup capability. Configuration of all radars should be looked at carefully to optimize use.
Recommendation 3c: Coastal locations should be provided with additional phone numbers for nearby WSR-88D sites (i.e., Eglin AFB) in the event that the number normally used to dial in remains busy.
xii
While most counties receive NWS products, many are only marginally prepared to use them. In general, counties with large metropolitan areas are more advanced than their more rural counterparts.
Recommendation 4: WCMs should redouble their efforts to provide training to all emergency management officials in their CWA to ensure that they are prepared to use hurricane-related NWS products appropriately and to their full potential. Other possible training options, such as distance learning modules of FEMA's Hurricane Course, should be explored.
Finding 5: Delivery of NWS information to some counties was a significant problem. While some large metropolitan areas and state officials receive NWS products from NWWS, there are a large number of emergency management officials who have no real-time access to NWS warnings and advisories.
Recommendation 5: While the NWS encourages all emergency management officials to subscribe to NWWS as the best means of obtaining critical data from the NWS, an alternative system of disseminating warnings and watches should be implemented for those areas that do not subscribe to NWWS due to its cost. Accordingly, the NWS should continue to support the new service called Emergency Managers Weather Information Network (EMWIN) which can provide emergency managers with critical weather information in a real-time mode. This is a low-speed broadcast that transmits over 5,000 pages of non-value added weather information daily. This data stream contains both alphanumeric and graphic products and some satellite imagery.
Finding 6: No tornado watch was in effect for the storms that swept across Prince George's County in Maryland. This was a result of coordination between NWSFO BaltimoreNashington and the SPC, where forecasters at NWSFO Baltimore/Washington mentioned that although an unstable tropical air mass was over the area, radar indications and the time of day did not suggest the potential for tornadic storms. A tornado warning, with a 6-minute lead time, was issued for Prince George's County. The forecasters at NWSFO BaltimoreNashington indicated that, had all resources of information been readily available as an integrated and displayable data set, they might have been able to discern the potential for tornadoes.
Recommendation 6: Timely delivery of the Advanced Weather Interactive Processing System (AWIPS) is crucial for the integration of model and observational data so that critical information can be used to its fullest in the forecast process. In addition, appropriate training in mesoscale convective processes is vital before the NWS migrates the convective watch program from SPC to WFOs.
Finding 7: A significant problem affecting the NWS services was the pronounced underestimation of precipitation by the WSR-88D in tropical air masses.
Recommendation 7: Ongoing studies to improve and optimize the adaptation parameters within the WSR-88D Precipitation Processing System (PPS) should continue and be given the highest priority. The inclusion of real-time rain gage data for use by the PPS will likely result in improved precipitation estimates as well. Field forecasters should make more effective use of the satellite precipitation estimates provided by the National Precipitation Prediction Unit.
Finding 8: Lack of sufficient NWR coverage affects the delivery of critical weather information to users.
Recommendation 8: Installation of additional NWR transmitters and privately- sponsored repeaters would be a significant step toward remedying the current coverage voids in the CWAs of NWSO Greenville-Spartanburg, South Carolina, and NWSO Tallahassee, Florida.
Finding 9: The lack of continuous, high-resolution satellite imagery which takes full advantage of the enhanced capabilities afforded by the new generation of Geostationary Operational Environmental Satellites (GOES) was a significant operational problem affecting services during Opal's passage.
Recommendation 9: The AWIPS should be fielded expeditiously with full functionality to utilize the new GOES data at all future Weather Forecast Office sites as well as the National Centers.
Before: Panama City Beach, FL, 1992. (Photograph courtesy of Bob Sheets)
I f . "
After: Storm surge damage at west end of Panama City Beach, FL., Hurricane Opal, October 1995.
(Photograph courtesy of Brian E. Smith)
Chapter 1
National Perspective
National Centers for Environmental Prediction (NCEP)
NCEP is comprised of nine centers, each with its own specialized function. The names of the various centers are the Environmental Modeling Center, Hydrometeorological Prediction Center, Tropical Prediction Center (TPC), Storm Prediction Center (SPC), Marine Prediction Center, Aviation Weather Center, Climate Prediction Center, Space Environment Center, and NCEP Central Operations.
The National Hurricane Center, which is part of the TPC, has overall responsibility for hurricane warning services for the Atlantic and eastern Pacific, north of the equator. NHC has the final authority for all meteorological decisions concerning the forecasting of tropical and subtropical systems in these areas. NHC determines the total NWS requirement for tropical cyclone aircraft reconnaissance and issues all public advisories and tropical cyclone forecasts/advisories for storms in its area of responsibility.
The HPC has responsibility for forecasting tropical systems once coastal warnings have been canceled and the systems have moved inland over the United States (except Florida and Hawaii). HPC also provides NHC expertise in the interpretation of the numerical model guidance, including forecast positions of tropical storms. Another function of HPC is to provide quantitative precipitation forecasts to field offices.
The SPC currently has the primary responsibility for issuing guidance and watches for severe local storms in the continental United States. Tropical cyclones often generate conditions which favor severe local storms (especially tornadoes) in addition to their tropical characteristics of high wind, heavy rainfall, and storm surge. When a tropical cyclone threatens the continental United States, its effects are integrated into SPC's forecast reasoning.
History of the Storm
Hurricane Opal made landfall near Pensacola Beach, Florida, as a marginal category 3 hurricane on the Saffir-Simpson Hurricane Scale (Appendix A), causing extensive storm surge damage to the immediate coastal areas of the Florida Panhandle. Opal was the first major hurricane to strike the Florida Panhandle since Eloise in 1975. Two months earlier, Hurricane Erin had struck the same area.
Synoptic History
Satellite imagery and synoptic meteorological analyses indicated that Opal originated from a tropical wave that emerged from the west coast of Africa on September 11, 1995. The wave moved across the Atlantic into the western Caribbean Sea by September 23 and merged with a broad area of low pressure centered in the vicinity of 15N 80W. The combined system drifted west-northwestward toward the Yucatan Peninsula during the following few days without significant development. Deep convection increased near the center of the low, and the post-analysis "best track" in figure 1 shows that a tropical depression formed about 70 nm south-southeast of Cozumel, Mexico, at 1 p.m., CDT, September 27. Best track position, central pressure, and maximum 1-minute sustained wind speed are listed at 6-hour intervals in appendix b, table 1.
Steering currents were weak and the tropical depression moved slowly over the Yucatan Peninsula for the following 3 days. Convective banding increased and ship reports suggested that the depression became Tropical Storm Opal at 7 a.m., CDT, September 30, while centered near the north-central coast of the Yucatan Peninsula. The storm gradually strengthened and moved slowly westward into the Bay of Campeche.
The Air Force Reserve unit aircraft investigating Opal over the southwestern Gulf of Mexico reported that the minimum central pressure steadily dropped. Aircraft reconnaissance reports and satellite analyses suggested that Opal strengthened to a hurricane near 7 a.m., CDT, October 2, while centered about 150 nm west of Merida, Mexico. An eye appeared in satellite imagery later in the day while a large amplitude mid- to upper-level trough moving into the central United States began turning Opal slowly toward the north.
On October 3 and 4, the hurricane turned toward the north-northeast to northeast and gradually accelerated. During this period, the water temperature beneath the hurricane's circulation was 28" to 29" Celsius, and a large upper-level anticyclone was well established over the Gulf of Mexico. Rapid intensification occurred not only as a result of these favorable environmental conditions on the large scale but also due to significant changes within the hurricane's inner core. Opal intensified into a category 4 hurricane early on October 4, at which time reconnaissance aircraft reported a small, 10 nm diameter eye. The minimum central pressure of 9 16 millibars (mb), with maximum sustained surface winds estimated at 130 kts, occurred when the hurricane was centered about 250 nm south-southwest of Pensacola, Florida, near 5 a.m., CDT, October 4. The peak intensity appeared to have occurred near the end of an eyewall contraction cycle. Soon thereafter, the small inner eyewall diminished as an outer eyewall became more dominant. The hurricane weakened during this process but was still a marginal category 3 hurricane as the center made landfall near Pensacola Beach, Florida, about 5 p.m., CDT, October 4. The collapse of the inner eyewall, cooler sea surface temperatures along the Gulf coast, and increased upper-level westerlies likely contributed to the weakening.
Figure 1. "Best track" positions for Hurricane Opal, September 27-October 6, 1995.
3
The hurricane was moving north-northeast near 20 kts at landfall with the sustained hurricane- force winds in the eastern quadrants of the circulation primarily between Pensacola Beach and Cape San Blas. The minimum central pressure at landfall was 942 mb. Maximum sustained surface winds were estimated at 100 kts in a narrow swath at the coast near the eastern tip of Choctawhatchee Bay about midway between Destin and Panama City. Although few official reports of surface winds were received within this area, data from reconnaissance aircraft and Doppler radar suggested that the peak winds occurred in this location. It should be emphasized that the strongest winds were in a very limited area, and most of the coastal areas of the Florida Panhandle experienced winds of a category 1 or category 2 hurricane (between 65 and 95 kts). Figure 2 shows the maximum sustained winds near the time of landfall. Figure 3 shows the swath of maximum sustained winds as Opal approached the coast and moved onshore. Although the winds were diminishing at the time of landfall, extensive damage due to storm surge and breaking waves occurred over most of the coastal areas of the Florida Panhandle.
Opal weakened rapidly after moving inland, becoming a tropical storm over southern Alabama and a tropical depression over southeastern Tennessee. The cyclone was declared extratropical as it moved northeastward over the Ohio Valley and eastern Great Lakes into southwestern Quebec. The strongest winds occurred well away from the center of the cyclone during the extratropical stage.
Meteorological Statistics
Figures 4 and 5 show the curves of minimum central pressure and maximum 1-minute wind speed, respectively, versus time, along with the observations on which they are based.
The Air Force Reserve aircraft provided a total of 38 operational center fixes during approximately 122 flying hours of reconnaissance on this hurricane. The minimum central pressure reported by aircraft was 916 mb at 4:45 a.m., October 4. This represented a 53 mb drop in pressure within 24 hours and a 42 mb fall within about 12 hours. This was a very rapid rate of deepening, but it is not unprecedented. Several western North Pacific typhoons have deepened at an even faster rate. The maximum winds of 152 kts from a flight-level of 700 mb were measured shortly after the 916 mb pressure report. At 3:06 p.m., CDT, approximately 2 hours prior to landfall, the aircraft reported 126 kts, 59 nm east of the center. At 5:03 p.m., CDT, near the time of landfall, the aircraft reported winds of 115 kts, 54 nm east of the center. In addition to the Air Force Reserve reconnaissance, a NOAA aircraft flew a 10-hour research mission at the time of landfall.
A ship with call sign XCKX reported 75 kt winds at 7 a.m., CDT, October 4, while located about 90 nm west-southwest of the hurricane center. Several other ship reports were helpful in defining the extent of tropical storm-force winds. Appendix B, table 2, lists ship reports of at least tropical storm-force winds in the vicinity of Opal.
Figure 2. Streamlines and isotachs maximum sustained (I-minute) surJace winds (units = Q 10 meters (m). Hurricane Opal, 4:40 p.m., CDT (2140 UTC), October 4. 1995.
Figure 3. Preliminary swath of maximum I-minute sustained surface winds (kt) for Hurricane Opal during landfall on October 4, 1995.
Figure 4. Best track minimum central pressure curve for Hurricane Opal, October 1995. Landfall noted by vertical line.
SAT <TSnF) . SAT <SAD> * 3H OBJ f -Nut
A ec:FLT LUL 0 AC:DUI P-+U
100
Figure 5. Best track maximum sustained wind speed curve for Hurricane Opal, October 1995. Landfall noted by vertical line.
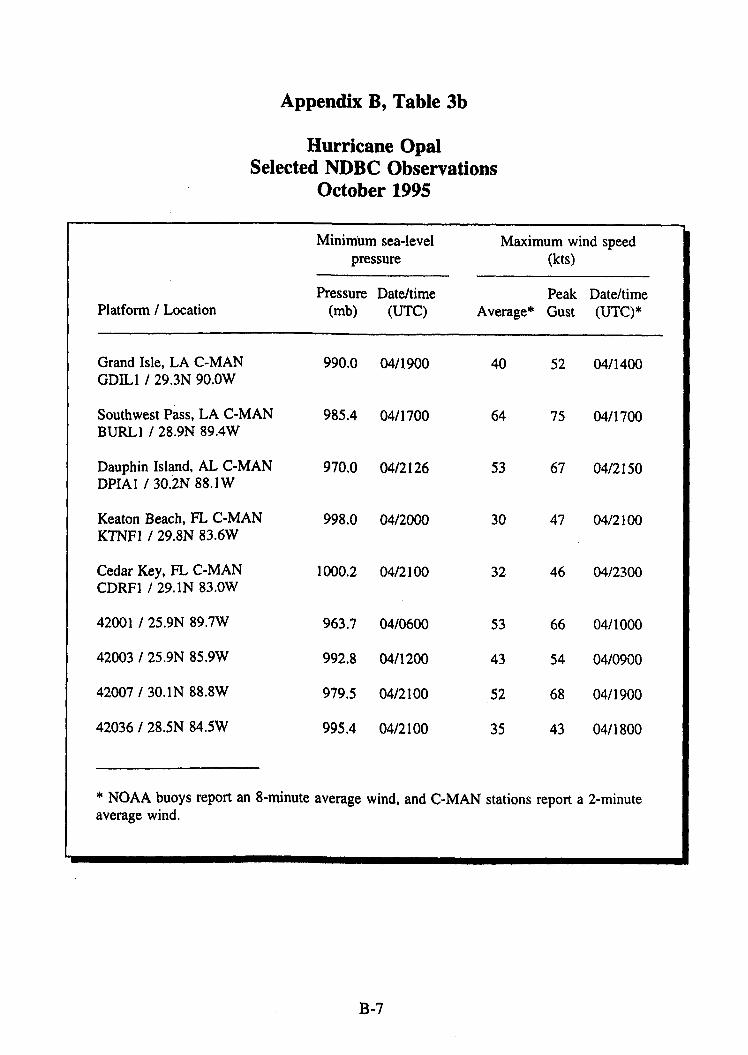
The strongest winds reported by a land station were 73 kts with gusts to 125 kts at Hurlbert Field, Florida. Appendix B, table 3a, lists selected surface observations, and appendix B, table 3b, lists selected observations made by National Data Buoy Center (NDBC) platforms near the path of Opal.
Isolated tornadoes were reported from the Florida Panhandle to the Mid-Atlantic States. One fatality occurred in Crestview, Florida, as a result of a tornado. Another tornado injured several people and severely damaged a number of structures as it swept through Charles, Prince George's, and Anne Arundel Counties in Maryland.
A post-storm high water mark survey conducted by the U.S. Army Corps of Engineers and the U.S. Geological Survey (USGS) shows an extensive storm surge from southeastern Mobile Bay and Gulf Shores, Alabama, eastward through the Florida Panhandle, to Cedar Key, Florida. Still water mark elevations inside of buildings or tide gage maximums, which damp out breaking wave effects and are indicative of the storm surge, ranged from 5 to 10 feet above MSL in the area of the storm. Outside water marks on buildings or debris lines on sand dunes and within approximately 300 ft of the Gulf of Mexico shoreline generally reflect the combined effects of the storm surge and breaking waves. These values ranged from 10 to 25 ft. For example, the tide gage at the Panama City Beach pier recorded a maximum of approximately 8 ft above MSL, indicative of storm surge. Figure 6 shows National Ocean Service (NOS) measurements versus the astronomical prediction of the water level from its Next Generation Water Level Measurement System (NGWLMS) at Panama City, Florida. At the end of the pier, a debris line elevation of approximately 18 ft above MSL was recorded. Thus, the wave run-up from breaking waves added approximately 10 ft to the 8-ft storm surge. Figure 7 shows the NOS NGWLMS record for Apalachicola, Florida.
The combination of Opal and a frontal system resulted in heavy rains along the path of the hurricane. Rainfall totals generally ranged from 8 to 16 inches over portions of the Florida Panhandle, Alabama, and Georgia. Rains in South Carolina averaged 2 to 4 inches, while in North Carolina, 4 to 8 inches were common. Highlands, North Carolina, recorded 8.95 inches, and Robinson Creek, North Carolina, recorded 9.89 inches. Elsewhere, 2- to 5-inch totals occurred over portions of the northeast United States from Maryland northward.
Casualty and Damage Statistics
The total number of deaths directly associated with Opal was placed at 59, and the distribution is as follows.
Guatemala - 3 1 (from flooding during the developing stages of Opal) Mexico - 19 (from flooding) United States - 9
Florida - 1 (from a tornado) Alabama - 2 (from a tree falling on a mobile home) Georgia - 5 (from falling trees) North Carolina - 1 (from a tree falling on a mobile home)
- - - * - -
6729210 PANAMA CITY BEACH) F L (NGWLMS) HOURLY HE1 GHTS . . 4449210 PANAMA CITY BEACH) F L (PREDICTED ON MLLW) HOURLY HEIGHTS
Figure 6. NOS NGWLMS record from ~ a k City Beach, FL. National Geodetic Vertical Datum correction not available. Hurricane Opal, October 1995.
Figure 7. NOS NGWLMS record from Apalachicola, FL. National Geodetic Vertical Datum - 0.35 ft above Mean Lower Low Water. Hurricane Opal, October 1995.
- ---- - 6728690 APALACHICOLA F L (NGWLMS) HOURLY HE1 GHT S 4448690 APAPACHICOLA) F L (PREDICTED ON MLLW) HOURLY HE1 GHTS
There were no reported deaths due to storm surge flooding, which is remarkable in view of the size of the vulnerable population and extensive salt water damage observed.
The Insurance Information Institute preliminary estimate of insured property damage for the United States was $2 billion. Considerable uncertainty exists concerning the amount of additional damage due to flood claims, uninsured property damage (including damage to roads and bridges and other government property), and the cost of cleanup. If the estimate of insured property damage proves to be correct, the total damage estimate from Hurricane Opal could reach $3 billion. Without adjustments for inflation, Opal could rank as high as third on the list of costliest 20th century U.S. hurricanes. With adjustments for inflation, Opal will likely still be ranked in the top ten on that list.
Most of the severe structural damage occurred at the coastline. The crumbled piers, demolished homes, and eroded or submerged highways were primarily a result of the storm surge. In addition, however, strong winds spread damage well inland. Opal downed numerous trees, knocking out power to nearly 2 million people in Florida, Alabama, Georgia, and the Carolinas. The Robert Trent Golf Course in Opelika, Alabama, lost over 7,000 trees during the storm. Many people in Florida were without water for several days. Appendix E is a report of the aerial survey of the damage.
Warning and Forecast Critique
The goal of NHC is to issue hurricane watches and warnings 36 hours and 24 hours, respectively, before the storm makes landfall. Landfall is defined as when the eye crosses the coast. Similarly, NHC makes every attempt to provide as much daylight warning time as possible to assist the evacuation process. Although Opal posed several warning and forecast challenges, watch and warning lead times were 31 and 19 hours which parallel NHC long- term average lead times. (See Appendix B, Table 4, Watch and Warning Summary, Hurricane Opal.)
Once Opal left the Yucatan Peninsula, both the numerical guidance and the official forecasts captured the dramatic recurvature when, on October 3 and 4, the hurricane turned to the north-northeast and took aim on the Gulf coast. At 4 a.m., CDT, Tuesday, October 3, the first hurricane watch was posted from Morgan City, Louisiana, to just west of Pensacola, Florida. Six hours later, the watch was extended eastward to the mouth of the Suwannee River.
A critical warning decision was made during the mid-afternoon of October 3. Although landfall location and timing were still highly uncertain, both NWS coastal offices and NHC were concerned that tropical storm-force conditions would move onto a portion of the Gulf coast within 24 hours. Accordingly, a tropical storm warning was issued at 4 p.m., CDT, October 3, from Morgan City to the mouth of the Suwannee River. Furthermore, the public advisory noted that hurricane warnings would likely be raised along that portion of the coast later that night. A hurricane warning was issued at 10 p.m., CDT, October 3, from Mobile, Alabama, to Anclote Key, Florida, as Opal continued its acceleration and intensification.
Findine 1: Both numerical guidance and the official forecast did not catch Opal's rate of acceleration and intensification. This could have led to the meteorological nightmare of preparing for a storm of one intensity and then having to respond to a stronger storm with insufficient time for successful evacuation. Thankfully, Opal weakened dramatically 10 hours prior to landfall.
Finding 2: Within hours of sunrise on October 4, evacuation routes exhibited gridlock. Had Opal continued to intensify, the results could have been catastrophic. (Details on the decision-making and response process are included in chapter 3 by Dr. Jay Baker.)
Recommendation 2: NOAA must continue aggressive research into tropical cyclone intensity change and acceleration so that significant warning improvements can be demonstrated as soon as possible. In the meantime, NHC, local Weather Service offices, and local officials must continue strong coordination efforts to ensure that warnings are posted as soon as possible by balancing current forecast capabilities with local response requirements.
History of the Storm After Becoming Extratropical
Hurricane Opal moved into the western Florida Panhandle the evening of October 4 and traveled north-northeastward before becoming extratropical as it moved into the eastern Great Lakes. Opal was drawn into the United States by the presence of an upper-level ridge over the western Atlantic and a deepening upper-level trough over the central United States. Opal crossed the western Florida Panhandle and then accelerated north-northeast through Alabama, Tennessee, Kentucky, Ohio, and into western New York. Torrential rains associated with Opal fell along and to either side of the system. The heaviest rains fell from about 12 hours before to 12 hours after landfall. Maximum amounts of 8 to 16 inches were common across eastern Alabama, western Georgia, and much of the Florida Panhandle. Two to 5 inches fell over the Ohio Valley into New England. (See figure 8.)
Meteorology Related to Precipitation Amounts
The Quantitative Precipitation Forecasts (QPF) from several NCEP operational atmospheric models (Eta Model, Nested Grid Model [NGM], Aviation Model [AVN]) showed several different solutions concerning areal coverage and amounts. The models severely underforecast the rainfall amounts, which is typical for tropical systems. Manual QPFs issued by HPC were an improvement over the model forecasts. Excessive rainfall and 24-hour QPF discussions from the HPC consistently described this as a major rainfall event. Some quotes were: "A major rainfall event is expected for much of the Gulf States during the next two days." "Very dangerous flash flood situation over part of the southeastern U.S. is coming together as Hurricane Opal approaches the region." "Isolated rainfall amounts around 1 foot are possible over the Florida Panhandle, southeastern Alabama, and southwestern Georgia." (See figure 9 for the associated graphics.)
TOTAL PRECIPITATION (inches)
/ h PATH OF HURRICANE OPAL October 3 - 5, f995 [3 days]
Isoplslhs drawn for2, 4,
1 % Shaded areas received
ALL TIMES EDT
HURRICANE OPAL DEVASTATES PARTS OFTHE DEEP SOUTH. A troplcaldepresslon Ionnedln Me western Carebean Sea late Seplember27andmeandenrdf(~se~~nldays balm strengthening hlo TroplalSIom Opallate Septembw30. Amundmkklay adaber2 Opdlbecame the nhth Allanlbh~aneollheseeson and~nmovlngmdhwardanerlashlngpad: d lhe Yucatan Peninsula, where 10hes wenr lost m h g lo press qmd. meslMlS strength lncreasedexpbdve& h Ihecenbal GMdMexkw on Gztokrr3, andqDalpeakedas r slmng category 4 hunlcane (with sustainedwlnds near 150 mph) on cMobw4. F m a l e & the system weakenedas d appvached the mulam FbMapanhandla, making landletpuleas d Pensamla, FL with s~~stained winds near 125 mph amund 8p.m. on OzbtwM Opal qukw lost strength as i t p ~ h e d mrlmdheashnvd owr lhe next24 Mum, but h a u s e the stom was modng so qubw(w~120mph), powerlur wlnds af~ctedanias welIhIam'. Sustained wind.9 ofup lo 90 mph we@ mrdedas andgualt lo nearhmkane toire reachsdthe waplemAtlanta, (34 slrbubs. Fadhersouth, a wtndgustlo 144 mph was cbckeda Mary Eslhec FL abng the extmma W e m FlwMapanhandlapt eas. dthelandtaRsUe, andslmngwlndpmmblnedwflhheavymInsanda 15-iwtalomsurpelogenentes~niIlcanIlbodandwinddamaabnga 1~laahelchofMemastaIRorMapenhMf hvm Penwok eashwdlo D&n Fadhernadh, gusly wlndp andkcallzed flooding was reporled, andmm than 2 m h n customers bslpowerlmm the Carolhas and Kenhrcky southwalc on Ocl&1?r5. As ~lconllnusdno~ihward, h ~ ~ r a k v C ~ ~ 8 d k c ~ U ~ s d ~ I n g h p ~ d t h ~ u 1 n l ~ I A ~ a I a c h I ~ 1 ~ a n d m L4Mj andan F 2 l o r n a & b d a ~ ~ e d & w n In c a n I n l L y /and, generallngbcaPeddamage. Overall, l8UvaP werelostbecauseollheslotm, a&ngtolheFedemiEmergencyManagem~ H o t w B S nolald0pafse1TeUs w n e g a l h a me stonnS nimnanls spread moderale lo heavy d m wer r larpeptvidlhe Mrlheas4 wherape&tenlllyalibmmaIp9c@itaUon has been mrdeddudng Me M 4 Ib 12 monllrr.
Figure 8. Total precipitation (inches,! and path of Hurricane Opal, October 3-5, 1995 (3 days).
The model QPFs from 7 a.m., CDT (1200 Coordinated Universal Time [UTC]), October 3, to 7 a.m., CDT (1200 UTC), October 4, all showed the axis of heaviest rains farther west than what occurred. The reason was the models' inability to resolve the interactions between the strong southeasterly flow and (1) an old frontal boundary from the Mid-Atlantic States into the Ohio Valley, (2) an inverted trough over Georgia, and (3) the Appalachian Mountains. These features enhanced low-level convergence and increased rainfall amounts (figure 10). Figures 10 and 11 include the actual rainfall amounts at the top, manual QPF in the middle left, NGM QPF in the middle right, Eta QPF in the lower left, and AVN QPF in the lower right.
The Eta and NGM QPF from 7 a.m., CDT (1200 UTC), October 4, to 7 a.m., CDT (1200 UTC), October 5, showed the axis of the heavy rain quite well, while still severely underforecasting the actual rainfall amounts. The AVN moved Opal too far west which supported light rainfall from Alabama into the central Appalachians. The manual QPF issued by the HPC was very close to the actual rainfall amounts and areal coverage. The model QPFs were again too light although the areal coverage from the Eta and NGM were better than the first day. The Eta and NGM improvement in the placement of the QPF on this day, versus the previous day, was linked to the flow around Opal washing out the inverted trough and the old frontal boundary. Therefore, the strongest 'low-level convergence and heaviest rains were more closely associated with the center of Opal and was handled much better by the models. (See figure 10.)
Beyond 7 a.m., CDT (1200 UTC), on October 5, Opal began to lose its tropical characteristics and accelerated into Canada by that evening. Heavy rains continued to fall over the northeastern United States as the strong southerly flow off the Atlantic brought deep moisture into and over a warm front from Opal to the coast of Maine.
Storm Prediction Center Guidance Products
Severe weather forecast guidance products from SPC are generated by the Operational Guidance Branch (OGB). The OGB provides 24-hour Severe Weather Outlook-Day 1 (SWODYI) and 48-hour Severe Weather Outlook-Day 2 (SWODY2). Both products are provided in narrative and graphic format. The Day-1 Outlook details the risk of severe weather as the following.
APCHG - approaching severe storm criteria. SLGT - slight risk of severe storms. MDT - moderate risk of severe storms. HIGH - high risk of severe storms.
The original SWODY2 Outlook issued at 3 a.m., CDT, daily provides only the area of severe weather threat. The SWODY2 is updated daily at 3 p.m., CDT, and details the risk as in the SWODY 1 products.
Figure 10. Actual rainfall amounts and manuaUmode1 precipitation forecast, Hurricane Opal, October 4, 1995.
Figure 11. Actual rainfall amounts and manuaUmode1 precipitation forecast, Hurricane Opal, October 5, 1995.
Beginning October 3, the OGB began mentioning northwest Florida, southern Alabama, and southwest Georgia as an area of severe weather threat. The SWODY2 Outlook narrative issued at 3 a.m., CDT, October 3, introduced a risk of tornadoes in the latter half of the valid period or between 7 p.m., CDT, October 4, and 7 a.m., CDT, October 5. The threat was based on approaching outer spiral bands in the right front quadrant of the hurricane. As the storm accelerated and continued to approach the Florida Panhandle, the tornado potential was addressed by the SWODYl guidance. The SWODYl issued at 1 a.m., CDT, October 4, indicated a moderate risk over southeastern Alabama, the Florida Panhandle, central and southern Georgia, and portions of southern South Carolina. The Outlook was based on a moderately unstable air mass coupled with strong low-level vertical wind shear that would provide favorable conditions for development of tornadoes in the right front quadrant of the hurricane. Updates issued at 10 a.m., CDT, and 2 p.m., CDT, on October 4, reiterated the moderate risk.' The 1 a.m., CDT, October 5, Outlook began focusing more strongly on the eastern part of the United States, east of the Appalachians. This Outlook was based on a very unstable air mass that had been pushed northward as the center of Opal moved northward just west of the Appalachians. The inflow into the remnants of Opal provided a low-level vertical wind shear pattern that would provide favorable conditions for development of tornadoes. This focus was continued with the updates at 10 a.m. and 2 p.m., CDT, on October 5.
The OGB also generated discussion products on an as-needed basis. The Severe Weather Outlook-Mesoscale Convective Discussions (SWOMCD) gave insight about convective trends during the past 2 hours and for the forthcoming 2- to 4-hour period. As Hurricane Opal approached the Florida Panhandle, the OGB provided a detailed evaluation of convective trends and severe thunderstorm potential. At 5:37 p.m., CDT, on October 3, a SWOMCD said that the air mass over central and northern Florida was destabilizing and that the OGB was becoming concerned about spiral bands associated with Hurricane Opal.
Severe Weather Watches
Watches that advise of the potential for severe thunderstorms or tornadoes also are the responsibility of the OGB. When conditions favor severe thunderstorms, causing hail at least 314-inch in diameter or wind gusts of at least 50 kts (58 miles per hour [mph]), the OGB will issue a severe thunderstorm watch for the favored area. Should the potential also include tornadoes, a tornado watch will be issued instead. As Opal approached the Florida Panhandle, Tornado Watch No. 1008 was issued at 7:19 a.m., CDT, October 4. The watch was for all of the Florida Panhandle and most of southern Alabama and graphically depicted as 80 miles north and south of a line from 25 miles northwest of Mobile, Alabama, to 25 miles south-southeast of Marianna, Florida. The watch was valid from 8 a.m., CDT, until 6 p.m., CDT, on October 4. It is unusual for a severe weather watch to be valid for more than 6 hours. In this situation, however, the lengthy watch made meteorological sense due to the protracted hurricane conditions. These conditions included the outer rain band approach, the passage of the storm core, and the trailing rain band passage. Because Opal was accelerating during the day, tornado watches were continually being replaced and moved north and east to reflect the passage of the remnants of the center and the banded circulation thunderstorms. In total, the OGB issued 12 tornado watches from the Gulf of Mexico coast northeastward into the Mid-Atlantic States during the 2-day period. Tornado Watch Number 1008 was in effect over the Florida Panhandle on the morning of October 4, when the tornado
struck Crestview, Florida. During the 2-day period, 10 of the 12 tornadoes reported occurred in or close to the watches. In addition, reports of straight-line wind damage were also received from the regions covered by tornado watches.
Three injuries occurred from 8:30 p.m. to 9 p.m., Eastern Daylight Time (EDT), October 5, as a tornado (F2 on the Fujita Tornado Intensity Scale [Appendix C]) moved across Prince George's County in southern Maryland. Tornado Watch Number 1015 was issued at 6:16 p.m., EDT, October 5, for portions of eastern and northern Virginia. The OGB forecaster had proposed extending the watch northward into the Maryland area all the way to the Pennsylvania border but did not because consultation with the NWSFO Baltimore1 Washington, D.C., public forecaster indicated the convective activity had been weakening. As the tornadic activity continued, Tornado Watch Number 1016 was issued at 9 p.m., EDT, October 5, and replaced Tornado Watch Number 1015. Tornado Watch Number 101 6 was extended northward to include eastern Pennsylvania, New Jersey, eastern and southern Maryland, the District of Columbia, and adjacent coastal waters.
Status Reports
While severe weather watches are in effect, the OGB produces Severe Local Storm Watch Status Reports (WWAMKC) to provide updated information about severe weather trends. A number of status reports were provided while the 12 tornado watches were in effect. The principal concern was of the thunderstorms in the spiral bands. WSR-88D radar data was used extensively by the OGB mesoscale forecaster, particularly the Vertical Azimuth Display winds, looking for favorable vertical wind shear patterns associated with the spiral bands. The OGB mesoscale meteorologists used the WWAMKCs to describe the details about the timing and location of the thunderstorm bands. The WWAMKC issued at 957 a.m., CDT, on October 4, specifically mentioned a line of thunderstorms associated with a spiral band from Mobile bay to south of Panama City, Florida. The vertical wind shear profile from the Eglin AFB WSR-88D indicated a profile conducive to tornadoes which were mentioned as a threat as the line of thunderstorms moved north over the panhandle of Florida.
Communications
On Tuesday, October 3, the electronic news media (local and networks) were preoccupied with coverage of the 0. J. Simpson trial verdict, beginning with the verdict, followed by near continuous "man-on-the-street" reaction, and scholarly analysis. This coverage persisted throughout the remainder of the day. In this context, NHC experienced a lower than normal level of on-site coverage of the hurricane event, but by no means was NHC entirely eclipsed in gaining media attention.
The ABC Radio Network and Associated Press wire service provided coverage on-site throughout the evening of Tuesday, October 3, and the morning of Wednesday, October 4.
NHC Public Affairs informally polled local Miami network affiliates (CBS-WFOR, NBC- WTVJ, and Cable News Network Miami Bureau) on Wednesday, October 4, to ensure their awareness of the intensifying storm and potential impact for the northeastern Gulf coast.
At NHC Public Affairs' request, the NWS Public Affairs polled major radio and television outlets from Pensacola to Tallahassee to ensure that the NHC Public Advisories were received and test general awareness of the situation. These media were aware and regularly updated the information for their respective markets. Several outlets expressed appreciation for the quality assurance follow-up, evidenced by the NWS ensuring NHC products had been received by those end users.
NHC Public Affairs also contacted Associated Press Broadcast Center, Washington, D.C., to ensure that a bulletin was placed on their "wire" alerting the national electronic media.
Coordination
NHC Coordination with Emergency Management Officials
Coordination between the NHC and Florida emergency management officials was perceived by the NHC as excellent. This was due, in part, to the assistance of individuals from FEMA and the Florida Office of Emergency Management who traveled to the NHC and scheduled conference calls from the NHC to affected county officials. (See appendix D for the FEMA view of this participation.) They also continually passed on pertinent information to local emergency management officials. The conference calls allowed the NHC to discuss the most current track and intensity forecast along with the forecast uncertainty. One word of caution is in order, however. The amount of time requested for the hurricane specialists to participate in these conference calls appears to be increasing. The same degree of support for other states is not occurring and, in fact, would not be possible given current resources and the amount of support currently given to Florida. It is neither desirable nor effective to give the same briefing on a state-by-state demand.
Coordination Between the HPC and the NHC
Coordination between the HPC and the NHC remained excellent. The HPC basic weather desk forecaster participated in a minimum of four conference calls between the NHC, HPC, and other concerned Federal and state agencies each day. Model differences and forecaster assessments were discussed. As Opal approached northwest Florida, several discussions about the storm track and associated rain amounts occurred between the HPC and the NHC. The transition of responsibility from the NHC to the HPC went very smoothly as Opal moved onshore and weakened.
The HPC issued storm summaries several times each day as Opal moved north. These summaries included Opal's position, strength, movement, and expected future positions. They also included current warnings and watches related to the heavy rains and severe weather. Information about rainfall amounts and storm damage was also included.
Coordination Between the NHC and the Field Offices
The NWS hurricane hotline, which provides the link between NHC, HPC, and coastal field offices, was used effectively. However, inland offices were not a part of this network so coastal offices were required to pass along the information received via the hotline to their adjacent offices for timely preparation of forecasts and Inland High Wind Warnings.
Following Hurricane Andrew, NOAA and FEMA identified the need for a more efficient and farther reaching Hurricane Coordination Hotline capability. Since Andrew, FEMA has upgraded their National Warning System (NAWAS) to satisfy coordination and communication requirements. NOAA feels that the upgraded NAWAS will provide the agency with an interim system that can meet its internal and external coordination and communication needs.
In 1995, the NWS and FEMA developed the architecture for a more robust system. During 1996, the NWS will work with FEMA to deploy an internal coordination capability allowing any number of offices, coastal and inland, to communicate with NHC during the threat of landfalling storms. Additionally, the upgraded NAWAS will provide the capability for any NWS office to bridge into any FEMA regional or state warning segment of the NAWAS. Once fully in place, NAWAS will provide all offices with the ability to communicate and coordinate with surrounding weather offices, National Centers, River Forecast Centers, and all levels of emergency managers.
Chapter 2
Field Response
NEXRAD Weather Service Forecast Offices and NEXRAD Weather Service Offices
The NWSFOs and NWSOs are responsible for providing warnings and forecasts for their county warning areas (CWA). Part of that responsibility is to maintain consistency among all of the products they issue and the latest advisories issued by NHC. The Hurricane Local Statements (HLS) are designed to provide long-range information about an approaching hurricane's anticipated effects on the NWSFO/NWS07s area of responsibility and suggest precautions necessary to protect life and property. The information should include the location of the storm, a review of warnings/watches in effect, a review of how conditions will impact commerce and society, and a brief call to action. Once the tropical cyclone's effects move into the CWA, the Short Term Forecast (NOW) should include a short-term forecast of expected conditions to heighten awareness and ensure proper near-term response actions.
Southern Region
Impact of the Storm
The impact of Hurricane Opal along the middle and eastern Gulf coast was considerable. One source has listed the storm as the third costliest in U.S. history, surpassed only by the extremely destructive Hugo (1989) and Andrew (1992). Insured losses have been estimated at nearly $2 billion. The effects of Opal were felt as far west as the central coast of Louisiana and eastward to over much of the Florida Peninsula. The primary area that experienced the most damaging effects from the storm were Alabama, Georgia, and northwest Florida. Based on information gathered by NWS offices in Auburn, Birmingham, and Mobile, Alabama; Atlanta, Georgia; and Tallahassee, Florida, we will examine in some detail the effects to these hard hit areas.
Southern AlabamalNorthwest Florida
Several hours prior to Opal's landfall, it was evident that the rapidly strengthening and fast-moving storm was focusing the thrust of its destructive power toward southern Alabama and northwest Florida. Consequently, local statements issued by the NWS offices in Mobile and Tallahassee (see next section) began to strongly emphasize the extreme danger of the storm and recommended preparatory actions for residents in their CWAs.
Opal's impact on communities in this area proved quite severe. Numerous structures along the immediate coastline were heavily damaged or destroyed. Most of the damage or destruction was attributed to the massive storm surge and battering waves, which rose to heights of 15 ft from Pensacola to Destin, Florida. The persistent wave action that battered coastline property also had a significant effect.
In the Mobile CWA, damage was concentrated in Escambia, Santa Rosa, and Okaloosa Counties in extreme northwest Florida. The storm surge caused severe damage to the lower floors of condominiums and motels near the coast. Water reportedly surged across the coastal U.S. Highway 98, where it knocked out the bottom floors of some structures causing upper floors to collapse. Fortunately, there were no reported injuries or fatalities caused by these collapsed structures.
Wind also caused problems across Okaloosa County. The strongest gust recorded in Opal occurred in the county-144 mph at Mary Esther at 455 p.m., CDT, on October 4. Eglin AFB in Valparaiso recorded a gust to 115 mph at 6:04 p.m., CDT. Numerous trees and power lines were downed by the winds as well as several structures damaged. The massive destruction ove; the county caused local officials to temporarily bar access to its communities.
One fatality occurred in Okaloosa County on the afternoon before Opal's landfall. An elderly female was killed in Crestview when an F2 tornado damaged her residence. Two other persons were injured in the same tornado.
The counties immediately to the west of Okaloosa, Santa Rosa, and Escambia also experienced considerable damage. Again, most of the structural damage, including commercial establishments and piers, was confined to the immediate coastline. The barrier island from Navarre Beach to Pensacola Beach was breached in several locations. The Bob Sikes Bridge, which extends from Pensacola to Gulf Breeze, was temporarily closed for damage inspection. Numerous trees and power lines were downed throughout the counties.
The remainder of the counties in the Mobile CWA experienced mostly tree and power line damage. Flooding produced by heavy rains in Opal washed out some roads and temporarily closed others.
Several counties in the Tallahassee CWA did not fare much better. Severe damage was inflicted by Opal on coastal property in Walton, Bay, and Gulf Counties. From Panama City Beach to Cape San Blas, as much as 95 percent of the beachfront homes were a total loss! A few smaller hotels also were destroyed. Again, the destruction was primarily a result of storm tides and wave action. A fatality was reported in Walton County during the cleanup effort.
Lesser degrees of damage were observed further inland and in counties to the east. Wind was a primary contributor to damage in these areas. One tornado was reported along the Holmes- Walton County line on October 4. Two buildings were damaged, and hundreds of pine trees were downed by the tornado.
Rainfall apparently was not a serious problem in the Tallahassee CWA. The Choctawhatchee River at Caryvilk, Florida, was the only waterway that reached flood stage as a result of Opal's rains.
Central and Northern Alabama
While the impact from Opal was not as serious in these areas, the awareness and interest of residents remained quite high. The NWS Agricultural Weather Service Center (AWSC) in Auburn reported an amazing 30,000 accesses to their World Wide Web and Gopher services on October 4. Their services included the latest advisories, statements, forecast track depiction, satellite images, and hourly observations from the Alabama Mesonet. In addition, numerous telephone calls were answered by the AWSC staff.
Auburn emergency management officials were able to keep updated on the progress of Opal through an Internet link with the East Alabama Amateur Radio Operators. Decisions to close businesses and schools in and around the area were based on continued operation of this critical information source.
Auburn and the surrounding communities were impacted by the storm and damage did occur in the area. Numerous residences were without power for several days. All but one radio station between Montgomery, Alabama, and Columbus, Georgia, lost power and thus went off the air during Opal. This station, in close cooperation with the AWSC, became virtually the sole source for information to the community during the cleanup.
One of the area's largest tourist attractions, the Robert Trent Golf Course in Opelika, lost over 7,000 trees during the storm. Logging crews, brought in from as far away as Canada, used helicopters to remove the trees.
The impact of Opal across the NWSFO Birmingham's CWA, although not as significant as experienced further south, was widespread and nonetheless tragic. Two fatalities were attributed directly to the storm's effects. These occurred when a tree fell onto a mobile home in Gadsen, Alabama (Etawah County). Four other fatalities were indirectly a result of Opal--one due to asphyxiation (carbon monoxide poisoning from an emergency generator), one in a fire, and two in auto accidents in which impact was made with fallen trees. Three injuries were also caused by Opal (one in Randolph County, two in Lee County).
The primary impact from Opal was the downing of numerous trees which resulted in extensive power outages. It is estimated that over-400,000 homes in Alabama lost power during the storm, with over 140,000 of those outages occurring in the Birmingham metropolitan area. Virtually every county in the ~ i r r n i n ~ h a m CWA experienced power interruptions.
The wind also produced some dramatic effects on the roadways across the CWA. Several large trucks were blown over or off the interstate highways. No injuries or deaths resulted from these mishaps. While no tornadoes were officially reported in central and northern Alabama, as many as 20 funnel clouds were sighted.
Rainfall caused flash flooding in the CWA, but the flooding was not significant. Birmingham did, however, receive in excess of 10 inches of rainfall from Opal. This fell over a 48- to 60-hour period.
Georgia
Georgia sustained considerable damage due to the persistent strong wind from Opal. As many as 45 counties were declared disaster areas, or approximately one-third of the state was severely affected. Additional counties were expected to seek some Federal assistance.
The monetary loss was initially placed at around $15 million but was expected to climb higher. This included debris removal, emergency protective measures, water control, utilities, parks and recreation areas, government buildings and their content, and roads and bridges.
Preliminary findings indicated a total of 349 homes suffered major damage, with 1,219 suffering only minor damage. Over 70 mobile homes were damaged-26 severely. Two business establishments had major damage, with 50 others sustaining minor damage. Much of the destruction was attributed to downed trees.
As many as nine deaths may have occurred, either directly or indirectly, as a result of Opal. ~t least five of the fatalities were caused by falling trees. Other causes included traffic accidents and a heart attack.
Summary of NWS Issuances by Local Offices
Affected coastal offices began issuance of HLSs early on October 3 shortly after the NHC posted a hurricane watch from Morgan City, Louisiana, to Pensacola, Florida. The statements were issued approximately every 3 hours until Opal approached the coast. At that time and until just after landfall, the statements were issued more frequently.
The statements were well written and emphasized the potential danger posed by Opal, both from wind and storm surge. Several comparisons were made, both in the headlines and body of the statements, to Hurricane Camille and the disastrous effects she had on the Gulf coast. A few of the statements, Just prior to Opal's landfall, warned of devastating or catastrophic damage near and to the east of the eye.
A number of other products were prepared and disseminated by the offices in the path of Opal. The details of these issuances follow.
Southern AlabamafNorthwest Florida
A total of 11 tornado warnings were issued for the CWA of NWSO Mobile on October 3 and 4. However, due to an unfortunate lightning strike, the NWSO suffered severe damage to many of its office detection and communication systems (see next section for more details), and NWSO Tallahassee and NWSFO Birmingham had to assume warning backup responsibility for several hours. Of the 14 warnings issued for the Mobile CWA, NWSO
Mobile issued 8; with NWSO Tallahassee issuing 5, including a tornado warning for the deadly twister at Crestview, Florida; and NWSFO Birmingham issued one-a special marine warning for the Alabama and northwest Florida coastal waters.
It is important to note that NWSO Mobile was not without monitoring and detection capability. In fact, many of the decisions to warn were made by the NWSO in close coordination with the Tallahassee and Birmingham offices. The staff was just unable to transmit products through its communication systems. NWSO Tallahassee, in addition to carrying backup responsibility for NWSO Mobile, issued a number of warnings for its CWA. Eight tornado warnings were issued as well as one UrbanISmall Stream Flood Advisory for two counties in southeast Alabama.
A preliminary review of the warnings and advisory revealed no glaring deficiencies. In fact, most were concise, timely, and well-worded. It appeared that most of the warnings verified with sufficient lead times. It should also be mentioned that both offices issued numerous NOWs to inform coastal residents of changing conditions. These forecasts were issued about every 3 hours.
Central and Northern Alabama
The NWSFO Birmingham issued a number of products to warn residents of central and northern Alabama of the threat from Opal. The type and number of these products is as follows:
b Short-Term Forecasts 32 Flash Flood Watches 2 Flash Flood Statements 2 High Wind Watches 3
r High Wind Warnings 2 Tornado Warnings 10 Flash Flood Warnings 22
Again, a review of these products revealed that they were well-worded and timely (the watches were issued several hours in advance of the actual effects of opalj. The warnings, where applicable, referenced the use of the WSR-88D as the source for their issuance.
Georgia
The NWSFO Atlanta issued several warnings, watches, and statements during Opal. The office disseminated two flash flood watches for central and north Georgia (2:30 p.m., EDT, on October 3, and 5 a.m., EDT, on October 4). A total of 12 flash flood warnings were issued by the NWSFO for its CWA, the first early'in the morning of October 4. Further, 8 high wind warnings and watches were issued from early on October 4 to early on the October 5. Finally, 12 flash flood statements and special weather statements were issued by NWSFO Atlanta to update Georgia residents on the threat from Opal.
Most of the warnings, watches, and statements were for residents in west and northern Georgia, or just to the east of Opal's track. The issuances were informative and well-worded. Because the area had received several inches of frontal-induced rainfall the day before Opal's arrival, the flash flood products stressed the likelihood of immediate problems resulting from the anticipated heavy tropical rains.
The high wind products emphasized the expectation of the wind from Opal reaching 40 to 50 mph, with gusts to 70 mph, across the CWA. It was anticipated that a number of trees and power lines would be downed in the near saturated soil, and damage would occur to weak structures. Several of the products included strong call to action statements.
Problems Affecting Services
While the NWS offices in the path of Opal were quite responsive and provided good service, the operations were not without problems, many of which dramatically impacted their services.
Southern Alabama/Northwest Florida
Lightning struck NWSO Mobile on October 3 (the day before landfall) and severely damaged the WSR-88D, Automation of Field Operations and Services (AFOS), peripheral personal computers and printers, Microcomputer Satellite Weather Information System, and Microcomputer-Aided Processed Surface Observations. AFOS remained in degraded mode until early afternoon on October 4, when it was finally returned to full operating capability several hours before Opal came ashore. The Auxiliary Backup Terminal was utilized in a dial-up mode during the period of degraded operations. It functioned satisfactorily; however, warning responsibility was handed off to NWSO Tallahassee and NWSFO Birmingham for much of the day of October 3 and for a short period of time on October 4.
The U.S. Air Force worked with NWSO Mobile to provide NEXRAD data from Eglin AFB. The radar at Keesler AFB was also made available for use as a backup.
The office's WSR-88D was not restored to full operating capabilities until the day after Opal's landfall, however, the Principal User Processor (PUP) remained operational throughout the event and allowed for continued dial acquisition of data from the Eglin AFB WSR-88D. The connection was disrupted for only a brief period, from 1 1 : 15 a.m. to 1 :45 p.m., CDT, on October 3. During this disruption in data availability, warning backup responsibility was transferred to NWSO Tallahassee and NWSFO Birmingham. It was within this time window that the Crestview tornado and a fatality occurred. NWSO Tallahassee issued the warning for that storm at 11:37 a.m., CDT, and it was still in effect when the tornado struck at the location of the fatality at 12:30 p.m., CDT, on October 3.
Findine 3: NWSO Mobile lost the use of their radar due to a lightning strike the day before Opal's landfall, however, the PUP remained operational. The PUP gave them the capability to dial into the WSR-88D at nearby Eglin AFB.
Recommendation 3a: When lightning strikes the WSR-88D, often other peripheral equipment in the office is also damaged, as was the case at NWSO Mobile. While this was investigated each time it occurred, a detailed study must be done to determine how to protect the equipment from damage. Plans should be made to install any additional devices to lessen the chances of damage in the future.
Recommendation 3b: While extra equipment cannot be installed at all lightning susceptible locations, dedicated ports on adjacent WSR-88Ds need to be added to ensure ready access on a dial-up basis to support backup capability. Configuration of all radars should be looked at carefully to optimize use.
Recommendation 3c: Coastal locations should be provided with additional phone numbers for nearby WSR-88D sites (i.e., Eglin AFB) in the event that the number normally used to dial in remains busy.
The Pensacola NWR, which is programmed by NWSO Mobile, went off the air for several hours during the night of October 3. It was restored to service by the morning of October 4. However, the NWRs at both Mobile and Pensacola lost power just prior to Opal's landfall on October 4. Neither installation was equipped with a backup power source.
In NWSO Tallahassee's CWA, the Pelham, Georgia, NWR lost power for 3 to 4 hours during the night of October 4. There was no emergency power generator at this site.
Additionally, the Tallahassee NWR lost power during the night of October 4. An emergency power source was available at this site but allowed the NWR to operate at low power (100 watts). When the transmitter was operating at this low power, the broadcast was much more difficult to receive, especially in the outlying areas. A number of users commented on this problem. Commercial power was restored early on the morning of October 5.
Another problem noted by NWSO Tallahassee involved the physical office configuration. The temporary operational space precluded their capability to host the media during a storm event. In addition, the "split operations" requirement brought about by upper-air sounding releases performed at another location placed additional stress on the staff during an event of this magnitude. The situation was aggravated when special sounding releases were requested.
m Central and Northern Alabama
The most significant problems caused by Opal were outages of NWR at Columbus, Georgia, and Mt. Cheaha near Anniston, Alabama. SRH records indicated that emergency power was available at both sites. The Columbus NWR went off the air late Wednesday night, October 4, and returned to service late in the morning of October 5.
The Mt. Cheaha transmitter went off the air the night of October 4. The antenna is at 2,620 ft MSL (the wind from Opal could have been in excess of 100 mph at the site). The~e was possible antenna andlor coaxial cabling damage at the site. Records indicate that this transmitting site, too, was equipped with an emergency power source.
The NWR workload during Opal increased significantly at NWSFO Birmingham. There were so many products to broadcast and not enough playback decks to accommodate the information. Additionally, the programming of seven consoles was quite a task during such a rapidly changing event when current information was so critical.
There were potential problems with the NWS products as well. Well after Opal's landfall, forecasters at NWSFO Birmingham were shouldered with highlighting a hurricane warning in their southern zones forecast during a time when the winds were obviously decreasing. It was felt that the warning was maintained too long.
A source of confusion among the public was the issuance of an Inland High Wind Watch. The perception is that the public cannot differentiate between our use of the "Inland" High Wind Watch and just a High Wind Watch.
Not having the inland offices with some coastal oversight responsibility involved in the NHC coordination calls resulted in some lost time. It took too much time to relay important information that inland offices require. This was compounded by the fact that Opal moved quickly toward the coast and was such a large storm.
NWSFO Birmingham has never been on the hurricane hotline, and cumbersome work-arounds have been used to have the Birmingham forecasters involved in the discussions of tropical systems approaching their forecast area. This problem will be solved with the upgraded NAWAS.
Georgia
Inland sections of Georgia experienced a great amount of tree and power line damage from Opal. As a result, there was considerable loss of power across western sections of the state. Power was interrupted anywhere from several hours to several days. The Stone Mountain (Atlanta) NWR transmitting antenna was tilted about 30 degrees as a result of Opal's strong wind. It remained that way for nearly 3 weeks until repairs could be made. Reception was affected in the fringe areas of the coverage pattern.
The transmitter at Chatsworth, Georgia, also went off the air due to loss of commercial power in the area. It was out of service for 3 days. Emergency power was not available.
Local Coordination with the Media and Emergency Management
Southern Alabama/Northwest Florida
Coastal emergency management officials in the Mobile CWA were routinely contacted prior to the issuance of an HLS (approximately every 3 hours) from the time of hurricane watch issuance until after Opal had moved well inland. Intermediate telephone calls were placed a.ndlor received as necessary. The media was given access to NWSO Mobile's unlisted telephone number which allowed them to place a number of calls for information. Preliminary feedback from emergency management officials and the media across the area indicated that they were kept well informed during the event.
Coordination was somewhat more involved in the Tallahassee CWA. The state of Florida Department of Emergency Management (DEM) held numerous conference calls with representatives from the affected counties, NHC, and the NWSO. These calls proved beneficial for several reasons: (1) to brief local emergency management directors, and (2) to quality control any information provided by DEM personnel to the counties.
According to the Post Storm Assessment prepared by Mr. William A. Wagner, Jr., the Escambia County Assistant Manager stated that he did not feel he had adequate detailed weather-related information from NHC. He also made the comment that the Mobile NWS gave them better guidance. This lack of understanding of where the support is supposed to come from indicates that WCMs may need to provide more training to emergency management officials in their CWA. Additionally, the independent report from Dr. Jay Baker (see chapter 3) indicates that those officials may need continuing training on how to use NWS products.
Finding 4: While most counties receive NWS products, many are only marginally prepared to use them. In general, counties with large metropolitan areas are more advanced than their more rural counterparts.
Recommendation 4: WCMs should redouble their efforts to provide training to all emergency management officials in their CWA to ensure that they are prepared to use hurricane-related NWS products appropriately and to their full potential. Other possible training options, such as distance learning modules of FEMA's Hurricane Course, should be explored.
A NAWAS drop was installed at the NWSO Tallahassee on the afternoon of October 4. This enabled verbal relay of the NOWs to emergency management officials in southeast Alabama.
Several radio interviews were conducted although requests were less than with other storms earlier in the season. The DEM had a spokesperson who fielded a number of the interview requests across the CWA. Further interaction with the media by the NWS is sought, and options for accomplishing this will be examined.
Finally, the World Wide Web Home Page developed by NWSO Tallahassee was accessed about 50,000 times during Opal. This, however, was somewhat less than during Hurricane Erin in August.
Central and Northern Alabama
The AWSC at Auburn was a major player in the local coordination arena. Two areas of coordination were of particular note. Local amateur radio operators commented on the excellent service provided them by the AWSC. At their request some years back, the AWSC established a computer gateway to funnel critical information to the various area operators. The severe weather information that the AWSC provided through this system was very timely and much appreciated by the operators.
Coordination became critical between the AWSC and Auburn University officials early in the morning of Wednesday, October 4. A nationally televised football game between Auburn and Mississippi State was scheduled for Thursday at 7 p.m., local time. Entertainment and Sports Programming Network (ESPN) was to provide coverage for the game. The campus became one large campground with hundreds of trailers, campers, and tents. In the interest of safety and at the urging of the AWSC, campus officials forced the evacuation of these campers, warning that hurricane-force winds would impact the area during the night and into Thursday. In addition, the AWSC recommended that ESPN dismantle their temporary lighting and production facilities that they had erected around the stadium. The campus shut down at 1 p.m., local time, on Wednesday, and the football game was subsequently postponed.
Positive comments were received from emergency management officials in the Birmingham CWA. In particular, the information contained in the high wind warnings and watches received praise as providing an accurate delineation of the counties to be affected and anticipating the maximum wind.
One negative concern was voiced, however. The Alabama State Emergency Management Agency lost some of their communications capability and vendor-supplied weather services during Opal. It was their perception that the NWS did not contact them enough. The NWSFO staff provided NAWAS briefings after each coordination call with NHC and, of course, disseminated all of their issuances via NWWS.
Georgia
Overall, coordination with emergency management officials and the media seemed to have gone very well, with most of the information the media requested given in a timely manner. The MIC at NWSFO Atlanta held hourly coordination calls with numerous emergency management officials across their CWA, beginning several hours prior to the onset of Opal's effects. In addition, a conference call was conducted with the Georgia Emergency Management Agency (GEMA) coordinators around 11 a.m., local time, on Wednesday, October 4. The call proved quite beneficial since much of the information received from the NWS was used in a news conference that GEMA officials held later in the day.
Perception of Public Response
The minimal loss of life from this destructive storm is, in itself, sound testimony to the overwhelmingly good public response to NWS products and services. There were no reported deaths attributable to Opal's storm surge.
A major contributing factor in the public's willingness to respond was likely due to the recent tropical storm and hurricane experiences along this section of the Gulf coast. The hurricane season of 1995 was one of the most active storm seasons on record, and coastal residents of Alabama and northwest Florida vividly remembered the effects of Hurricane Erin as it made landfall near Pensacola, Florida, on August 3, 1995.
Additionally, the affected NWS offices' comparison,of Opal's strength and potential impact to that of Camille and, the recent Andrew, undoubtedly raised the awareness of coastal residents.
Several of the HLSs issued by NWSOs Tallahassee and Mobile stressed these comparisons and warned of massive destruction near and to the east of Opal's track.
Despite Opal's fast movement and rapid strengthening, coastal residents responded appropriately to the evacuation requests. In fact, media reports estimated well over 100,000 residents fled inland in the days before Opal's landfall. However, just prior to Opal's arrival on the coast, several thousand residents of northwest Florida were "bottled up" on U.S. Highway 29, the main escape route from Pensacola northward into Alabama. Further, Interstate 10, the main east-to-west evacuation route, was jammed with traffic only able to crawl along at 5 mph. These backups were due to construction and abandoned cars as well as the large volume of traffic.
The unusual size and strength of Opal, unlike other storms this season, had a considerable effect on inland residents. They, too, responded well. to NWS-supplied information, despite some expression of initial disbelief that the storm would have such an effect so far inland. One newspaper reporter in Georgia even posed the question to the MIC at NWSFO Atlanta of whether "we were crying wolf" on this storm.
NWS products stressed the inland impact of Opal, particularly the threat of severe damage from wind and heavy rain. Predictions, especially with regard to the wind, were quite accurate and drew high praises. Many state agencies took immediate action and closed schools and businesses. Stores geared up for the onslaught of residents seeking to gather supplies in expectation of being without power for an extended period.
Media reports in the aftermath of the storm praised the "Government" for the work they did in preparing residents for this event. One editorial in an Alabama newspaper specifically lauded the "bureaucrats" from NOAA for their warnings of the impending hurricane.
Eastern Region
Impact of the Storm
As is usual with hurricanes, Opal's impact lessened as it moved inland. Nonetheless, two fatalities were associated with Opal in North Carolina. The first was in Buncombe County where a trailer was struck by a falling tree. The other fatality was associated with the post- storm cleanup when a tree fell on a man while he was using a chain saw to cut tree limbs in Madison County.
The NWSFO Baltimore/Washington, D.C., CWA was impacted by a series of tornadoes which struck east-central Maryland as the remnants of Opal moved through the Mid-Atlantic States' region. At least three separate and confirmed tornadoes, each preceded by a tornado warning, were spawned by a powerful rotating thunderstorm between 8:30 and 9:45 p.m., EDT, on October 5. (The NWSFO's CWA may have been impacted by as many as seven tornadoes.) The strongest tornado, estimated as an F2 with associated winds estimated up to 150 mph, most heavily impacted the Temple Hills, Maryland, area of Prince George's
County. Preliminary property damage estimates with this tornado were $5 million. The second confirmed tornado, an F1, moved through Charles County, Maryland, between Ironside and Grayton. The third confirmed tornado, classified as an FO/Fl, impacted western Anne Arundel County between Odenton and Glen Burnie.
Two tornadoes, which were also preceded by tornado warnings, touched down in the NWSO Wakefield, Virginia, area. One of the tornadoes struck a small airport and destroyed or damaged several planes. An FO tornado also occurred in Greenville County, South Carolina, at 3:35 a.m., EDT, on October 5.
Opal's effects were indeed far-reaching. As the former hurricane was exiting the United States, it provided heavy rains to the NWSFO Buffalo, New York, forecast area. Buffalo issued a flood watch and subsequent statements; fortunately, however, no extensive flooding occurred.
Elsewhere, the combination of Opal's remnants and a frontal complex along the Atlantic coast brought heavy rains to many areas. Rains in South Carolina averaged 2 to 4 inches, while in North Carolina, 3 to 5 inches were common. Highlands, North Carolina (in Macon County), recorded 8.95 inches. Robinson Creek (in Jackson County, North Carolina) measured 9.89 inches. Much of the area from Maryland to the north received 1- to 3-inch rains, with isolated 4-inch amounts.
Strong winds also occurred in many areas of the Region. Along the coast, a 76-mph gust was recorded in Charleston Harbor during a severe thunderstorm. Further inland, a peak gust of 81 rnph occurred atop a 4,320 ft mountain located just east-southeast of Asheville, North Carolina. Large-scale tree damage and power outages were common in many locations of the southern Appalachians where sustained winds averaged around 40 mph with frequent gusts around 60 mph. Significant property damage also occurred in this area although the final damage figures were still being assessed. Indicative of the damage was the $2.5 million of immediate public assistance required in Jackson County, North Carolina.
Local Coordination with Media and Emergency Management
Local office coordination with the media and emergency managers was excellent in most instances. There were some problems, however, as denoted below.
Delivery of information to some counties was a significant problem. Some emergency management agencies had sophisticated means of receiving NWS data, while others had antiquated equipment or no means of receiving information in a timely manner.
find in^ 5: Delivery of NWS information to some counties was a significant problem, While some large metropolitan areas and state officials receive NWS products from NWWS, there are a large number of emergency management officials who have no real-time access to NWS warnings and advisories.
Recommendation 5: While the NWS encourages all emergency management officials to subscribe to NWWS as the best means of obtaining critical data from the NWS, an
alternative system of disseminating warnings and watches should be implemented for those areas that do not subscribe to NWWS due to its cost. Accordingly, the NWS should continue to support the new service called Emergency Managers Weather Information Network (EMWIN) which can provide emergency managers with critical weather information in a real-time mode. This is a low-speed broadcast that transmits over 5,000 pages of non-value added weather information daily. This data stream contains both alphanumeric and graphic products and some satellite imagery.
In the NWSO Greenville-Spartanburg, South Carolina, area, a number of counties had trouble receiving some of the information on a timely basis. This was compounded by many areas not having access to the important Nowcast products since The Weather Channel, in some outlets, was not equipped to display the Nowcasts. This deficiency is a result of a local cable company's decision to not upgrade their "Weatherstar" to the latest version. Additionally, North Carolina Emergency Management Area F and one or two counties expressed that they were not kept abreast frequently enough. The NWSO will work with these officials to ensure proper close coordination during future events.
NWSO Roanoke, Virginia, discovered during this event that newspapers and radio stations used several local office numbers to reach the NWSO. This, in turn, involved the office staff in a number of interviews at t h e s of extremely heavy workloads. The NWSO will work with the media to keep the calls confined to their media telephone line and will also request that TV stations call in advance before arriving (unannounced) for a "spot." Lastly, the NWSO experienced problems keeping the event in proper perspective for the public since a few media outlets were "hyping" the upcoming situation.
NWSFO ~altimoremashington, D.C., did a particularly fine job staying on top of the rapidly breaking weather event, and its actions resulted in timely recognition of the threat by users. For example, in post-storm conversations with residents, the NWSFO was made aware just how important within-county locations are in the text of a tornado warning. The NWSFO is currently testing software which facilitates the inclusion of cityltown locations for severe thunderstorm or tornado warnings and successfully utilized the technique during Opal's passage.
Lastly, NWSO Charleston, South Carolina, experienced problems with emergency managers in Beaufort County, South Carolina, who had received advice from the U.S. Coast Guard in Savannah, Georgia, to expect winds much higher than forecast in NWS products. This information was subsequently picked up by a state agency in South Carolina and passed along to local marinas. The Savannah Coast Guard, in subsequent conversations with the NWSO, noted that they gleaned their information from sources other than the NWS. The Charleston NWSO will visit this U.S. Coast Guard office shortly to establish better coordination mechanisms between both organizations.
Problems Affecting Service
Finding 6: No tornado watch was in effect for the storms that swept across Prince George's County in Maryland. This was a result of coordination between NWSFO BaltimorefWashington and the SPC, where forecasters at NWSFO Baltimore1 Washington mentioned that although an unstable tropical air mass was over the area, radar indications and the time of day did not suggest the potential for tornadic storms. A tornado warning, with a 6-minute lead time, was issued for Prince George's County. The forecasters at NWSFO Baltimore/Washington indicated that, had all resources of information been readily available as an integrated and displayable data set, they might have been able to discern the potential for tornadoes.
Recommendation 6: Timely delivery of the Advanced Weather Interactive Processing System (AWIPS) is crucial for the integration of model and observational data so that critical information can be used to its fullest in the forecast process. In addition, appropriate training in mesoscale convective processes is vital before the NWS migrates the convective watch program from SPC to WFOs.
Finding 7: A significant problem affecting the NWS services was the pronounced underestimation of precipitation by the WSR-88D in tropical air masses. For example, 6- to 8-inch precipitation amounts in the southern Appalachians were underestimated by a factor of two by the NWSFO Columbia, South Carolina, WSR-88D. NWSFO Raleigh, North Carolina, noted that their WSR-88D estimates averaged 60 to 75 percent of actual rainfall values. NWSO Roanoke, Virginia, reported that their WSR-88D rainfall estimates during OPAL'S passage were between 50 and 75 percent of what actually occurred.
Recommendation 7: Ongoing studies to improve and optimize the adaptation parameters within the WSR-88D Precipitation Processing System (PPS) should continue and be given the highest priority. The inclusion of real-time rain gage data for use by the PPS will likely result in improved precipitation estimates as well. Field forecasters should make more effective use of the satellite precipitation estimates provided by the National Precipitation Prediction Unit.
NWSO Greenville-Spartanburg noted a deficiency on NWR coverage in western parts of their CWA (i.e., in North Carolina and Georgia).
Finding 8: Lack of sufficient NWR coverage affects the delivery of critical weather information to users.
Recommendation 8: Installation of additional NWR transmitters and privately- sponsored repeaters would be a significant step toward remedying the current coverage voids in the CWAs of NWSO Greenville-Spartanburg, South Carolina, and NWSO Tallahassee, Florida.
An important equipment shortcoming that impacted a number of NWSOs and some NWSFOs was the lack of digital satellite imagery. This situation is only slowly being improved and was noted by NWSO Wilmington, North Carolina, as a significant operational problem.
Finding 9: The lack of continuous, high-resolution satellite imagery which takes full advantage of the enhanced capabilities afforded by the new generation of Geostationary Operational Environmental Satellites (GOES) was a significant operational problem affecting services during Opal's passage.
Recommendation 9: The AWIPS should be fielded expeditiously with full functionality to utilize the new GOES data at all future Weather Forecast Office sites as well as the National Centers.
Perception of Public Response
Over most of the Eastern Region, the NWS performance was largely perceived as being excellent. In concert with this perception, public response to NWS products was timely in most cases.
Especially noteworthy were the excellent services provided by NWSFO Baltimore1 Washington, D.C., in advance of, and during, the tornadic storms which impacted their area of responsibility. In addition, NWSO Greenville-Spartanburg and NWSFO Raleigh performed admirably during the passage of Opal. The public was informed well ahead of time on the potential for damaging winds and flood-producing rainfall.
Despite the problems noted above, the conclusion was that NWS products were well received and adequately served the needs of users.
Summary of NWS Issuances by Local Offices
In response to Opal, Eastern Region offices issued a number of warnings, watches, and advisories in conjunction with the threat presented by the storm's heavy rains and wind. Specifically, NWSFO Raleigh had posted a high wind warning for the area, which provided residents in the area with a lead time of 2 hours and 50 minutes prior to the fatality in Buncombe County.
Lead times for the F2 tornado in Prince George's County, Maryland, ranged from 6 to 10 minutes. Similar lead times were also provided by NWSFO Baltimore/Washington, D.C., for the other two confirmed tornadoes in their CWA.
NWSFOs Columbia, South Carolina, and Pittsburgh, Pennsylvania, issued a number of timely, well-worded products to warn residents of their respective forecast areas of the threat from Opal. The type and number of these products is as follows.
NWSFO Columbia, South Carolina NWSFO Pittsburgh, Pennsylvania
Flood Potential Outlook 1 High Wind Watch 1 Small Craft Advisory 1 Flash Flood Watch 2 Flash Flood Watch 1 High Wind Warning 4 Coastal Flood Watch 1 Flash Flood Statement 1 High Wind Watch 1 Wind Advisory 2 High Wind Warning 1 Tornado Warning 1 Flood Warning 2
Surge darrtage at Laguna Beach, FL, Hrtrricarle Opal, October 1995. (Photograph courtesy of Billy Wagner)
Surge damage at Lagzrna Beach, FL, Hrrrricane Opal. October 1995. (Photograph courtesy of Billy Wagner)
Blank page r e t a i n e d f o r pag ina t ion
Chapter 3
Florida Use of NWS Products and Response in Hurricane Opal
PREPARED FOR THE NATIONAL WEATHER SERVICE
BY DR. JAY BAKER
DEPARTMENT OF GEOGRAPHY FLORIDA STATE UNIVERSITY
Background
Hurricane Opal threatened the Florida Panhandle: the coastal counties of Escambia, Santa Rosa, Okaloosa, Walton, Bay, Gulf, Franklin, and Wakulla, from west to east. The five westernmost counties could reasonably be considered at greatest risk to Opal as the storm's forecast tracks varied between Bay and Escambia and because those five counties have the largest populations. Notable cities within the largest counties are Pensacola in Escambia, Fort Walton Beach and Destin in Okaloosa, and Panama City and Panama City Beach in Bay.
The evacuation study data, in place at the time Opal occurred, was produced in the 1986 Tri-State Hurricane Evacuation Study, conducted by the Mobile District of the Army Corps of Engineers. The study is being updated in 1996, but an emergency management concern was the age of the evacuation clearance time data appearing in table 1. The general feeling was that population growth had caused clearance times to increase, but no one knew how much. Clearance times were also calculated for slower response times, tended to add 3 to 4 hours to the figures in table 1, depending upon the county, with the mode being about 2 hours. Thus, table 1 is optimistic with respect to the rapidity of public response. Higher tourist occupancy assumptions increased times by about 4 hours on average, with Bay affected the most. However, when Opal occurred, the low occupancy scenario was probably applicable. The 1986 Tri-State study also indicated that if officials were to "one-way" all four lanes of U.S. 231 out of Bay County, clearance times could be reduced to 7:30 and 8:30 for category 1-3 and category 4-5 storms, respectively, with quick response and low tourist occupancy. As indicated in table 1, clearance times for category 1, 2, and 3 storms are essentially the same as are times for category 4 and 5 storms, Moreover, for the optimistic assumptions used in table 1, there is relatively little difference across all categories of storms.
Table 1
Evacuation Clearance Times for Five Western Panhandle Counties in Florida
(Hours:Minutes)
1986 Tri-State Study Clearance Times Rapid Response/Low Tourist Occupancy
Cat 1-3 Cat 4-5 Escambia 13:OO 15:30 Santa Rosa 6:30 7:45 Okaloosa 12:15 14:15 W a1 ton 6:15 8:00 Bay 22:OO 2545
Forecast Summary
From an emergency management perspective, Opal was well behaved until the evening of Tuesday, October 3, 1995. At 4 p.m., CDT, Opal had sustained winds of 98 mph but was large, with tropical storm-force winds extending 230 miles from the center. Landfall was forecast to occur near Ft. Walton Beach Thursday morning, October 5, at 6 a.m., CDT, with winds of 109 mph-almost a category 3 hurricane. Pensacola's probability was 22 percent and Panama City's, 23 percent. A watch (already in place since early Tuesday morning) was extended from Morgan City, Louisiana, to the Suwannee River in Florida.
An intermediate advisory at 7 p.m., CDT, said "Opal now packing 100 mph winds," and said that a warning would probably be issued later that night. It also noted that some further increase in forward speed was expected and that tropical storm-force winds could arrive on Wednesday. Officials were reminded about the Yom Kippur religious holiday.
A tropical cyclone update was issued at 8:30 p.m., CDT, saying that Opal had increased in forward speed, hurricane-force winds would be felt earlier than previously expected, and a Hurricane Warning would be issued at 10 p.m., CDT. A conference call was held near this time with emergency management officials.
The 10 p.m., CDT, advisory included a warning from Mobile, Alabama, to Anclote Key, Florida. Pensacola's probability was 28 percent; Panama City's (where landfall was projected) was 36 percent. Winds were up to 115 mph sustained and forecast to reach 120 mph at landfall. Most importantly, landfall was now forecast to occur Wednesday at
6 p.m., 12 hours earlier than in the previous forecast-a classic case of losing 18 hours of response time in a 6-hour period.
By 4 a.m., CDT, Wednesday, October 4, winds were up to 121 mph and forecast to reach 132 mph (a category 4), landfall to occur Wednesday at 8 p.m., CDT. Probabilities had shifted so Pensacola was at 39 percent and Panama City, 30 percent. Projected landfall location was to be near the AlabamaIFlorida line, and the warning area was extended west to the mouth of the Mississippi River.
By 7 a.m., CDT, Wednesday, October 4, winds were 135 mph (category 4), and by 10 a.m., CDT, they were 149 mph. At 10 a.m., CDT, landfall was forecast for Pensacola Wednesday, October 4, at 6 p.m., CDT. Pensacola's probability was 70 percent, and Panama City's was 46 percent.
By 4 p.m., CDT, Wednesday, October 4, sustained winds were down to 126 mph but forecast to remain there until landfall at 6 p.m., CDT, at Pensacola (probability 99 percent; Panama City probability, 51 percent). Tropical storm winds extended 258 miles from Opal's center.
HLSs from both Mobile and Tallahassee were numerous and informative. Specific evacuation actions taken by counties were spotty, however, and became more so as evacuations proceeded. Both offices were aggressive in communicating the danger posed by Opal when intensity approached category 5 status, but neither offered specific response recommendations for non-surge residents.
Response Summary
Decision making obviously became difficult Tuesday evening, October 3, when Opal increased forward speed dramatically. A case could be made, however, that even before that event at 4 p.m., CDT, on Tuesday, October 3, emergency management officials faced a significant decision. Plans normally call for evacuations to be completed before arrival of tropical storm-force winds, and at 4 p.m., CDT, tropical storm winds were forecast to arrive from 1 p.m., CDT, Wednesday, October 4, in Pensacola to 8 p.m., CDT, Wednesday, in Panama City. Even with that forecast, waiting until Wednesday morning to begin the evacuation would continue the evacuation well after arrival of tropical storm-force winds. In Panama City, the situation would have been even more risky if reverse laning U.S. 231 would not be used. More importantly, if decisions made at 4 p.m., CDT, Tuesday, October 3, had assumed that Opal would increase forward speed more than forecast at that time, waiting until Wednesday morning, October 4, to begin the evacuation would have appeared even more risky. In fact, if Opal's 4 p.m., CDT, forecast were offset by the average forecast error for that time period, the center could be expected to arrive in 17 hours rather than 30, and tropical storm-force winds could be expected to arrive in 8 hours rather than 16 hours.
At 10 p.m., CDT, 12 hours were shaved from the response time anticipated to be available. Landfall was then forecast to occur in approximately 20 hrs, with tropical storm winds arriving in 10 hours or less. Emergency management officials had to decide whether to
initiate nighttime evacuation or wait until morning. Most, but not all emergency managers, waited until Wednesday or did not make aggressive efforts Tuesday evening. Many officials expressed reservations about the success of nighttime evacuation although there is no empirical basis for the reservations. The next decision point came late to mid-morning Wednesday when roads were congested and the storm was approaching category 5 strength. Officials had to decide whether to urge more people to evacuate, which would congest routes further, or dissuade people in least hazardous locations from leaving at all, to prevent further nonessential traffic. There were concerns that too many residents from non-surge areas would attempt to evacuate as was experienced with Andrew in south Florida.
Most counties receive the majority of NWS forecast products, but many are marginally prepared to use them. In general, larger counties are more advanced than smaller counties. Although all recognize that forecasts are subject to error, none use probabilities in a quantitative or structured manner. Most do use clearance times and pre-landfall hazards times in decision making. All issue evacuation notices for areas derived in some manner from Sea, Lake, and Overland Surge from Hurricanes (SLOSH) data (i.e., adaptations to meaningful landmarks vary). There are no evacuation zone maps readily available to the public, such as in telephone books, although the Pensacola News Journal and the Northwest Florida Daily News publish evacuation maps which they insert in their papers at least once a year.
Everyone likes NHC conference calls. HLSs are not apparently significant to counties, but counties do appear to rely on direct contact with NWS offices. Mobile NWS got higher marks than Tallahassee NWS with respect to accessibility. No place acknowledged receiving forecast data from the Florida Division of Emergency Management via satellite.
The western part of the region (Escambia, Santa Rosa, Okaloosa, Walton, Bay) felt frustrated by out-of-date evacuation data. The study is scheduled for update in 1996 but was originally prepared using 1980 census data. Bay County, however, did have updated SLOSH data available.
All counties issued mandatory evacuation orders no later than Wednesday morning. Many issued recommendations Tuesday night or told residents to begin leaving first thing Wednesday morning. Most disseminated notices with public address systems in neighbor- hoods or door-to-door, in addition to using electronic media. Escambia and Santa Rosa used automated phone notification systems.
Most counties felt that public response was too slow. Some believed that media and public attention was focused on the 0. J. Simpson trial verdict. Too many people waited until mid- morning Wednesday to leave, resulting in congestion of the evacuation routes. Most believe mild effects from Erin, Allison, 1994 tropical storms, and a miss by Jerry led to complacency.
To alleviate congestion, Bay County made U.S. 231 one way. Escambia opened "refuges of last resort" (regular shelters outside of surge areas which would not normally have been used) for people stuck in traffic. Escambia County stated that many evacuees from Okaloosa and Santa Rosa Counties came and were sheltered in their county which added to traffic congestion and overcrowding in shelters. Most areas felt congestion was aggravated by road
construction in many locations. Congestion was reported on 1-10 (more than 9 hours to travel from Pensacola to Tallahassee), 1-65 (crawling a long way north of Mobile), and local roads.
The Florida DEM made the wind display module of Hurrevac software and Hurrcom software available for downloading Hurrevac files and NHC advisories after Opal. Gulf, Franklin, and Wakulla Counties already had Hurrevac, complete with evacuation zone maps and clearance times. Three of the counties (Escambia, Okaloosa, and Walton) purchased Enhanced GDS software with their own funds to assist their decision making. The software available to counties was generally underutilized in Opal. Some counties utilized tracking software, such as HURRTRAK Pro used by Okaloosa County. Most emergency managers in the area would benefit from training in decision-making procedures, not just use of software. Of particular need is training in the incorporation of forecast errors into decision making. In fact, decision- making training was being arranged in the wake of Erin but did not occur before Opal.
Counties and the Florida DEM were generally very happy with the NHC in Opal. NHC made a conference call Tuesday afternoon in time for the late TV news to say that Opal was increasing forward speed and strengthening (changing forecast landfall time from Thursday, October 5, at 6 a.m., CDT, to Wednesday, October 4, at 6 p.m., CDT). No one was critical of the need to change the forecast or of failure to forecast the degree of intensification or loss of intensity before landfall.
Wind damage three blocks inland at Holiday Isles, Destin, FI,, Hurricane Opal, October 1995.
(Photograph courtesy of Billy Wagner)
Wind damage at Navarre Beach, FL, Hurricane Opal, October 1995. (Photograph courtesy of Billy Wagner)
Chapter 4
Conclusion
Hurricane Opal made history once it became a tropical storm and was named-it was the first ever "0"-named storm in the Atlantic. This was the most active season since the practice of naming tropical cyclones began in 1950. However, the 1933 season still holds the title of the most active Atlantic hurricane season since records have been kept. Opal was significant in other ways, too. At its greatest intensity, it had a lower pressure than both Hurricanes Andrew and Hugo. Opal was also one of this century's costliest storms.
The major focus of hurricane awareness is often the threat of the storm surge. Without a doubt, a landfalling hurricane will produce a storm surge, and that surge, coupled with waves, may cause significant damage. However, other threats can be potentially devastating as well, such as the winds with Andrew and the flooding with Alberto. Opal was a classic hurricane in that it brought all the possible threats-storm surge, breaking waves, high winds, tornadoes, and flooding.
As disastrous as Opal was to the Florida Panhandle, it could have been even worse. Opal deepened rapidly but began to weaken as it moved near the shore, thus lessening the winds and storm surge. Opal moved relatively fast as it approached land. There was a significant amount of moisture associated with this system and if Opal had been a slow-moving storm, the flooding could have been devastating for much of the eastern United States.
Although the property loss was great, the loss of life was minimal in the United States. The timely products and services issued by the NWS offices provided both the emergency management officials and the public with the information needed to make difficult decisions related to the protection of life and property. This same area had been hit by Hurricane Erin earlier during the season. With such a recent experience still in their minds, the majority of residents along the coast evacuated. However, delays were encountered on the roads due to such problems as construction areas and abandoned cars. If Opal had not weakened considerably during the hours before landfall, a significant loss of life could have occurred among those trapped in their cars as the core of a major hurricane made landfall.
Major hurricanes such as Opal, Andrew, and Hugo will threaten our coasts again. The NWS forecast tracks have improved over the years, and research is continuing to improve intensity forecasting. The NWS will continue working with emergency management officials and the public to ensure the best information gets to them quickly and in the best possible way. While we expect coastal property damages to remain high as long as the development of the coastline continues, the possibility for major loss of life exists. Therefore, the NWS must continue its efforts to educate emergency management officials and the public to the threats from landfalling tropical cyclones.
Storm surge damage between Navarre Beach and Villa Sabine, FL, Hurricane Opal, October 1995.
(Photograph courtesy of Brian E. Smith)
Beach erosion (105 miles east of landfall) at Mexico Beach, FL, Hurricane Opal, October 1995.
(Photograph courtesy of Billy Wagner)
Appendix A
Categorv
ONE
TWO
THREE
FOUR
FIVE
~affir-simpson Hurricane Scale*
Definition-Likelv Effects
Winds 74-95 mph: No real damage to building structures. Damage primarily to unanchored mobile homes, shrubbery, and trees. Also, some coastal road flooding and minor pier damage.
Winds 96-110 m ~ h : Some roofing material, door, and window damage to buildings. Considerable damage to vegetation, mobile homes, and piers. Small craft in unprotected anchorages break moorings.
Winds 111-130 m ~ h : Some structural damage to small residences and utility buildings with a minor amount of curtainwall failures. Mobile homes are destroyed. Flooding near the coast destroys smaller structures with larger structures damaged by floating debris. Terrain may be flooded well inland.
Winds 131-155 mph: More extensive curtainwall failures with some complete roof structure failure on small residences. Major erosion of beach areas. Major damage to lower floors of structures near the shore. Terrain may be flooded well inland.
Winds greater than 155 mph: Complete roof failure on many residences and industrial buildings. Some complete building failures with small utility buildings blown over or away. Major damage to lower floors of all structures located near the shoreline. Massive evacuation of residential areas may be required.
* In operational use, the scale corresponds to the I-minute average sustained wind speed as opposed to gusts which could be 20 percent higher or more.
Appendix B
Meteorological Summary
Tables
Appendix B, Table 2
Ship Observations of 34 Knots or Higher Associated with Hurricane Opal
Tropical Ship Date Time Position Wind (kt) Pressure Cyclone Call Sign MoJDa UTC LatN LonW DirlSpeed (mb)
1-10 & East Bay Pensacola Airport (FAA-site) Pensacola (PNS) Pensacola (NPA) Ellyson (near PNS) Hurlburt Field (HRT) Fort Walton Beach Eglin AFB (VPS) Panama City (PAM) Apalachicola (AQQ) St. George Island
Causeway Tallahassee (TLH) Tallahassee
(FSU Weather Station) Turkey Point (TUPF) Brooksville (BKV) New Port Richey Tampa (TPA) St. Petersburg (PIE) Sarasota Winter Haven
Appendix B, Table 3a (cont.)
Hurricane Opal Selected Surface Observations
October 1995
Minimum sea-level Maximum surface wind speed pressure (kts) Storm surge
* NOAA buoys report an 8-minute average wind, and C-MAN stations report a Zminute average wind.
Appendix B, Table 4
Watch and Warning Summary Hurricane Opal
DateITime (UTC) Action Location
Tropical Storm Warning Northeast portion of the Yucatan Peninsula from Cozumel and Cancun to Progreso
Tropical Storm Warning extended Yucatan Peninsula from Progreso to Celestun
Tropical Storm Warning extended Yucatan Peninsula from Progreso to Veracruz
Yucatan Peninsula east of Progreso Tropical Storm Warning discontinued
Morgan City, Louisiana, to just west of Pensacola, Florida
Hurricane Watch
Hurricane Watch extended Pensacola to the mouth of the Suwannee River, Florida
Tropical Storm Warning discontinued
All portions of the Yucatan Peninsula
Tropical Storm Warning Morgan City, Louisiana, to the mouth of the Suwannee River, Florida
Hurricane Warning
Tropical Storm Warning extended
Mobile, Alabama, to Anclote Key, Florida
South of Anclote Key to Venice, Florida
Tropical Storm Warning and Hurricane Watch discontinued
West of Grand Isle to Morgan City, Louisiana
Hurricane Warning extended Mobile, Alabama, westward to the mouth of the Mississippi River, including coastal Mississippi
Tropical Storm Warning and Hurricane Watch extended
Grand Isle, Louisiana, westward to just east of Morgan City, Louisiana, including metropolitan New Orleans
Tropical Storm Warning, Hurricane Warning, and Hurricane Watch discontinued
West of Mobile, Alabama
All remaining coastal Watches and Warnings discontinued
Appendix C
Fujita Tornado Intensity Scale
Cateeorv Definition-Effective
(FO) Gale tornado (40-72 m h ) : Light damage. Some damage to chimneys; break branches off trees; push over shallow-rooted trees; damage sign boards.
(Fl) Moderate tornado (73-112 mph): Moderate damape. The lower limit is the beginning of hurricane wind speed; peel surface off roofs; mobile homes pushed off foundations or overturned; moving autos pushed off the roads.
(F2) Significant tornado (113-157 mph): Considerable damage. Roofs tom off frame houses; mobile homes demolished; boxcars pushed over; large trees snapped or uprooted; light-object missiles generated.
(F3) Severe tornado (158-206 msh): Severe damage. Roofs and some walls torn off well-constructed houses; trains overturned; most trees in forest uprooted; heavy cars lifted off ground and thrown.
(F4) Devastating tornado (207-260 mph): Devastating damage. Well-constructed houses leveled; structure with weak foundation blown off some distance; cars thrown and large missiles generated.
(F5) Incredible tornado (261-318 m ~ h ) : Incredible damape. Strong frame houses lifted off foundations and carried considerable distance to disintegrate; automobile sized missiles fly through the air in excess of 100 yards; trees debarked; incredible phenomena will occur.
Appendix D
FEMA/NHC Coordination
Federal Emergency Management Agency Region IV
1371 Peachtree Street, NE, Suite 700 Atlanta, GA 30309
March 1, 1996
MEMORANDUM FOR: Rainer Donbrowsky NWS
FROM : Bill Massey Hurricane Program Manager F E W Region IV
SUBJECT : ~urxicane Opal Activities
During the Hurricane Opal threat, Dr. Bob Burgee, Director of the National ~urricane center, requested that I activate the "Liaison Partnership Team'' at the NHC. The first test of this concept was during the Hurricane Felix threat earlier in the season. The results of the Felix exgeriment were very positive and Dr. Burgee wanted to test the concept a second time.
The basic concept of this activity is to supplement the NHC staff with several Federal, State and local Emergency Management personnel to provide assistance, coordination and expertise to threatened States, conImunities and agencies. The team consisted of Billy Wagner, Director of the Monroe County Emergency Management Agency, Mike McDonald, Stat6 of Florida ~urricane Program coordinator, and me.
~ctivities undertaken by the team included scheduling conference calls and providing data to Federal and State Emergency Agencies, providing storm-specific data and graphics to those at risk, providing the media with pertinent information and providing direct comrnunications between Dr. Burgee and Mr. James Lee Witt, Director of FEMA.
Director ~ i t t has expressed his support of this concept and has requested that we formalize the concept, train the team and be ready to activate for each threat during the 1996 ~urricane Season.
A training session for the team has been tentatively scheduled for the NHC the last week of April or the first week of May, 1996.
We are excited about this partnership concept between FEMA and the NHC and are committed to making the concept work to the benefit of all parties.
Appendix E
Report of Aerial Survey of Hurricane Opal October 6-7, 1995
Introduction
Hurricane Opal struck the northwest Florida coast on October 4, 1995. This storm produced significant destruction of structures, primarily along the coast. Structures were damaged from the combination of storm tide, waves, and wind. The damaging winds continued well inland, with damage reported just south of Montgomery, Alabama. The hurricane also spawned several tornadoes.
Because of the significant impact that Opal was expected to produce, a hurricane survey mission was planned by the Office of the Federal Coordinator prior to landfall. The survey aircraft was based out of Jackson, Mississippi, well away from the path of the hurricane's damage. The aircraft employed for the survey was a Cessna Caravan, which has a relative long operating range. There were two survey flights. The first day included an over flight of the coastal regions which sustained the worst damage from the hurricane. The survey was conducted by Brian E. Smith, WCM at Omaha, Nebraska, and he was accompanied by Randy McKee, MIC of the Mobile NWSO, and two employees of the USGS. The second day was devoted to surveying inland areas impacted by the hurricane.
Coastal Damage
Damage from the hurricane extended from Pensacola Beach eastward to Mexico Beach. See Appendix E, Figure 1, Damage Map of Hurricane Opal. The eye of the storm passed over Pensacola Beach. The storm then moved rapidly north-northeast inland. Much of the most extensive damage was located along the coast with damage being caused by both storm surge and wind. The worst structural damage was from Pensacola Beach eastward across Navarre to east of Destin. The combination of storm surge and wind produced nearly total destruction of elevated beach homes. Well engineered structures, such as high rise apartments or condominiums, had minor damage such as pulled back rooftops. Some of the most significant damage included a free-standing radio tower toppled in the wind east of Destin, roofs and walls off homes, demolished beach homes, asphalt from U.S. Highway 98 ripped totally off between Destin and Miramar Beach. A tremendous amount of beach erosion occurred between Pensacola Beach and Panama Beach, in the right forward quadrant of the storm as viewed along its track.
Appendix E, Figure 1. Damage Map of Hurricane opal.
The damage was largely confined to the coastline but extensive structural damage from wind extended to the north sidt of Choctawhatchee Bay (north of Destin and east of Mary Esther). In this area, the peak wind speed gusts were estimated to be in the low F2 range (around 115 mph). The extensive destruction of the beach homes might have led some viewers to think the winds were higher. However, the beach homes were destroyed by the combination of wind and the battering from the storm tide and waves.
Inland Damage
Further inland, wind damage was sporadic. There were some structures that received extensive damage. Some of the structures were farm buildings, poorly tied down mobile homes, and outbuildings. The damage was likely caused by the peak gusts which were in the F1 range (73-1 12 mph). This damage was visible to just south of Montgomery, Alabama.
Opal's translational motion was very fast when it moved inland. Because of the fast forward motion, much of the damaging winds were east of the eye. The damage west of the eye was minimal and not as extensive. The damage only extended westward approximately 25 to 30 miles, while east of the eye damage extended 85 to 90 miles.
The only tornado discovered during the survey was the one that struck Crestview, Florida. This produced a concentrated, narrow path of damage of about F2 strength. Mobile homes as well as permanent residences sustained significant damage. As is the case with most hurricane-spawned tornadoes, the path length was short-only 1.8 miles. Although this was the only tornado identified by the aerial survey, there were 18 other tornadoes reported and are indicated on the damage map. Most of these tornadoes produced FO (40-72 mph) damage and would have been either difficult to discern from the hurricane damage or to identify from the aerial survey.