1 Hong Kong Exchanges and Clearing Limited and The Stock Exchange of Hong Kong Limited take no responsibility for the contents of this announcement, make no representation as to its accuracy or completeness and expressly disclaim any liability whatsoever for any loss howsoever arising from or in reliance upon the whole or any part of the contents of this announcement. Hutchison Telecommunications Hong Kong Holdings Limited (Incorporated in the Cayman Islands with limited liability) (Stock Code: 215) AUDITED RESULTS FOR THE YEAR ENDED 31 DECEMBER 2016 HIGHLIGHTS For the year ended 31 December 2016 HK$ millions For the year ended 31 December 2015 HK$ millions FY2016 vs FY2015 Change Consolidated service revenue 7,640 7,674 - Consolidated hardware revenue 4,384 14,368 -69% Consolidated revenue 12,024 22,042 -45% Consolidated service EBITDA 2,392 2,483 -4% Consolidated hardware EBITDA 73 305 -76% Consolidated EBITDA 2,465 2,788 -12% Consolidated service EBIT 971 1,125 -14% Consolidated hardware EBIT 73 305 -76% Consolidated EBIT 1,044 1,430 -27% Service profit 655 722 -9% Hardware profit 46 193 -76% Profit attributable to shareholders 701 915 -23% Earnings per share (in HK cents) 14.55 18.99 -23% Final dividend per share (in HK cents) 6.90 9.00 -23% Full year dividend per share (in HK cents) 10.90 14.20 -23% Consolidated revenue decreased by 45% to HK$12,024 million as a result of lower hardware revenue from lesser demand for new smartphones during the year. Consolidated service revenue was stable at HK$7,640 million. Consolidated service EBITDA decreased by 4% to HK$2,392 million as a result of increase in selling expenses from higher volume of service transactions completed in 2016. Profit attributable to shareholders decreased by 23% to HK$701 million. Final dividend per share is 6.90 HK cents.
Transcript
1
Hong Kong Exchanges and Clearing Limited and The Stock Exchange of Hong Kong Limited take no responsibility for the contents
of this announcement, make no representation as to its accuracy or completeness and expressly disclaim any liability whatsoever
for any loss howsoever arising from or in reliance upon the whole or any part of the contents of this announcement.
Hutchison Telecommunications Hong Kong Holdings Limited
(Incorporated in the Cayman Islands with limited liability) (Stock Code: 215)
AUDITED RESULTS FOR THE YEAR ENDED 31 DECEMBER 2016
HIGHLIGHTS
For the year ended
31 December 2016 HK$ millions
For the year ended
31 December 2015 HK$ millions
FY2016 vs
FY2015 Change
Consolidated service revenue 7,640 7,674 -
Consolidated hardware revenue 4,384 14,368 -69%
Consolidated revenue 12,024 22,042 -45%
Consolidated service EBITDA 2,392 2,483 -4%
Consolidated hardware EBITDA 73 305 -76%
Consolidated EBITDA 2,465 2,788 -12%
Consolidated service EBIT 971 1,125 -14%
Consolidated hardware EBIT 73 305 -76%
Consolidated EBIT 1,044 1,430 -27%
Service profit 655 722 -9%
Hardware profit 46 193 -76%
Profit attributable to shareholders 701 915 -23%
Earnings per share (in HK cents) 14.55 18.99 -23%
Final dividend per share (in HK cents) 6.90 9.00 -23%
Full year dividend per share (in HK cents) 10.90 14.20 -23%
Consolidated revenue decreased by 45% to HK$12,024 million as a result of lower
hardware revenue from lesser demand for new smartphones during the year.
Consolidated service revenue was stable at HK$7,640 million.
Consolidated service EBITDA decreased by 4% to HK$2,392 million as a result of increase in selling expenses from higher volume of service transactions completed in 2016.
Profit attributable to shareholders decreased by 23% to HK$701 million.
Final dividend per share is 6.90 HK cents.
2
CHAIRMAN’S STATEMENT Hutchison Telecommunications Hong Kong Holdings Limited and its subsidiaries report 2016 results achieved in a market under continued downward trend in roaming and hardware revenue. The Group has made continued effort to nurture future service revenue growth by focusing on innovative products offering, enhancing customer service and improving quality on the self-owned advanced network infrastructure. Results Consolidated revenue comprising service and hardware revenue from mobile and fixed-line businesses decreased by 45% from HK$22,042 million in 2015 to HK$12,024 million in 2016. Over 99% of the decline in revenue was due to lower hardware revenue as a result of lesser demand for new smartphones during the year. Consolidated EBITDA and EBIT in 2016 were HK$2,465 million and HK$1,044 million respectively, compared to HK$2,788 million and HK$1,430 million respectively in 2015. Profit attributable to shareholders in 2016 amounted to HK$701 million, a drop of 23% compared to HK$915 million in 2015. Basic earnings per share for 2016 was 14.55 HK cents compared to 18.99 HK cents for 2015. Dividends The Board recommends the payment of a final dividend of 6.90 HK cents (2015: 9.00 HK cents) per share for the year ended 31 December 2016. The proposed final dividend will be payable on Wednesday, 24 May 2017, following the approval of shareholders at the Annual General Meeting of the Company, to those persons registered as shareholders of the Company on Monday, 15 May 2017, being the record date for determining shareholders’ entitlement to the proposed final dividend. Including the interim dividend of 4.00 HK cents per share, full year dividend amounts to 10.90 HK cents per share. This payout is equivalent to 75% of profit attributable to shareholders for the year, in line with the sustainable dividend policy of the Company to enhance shareholder value over the long term. Business Review Mobile business – Hong Kong and Macau Mobile business revenue in 2016 was HK$8,332 million, a decrease of 55% compared to HK$18,477 million in 2015. 98% of the decline in revenue was due to lower hardware revenue because of reduced demand for new smartphones during the year. Hardware revenue decreased significantly by 69% from HK$14,371 million in 2015 to HK$4,386 million in 2016. Mobile net customer service revenue in 2016 was HK$3,946 million, a 4% decrease compared to HK$4,106 million in 2015. The decrease in mobile net customer service revenue was mainly due to a HK$109 million, or 13% decrease in roaming revenue during the year. Excluding roaming revenue, local service revenue was slightly lower than that in 2015 as a result of a drop in customer number in the first quarter of 2016 and such drop was turnaround since the second quarter of 2016. The net customer service margin in 2016 was maintained at 93% despite a lower roaming revenue during the year.
3
EBITDA and EBIT in 2016 were HK$1,333 million and HK$600 million respectively, a decrease of 19% and 39% respectively compared to those of 2015. Service EBITDA in 2016 was 5% lower than that of 2015 mainly as a result of decrease in roaming margin as well as increase in selling expenses from higher volume of service transactions completed in 2016, partially offset by savings in operating expenses. Corresponding service EBITDA margin was maintained at 32%. As of 31 December 2016, the Group was serving approximately 3.2 million customers in Hong Kong and Macau (2015: approximately 3.0 million), of which the number of postpaid customers was approximately 1.5 million (2015: approximately 1.5 million). The overall churn rate of postpaid customers was substantially improved to 1.3% in 2016 from 1.8% in 2015, which reflected much improved customers’ satisfaction on the 4G LTE network quality and enhanced customer service. Customer response from various segments was overwhelming and the number of data-centric customers increased in 2016 following the introduction of innovative lifestyle-related tariff plans with various offerings in speed, content and value-added services. The blended local postpaid net ARPU improved 4% from HK$161 in 2015 to HK$168 in 2016 as a result of higher data consumption during the year. Blended local postpaid net AMPU improved 5% to HK$161 in 2016 from HK$154 in 2015. Growing popularity around OTT applications and IoT usage prompted the Group to prepare for a new era of digitalisation and automation, in which more personalised content will be offered to customers. The Group will focus on developing local and roaming products and tariff plans to meet demand from various customer base and to boost revenue. At the same time, the Group is committed to developing customer loyalty initiatives for long-term benefits. In 2016, the Group enhanced its mobile network by refarming a portion of existing 900MHz spectrum band to enhance indoor 4G LTE coverage, while a new 2300MHz spectrum band was activated to meet the rising demand for data. Small-cell technology was deployed to enhance both coverage and capacity in heavy traffic areas and growing data demand into the 5G era. Fixed-line business Fixed-line service revenue in 2016 was HK$4,127 million, an increase of 4% compared to HK$3,973 million in 2015. This improvement was mainly due to higher revenue from the corporate and business market segments as well as the international and local carrier markets, partially offset by lower revenue from residential market due to keen competition. More revenue was generated by developing ICT solutions for corporate customers with sophisticated needs when compared to 2015. During 2016, the Group deepened penetration of various market segments such as banking, insurance, logistics and healthcare. Moving forward, the Group will place more focus on penetrating new industry segments and offer industry-specific one-stop ICT solutions. In addition, the Group will leverage its data centre capabilities and sophisticated network infrastructure to develop high security cloud solutions to help customers achieve greater cost efficiency, while accelerating digital transformation. EBITDA and EBIT in 2016 slightly decreased by 2% to HK$1,252 million and HK$564 million respectively compared to those of 2015.
4
Outlook The appetite for telecommunications is growing, regardless of evolving economies locally and globally. With this in mind, the Group is committed to introducing innovative products and developing new revenue streams. The Group aims to boost customer loyalty by enhancing mobile and fixed-line service quality. These new initiatives would at the same time help maximise customer satisfaction and promote efficiency in the sales process. The mobile, fixed-line, Wi-Fi and content capabilities of the Group are delivered via integrated network infrastructure and benefit from years of experience in serving a variety of market segments. In addition, the Group is committed to offering customised products and services for the unique needs of each segment. The Group will also focus on offering an array of value-added services and delivering customer experience of the highest standard. I am confident the management team will reinforce our position in mobile and fixed-line businesses. Finally, I would like to take this opportunity to thank the Board and all staff members for their dedication, professionalism and determination to succeed. FOK Kin Ning, Canning Chairman Hong Kong, 28 February 2017
5
MANAGEMENT DISCUSSION AND ANALYSIS Financial Review Consolidated service revenue in 2016 was HK$7,640 million, comparable to HK$7,674 million in 2015. This was the result of a 4% increase in fixed-line revenue, partially offset by a 4% decrease in mobile service revenue.
Consolidated hardware revenue was HK$4,384 million in 2016, a decrease of 69% from HK$14,368 million in 2015 resulting from lesser demand for new smartphones during the year.
Total operating expenses, excluding cost of inventories sold, amounted to HK$6,669 million in 2016, slightly higher than HK$6,549 million in 2015. Overall, total operating expenses were managed such that they had below inflationary incremental change, this outcome was achieved despite higher operating expenses including call centre costs and additional spectrum licence fee amortisation were incurred to help generate future growth.
7,674 7,640
0
4,000
8,000
HK
$ m
illio
ns
14,368
4,384
0
7,500
15,000
HK
$ m
illio
ns
3,977 3,915
830 896
384 437
1,358 1,421
0
4,000
8,000
HK
$ m
illio
ns
6,549 6,669
Other operating expenses
2015 2016
Consolidated service revenue
Key cost items
+89% +89%
+2%
Depreciation and amortisation Staff costs
Customer acquisition costs
2015 2016
Consolidated hardware revenue
2015 2016
-69%
6
Consolidated service EBITDA in 2016 was HK$2,392 million, a decrease of 4% compared to HK$2,483 million in 2015. Consolidated service EBITDA margin was 31% in 2016. Depreciation and amortisation amounted to HK$1,421 million in 2016 compared to HK$1,358 million in 2015. The increase was mainly a result of enhancement of the 4G LTE network infrastructure as well as an increase in spectrum licence fee amortisation on 2100MHz band and 2300MHz band after its activation in 2016. Consolidated service EBIT was HK$971 million in 2016, a decrease of 14% compared to 2015, mainly due to an increase in depreciation and amortisation mentioned above together with the decrease in consolidated service EBITDA. Net interest and other finance costs amounted to HK$95 million in 2016, representing a decrease of 8% compared to HK$103 million in 2015. This decrease was the result of lower notional finance charge on decreasing spectrum licence fee liabilities, partially offset by higher finance costs on increased level of bank borrowings to finance one-off payment of mobile spectrum licence fee on 2100MHz band, the licence period of which was renewed for another 15 years to 2031. Gearing ratio as of 31 December 2016, calculated by dividing net debt by net total capital, was 26% (2015: 20%) as a result of higher net debt position. Share of joint venture losses in 2016 decreased to HK$21 million compared to HK$34 million in 2015 mainly due to improved occupancy performance of the data centre joint venture business in 2016. Overall, profit attributable to shareholders of the company in 2016 was HK$701 million, a decrease of 23% compared to HK$915 million in 2015.
2,483 2,392
32% 31%
0%
18%
36%
0
1,500
3,000
HK
$ m
illio
ns
1,125 971
15% 13%
0%
8%
16%
0
700
1,400
HK
$ m
illio
ns
915
701
0
500
1,000
HK
$ m
illio
ns
Service EBIT
Service EBITDA
Service EBITDA margin
Consolidated service EBIT
Serv
ice E
BIT
DA
/ EB
ITD
A m
arg
in %
S
erv
ice E
BIT
/ EB
IT m
arg
in %
Consolidated service EBITDA
Profit attributable to shareholders
Service EBIT margin
-14%
-23%
2015 2016
2015 2016
2015 2016
-4%
7
Business Review The Group is engaged in two principal businesses – mobile and fixed-line. Hong Kong and Macau mobile business highlights
Mobile business revenue in 2016 was HK$8,332 million, a decrease of 55% compared to HK$18,477 million in 2015. 98% of the decline in revenue was due to lower hardware revenue because of reduced demand for new smartphones during the year. Hardware revenue decreased significantly by 69% from HK$14,371 million in 2015 to HK$4,386 million in 2016. Mobile net customer service revenue in 2016 was HK$3,946 million, a 4% decrease compared to HK$4,106 million in 2015. The decrease in mobile net customer service revenue was mainly due to a HK$109 million, or 13% decrease in roaming revenue during the year. Excluding roaming revenue, local service revenue was slightly lower than that in 2015 as a result of a drop in customer number in the first quarter of 2016 and such drop was turnaround since the second quarter of 2016. The net customer service margin in 2016 was maintained at 93% despite a lower roaming revenue during the year. EBITDA and EBIT in 2016 were HK$1,333 million and HK$600 million respectively, a decrease of 19% and 39% respectively compared to those of 2015. Service EBITDA in 2016 was 5% lower than that of 2015 mainly as a result of decrease in roaming margin as well as increase in selling expenses from higher volume of service transactions completed in 2016, partially offset by savings in operating expenses. Corresponding service EBITDA margin was maintained at 32%. As of 31 December 2016, the Group was serving approximately 3.2 million customers in Hong Kong and Macau (2015: approximately 3.0 million), of which the number of postpaid customers was approximately 1.5 million (2015: approximately 1.5 million). The overall churn rate of postpaid customers was substantially improved to 1.3% in 2016 from 1.8% in 2015, which reflected much improved customers’ satisfaction on the 4G LTE network quality and enhanced customer service. Customer response from various segments was overwhelming and the number of data-centric customers increased in 2016 following the introduction of innovative lifestyle-related tariff plans with various offerings in speed, content and value-added services. The blended local postpaid net ARPU improved 4% from HK$161 in 2015 to HK$168 in 2016 as a result of higher data consumption during the year. Blended local postpaid net AMPU improved 5% to HK$161 in 2016 from HK$154 in 2015. Growing popularity around OTT applications and IoT usage prompted the Group to prepare for a new era of digitalisation and automation, in which more personalised content will be offered to customers. The Group will focus on developing local and roaming products and tariff plans to meet demand from various customer base and to boost revenue. At the same time, the Group is committed to developing customer loyalty initiatives for long-term benefits. In 2016, the Group enhanced its mobile network by refarming a portion of existing 900MHz spectrum band to enhance indoor 4G LTE coverage, while a new 2300MHz spectrum band was activated to meet the rising demand for data. Small-cell technology was deployed to enhance both coverage and capacity in heavy traffic areas and growing data demand into the 5G era.
9
Key performance indicators for mobile business
For the year ended
31 December 2016
For the year ended
31 December 2015
Favourable/ (unfavourable)
change
Number of postpaid customers (‘000) 1,486 1,484 -
Number of prepaid customers (‘000) 1,736 1,547 +12%
Total customers (‘000) 3,222 3,031 +6%
Postpaid customers to the total customer base (%) 46% 49% -3% points Postpaid customers’ contribution to the net customer
service revenue (%) 93% 93% -
Monthly postpaid churn rate (%) 1.3% 1.8% +0.5% point
Local postpaid gross ARPU (HK$) 210 212 -1%
Local postpaid net ARPU (HK$) 168 161 +4% Local postpaid net AMPU (HK$) 161 154 +5%
Capital expenditure on property, plant and equipment in 2016 amounted to HK$589 million (2015: HK$574 million), accounting for 15% (2015: 14%) of mobile service revenue. The slight increase in capital expenditure in 2016 was mainly a result of long-term investment in network enhancement for 4.5G technology and preparation for coming 5G technology for better service and long-term cost savings in future.
Spectrum band Bandwidth Year of expiry
Hong Kong
900 MHz 10 MHz 2026
900 MHz 16.6 MHz 2020
1800 MHz 23.2 MHz 2021
2100 MHz 29.6 MHz 2031
2300 MHz 30 MHz 2027
2600 MHz 30 MHz* 2024
2600 MHz 10 MHz* 2028
Macau
900 MHz 15.6 MHz 2023
1800 MHz 38.8 MHz 2023
2100 MHz 20 MHz 2023
* Shared under 50/50 joint venture - Genius Brand Limited
Summary of spectrum investment as of 31 December 2016
574 589
14% 15%
0%
15%
30%
0
400
800
% to
serv
ice re
venue
HK
$ m
illio
ns
Mobile capex
capex over mobile service revenue
10
Fixed-line business highlights
For the year ended
31 December 2016 HK$ millions
For the year ended
31 December 2015 HK$ millions
Favourable/
(unfavourable) change
Revenue 4,127 3,973 +4%
Operating expenses (2,875) (2,699) -7%
Opex as % of revenue 70% 68% -2% points
EBITDA EBITDA margin %
1,252 30%
1,274 32%
-2% -2% points
Depreciation and amortisation (688) (697) +1%
EBIT 564 577 -2%
CAPEX (excluding licence) (509) (485) -5%
EBITDA less CAPEX 743 789 -6%
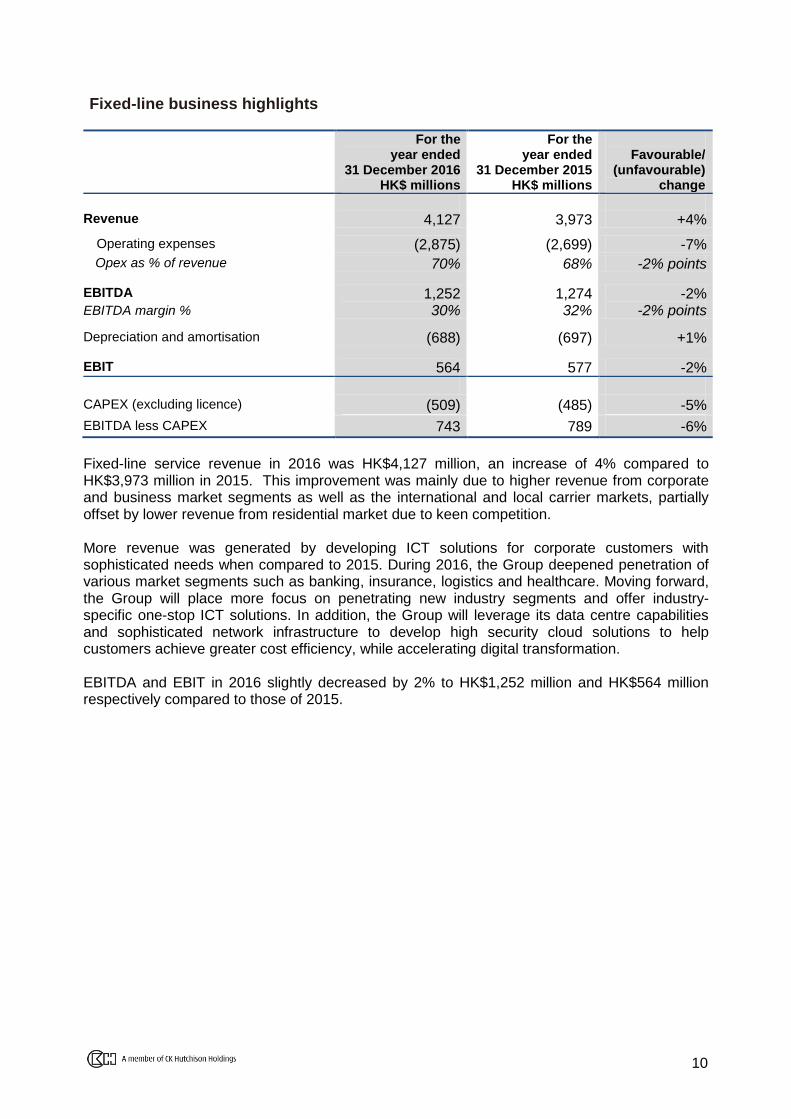
Fixed-line service revenue in 2016 was HK$4,127 million, an increase of 4% compared to HK$3,973 million in 2015. This improvement was mainly due to higher revenue from corporate and business market segments as well as the international and local carrier markets, partially offset by lower revenue from residential market due to keen competition. More revenue was generated by developing ICT solutions for corporate customers with sophisticated needs when compared to 2015. During 2016, the Group deepened penetration of various market segments such as banking, insurance, logistics and healthcare. Moving forward, the Group will place more focus on penetrating new industry segments and offer industry-specific one-stop ICT solutions. In addition, the Group will leverage its data centre capabilities and sophisticated network infrastructure to develop high security cloud solutions to help customers achieve greater cost efficiency, while accelerating digital transformation. EBITDA and EBIT in 2016 slightly decreased by 2% to HK$1,252 million and HK$564 million respectively compared to those of 2015.
11
Capital expenditure on property, plant and equipment in 2016 amounted to HK$509 million (2015: HK$485 million), representing 12% (2015: 12%) of fixed-line service revenue. The slight increase in capital expenditure in 2016 was mainly a result of additional network equipment acquired to meet corporate customer requirements.
485 509
12% 12%
0%
10%
20%
0
300
600
% to
se
rvic
e re
ve
nu
e
HK
$ m
illio
ns
capex over fixed-line service revenue
Fixed-line capex
2015 2016
2016:
HK$4,127 million
Fixed-line service revenue
2015:
HK$3,973 million
12
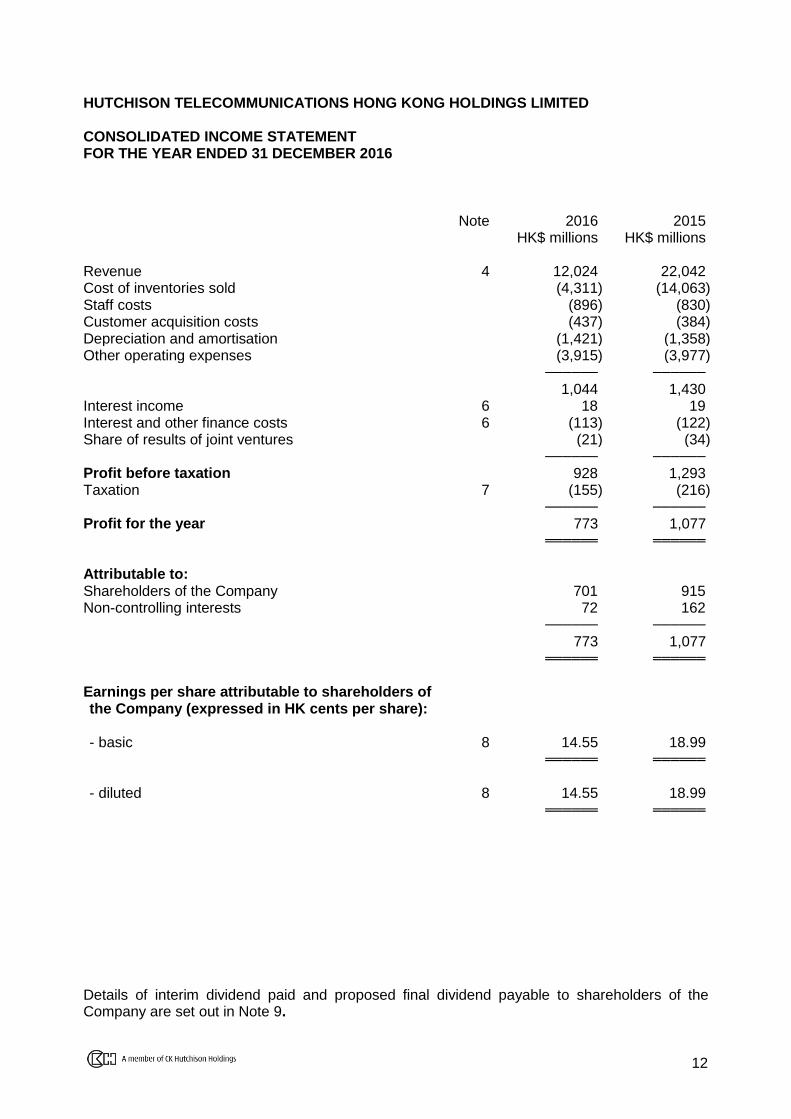
HUTCHISON TELECOMMUNICATIONS HONG KONG HOLDINGS LIMITED CONSOLIDATED INCOME STATEMENT FOR THE YEAR ENDED 31 DECEMBER 2016 Note 2016 2015 HK$ millions HK$ millions Revenue 4 12,024 22,042 Cost of inventories sold (4,311) (14,063) Staff costs (896) (830) Customer acquisition costs (437) (384) Depreciation and amortisation (1,421) (1,358) Other operating expenses (3,915) (3,977) ────── ──────
1,044 1,430 Interest income 6 18 19 Interest and other finance costs 6 (113) (122) Share of results of joint ventures (21) (34) ────── ──────
Attributable to: Shareholders of the Company 701 915 Non-controlling interests 72 162 ────── ──────
773 1,077 ══════ ══════
Earnings per share attributable to shareholders of the Company (expressed in HK cents per share):
- basic 8 14.55 18.99 ══════ ══════
- diluted 8 14.55 18.99
══════ ══════
Details of interim dividend paid and proposed final dividend payable to shareholders of the Company are set out in Note 9.
13
HUTCHISON TELECOMMUNICATIONS HONG KONG HOLDINGS LIMITED CONSOLIDATED STATEMENT OF COMPREHENSIVE INCOME FOR THE YEAR ENDED 31 DECEMBER 2016 2016 2015 HK$ millions HK$ millions Profit for the year 773 1,077 Other comprehensive income Item that will not be reclassified subsequently to income statement in subsequent periods: - Remeasurements of defined benefit plans (18) (12) Item that may be reclassified subsequently to income statement in subsequent periods: - Currency translation differences (6) (4) ───── ─────
Total comprehensive income for the year, net of tax 749 1,061 ═════ ═════
Total comprehensive income attributable to: Shareholders of the Company 677 899 Non-controlling interests 72 162 ───── ─────
749 1,061 ═════ ═════
14
HUTCHISON TELECOMMUNICATIONS HONG KONG HOLDINGS LIMITED CONSOLIDATED STATEMENT OF FINANCIAL POSITION AT 31 DECEMBER 2016 Note 2016 2015 HK$ millions HK$ millions ASSETS Non-current assets Property, plant and equipment 10,631 10,656 Goodwill 4,503 4,503 Telecommunication licences 2,796 1,207 Other non-current assets 768 858 Deferred tax assets 53 128 Investments in joint ventures 460 493 ────── ────── Total non-current assets 19,211 17,845 ----------- ----------- Current assets Cash and cash equivalents 10 237 1,021 Trade receivables and other current assets 11 1,719 1,817 Inventories 127 591 ────── ────── Total current assets 2,083 3,429 ----------- ----------- Current liabilities Trade and other payables 12 3,581 4,200 Current income tax liabilities 8 11 ────── ────── Total current liabilities 3,589 4,211 ----------- ----------- Non-current liabilities Deferred tax liabilities 573 497 Borrowings 4,467 3,962 Other non-current liabilities 509 513 ────── ────── Total non-current liabilities 5,549 4,972 ----------- -----------
Net assets 12,156 12,091 ══════ ══════ CAPITAL AND RESERVES Share capital 1,205 1,205 Reserves 10,368 10,317 ────── ────── Total shareholders’ funds 11,573 11,522 Non-controlling interests 583 569 ────── ────── Total equity 12,156 12,091 ══════ ══════
15
HUTCHISON TELECOMMUNICATIONS HONG KONG HOLDINGS LIMITED CONSOLIDATED STATEMENT OF CHANGES IN EQUITY FOR THE YEAR ENDED 31 DECEMBER 2016 Attributable to shareholders of the Company
Share capital
Share premium
Accumulated losses
Cumulative translation
adjustments Pension reserve
Other reserves Total
Non-controlling interests
Total equity
HK$ millions HK$ millions HK$ millions HK$ millions HK$ millions HK$ millions HK$ millions HK$ millions HK$ millions At 1 January 2016 1,205 11,185 (924) (7) 46 17 11,522 569 12,091
---------- ---------- ---------- ---------- ---------- ---------- ---------- ---------- --------- Profit for the year - - 701 - - - 701 72 773 Other comprehensive income Remeasurements of defined benefit plans - - - - (18) - (18) - (18)
HUTCHISON TELECOMMUNICATIONS HONG KONG HOLDINGS LIMITED CONSOLIDATED STATEMENT OF CHANGES IN EQUITY (CONTINUED) FOR THE YEAR ENDED 31 DECEMBER 2016 Attributable to shareholders of the Company
Share capital
Share premium
Accumulated losses
Cumulative translation
adjustments Pension reserve
Other reserves Total
Non-controlling interests
Total equity
HK$ millions HK$ millions HK$ millions HK$ millions HK$ millions HK$ millions HK$ millions HK$ millions HK$ millions At 1 January 2015 1,205 11,185 (1,169) (3) 58 17 11,293 416 11,709 ---------- ---------- ---------- ---------- ---------- ---------- ---------- ---------- ---------
Profit for the year - - 915 - - - 915 162 1,077 Other comprehensive income Remeasurements of defined benefit plans - - - - (12) - (12) - (12)
HUTCHISON TELECOMMUNICATIONS HONG KONG HOLDINGS LIMITED CONSOLIDATED STATEMENT OF CASH FLOWS FOR THE YEAR ENDED 31 DECEMBER 2016 Note 2016 2015 HK$ millions HK$ millions Cash flows from operating activities Cash generated from operations 2,458 2,566 Interest and other finance costs paid (77) (72) Tax paid (7) (16) ────── ──────
Net cash generated from operating activities 2,374 2,478 ----------- ----------- Cash flows from investing activities Purchases of property, plant and equipment (1,088) (1,045) Additions to other non-current assets (40) (8) Additions to telecommunications licences (1,777) - Proceeds from disposals of property, plant and
equipment
6 - Interest received 1 1 Loan to a joint venture (71) (85) ────── ──────
Net cash used in investing activities (2,969) (1,137) ----------- ----------- Cash flows from financing activities Proceeds from borrowings 1,995 - Repayment of borrowings (1,500) - Dividend paid to the shareholders of the Company 9 (626) (670) Dividend paid to non-controlling interests (58) (9) ────── ──────
Net cash used in financing activities (189) (679) ----------- ----------- (Decrease)/increase in cash and cash equivalents (784) 662 Cash and cash equivalents at 1 January 1,021 359 ────── ──────
Cash and cash equivalents at 31 December 237 1,021 ══════ ══════
18 18
NOTES
1 General Information
Hutchison Telecommunications Hong Kong Holdings Limited was incorporated in the Cayman Islands on 3 August 2007 as a company with limited liability. The address of its registered office is P.O. Box 31119, Grand Pavilion, Hibiscus Way, 802 West Bay Road, Grand Cayman, KY1-1205 Cayman Islands.
The Company and its subsidiaries are principally engaged in mobile telecommunications business in Hong Kong and Macau and fixed-line telecommunications business in Hong Kong.
The shares of the Company are listed on the Main Board of the Stock Exchange and
whose American Depositary Shares, each representing ownership of 15 shares, are eligible for trading in the United States of America only in the over-the-counter market.
These financial statements are presented in Hong Kong dollars, unless otherwise stated.
These financial statements were approved for issuance by the Board on 28 February 2017.
2 Basis of Preparation
The consolidated financial statements of the Group have been prepared in accordance with all applicable International Financial Reporting Standards as issued by the International Accounting Standards Board. These financial statements also comply with the applicable disclosure requirements of the Hong Kong Companies Ordinance (Chapter 622 of the Laws of Hong Kong). As at 31 December 2016, the current liabilities of the Group exceeded its current assets by approximately HK$1,506 million. Included in the current liabilities were non-refundable customer prepayments of HK$676 million which will gradually reduce over the contract terms of relevant subscriptions through delivery of services. Excluding the non-refundable customer prepayments, the net current liabilities of the Group would have been approximately HK$830 million. Management of the Group anticipates the net cash inflows from its operations, together with the ability to draw down from available banking facilities, would be sufficient to enable the Group to meet its liabilities as and when they fall due. Accordingly, these consolidated financial statements have been prepared on a going concern basis.
19 19
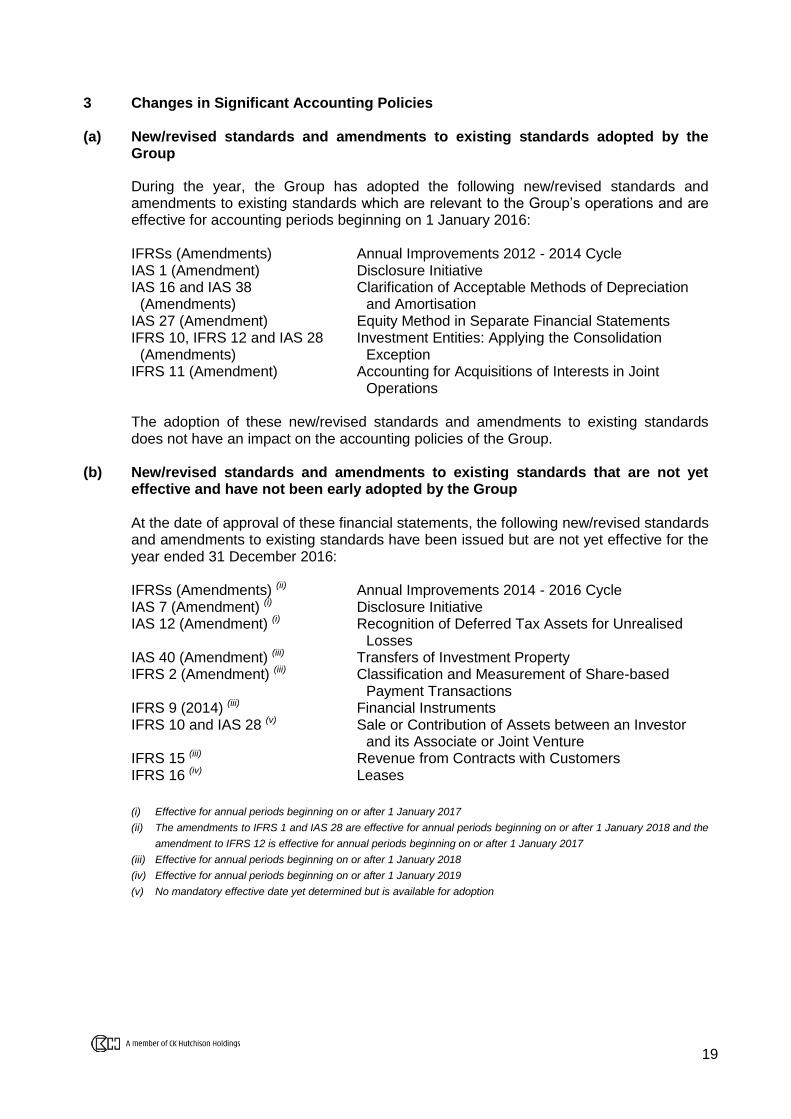
3 Changes in Significant Accounting Policies (a) New/revised standards and amendments to existing standards adopted by the
Group
During the year, the Group has adopted the following new/revised standards and amendments to existing standards which are relevant to the Group’s operations and are effective for accounting periods beginning on 1 January 2016: IFRSs (Amendments) Annual Improvements 2012 - 2014 Cycle IAS 1 (Amendment) Disclosure Initiative IAS 16 and IAS 38 Clarification of Acceptable Methods of Depreciation
(Amendments) and Amortisation IAS 27 (Amendment) Equity Method in Separate Financial Statements IFRS 10, IFRS 12 and IAS 28 Investment Entities: Applying the Consolidation
(Amendments) Exception IFRS 11 (Amendment) Accounting for Acquisitions of Interests in Joint Operations
The adoption of these new/revised standards and amendments to existing standards does not have an impact on the accounting policies of the Group.
(b) New/revised standards and amendments to existing standards that are not yet effective and have not been early adopted by the Group
At the date of approval of these financial statements, the following new/revised standards and amendments to existing standards have been issued but are not yet effective for the year ended 31 December 2016: IFRSs (Amendments) (ii) Annual Improvements 2014 - 2016 Cycle IAS 7 (Amendment) (i) Disclosure Initiative IAS 12 (Amendment) (i) Recognition of Deferred Tax Assets for Unrealised
Losses IAS 40 (Amendment) (iii) Transfers of Investment Property IFRS 2 (Amendment) (iii) Classification and Measurement of Share-based
Payment Transactions IFRS 9 (2014) (iii) Financial Instruments IFRS 10 and IAS 28 (v) Sale or Contribution of Assets between an Investor
and its Associate or Joint Venture IFRS 15 (iii) Revenue from Contracts with Customers IFRS 16 (iv) Leases
(i) Effective for annual periods beginning on or after 1 January 2017
(ii) The amendments to IFRS 1 and IAS 28 are effective for annual periods beginning on or after 1 January 2018 and the
amendment to IFRS 12 is effective for annual periods beginning on or after 1 January 2017
(iii) Effective for annual periods beginning on or after 1 January 2018
(iv) Effective for annual periods beginning on or after 1 January 2019
(v) No mandatory effective date yet determined but is available for adoption
20 20
3 Changes in Significant Accounting Policies (Continued)
(b) New/revised standards and amendments to existing standards that are not yet effective and have not been early adopted by the Group (Continued) IFRS 15 will be effective for the Group’s financial statements for annual reporting periods beginning on or after 1 January 2018. IFRS 15 will replace all existing IFRS revenue guidance and requirements including IAS 18 Revenue, IAS 11 Construction Contracts and the related Interpretations when it becomes effective. The core principle of IFRS 15 is that an entity recognises revenue to depict the transfer of promised goods or services to customers in an amount that reflects the consideration to which the entity expects to be entitled in exchange for those goods or services. The Group is assessing the impact of IFRS 15. It is currently anticipated that the application of IFRS 15 in the future may impact the disclosure to be made in the Group’s financial statements. However, it is not practicable to provide a reasonable estimate of the impact of IFRS 15 as at the date of publication of these financial statements.
IFRS 16 will be effective for the Group’s financial statements for annual reporting periods beginning on or after 1 January 2019. IFRS 16 specifies how an entity to recognise, measure, present and disclose leases. IFRS 16 requires lessees to recognise assets and liabilities for all leases unless the lease term is 12 months or less or the underlying asset has a low value. Lessors continue to classify leases as operating or finance with IFRS 16’s approach to lessor accounting substantially unchanged from its predecessor IAS 17. The Group is assessing the impact of IFRS 16 and as a result, it is not practicable to provide a reasonable estimate of the impact of IFRS 16 as at the date of publication of these financial statements. The impact of adoption of other new/revised standards and amendments to existing standards in future periods is not currently known or cannot be reasonably estimated.
(c) Critical accounting estimates and judgements Estimates and judgements are continually evaluated and are based on historical experience and other factors, including expectations of future events that are believed to be reasonable under the circumstances. Critical accounting estimates and assumptions Significant estimates and assumptions concerning the future may be required in selecting and applying accounting methods and policies in these financial statements. The Group bases its estimates and assumptions on historical experience and various other assumptions that it believes are reasonable under the circumstances. Actual results may differ from these estimates or assumptions. The following is a review of the more significant estimates and assumptions used in the preparation of these financial statements.
21 21
3 Changes in Significant Accounting Policies (Continued)
(c) Critical accounting estimates and judgements (Continued)
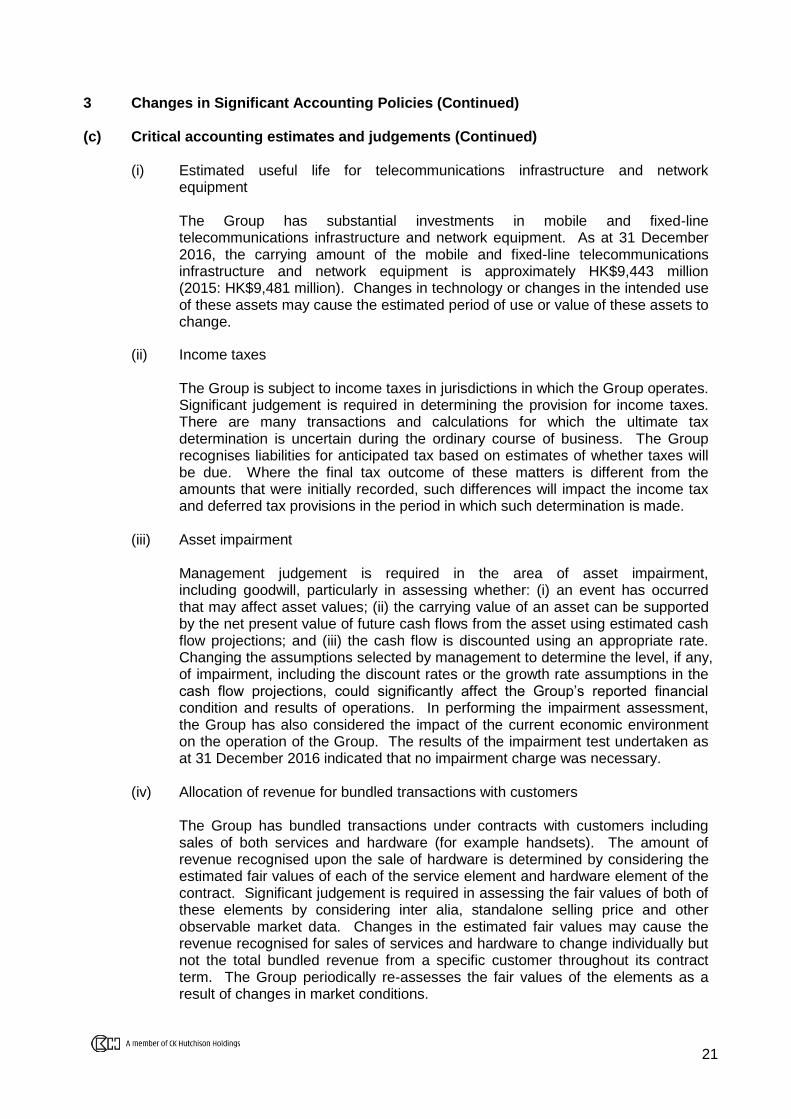
(i) Estimated useful life for telecommunications infrastructure and network equipment
The Group has substantial investments in mobile and fixed-line telecommunications infrastructure and network equipment. As at 31 December 2016, the carrying amount of the mobile and fixed-line telecommunications infrastructure and network equipment is approximately HK$9,443 million (2015: HK$9,481 million). Changes in technology or changes in the intended use of these assets may cause the estimated period of use or value of these assets to change.
(ii) Income taxes
The Group is subject to income taxes in jurisdictions in which the Group operates. Significant judgement is required in determining the provision for income taxes. There are many transactions and calculations for which the ultimate tax determination is uncertain during the ordinary course of business. The Group recognises liabilities for anticipated tax based on estimates of whether taxes will be due. Where the final tax outcome of these matters is different from the amounts that were initially recorded, such differences will impact the income tax and deferred tax provisions in the period in which such determination is made.
(iii) Asset impairment
Management judgement is required in the area of asset impairment, including goodwill, particularly in assessing whether: (i) an event has occurred that may affect asset values; (ii) the carrying value of an asset can be supported by the net present value of future cash flows from the asset using estimated cash flow projections; and (iii) the cash flow is discounted using an appropriate rate. Changing the assumptions selected by management to determine the level, if any, of impairment, including the discount rates or the growth rate assumptions in the cash flow projections, could significantly affect the Group’s reported financial condition and results of operations. In performing the impairment assessment, the Group has also considered the impact of the current economic environment on the operation of the Group. The results of the impairment test undertaken as at 31 December 2016 indicated that no impairment charge was necessary.
(iv) Allocation of revenue for bundled transactions with customers
The Group has bundled transactions under contracts with customers including sales of both services and hardware (for example handsets). The amount of revenue recognised upon the sale of hardware is determined by considering the estimated fair values of each of the service element and hardware element of the contract. Significant judgement is required in assessing the fair values of both of these elements by considering inter alia, standalone selling price and other observable market data. Changes in the estimated fair values may cause the revenue recognised for sales of services and hardware to change individually but not the total bundled revenue from a specific customer throughout its contract term. The Group periodically re-assesses the fair values of the elements as a result of changes in market conditions.
22 22
3 Changes in Significant Accounting Policies (Continued)
(c) Critical accounting estimates and judgements (Continued)
Critical judgements in applying the Group’s accounting policies Deferred taxation Management has considered future taxable income and ongoing prudent and feasible tax planning strategies in assessing the recognition criteria for deferred tax assets recorded in relation to cumulative tax loss carried forward. The assumptions regarding future profitability of various subsidiaries require significant judgement, and significant changes in these assumptions from period to period may have a material impact on the Group’s reported financial position and results of operations. As at 31 December 2016, the Group has recognised deferred tax assets of approximately HK$53 million (2015: HK$128 million).
4 Revenue
Revenue comprises revenues from provision of mobile telecommunications services, sales of telecommunications hardware and provision of fixed-line telecommunications services. An analysis of revenue is as follows:
2016 2015 HK$ millions HK$ millions Mobile telecommunications services 3,915 4,095 Fixed-line telecommunications services 3,725 3,579 Telecommunications hardware 4,384 14,368 ───── ─────
12,024 22,042 ═════ ═════
23 23
5 Segment Information
The Group is organised into two operating segments: mobile business and fixed-line business. “Others” segment represents corporate support functions. No geographical segment analysis is presented as the majority of the assets and operations of the Group are located in Hong Kong. Management of the Group measures the performance of its segments based on EBITDA/(LBITDA)(a) and EBIT/(LBIT)(b). Revenue from external customers is after elimination of inter-segment revenue. The segment information on revenue, EBITDA/(LBITDA), EBIT/(LBIT), total assets and total liabilities agreed to the aggregate information in the consolidated financial statements. As such, no reconciliation between the segment information and the aggregate information in the consolidated financial statements is presented.
At and for the year ended 31 December 2016
Mobile Fixed-line Others Elimination Total
HK$ millions HK$ millions HK$ millions HK$ millions HK$ millions Revenue - service 3,946 4,127 - (433) 7,640 Revenue - hardware 4,386 - - (2) 4,384 ────── ────── ────── ────── ──────
Additions to telecommunications licences 3 - - - 3
══════ ══════ ══════ ══════ ══════
(a) EBITDA/(LBITDA) is defined as earnings/(losses) before interest income, interest and other finance costs, taxation,
depreciation and amortisation and share of results of joint ventures.
(b) EBIT/(LBIT) is defined as earnings/(losses) before interest income, interest and other finance costs, taxation and
share of results of joint ventures.
25 25
5 Segment Information (Continued)
The total revenue from external customers in Hong Kong for the year ended 31 December 2016 amounted to approximately HK$11,378 million (2015: HK$20,905 million) and the total revenue from external customers in Macau for the year ended 31 December 2016 amounted to approximately HK$646 million (2015: HK$1,137 million). The total of non-current assets other than deferred tax assets located in Hong Kong as at 31 December 2016 amounted to approximately HK$18,578 million (2015: HK$17,147 million) and the total of these non-current assets located in Macau as at 31 December 2016 amounted to approximately HK$580 million (2015: HK$570 million).
6 Interest and Other Finance Costs, Net 2016 2015 HK$ millions HK$ millions Interest income: Interest income from joint ventures 17 18 Bank interest income 1 1 ───── ─────
18 19 --------- --------- Interest and other finance costs: Bank loans (62) (56) Notional non-cash interest accretion (a) (32) (48) Guarantee and other finance fees (25) (26) ───── ─────
(119) (130) Less: Amounts capitalised on qualifying assets 6 8 ───── ─────
(113) (122) --------- --------- Interest and other finance costs, net (95) (103) ═════ ═════
(a) Notional non-cash interest accretion represents the notional adjustments to accrete the carrying amount
of certain obligations recognised in the consolidated statement of financial position such as licence fees liabilities and asset retirement obligations to the present value of the estimated future cash flows expected to be required for their settlement in the future.
26 26
7 Taxation 2016 Current
taxation Deferred taxation Total
HK$ millions HK$ millions HK$ millions Hong Kong 1 148 149 Outside Hong Kong 3 3 6 ──── ──── ──── 4 151 155 ════ ════ ════ 2015 Current
taxation Deferred taxation Total
HK$ millions HK$ millions HK$ millions Hong Kong 1 203 204 Outside Hong Kong 8 4 12 ──── ──── ──── 9 207 216 ════ ════ ════
Hong Kong profits tax has been provided at the rate of 16.5% (2015: 16.5%) on the estimated assessable profits less available tax losses. Taxation outside Hong Kong has been provided at the applicable current rates of taxation ruling in the relevant countries on the estimated assessable profits less available tax losses.
8 Earnings per Share The calculation of basic earnings per share is based on profit attributable to shareholders of the Company of approximately HK$701 million (2015: HK$915 million) and on the weighted average number of 4,818,896,208 (2015: Same) ordinary shares in issue during the year. The diluted earnings per share for the year ended 31 December 2016 is calculated by adjusting the weighted average number of 4,818,896,208 (2015: Same) ordinary shares in issue with the weighted average number of 124,242 (2015: 138,462) ordinary shares deemed to be issued assuming the exercise of the share options.
9 Dividends 2016 2015 HK$ millions HK$ millions Interim, paid of 4.00 HK cents per share
(2015: 5.20 HK cents per share) 193 251 Final, proposed of 6.90 HK cents per share
(2015: 9.00 HK cents per share) 332 433 ──── ────
525 684 ════ ════
27 27
10 Cash and Cash Equivalents 2016 2015 HK$ millions HK$ millions Cash at banks and in hand 214 290 Short-term bank deposits 23 731 ──── ────
237 1,021 ════ ════
The effective interest rates on short-term bank deposits ranged from 0.01% to 0.39% per annum (2015: 0.01% to 0.25%). These deposits have an average maturity of 1 to 31 days (2015: Same). The carrying values of cash and cash equivalents approximate their fair values.
11 Trade Receivables and Other Current Assets 2016 2015 HK$ millions HK$ millions Trade receivables 1,443 1,661 Less: Provision for doubtful debts (106) (110) ───── ─────
Trade receivables, net of provision (a) 1,337 1,551 Other receivables 208 95 Prepayments and deposits 174 171 ───── ─────
1,719 1,817 ═════ ═════
(a) Trade receivables, net of provision
2016 2015 HK$ millions HK$ millions The ageing analysis of trade receivables, net of
provision for doubtful debts is as follows:
0 - 30 days 846 1,039 31 - 60 days 190 208 61 - 90 days 96 115 Over 90 days 205 189 ───── ───── 1,337 1,551 ═════ ═════
28 28
11 Trade Receivables and Other Current Assets (Continued) The carrying values of trade receivables approximate their fair values. The Group has established credit policies for customers. The average credit period granted for trade receivables ranges from 14-45 days, or a longer period for corporate or carrier customers based on individual commercial terms. There is no concentration of credit risk with respect to trade receivables, as the Group has a large number of customers.
12 Trade and Other Payables 2016 2015 HK$ millions HK$ millions Trade payables (a) 730 1,041 Other payables and accruals 2,119 2,217 Deferred revenue 676 751
Current portion of licence fees liabilities 56 191 ───── ─────
3,581 4,200 ═════ ═════
The carrying values of trade and other payables approximate their fair values. (a) Trade payables
2016 2015 HK$ millions HK$ millions The ageing analysis of trade payables is as follows: 0 - 30 days 411 477 31 - 60 days 99 137 61 - 90 days 35 101 Over 90 days 185 326 ───── ─────
730 1,041 ═════ ═════
29 29
GROUP CAPITAL RESOURCES AND LIQUIDITY Treasury Management The Group’s treasury function sets financial risk management policies in accordance with policies and procedures that are approved by the Executive Director, and which are also subject to periodic review by the Group’s internal audit function. The Group’s treasury policies are designed to mitigate the impact of fluctuations in interest rates and exchange rates on the Group’s overall financial position and to minimise the Group’s financial risks. The Group’s treasury function operates as a centralised service for managing financial risks, including interest rate and foreign exchange risks, and for providing cost-efficient funding to the Group and its companies. It manages the majority of the Group’s funding needs, interest rate, foreign currency and credit risk exposures. The Group uses interest rate and foreign currency swaps and forward contracts as appropriate for risk management purposes only, for hedging transactions and for managing the Group’s assets and liabilities’ exposure to interest rate and foreign exchange rate fluctuations. It is the Group’s policy not to enter into derivative transactions for speculative purposes. It is also the Group’s policy not to invest liquidity in financial products, including hedge funds or similar vehicles, with significant underlying leverage or derivative exposure. Cash management and funding The Group operates a central cash management system for all of its subsidiaries. In general, financing is raised mainly in the form of bank borrowings to meet funding requirements of the operating subsidiaries of the Group. The Group regularly and closely monitors its overall debt position and reviews its funding costs and maturity profile to facilitate refinancing. Interest rate exposure The Group manages its interest rate exposure with a focus on reducing the Group’s overall cost of debt and exposure to changes in interest rates. When considered appropriate, the Group uses derivatives such as interest rate swaps and forward rate agreements to manage its interest rate exposure. The Group is exposed to interest rate changes that affect Hong Kong dollar borrowings which are at floating rates. Foreign currency exposure The Group runs telecommunications operations principally in Hong Kong, with transactions denominated in Hong Kong dollars. The Group generally endeavours to establish a natural hedge for debt financing with an appropriate level of borrowings in those same currencies. The Group is exposed to other currency movements, primarily in terms of certain trade receivables or payables and bank deposits denominated in United States dollars, Macau Patacas, Renminbi, Euros and British pounds. Credit exposure The Group’s holdings of surplus funds with financial institutions expose the Group to credit risk of counterparties. The Group controls its credit risk to non-performance by its counterparties through monitoring their equity share price movements and credit ratings as well as setting approved counterparty credit limits that are regularly reviewed. The Group is also exposed to counterparties credit risk from its operating activities, such risks are continuously monitored by the management.
30 30
Capital and Net Debt As at 31 December 2016, the Group recorded share capital of HK$1,205 million and total equity of HK$12,156 million. The cash and cash equivalents of the Group amounted to HK$237 million as at 31 December 2016 (2015: HK$1,021 million), 34% of which were denominated in Euros, 19% in Hong Kong dollars, 17% in United States dollars, 11% in Macau Patacas, with remaining in various other currencies. The Group’s carrying amount of bank borrowings amounted to HK$4,467 million at 31 December 2016 (2015: HK$3,962 million), which were denominated in Hong Kong dollars and repayable in the fourth quarter of 2019. As at 31 December 2016, the consolidated net debt of the Group was HK$4,230 million (2015: HK$2,941 million). The Group’s net debt to net total capital ratio at 31 December 2016 was 26% (2015: 20%). Charges on Group Assets As at 31 December 2016, same as prior year, except for all of the shares of a joint venture owned by the Group which were pledged as security in favour of the joint venture partner under a cross share pledge arrangement, no material asset of the Group was under any charge. Borrowing Facilities Available Committed borrowing facilities available to the Group but not drawn as at 31 December 2016 amounted to HK$1,500 million (2015: HK$1,000 million). Contingent Liabilities As at 31 December 2016, the Group provided performance and other guarantees of HK$631 million (2015: HK$326 million). Commitments As at 31 December 2016, the Group had total capital commitments of property, plant and equipment amounting to HK$787 million (2015: HK$748 million). As at 31 December 2016, the Group had total operating lease commitments for building and other assets amounting to HK$296 million (2015: HK$575 million). A subsidiary of the Group has acquired various blocks of spectrum bands for the provision of telecommunications services in Hong Kong, certain of which over various assignment years up to year 2021 and variable licence fees are payable on those spectrum bands based on 5% of the network revenue or the Appropriate Fee (as defined in the Unified Carrier Licence) in respect of the relevant year whichever is greater. The net present value of the Appropriate Fee has already been recorded as licence fee liabilities.
31 31
Corporate Strategy The strategy of the Group is to deliver sustainable returns with solid financial fundamentals, so as to enhance long-term total return for shareholders. Please refer to the Chairman’s Statement and Management Discussion and Analysis for discussions and analyses of the performance of the Group and the basis on which the Group generates or preserves value over the longer term and the strategy for delivering the objective of the Group.
Past Performance and Forward-looking Statements
The performance and the results of operations of the Group contained in this announcement are historical in nature, and past performance is no guarantee for the future results of the Group. Any forward-looking statements and opinions contained in this announcement are based on current plans, estimates and projections, and therefore involve risks and uncertainties. Actual results may differ materially from expectations discussed in such forward-looking statements and opinions. The Group, the Directors, employees and agents of the Group assume (a) no obligation to correct or update the forward-looking statements or opinions contained in this announcement; and (b) no liability in the event that any of the forward-looking statements or opinions do not materialise or turn out to be incorrect. Human Resources As at 31 December 2016, the Group employed 2,304 (2015: 2,355) full-time staff members and on average 2,382 (2015: 2,272) staff members during the year ended 31 December 2016. The increase in staff costs over 2015 was a result of insourcing of certain functions, e.g. IT and network management, to enhance governance and operational efficiency as reflected in savings of other operating expenses in 2016. Staff costs during the year ended 31 December 2016, including directors’ emoluments, totalled HK$896 million (2015: HK$830 million). The Group fully recognises the importance of high-quality human resources in sustaining market leadership. Salary and benefits are kept at competitive levels, while individual performance is rewarded within the general framework of the salary, bonus and incentive system of the Group, which is reviewed annually. Employees are provided with a wide range of benefits that include medical coverage, provident funds and retirement plans, long-service awards and a share option plan. The Group stresses the importance of staff development and provides training programmes on an ongoing basis. Employees are also encouraged to play an active role in community care activities arranged by the Group. Environmental, Social and Governance Responsibility The Group is committed to the long-term sustainability of its businesses and the communities with which it engages. It delivers quality products and services to its customers by managing its businesses prudently, while executing management decisions with due care and attention. The Group demonstrates a strong sense of corporate social responsibility and believes such a commitment helps strengthen its relationship with the community. Operating as a sound corporate citizen via sponsorship and supporting socially-responsible projects at company level, the Group is committed to bringing positive impact to the general welfare of the community.
32 32
Review of Financial Statements The consolidated financial statements of the Group for the year ended 31 December 2016 have been reviewed by the Audit Committee of the Company and audited by the independent auditor of the Company, PricewaterhouseCoopers. The unqualified independent auditor’s report will be included in the Annual Report to shareholders. Closure of Register of Members The register of members of the Company will be closed from Thursday, 4 May 2017 to Tuesday, 9 May 2017, both days inclusive, for the purpose of determining shareholders’ entitlement to attend and vote at the 2017 Annual General Meeting. In order to be eligible to attend and vote at the 2017 Annual General Meeting, all transfers, accompanied by the relevant share certificates, must be lodged with the Hong Kong Share Registrar of the Company (Computershare Hong Kong Investor Services Limited at Rooms 1712-1716, 17th Floor, Hopewell Centre, 183 Queen’s Road East, Wanchai, Hong Kong) for registration no later than 4:30 pm on Tuesday, 2 May 2017. Record Date for Proposed Final Dividend
The record date for the purpose of determining shareholders’ entitlement to the proposed final dividend is Monday, 15 May 2017. In order to qualify for the entitlement to the proposed final dividend payable on Wednesday, 24 May 2017, all transfers, accompanied by the relevant share certificates, must be lodged with the Hong Kong Share Registrar of the Company (Computershare Hong Kong Investor Services Limited at Rooms 1712-1716, 17th Floor, Hopewell Centre, 183 Queen's Road East, Wanchai, Hong Kong) for registration no later than 4:30 pm on Monday, 15 May 2017. Purchase, Sale or Redemption of the Listed Securities During the year ended 31 December 2016, neither the Company nor any of its subsidiaries has purchased or sold any of the listed securities of the Company. In addition, the Company has not redeemed any of its listed securities during the year. Compliance with the Corporate Governance Code The Company strives to attain and maintain high standards of corporate governance best suited to the needs and interests of the Group as it believes that effective corporate governance practices are fundamental to safeguarding interests of shareholders and other stakeholders and enhancing shareholder value.
33 33
The Company has complied throughout the year ended 31 December 2016 with all code provisions of the Corporate Governance Code contained in Appendix 14 of the Listing Rules, other than those in respect of the nomination committee. The Company has considered the merits of establishing a nomination committee but is of the view that it is in the best interests of the Company that the Board collectively reviews, deliberates on and approves the structure, size and composition of the Board as well as the appointment of any new Director, as and when appropriate. The Board is tasked with ensuring that it has a balanced composition of skills and experience appropriate for the requirements of the businesses of the Group and that appropriate individuals with the relevant expertise and leadership qualities are appointed to the Board to complement the capabilities of the existing Directors. In addition, the Board as a whole is responsible for reviewing the succession plan for Directors, including the Chairman of the Board and the Chief Executive Officer. Compliance with the Model Code for Securities Transactions by Directors The Board has adopted its own Model Code for Securities Transactions by Directors (the “HTHKH Securities Code”) regulating Directors’ dealings in securities (Group and otherwise), on terms no less exacting than the required standard of the Model Code for Securities Transactions by Directors of Listed Issuers set out in Appendix 10 of the Listing Rules. In response to specific enquiries made, all Directors confirmed that they have complied with the HTHKH Securities Code in their securities transactions throughout their tenure during 2016. Annual General Meeting The Annual General Meeting of the Company will be held on Tuesday, 9 May 2017. Notice of the Annual General Meeting will be published and issued to shareholders in due course. DEFINITIONS In this announcement, unless the context otherwise requires, the following expressions have the following meanings: “Board” the board of Directors “CACs” customer acquisition costs “Company” or
“HTHKH” Hutchison Telecommunications Hong Kong Holdings Limited, a company incorporated in the Cayman Islands with limited liability, whose shares are listed on the Main Board of the Stock Exchange (Stock Code: 215) and whose American Depositary Shares are eligible for trading in the United States of America only in the over-the-counter market
“Director(s)” director(s) of the Company “EBITDA” earnings before interest income, interest and other finance costs,
taxation, depreciation and amortisation, and share of results of joint ventures
34 34
DEFINITIONS (continued)
“EBIT” earnings before interest income, interest and other finance costs,
taxation and share of results of joint ventures “Group” the Company and its subsidiaries “HK$” Hong Kong dollars, the lawful currency of Hong Kong “Hong Kong” the Hong Kong Special Administrative Region of the People’s Republic
of China “IAS” International Accounting Standards “ICT” Information and Communications Technology “IFRS” International Financial Reporting Standards “IoT” Internet-of-Things “Listing Rules” the Rules Governing the Listing of Securities on the Stock Exchange of
Hong Kong Limited “Local postpaid
gross ARPU” monthly average spending per postpaid user including a customer’s contribution to mobile devices in a bundled plan, excluding roaming revenue
“Local postpaid net
ARPU” monthly average spending per postpaid user excluding roaming revenue and revenue related to handset under the non-subsidised handset business model
“Local postpaid net
AMPU” average net margin per postpaid user; local postpaid net AMPU equals local postpaid net ARPU less direct variable costs (including interconnection charges)
“LTE” Long-Term-Evolution
“Net customer service margin”
net customer service revenue less direct variable costs (including interconnection charges and roaming costs)
margin percentage or service EBIT margin percentage”
EBITDA or EBIT excluding standalone handset sales margin as a percentage of net customer service revenue
“Stock Exchange” The Stock Exchange of Hong Kong Limited
35 35
As at the date of this announcement, the Directors of the Company are: Chairman and Non-executive Director: Non-executive Directors: Mr FOK Kin Ning, Canning Mr LAI Kai Ming, Dominic
Deputy Chairman and Non-executive
(also Alternate to Mr FOK Kin Ning, Canning and Ms Edith SHIH)
Director: Ms Edith SHIH Mr LUI Dennis Pok Man Mr MA Lai Chee, Gerald
(Alternate to Mr LAI Kai Ming, Dominic) Executive Director: Mr WOO Chiu Man, Cliff Independent Non-executive Directors: Mr CHEONG Ying Chew, Henry (also Alternate to
Dr WONG Yick Ming, Rosanna) Dr LAN Hong Tsung, David Dr WONG Yick Ming, Rosanna