Page 1
DEPARTMENT OF ELECTRICAL ENGINEERING viiTHsem B.E. electrical
G.H.RAISONI COLLEGE OF ENGINEERING, NAGPUR
1
G.H. RAISONI COLLEGE OF ENGINEERING DEPARTMENT OF ELECTRICAL ENGINEERING
HIGH VOLATGE LABORATORY
INDEX
Sr.
No.
Name of Experiment Page
No.
01 CALIBERATION OF VOLTMETER BY USING SPEHERE GAP
METHOD
2
02 CALIBRATION OF VOLTMETER USING ROAD GAP AND POINT
GAP
4
03 TO DETERMINE FLASH OVER VOLTAGE ACROSS PIN-TYPE
INSULATOR
7
04 - TO DETERMINE STRING EFFICIENCY OF SUSPENSION TYPE
INSULATOR.
9
05 - STUDY OF BREAK-DOWN VOLTAGE FOR DIFFERENT
COMBINATION OF ELECTRODES.
12
06 DETERMINATION OF FAULT LOCATION BY DIGITALCABLE
FAULT LOCATOR MODEL 2000A.
14
07 MEASUREMENT OF CAPACITANCE AND DISSIPATION
FACTOR (TAN δδδδ) OF SOLID INSULATING MATERIAL BY
ELTEL CTS-500KIT.
16
08 STUDY THE FERRANTI EFFECT AND SURGE IMPEDANCE
LOADING IN EHV LINE.
19
09 MEASUREMENT OF DIELECTRIC CONSTANT, DISSIPATION
FACTOR (TAN δδδδ) AND RESISTIVITY OF Oil.
22
Page 2
DEPARTMENT OF ELECTRICAL ENGINEERING viiTHsem B.E. electrical
G.H.RAISONI COLLEGE OF ENGINEERING, NAGPUR
2
EXPERIMENT NO: - 1
AIM: - CALIBERATION OF VOLTMETER BY USING SPEHERE GAP METHOD.
(1) 10 cm dia.
(2) 5 cm dia.
APPARATUS: - Sphere gap, 10cm / 5cm dia, Control Panel, H.V. transformer (230V / 100KV,
10KVA), Capacitor Divider (100 pf), Connecting wires etc.
CIRCUIT DIAGRAM: -
THEORY: - A uniform field spark gap will always have a spark over voltage within a known
tolerance under constant atmospheric conditions. Hence sphere gap can be used for the
measurement of the peak value of the voltage, if the gap distance is known. The voltage
to be measured is applied between the two spheres and the distance between them gives a
measure of spark over voltage.
Irradiation of sphere gap is needed when measurements of voltage less than 50KV
are made with sphere gaps of 10cm dia. or less. There are various factors that affects the
spark over voltage of the sphere gap are,
1) Nearby earthed objects.
2) Atmospheric conditions & Humidity.
3) Irradiation, &
4) Polarity and rise time of Waveforms.
FUSE
RUGULATING
TRANSFORMER
230 V / 100KV
10KVA
HT SWITCH
V
230 V
ACSUPPLY V
Scale
100 PF
100 KV
230
V
1OO
KV
Sphere
gap
VoltageDivider
Page 3
DEPARTMENT OF ELECTRICAL ENGINEERING viiTHsem B.E. electrical
G.H.RAISONI COLLEGE OF ENGINEERING, NAGPUR
3
PROCEDURE: - 1) Make the connections as shown in the circuit diagram.
2) For this experiment both the spheres must of same diameter.
3) Adjust the suitable distance between the electrical say 0.5 cm and 1 cm from
control panel.
4) Increase the voltage gradually from control panel till breakdown occur.
5) Measure this breakdown / spark over voltage for that gap.
6) Change the distance & increase the voltage gradually.
7) Repeat the same procedure for both the sphere set.
8) Find the percentage error and plot the graph.
OBSERVATION TABLE: -
Sr.
no.
Distance
between
the
sphere
(D) cm
Peak V
BDV at
20o and 76
cm of HG
(A)
Actual
BDV
= KV
(B)
RMS BDV
(V2)
=KV/ √2
Value of BDV
as per
voltmeter
KV (V1)
V1-V2 V1-V2 / V1
*100 =
% Error
01
02
03
04
Relation between air density factor δ and correction factor K
δ 0.70 0.75 0.80 0.85 0.90 0.95 1.0 1.05 1.10 1.15
K 0.72 0.77 0.82 0.86 0.91 0.95 1.0 1.05 1.09 1.12
δ = P/760 * (273+20 / 273+ t)
P & t: - are atmospheric pressure and temperature while performing the experiments
δ : - Air density factor
K: - correction factor
RESULTS: - From this experiments we are able to get the various breakdown voltages for
different gaps between the electrodes.
QUESTIONS: - 1) Write in brief the effect of near by earthed object on the spark over
voltage of sphere gap.
2) Write in brief the effect of irradiation on the spark over voltage of
sphere gap.
3) Explain the measurement of high voltage by capacitance voltage
divider method.
Page 4
DEPARTMENT OF ELECTRICAL ENGINEERING viiTHsem B.E. electrical
G.H.RAISONI COLLEGE OF ENGINEERING, NAGPUR
4
EXPERIMENT NO: - 2
AIM: -CALIBRATION OF VOLTMETER USING ROAD GAP AND POINT GAP
APPARATUS: - Transformer (230/100 KV, 10 KVA)
Voltage Divider (100pf)
Control Panel, connecting rods, connecting wires, etc.
TYPE (A): - ROD GAP METHOD
CIRCUIT DIAGRAM: -
THEORY: - A rod gap is also sometimes used for approximate measurement of peak
values of power frequency voltages and impulse voltages. The rods will be either
square edged or circular in spacing varies from 2 to 200 cm. The spark over voltage,
as in other gaps is affected by humidity and air density. (The power frequency
breaks down voltage for 1.27 cm square rod in air at 250 C and a pressure of 760 torr
with the vapour pressure of water of 15.5 torr.
FUSE
RUGULATING
TRANSFORMER
230 V / 100KV
10KVA
HT SWITCH
V
230 V
AC
SUPPLY V
Voltagedivider
100KV
100PF
Rod Gap
100KV
230 V
Scale
Page 5
DEPARTMENT OF ELECTRICAL ENGINEERING viiTHsem B.E. electrical
G.H.RAISONI COLLEGE OF ENGINEERING, NAGPUR
5
TYPE (B): - POINT GAP METHOD
CIRCUIT DIAGRAM: -
THEORY: - A point gap method is also used for measurement of a peak value of power frequency,
voltage and impulse voltage. Standard point gap is constructed and arranged according to the rules
specified by standard. Performing to high voltage testing techniques and point gap should be
thoroughly studied. Complete arrangement consisting of two rods of equal length and cross section
area with their operating gear. Insulating sphere supporting frames leads up to the point at which
the volt is to be measured. One point is perfectly connected directly to earth, while the other sphere
is connected to high voltage conductor leads coming from H. T. transformers.
FUSE
RUGULATING
TRANSFORMER
230 V / 100KV
10KVA
HT SWITCH
V
230 V
AC
SUPPLY V
VoltageDivider
100PF
100KV
PointGap
Scale
100K
V
230 V
Page 6
DEPARTMENT OF ELECTRICAL ENGINEERING viiTHsem B.E. electrical
G.H.RAISONI COLLEGE OF ENGINEERING, NAGPUR
6
OBSERVATION TABLE: -
1) FOR ROD GAP
B. D. V. Sr.
No.
Distance
between
rods in cm Standard
value
(peak
value in
KV) (A)
Peak value at
existing
temperature
B = KA .(KV)
RMS
value
= B / √2
RMS value of
BDV V1 (from
voltmeter)
% error
= V1-V2 /V1
*100
δ = P/760 * (273+20 / 273+ t)
P & t: - are the atmospheric pressure and temperature while doing the practical
δ: - Air density factor
K: - correction factor
2) FOR POINT GAP
Sr. No. Distance in cm or
mm
BDV in KV (voltmeter)
01
02
03
PROCEDURE: - Same as “Calibration of voltmeter by using sphere gap”
GRAPH: - FOR ROD GAP
(i) Distance Vs RMS BDV (Std & Observed)
(ii) Distance Vs % Error.
FOR POINT GAP
(i) Distance Vs RMS (Observed)
RESULT: - Find out the BDV for different spacing and plot the graph between spacing and
Standard / observed BDV rms reading & compare the values.
QUESTIONS: -
(1) Explain the effect of atmospheric conditions on the spark over voltage of rod
gap.
(2) Write the advantages of high voltage voltage measurement by electrostatic
voltmeter.
(3) Explain the high voltage measurement by resistance voltage divider method.
Page 7
DEPARTMENT OF ELECTRICAL ENGINEERING viiTHsem B.E. electrical
G.H.RAISONI COLLEGE OF ENGINEERING, NAGPUR
7
EXPERIMENT NO: - 3
AIM: -TO DETERMINE FLASH OVER VOLTAGE ACROSS PIN-TYPE INSULATOR
1) UNDER DRY CONDITION
2) UNDER WET CONDITION
APPARATUS: - 1) H. V. transformer, 230V / 100KV, 10 KVA
2) 11KV pin type fixed on table and its bottom is earthed.
3) Connecting wires & rod.
4) Control panel etc.
CIRCUIT DIAGRAM: -
THEORY: - It is one of the earliest designs used for supporting line conductor. The pin
insulator is supported on the forged steel pins and bolds, which are skewed to the cross
section of this supporting structure.
The conductor is lied to insulator on the grooves. In order to increase the leakage
path, one, two or three rain shades are so designed when these insulators are wet even then
sufficient dry space is provided by the inner shades.
For higher voltages the thickness of the material required for the purpose of the
insulation. But the practical way is to use more than one insulator unit instead of increasing
the thickness.
Flashover distances when the insulators are dry and wet are different. The flash over
voltage when the insulator is wet is less. The rain shades should not disturb the voltage
distribution. They are so designed that their surface is right angle to electrostatic lines of
forces or they must try to lie in the equipotential.
The pin type insulator is reliable for voltage level upto 50KV max. and They are
never used for voltage beyond 80 KV. Since the suspension insulator is more reliable and
cheaper. The modern practice is “not to used” the pin type insulator beyond 33KV.
FUSE
RUGULATING
TRANSFORMER
230 V / 100KV
10KVA
HT SWITCH
V
230 V
AC
SUPPLY V
Voltage
Divider
100PF100KV
Pin
Insulator
100
KV
230 V
Page 8
DEPARTMENT OF ELECTRICAL ENGINEERING viiTHsem B.E. electrical
G.H.RAISONI COLLEGE OF ENGINEERING, NAGPUR
8
PROCEDURE: -
1) Make the connection as shown in circuit diagram.
2) Increase the voltage across pin type insulator (Dry condition) gradually from control
panel till spark over gets.
3) Note down this spark over voltage.
4) Repeat the process for Wet condition.
5) Compare the observed value with standard value & find out the percentage error.
OBSERVATION TABLE: -
Pin Type Insulator = WD-10 type
Flash over voltage – Dry condition = 62.5 KV RMS
Wet condition = 38 KV RMS
1) For Dry Condition: -
Sr. No. Std. Flash over
Voltage (V1)
RMS KV
Measured flash over
voltage (V2) KV
RMS voltmeter reading
% error
= (V1-
V2/V1)*
100
Avg. error
2) For Wet Condition: -
Sr. No. Std. Flash over
Voltage (V1)
RMS KV
Measured flash over
voltage (V2) KV
RMS voltmeter reading
% error
= (V1-
V2/V1)*
100
Avg. error
RESULT: - The flashover voltage across pin type insulator is found to be ______KV
in dry condition. And _________ KV in wet condition.
QUESTIONS: -
1. Write the comparison between pin insulator type Wc & Wd.
2. Write the dimensions of the different types of pin insulator and their
flash over voltage under dry and wet condition.
3. Compare the properties of procelain and glass insulator.
4. List the solid dielectrics used in practice.
Page 9
DEPARTMENT OF ELECTRICAL ENGINEERING viiTHsem B.E. electrical
G.H.RAISONI COLLEGE OF ENGINEERING, NAGPUR
9
EXPERIMENT NO: - 4
AIM: - TO DETERMINE STRING EFFICIENCY OF SUSPENSION TYPE INSULATOR.
APPARATUS: - String of Suspension Type Insulator, Sphere Gap, HV transformers 230V/100KV
10KVA,
Control Panel, Connecting rods etc.
CIRCUIT DIAGRAM: -
THEORY: - Suspension type insulator consists of number of porcelain discs connected in
series by metal links in the form of a string. The conductor is suspended at bottom end of
the string while the other end is secured to the cross arm of tower. Each disc is designed for
low voltage say 11KV. The number of discs in series would obviously depend on working
voltage e.g. for 66KV, 6discs are required. The ratio of voltage across the whole string to
the product of number of discs & voltage across discs nearest to the conductor is known as
string efficiency.
Voltage across string String efficiency =
_______________________________________________________
n * voltage across disc to nearest conductor
Where n = number of discs.
FUSE
RUGULATING
TRANSFORMER
230 V / 100KV
10KVA
HT SWITCH
V
230 VAC
SUPPLY V
Scale
100 PF
100 KV
230
V
1OO
KV
Sphere
gap
Voltage
Divider
Page 10
DEPARTMENT OF ELECTRICAL ENGINEERING viiTHsem B.E. electrical
G.H.RAISONI COLLEGE OF ENGINEERING, NAGPUR
10
String efficiency is an important consideration since it decides potential distribution
along string. The greater the string η, more uniform is the voltage distribution. Although
it is impossible to achieve 100% string η, yet efforts should be made to improve it as
close as possible to this value. The inequality of voltage distribution increases which in
increase in no. of discs in the string. Therefore shorter string has more efficiency than
longer one. String efficiency can be increased by
1) Using longer cross-arm.
2)Grading the insulator
3) Using a grid ring.
PROCEDURE: -
1) Make the connections as shown in circuit diagram.
2) Set the distance between 10cm diameter sphere to maximum value.
3) Apply a constant voltage to the string say for 7 discs,11KV*7=77KV
4) Now reduce the distance between the spheres till flashover occurs.
5) Note the corresponding distance between the spheres at flashover.
6) Make supply off and make connections for second step, keep maximum distance
between the spheres
7) Decrease the distance from control panel till flash over occurs. It gives the BDV for (n-
1) discs excepting the bottom discs.
8) Repeat the procedure for all discs.
OBSERVATION TABLE: -
δ = P/760 * (273+20 / 273+ t)
P & t: - are atmospheric pressure and temperature while performing the
experiments
δ : - Air density factor
K: - correction factor
FOR 10 CM DIAMETER SPHERE: -
Sr. No. Distance
between sphere
at which spark
over takes place
in cm
Spark over KV
peak at 200
C &
760mm HG std.
From
manufactures
table A
BDV peak at
room temp. &
pressure in
KV
B= KA
RMS value
of BDV in
KV
=B/√2
String
efficiency
η
01
02
03
Page 11
DEPARTMENT OF ELECTRICAL ENGINEERING viiTHsem B.E. electrical
G.H.RAISONI COLLEGE OF ENGINEERING, NAGPUR
11
Voltage across the string V1
String efficiency ηηηη = __________________________________________________________
= ________________
n * voltage across the disc nearer to conductor n* (V1 - V2)
RESULT: - It is found that voltage across the each disc is not uniform. & string efficiency of
suspension type insulator is found to _________ % .
DISCUSSIONS:- 1) Why it is necessary to calculate string efficiency.
2) How string efficiency can be increase.
3) What is efficiency for pin type insulator.
4) Is it necessary to calculate string efficiency in case of dc supply.
Page 12
DEPARTMENT OF ELECTRICAL ENGINEERING viiTHsem B.E. electrical
G.H.RAISONI COLLEGE OF ENGINEERING, NAGPUR
12
EXPERIMENT NO: -5
AIM: - STUDY OF BREAK-DOWN VOLTAGE FOR DIFFERENT COMBINATION OF
ELECTRODES.
1) SPHERE 10 CM DIA & SPHERE 5 CM DIA.
2) SPHERE 10 CM DIA & ROD.
3) SPHERE 10 CM DIA & POINT.
APPARATUS: - Sphere, Rod, & Point electrode, control unit, HV transformer 10KVA,
230V/100KV,
Capacitor Voltage Divider, Connecting wires etc.
THEORY: - The sphere gap between two spheres is a classical example of weakly non uniform
field, the degree of non-uniformity increases with increase in the ratio in the distance ‘S’ between
the electrodes to their diameter D. the sphere gap happen to be commonly acknowledged means in
the inter-national practice for the measurement of amplitudes of direct ac & impulse voltages. Volt-
Second chara. of a sphere gap over a large internal of time is a horizontal straight line &
consequently the breakdown voltage of the gap does not depend upon the duration of application of
voltage & on the low of its variation with time. Out of all the gaps having a weak non uniform field
the sphere gap can be prepared mast easily & is has least dimensions. In case of a gap between two
planes each plane will require to have rounded off edges & for the value discharge distance,
diameter of the plane electrode will have to be a few times larger than the diameter of sphere.
PROCEDURE: -
1) Place the two spheres of diameter 10cm & 5cm. respectively are shown in
circuit diagram.
2) Set the distance between them at 0.5cm.
3) Increase the voltage with the help of tap changing transformer.
4) Observe the voltage at which breakdown takes place.
5) Now increase the gap between the two spheres in steps of 0.5cm & observe the
breakdown voltage.
6) Take 5 set of readings.
7) Now replace the 5cm sphere with
i) A rod electrode
ii) A point electrode & Repeat from step1.
Page 13
DEPARTMENT OF ELECTRICAL ENGINEERING viiTHsem B.E. electrical
G.H.RAISONI COLLEGE OF ENGINEERING, NAGPUR
13
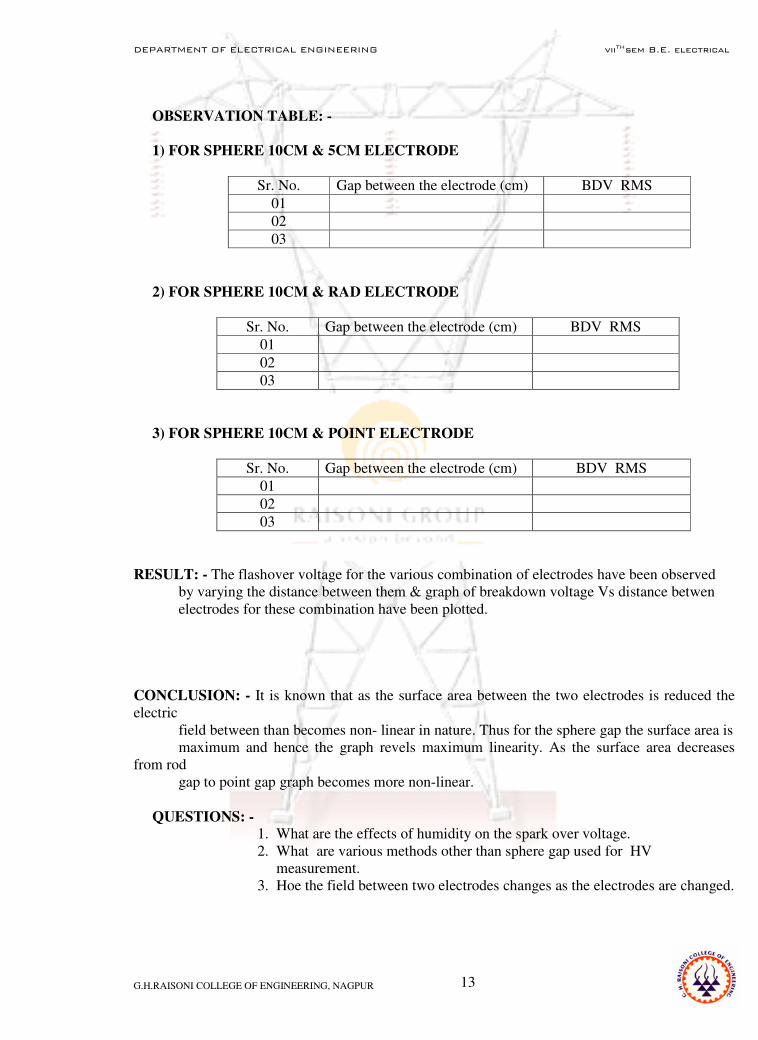
OBSERVATION TABLE: -
1) FOR SPHERE 10CM & 5CM ELECTRODE
Sr. No. Gap between the electrode (cm) BDV RMS
01
02
03
2) FOR SPHERE 10CM & RAD ELECTRODE
Sr. No. Gap between the electrode (cm) BDV RMS
01
02
03
3) FOR SPHERE 10CM & POINT ELECTRODE
Sr. No. Gap between the electrode (cm) BDV RMS
01
02
03
RESULT: - The flashover voltage for the various combination of electrodes have been observed
by varying the distance between them & graph of breakdown voltage Vs distance betwen
electrodes for these combination have been plotted.
CONCLUSION: - It is known that as the surface area between the two electrodes is reduced the
electric
field between than becomes non- linear in nature. Thus for the sphere gap the surface area is
maximum and hence the graph revels maximum linearity. As the surface area decreases
from rod
gap to point gap graph becomes more non-linear.
QUESTIONS: -
1. What are the effects of humidity on the spark over voltage.
2. What are various methods other than sphere gap used for HV
measurement.
3. Hoe the field between two electrodes changes as the electrodes are changed.
Page 14
DEPARTMENT OF ELECTRICAL ENGINEERING viiTHsem B.E. electrical
G.H.RAISONI COLLEGE OF ENGINEERING, NAGPUR
14
EXPERIMENT NO: 6
AIM: - DETERMINATION OF FAULT LOCATION BY DIGITALCABLE FAULT
LOCATOR
MODEL 2000A.
APPARATUS: - Digital cable fault locator, Kit with circuit, connecting wires etc.
-
THEORY: - Fault locator is an essential complement to distance protective relay for transmission
lines and fault recorder. Fault location are installed along with distance protection scheme and fault
recorders, fault locator measures and indicates accurately the distance between the substation and
the point of fault. Fault locator is connected to the line secondary CTs & VTs of the line under
normal conditions, the fault locator monitors three phase currents & the ground current, voltage
input signals continuously. The operation of the fault locator is with following steps (1) Data
collection, (2) Starting of fault locator, (3) Sorting of measured instantaneous values, (4) Filtering
of measured signals, (5) Determination of type of fault, (6) Solution of fault equation, (7) Pre-
location of results.
The input analog signals are converted into digital signals in A/D converter and stored
in memory for every six cycles continuously. When a fault occurs, trip circuit from the protective
relay initiates the fault locator’s calculation program. The pre-fault sample values & during fault
sample values are used for calculating the distance of the fault. The calculation of distance is based
on the principle relays. The fault distance is shown as % of total line length on two digital front
mounted LED display.
Various types of fault that occur in a power systems are
1) Shunt type fault
a) Single line to ground fault (LG)
b) Line to line ground fault (LL)
c) Double line to ground fault (LLG)
2) Series type fault
a) Open conductor fault (one or two conductors are open)
PROCEDURE: -
1) Connect all batteries i.e. 6V 10A & 12V, 3.8A.
2) Switch ON the instrument.
3) Create a fault at (20% to 100%) in between appropriate phases.
4) Connect stimulating Board according to diagram.
5) Keep Earth / open switch in earth position.
6) Keep V1/V2 voltage switch in V1 position.
7) Keep fault resistance selector in 1MΩ position.
8) Keep V1/V2 voltage range selector switch at 20V position.
9) Null display reading to zero.
10) Press push to read V1 display.
11) Change V1/V2 switch to V2 position.
12) Press push to read V2 display.
Page 15
DEPARTMENT OF ELECTRICAL ENGINEERING viiTHsem B.E. electrical
G.H.RAISONI COLLEGE OF ENGINEERING, NAGPUR
15
RESULT: - All types of faults are located by digital cable fault locator.
CONCLUSION: - It is found that the calculation of distance is based on the principle of distance
relay. Also
fault location chosen in a % of total length is nearly equal to the distance of fault from end
(calculated)
i.e. selected value of fault locations & calculated value of fault locations are found to be
same .
QUESTIONS: -
1. What are the principles used to locate open circuit fault?
2. What are the principles used to locate short circuit fault.
3. What are the methods to know the types of fault?
Page 16
DEPARTMENT OF ELECTRICAL ENGINEERING viiTHsem B.E. electrical
G.H.RAISONI COLLEGE OF ENGINEERING, NAGPUR
16
EXPERIMENT NO: - 7
AIM: - MEASUREMENT OF CAPACITANCE AND DISSIPATION FACTOR (TAN δδδδ) OF
SOLID
INSULATING MATERIAL BY ELTEL CTS-500KIT.
* Measurement of two winding transformer.
APPARATUS: - Eltel Tan Delta Set, Testing transformer, connecting wires, etc.
THEORY: - Write about ( Tan Delta ) Dissipation factor. Its basic theory
Write about Shearing bridge used for measurement of Capacitance and Tan
delta.
GENERAL DESCRIPTION OF THE EQUIPMENT:-
General description about ELTEL – CTS – 500 Model: - It is a,
• Self contained instrument designed for the accurate measurement
of capacitance and Tan delta of electrical insulation. The test set
is suitable for making two terminals or three terminal
measurements on a specimen that may be grounded or floating.
• The test set operates at a frequency of 80KHZ with voltage at
500v.
• Equipment works on the principle of transformer ratio bridge type
circuit.
OPERATING INSTRUCTION: -
1) Connect the ground test lead to station ground using the test lead provided.
2) Set the selector switch to the required position.
3) Connect the instrument to the specimen to be tested.
4) Connect H & L cable of meter to High and Low voltage side transformer respectively
5) Guard connects to earth and transformer body to earth separately.
6) Set detector phasing switch.
7) Set DF range 0 to 1%.
8) Set Cap multiplier to .01 uF.
9) Set capacitance switch to 5 & capacitance dial to 000.
10) Turn bridge power Switch ON.
11) If the detector swings to the right, turn the capacitance multiplier switch in counter
clockwise direction until the detector swings to the left.
12) Advance the Capacitance switch clockwise until the detector swings to the then turn
the switch back by one step.
13) Adjust the multiturn Capacitance dial to bring the detector to zero position.
14) Turn the detector phasing switch to DF.
15) Bring the detector to zero by the DF range switch and DF dial.
16) Turn the detector phasing switch to C and adjust C to null position.
17) Repeat above three steps until no further adjustment is required.
Page 17
DEPARTMENT OF ELECTRICAL ENGINEERING viiTHsem B.E. electrical
G.H.RAISONI COLLEGE OF ENGINEERING, NAGPUR
17
PROCEDURE: -
1) Clean the transformer after isolating from the system and other accessories.
2) Remove oil and dry it.
3) Short the HV & LV terminals.
4) Short the Neutral to corresponding terminal.
5) For UST Place the selector switch at UST (Ungrounded Sample Test CHL) For UST - means
measurement of H – L.
6) Repeat the operating instruction (1 to 14).
7) For second set of observation – ie. For measurement of H – GND – keep selector switch at L –
Guard. And repeat the operating instruction.
OBSERVATIONS: - UST = Ungrounded Specimen Test.
GST = Grounded Specimen Test
1) FOR CAPACITANCE: -
Sr. No. Mode Multiplier
A
Switch
B
Dial
C
Capacitance calculation =
A X (B + 0.C )
01 UST 0.001uf 7 561 .007561
02
CALCULATIONS: -
Capacitance = A X ( B+0.C)
= .001*7 + .001* .561
= 0.007561 uF
= 7561 PF= 75.61%
2) FOR DISSIPATION FACTOR (tan δδδδ): -
Sr. No. Mode Dissipation
Factor (DF)
Range
Dial
D % tan δ = Lower Scale +
0.D * (Difference of Scale)
01 UST 10-20 258
02
RESULT: - Capacitance and % tan δ between two winding are found to be as follows,
1) between H & L UST ----------, ----------%
2) between H & L Guard ---------, ---------%
3) between L & H Guard ----------, ----------%
PRECAUTIONS: -
1) Transformer must be isolated from the supply and load.
2) Clean the transformer and transformer bushings.
3) Results will be better in the dry atmosphere.
4) While shorting the HV & LV terminals sag is not allowed.
5) Person should kept away several feet the test object, otherwise it may affects on the
results.
6) It should be noted that in the GST mode of testing, the full test voltage is present
between the shells of the UHF connector and the body of the unit. Take care as to not to
come in contact with these two simultaneously.
Page 18
DEPARTMENT OF ELECTRICAL ENGINEERING viiTHsem B.E. electrical
G.H.RAISONI COLLEGE OF ENGINEERING, NAGPUR
18
7) This instrument must always be connected to ground with the supplied leads and front
panel ground binding post prior to and during all measurements.
8) The apparatus being tested must be cleaned and correctly grounded to avoid any
possibility of lethal floating potential.
QUESTIONS: -
1. Which are the different circuits used for the measurement of capacitance
and dissipation factor.
2. What information we get from the dissipation factor and capacitance
related to insulation.
3. List the methods to detect partial discharge.
Page 19
DEPARTMENT OF ELECTRICAL ENGINEERING viiTHsem B.E. electrical
G.H.RAISONI COLLEGE OF ENGINEERING, NAGPUR
19
EXPERIMENT NO:8
AIM: - STUDY THE FERRANTI EFFECT AND SURGE IMPEDANCE LOADING IN
EHV LINE.
THEORY: -
1) FERRANTI EFFECT:
The phenomenon of rise in voltage at the receiving end of the open circuited or lightly
loaded line is called the Ferranti effect, owing to its first being observed on the Deptford
mains laid down by S. Z. De Ferranti in1890. This rise in voltage is due to the end of self-
inductance of the charging current being is phase with the applied voltage at the sending end
of the line & thus both capacitance & inductance are necessary to call this phenomenon.
The effect becomes more pronounced as the line length increases.
To prove this analytically, consider the equation Vs for nominal π model of line,
Z=R+JX
Vs = A VR + B IR = (1+ YZ/2) VR + Z IR
At no load IR = 0
Vs = (1 + YZ/2) VR
Vs – VR = (YZ/2) VR
Where Z = (r + jwL)l & Y = jwCl l = length of line
If resistance of line neglected ; Z = jwLl
Vs – VR = ½ (jwLl) * ( jwCl) VR
Vs - VR = -1/2 (w2l2) LC VR
For overhead lines,
1/√LC = Velocity of propagation of electromagnetic waves on the line
= Velocity of light = 3 * 108 m/s.
Vs – VR = - ½ [( 2πf)2 l
2] / (3*10
8)2 VR
Thus (Vs – VR ) is negative. It means that VR>Vs. also it is clear that Ferranti effect
depends on frequency and length of line. It does not depend on conductor diameter and
spacing between conductor.
Page 20
DEPARTMENT OF ELECTRICAL ENGINEERING viiTHsem B.E. electrical
G.H.RAISONI COLLEGE OF ENGINEERING, NAGPUR
20
2) SURGE IMPEDANCE LOADING:
Surge Impedance: - The square root of the ratio of the line impedance (Z) & shunt
admittance (Y) is called the surge impedance (Zo) of the line i.e. Zo = √(Z/Y) where Z =R +
jX & Y =G + jB. Surge impedance is the characteristic impedance of a loss free line. For a
heavy copper conductor & well insulated line the resistance (R) & leakage conductance (G)
can be taken as zero & therefore, surge impedance Zo = √(L/C) which is a pure resistance.
Its value varies between 400Ω & 600Ω in case of overhead transmission line and 40Ω &
60Ω in case of underground cable.
SIL: - This is defined as the load (of unity power factor) that can be delivered by the line
of negligible resistance. Power transmitted, PR =VRL2 / Zo MW, where VRL is the receiving
end line voltage in KV & Zo is the surge impedance in Ω. PR is called the surge impedance
loading or natural power of the line.
The above expression gives the limit of the maximum power that can be delivered
by a line & is useful in the design of transmission line. This can be used for the comparison
of loads that can be carried on the transmission line at different voltages.
The power transmitted through a long transmission line can be increased either by
increasing is the value of receiving end voltage ( VRL) or by reducing surge impedance
(Zo).
Nowadays the trend is of employing higher & higher voltages for transmission,
therefore this is the most commonly adopted method for increasing the power limit beyond
which it is neither economical nor practicable to increase the value of receiving end line
voltages.
Since the spacing between the conductors, which depends upon the line voltage
employed, cannot be reduced much, so the value of surge impedance (Zo) cannot be varied
as such. However, some artificial means, such as series capacitors (capacitors in series with
the transmission lines) or shunt capacitors (capacitors in parallel with the transmission lines)
can be used to reduced the value of surge impedance (Zo).
For a loss free transmission line, surge impedance, Zo = √ (L/C) & propagation
constant, γ = jw√LC = jB where B is the phase shift, which determines the torque angle δ
between Vs & VR & hence the system stability.
By the use of series capacitors, surge impedance (Zo) & phase shift (B) get
reduced due to decrease of line inductance (L). This improves the system stability limit also.
But it causes difficulties under short circuit conditions of the system as no satisfactory
protection of capacitors has yet been devised. These capacitors are also helpful in reducing
line drops & so voltage variations.
By use of shunt capacitors, through the surge impedance (Zo) is reduced but the
phase shift (B) is increased due to increase in the value of C. Hence stability conditions
become worse, specially when synchronous machines are used as loads. So this method is
not used in case of long transmission lines, specially when stability limits are present.
Page 21
DEPARTMENT OF ELECTRICAL ENGINEERING viiTHsem B.E. electrical
G.H.RAISONI COLLEGE OF ENGINEERING, NAGPUR
21
OBSERVATION TABLE: -
1) SURGE IMPEDANCE LOADING
Sr. No. Psend Vsend Isend Prec Vrec Irec
01
02
2) FERRANTI EFFECT
Sr. No. Vsend Vrec
01
02
CALCULATION: -
For SIL, Power transmitted,
PR = V2
RL/ Zo MW.
QUESTIONS: -
1. Clearly explain the Ferranti effect in the field of electrical power system.
2. What is surge impedance and surge impedance loading.
3. What is difference between characteristic impedance and surge
impedance.
Page 22
DEPARTMENT OF ELECTRICAL ENGINEERING viiTHsem B.E. electrical
G.H.RAISONI COLLEGE OF ENGINEERING, NAGPUR
22
EXPERIMENT NO:9
AIM: - MEASUREMENT OF DIELECTRIC CONSTANT, DISSIPATION FACTOR (TAN
δδδδ) AND
RESISTIVITY OF OIL.
APPARATUS: - Oil Loss Angle Meter (Model MLO – 1D), Million Megaohm Meter (Model LS
– 3D),
Three Terminal Oil Test Cell, Heating Chamber etc.
THEORY: - Explain the schering bridge
PROCEDURE: -
A) Measurement of Dielectric Constant
Equipment: - Oil Loss Angle Meter, Three Terminal Oil Test Cell.
Before proceeding to make this test, clean the oil cell throughly. This may be ensured by
testing empty clean cell on Million Megohm Meter.
1) connect the oil loss angle meter to 230V AC, 50 Hz power supply.
2) Switch on the equipment.
3) Keep ‘OPERATE’ switch in ‘SET ZERO’ position.
4) Keep the voltage at zero.
5) Mount the oil cell on insulated base plate and connect the empty cell to the oil loss angle
meter by the cable provided. The connection should be (a) Terminal HV connect to
outer case. (b) Terminal LV to inner case & (c) Guard terminal should be connect to
middle terminal of oil test cell.
6) Now put ‘OPERATE’ switch in ‘HV ON’ position.
7) Gradually raise the voltage to about 300V.
8) With the help of ‘NULL’ control adjust the null meter to read 1.00.
9) Put ‘OPERATE’ switch in ‘SET ZERO’ position.
10) Do not alter or disturb the voltage or control knob.
11) Pour required quantity of oil in the cell
12) Now put ‘OPERATE’ switch in ‘HV ON’ position.
13) Null meter will show a different reading. This new reading directly shows the Dielectric
Constant of the sample under test.
Page 23
DEPARTMENT OF ELECTRICAL ENGINEERING viiTHsem B.E. electrical
G.H.RAISONI COLLEGE OF ENGINEERING, NAGPUR
23
B) MEASUREMENT OF DISSIPATION FACTOR (TAN δδδδ)
Equipment: - Oil Loss Angle Meter, Three Terminal Oil Test Cell, Heating Chamber etc.
Tan δ for oils is normally measured at 900C as recommended by I. S. I., but for R& D purpose it
can be at any temperature upto 1500C.
1) Clean the Oil Cell throughly, this can be ensured by measuring resistance on
Million Megohm Meter which should by practically infinite.
2) Pour oil to be tested in the cell gradually, the oil enters the space cavity in
between the electrodes of cell through holes provided.
3) Keep Oil Cell in Heating Chamber.
4) Connect Heating Chamber to 230V AC, 50 Hz supply.
5) Switch on the Heating Chamber. Pilot lamp will come on.
6) Switch on the Heater by a switch marked Heater ON/OFF. LED will glow indicating
that Heater is ON.
7) Connect the sensing probe to the Heating Chamber by means of connecting its 3 pin
lunar socket probe in the oil cell carefully.
8) The meter on Heating Chamber will indicate the temperature of the oil in cell.
9) Connect Oil Loss Angle Meter to 230V AC, 50Hz power supply.
10) Keep the voltage Zero and ‘OPERATE’ switch in ‘SET ZERO’ position.
11) Connect the Three Terminal Oil Cell to the instrument.
12) Slowly raised the voltage to create the desired stress level.
13) When the temperature of oil cell in heating chamber reach to 900C, then heater supply
will be cut off automatically and heater ‘ON’ indication lamp will go off. The trip
setting may be changed if required by adjusting the ‘TRIP SET control.
14) Put ‘OPERATE’ switch in ‘HV ON’ position.
15) When the temperature is 900C, with the help of ‘NULL’ control adjust the null indicator
to read 5.00.
16) Again put ‘OPERATE’ switch in SET ZERO. Set the zero on tan δ meter carefully with
the help of set zero control.
17) Put ‘OPERATE’ switch in ‘HV ON’ position and read the value of tan δ on the DP %
directly in percentage.
QUESTIONS: -
1. What are the various methods to calculate dielectric constant, dissipation
factor and resistivity of oil.
2. Write all the parameters for good quality transformer oil.
3. What is meant by pure and commercial liquid.


![G.H. RAISONI COLLEGE OF ENGINEERING UGC Act, CPF Digdo …ghrce.raisoni.net/ac/3rd.pdfG.H. RAISONI COLLEGE OF ENGINEERING [An Autonomous Institute under UGC Act, 1956] CPF Gab No.3,](https://static.documents.pub/doc/80x56/5e679358236a97190b18a8d6/gh-raisoni-college-of-engineering-ugc-act-cpf-digdo-ghrce-gh-raisoni-college.jpg)


