1 A STUDY ON CUSTOMER SATISFACTION OF GANESH DEPARTMENT STORE AT THE PALLADAM PROJECT REPORT SUBMITTED BY H.VASUDEVAN (REG. NO. 1325G0255) UNDER THE GUIDANCE OF MR.A. BALAKRISHNAN B.com., M.B.A., M.Phil., PGDCA., Asst Professor- Department of Management Studies. IN PARTIAL FULFILLMENT OF THE REQUIREMENT FOR THE AWARD OF THE DEGREE OF BACHELOR OF BUSINESS ADMINISTRATION WITH COMPUTER APPLICATIONS IN BHARATHIAR UNIVERSITY DURING THE ACADEMIC YEAR 2015 – 2016 DEPARTMENT OF MANAGEMENT STUDIES BISHOP AMBROSE COLLEGE COIMBATORE-45
Transcript
1
A STUDY ON CUSTOMER SATISFACTION OF GANESH DEPARTMENT STORE AT THE PALLADAM
IN PARTIAL FULFILLMENT OF THE REQUIREMENT FOR THE AWARD OF THE DEGREE OF BACHELOR OF BUSINESS ADMINISTRATIONWITH COMPUTER APPLICATIONS IN BHARATHIAR UNIVERSITY
DURING THE ACADEMIC YEAR
2015 – 2016
DEPARTMENT OF MANAGEMENT STUDIES
BISHOP AMBROSE COLLEGE
COIMBATORE-45
2
DEPARTMENT OF MANAGEMENT STUDIES
BISHOP AMBROSE COLLEGE
COIMBATORE -45
Certificate that this is a bonafide record of project done byH.VASUDEVAN (Reg .No. 1325G0255) in partial fulfillment of the requirement for the award of Degree of BACHELOR OF BUSINESS ADMINISTRATION in BHARATHIAR UNIVERSITY during the academic year 2015-2016
Certified that we examined the candidate in the project work viva voce
examination held on at Bishop Ambrose college, Coimbatore.
Internal Examiner External Examiner
3
DECLARATION
I hereby declare the project work entitled A STUDY ON CUSTOMER SATISFACTION ABOUT GANESH DEPARTMENT STORE IN PALLADAM Submitted to the Bharathiar University for the award of
BACHELOR OF BUSINESS ADMINISTRATION. It is a record of work done by me under the guidance of MR .A. BALAKRISHNAN, B.Com,M.B.A., M.Phil. PGDCA Lecturer, Department of Management Studies.
This project has not from the basis for award of degree or diploma or associates of similar title.
( H. VASUDEVAN )DATE : Signature of the Candidate
PLACE :
4
ACKNOWLEDGEMENT
I am very grateful to Rev. Fr. MARIYA IRUTHAYANATHAN (secretary) Of Bishop Ambrose College for having permitted to undergo this project study
I am very grateful to Dr. A. PETER RAJ, M.A., M.Phil. B.Ed., and D.G.T., Ph.D., Principal of Bishop Ambrose College for having
Permitted to undergo this project study.
I take the privilege to express my sincere thanks and deep sense of gratitude to Mr. A. ANAND GERALD B.Sc., M.B.A., M.Phil, and Head of the
Department of Management Studies.
I take the privilege to express my sincere thanks and deep sense of gratitude to Mr.A.BALAKRISHNAN, B.Com, M.B.A.,M.Phil.,PGDCA my project guide
for excellent guidance.
I would like to thank our entire Department staff members , for their moral support they extended always.
I would like to thank my beloved parents and friends for their moral support they extended always.
Finally I gratefully acknowledge the co-operation and help received from the respondents. I am in deep much thank ful to all the entire persons who helped
to complete this project.
5
CONTENTS
CHAPTERNO
PARTICULARS PAGENO
I. INTRODUCTION AND DESIGN OF THE STUDY1.1 INTRODUCTION 11.2 ABSTRACTS 3
II. OBJECTIVES OF THE STUDY
2.1 SCOPE OF THE STUDY 52.2 LIMITATION OF THE STUDY 62.3 REVIEW OF LITERATURE 7
III. RESEARH METHODOLOGYIV ANALYSIS AND INTERPRETATION
4.1 DATA ANALYSIS AND INTERPRETATION 12
4.2 SIMPLE PERCENTAGE 13
4.3 CHI-SQUARE TEST 62
V SUMMARY OF FINDINGS, SUGGESTIONS, AND CONCLUSION
5.1 FINDINGS 70
5.2 SUGGESTIONS 72
5.3 CONCLUSION 73
5.4 BIBLIOGRAPHY 74
5.5 ANNEXURE 75
6
LIST OF TABLES
TABLENO
TITLES PAGENO
4.1 TABLE SHOWING AGE GROUP OF THE RESPONDENTS 124.2 TABLE SHOWING GENDER OF THE RESPONDENTS 144.3 TABLESHOWING QUALIFICATION OF THE RESPONDENTS 164.4 TABLE SHOWING FAMILY STATUS OF THE RESPONDENTS 184.5 TABLE SHOWING MONTHLY INCOME OF THE
RESPONDENTS20
4.6 TABLE SHOWING VISIT GANESH DEPARTMENT STORE OF
THE RESPONDENTS22
4.7 TABLE SHOWING PUCHASE MORE OFTEN IN GANESH
DEPARTMENT STORE24
4.8 TABLE SHOWING WHICH SOURCE MADE TO BUY
PRODUCTS FROM GANESH DEPARTMENT STORE26
4.9 TABLE SHOWING MAKE PUCHASE OF PRODUCTS IN
GANESH DEPARTMENT STORE28
4.10 TABLE SHOWING GANESH DEPARTMENT STORE PROVIDE
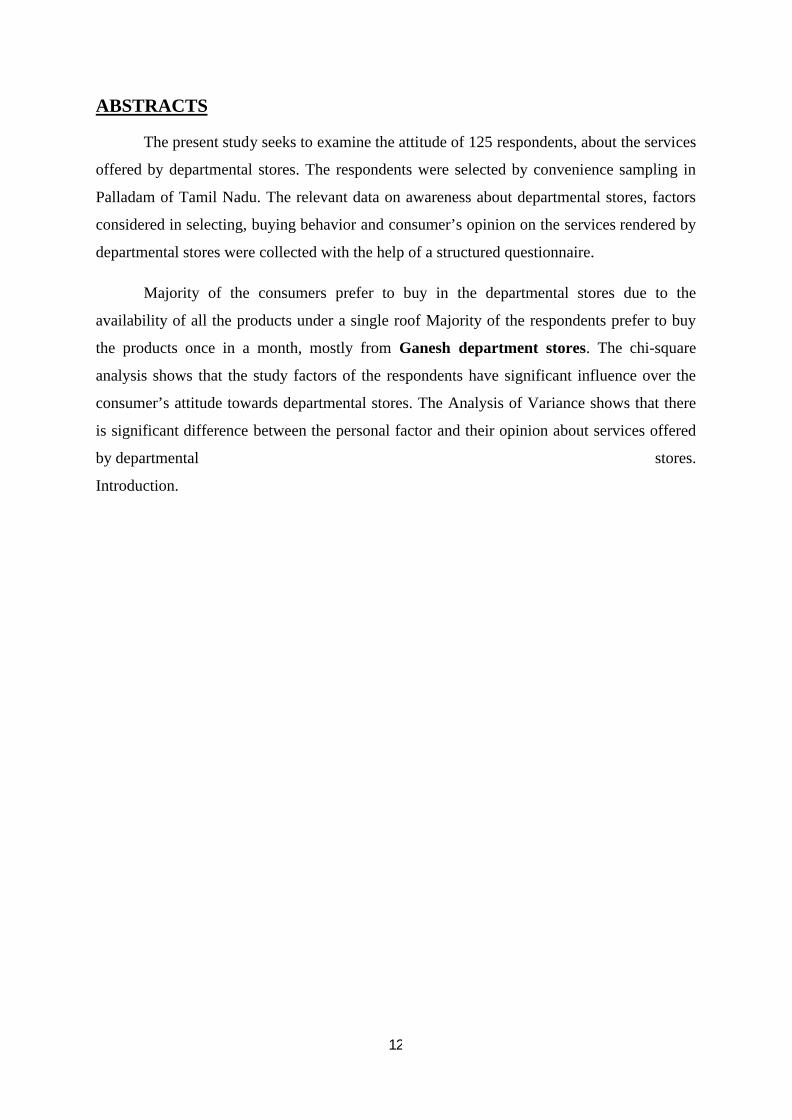
The present study seeks to examine the attitude of 125 respondents, about the services
offered by departmental stores. The respondents were selected by convenience sampling in
Palladam of Tamil Nadu. The relevant data on awareness about departmental stores, factors
considered in selecting, buying behavior and consumer’s opinion on the services rendered by
departmental stores were collected with the help of a structured questionnaire.
Majority of the consumers prefer to buy in the departmental stores due to the
availability of all the products under a single roof Majority of the respondents prefer to buy
the products once in a month, mostly from Ganesh department stores. The chi-square
analysis shows that the study factors of the respondents have significant influence over the
consumer’s attitude towards departmental stores. The Analysis of Variance shows that there
is significant difference between the personal factor and their opinion about services offered
by departmental stores.
Introduction.
13
II. OBJECTIVES OF THE STUDY
1. To study the factors influencing the customers to purchase house hold articles from
departmental store.
2. To study the needs of the customers at the place of purchase.
3. To study the consumer’s opinion and ideas about the price, quality and services rendered
by the departmental stores.
4. To study the sales services provided by the departmental stores.
5. To suggest, improve in sales and functions in the departmental stores based on results.
14
SCOPE OF THE STUDY
This research gives a broad frame work of the “A STUDY ON CUSTOMER
SATISFACTION ABOUT GANESH DEPARTMENT STORE IN PALLADAM”
.The researcher covered three departmental stores in Ganesh departmental store-
palladam. This can be used as a guideline in the future business plan and making changes
in the current activities. It gives an idea of the areas, which need emphasis and
development. This study has been conducted in Erode city covering all the areasfalling
within the palladam zone with a sample size of 125 respondents. All classes of customers
were met and their views were analyzed.
15
1.6 LIMITATIONS OF THE STUDY
1. Due to time constraints an in-depth enquiry could not be conducted.
2. For convenience purpose, the population taken for the study refers to the customers of
Ganesh departmental stores, Sakthi super market and Spencer’s.
3. In order to complete the study within the time frame, the number of respondents had
been restricted to 125.
4. Information given by the respondents may not be accurate, due to the time factor.
5. The result will not be same in the next period and uncertain predictions are expected.
6. Many of the customers were not able to give complete data due to their busy schedule.
16
REVIEW OF LITERATURE
Anderson and Cook
(1999) have tried to bring together varying threads of the idea of "community food
security" (CFS) into a cohesive set of ideas rooted in a common theory. They assert that three
main groups contribute to food security: 1) community nutritionists and educators, 2)
progressive agricultural researchers and grass roots activists, and 3) anti-hunger and
community development researchers and activists. All three have different objectives and
interests, but together they form the collective interpretation of community food security.
Frongillo
(1999) describes food insecurity for individuals along the following spectrum: the
least severe form is people who are uncertain of being able to obtain food in socially
acceptable ways, to the most severe form where people simply do not eat enough due to
insufficient resources and thus "experience the physical and psychological consequences of
hunger" (Frongillo, 1999, 506s). In this view, food insecurity has four components: quantity
and quality of food (related directly to food), and certainty and acceptability (psychological
and social).
Grocery
Any store whose primary sale item is food may be classified as a grocery store. This
ranges from small corner "ma-and-pa" stores to large supermarkets. This range can be viewed
hierarchically: larger stores will usually have more items for sale, lower prices, more floor
space and more aisles, more specialty sections, and are more likely to be part of a larger
corporate grocery chain (Census Bureau, 1992).
Weinstein, 2000
The supermarket is "a retail format with long-established ties to suburban, middle
class life" (Lavin, 2000, 49). It functions on the strategies of "impulse buying, promotion of
national brands, and customer self-service" (Michman and Mazze, 1998, 6).
17
Michman and Mazze, 1998
The US, many major chain grocery stores left inner city areas following race riots in
the 1960s. To this day, some still claim insurance costs for fire and theft are so high in such
neighborhoods that grocery stores will not locate there. Thus, food retail outlets follow a
"hole in the donut" model with wealthy suburbs surrounding an under-served inner-city core,
which is attributed to a failure in the US to promote multi-class, mixed-use downtown areas
(Toronto Food Policy Council, 1996).
O'Kelly, 2001
A study of retail market share and saturation states that only in the case of small
towns will all stores compete with each other. Analysis becomes more complex when the city
is large enough to have multiple stores where distinguishable sub-markets exist. In such
cases, stores are not all in direct competition with each other . Unlike in the suburbs, there is
no saturation of supermarkets in the inner city, and therefore retailers are looking to these
areas for expansion. What attracts them is the more than $331 billion of "retailing purchasing
power" that inner city residents wield (Janoff, 1999).
Turcsik, 2001
Supermarkets have consolidated to the point where the top five supermarket chains
controlled 37 percent of the market in 1999. According to Gambino this consolidation
weakens the power of both manufacturers and consumers. Family-run and regional chains are
viewed as the next targets of acquisitions . There also has been a concerted effort by large
department stores to enter into the food retail business. As a result, powerful chains can exert
enormous influence onto an industry that already has very small profit margins.
18
Seston and Zhang (2001)
Observe that the present trend of increasing food industry market power and
consolidation can lead to an even larger share of market surplus. They observe that
concentration in food manufacturing has grown rapidly through mergers and consolidations,
and that "exercise of market power anywhere in the market chain will reduce consumers'
welfare" (their emphasis) (Sexton and Zhang, 2001, 60).
Franklin, 2001.
The top four firms in the US own 43 percent of national supermarkets. The largest
grocery chain in the US, Kroger, is now being rivaled by Wal-Mart, the world's largest
department store. Wal-Mart sold $15 billion in supermarket sales in 1999, putting it as the 5th
largest supermarket chain in the US, even though it is not technically a supermarket. An
increasing percentage of Wal-Mart's sales are from supermarket items - now at 30 percent of
all sales. Wal-Mart plans to open "neighborhood stores", to primarily sell food items,
effectively putting it into direct competition with large supermarket chains
Seiders and Tigert, 2000
A case study on the effect of supercenters by looking at four American metropolitan
areas, including Columbus, Ohio. They found that Wal-Mart and K-Mart supercenters
captured 16 percent of primary shoppers and 27 percent of secondary shoppers in the study
(primary stores are most often shopped, while secondary stores are second most frequented).
In the case of Columbus, 41 percent of shopped considered a convenient location to be at
least twice as important as any other reason for choosing stores (Seiders and Tigert, 2000).
This may indicate that Wal-Mart and other supercenters and department stores may be using
their market share to move into other industries.
19
METHODOLOGY OF STUDY
Title of the study:
The research was undertaken in topic entitled “A study on Ganesh Department
Store ”
Research design:
A research design is the arrangement of condition for collection &analysis of the data in
a manner that aims to combine relevance to the research purpose with economy in procedure.
The researches have used descriptive researches for the purpose of study.
It is used for the characteristics of certain groups to make specific prediction & to determine
the association of the variables
Sampling method:
The researcher have used judgement sample which is selected according to once
personal judgement inwards, investigator use his judgement choice and includes only those
items of the universe in the sample for selection idea which is considers representative has
been applied based this researches adopted judgement sampling`
Sampling unit :
The sampling unit comprise of different types retailer who are potential dealers of Hindustan uni
lever product in Coimbatore city.
Sampling size:
The survey was conducted on 125 respondents from the universe to frame a sample.
The researches has used respondent as a sample size this study for collecting the required
information data the researches had met the respondent in respondent in person and collected
data’s.
Data collection method:
The data has been collected by the both primary & secondary method of data
collection.
20
Primary data:
The data are collected fresh and for the first time and thus happen to be original in
character the researches followed a rigid procedure and seek to a set of pre-determined
questions.
Secondary data:
The data those which already have been collected by someone else, already available
if secondary has been collected from the textbook, journals, magazines, newspaper and
website.
Charts used:
I) Bar diagrams
21
CHAPTER-IV
ANALYSIS AND INTERPRETATION
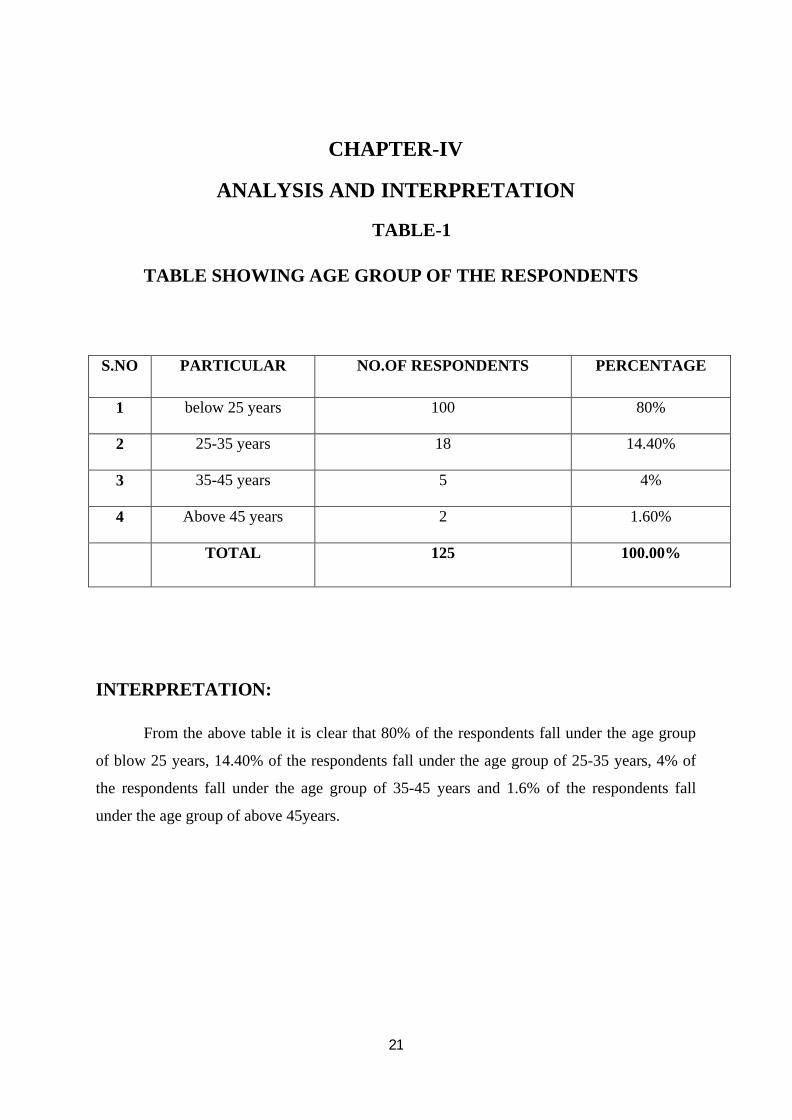
TABLE-1
TABLE SHOWING AGE GROUP OF THE RESPONDENTS
S.NO PARTICULAR NO.OF RESPONDENTS PERCENTAGE
1 below 25 years 100 80%
2 25-35 years 18 14.40%
3 35-45 years 5 4%
4 Above 45 years 2 1.60%
TOTAL 125 100.00%
INTERPRETATION:
From the above table it is clear that 80% of the respondents fall under the age group
of blow 25 years, 14.40% of the respondents fall under the age group of 25-35 years, 4% of
the respondents fall under the age group of 35-45 years and 1.6% of the respondents fall
under the age group of above 45years.
22
CHART-1
CHART SHOWING AGE GROUP OF THE RESPONDENTS
100
185 2
125
80%
14.40%4%
1.60%
100.00%
below 25 years 25-35 years 35-45 years Above 45 years TOTAL
1 2 3 4
NO.OF RESPONDENTS PERCENTAGE
23
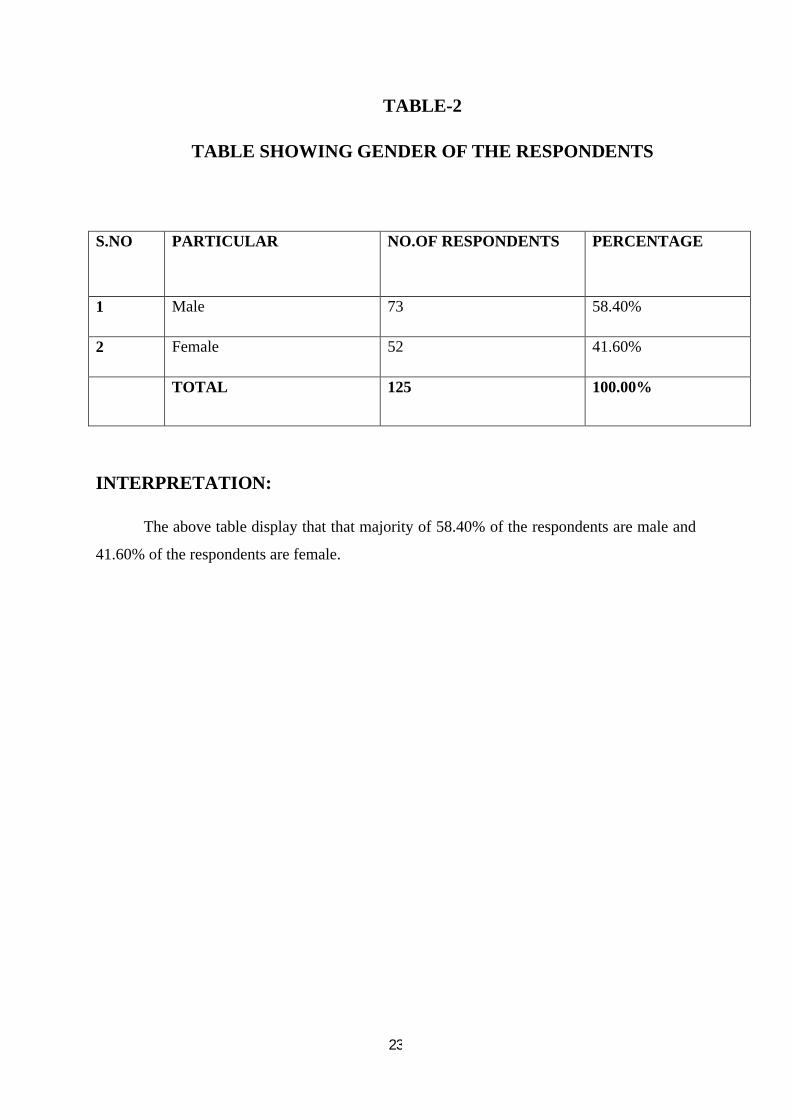
TABLE-2
TABLE SHOWING GENDER OF THE RESPONDENTS
S.NO PARTICULAR NO.OF RESPONDENTS PERCENTAGE
1 Male 73 58.40%
2 Female 52 41.60%
TOTAL 125 100.00%
INTERPRETATION:
The above table display that that majority of 58.40% of the respondents are male and
41.60% of the respondents are female.
24
CHART-2
CHART SHOWING GENDER OF THE RESPONDENTS
Male Female TOTAL
1 2
7352
12558.40%
41.60%
100.00%
NO.OF RESPONDENTS PERCENTAGE
25
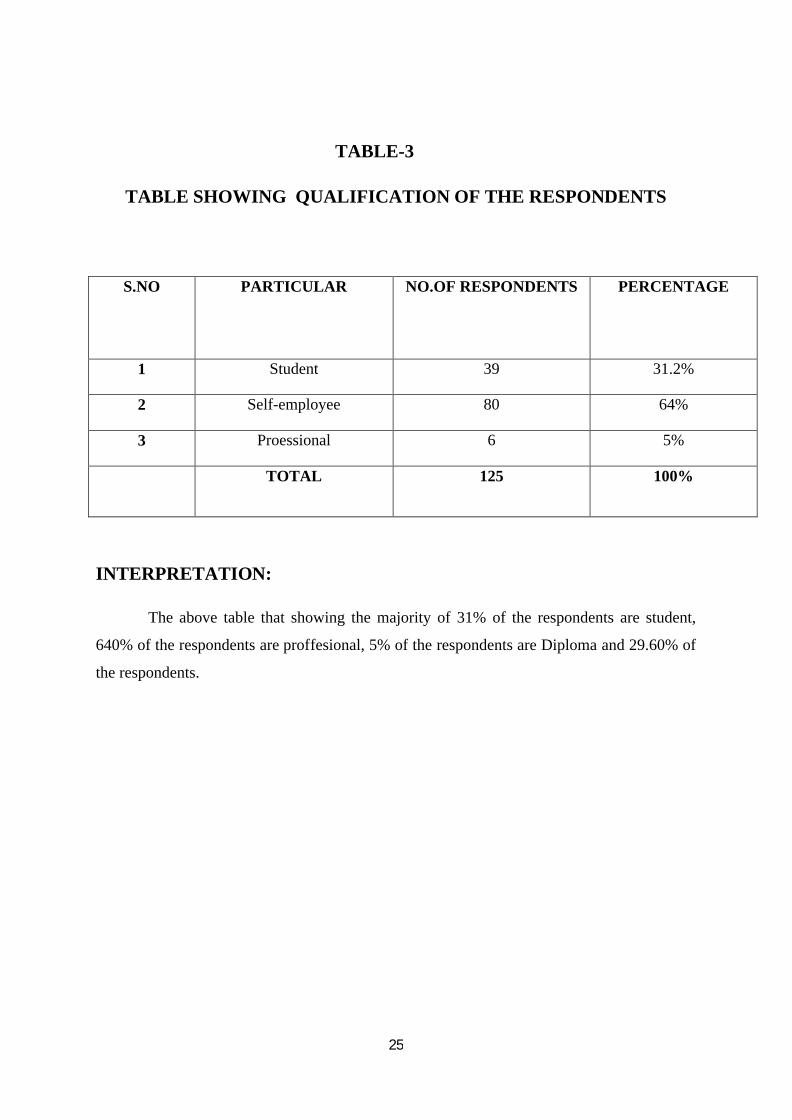
TABLE-3
TABLE SHOWING QUALIFICATION OF THE RESPONDENTS
S.NO PARTICULAR NO.OF RESPONDENTS PERCENTAGE
1 Student 39 31.2%
2 Self-employee 80 64%
3 Proessional 6 5%
TOTAL 125 100%
INTERPRETATION:
The above table that showing the majority of 31% of the respondents are student,
640% of the respondents are proffesional, 5% of the respondents are Diploma and 29.60% of
the respondents.
26
CHART-3
CHART SHOWING QUALIFICATION OF THE RESPONDENTS
Student Self-employee Proessional TOTAL
1 2 3
39
80
6
125
31.20%
64%
5%
100%
NO.OF RESPONDENTS PERCENTAGE
27
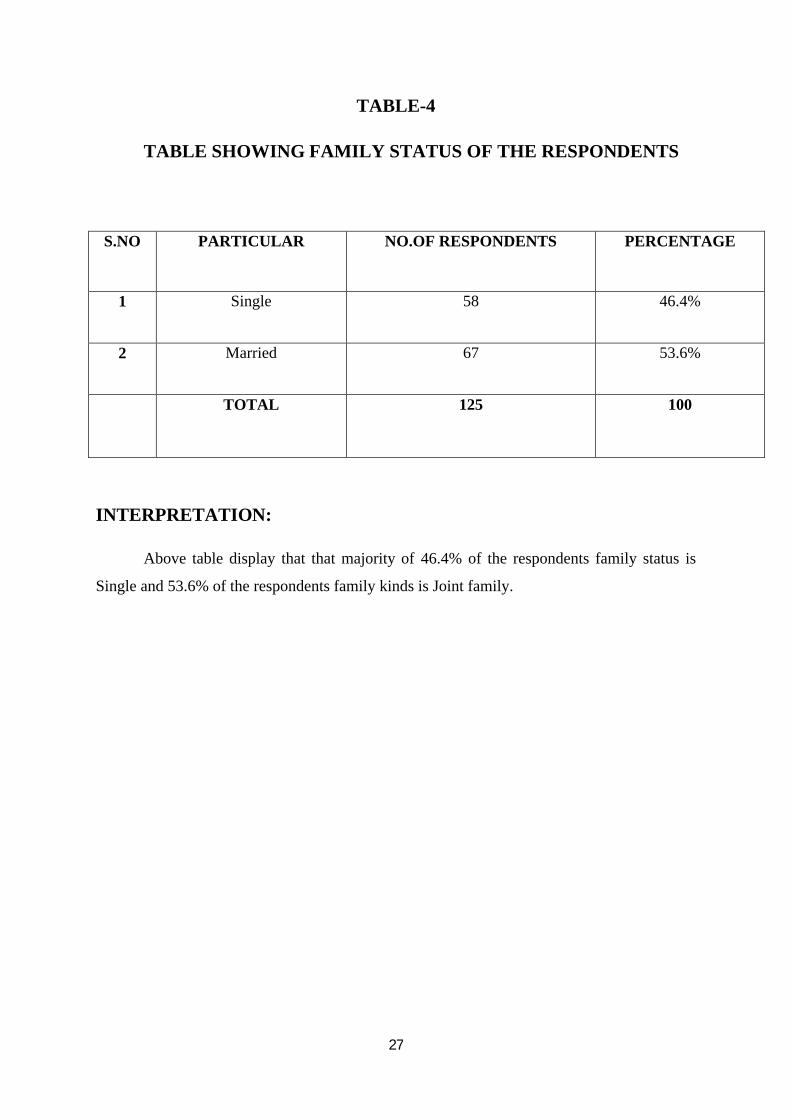
TABLE-4
TABLE SHOWING FAMILY STATUS OF THE RESPONDENTS
S.NO PARTICULAR NO.OF RESPONDENTS PERCENTAGE
1 Single 58 46.4%
2 Married 67 53.6%
TOTAL 125 100
INTERPRETATION:
Above table display that that majority of 46.4% of the respondents family status is
Single and 53.6% of the respondents family kinds is Joint family.
28
CHART-4
CHART SHOWING FAMILY STATUS OF THE RESPONDENTS
58 67125
46.40% 53.60%
100
Single Married TOTAL
1 2
Chart TitleTOTAL 125
29
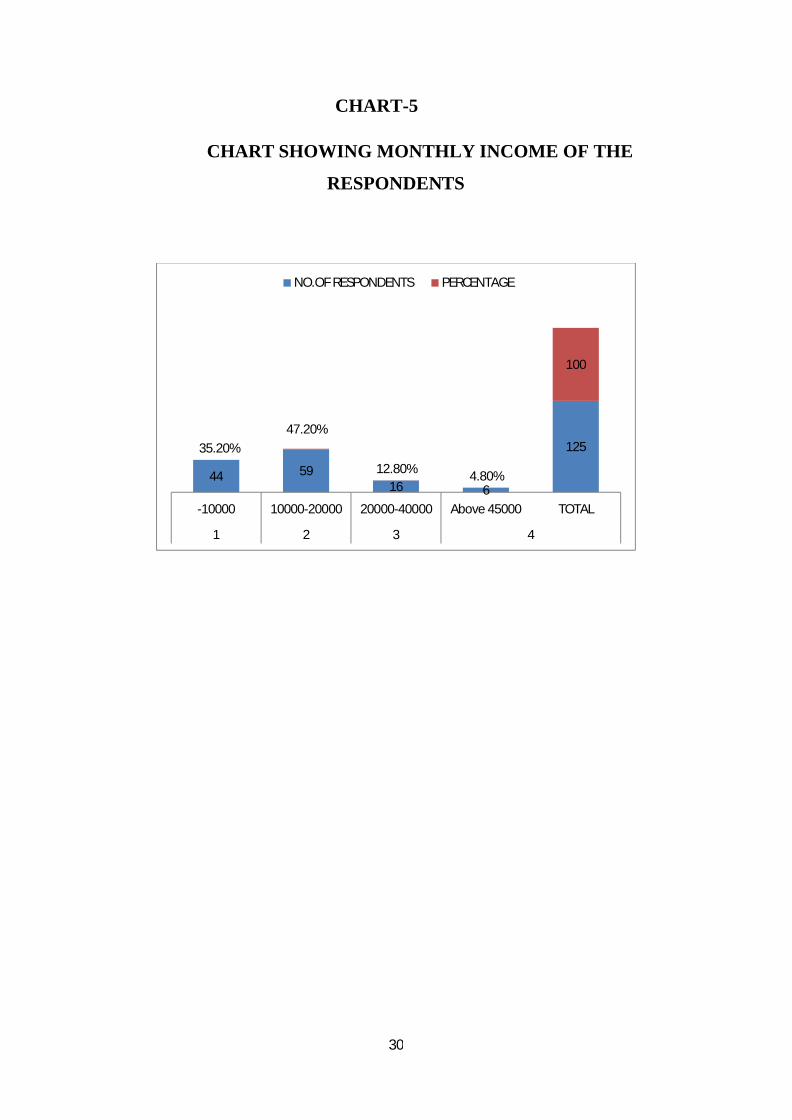
TABLE-5
TABLE SHOWING MONTHLY INCOME OF THE
RESPONDENTS
S.NO PARTICULAR NO.OF RESPONDENTS PERCENTAGE
1 -10000 44 35.2%
2 10000-20000 59 47.2%
3 20000-40000 16 12.8%
4 Above 45000 6 4.8%
TOTAL 125 100
INTERPRETATION:
Above table display that that majority of 35.2% of the respondents salaries lies
between Below 10000, 47.2% of the respondents salaries lies between Rs 10000-20000,
12.8% of the respondents salaries lies between Rs 20000-40000 and 4.8% of the respondents
salaries lies between above 40000.
30
CHART-5
CHART SHOWING MONTHLY INCOME OF THE
RESPONDENTS
44 5916 6
12535.20%47.20%
12.80% 4.80%
100
-10000 10000-20000 20000-40000 Above 45000 TOTAL
1 2 3 4
NO.OF RESPONDENTS PERCENTAGE
31
TABLE-6
TABLE SHOWING VISIT GANESH DEPARTMENT STORE OF THE
RESPONDENTS
S.NO PARTICULAR NO.OF RESPONDENTS PERCENTAGE
1 Once in a weak 49 39.2%
2 Once in a 15 days 52 41.6%
3 Once in a month 13 10.4%
4 Once in a 2 month 11 8.8%
TOTAL 125 100
INTERPRETATION:
Above table display that that majority of 39.2% of the respondents are Once in a
Weak, 41.6% of the respondents are Once in a 15 days, 10.4% of the respondents are Once in
a month and 8.8% of the respondents are Others professions.
32
CHART-6
CHART SHOWING VISIT GANESH DEPARTMENT STORE OF THE
RESPONDENTS
Once in aweak
Once in a 15days
Once in amonth
Once in a 2month
TOTAL
1 2 3 4
49 5213 11
12539.20%
41.60%
10.40%8.80%
100
NO.OF RESPONDENTS PERCENTAGE
33
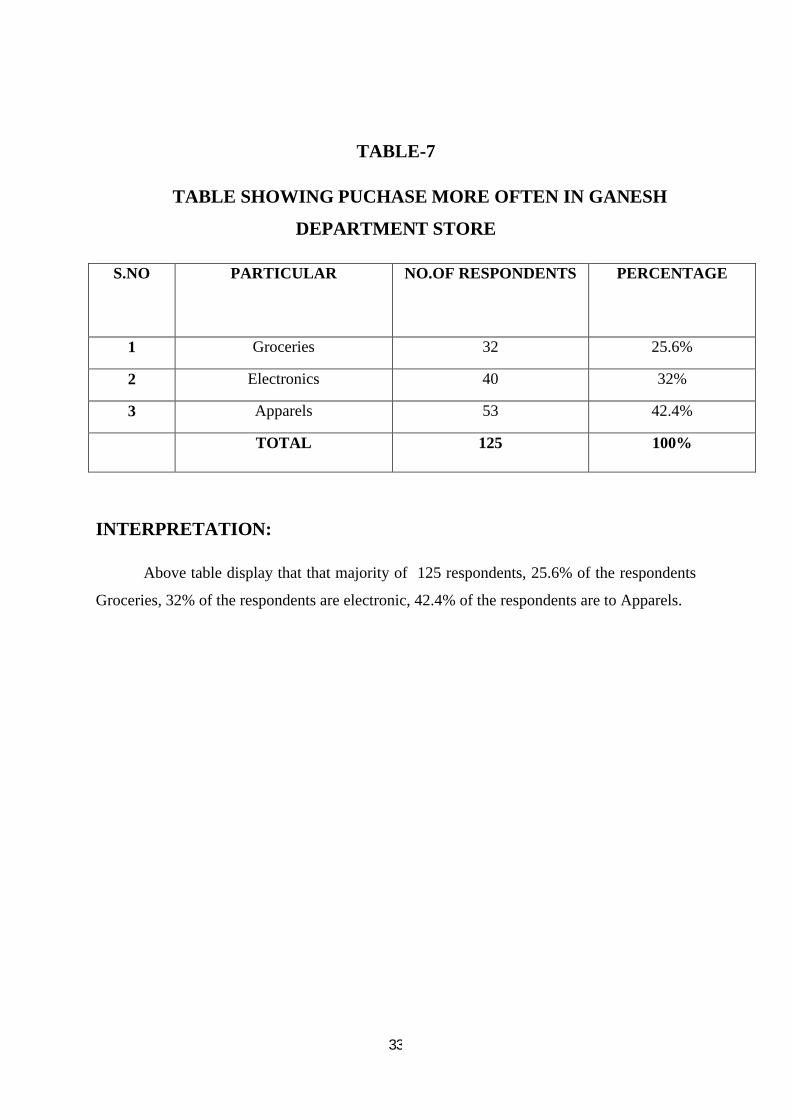
TABLE-7
TABLE SHOWING PUCHASE MORE OFTEN IN GANESH
DEPARTMENT STORE
S.NO PARTICULAR NO.OF RESPONDENTS PERCENTAGE
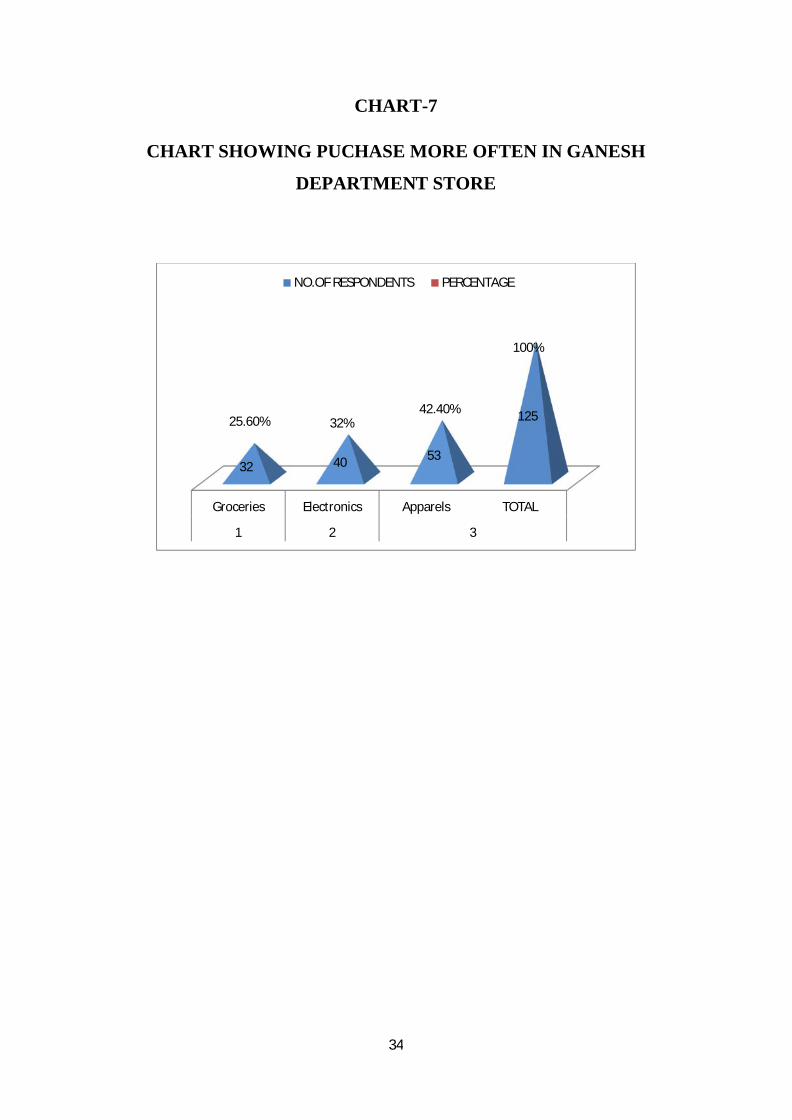
1 Groceries 32 25.6%
2 Electronics 40 32%
3 Apparels 53 42.4%
TOTAL 125 100%
INTERPRETATION:
Above table display that that majority of 125 respondents, 25.6% of the respondents
Groceries, 32% of the respondents are electronic, 42.4% of the respondents are to Apparels.
34
CHART-7
CHART SHOWING PUCHASE MORE OFTEN IN GANESH
DEPARTMENT STORE
Groceries Electronics Apparels TOTAL
1 2 3
32 40 53
12525.60% 32%42.40%
100%
NO.OF RESPONDENTS PERCENTAGE
35
TABLE-8
TABLE SHOWING WHICH SOURCE MADE TO BUY
PRODUCTS FROM GANESH DEPARTMENT STORE
S.NO PARTICULAR NO.OF RESPONDENTS PERCENTAGE
1 News paper 78 62.4%
2 Friends 47 37.6%
TOTAL 125 100%
INTERPRETATION:
Above table display that that majority of 125 respondents, .62.4% of the respondents
News paper, 37.6% of the respondents are Friends.
36
CHART-8
CHART SHOWING WHICH SOURCE MADE TO BUY
PRODUCTS FROM GANESH DEPARTMENT STORE
0.00%2000.00%4000.00%6000.00%8000.00%
10000.00%12000.00%14000.00%
8 125 TOTAL
None TOTALPERCENTAGE 62.40% 37.60% 100%
19.20% 6.40% 100 125
Axi
s Ti
tle
Chart Title
37
TABLE-9
TABLE SHOWING MAKE PUCHASE OF PRODUCTS IN
GANESH DEPARTMENT STORE
S.NO PARTICULAR NO.OF RESPONDENTS PERCENTAGE
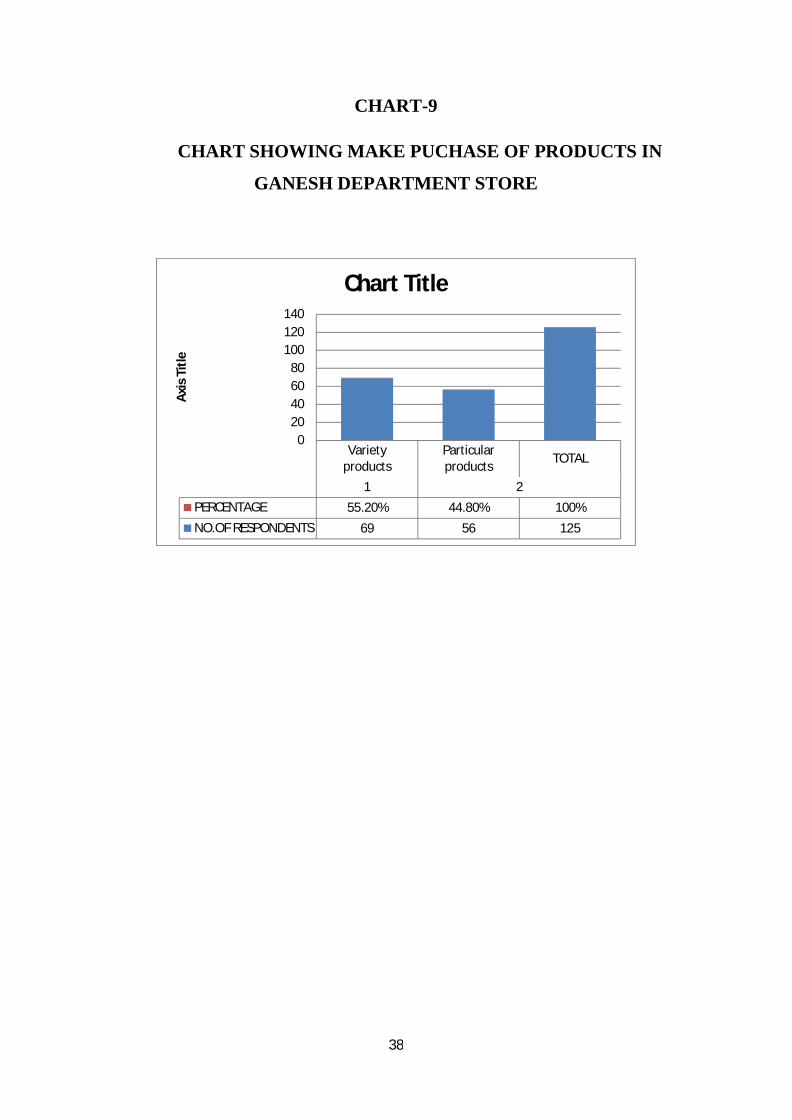
1 Variety products 69 55.2%
2 Particular products 56 44.8%
TOTAL 125 100%
INTERPRETATION:
The above table, it is clear among 125 respondents, 55.2% of the respondents Variety
products, 44.8% of the respondents are Particular products.
38
CHART-9
CHART SHOWING MAKE PUCHASE OF PRODUCTS IN
GANESH DEPARTMENT STORE
Varietyproducts
Particularproducts
TOTAL
1 2
PERCENTAGE 55.20% 44.80% 100%
NO.OF RESPONDENTS 69 56 125
020406080
100120140
Axis
Titl
e
Chart Title
39
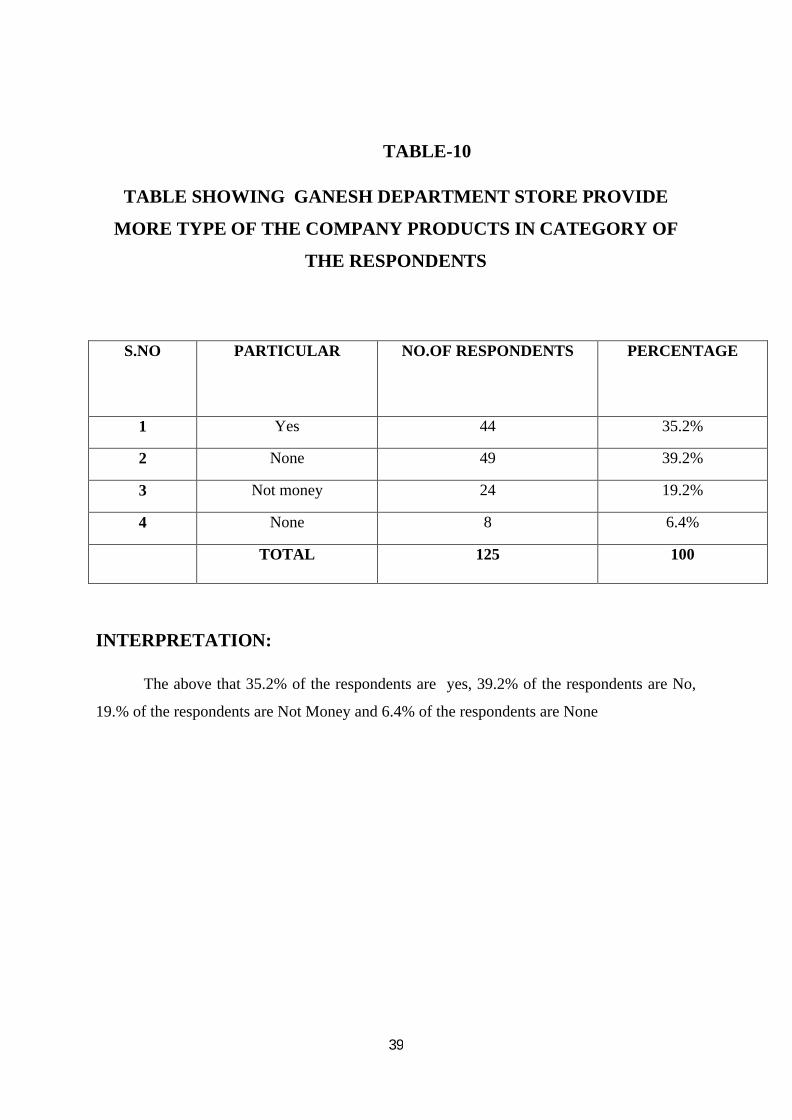
TABLE-10
TABLE SHOWING GANESH DEPARTMENT STORE PROVIDE
MORE TYPE OF THE COMPANY PRODUCTS IN CATEGORY OF
THE RESPONDENTS
S.NO PARTICULAR NO.OF RESPONDENTS PERCENTAGE
1 Yes 44 35.2%
2 None 49 39.2%
3 Not money 24 19.2%
4 None 8 6.4%
TOTAL 125 100
INTERPRETATION:
The above that 35.2% of the respondents are yes, 39.2% of the respondents are No,
19.% of the respondents are Not Money and 6.4% of the respondents are None
40
CHART-10
CHART SHOWING GANESH DEPARTMENT STORE PROVIDE
MORE TYPE OF THE COMPANY PRODUCTS IN CATEGORY OF
THE RESPONDENTS
Yes NoneNot
moneyNone TOTAL
1 2 3 4
PERCENTAGE 35.20% 39.20% 19.20% 6.40% 100
NO.OF RESPONDENTS 44 49 24 8 125
0
50
100
150
200
250
Axis
Titl
e
Chart Title
41
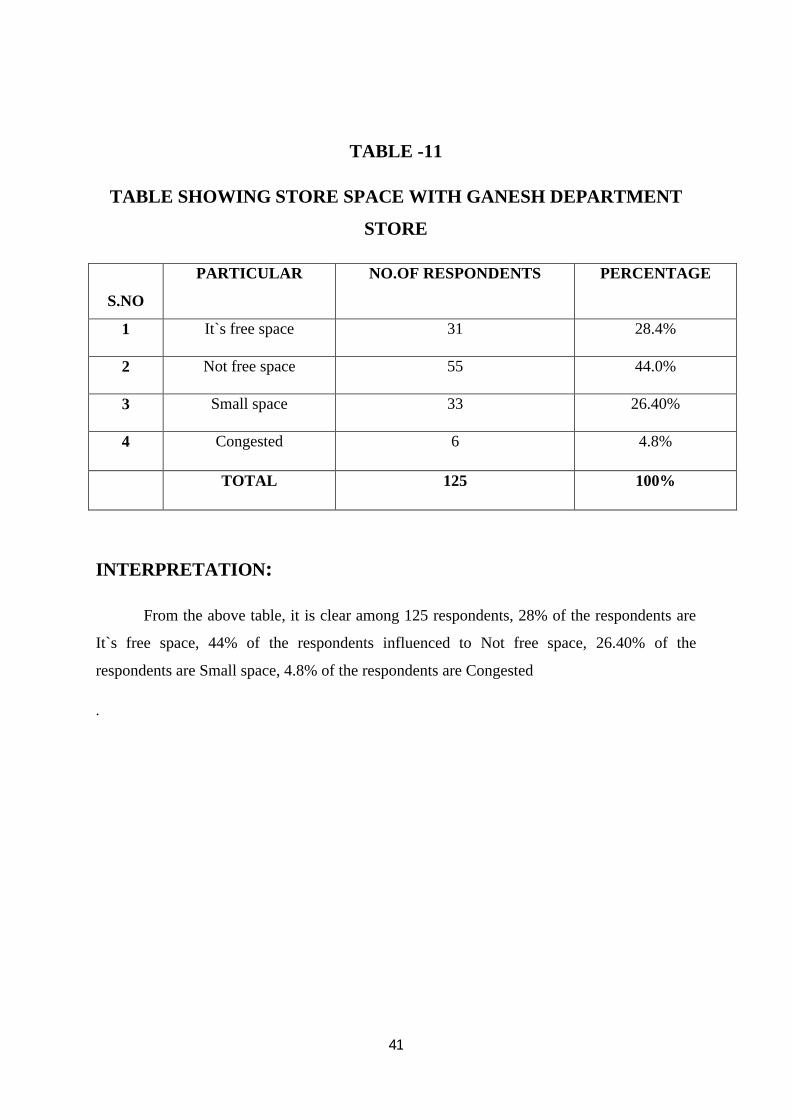
TABLE -11
TABLE SHOWING STORE SPACE WITH GANESH DEPARTMENT
STORE
S.NO
PARTICULAR NO.OF RESPONDENTS PERCENTAGE
1 It`s free space 31 28.4%
2 Not free space 55 44.0%
3 Small space 33 26.40%
4 Congested 6 4.8%
TOTAL 125 100%
INTERPRETATION:
From the above table, it is clear among 125 respondents, 28% of the respondents are
It`s free space, 44% of the respondents influenced to Not free space, 26.40% of the
respondents are Small space, 4.8% of the respondents are Congested
.
42
CHART -11
CHART SHOWING STORE SPACE WITH GANESH DEPARTMENT
STORE
0 0 0 0 0
3155
336
125
28.40%
44.00%
26.40%
4.80%
100%
S.NO 1 2 3 4
PARTICULAR NO.OF RESPONDENTS PERCENTAGE
43
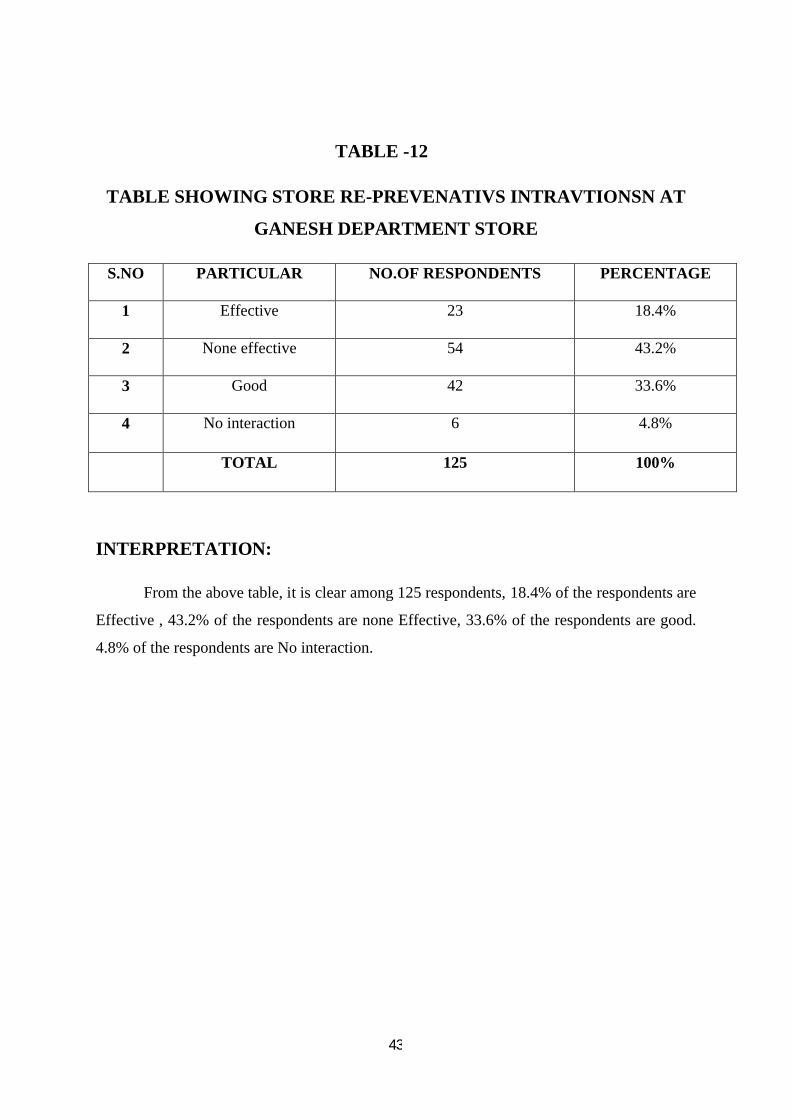
TABLE -12
TABLE SHOWING STORE RE-PREVENATIVS INTRAVTIONSN AT
GANESH DEPARTMENT STORE
S.NO PARTICULAR NO.OF RESPONDENTS PERCENTAGE
1 Effective 23 18.4%
2 None effective 54 43.2%
3 Good 42 33.6%
4 No interaction 6 4.8%
TOTAL 125 100%
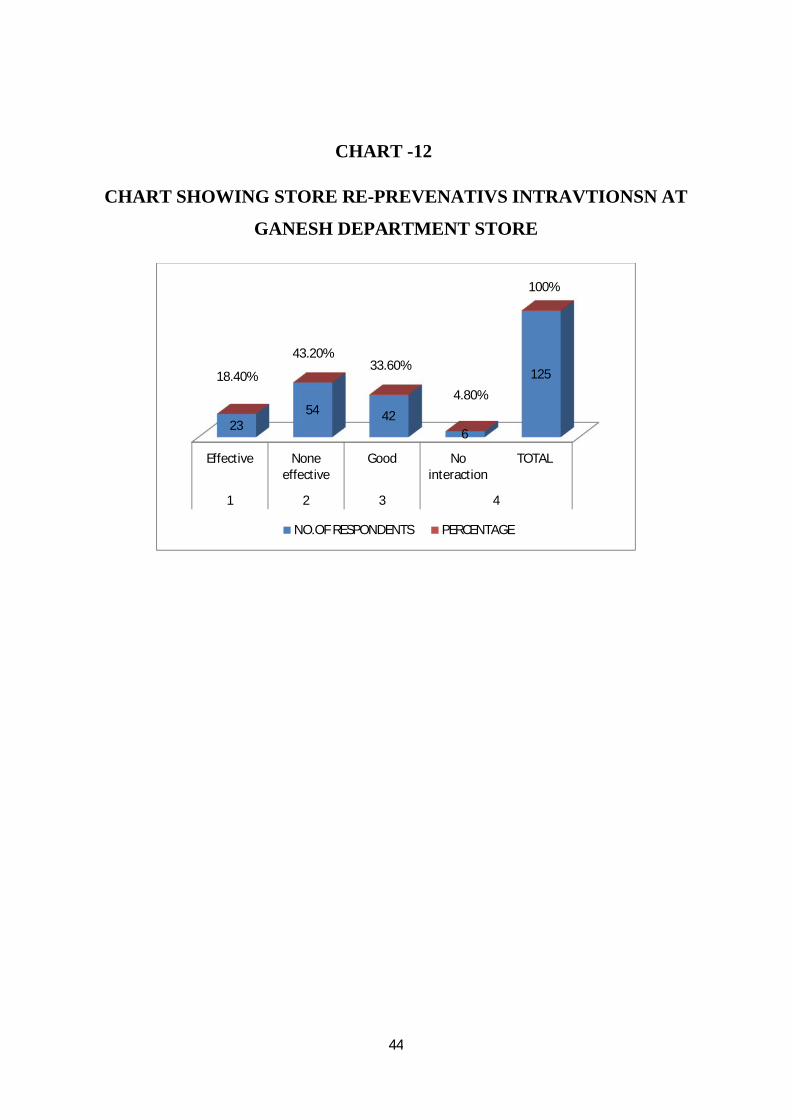
INTERPRETATION:
From the above table, it is clear among 125 respondents, 18.4% of the respondents are
Effective , 43.2% of the respondents are none Effective, 33.6% of the respondents are good.
4.8% of the respondents are No interaction.
44
CHART -12
CHART SHOWING STORE RE-PREVENATIVS INTRAVTIONSN AT
GANESH DEPARTMENT STORE
Effective Noneeffective
Good Nointeraction
TOTAL
1 2 3 4
2354 42
6
12518.40%
43.20%33.60%
4.80%
100%
NO.OF RESPONDENTS PERCENTAGE
45
TABLE -13
TABLE SHOWING GANESH DEPARTMENT STORE REMINDING
AND PRICING TO ALL CUSTOMERS IN STORE
S.NO PARTICULAR NO.OF RESPONDENTS PERCENTAGE
1 Yes cleanly 45 36%
2 None clearly 49 39.2%
3 No intimation all 31 24.8%
TOTAL 125 100%
INTERPRETATION:
From the above table, it is clear among 125 respondents, 36% of the respondents are
Yes cleanly ,39.2% of the respondents are none None clearly, 24.8% of the respondents are
No intimation all.
46
CHART -13
CHART SHOWING GANESH DEPARTMENT STORE REMINDING
AND PRICING TO ALL CUSTOMER IN STORE
45 4931
12536% 39.20%
24.80%
100%
Yes cleanly None clearly No intimation all TOTAL
1 2 3
NO.OF RESPONDENTS PERCENTAGE
47
TABLE -14
TABLE SHOWING CUSTOMER SERVICE IN GANESH
DEPARTMENT STORE
S.NO PARTICULAR NO.OF RESPONDENTS PERCENTAGE
1 Fast service 39 31.2%
2 Slow service 54 43.2%
3 Poor 30 24%
4 Very poor 2 1.6%
TOTAL 125 100%
INTERPRETATION:
From the above table, it is clear among 125 respondents, 31.2% of the respondents are
Fast service , 43.2% of the respondents are Slow service. 24% of the respondents are poor.
1.6% of the respondents are very poor
48
CHART -14
CHART SHOWING CUSTOMER SERVICE IN GANESH
DEPARTMENT STORE
Yes cleanlyNone clearly
Nointimation all TOTAL
12
3
45 4931
125
36%39.20%
24.80%
100%
NO.OF RESPONDENTS PERCENTAGE
49
TABLE -15
TABLE SHOWING DISCOUNTS IN GANESH DEPARTMENT STORE
S.NO PARTICULAR NO.OF RESPONDENTS PERCENTAGE
1 Yes season time offer 79 63.2%
2 Special offer 46 36.8%
TOTAL 125 100%
INTERPRETATION:
From the above table, it is clear among 125 respondents, 63.2% of the respondents are
Yes season time offer, 36.8% of the respondents are Special offer.
50
CHART -15
CHART SHOWING DISCOUNTS IN GANESH DEPARTMENT
STORE
Yes season timeoffer
Special offer TOTAL
1 2
79
46
125
63.00%36.80%
100%
NO.OF RESPONDENTS PERCENTAGE
51
TABLE -16
TABLE SHOWING WHAT ARE BUYING INTRESTS IN GANESH
DEPARTMENT STORE
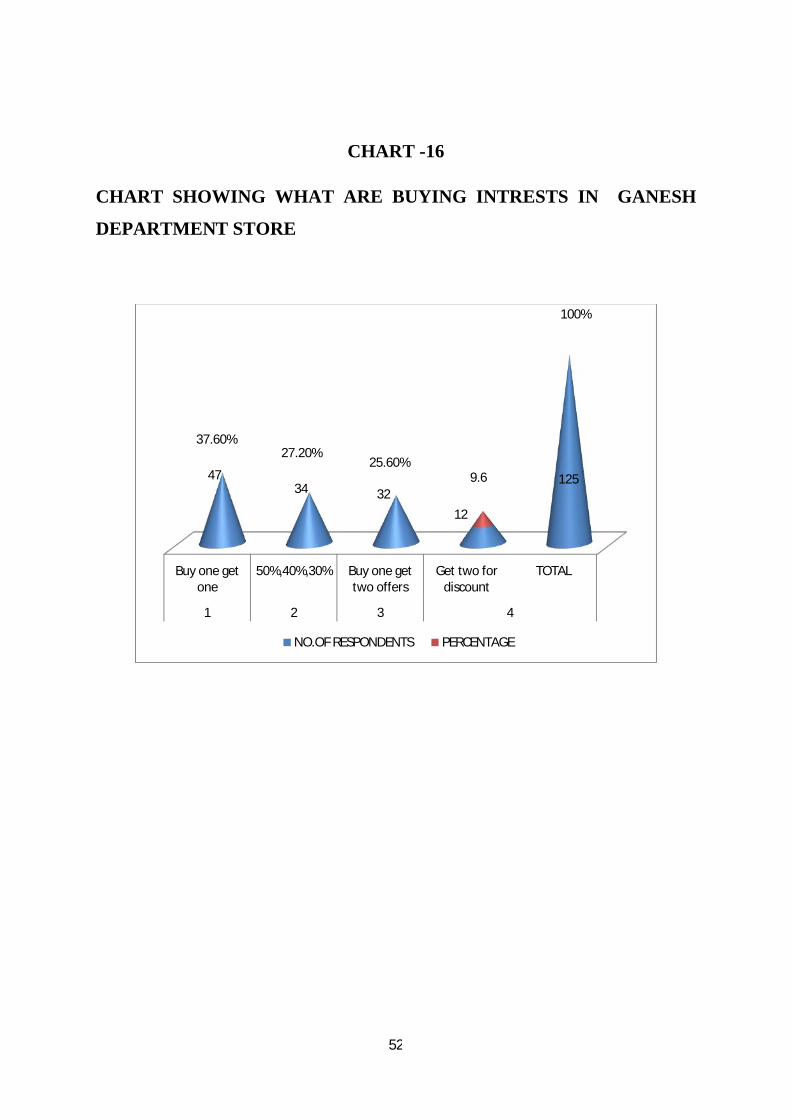
S.NO PARTICULAR NO.OF RESPONDENTS PERCENTAGE
1 Buy one get one 47 37.6%
2 50%,40%,30% 34 27.2%
3 Buy one get two offers 32 25.6%
4 Get two for discount 12 9.6
TOTAL 125 100%
INTERPRETATION:
From the above table, it is clear among 125 respondents, 37.6% of the respondents are
Buy one get one , 27.2% of the respondents are 50%,40%,30%. 25.6% of the respondents
are Buy one get two offers. 9.6% of the respondents are Get two for discount
52
CHART -16
CHART SHOWING WHAT ARE BUYING INTRESTS IN GANESH
DEPARTMENT STORE
Buy one getone
50%,40%,30% Buy one gettwo offers
Get two fordiscount
TOTAL
1 2 3 4
4734 32
12
125
37.60%27.20%
25.60%9.6
100%
NO.OF RESPONDENTS PERCENTAGE
53
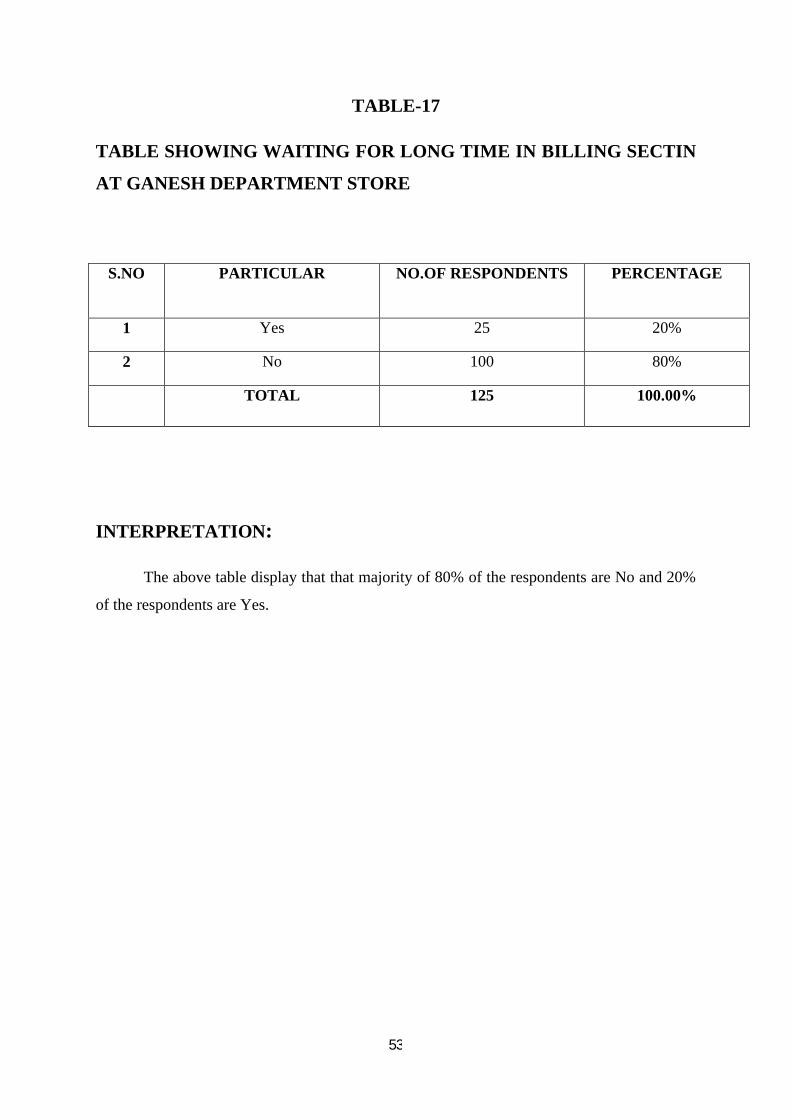
TABLE-17
TABLE SHOWING WAITING FOR LONG TIME IN BILLING SECTIN
AT GANESH DEPARTMENT STORE
S.NO PARTICULAR NO.OF RESPONDENTS PERCENTAGE
1 Yes 25 20%
2 No 100 80%
TOTAL 125 100.00%
INTERPRETATION:
The above table display that that majority of 80% of the respondents are No and 20%
of the respondents are Yes.
54
CHART-17
CHART SHOWING WAITING FOR LONG TIME IN BILLING SECTIN
AT GANESH DEPARTMENT STORE
Yes No TOTAL
1 2
25
100125
20%
80%
100.00%
NO.OF RESPONDENTS PERCENTAGE
55
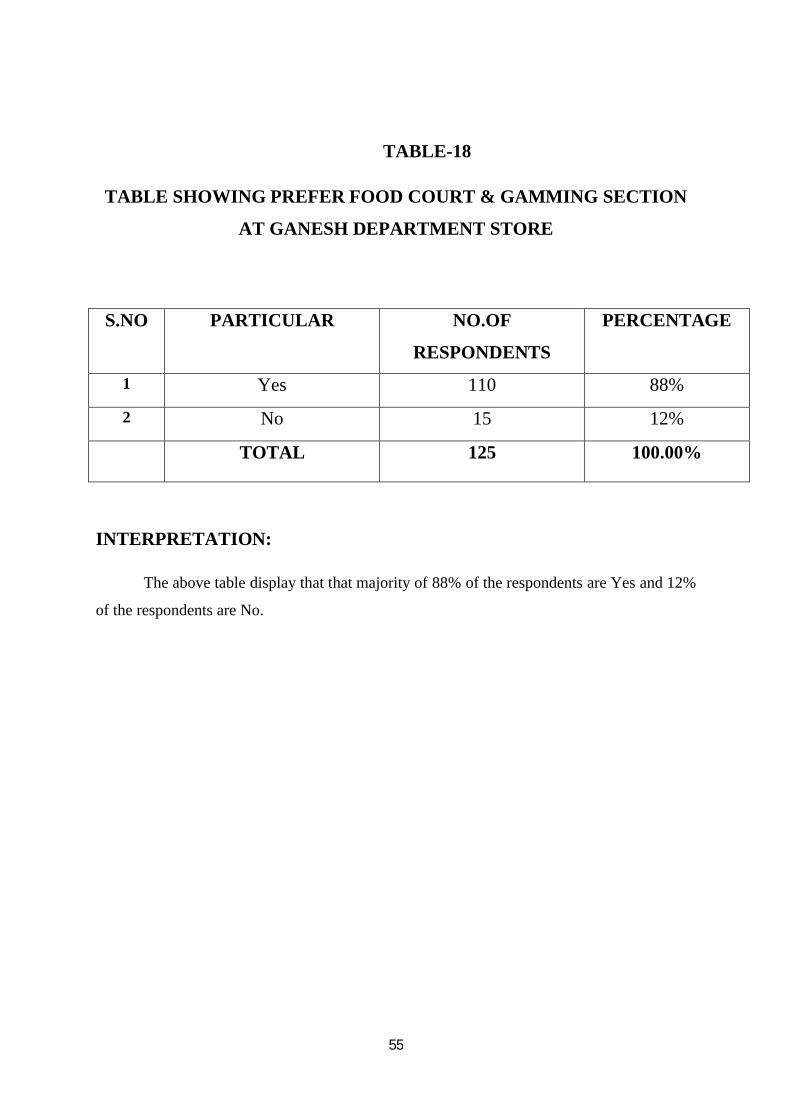
TABLE-18
TABLE SHOWING PREFER FOOD COURT & GAMMING SECTION
AT GANESH DEPARTMENT STORE
S.NO PARTICULAR NO.OF
RESPONDENTS
PERCENTAGE
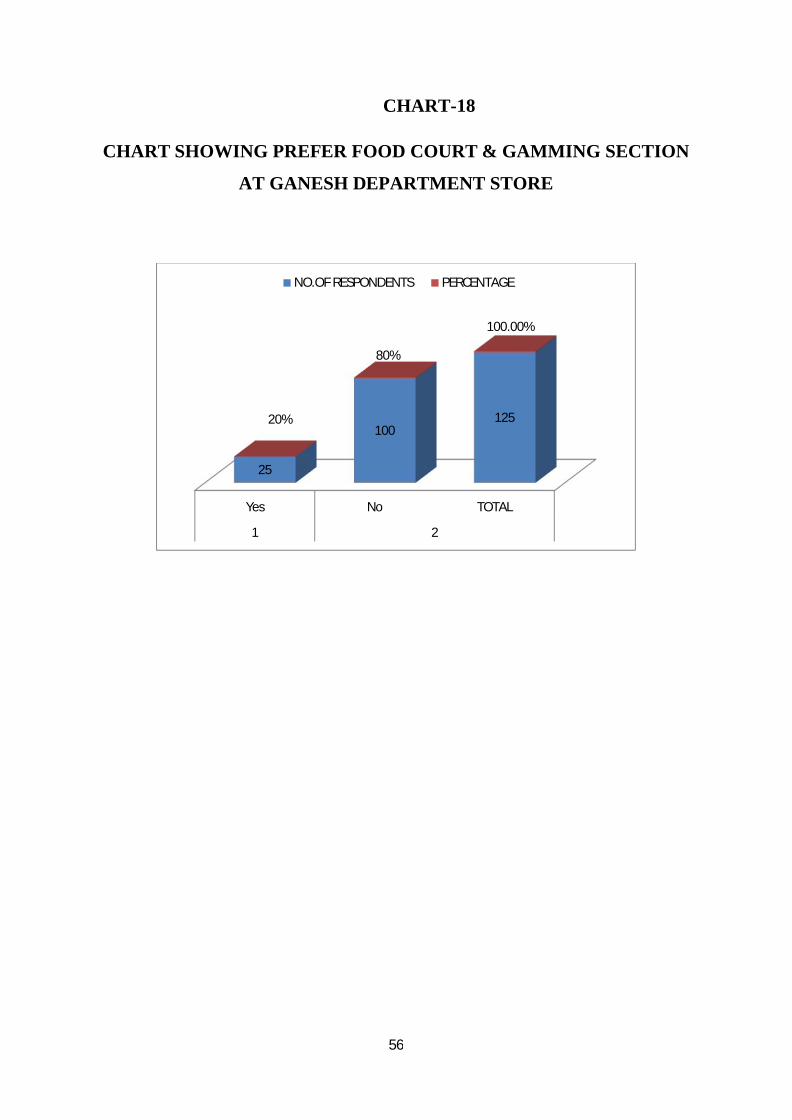
1 Yes 110 88%
2 No 15 12%
TOTAL 125 100.00%
INTERPRETATION:
The above table display that that majority of 88% of the respondents are Yes and 12%
of the respondents are No.
56
CHART-18
CHART SHOWING PREFER FOOD COURT & GAMMING SECTION
AT GANESH DEPARTMENT STORE
Yes No TOTAL
1 2
25
10012520%
80%
100.00%
NO.OF RESPONDENTS PERCENTAGE
57
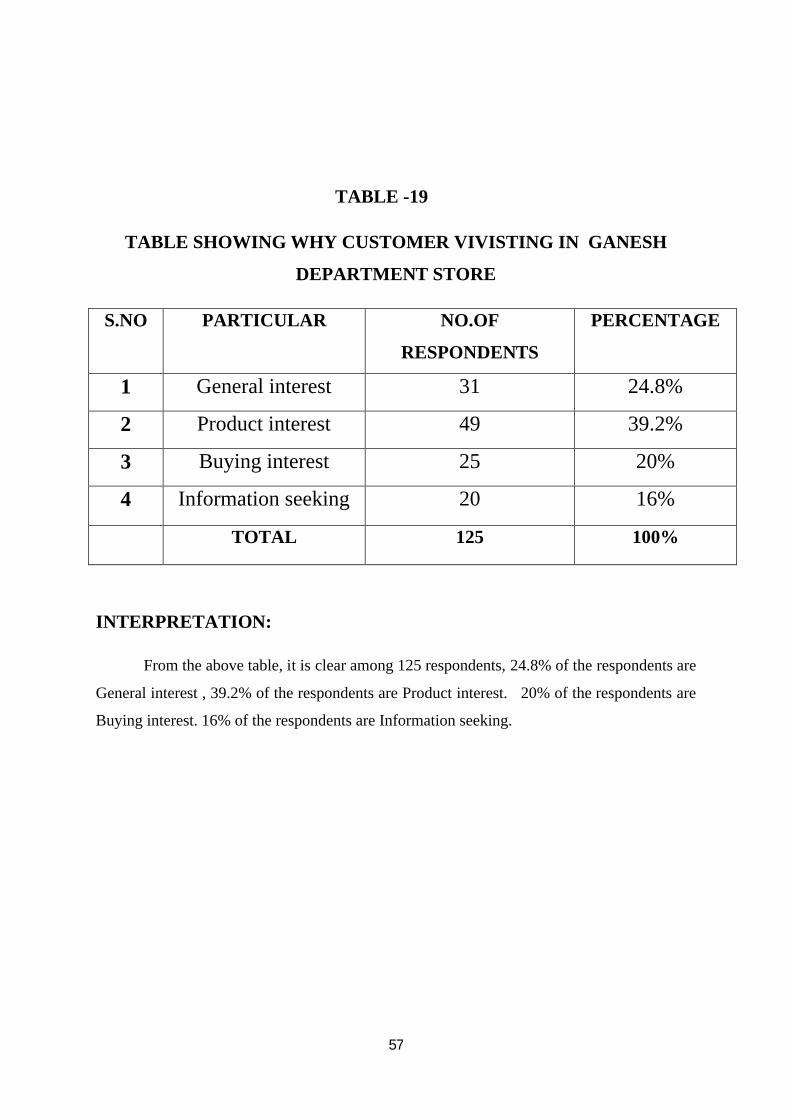
TABLE -19
TABLE SHOWING WHY CUSTOMER VIVISTING IN GANESH
DEPARTMENT STORE
S.NO PARTICULAR NO.OF
RESPONDENTS
PERCENTAGE
1 General interest 31 24.8%
2 Product interest 49 39.2%
3 Buying interest 25 20%
4 Information seeking 20 16%
TOTAL 125 100%
INTERPRETATION:
From the above table, it is clear among 125 respondents, 24.8% of the respondents are
General interest , 39.2% of the respondents are Product interest. 20% of the respondents are
Buying interest. 16% of the respondents are Information seeking.
58
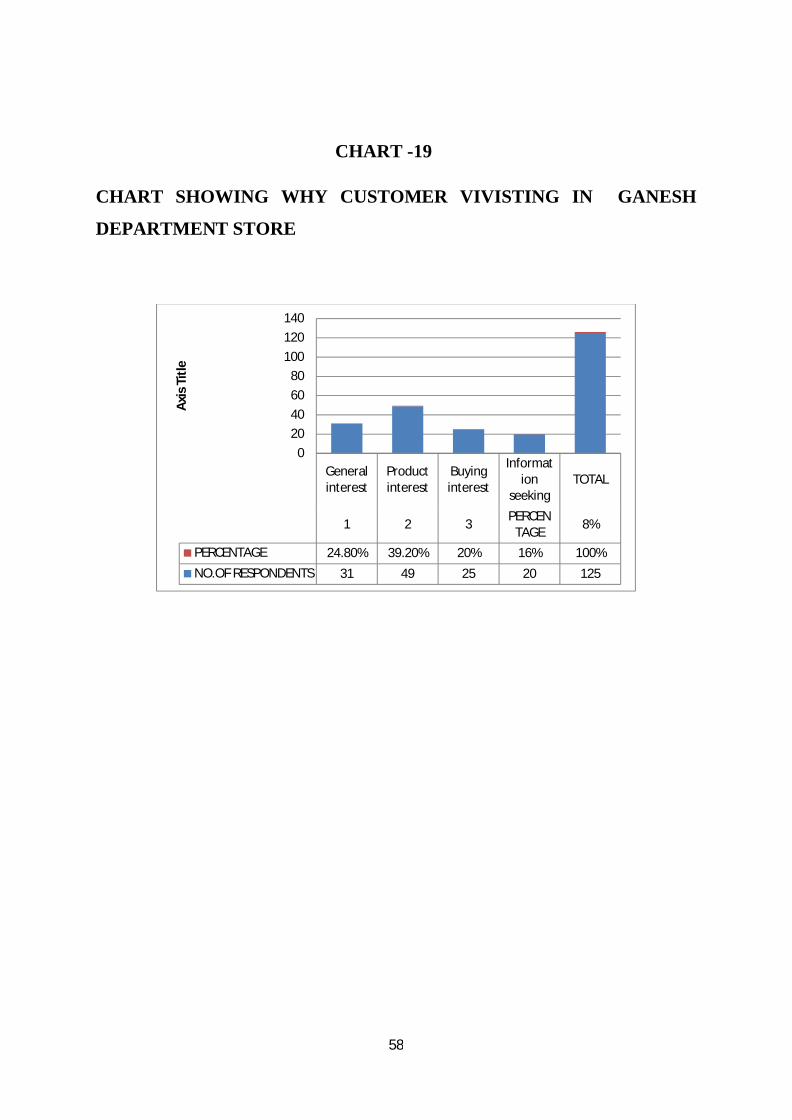
CHART -19
CHART SHOWING WHY CUSTOMER VIVISTING IN GANESH
DEPARTMENT STORE
Generalinterest
Productinterest
Buyinginterest
Information
seekingTOTAL
1 2 3PERCEN
TAGE8%
PERCENTAGE 24.80% 39.20% 20% 16% 100%
NO.OF RESPONDENTS 31 49 25 20 125
020406080
100120140
Axi
s Ti
tle
59
TABLE -20
TABLE SHOWING JUST BY VIVISTING IN FIRST TIME GANESH
DEPARTMENT STORE
S.NO PARTICULAR NO.OF RESPONDENTS PERCENTAGE
1 yes 79 63.2%
2 No 30 24%
3 No first time 6 4.8%
4 More than two times 10 8%
TOTAL 125 100%
INTERPRETATION:
From the above table, it is clear among 125 respondents, 63.2% of the respondents are
yes , 24% of the respondents are no. 24% of the respondents are No first time. 8% of the
respondents are More than two times.
60
CHART -20
CHART SHOWING JUST BY VIVISTING IN FIRST TIME GANESH
DEPARTMENT STORE
yes NoNo first
time
Morethantwo
times
TOTAL
1 2 3 4
PERCENTAGE 63.20% 24% 4.80% 8% 100%
NO.OF RESPONDENTS 79 30 6 10 125
020406080
100120140
Axi
s Ti
tle
61
TABLE -21
TABLE SHOWING WHAT ARE INTENSION TO RE-ENTER IN
GANESH DEPARTMENT STORE
S.NO PARTICULAR NO.OF RESPONDENTS PERCENTAGE
1 Low price 10 8%
2 Product quality 65 52%
3 Customer service 23 18.4%
4 Avalibilaty 17 13.6%
TOTAL 125 100%
INTERPRETATION:
From the above table, it is clear among 125 respondents, 8% of the respondents are
Low price , 52% of the respondents are Product quality. 18.4% of the respondents are
Customer service. 13.6% of the respondents are avalibilaty.
62
CHART -21
CHART SHOWING WHAT ARE INTENSION TO RE-ENTER IN
GANESH DEPARTMENT STORE
Lowprice
Productquality
Customer service
Avalibilaty
TOTAL
1 2 3 4
PERCENTAGE 8% 52% 18.40% 13.60% 100%
NO.OF RESPONDENTS 10 65 23 17 125
0
20
40
60
80
100
120
140
Axis
Titl
e
63
TABLE -22
TABLE SHOWING MAINTAINIG THE PRODUCTS IN GANESH
DEPARTMENT STORE
S.NO
PARTICULAR NO.OF RESPONDENTS PERCENTAGE
1 Good 65 52%
2 Normal 25 20%
3 poor service 35 28%
4 Very poor 0 0%
TOTAL 125 100%
INTERPRETATION:
From the above table, it is clear among 125 respondents, 52% of the respondents are
gooog , 20% of the respondents are normal. 28.4% of the respondents are poor sevice. 0% of
the respondents are Very poor
64
CHART -22
CHART SHOWING MAINTAINIG THE PRODUCTS IN GANESH
DEPARTMENT STORE
0
20
40
60
80
100
120
140
38% 100.00%
2 3 4
PARTICULAR 0 0 0 0 0
NO.OF RESPONDENTS 65 25 35 0 125
PERCENTAGE 52% 20% 28% 0% 100%
Axis
Titl
e
65
TABLE-23
TABLE SHOWING CUSTOMERS FEEL (SATISFIED) OF THE
RESPONDENTS
S.NO PARTICULAR NO.OF RESPONDENTS PERCENTAGE
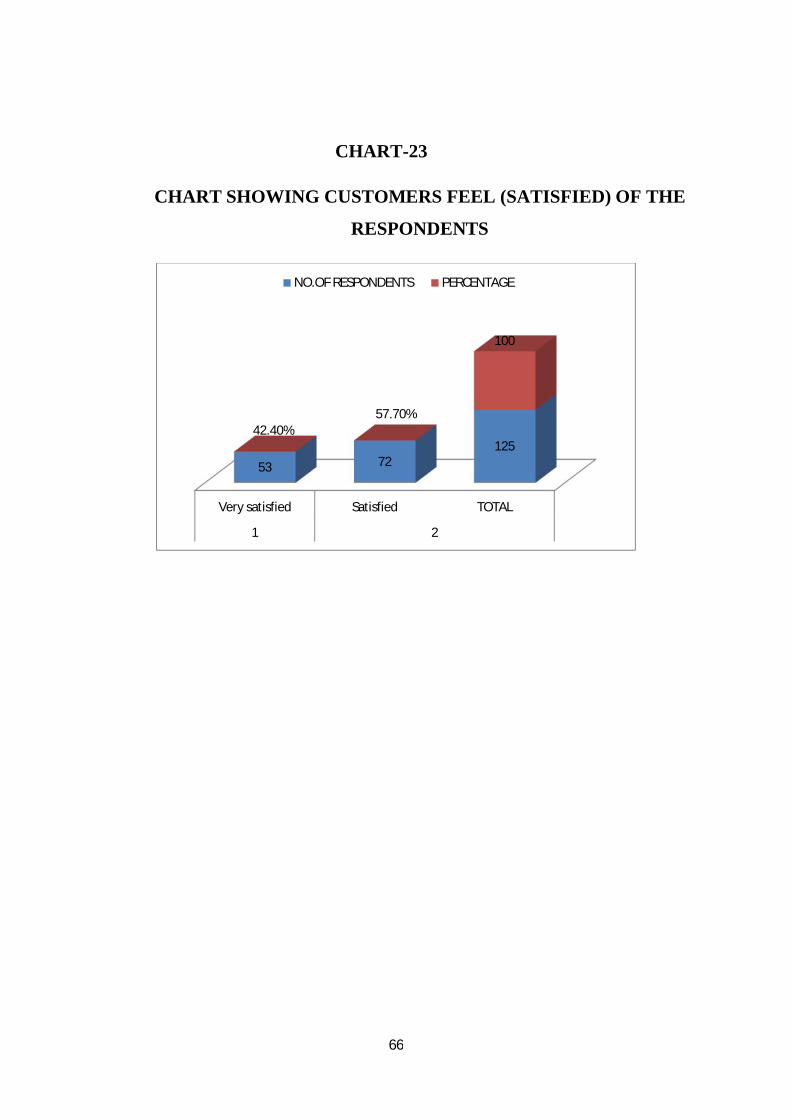
1 Very satisfied 53 42.4%
2 Satisfied 72 57.7%
TOTAL 125 100
INTERPRETATION:
Above table display that that majority of 42.4% of the respondents Very satisfied.
57.7% of the respondents family kinds is Satisfied
66
CHART-23
CHART SHOWING CUSTOMERS FEEL (SATISFIED) OF THE
RESPONDENTS
Very satisfied Satisfied TOTAL
1 2
53 72125
42.40%57.70%
100
NO.OF RESPONDENTS PERCENTAGE
67
TABLE-24
TABLE SHOWING EVER CONTACTED CUSTOMER SERVICE
GANESH DEPARTMENT STORE
S.NO PARTICULAR NO.OF
RESPONDENTS
PERCENTAGE
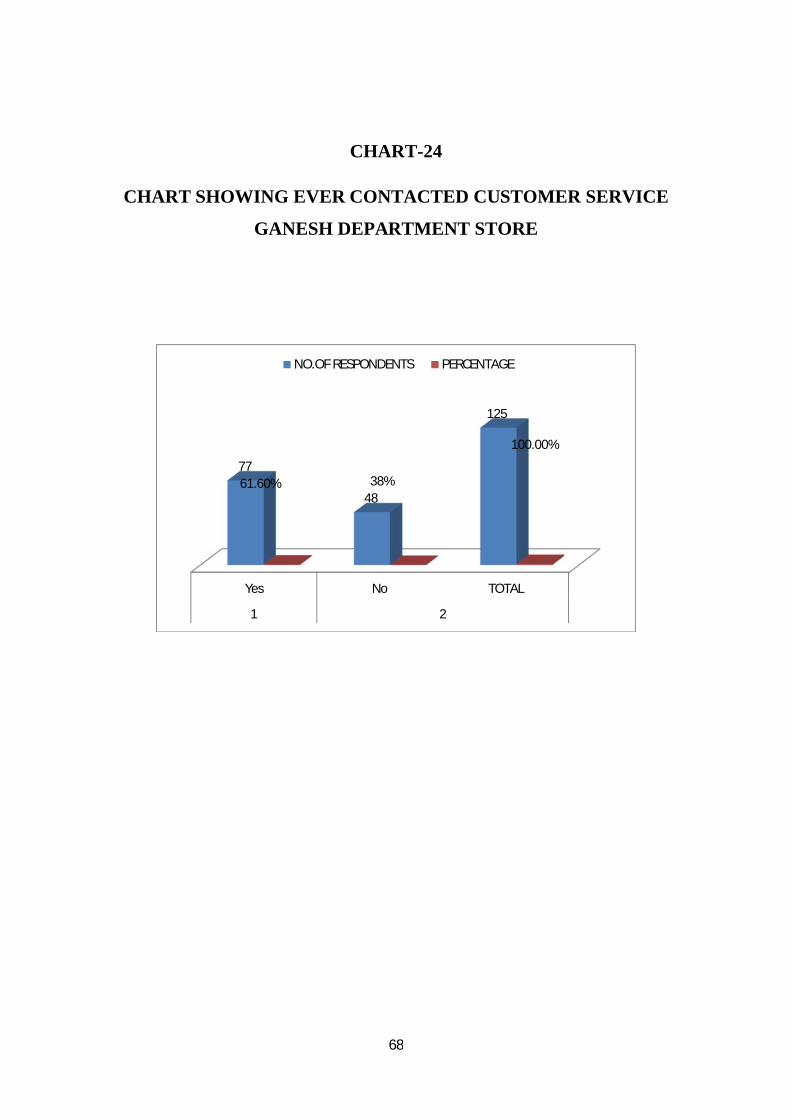
1 Yes 77 61.6%
2 No 48 38%
TOTAL 125 100.00%
INTERPRETATION:
The above table display that that majority of 61.6% of the respondents are Yes and
38% of the respondents are No.
68
CHART-24
CHART SHOWING EVER CONTACTED CUSTOMER SERVICE
GANESH DEPARTMENT STORE
Yes No TOTAL
1 2
77
48
125
61.60% 38%
100.00%
NO.OF RESPONDENTS PERCENTAGE
69
TABLE -25
TABLE SHOWING EXPERIENCE WITH PRODUCT HOW LIKELY
ARE YOU TO BUY PRODUCTS AGAIN GANESH DEPARTMENT
STORE
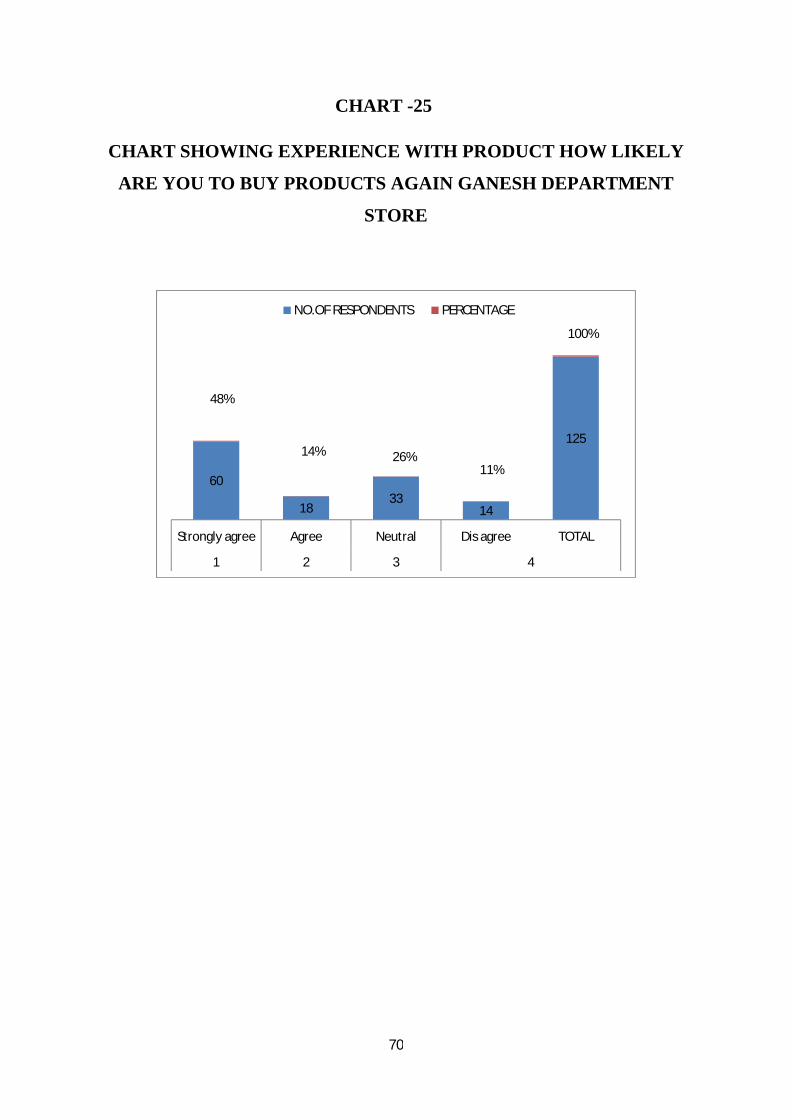
S.NO PARTICULAR NO.OF RESPONDENTS PERCENTAGE
1 Strongly agree 60 48%
2 Agree 18 14%
3 Neutral 33 26%
4 Dis agree 14 11%
TOTAL 125 100%
INTERPRETATION:
From the above table, it is clear among 125 respondents, 48% of the respondents are
Strongly agree, 18% of the respondents are Agree. 26% of the respondents are poor Neutral.
11% of the respondents are Disagree.
70
CHART -25
CHART SHOWING EXPERIENCE WITH PRODUCT HOW LIKELY
ARE YOU TO BUY PRODUCTS AGAIN GANESH DEPARTMENT
STORE
60
1833
14
125
48%
14% 26%11%
100%
Strongly agree Agree Neutral Dis agree TOTAL
1 2 3 4
NO.OF RESPONDENTS PERCENTAGE
71
CHI-SQUARE TEST: 1
The chi-square test is an important test amongst the several tests of significations developed by statisticians. Chi-square, symbolically written as x2 (pronounced as Chi-square),is a statistical measures used in the context of sampling analysis for comparing a variances to a theoretical varience. As a non-parametric test, it can be used to determine if categorical data shows dependency or the two classifications are independent. it can also be used to make comparison between theoretical population and actual data when categories are used . Thus the Chi-square test is applicable in large number of problems.
TEST-1
AIM:-
To find out the relationship between the monthly income and factors that they expects
from the Ganesh department store
HYPOTHESIS
Null hypothesis:
Ho- the hypothesis is that there is no significance relationship between the monthly
income and the expectation factors from the Ganesh department store.
Alternative hypothesis :
H1- the hypothesis is that there is significance relationship between the monthly
income and the expectation factors from the Ganesh department store.
72
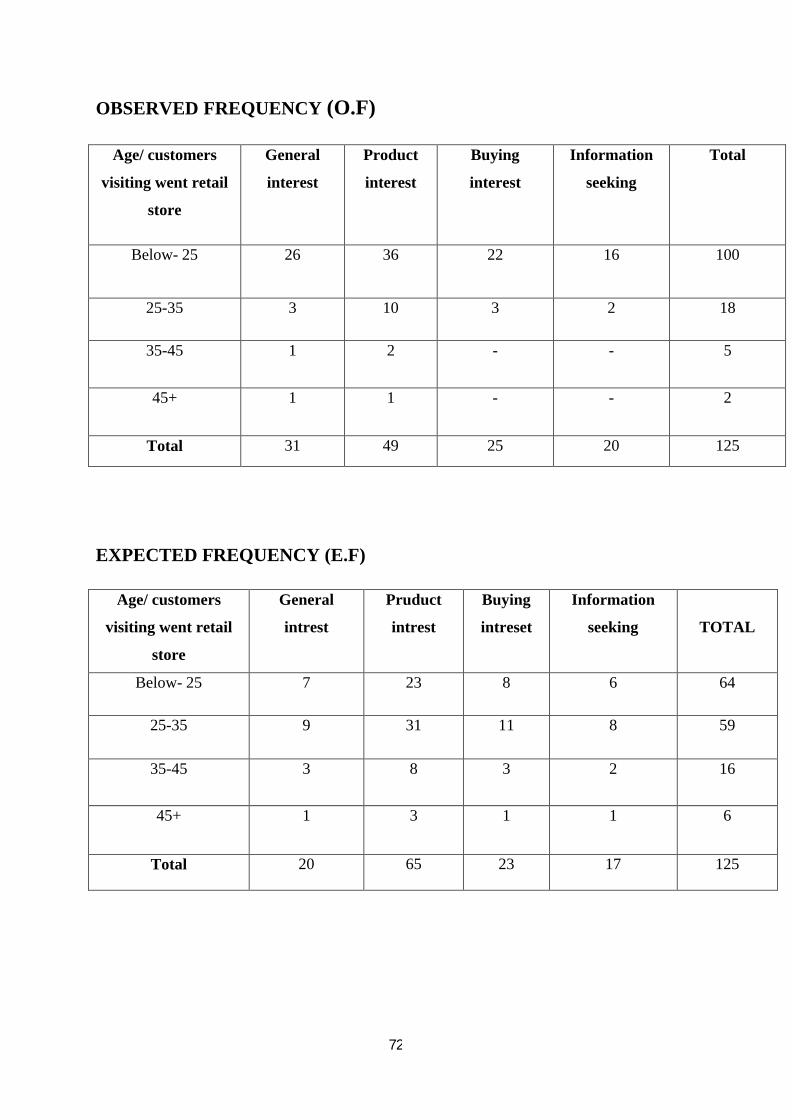
OBSERVED FREQUENCY (O.F)
Age/ customers
visiting went retail
store
General
interest
Product
interest
Buying
interest
Information
seeking
Total
Below- 25 26 36 22 16 100
25-35 3 10 3 2 18
35-45 1 2 - - 5
45+ 1 1 - - 2
Total 31 49 25 20 125
EXPECTED FREQUENCY (E.F)
Age/ customers
visiting went retail
store
General
intrest
Pruduct
intrest
Buying
intreset
Information
seeking TOTAL
Below- 25 7 23 8 6 64
25-35 9 31 11 8 59
35-45 3 8 3 2 16
45+ 1 3 1 1 6
Total 20 65 23 17 125
73
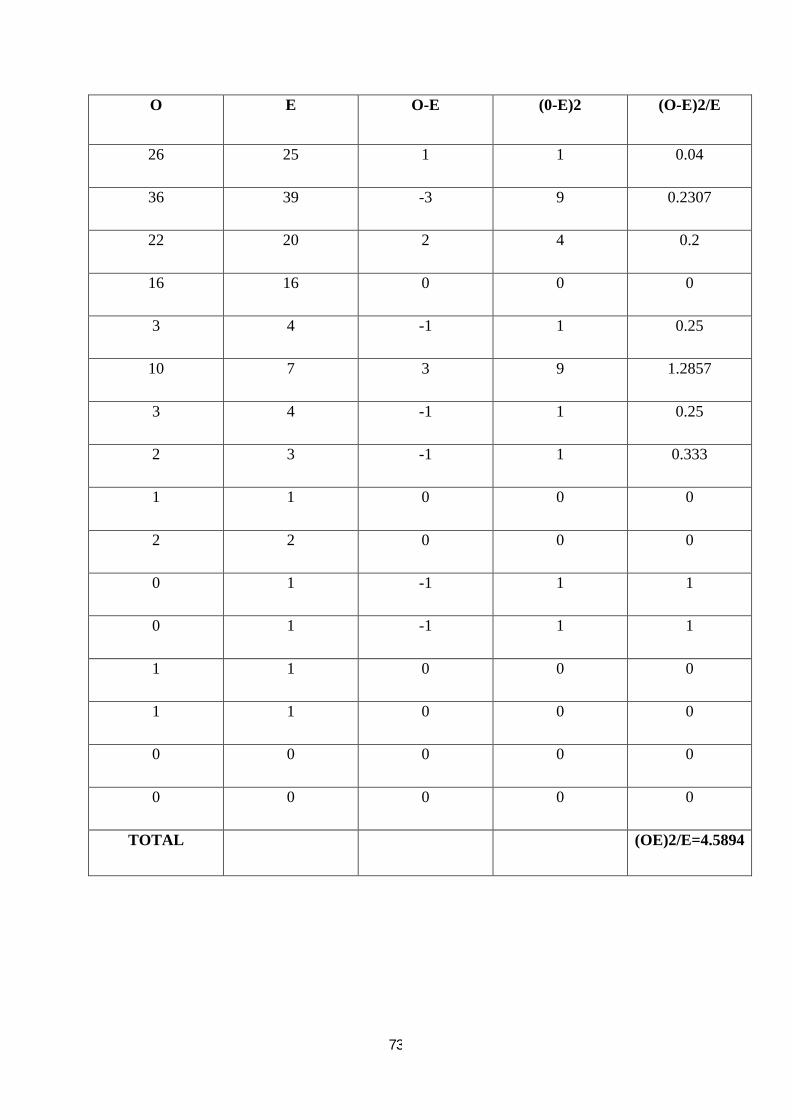
O E O-E (0-E)2 (O-E)2/E
26 25 1 1 0.04
36 39 -3 9 0.2307
22 20 2 4 0.2
16 16 0 0 0
3 4 -1 1 0.25
10 7 3 9 1.2857
3 4 -1 1 0.25
2 3 -1 1 0.333
1 1 0 0 0
2 2 0 0 0
0 1 -1 1 1
0 1 -1 1 1
1 1 0 0 0
1 1 0 0 0
0 0 0 0 0
0 0 0 0 0
TOTAL (OE)2/E=4.5894
74
Degrees of freedom:
= ( C-1) x (R-1)
= (4-1) x (4-1)
=3 x 3
=9
The chart value of the chi-square for the degree of the freedom at 5%
level of the significant.
The calculated value chi-square (4.5894 ) less than the table value (16.919) the table value hence the hypothesis is accepted.
75
CHI-SQUARE TEST: 2
The chi-square test is an important test amongst the several tests of significations
developed by statisticians.Chi-square,symbolically written as x2 (pronounced as Chi-
square),is a statistical measures used in the context of sampling analysis for comparing a
variences to a theoretical varience. As a non-parametric test, it can be used to determine if
categorical data shows dependency or the two classification are independent . it can also be
used to make comparison between theoretical population and actual data when categories are
used . Thus the Chi-square test is applicable in large number of problems.
TEST-2
AIM:-
To find out the relationship between the age and factors that they opinion regarding
after sales service of Ganesh department store.
HYPOTHESIS
Null hypothesis:
Ho- the hypothesis is that there is no significance relationship the age and factors that
they opinion regarding after sales service of Ganesh department store
Alternative hypothesis :
H1- the hypothesis is that there is significance relationship between the
age and factors that they opinion regarding after sales services of ganesh
department store.
76
OBSERVED FREQUENCY (O.F)
Salary/intention
to re-enter
Low price Product
quality
Buying
interest
Avalibility
TOTAL
Below-10000 8 19 10 8 45
10000-20000 10 35 5 9 59
15000-30000 1 9 6 - 16
Above 45000 1 2 2 - 5
TOTAL 20 65 23 17 125
EXPECTED FREQUENCY (E.F)
Salary/
intention to
re-enter
Low price Product
quality
Buying
interest
Avalibility
TOTAL
Below-10000 7 23 8 6 44
10000-20000 9 31 11 8 59
15000-30000 3 8 3 2 16
Above 45000 1 3 2 1 6
TOTAL 20 65 23 17 125
77
O E O-E (O-E)2 (O-E)2/E
8 7 1 1 0.1428
19 23 -4 16 0.656
10 8 2 4 0.5
8 6 2 4 0.666
10 9 1 1 0.111
35 31 4 16 0.5161
5 11 -6 36 3.2727
9 8 1 1 0.7125
1 3 -2 4 1.333
9 8 1 1 0.125
6 3 3 9 3
0 2 -2 4 2
1 1 0 0 0
2 3 -1 1 0.333
2 1 1 1 1
0 1 -1 1 1
TOTAL (O-E)2/E=
14.8209
78
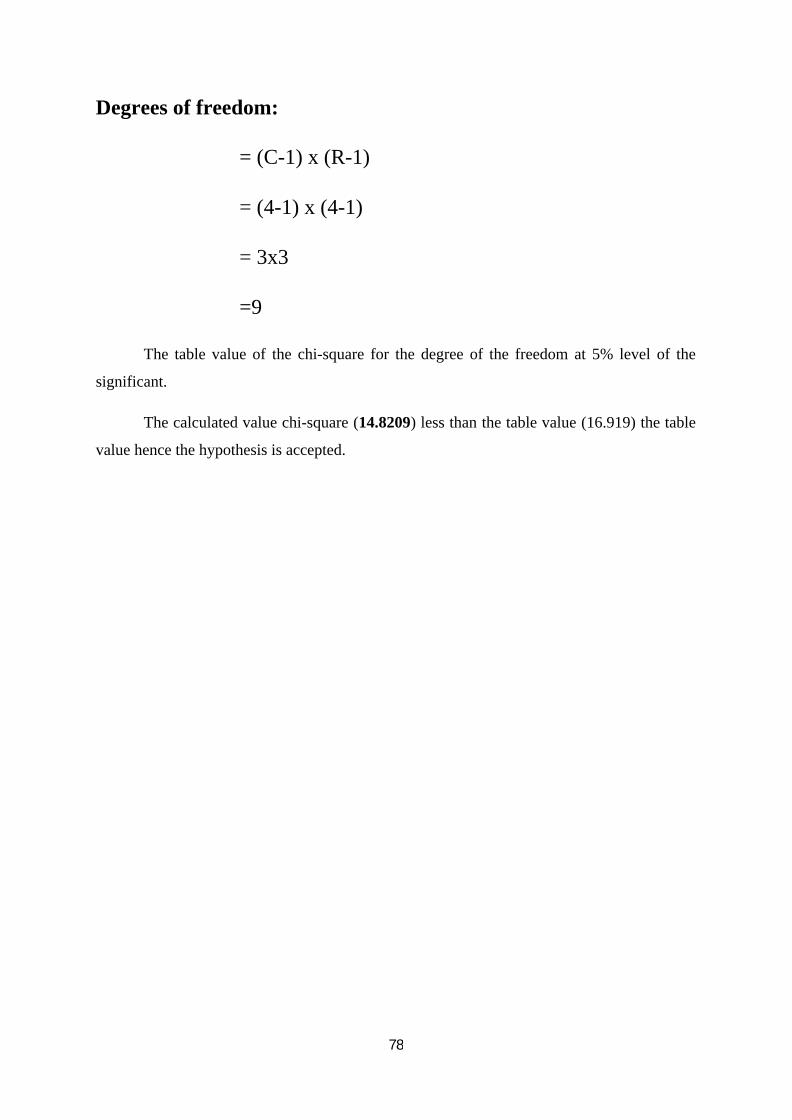
Degrees of freedom:
= (C-1) x (R-1)
= (4-1) x (4-1)
= 3x3
=9
The table value of the chi-square for the degree of the freedom at 5% level of the
significant.
The calculated value chi-square (14.8209) less than the table value (16.919) the table
value hence the hypothesis is accepted.
79
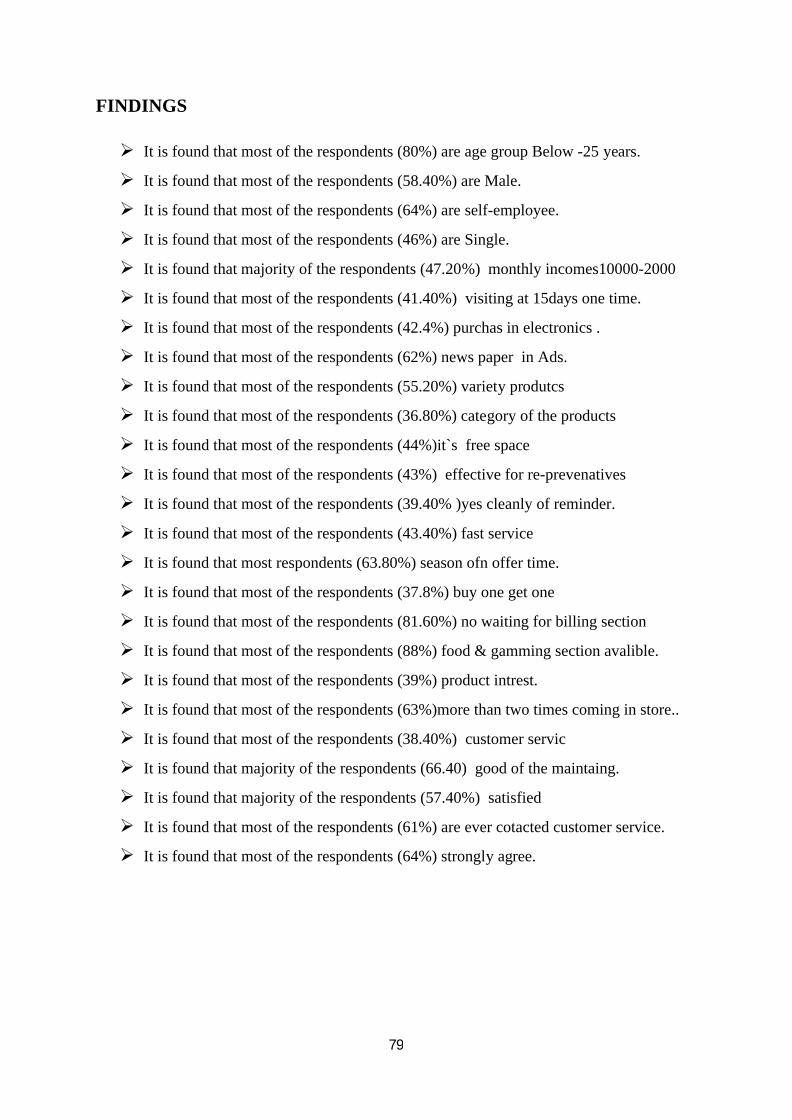
FINDINGS
ÿ It is found that most of the respondents (80%) are age group Below -25 years.
ÿ It is found that most of the respondents (58.40%) are Male.
ÿ It is found that most of the respondents (64%) are self-employee.
ÿ It is found that most of the respondents (46%) are Single.
ÿ It is found that majority of the respondents (47.20%) monthly incomes10000-2000
ÿ It is found that most of the respondents (41.40%) visiting at 15days one time.
ÿ It is found that most of the respondents (42.4%) purchas in electronics .
ÿ It is found that most of the respondents (62%) news paper in Ads.
ÿ It is found that most of the respondents (55.20%) variety produtcs
ÿ It is found that most of the respondents (36.80%) category of the products
ÿ It is found that most of the respondents (44%)it`s free space
ÿ It is found that most of the respondents (43%) effective for re-prevenatives
ÿ It is found that most of the respondents (39.40% )yes cleanly of reminder.
ÿ It is found that most of the respondents (43.40%) fast service
ÿ It is found that most respondents (63.80%) season ofn offer time.
ÿ It is found that most of the respondents (37.8%) buy one get one
ÿ It is found that most of the respondents (81.60%) no waiting for billing section
ÿ It is found that most of the respondents (88%) food & gamming section avalible.
ÿ It is found that most of the respondents (39%) product intrest.
ÿ It is found that most of the respondents (63%)more than two times coming in store..
ÿ It is found that most of the respondents (38.40%) customer servic
ÿ It is found that majority of the respondents (66.40) good of the maintaing.
ÿ It is found that majority of the respondents (57.40%) satisfied
ÿ It is found that most of the respondents (61%) are ever cotacted customer service.
ÿ It is found that most of the respondents (64%) strongly agree.
80
5.2 SUGGESTIONS
• As the majority of the respondents are aware of departmental stores not through
advertisement, it is suggested that the store puts in more efforts in making the
advertising media an effective source of information in reaching the customers at
large.
• Efforts should be made to reduce the price of certain products like fancy items,
children’s toys, etc.,
• Steps should be formulated to make the customers aware of the door delivery system
facility provided.
• It is suggested to the management to appoint more number of skilled sales persons in
order to attract customers.
• It is recommended to the management to make the billing procedure more
convenient.
• Steps should be taken to avoid waiting and arrangements be made to park the
customers vehicle without any problem.
• It is suggested to the management to make the department store account for the
benefit of the customers and the persons working at the store.
81
CONCLUSION
Through this research had gained the knowledge in different aspects in different areas
and mainly in a ’’A STUDY ON CUSTOMER SATISFICATION ON GANESH
DEPARTMENTAL STORE - PALLADAM’’
A Highly spacious departmental store with offers a wide variety of products from to
all over the world.
Having various departmental present with in a reachable distance, Ganesh
Department Store is a good choice for the daily shopping.
Providing parking space and counter to level shopping bags while in side the store add
to the convenience that the customers desire.
The large isles allows the customers to move around esasily, even durng rush times.