70
HVO North Development Consent (DA 450-10-2003) Appendix J www.emmconsulting.com.au Kurri Kurri Battery Recycling Facility — Environmental Impact Statement Surface Water Assessment

HVO North Development Consent (DA 450-10-2003)
Appendix J
www.emmconsulting.com.au
Kurri Kurri Battery Recycling Facility — Environmental Impact Statement
Surface Water Assessment

www.emmconsulting.com.au
Kurri Kurri Battery Recycling Facility — Environmental Impact Statement
JAppendix J � Surface Water Assessment
Battery Recycling Project
129 Mitchell Avenue, Kurri Kurri
Surface Water Assessment
For: Pymore Recyclers International Pty Ltd October 2016

Kurri Kurri Battery Recycling Project
Surface Water Assessment
Project Number PA1361| Revision No. B | October 2016 Page | i
PROJECT INFORMATION
Project Name: Kurri Kurri Battery Recycling Project – Surface Water Assessment
Project Number: PA1361
Report for: Pymore Recyclers International Pty Ltd
PREPARATION, REVIEW AND AUTHORISATION
Revision # Date Prepared by Reviewed by Approved for Issue by
Rev A 26.09.2016 Chris Kuczera Ben Patterson Ben Patterson
Rev B 21.10.2016 Chris Kuczera Ben Patterson, EMM & Pymore Ben Patterson
COMPANY DETAILS Royal HaskoningDHV
Level 1, 43 Bolton Street
Newcastle, NSW, 2300
Tel. 4926 9500
www.royalhaskoningdhv.com
ABN 66 153 656 252
This report has been prepared by Haskoning Australia Pty Ltd solely for its client in accordance with the terms of appointment, the methodology, qualifications, assumptions and constraints as set out in the report and may not be relied upon by any other party for any use whatsoever without prior written consent from Haskoning Australia Pty Ltd.
© 2016 Haskoning Australia Pty Ltd

Kurri Kurri Battery Recycling Project
Surface Water Assessment
Project Number PA1361| Revision No. B | October 2016 Page | ii
TABLE OF CONTENTS 1 INTRODUCTION .............................................................................................. 1
1.1 Project Overview ............................................................................................... 1 1.2 Report Overview ............................................................................................... 4
2 STATUTORY REQUIREMENTS ...................................................................... 5 2.1 Environmental Assessment Requirements ........................................................ 5 2.2 Agency Correspondence................................................................................... 5 2.3 Applicable Polices and Guidelines .................................................................... 6 2.4 Relevant Studies ............................................................................................... 7
3 EXISTING CONDITONS .................................................................................. 8 3.1 Rainfall Data ..................................................................................................... 8 3.2 Local Watercourses .......................................................................................... 9 3.3 Site Drainage and Topography ......................................................................... 9 3.4 Local Soil Conditions ...................................................................................... 12
4 SURFACE WATER MANAGEMENT .............................................................. 13 4.1 Definitions ....................................................................................................... 13 4.2 Water Management Strategy .......................................................................... 14
4.2.1 Surface Water Management Objectives and Measures ........................... 14 4.2.2 Surface Water Management Strategy and Plan ....................................... 16
4.3 Site Water Balance ......................................................................................... 24 4.3.1 Modelling Approach ................................................................................. 24 4.3.2 Model Assumptions ................................................................................. 25 4.3.3 Water Balance Results ............................................................................ 26
5 FLOOD RISK MANAGEMENT ....................................................................... 30 5.1 Existing Studies .............................................................................................. 30 5.2 Model Development and Verification ............................................................... 31 5.3 Model Results ................................................................................................. 38 5.4 Flood Risk Assessment and Management Measures ...................................... 42 5.5 Assessment of Flood Impacts ......................................................................... 46
6 WATER MANAGEMENT ACT PROVISIONS ................................................. 50 7 MONITORING AND CONTINGENCY MEASURES ....................................... 51
7.1 Surface Water Monitoring Plan ....................................................................... 51 7.2 Summary of Additional Investigations and Contingency Measures ................. 52
8 CONCLUSION ................................................................................................ 53 9 REFERENCES ............................................................................................... 56

Kurri Kurri Battery Recycling Project
Surface Water Assessment
Project Number PA1361| Revision No. B | October 2016 Page | iii
ABBREVIATIONS AHD Australian Height Datum
AEP Annual Exceedance Probability
AR&R Australian Rainfall and Runoff (1987)
BBS Battery Breaking System
BoM Bureau of Meteorology
Cv Volumetric Runoff Coefficients
DP&E NSW Government’s Department of Planning and Environment
DPI – Water Department of Primary Industries – Water
EC Electrical Conductivity
EIS Environmental Impact Statement
EPA NSW Environment Protection Authority
EPL Environmental Protection License
FFL Finished Floor Level
HEX Hunter Expressway
IEAust Institution of Engineers Australia
OEH The Office of Environment and Heritage
OSD On-Site Detention
PMF Probable Maximum Flood
POEO Act Protection of the Environment Operations Act 1997
RHDHV Royal HaskoningDHV
SEARs Secretary’s Environmental Assessment Requirements
SSD State Significant Development
SWMP Surface Water Management Plan
tpa tonnes per annum
TSS Total Suspended Solids
TN Total Nitrogen
TP Total Phosphorus
ULAB Used Lead-Acid Battery
WM Act Water Management Act 2000

Kurri Kurri Battery Recycling Project
Surface Water Assessment
Project Number PA1361| Revision No. B | October 2016 Page | 1
1 INTRODUCTION
This Surface Water Assessment has been prepared by Royal HaskoningDHV (RHDHV) for Pymore Recyclers International Pty Ltd’s (Pymore) proposed used lead-acid battery (ULAB) recycling facility (the project). The project is a State significant development (SSD) which requires development consent under Part 4, Division 4.1 of the NSW Environmental Planning and Assessment Act 1979 (EP&A Act). A Development Application for SSD is required to be accompanied by an Environmental Impact Statement (EIS). This Surface Water Assessment will be appended to the EIS for the project.
1.1 Project Overview
The project is located at 129 Mitchell Avenue, Kurri Kurri (the site), within the Cessnock City Council (Council) Local Government Area. Figure 1 shows the site locality and local watercourses, landmarks and infrastructure.
Figure 1 – Site Locality

Kurri Kurri Battery Recycling Project
Surface Water Assessment
Project Number PA1361| Revision No. B | October 2016 Page | 2
The facility will recycle approximately 60,000 tonnes per annum (tpa) of ULABs. ULAB recycling will occur through the following processes:
� Crushing, screening and separation;
� Desulphurisation;
� Crystallisation; and
� Lead extraction.
The recycling process converts ULABs into the following materials that can be used in new products:
� Lead and plastics recovered are used in the production of new batteries.
� Sodium sulphate crystals are used primarily for the manufacture of detergents and glass.
The site area is approximately 3.4 ha and adjoins the Weston Aluminium recycling facility, which is located immediately to the west. Figure 2 shows the layout of the project. A more detailed project layout with section concepts that has been provided by Pymore is also provided as Appendix A. Table 1-1 provides a description of the nine buildings that are noted in Figure 2. It is noted that ULAB storage and processing will occur in Buildings 5 and 8.
Table 1-1 – Proposed Buildings
Building Number Description
1 Guard House and Truck Scale
2 QA /Lab / Workshop & Refectory Store
3 Administration / Canteen / Clinic
4 Changing Room
5 Battery Breaking, Crystallization and Foundry
6 Air Compressor Room
7 Oxygen Plant
8 ULAB Warehouse
9 Water Treatment Plant

Kurri Kurri Battery Recycling Project
Surface Water Assessment
Project Number PA1361| Revision No. B | October 2016 Page | 3
Figure 2 – Project layout

Kurri Kurri Battery Recycling Project
Surface Water Assessment
Project Number PA1361| Revision No. B | October 2016 Page | 4
1.2 Report Overview
This report documents the Surface Water Assessment that has been prepared for the project. The report is structured as follows:
� Section 2 discusses statutory requirements, relevant guidelines and studies.
� Section 3 reviews the existing surface water environment at the site.
� Section 4 describes the proposed surface water management strategy and presents a Surface Water Management Plan and water balance results for the project.
� Section 5 documents a flood risk assessment for the project.
� Section 6 addresses water licencing provisions for the project.
� Section 7 details monitoring and contingency measures for the project.
� Section 8 provides a summary of the assessment.

Kurri Kurri Battery Recycling Project
Surface Water Assessment
Project Number PA1361| Revision No. B | October 2016 Page | 5
2 STATUTORY REQUIREMENTS
2.1 Environmental Assessment Requirements
The NSW Government’s Department of Planning and Environment (DP&E) provided the Secretary’s Environmental Assessment Requirements (SEARs) for the preparation of an EIS for the project. Table 2-1 lists the SEARs that are applicable to this surface water assessment and provides a reference to the relevant section of the report that addresses each SEAR.
Table 2-1 – Secretary’s Environmental Assessment Requirements
Secretary’s Environmental Assessment Requirements Applicable Sections
A quantitative assessment of existing flooding on the site, potential impacts to and as a result of the development and proposed mitigation measures. Sections 5 and 8
An assessment of impacts to surface and groundwater resources, soil and agricultural resources and impacts to groundwater dependant ecosystems. Sections 4 and 8
A description of local soils, geology, topography, drainage (including flooding) and landscapes. Sections 3 and 5
A site water balance including the details of any water supply and licencing requirements. Section 4 and 6 Details of proposed stormwater, leachate, groundwater and waste water management, including erosion and sediment controls for the construction phase of the project. Section 4
Waste water predictions and the measures that would be implemented to treat, reuse and /or dispose of this water Section 4
A description and appraisal of impact mitigation and monitoring measures. Section 7
2.2 Agency Correspondence
Cessnock City Council Advice
In a letter dated 8 March 2016, Cessnock City Council provided the following advice that is relevant to this surface water assessment:
� Bunding: should be installed around:
- Battery and chemical storage areas;
- Truck wash-down bay; and
- Recycling centre.
� Water Quality: A water treatment plant should be installed to treat stormwater runoff from potentially contaminated areas of the site and any water produced from the ULAB recycling process or plant area.
� Drainage: The provision of On-Site Detention (OSD) and site drainage concepts will be required. OSD concepts should include calculations justifying the sizing of any OSD system.

Kurri Kurri Battery Recycling Project
Surface Water Assessment
Project Number PA1361| Revision No. B | October 2016 Page | 6
� Flooding: The northern portion of the site is located on the Swamp Creek Floodplain. The development should consider the potential for flood impacts to adjoining properties and all hazardous materials should be stored above the 1% Annual Exceedance Probability (AEP) flood level.
OEH Correspondence
In a letter dated 7 March 2016, The Office of Environment and Heritage (OEH) noted that the project is located on flood prone land and raised concern over a range of flood risk management issues. In particular, the potential for the mobilisation of hazardous material in flood waters was raised as a key concern. OEH recommended the following assessment requirements to DP&E:
� The impact of any changes to the existing site topography including cut, fill and building construction is to be assessed by flood modelling for events up to and including the Probable Maximum Flood (PMF). The site currently contains areas of flood storage which if filled may have off site impacts. The development is to demonstrate that it will have no impact on flood levels outside of the site boundary.
� The Environmental Impact Assessment is to demonstrate how the risk of mobilisation of stored dangerous/ hazardous goods will be managed in a flood event, up to and including the PMF event.
� The Environmental Impact Assessment is to demonstrate how the risk of contamination of waterways will be managed in the event of inundation of the site during flood events up to and including the PMF. The assessment is to consider both dangerous/hazardous goods and waste products.
� A risk assessment should be undertaken in accordance with the Hazardous Industry Planning Advisory Papers and other risk assessment guidelines provided by the NSW Department of Planning and Environment. The assessment should consider the likelihood and consequences of exposure of hazardous materials to the 1%, 2% and PMF events.
2.3 Applicable Polices and Guidelines
There are a number of legislative and guidance documents for water resource management and assessment in NSW. The following policies, plans and guidelines have been considered in this assessment.
Water Sharing Plan for the Greater Metropolitan Region Unregulated Water Sources 2011
Water Access Licenses (WALs) in the project area are administered by the Water Sharing Plan for the Hunter Unregulated and Alluvial Water Sources. The Water Sharing Plan is administered on the basis of catchment scale Water Sources. The site is located within the Wallis Creek Water Source. The licensing provisions of the Water Management Act 2000 (WM Act) are also applicable to the plan area.
The Water Sharing Plan is administered by the Department of Primary Industries – Water (DPI Water). Section 6 addresses the water licensing requirements for the project.
Protection of the Environment Operations Act 1997
The Protection of the Environment Operations Act 1997 (POEO Act) establishes the NSW environmental regulatory framework and includes licensing requirements for certain activities.

Kurri Kurri Battery Recycling Project
Surface Water Assessment
Project Number PA1361| Revision No. B | October 2016 Page | 7
Environmental Protection Licences (EPLs) for water discharge are administered by the NSW Environmental Protection Authority (EPA) under the POEO Act.
Guidelines
Stormwater Drainage Design: Engineering Requirements for Development
This guideline provides recommendations on engineering design specifications for subdivisions and the development of land within the Cessnock LGA area.
Australian Rainfall and Runoff
Australian Rainfall and Runoff (IEAust, 1987) is a document published by the Institution of Engineers, Australia. This document has been prepared to provide practitioners with the best available information on design flood estimation and is widely accepted as a design guideline for all flood and stormwater related investigation and design in Australia.
Bunding and Spill Management Guidelines
The following NSW Government guidelines detail best practice storage, handling and spill management procedures for liquid chemicals:
� Liquid Chemical Storage, Handling and Spill Management: Review of Best Practice Regulation (DECC, 2005).
� Storing and Handling Liquids: Environmental Protection: Participant’s Manual (DECC, 2007).
Australian Guidelines for Water Quality Monitoring and Reporting – ANZECC, 2000
These guidelines are the benchmark documents of the National Water Quality Management Strategy which is used for comparison of water quality monitoring data throughout Australia.
NSW Guidelines for Controlled Activities on Waterfront Land (DPI - Water)
DPI – Water have produced a series of guidelines that provide information on suitable design and construction methods for works on waterfront land. Controlled activity approvals under the WM Act aren’t required for an SSD project, by virtue of Section 89J of the EP&A Act. However, the intent of these guidelines has been considered when developing the project layout and water management plans.
2.4 Relevant Studies
The site area is partially located on the Swamp Creek Floodplain. Flooding on the Swamp Creek Floodplain is known to occur from both back water flooding during a Hunter River flood event and from flooding produced by rainfall in the Swamp Creek Catchment. The following government funded flood studies provide information on both of these flooding mechanisms:
� Information on Hunter River flooding is documented in the Hunter River Flood Study - Branxton to Green Rocks (WMA, 2010).
� Information on Swamp Creek flooding is documented in the Swamp Creek Floodplain Risk Management Study (Worley Parsons, 2013).
Relevant information from these flood studies is discussed further in Section 5.
Kurri Kurri Battery Recycling Project
Surface Water Assessment
Project Number PA1361| Revision No. B | October 2016 Page | 8
3 EXISTING CONDITONS
This section discusses the existing surface water environment with the project area.
3.1 Rainfall Data
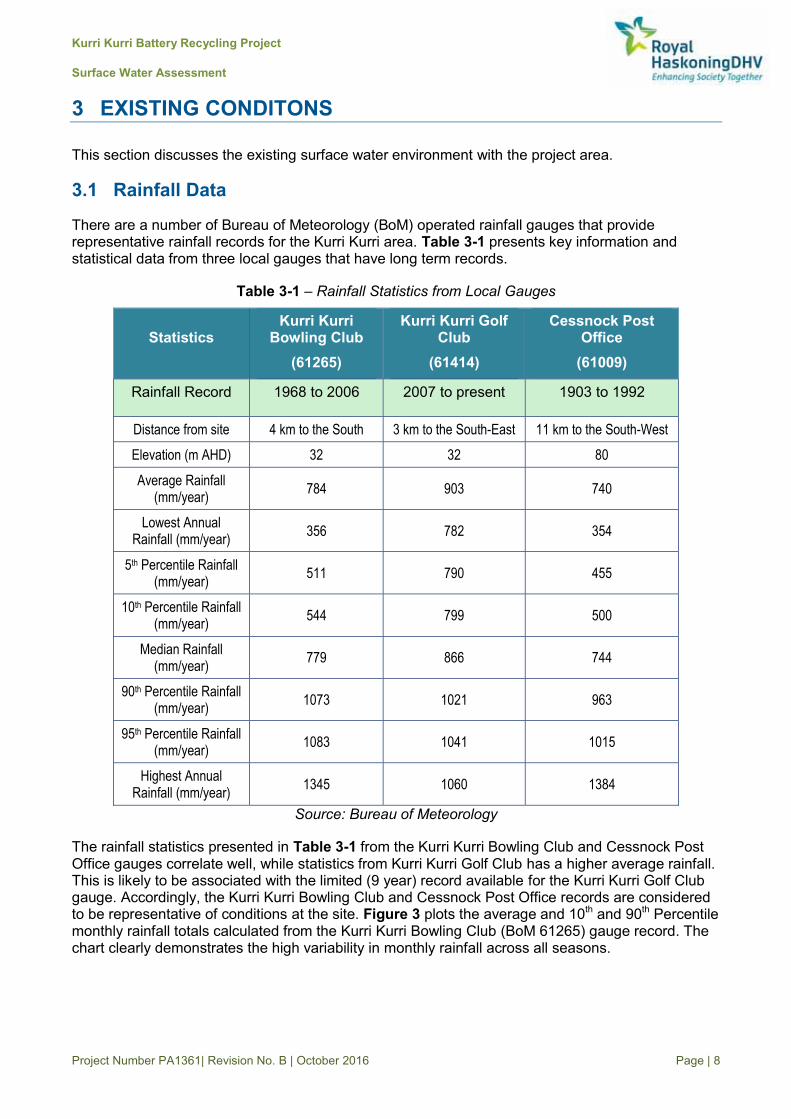
There are a number of Bureau of Meteorology (BoM) operated rainfall gauges that provide representative rainfall records for the Kurri Kurri area. Table 3-1 presents key information and statistical data from three local gauges that have long term records.
Table 3-1 – Rainfall Statistics from Local Gauges
Statistics Kurri Kurri
Bowling Club (61265)
Kurri Kurri Golf Club
(61414)
Cessnock Post Office
(61009)
Rainfall Record 1968 to 2006 2007 to present 1903 to 1992
Distance from site 4 km to the South 3 km to the South-East 11 km to the South-West Elevation (m AHD) 32 32 80 Average Rainfall
(mm/year) 784 903 740
Lowest Annual Rainfall (mm/year) 356 782 354
5th Percentile Rainfall (mm/year) 511 790 455
10th Percentile Rainfall (mm/year) 544 799 500
Median Rainfall (mm/year) 779 866 744
90th Percentile Rainfall (mm/year) 1073 1021 963
95th Percentile Rainfall (mm/year) 1083 1041 1015
Highest Annual Rainfall (mm/year) 1345 1060 1384
Source: Bureau of Meteorology
The rainfall statistics presented in Table 3-1 from the Kurri Kurri Bowling Club and Cessnock Post Office gauges correlate well, while statistics from Kurri Kurri Golf Club has a higher average rainfall. This is likely to be associated with the limited (9 year) record available for the Kurri Kurri Golf Club gauge. Accordingly, the Kurri Kurri Bowling Club and Cessnock Post Office records are considered to be representative of conditions at the site. Figure 3 plots the average and 10th and 90th Percentile monthly rainfall totals calculated from the Kurri Kurri Bowling Club (BoM 61265) gauge record. The chart clearly demonstrates the high variability in monthly rainfall across all seasons.

Kurri Kurri Battery Recycling Project
Surface Water Assessment
Project Number PA1361| Revision No. B | October 2016 Page | 9
Figure 3 – Monthly rainfall statistics at Kurri Kurri Bowling Club – 61265 (Source: BoM)
3.2 Local Watercourses
The site is located to the south of Swamp Creek, approximately 600 m upstream of the Hunter Expressway Bridge. Swamp Creek is a major watercourse that has a contributing catchment area upstream of the site of more than 80 km2. Downstream of the site, Swamp Creek enters into Wentworth Swamp, a large ephemeral waterbody that is known to accumulate large amounts of surface water following rainfall. Wentworth Swamp drains into Wallis Creek before entering the Hunter River. The lower portion of Wallis Creek is known to be tidal.
Figure 1 shows the location of Swamp Creek relative to the site area.
3.3 Site Drainage and Topography
It is understood that the site is currently used by Weston Aluminium as a laydown area. The existing topography at the site is characterised by a subtle ridge line that is aligned in a north-south direction. Under existing conditions:
� The western portion of the site drains towards the Weston Aluminium recycling facility where it accumulates in the facility’s water management dams. These dams overflow to Swamp Creek when full.
� The eastern portion of the project area drains to the east as sheet flow.
Flooding is known to occur on the northern (lower) portion of the site.
Figure 4 locates the abovementioned watercourses and topographical features relative to the project area. Photos 1, 2 and 3 (overleaf) show typical images of the site.
0
50
100
150
200
250
Jan Feb Mar Apr May Jun Jul Aug Sep Oct Nov Dec
Monthly Rainfall Statistics (61265)
90th Percentile
Average
10th Percentile
Mon
thly
Rai
nfal
l (m
m)

Kurri Kurri Battery Recycling Project
Surface Water Assessment
Project Number PA1361| Revision No. B | October 2016 Page | 10
Figure 4 – Local Drainage and Topography

Kurri Kurri Battery Recycling Project
Surface Water Assessment
Project Number PA1361| Revision No. B | October 2016 Page | 11
Photo 1 shows the site looking south. The site is currently used as a lay down area by Weston
Aluminium.
Photo 2 is taken from the eastern portion of the site looking to the north along the eastern boundary

Kurri Kurri Battery Recycling Project
Surface Water Assessment
Project Number PA1361| Revision No. B | October 2016 Page | 12
Photo 3 shows the Swamp Creek Floodplain looking to the north-west of the site.
3.4 Local Soil Conditions
A Preliminary Contamination Assessment was undertaken as part of the EIS (EMM, 2016). The assessment included the following description of local soils:
“The project area is in the northern end of the Permo-Triassic Sydney Geological Basin. This basin comprises Permian and Triassic sedimentary units, overlain by Quaternary alluvium associated with watercourses. Reference to the 1:100 000 Newcastle Coalfield Regional Geology map sheet (Hawley et al 1995) confirms Quaternary alluvial soils and unconsolidated sands are deposited adjacent to Swamp Creek.
The Quaternary deposits are underlain by Early Permian, Dalwood Group, comprising silty sandstone and siltstone. Weathering of this unit produces sandy, silty clay and the depth to competent rock is 7 m below ground level (BGL).
There is no reportable presence of acid sulfate soils (potential or actual) at the project area or in the surrounding area (OEH 2015 and section 149 certificate).”
The preliminary contamination assessment did not identify significant contamination issues that would preclude the proposed future land use as an industrial facility

Kurri Kurri Battery Recycling Project
Surface Water Assessment
Project Number PA1361| Revision No. B | October 2016 Page | 13
4 SURFACE WATER MANAGEMENT
The ULAB recycling facility will store and process a number of imported materials, including ULAB and other chemicals, some of which are classified to be hazardous requiring appropriate management. As a result there is potential for the project to export pollutants to the surrounding environment through a range of mechanisms, including stormwater runoff, accidental spills and leaks and airborne mobilisation of particulates. In recognition of these potential risks the following stormwater management principles have been integrated into the project layout and concept design that has been prepared by Pymore:
� All ULAB storage and processing will be undertaken in enclosed and bunded buildings.
� All wash-down water and water collected in building sumps will be separated from the stormwater drainage system.
� A stormwater management system will be established that captures initial runoff from the site in a Stormwater Capture Basin.
� A water treatment plant will be constructed to treat captured stormwater and all wash-down water produced. Treated water will be used in the ULAB recycling process.
� The stormwater drainage system will be designed to capture any accidental spills or fire water that may be produced in the event of a major fire at the site.
Importantly, the ULAB recycling process is a net user of water, and no liquid by-products are produced. This characteristic enables a contained surface water management system to be established, whereby stormwater runoff and wash-down water is captured and used in the ULAB recycling process. This eliminates any liquid waste streams and substantially reduces the volume of stormwater runoff that will be discharged from the site.
This section documents the surface water management strategy and plan that has been developed for the project and is structured as follows:
� Section 4.1 introduces terminology used to describe the surface water management strategy.
� Section 4.2 discusses potential impacts, describes the surface water management strategy and presents a Surface Water Management Plan (SWMP) for project.
� Section 4.3 details water balance modelling that was undertaken for the project.
Surface water impacts are summarised in Section 8.
4.1 Definitions
Water within the site has been differentiated into the following categories based on water quality:
� Clean Water – refers to surface water runoff from surfaces that are unlikely to be contaminated such as undisturbed and landscaped areas.
� Stormwater – refers to runoff from the facility’s hardstand and roof areas. Stormwater runoff from these areas has potential to contain elevated concentrations of suspended sediments and other contaminants.
Kurri Kurri Battery Recycling Project
Surface Water Assessment
Project Number PA1361| Revision No. B | October 2016 Page | 14
� Stormwater Management Area – refers to the portion of the site for which stormwater management controls are required. This principally includes the facility’s hardstand and roof areas.
� Wash Down Water – refers to water produced from the wash-down of plant and equipment, the truck wheel wash and any water collected in the building sumps. Wash down water is likely to contain elevated concentrations of suspended sediments and other contaminants.
� Process Water - refers to water that is used in the battery recycling process. Process water will be sourced from treated stormwater (when available) and from mains water when no stormwater is available for harvesting.
� Wastewater – refers to wastewater generated from the onsite amenities such as toilets and showers. Wastewater contains human waste and associated pathogens.
� Potable or Mains Water – refers to water suitable for drinking.
� Fire Water – refers to runoff resulting from the application of firefighting water. Fire water would be expected to have poor water quality.
4.2 Water Management Strategy
This section discusses the surface water management objectives, associated management measures and presents a SWMP.
4.2.1 Surface Water Management Objectives and Measures
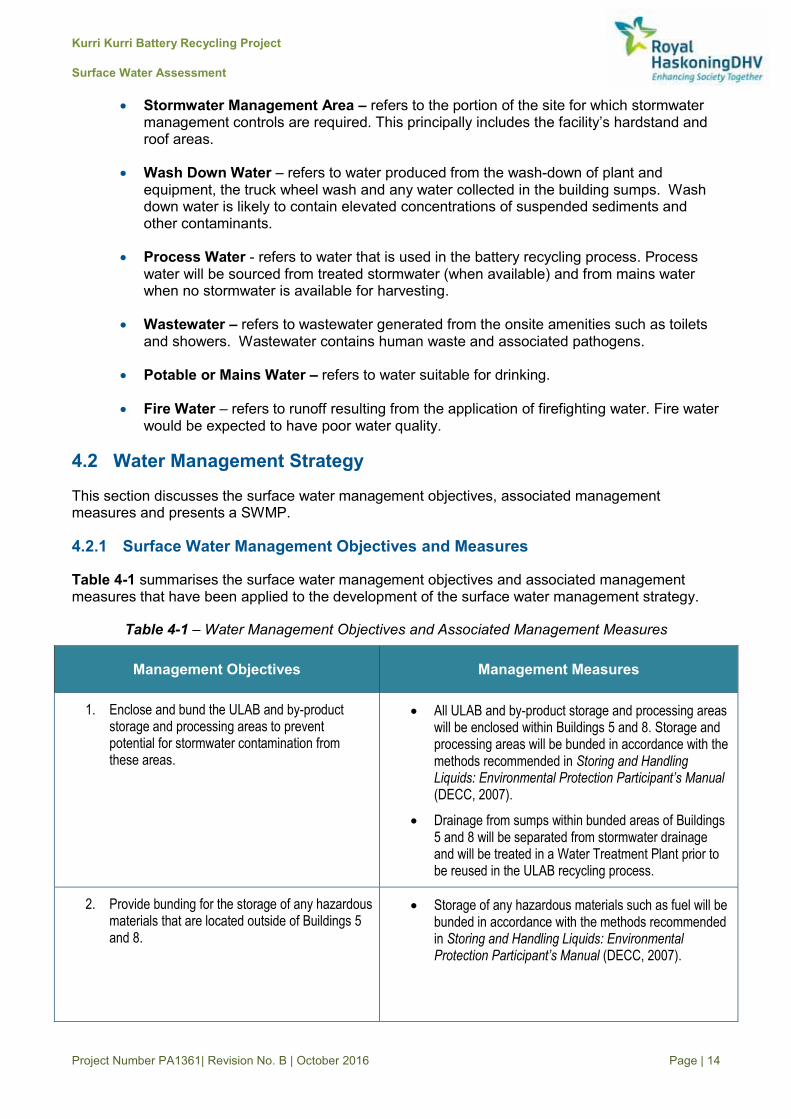
Table 4-1 summarises the surface water management objectives and associated management measures that have been applied to the development of the surface water management strategy.
Table 4-1 – Water Management Objectives and Associated Management Measures
Management Objectives Management Measures
1. Enclose and bund the ULAB and by-product storage and processing areas to prevent potential for stormwater contamination from these areas.
� All ULAB and by-product storage and processing areas will be enclosed within Buildings 5 and 8. Storage and processing areas will be bunded in accordance with the methods recommended in Storing and Handling Liquids: Environmental Protection Participant’s Manual (DECC, 2007).
� Drainage from sumps within bunded areas of Buildings 5 and 8 will be separated from stormwater drainage and will be treated in a Water Treatment Plant prior to be reused in the ULAB recycling process.
2. Provide bunding for the storage of any hazardous materials that are located outside of Buildings 5 and 8.
� Storage of any hazardous materials such as fuel will be bunded in accordance with the methods recommended in Storing and Handling Liquids: Environmental Protection Participant’s Manual (DECC, 2007).
Kurri Kurri Battery Recycling Project
Surface Water Assessment
Project Number PA1361| Revision No. B | October 2016 Page | 15
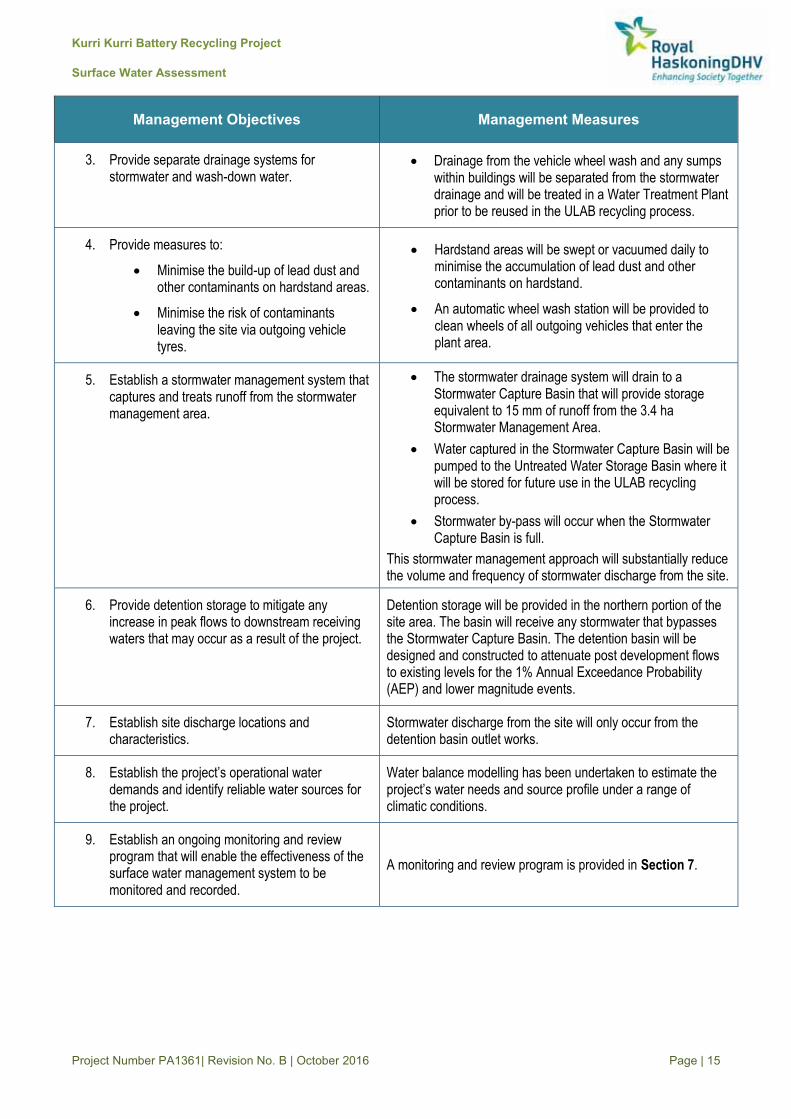
Management Objectives Management Measures
3. Provide separate drainage systems for stormwater and wash-down water.
� Drainage from the vehicle wheel wash and any sumps within buildings will be separated from the stormwater drainage and will be treated in a Water Treatment Plant prior to be reused in the ULAB recycling process.
4. Provide measures to:
� Minimise the build-up of lead dust and other contaminants on hardstand areas.
� Minimise the risk of contaminants leaving the site via outgoing vehicle tyres.
� Hardstand areas will be swept or vacuumed daily to minimise the accumulation of lead dust and other contaminants on hardstand.
� An automatic wheel wash station will be provided to clean wheels of all outgoing vehicles that enter the plant area.
5. Establish a stormwater management system that captures and treats runoff from the stormwater management area.
� The stormwater drainage system will drain to a Stormwater Capture Basin that will provide storage equivalent to 15 mm of runoff from the 3.4 ha Stormwater Management Area.
� Water captured in the Stormwater Capture Basin will be pumped to the Untreated Water Storage Basin where it will be stored for future use in the ULAB recycling process.
� Stormwater by-pass will occur when the Stormwater Capture Basin is full.
This stormwater management approach will substantially reduce the volume and frequency of stormwater discharge from the site.
6. Provide detention storage to mitigate any increase in peak flows to downstream receiving waters that may occur as a result of the project.
Detention storage will be provided in the northern portion of the site area. The basin will receive any stormwater that bypasses the Stormwater Capture Basin. The detention basin will be designed and constructed to attenuate post development flows to existing levels for the 1% Annual Exceedance Probability (AEP) and lower magnitude events.
7. Establish site discharge locations and characteristics.
Stormwater discharge from the site will only occur from the detention basin outlet works.
8. Establish the project’s operational water demands and identify reliable water sources for the project.
Water balance modelling has been undertaken to estimate the project’s water needs and source profile under a range of climatic conditions.
9. Establish an ongoing monitoring and review program that will enable the effectiveness of the surface water management system to be monitored and recorded.
A monitoring and review program is provided in Section 7.

Kurri Kurri Battery Recycling Project
Surface Water Assessment
Project Number PA1361| Revision No. B | October 2016 Page | 16
4.2.2 Surface Water Management Strategy and Plan
The proposed surface water management strategy and plan is described in the following figures:
� Figure 5 diagrammatically describes the functionality of the proposed water management system.
� Figure 6 provides a site Surface Water Management Plan.
� Figure 7 provides a more detailed image of the proposed surface water management controls that will be located in the northern portion of the site.
� Figure 8 provides section concepts of the northern portion of the site.
Key aspects of the strategy and plan are discussed below the figures.

Battery Recycling Project
Surface Water Assessment
Project Number PA1361| Revision No. B | October 2016 Page | 17
Figure 5 - Water Management Strategy
ULAB Recycling Process
(net water use: 46 m3/day)
Runoff from 3.4 ha Stormwater Management Area
(poten�al for elevated concentra�ons of suspended sediments and other contaminants)
Wash Down Water and Drainage from Internal Building Sumps
(likely to contain elevated concentra�ons of suspended sediments and other contaminants)
Mains Water
(Potable Water Quality)
Stormwater Capture Basin: Total volume of 708 m3 comprising:
�� First Flush Storage: 510 m3
�� Stormwater Storage: 198 m3
There is no liquid by-product from the ULAB recycling process
Deten�on Storage Volume (600 m3)
Site discharge to Swamp Creek via a surface drain
Basin outlet works
Flow Diversion Pit: bypass flow
will only occur when the Stormwater Capture Basin is full
Poten�al to harvest water from Swamp Creek as an alterna�ve to using
mains water.
Water Treatment Plant �� Floccula�on
�� pH Adjustment
�� Oil and Grease removal
Untreated Water Storage Basin: (703 m3)
Site discharge loca�on
The stormwater capture basin will be progressively pumped to the Untreated Water Storage Basin at a rate of 20 l/s. Pumping will con�nue un�l the Water
Storage Basin is full.
Bypass flow
Process water tank
Separate drainage line to stormwater
First Flush Storage volume will contain any accidental
spills or fire water
First Flush Storage volume equivalent to 15mm of runoff from the 3.4 ha Stormwater
Management Area

Kurri Kurri Battery Recycling Project
Surface Water Assessment
Project Number PA1361| Revision No. B | October 2016 Page | 18
Figure 6 – Surface Water Management Plan

Kurri Kurri Battery Recycling Project
Surface Water Assessment
Project Number PA1361| Revision No. B | October 2016 Page | 19
Figure 7 – Surface Water Management Plan Detailed View

Kurri Kurri Battery Recycling Project
Surface Water Assessment
Project Number PA1361| Revision No. B | October 2016 Page | 20
Figure 8 – Section Concepts
Stormwater Management Area
The Stormwater Management Area is estimated to be 3.4ha and comprises:
� 3.1 ha of site area that primarily includes roof and hardstand area; and
� 0.3 ha of land from an adjoining property that currently drains towards the site.
Figure 9 shows the assumed stormwater management area.
Swamp Creek Channel
Site Boundary (Indica�ve)
100 year ARI Flood Level
Exis�ng Levels (thick red line) Retaining Wall (indica�ve)
Sec�on A-A
Chainage (m)
Leve
l (m
AHD
)
40m
Subject to detailed design, the retaining wall may be constructed within 40m of the
Swamp Creek Channel (top of bank)
Top of Bank (indica�ve)
Proposed Hardstand Levels (indica�ve)
Swamp Creek Channel
Site Boundary (Indica�ve)
100 year ARI Flood Level
Flow Diversion Pit (directs flow to the Stormwater
Capture Storage un�l full) Drop Pit
Site Drainage
Deten�on Basin constructed in cut to minimise flood impacts. Basin
volume 600 m3 Basin outlet works
Exis�ng Levels (thick red line)
40m
Subject to detailed design, the basin and outlet works are expected to be
constructed within 40m of the Swamp Creek Channel (top of bank)
Retaining Wall (indica�ve)
Sec�on B-B
Chainage (m)
Leve
l (m
AHD
)
Surface drain to Swamp Creek
Scour protec�on at channel interface
Proposed Hardstand Levels (indica�ve)

Kurri Kurri Battery Recycling Project
Surface Water Assessment
Project Number PA1361| Revision No. B | October 2016 Page | 21
Figure 9 – Stormwater Management Area

Kurri Kurri Battery Recycling Project
Surface Water Assessment
Project Number PA1361| Revision No. B | October 2016 Page | 22
Site Grading Concept
It is proposed to grade the site so that it slopes gently to the north. It is currently envisaged that Building 5 will have a Finished Floor Level (FFL) of 15.6 m AHD and hardstand areas will be around 15.3 m AHD in the southern portion of the site (near Building 5) and 14.4 m AHD at the northern portion of the site (near Building 5) to match with a truck bed level height of 1.2 m. To achieve this grading concept, the southern and central portions of the site will be established in cut, and filling will be required to achieve design levels in the northern portion of the site. As indicated in Figure 6 a retaining wall is proposed around the northern and majority of the eastern and western boundaries of the proposed fill extent. The retaining wall will be up to 4.4 m high in the northern portion of the site where the existing levels are between 10 to 11 m AHD. Figure 8 shows section concepts of the northern portion of the site.
Detailed site grading plans will be provided at the detailed design stage. It is noted that site levels presented in this document are indicative and are subject to change at the detailed design stage of the project.
Stormwater Drainage and Capture
Runoff from the Stormwater Management Area will be collected in a piped drainage system. An indicative layout of the piped drainage system is provided in Figure 6. The piped drainage system will drain under gravity to the north of the site. A flow diversion pit will be established to divert (under gravity) stormwater into the Stormwater Capture Basin. When the Stormwater Capture Basin is full, all additional flows will spill via an overflow weir that will be established in the flow diversion pit. All overflows (also referred to as bypass flows) will drain into the Detention Basin that will be constructed at lower levels on the Swamp Creek Floodplain.
As indicated in Figure 5, the Stormwater Capture Basin will have a total volume of 708 m3, which will comprise:
� A First Flush Storage volume of 510 m3, which is equivalent to 15 mm of runoff from the 3.4ha Stormwater Management Area in accordance with the storage depths recommended in Storing and Handling Liquids: Environmental Protection Participant’s Manual (DECC, 2007).
� A Stormwater Storage Volume of 198 m3.
During and following rainfall, the Stormwater Capture Basin will be dewatered (via pumping) to the Untreated Water Storage Basin at a rate of 20 l/s. This dewatering rate will empty the first flush storage volume in approximately 7 hours. The Untreated Water Storage Basin will have a volume of 703 m3. When the Untreated Water Storage Basin is full, pumping from the Stormwater Capture Basin will cease and the Stormwater Capture Basin will be allowed to fill. The collective storage between both basins is 1,411 m3, which is equivalent to 41.5 mm of runoff from the 3.4 ha Stormwater Management Area. The ULAB recycling process will use an average of 46m3 of water a day. This water will be sourced from the Untreated Water Storage Basin, which will enable the Stormwater Capture Basin to be progressively dewatered at a similar rate.
Stormwater discharge from the site will only occur under the following scenarios:
� During an intense rainfall burst where the runoff volume exceeds the first flush storage volume (equivalent to 15mm of runoff).
� During extended periods of wet weather when both the Stormwater Capture Basin and Untreated Water Storage Basin are full.

Kurri Kurri Battery Recycling Project
Surface Water Assessment
Project Number PA1361| Revision No. B | October 2016 Page | 23
The water balance model results that are presented in Section 4.3 provide further information on the expected site discharge volumes.
Water Treatment Plant
Water stored in the Untreated Water Storage Basin will be treated in a Water Treatment Plant. The Water Treatment Plant will include the following processes:
� Flocculation and precipitation to remove suspended sediments.
� pH adjustment.
� Oil and Grease removal.
Treated water will be used in the ULAB recycling process and for wash-down water.
Management of Wash-down Water
Water produced from the truck wheel wash, the wash-down of plant and equipment and water collected in any internal building sumps is expected to be of poorer quality than stormwater runoff. The following measures are proposed to manage wash-down water:
� As indicated in Figure 5, all wash-down water will drain directly to the Untreated Water Storage Basin through a drainage system that is separate to the site’s stormwater drainage. This will avoid any mixing with stormwater and potential for wash-down water to discharge from the site.
� Wash-down water will be treated in the Water Treatment Plant and used in the ULAB recycling process.
Detention Basin
An increase in peak flows from the project area is expected due to the establishment of 3.1 ha of hardstand and roof area. Hydrologic modelling was undertaken to estimate detention storage requirements. Model results indicate that 600 m3 of storage will be required to fully mitigate the increase in peak flows for all events up to and including the 100 year ARI event. Refer to Appendix B for detailed calculations.
As indicated in the above figures, it is proposed to locate the detention basin in the northern portion of the site area, within the Swamp Creek Floodplain. To minimise potential flood impacts, the basin and embankment will be established in cut.
Water Supply
Pymore propose to apply to Hunter Water Corporation to have the site connected to local mains water. Mains water will be used in all amenities and to top-up the process water supply tank.
Waste Water Management
Pymore propose to apply to Hunter Water Corporation to have the site connected to the local sewer. Accordingly, all waste water produced on-site will be discharged to the sewer. Pymore does not propose to discharge trade waste to the sewer.
Kurri Kurri Battery Recycling Project
Surface Water Assessment
Project Number PA1361| Revision No. B | October 2016 Page | 24
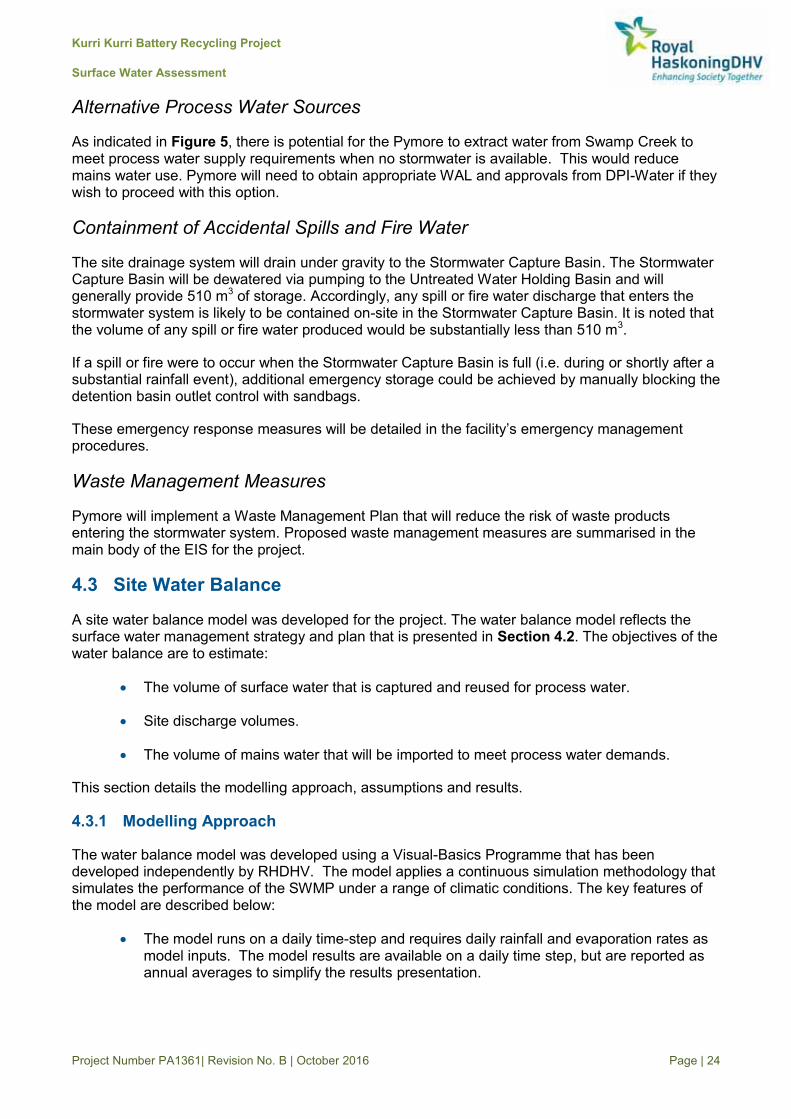
Alternative Process Water Sources
As indicated in Figure 5, there is potential for the Pymore to extract water from Swamp Creek to meet process water supply requirements when no stormwater is available. This would reduce mains water use. Pymore will need to obtain appropriate WAL and approvals from DPI-Water if they wish to proceed with this option.
Containment of Accidental Spills and Fire Water
The site drainage system will drain under gravity to the Stormwater Capture Basin. The Stormwater Capture Basin will be dewatered via pumping to the Untreated Water Holding Basin and will generally provide 510 m3 of storage. Accordingly, any spill or fire water discharge that enters the stormwater system is likely to be contained on-site in the Stormwater Capture Basin. It is noted that the volume of any spill or fire water produced would be substantially less than 510 m3.
If a spill or fire were to occur when the Stormwater Capture Basin is full (i.e. during or shortly after a substantial rainfall event), additional emergency storage could be achieved by manually blocking the detention basin outlet control with sandbags.
These emergency response measures will be detailed in the facility’s emergency management procedures.
Waste Management Measures
Pymore will implement a Waste Management Plan that will reduce the risk of waste products entering the stormwater system. Proposed waste management measures are summarised in the main body of the EIS for the project.
4.3 Site Water Balance
A site water balance model was developed for the project. The water balance model reflects the surface water management strategy and plan that is presented in Section 4.2. The objectives of the water balance are to estimate:
� The volume of surface water that is captured and reused for process water.
� Site discharge volumes.
� The volume of mains water that will be imported to meet process water demands.
This section details the modelling approach, assumptions and results.
4.3.1 Modelling Approach
The water balance model was developed using a Visual-Basics Programme that has been developed independently by RHDHV. The model applies a continuous simulation methodology that simulates the performance of the SWMP under a range of climatic conditions. The key features of the model are described below:
� The model runs on a daily time-step and requires daily rainfall and evaporation rates as model inputs. The model results are available on a daily time step, but are reported as annual averages to simplify the results presentation.
Kurri Kurri Battery Recycling Project
Surface Water Assessment
Project Number PA1361| Revision No. B | October 2016 Page | 25
� The model runs as a continuous simulation and applies a long term (36 year) rainfall record that includes a wide range of embedded dry and wet periods. The model results are processed to provide a statistical representation of the performance of the SWMP, under a full range of climatic conditions.
� Water demands and sources can be applied at constant rates or through the use of customised dynamic functions.
� Water transfers between storages, demands and sources can be controlled using transfer rules that are based on storage levels, demand requirements and source availability.
Results are presented in flow chart format for typical dry (10th Percentile), average and wet (90th Percentile) years in Section 4.3.3.
4.3.2 Model Assumptions
This section details the assumptions applied to the water balance model.
Climatic Data
A 36 year simulation period was adopted for the water balance model using daily rainfall data from the Kurri Kurri Bowling Club Gauge (BoM 61265) between 1967 and 2002.
Calculation of Runoff
The model calculates daily runoff volumes from the 3.4 ha Stormwater Management Area. As this area will primarily comprise impervious surfaces (hardstand and roofed areas), daily runoff volumes were calculated as a function of daily rainfall depths less a daily rainfall loss of 2.5 mm/day.
Process Water Demands
Process water will be primarily used in the ULAB recycling process. Pymore have advised that the net water use will be 54 m3/day on days when the facility is operating. As the facility will operate 310 days per year, an average daily water use rate of 46 m3/day has been calculated for use in water balance modelling.
Low volumes of process water will also be used for other purposes such as the truck wheel wash and wash-down of plant and equipment. As these volumes are minor when compared to the water use in the ULAB recycling process, they are ignored in the water balance model.
Mains Top-Up
The water balance model is configured to preferentially source process water from the Stormwater Capture and Untreated Water Basins. When empty, the water balance model sources mains water to meet process water demands.

Kurri Kurri Battery Recycling Project
Surface Water Assessment
Project Number PA1361| Revision No. B | October 2016 Page | 26
4.3.3 Water Balance Results
Water balance results are presented in flow chart format in Figures 11 to 13 for dry, average and wet rainfall years respectively. A summary chart is also provided as Figure 10. Results indicate that:
� Stormwater harvesting will reduced runoff volumes by between 49% (wet year) and 81% (dry year). The calculated long term average reduction is 60% of runoff. The stormwater system is designed to capture initial runoff during a rainfall period, which is more likely to contain elevated concentrations of pollutants than runoff that occurs after substantial rainfall. As a result, the stormwater capture and harvesting system is expected to substantially reduce pollutant loads from the facility.
� Stormwater harvesting will supply between 67% (dry year) and 90% (wet year) of the process water demand. The calculated long term average is 73% of total demand. It is proposed to use mains water to meet any shortfall. With reference to Figure 10, mains water use will range between 2,000 and 10,000 KL/year. As discussed in Section 4.2, there is potential to harvest water from Swamp Creek to further reduce the need to access mains water.
Figure 10 – Water Balance Summary Chart
-
5,000
10,000
15,000
20,000
25,000
30,000
35,000
40,000
45,000
0 0.05 0.1 0.15 0.2 0.25 0.3 0.35 0.4 0.45 0.5 0.55 0.6 0.65 0.7 0.75 0.8 0.85 0.9 0.95 1
Wat
er V
olum
e (K
L/ye
ar)
Rainfall Year (Percentile)
Water Balance Summary ChartStormwater Harvested Site Overflows Process Water Demand Mains Water Import Total Runoff
Dry Year Median Year Wet Year

Kurri Kurri Battery Recycling Project
Surface Water Assessment
Project Number PA1361| Revision No. B | October 2016 Page | 27
Figure 11 – Water Balance Results for a Typical Dry Year
KKBR Project: Site Water BalanceTypical Dry (10th Percentile) Rainfall YearAnnual Rainfall 544 mm/year
Minor Volumes
Minor Volumes
Runoff Volume Results Summary14,222 KL/year Water Treatment Plant Site Discharge Summary
Total Runoff 14,222 KL/year Stormwater Harvested 11,574 KL/year
81% of total runoff
Net Evaporation Loss 11,320 KL/year 4,646 KL/year Site Discharged 2,648 KL/yearBypass Volume 253 KL/year 19% of total runoff
2,648 KL/year Process Water Use Total Process Water Use 16,790 KL/year
11,574 KL/year 11,320 KL/year Stormwater Use 11,320 KL/year67% of total use
Mains Water Use 4,646 KL/year28% of total use
16,790 KL/year
2,648 KL/year
Runoff from 3.4 ha Stormwater Management Area
Wash-down Water Mains Water(Potable Water Quality)
Water consumed by recycling process
Detention Basin(attenuates flow only, does not
provide water storage)
Process water storage tank
Flow Diversion Pit
Process water will be preferentially sourced in the following order:1)Untreated Water Storage Basin2)Mains Water
ULAB Recycling Process(net water use: 46 m3/day)
Site discharge to Swamp Creek via a surface drain
Untreated Water Storage Basin: (703 m3)
Stormwater Capture Basin(708 m3)

Kurri Kurri Battery Recycling Project
Surface Water Assessment
Project Number PA1361| Revision No. B | October 2016 Page | 28
Figure 12 – Water Balance Results for a Typical Average Rainfall Year
KKBR Project: Site Water BalanceTypical Average Rainfall YearAnnual Rainfall 784 mm/year
Minor Volumes
Minor Volumes
Runoff Volume Results Summary19,972 KL/year Water Treatment Plant Site Discharge Summary
Total Runoff 19,972 KL/year Stormwater Harvested 11,232 KL/year
56% of total runoff
Net Evaporation Loss 10,986 KL/year 5,566 KL/year Site Discharged 8,740 KL/yearBypass Volume 246 KL/year 44% of total runoff
8,740 KL/year Process Water Use Total Process Water Use 16,836 KL/year
11,232 KL/year 10,986 KL/year Stormwater Use 10,986 KL/year65% of total use
Mains Water Use 5,566 KL/year33% of total use
16,836 KL/year
8,740 KL/year
Runoff from 3.4 ha Stormwater Management Area
Wash-down Water Mains Water(Potable Water Quality)
Water consumed by recycling process
Detention Basin(attenuates flow only, does not
provide water storage)
Process water storage tank
Flow Diversion Pit
Process water will be preferentially sourced in the following order:1)Untreated Water Storage Basin2)Mains Water
ULAB Recycling Process(net water use: 46 m3/day)
Site discharge to Swamp Creek via a surface drain
Untreated Water Storage Basin: (703 m3)
Stormwater Capture Basin(708 m3)

Kurri Kurri Battery Recycling Project
Surface Water Assessment
Project Number PA1361| Revision No. B | October 2016 Page | 29
Figure 13 – Water Balance Results for a Typical Wet Year
KKBR Project: Site Water BalanceTypical Wet (90th Percentile) Rainfall YearAnnual Rainfall 1,073 mm/year
Minor Volumes
Minor Volumes
Runoff Volume Results Summary31,297 KL/year Water Treatment Plant Site Discharge Summary
Total Runoff 31,297 KL/year Stormwater Harvested 15,425 KL/year
49% of total runoff
Net Evaporation Loss 15,131 KL/year 2,392 KL/year Site Discharged 15,872 KL/yearBypass Volume 294 KL/year 51% of total runoff
15,872 KL/year Process Water Use Total Process Water Use 16,836 KL/year
15,425 KL/year 15,131 KL/year Stormwater Use 15,131 KL/year90% of total use
Mains Water Use 2,392 KL/year14% of total use
16,836 KL/year
15,872 KL/year
Runoff from 3.4 ha Stormwater Management Area
Wash-down Water Mains Water(Potable Water Quality)
Water consumed by recycling process
Detention Basin(attenuates flow only, does not
provide water storage)
Process water storage tank
Flow Diversion Pit
Process water will be preferentially sourced in the following order:1)Untreated Water Storage Basin2)Mains Water
ULAB Recycling Process(net water use: 46 m3/day)
Site discharge to Swamp Creek via a surface drain
Untreated Water Storage Basin: (703 m3)
Stormwater Capture Basin(708 m3)

Kurri Kurri Battery Recycling Project
Surface Water Assessment
Project Number PA1361| Revision No. B | October 2016 Page | 30
5 FLOOD RISK MANAGEMENT
Swamp Creek has a known history of flooding with major floods occurring in June 2007 and April 2015. Anecdotally, inundation of the lower lying northern portion of the site occurred during both events. As discussed in Section 4, it is proposed to substantially regrade the site to establish a hardstand area that has a minimal grade and is suitable for truck movements etc. This will require some filling on the periphery of the 1% AEP flood extent and the construction of a retaining wall around the northern and majority of the eastern and western proposed fill extent.
During initial consultation, both OEH and Council noted that the project is located on flood prone land and raised concern over a range of flood risk management issues. In particular, the potential for the project to impact flooding on adjoining properties and the mobilisation of hazardous material in flood waters were raised as key concerns.
This section documents a flood risk management assessment that has been undertaken to address the above-mentioned concerns. A 2D hydraulic model of the Swamp Creek Floodplain between Government Road and the Hunter Expressway has been developed to inform this assessment. This section is structured as follows:
� Section 5.1 reviews existing flood studies.
� Section 5.2 describes the flood modelling approach and associated assumptions.
� Section 5.3 presents flood model results.
� Section 5.4 documents a flood risk assessment and proposed management measures.
� Section 5.5 assesses potential flood impacts associated with the project.
5.1 Existing Studies
As discussed in Section 2, flooding on the Swamp Creek Floodplain is known to occur from both back water flooding during a Hunter River flood event and from flooding produced by rainfall in the Swamp Creek Catchment. The following government funded flood studies provide information on both of these flooding mechanisms:
� Information on Hunter River flooding is documented in the Hunter River Flood Study - Branxton to Green Rocks (WMA, 2010).
� Information on Swamp Creek flooding is documented in the Swamp Creek Floodplain Risk Management Study (Worley Parsons, 2013).
These studies are discussed further below.
Swamp Creek Floodplain Risk Management Study and Plan (Worley Parsons, 2013)
Worley Parsons prepared the Swamp Creek Floodplain Risk Management Study and Plan for Council in 2013. The study is referred to as the FRMS in the remainder of this report. The FRMS included the development of a two-dimensional hydraulic model of the Swamp Creek Floodplain using the RMA software package. Hydrologic inputs were calculated using XP-RAFTS. The study documents the most recent estimates of Swamp Creek flood characteristics in the vicinity of the site.

Kurri Kurri Battery Recycling Project
Surface Water Assessment
Project Number PA1361| Revision No. B | October 2016 Page | 31
However, it is understood that the hydraulic model does not include the recently constructed Hunter Expressway Bridge, which is located 600m downstream of the site.
Council has given consent for output from the hydrologic model to be used in this assessment. Relevant information from this flood study is discussed further in Section 5.2.
Hunter River Flood Study - Branxton to Green Rocks (WMA, 2010)
During a Hunter River Flood event, flood waters are known to inundate (via back water flooding) the lower portion of the Swamp Creek Floodplain. WMA Water prepared the Hunter River Flood Study – Branxton to Green Rocks for Maitland City and Cessnock City Councils in 2010. The study provides the most reliable estimates of Hunter River flood characteristics in the vicinity of the site. Results from Dagworth Bridge (Point G in the table provided in the executive summary) are considered to be the most representative flood levels at the subject site. Peak flood levels for a range of events are reproduced in Table 5-1.
Table 5-1 – Hunter River Flood Levels
Flood Event (AEP) Flood Level (m AHD)
5% 7.6
2% 8.5
1% 9.7
0.2% 10.8
Extreme 12.2
Comparison of Studies
A comparison of peak flood levels presented in the above-mentioned studies indicates that peak flood levels are governed by:
� Hunter River back water flooding downstream of the Hunter Expressway; and
� Flooding produced by rainfall in the Swamp Creek Catchment upstream of the Hunter Expressway. This flooding mechanism is referred to as Swamp Creek flooding in the remainder of this report.
As the site is located upstream of the Hunter Expressway, peak flood levels at the site are governed by Swamp Creek flooding. Accordingly, no further assessment of Hunter River flooding has been undertaken in this assessment.
5.2 Model Development and Verification
A two-dimensional hydraulic model of the Swamp Creek Floodplain has been developed to inform this assessment. The model was developed using TUFLOW hydraulic modelling software and was applied to assess the 1%, 0.5% AEP and PMF flood events for both existing and proposed conditions. Lower magnitude events such as the 5% AEP were not assessed as it is clear the project will not impact or be impacted by such an event.

Kurri Kurri Battery Recycling Project
Surface Water Assessment
Project Number PA1361| Revision No. B | October 2016 Page | 32
Key characteristics of the model are summarised as follows:
� The model extends from immediately upstream of Government Road to downstream of the Hunter Expressway.
� Surface elevations in the model were sourced from a 2012 LiDAR survey.
� The model was established at a 3 m x 3 m grid resolution.
� Hydrologic inflows were applied to the model at two locations upstream of the site. Inflow hydrographs were sourced from the hydrologic model that was developed for the Swamp Creek FRMS.
� The Hunter Expressway Bridge was applied as a two-dimensional flow constriction cell, using bridge geometry information that was provided by RMS for use in this project.
� For developed conditions simulations, the model’s Digital Elevation Model was modified to include filling to16m AHD within the proposed fill extent.
Figure 14 shows the hydraulic model domain and locates the above-mentioned features.

Kurri Kurri Battery Recycling Project
Surface Water Assessment
Project Number PA1361| Revision No. B | October 2016 Page | 33
Figure 14 – Hydraulic Model Domain

Kurri Kurri Battery Recycling Project
Surface Water Assessment
Project Number PA1361| Revision No. B | October 2016 Page | 34
Hydraulic Roughness
Hydraulic roughness parameters are used to represent friction between water and the surface of a channel or a floodplain. Generally higher roughness values imply increased friction (or energy loss) and imply higher flood levels. The model domain was divided into the hydraulic roughness categories based on site observations and a review of aerial photography. Figure 15 shows the distribution of the various roughness categories and adopted Manning’s Roughness values for each category.
Figure 15 – Hydraulic Roughness

Kurri Kurri Battery Recycling Project
Surface Water Assessment
Project Number PA1361| Revision No. B | October 2016 Page | 35
Hydrologic Inflows
Hydrologic inflows were applied at the two locations indicated in Figure 14. Inflow hydrographs were sourced from the hydrologic model that was developed for the Swamp Creek FRMS. The hydrographs were moderately scaled to achieve flood levels similar to those documented in the FRMS. Table 5-2 provides the adopted combined peak flows from the two inflow hydrographs.
Table 5-2 – Adopted peak inflows
Event (AEP) Peak Flow
1% 397 m3/s
0.5% 575 m3/s
PMF 2,550 m3/s
Verification to FRMS Levels
The hydraulic model was verified by comparing the predicted peak flood levels for the 1%, 0.5% AEP and PMF events to the levels documented in the FRMS figures. It is understood that the FRMS Model did not include the Hunter Expressway (HEX) Bridge, which was under construction in 2013, the year the FRMS was finalised. Accordingly, the hydraulic model was simulated ‘with’ and ‘without’ the HEX Bridge. The ‘without’ bridge results were used to verify the predicted peak flood levels.
Peak flood levels were compared at five locations along the Swamp Creek Channel that are within 400m of the site. Figure 16 shows the location of the comparison points and Table 5-3 compares the peak flood levels at each point. It is noted that the results at Point 3 are representative of peak flood levels at the site.

Kurri Kurri Battery Recycling Project
Surface Water Assessment
Project Number PA1361| Revision No. B | October 2016 Page | 36
Figure 16 – Model Verification Points

Kurri Kurri Battery Recycling Project
Surface Water Assessment
Project Number PA1361| Revision No. B | October 2016 Page | 37
Table 5-3 – Model Verification Results
FRMS Model1 RHDHV Model
Without HEX Bridge With HEX Bridge
1% AEP Event
Point 1 12.00 12.01 12.03
Point 2 11.80 11.80 11.83
Point 3 11.40 11.41 11.46
Point 4 11.20 11.20 11.27
Point 5 11.00 11.00 11.09
0.5% AEP Event
Point 1 12.65 12.63 12.83
Point 2 12.55 12.47 12.73
Point 3 12.20 12.12 12.57
Point 4 12.00 11.92 12.40
Point 5 11.80 11.75 12.31
PMF Event
Point 1 16.80 16.83 17.80
Point 2 16.70 16.78 17.77
Point 3 16.65 16.57 17.64
Point 4 16.50 16.51 17.62
Point 5 16.40 16.40 17.56
Note 1: The FRMS levels were estimated from the peak flood level contours provided in the FRMS figures. The contours were provided at a 0.2m interval which enabled the levels to be reliably estimated from the figures.
Comparison of the results presented in Table 5-3 shows that the ‘without’ HEX Bridge results are within 100mm of the FRMS levels at all locations and for all events. This verifies that the hydraulic model reliably reproduces the peak FRMS flood levels.
Comparison of the ’with’ and ‘without’ HEX Bridge results indicates that the HEX Bridge will result in the following flood level increases at the site:
� 1% AEP event – 0.05 m increase.
� 0.5% AEP event – 0.45 m increase.
� PMF event – 1.07 m increase.

Kurri Kurri Battery Recycling Project
Surface Water Assessment
Project Number PA1361| Revision No. B | October 2016 Page | 38
5.3 Model Results
The ’with’ HEX Bridge results are representative of current conditions and have therefore been applied to establish existing Swamp Creek flood characteristics in the vicinity of the site. Model results are presented as follows:
� Table 5-4 documents the adopted flood levels at the site for the 1%, 0.5% AEP and PMF events.
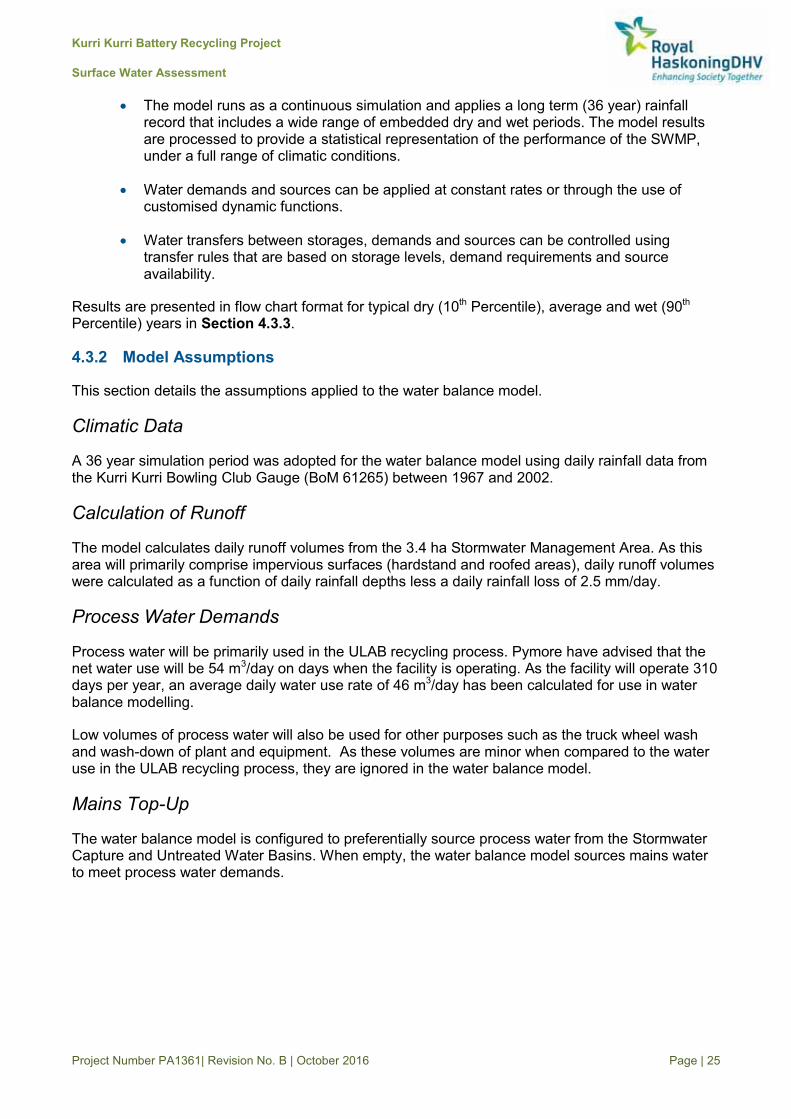
� Flood maps that depict peak flood depth and level contours are provided in Figures 17 to 19 for the 1%, 0.5% AEP and PMF events respectively. It is noted that these figures show the flood extent for existing conditions (i.e. no filling has been applied).
� Flood maps that depict peak flood hazard (calculated as the Velocity x Depth product) are provided in Appendix C.
Table 5-4 – Adopted peak flood levels at the site
Event (AEP) Peak Flood Level
1% 11.6 m AHD
0.5% 12.6 m AHD
PMF 17.6 m AHD
The model results indicate that:
� The proposed fill extent will encroach onto the periphery of the 1% and 0.5% AEP flood extents.
� The PMF will inundate the majority of the site area. It is noted that PMF levels are significantly higher than the 1% AEP level due a combination of the substantially higher flows and a natural constriction in the floodplain at the HEX Bridge location. As noted in Section 5.2, the construction of the HEX Bridge has exacerbated the head loss through this natural constriction, resulting in an estimated 1.07 m increase in PMF levels at the site.

Kurri Kurri Battery Recycling Project
Surface Water Assessment
Project Number PA1361| Revision No. B | October 2016 Page | 39
Figure 17 – Peak Flood Depth and Level – 1% AEP Event
Kurri Kurri Battery Recycling Project
Surface Water Assessment
Project Number PA1361| Revision No. B | October 2016 Page | 40
Figure 18 – Peak Flood Depth and Level – 0.5% AEP Event

Kurri Kurri Battery Recycling Project
Surface Water Assessment
Project Number PA1361| Revision No. B | October 2016 Page | 41
Figure 19 – Peak Flood Depth and Level – PMF Event

Kurri Kurri Battery Recycling Project
Surface Water Assessment
Project Number PA1361| Revision No. B | October 2016 Page | 42
5.4 Flood Risk Assessment and Management Measures
This section assesses the following flood risks:
� Economic Risks associated with damage to property, plant and equipment.
� Environmental Risks associated with mobilisation of hazardous materials in flood waters.
� Risk to life associated with the facility being located on flood prone land.
The risk assessment is informed by a review of site levels, freeboards and hazardous materials that will be stored and processed onsite.
Site Levels and Freeboards
Table 5-4 summarises proposed minimum hardstand levels and Finished Floor Levels (FFLs) for Buildings 5 and 8, for which ULABs will be stored and processed. Minimum freeboards for the 1% and 0.5% AEP and PMF flood events have been calculated based on these lower levels and are provided in Table 5-4.
Table 5-5 – Indicative Site Levels and Freeboards
Estimated Site Levels Minimum Freeboards
Current Estimate 1% 0.5% PMF
Hardstand
14.4 m AHD (northern portion of the Site) 15.3 m AHD (central portion of the Site)
2.8 m 1.8 m (3.2 m)
Building 5 (ULAB and by-product Processing &
Storage) FFL of 15.6m AHD 4.0 m 3.0 m (2 m)
Building 8 (ULAB Storage)
FFL of 15.6m AHD 4.0 m 3.0 m (2 m)
The information presented in Table 5-4 indicates that site hardstand and FFLs will be substantially above the predicted peak 1% and 0.5% AEP levels. A PMF event would be expected to inundate the majority of the site with over floor flooding of up to 2 m expected in the site buildings.
It is noted that a PMF is estimated to have a 1 in 10,000,000 probability of occurring (AR&R, 2016) in any given year. As a result a flood of this magnitude is extremely unlikely to occur. The probability of a flood exceeding the minimum FFL of 15.6 m AHD is estimated by RHDHV to be 1 in 20,000 in any given year.
Risk of Mobilisation of Hazardous Materials in Floodwaters
In the unlikely event that a 1 in 20,000 year or greater magnitude flood occurs, floodwater would be expected to inundate the floor levels of the onsite buildings. If this occurs, the stored ULAB and
Kurri Kurri Battery Recycling Project
Surface Water Assessment
Project Number PA1361| Revision No. B | October 2016 Page | 43
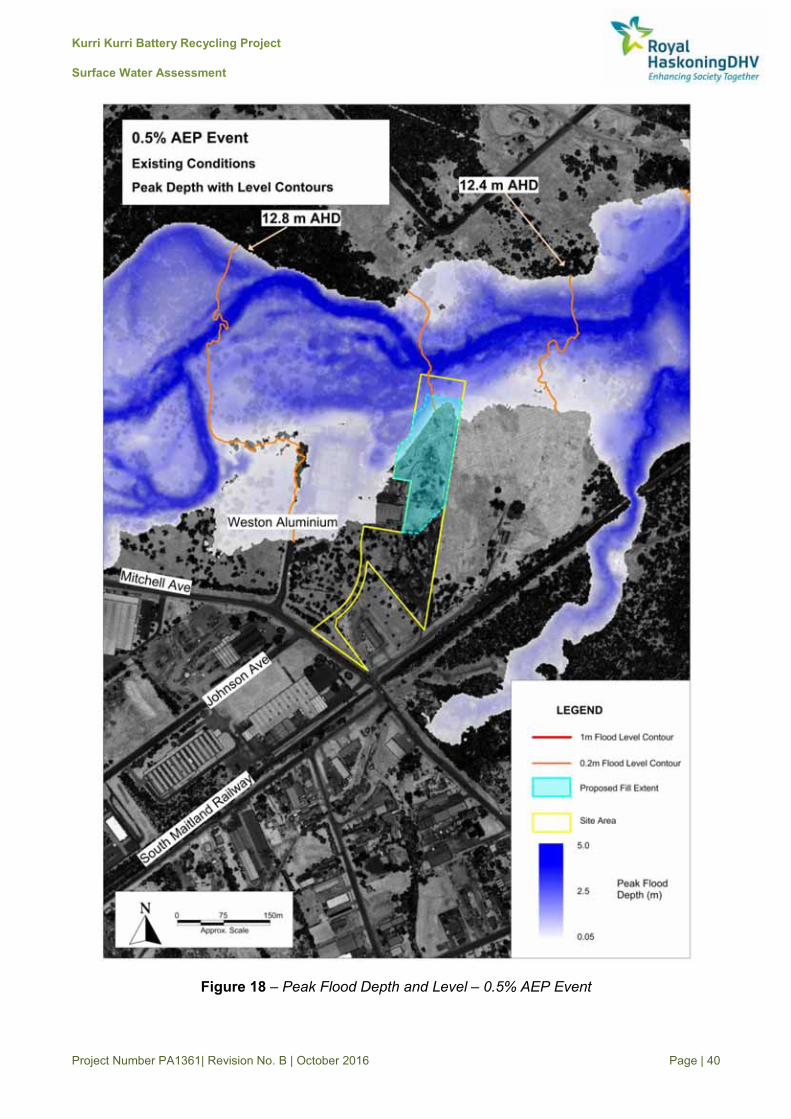
ULAB recycling by-products in Buildings 5 and 8 will be exposed to floodwaters. This section reviews the potential for these materials to become mobilised and cause environmental harm. It is noted that all materials will be stored in enclosed buildings and would therefore be shielded from excessive flow velocities.
ULAB batteries will be transported to the site by truck and will be stored in either Building 8 or the northern portion of Building 5 prior to processing. The ULABs will be stacked on crates and generally bound together by plastic sheeting. Figure 20 shows images of ULAB storage areas at other facilities operated by Pymore.
Figure 20 – ULAB Storage Areas (provided by Pymore)
The recycling process converts ULABs into the following materials that can be used in new products:
� Lead bullion.
� Ground polypropylene plastics.
� Sodium sulphate crystals which are highly soluble but non-toxic.
By-products will be stored in the north-western portion of Building 5. Figure 21 shows images of these by-products.

Kurri Kurri Battery Recycling Project
Surface Water Assessment
Project Number PA1361| Revision No. B | October 2016 Page | 44
Figure 21 – ULAB recycling by-products (provided by Pymore)
An assessment was undertaken to establish environmental risks associated with the stored ULAB and recycling by-products being exposed to floodwaters. The risk assessment considered both the potential for materials to become mobilised in floodwaters and the environmental consequences if mobilised. Table 5-6 documents the risk assessment.
Table 5-6 – ULAB and by-product risk assessment
Potential to become Mobilised in Floodwaters1
Consequence if mobilised in Floodwaters
Risk to Environment
ULAB
� Stored batteries are not expected to be mobilised in flood waters due to weight.
� Some leaching of acid may occur.
� Negligible consequences of acid leaching due to dilution.
Negligible
Polypropylene Plastics
� Plastic is buoyant and would be readily mobilised in flood waters. However, the majority of mobilised plastics would be expected to remain within the building.
� Ground plastic are non-toxic but would be considered litter.
Risks are limited to litter being mobilised in floodwaters.
Sodium Sulphate � Sodium sulphate is highly
soluble and would be expected to dissolve in flood waters.
� Negligible consequences as sodium sulphate is non-toxic and would be significantly diluted.
Negligible
Lead Bullion � Lead bullion is not expected
to be mobilised in flood waters due to weight.
� Not Applicable Negligible
Note1: It is noted that all materials will be stored in enclosed buildings and would therefore be shielded from excessive flow velocities.
The risk assessment documented in Table 5-6 identified the mobilisation of non-toxic ground plastic as the only material environmental risk.
Recycling By-products
Polypropylene Plas�cs
Sodium Sulphate
Lead Bullion

Kurri Kurri Battery Recycling Project
Surface Water Assessment
Project Number PA1361| Revision No. B | October 2016 Page | 45
Flood Evacuation
Flood evacuation would only be required during a PMF or similar magnitude event. Building 3 (Administration Building) is a multi-story building and would provide safe refuge for site staff. Evacuation from the site is not recommended due to local flooding hazards.
A flood evacuation procedure will be established as part of the project’s Emergency Management Plan.
Proposed Flood Risk Management Measures
The following flood risk management measures are recommended:
� All hazardous materials are to be stored and processed in fully enclosed and bunded buildings that have a minimum Finished Floor Level (FFL) of 15.6 m AHD. This provides 4.0 m freeboard to the peak 1% AEP levels and 3.0 m freeboard to the peak 0.5% AEP Levels. It is noted that a FFL of 15.6 m AHD is currently proposed for Buildings 5 and 8.
� Site staff can take refuge in Building 3 if required.
Residual Flood Risks
Table 5-7 summarises information presented in this section and establishes residual flood risks. The risk assessment process concluded that economic, environmental and risk to life flood risks are negligible. This is primarily due to the site being established substantially above the 1% AEP flood level with inundation of floor levels only expected to occur in 1 in 20,000 year or greater magnitude extreme event.
Table 5-7 – Flood risk assessment summary
Identified Risks Proposed Controls Residual Risks
Economic Risks � Damage to property, plant and equipment.
� Minimum FFLs are to be 4.1 m above the 1% AEP level. Negligible
Environmental Risks � Potential for
hazardous materials to be mobilised in floodwaters.
� All hazardous materials are to be stored and processed above 15.6 m AHD. The probability of flood levels exceeding this level is estimated to be 1 in 20,000 in any given year.
� All hazardous materials will be stored and processed in enclosed and bunded buildings.
� A review of hazardous materials stored on site did not identify any significantly environmental risks associated with these materials being inundated by floodwaters.
Negligible
Risks to Life � Potential for loss of
life during a PMF event.
� Flood refuge will be provided in Building 3. Negligible

Kurri Kurri Battery Recycling Project
Surface Water Assessment
Project Number PA1361| Revision No. B | October 2016 Page | 46
5.5 Assessment of Flood Impacts
As discussed earlier in this section, it is proposed to substantially regrade the site to establish a hardstand area that has a minimal grade and is suitable for truck movements. This will require some filling on the periphery of the 1% AEP flood extent and the construction of a retaining wall around the northern and majority of the eastern and western boundaries of the proposed fill extent.
Works to the north of the retaining wall will be limited to the proposed detention basin, outlet works and fencing. The following design measures are proposed to minimise flood impacts associated with these works:
� The detention basin and embankment will be established in cut to avoid any localised increases in surface levels.
� Any fences established to the north of the retaining wall will be low profile stock fencing.
The hydraulic model was applied to assess flood impacts on adjoining properties associated with the proposed filling. Flood impacts were assessed in the hydraulic model by raising surface levels within the proposed fill extent to 16 m AHD. The proposed fill extent is shown in all figures presented in this section. Flood impacts were calculated by comparing the existing and proposed conditions results. The predicted change in flood levels is presented diagrammatically in Figures 22 to 24 for the 1%, 0.5% AEP and PMF events respectively.
Model results indicate that:
� Predicted flood impacts during a 1% AEP event are limited to a 13 mm increase in flood levels at the location of Weston Aluminium’s water management dams, which are located immediately to the west of the site.
� Predicted flood impacts during a 0.5% AEP event range between 11 to 17 mm in the floodplain area located to the west of the site. This minor increase in predicted flood levels extends approximately 300 m upstream of the site and only affects land used for industrial purposes.
� Predicted flood impacts during a PMF range from 13 to 17 mm in upstream areas, which is negligible considering the extent of inundation.
In summary, model results indicate that flood level impacts associated with the proposed filling will range between 13 to 17mm. These minor changes to peak flood levels are not expected to result in a material increase in flood risk on adjoining properties.

Kurri Kurri Battery Recycling Project
Surface Water Assessment
Project Number PA1361| Revision No. B | October 2016 Page | 47
Figure 22 – Predicted changes to peak flood levels – 1% AEP event

Kurri Kurri Battery Recycling Project
Surface Water Assessment
Project Number PA1361| Revision No. B | October 2016 Page | 48
Figure 23 – Predicted changes to peak flood levels – 0.5% AEP event

Kurri Kurri Battery Recycling Project
Surface Water Assessment
Project Number PA1361| Revision No. B | October 2016 Page | 49
Figure 24 – Predicted changes to peak flood levels – PMF event

Kurri Kurri Battery Recycling Project
Surface Water Assessment
Project Number PA1361| Revision No. B | October 2016 Page | 50
6 WATER MANAGEMENT ACT PROVISIONS
Water harvesting from the Stormwater Capture and Untreated Water Storage Basins is considered to be excluded works under Water Management (General) Regulation 2011, Schedule 1, item 3 (dams solely for the capture, containment or recirculation of drainage). Accordingly, the project is expected to have no requirements for water licencing.

Kurri Kurri Battery Recycling Project
Surface Water Assessment
Project Number PA1361| Revision No. B | October 2016 Page | 51
7 MONITORING AND CONTINGENCY MEASURES
7.1 Surface Water Monitoring Plan
Pymore will implement a surface water monitoring program that comprises quarterly monitoring of a full suite of analytes during wet weather conditions. The objective of the monitoring program is to establish the typical range in quality of stormwater runoff from the site. This information can be used to infer the likely quality of any site discharge, which is expected to occur for only short periods of time with little notice and would be difficult to effectively monitor.
Table 7-1 describes the framework of the monitoring plan and Table 7-2 details the proposed analytes that will be monitored. Pymore will keep a record of all monitoring results.
Table 7-1 – Proposed Surface Water Monitoring Plan Framework
Aspect Objective Monitoring Locations Monitoring Description
Inflows into the Stormwater Capture Basin (quarterly)
To establish the water quality of stormwater runoff from the site.
� Stormwater Capture Basin
Quarterly sampling comprising two samples taken 1 hour apart during wet weather.
Table 7-2 – Surface Water Monitoring Plan: Analytes Proposed
Analytes Proposed
Physical Parameters
� Electrical Conductivity (EC)
� Total Suspended Solids (TSS)
� Total Dissolved Solids (TDS)
� Turbidity
Chemical Parameters
� pH
� Total Nitrogen (TN)
� Total Phosphorus (TP)
� Metals (Al, As, Ag, B, Ba, Co, Cu, Cr, Cd, Pb, Mn, Ni, Zn, Mg, Na, K, Ca, Cl, Fe, F, Hg, Se)
� Total Oil and Grease

Kurri Kurri Battery Recycling Project
Surface Water Assessment
Project Number PA1361| Revision No. B | October 2016 Page | 52
7.2 Summary of Additional Investigations and Contingency Measures
Table 7-3 provides a summary of additional investigations and Table 7-4 contingency measures that have been proposed in this report.
Table 7-3 – Summary of Additional Investigations
Item Trigger / Timing Outcomes
Detailed civil design of the project and proposed water management controls. Prior to the construction of the project.
A detailed design that will achieve the surface water management objectives established in Table 4-1.
Surface Water Management and Monitoring Plan Prior to the construction of the project.
The plan will document:
� Relevant consent and licence conditions.
� The functionality of the stormwater management system.
� Stormwater management operating procedures.
� Stormwater monitoring and reporting requirements.
� Emergency response and contingency procedures.
Table 7-4 – Summary of Contingency Measures
Item Trigger / Timing Outcomes
Surface water quality
� If an annual review of water quality monitoring data establishes that the project is adversely impacting receiving waters1; or
� If issues are identified by Pymore or a third party.
Pymore will undertake an investigation to establish the likely cause of the underperformance of the water management system and will implement necessary measures to mitigate the identified underperformance. Possible measures could include:
� Modifications to operational procedures.
� Using the Water Treatment Plant to treat stormwater runoff prior to discharge.
� Modifying the detention basin to include a constructed wetland to provide additional water quality treatment.
Note 1: Water quality monitoring data will be reviewed annually as part of the Annual Environmental Monitoring Report.

Kurri Kurri Battery Recycling Project
Surface Water Assessment
Project Number PA1361| Revision No. B | October 2016 Page | 53
8 CONCLUSION
This report documents a Surface Water Assessment of a proposed ULAB facility at 129 Mitchell Avenue, Kurri Kurri. The project is SSD which requires development consent under Part 4, Division 4.1 of the EP&A Act. A Development Application for SSD is required to be accompanied by an EIS. This Surface Water Assessment will be appended to the EIS for the project.
This Surface Water Assessment addresses relevant assessment requirements that have been provided by the NSW Government’s Department of Planning and Environment. These assessment requirements are discussed in detail in Section 2 of this report.
To address the assessment requirements, the following key information is provided in this report:
� A Stormwater Management Plan was developed for the project. The plan describes key management actions and infrastructure proposed to effectively manage stormwater runoff from the site. Water balance modelling was undertaken to assess the performance of the proposed stormwater management system. The proposed stormwater management plan is described in detail in Section 4.
� A Flood Risk Management Assessment was undertaken to assess the potential for the project to impact flooding on adjoining properties and the environmental risks associated with the mobilisation of hazardous material in flood waters. A 2D hydraulic model of the Swamp Creek Floodplain between Government Road and the Hunter Expressway was developed to inform this assessment. The flood risk management assessment is described in detail in Section 5.
Table 8-1(on the following page) summarises potential surface water impacts, associated management measures and predicted impacts that have been documented in this report.

Kurri Kurri Battery Recycling Project
Surface Water Assessment
Project Number PA1361| Revision No. B | October 2016 Page | 54
Table 8-1– Summary of potential impacts, associated management measures and predicted impacts.
Potential Impact Proposed Management Measures Predicted Impacts / Risks
Water Quality Impacts associated with stormwater runoff from the site hardstand and roof areas.
� All ULAB storage and processing will be undertaken in fully enclosed and bunded buildings.
� Hardstand areas will be swept daily using a street sweeper to limit the accumulation of pollutants.
� All wash-down water and water collected in building sumps will be separated from the stormwater drainage system.
� A stormwater management system will be established that captures the initial 15 mm of stormwater runoff from the site. Additional storage will be provided to store captured stormwater.
� A Water Treatment Plant will be constructed to treat captured stormwater and all wash-down water produced. Treated water will be used in the ULAB recycling process.
� The stormwater drainage system will be designed to capture any accidental spills or fire water that may be produced in the event of a major fire at the site.
Water balance model results presented in Section 4 indicate that stormwater harvesting will reduced runoff volumes by between 49% (wet year) and 81% (dry year). The calculated long term average reduction is 60% of runoff. The stormwater system is designed to capture initial runoff during a rainfall period, which is more likely to contain elevated concentrations of pollutants than runoff that occurs after substantial rainfall. As a result, the stormwater capture and harvesting system is expected to substantially reduce any pollutant loads from the facility.
The proposed water quality management measures have been established in accordance with current best practice guidelines and are therefore expected to adequately mitigate potential impacts. Pymore will implement a Surface Water Monitoring Program and will progressively improve the surface water management system to mitigate any underperformances identified by the monitoring.
Flood Impacts associated with increases to peak flows.
� Detention storage will be provided to reduce developed conditions peak flows to existing rates for the 100 year ARI and lower magnitude rainfall events.
The provision of detention storage is expected to mitigate any potential impacts associated with increases to peak flows.
Environmental Risks associated with hazardous materials becoming mobilised in floodwaters.
� All hazardous materials are to be stored and processed in fully enclosed and bunded buildings that have a minimum Finished Flood Level (FFL) of 15.6 m AHD. This provides 4.0 m freeboard to the peak 1% AEP levels and 3.0 m freeboard to the peak 0.5% AEP Levels.
A flood risk assessment concluded that environmental risks associated with hazardous materials becoming mobilised in floodwaters are negligible. This is primarily due to the site being established substantially above the 1% AEP flood level with inundation of floor levels only expected to occur in 1 in 20,000 year or larger magnitude extreme event.

Kurri Kurri Battery Recycling Project
Surface Water Assessment
Project Number PA1361| Revision No. B | October 2016 Page | 55
Potential Impact Proposed Management Measures Predicted Impacts / Risks
Flood Impacts associated with filling.
� Hydraulic modelling was undertaken to identify a fill extent that would achieve minimal flood impacts on adjoining properties.
� The detention basin and embankment will be established in cut to avoid any localised increases in surface levels.
� Any fences established to the north of the retaining wall will be low profile to minimise any impacts to flow conveyance.
Model results indicate that flood level impacts associated with the proposed filling will be limited to a 13mm increase for the 1% AEP event and range between 13 to 17mm for the 0.5% AEP and PMF events. These minor changes to peak flood levels are not expected to result in a material increase in flood risk on adjoining properties.

Kurri Kurri Battery Recycling Project
Surface Water Assessment
Project Number PA1361| Revision No. B | October 2016 Page | 56
9 REFERENCES
1) Department of Environment and Conservation NSW (2005), ‘Environmental Compliance Report: Liquid Chemical Storage, Handling and Spill Management: Part B Review of Best Practice and Regulation’
2) Department of Environment and Climate Change NSW (2007), ‘Storing and Handling Liquids: Environmental Protection: Participant’s Manual’
3) EMM Consulting Pty Limited (2016), ‘Kurri Kurri Battery Recycling Project: Preliminary Contamination Assessment’
4) Institution of Engineers Australia (1987), ‘Australian Rainfall and Runoff – A Guide to Flood Estimation’
5) Institution of Engineers Australia (2016), ‘Australian Rainfall and Runoff – A Guide to Flood Estimation’: Revision Note: this document is currently in draft form.
6) Landcom (2004), ‘Managing Urban Stormwater: Soils and Construction Volume 1 4th Edition’.
7) New South Wales Government (2005), ‘Floodplain Development Manual – The Management of Flood Liable Land’
8) Worley Parsons (2013), ‘Swamp Creek Floodplain Risk Management Study’
9) WMA Water (2010), ‘Hunter River Flood Study - Branxton to Green Rocks’

Kurri Kurri Battery Recycling Project
Surface Water Assessment
Project Number PA1361| Revision No. B | October 2016 Appendices
APPENDIX A – DETAILED SITE ALYOUT (PROVIDED BY PYMORE)

IRON COAL SODA PbSb
PASTE
PASTE
FINE GRIDSSEPERATORPASTE
FOUNDRY AREA
PK-721 (PHASE 1)
SEPARATOR
MATERIALSTORAGE
TILTINGBATTERY FEEDER
SPARELEAD BULLION
(FINISHEDPRODUCT)
PK-720a (PHASE1)
MATERIALSTORAGE
15.6m AHD FFL
BLDG. 5BLDG. 5
15.6m AHD FFL
15.6m AHD FFL
KL-710a (PHASE 2 ) KL-710b (PHASE1)
15.3m AHD FGL
15.6m AHD FFL
15.6m AHD FFL
U-L
AB
UN
LOA
DIN
G D
OC
K
BLDG. 615.3m AHD FGL BLDG. 7
S-220V-220
H-220a
H-220b
S-201
H-280
S-210
H-210
S-212
H-216
PK-2
60
V-103
H-140
BY-PASSP.P.
EVERGREENENVIRONMENTALRESOURCES INC.
PLANT BUILDING1.The contractor shall verify the necessity of an air natural drafting system inorder to maintain the inner temperature in according to the Australian safetyand occupational rules. During the hot season the hourly heat generated in theplant in operation is the following :
-Furnace area 280000 Kca l/h;-Slag demolition area 150000 Kca l/h;-Refinery area 100000 Kca l/h;-Crystallizer tower 100000 Kca l/h;
2. The building design shall include louvers capable to allow the following airintake :
-Battery breaker room 16000 Nm3/h;-Charge preparation room 25000 Nm3/h;-Furnace and refinery room 95000 Nm3/h;-Slag demolition room 12000 Nm3/h;
3. The control room shall be equipped with the hvac system and the light shallhave an intensity of 500 lux.
4. The drawing shows the main doors. Those access shall be of to kinds: theswinging type and the rolling type. The main doors shall have a glass window.spring return closing mechanism. and anti panic handle device. the drawingdoes not show any type of windows. however the window may be foreseen inaccording to the civil engineer design.
5. The building diffused lighting shall have an intensity of 250-300 lux.Emergency light are also required to maintain safe work conditions during thepossible power black out. The emergency lighting intensity will be granted of150 lux. The machinery equipments lighting and services (where it is required)will be part of detailed engineering.
6.Each column of the building shall be sized for an extra load equal to 2500 kgdue to the support of the air duct. The electric cables and the equipmentpiping. This extra load will be max at 600mm from the column surface. The roofbeam shall be sized for an extra load equal to 1500 kg (building centre line) dueto the support of air duct.
7. Building walls: the non concrete structures unless otherwise indicated shallbe realised as follows:
-Battery storage and battery breaker and crystallizer,carbon steel; epoxy painted-Foundry and refinery, aluminum or carbon steel painted.
9. The contractor shall verify the need of thermal insulation to maintaincomfortable working conditions inside the production buildings.
LEADLOADING
DOCK
GENERAL SITE LAYOUT & MACHINE ARRANGEMENT
14.40m AHD FGL
EMPLOYEESGATE 2
LOT 795LOT 797b
BLDG. 1
BLDG. 4CHANGING RM.
BLDG. 5
KKBR BUILDINGS BUILDING AREAS
H-100
MATERIALSTORAGE
LOT 797a
LOT 796
SLAG ROOM AREA
BLDG. 9BLDG. 9
³
PRES. TANK 2
AC 2
PRES. TANK 1
AC 1
AC 3FUTURE
DRYER 3
DRYER 2
DRYER 1
AIR COMPRESSOR PLANT
15m AHD FGL
CRYSTALLIZER
15.3m AHD FGL
14.4m AHD FGL
15m AHD FGL
FUTURE
FUTURE
OXYGEN PLANT
³
³

Kurri Kurri Battery Recycling Project
Surface Water Assessment
Project Number PA1361| Revision No. B | October 2016 Appendices
APPENDIX B – DETENTION STORAGE CALCULATIONS
Detention Storage Calculations (1 of 2)
Overview
Catchment AssumptionsExisting Conditions
Parameter Units Existing Catchment Impervious Area Pervious Area CommentsCatchment Area (ha) 3.5 3.2 0.3Average Slope (%) 3.5 1 1 Measured from site contoursRoughness (n) 0.05 0.015 0.05 Typical ValueInitial Loss (mm) 5 1 5 Recommended Value in Cessnock Council Stormwater Drainage Design GuidelineContinuing Loss (mm/hr) 2.5 0 2.5 Recommended Value in Cessnock Council Stormwater Drainage Design Guideline
A hydrologic model was developed using the XP-RAFTS software package. The model was applied to simulate runoff hydrographs from the site for both existing and developed conditions and to estimate the volume of detention storage required to fully mitigate any increases in peak flows that are expected to occur as a result of the project.
Developed Conditions

Kurri Kurri Battery Recycling Project
Surface Water Assessment
Project Number PA1361| Revision No. B | October 2016 Appendices
Detention Storage Calculations (2 of 2)
Rainfall AssumptionsIntensity Frequency Duration (IFD) data was sourced from AR&R (1987) for the site location. The following chart shows the resulting average rainfall intensities and IFD parameters.
Storage Assumptions
Units VolumeRetention Storage Volume (m 3 ) 520Detention Storage Volume (m 3 ) 600
ResultsEstimated peak flows from governing duration storm
No Controls With Controls5 year ARI (m 3 /s) 0.39 1.07 0.3810 year ARI (m 3 /s) 0.48 1.21 0.4720 year ARI (m 3 /s) 0.60 1.40 0.59
100 year ARI (m 3 /s) 0.82 1.71 0.81
Developed Conditions Existing Conditions Event Units
Volume of the Stormwater Capture Basin modelled as retention storageVolume calculated using the hydrologic model
Comments
Developed conditions peak flows with controls are less than peak flows for existing conditions.
Deten�on Storage Volume (600 m3) 1.5 m
0.5 m freeboard 100 year ARI Level
Basin outlet works (to be sized at Detailed
Design)
2m
Water holding embankment (2.0m high)
Spillway (to be sized at Detailed Design)
Incoming piped flows
Discharge to Swamp Creek via a swale drain
Basin Design Concept
4
1 3
1
3
1

Kurri Kurri Battery Recycling Project
Surface Water Assessment
Project Number PA1361| Revision No. B | October 2016 Appendices
APPENDIX C – FLOOD HAZARD MAPS

Kurri Kurri Battery Recycling Project
Surface Water Assessment
Project Number PA1361| Revision No. B | October 2016 Appendices

Kurri Kurri Battery Recycling Project
Surface Water Assessment
Project Number PA1361| Revision No. B | October 2016 Appendices

�


