Page 1
https://www.liverpool.ac.uk/management/people/economics/ © authors
Working Paper in Economics
# 202032
October 2020
A Natural Experiment on the Effect of Instruction Time and Quality:
Lessons for the Covid-19 Outbreak
Ismael Sanz
J.D. Tena
Page 2
1
A Natural Experiment on the Effect of
Instruction Time and Quality: Lessons for the
Covid-19 Outbreak
Ismael Sanz1 and J.D. Tena2
ABSTRACT
Exploring the impact of reducing instruction time has become a fundamental topic in education,
particularly following the covid-19 outbreak. In this paper we consider an unexpected
regulation change affecting the academic calendar of non-fee paying schools in the Madrid
region (Spain) during the 2017-2018 school year. The availability of standard cognitive tests
allows us to estimate the impact of this measure on academic performance by means of a
difference in difference regression. Although this regulation change affected just two weeks of
the school calendar, we found that it contributed to a significant deterioration of academic
performance which was particularly evident in Spanish and English. We further explore non-
linear (quantile) effects across the distribution of scores in the standardized exam finding that
the disruption of the new normative affected more to students in the upper quartile of the
distribution. Overall, we found a reduction of the gap across students in non-fee schools
together with an increase of the gap between non-fee and fee paying schools. We discuss the
implications of these results for a better understanding of the impact of school closures due to
covid-19.
Keywords: Instruction time, difference in difference, quantile regression, academic
performance.
The authors would like to give special thanks to José Montalban and Luis Pires for providing us with the data of
the external and standardized tests in the Region of Madrid and with helpful suggestions and comments for this
study. We are also grateful to Almudena Sevilla for helpful suggestions. The usual disclaimer applies. 1 Ismael Sanz, Universidad Rey Juan Carlos, Madrid, Spain. 2 J.D. Tena, University of Liverpool, United Kingdom and Università degli studi di Sassari and CRENoS, Italy.
Email: [email protected]
Page 3
2
1. Introduction
Education is considered one of the fundamental factors of economic growth and social progress
and instruction time the most obvious input in the production of education. Therefore, this issue
has attracted the attention of researchers even in the years before the covid-19 outbreak (Lavy,
2015; Cattaneo et al. 2016; Heubener et al., 2017 and Aucejo and Romano, 2016). This interest
has been multiplied with the emergency of the covid-19 crisis, which has led many countries to
implement lockdown policies with drastic alterations of instruction time in many cases (DELVE
Initiative, 2020; Burgess, 2020; Burgess and Sievertsen, 2020; Santibanez and Guarino, 2020;
Kuhfeld et al., 2020; and Goulas and Magalokonomou, 2020). However, a precise estimate of
its consequences on educational output will be only possible with the benefit of hindsight once
international databases containing post covid-19 information will be available. Even then, in
many cases it will be difficult to appraise the specific contribution of the decision to close school
doors on academic performance as this information will be contaminated by changes in other
social and economic variables related to covid-19 such as income and health.
An important difficulty in the identification of the impact of instruction time on academic
performance is the fact that students’ families, subject to regulatory constraints, self-select the
total number of instructions hours (including extracurricular activities) they need to achieve a
given academic outcome. Many papers have circumvented this issue by studying modifications
of instruction time due to political decisions (Pischke , 2007, Bellei, 2009, Huebener et al, 2017).
However, even if policy interventions were randomly allocated across schools, they are
typically announced and discussed in advance by the media. Therefore, the implementation of
these policies and their consequences could be largely anticipated by rational schools and
students before making relevant decisions.
In this paper we consider an unexpected regulation change affecting 7th to 10th grade
students in the Madrid region (Spain) during the 2017/18 school year. In particular, the new
Page 4
3
normative changed the ordinary final exam date from late to early June reducing the total
instruction time of students who passed these exams by around two weeks. Thus, failed students
received focused classes to pass resit exams during these two weeks while passed students did
not received any formal teaching but, instead, they were involved in different cultural activities.
The new regulation affected only public1 and charter schools but not private schools. We use
the fact that this region conducted standard cognitive tests in 10th grade students before and
after the regulation change for schools affected and not affected by the new regulation to
implement a difference in difference analysis. Despite the small size change in the school
calendar, just two weeks, we found that this measure contributed to a significant deterioration
of academic performance which was particularly evident in Spanish and English. In an extended
analysis we explore non-linear (quantile) effects across the distribution of scores in the
standardized exam finding that the disruption of the new normative affected more to the
students in upper quartile of the distribution. Overall, we found a reduction of the gap across
students in non-fee schools together with an increase of the gap between non-fee and fee paying
schools.
This paper proceeds as follows. The next section discusses the related literature on the
importance of instruction time. Section 3 describes the new normative. Section 4 presents the
data considered in the analysis. The empirical strategy employed is discussed in Section 5,
while Section 6 presents and discusses empirical results. The last section concludes.
2. Related Literature
It is remarkable that one of the most obvious investment in education, increasing instruction
time, has not traditionally attracted the attention of early researchers. Goodman (2014), by
quoting Berliner (1990), suggested this disinterest could be a consequence of the fact that
instructional time has been deemed as an obvious and conceptually unexciting variable in
1 Hereafter the term public school refers to state-owned non-fee schools.
Page 5
4
determining educational output. An analysis of the impact of instruction time on academic
performance can be only found in early works by Grogger (1996) and Eide and Showalter (1998)
who observed an insignificant effect of the length of the school year in the US on academic
outcome. Card and Krueger (1992) analysed the same issue considering state-level data in the
US. They found a positive significant effect on earnings, although this effect vanished once
they control for quality school variables.
However, it is the arrival of individual databases, especially the Programme for International
Student Assessment (PISA), one of the main propellers of the recent burgeoning of this
literature. Thus, Lavy (2012, 2015), Rivkin and Schiman (2015) and Cattaneo et al. (2017)
achieve identification using the variation of instruction time in different subjects by the same
student. This is at the cost of obtaining a single estimation of the causal effect for all the possible
subjects. Alternative identification approaches include, for example, the use of exogenous
political shocks (Pischke , 2007, Bellei, 2009, Huebener et al, 2017), natural experiments
(Fitzpatrick et al., 2011 and Aucejo and Romano, 2016), instrumental variables (Goodman,
2014) and laboratory experiments (Banerjee et al. 2007).
A general conclusion of all this literature is that instruction time exerts a positive and significant
effect, but of small magnitude, on educational outcome. When looking at the impact on score
tests, papers that identify causal effects by subject provide inconclusive results. Thus, for
example, while Aucejo and Romano (2011) found that instruction time exerts a higher impact
on math compared to reading, results are not significantly different in Bellei (2009). Some of
these papers also explore differences by ability which has a clear political relevance to apprise
the contribution of instruction time to reduce differences in students’ performances. However,
results are also mixing in this respect. For example, Huebener et al (2017) found more
sensitivity in low-performing students while the opposite is found in Aucejo and Romano
(2016).
One of the most critical dimensions of these analyses regard the importance of the quality of
instruction time. Banerjee et al. (2007) provide an interesting discussion on this issue. They
Page 6
5
explain that additional inputs in education will not affect educational performance unless they
address specific unmet needs at the school. In their experiment, they found that specific
programmes for remedial education and computer assisted learning exert a significant but not
highly persistent effect on students’ outcome. However, despite the importance of quality
variables, they can only be imperfectly observed in most cases. For example, Rivkin and
Schiman, (2015) use classroom environment as a proxy finding that the effect of instruction
time on academic performance is higher the higher the quality of this instruction.
The interest in the impact of instruction time on education has been further intensified with the
covid-19 outbreak which has produced unprecedented learning interruptions. Thus, recent
papers have used these types of analyses to discuss the potential impact of covid-19 school
closures (Santibanez and Guarino, 2020; Kuhfeld et al., 2020; and Goulas and Magalokonomou,
2020). In particular, Santibanez and Guarino (2020) estimate the effect of absenteeism on
cognitive and social-emotional outcomes in the state of California while Kuhfeld et al. (2020)
analyse the impact of missing schools due to absenteeism, regular summer breaks and school
closures on learning outcomes in the US. These two papers found a significant effect of missing
schools on learning outcomes. Goulas and Magalokonomou (2020) focus on the Swine flu
pandemic in Greece. As a consequence of this, the Greek government eased its school
attendance policy. Similar to our paper, the effect of this policy was not homogeneous across
students affecting more those with higher prior performance, who took more absences while
students with lower prior performance kept going to the school. They conducted a regression
analysis to show a negative correlation between attendance and performance.
We contribute to all this literature by considering one of the few examples of a natural
experiment that consists in an exogenous alteration of instruction time. More specifically, the
new regulation implied a different treatment to failed students in non fee-paying and private
schools. In the former (treatment group), students who must take resit exams, receive specific
instruction for this exam during 15 additional days. This is provided by the teachers who are
going to evaluate them. However, higher-performance state-school students, who already
Page 7
6
passed the exam, use this time for social and cultural activities. Private schools (control group)
were unaffected by this measure.
Given that all students in the Madrid region must take a standard test in the following year, a
difference in difference approach can be used to estimate the specific effect of this policy. In
principle, we should not expect this political measure to have a significant impact on academic
outcome. This is because the variation of the number of instruction days is very small compared
to the literature discussed above, which already found effects of small magnitude. Moreover,
the political shock affected both students regardless of whether or not they have to take the resit
exam. However, a distinctive feature of this variation in instruction time is that is aiming to
address specific unmet needs by students, who are supposed to be especially interested in
receiving help to pass their resit exams.
3. Background
National and regional governments steer educational policies in Spain. Although the overall
framework and guidelines are defined at the national level, most schooling decisions as well as
funding are determined at the regional level. There are three main school categories: state-
funded, charter and private schools. While the former two are funded by the state for
compulsory education, the latter is privately funded. Here, we focus on students in 9th grade
(around 14-15 years old) in the Madrid region as many of them were affected by the change in
the school calendar we analyse. Moreover, they participated in the external and standardised
test the following academic year; that is in 10th grade (final year of compulsory secondary
school).
In the 2017/18 school year the Community of Madrid changed the timing for the extraordinary
final evaluation for first time. This is a resit exam for those students who did not pass the
ordinary final exam of the subject on the first attempt. Prior to this year, the final and the
Page 8
7
extraordinary exams took place in late June and September respectively. The aim of this change
was to improve academic results, advance planning of the start of the course, more facilities for
the reconciliation of family life during the summer period and the reduction of family spending
intended for recovery activities, etc (Madrid, Regional Ministry of Education, 2018).
Importantly, bringing forward the extraordinary final exams from September to the third week
of June implied that the ordinary final exams were taken in the first week of June, two weeks
earlier than in the previous academic year. During these two weeks, students with pending
subjects attended regular classes with a lower student-to-teacher ratio, getting greater individual
attention, support activities, reinforcement and tutoring. In contrast, students who passed all
subjects in the ordinary final evaluation attended other types of cultural activities such as, for
example, visits to museums, social volunteering activities or debate tournaments. All students,
regardless of whether or not they have passed their exams, should continue attending school,
as it is established that the school calendar must involve a minimum of 175 school days for
compulsory education (fifth additional provision of the Educational Organic Law, LOE).
The modification of the extraordinary final evaluation from September 2018 to June 2018 was
decided on 27 June 2017 (Madrid Regional Ministry of Education, 2018), when the previous
course had already finished. Many schools did not realise of the calendar change until May
2018. The first evaluation of this measure by the Madrid Regional Education Council supports
this conclusion. Firstly, attendance by students who passed all subjects from the first to third
week of June was around 50%, since they did not want to participate in such activities. In fact,
the Madrid Regional Education Council (2018) approved a Recommendation after this change
pointing out that “Incentives to attend classes for all students should be improved, including
those who have obtained positive grades in the ordinary final exams.” Moreover, the Madrid
Regional Education Council (2018) continued with the first evaluation of the measure
suggesting some improvements for the next school year explicitly stating “What incentives will
have students who have succeeded in all subjects with positive evaluation in the ordinary final
call?”. Secondly, in the first evaluation of the calendar change, the Madrid Regional Education
Council concluded that the information about this new school calendar should reach the entire
educational community in the 2018/19 school year. In fact, this information did not reach the
Page 9
8
entire community as the Madrid Regional Education Council suggested by asking “What
actions will be carried out to ensure that the information of the new school calendar reaches the
schools?”. Moreover, its report proposed some possible actions to follow such as “Information
panels to the centres; institutional advertising; workshops especially aimed at families.” The
document concluded that among the “Improvement Aspects” of the change in the calendar it
should include “Attendance of students who passed all subjects in the ordinary exam” and
“Information to families”. The absenteeism of students who have passed the ordinary exams in
the last two weeks in the Region of Madrid was intensely covered by the national press2.
4. Data
4.1. External exam
Our aim is to estimate the impact of the change in school calendar on students’ performance in
the Madrid region. For this purpose we have an objective and independent measure of academic
performance. Since the 2015/16 school year, the regional government of Madrid has conducted
a standardized external exam for all 3rd and 6th grade students in the region. One year later, in
2016/17 the region extended this standardized external exam to students in 10th grade, who are
in the final year of compulsory secondary school (15-16 years old). Here, we focus on the
outcome of 10th grade exams as they include students affected by the change in the school
calendar the previous academic year The exam measures basic knowledge in four competences:
Spanish (SPA); foreign language, ,English, (ENG) ; maths (MTH) and history and geography
(H&G). The results of this exam do not have academic consequences for students beyond the
information they provide to the school (Anghel et al, 2016) but they are just used for a
diagnostic purpose. Therefore, each student’s result is recorded in a report to be delivered to
2 Spanish newspapers explicitly stated “Early end of the year for Secondary students who have not failed”or
“Generalized absenteeism after the advancement of the exams from September to June”
https://elpais.com/ccaa/2018/06/14/madrid/1528976557_605054.html
https://www.elmundo.es/madrid/2019/06/14/5d021b8cfc6c837e218b462b.html
Page 10
9
his/her parents. This is informative for schools as well as teachers, parents, and students
themselves. Furthermore, since the exams are compulsory for all students, our analysis is not
just based on a sample but on the whole census of 10th grade students in the Madrid region.
Each of the four competence tests (mathematics, Spanish, foreign language, and history and
geography) lasts 60 minutes. The exams take place in two consecutive days. In addition, all the
principals, teachers of the subjects involved, families and students complete the context
questionnaires in the days before and after the exam. These questionnaires provide information
on the socio-economic and cultural conditions of the centres for the contextualization of the
results obtained.
4.2. Description of the variables
The scores obtained in each of the four competences described above represent the dependent
variable in our analysis. Like in the Programme for International Student Assessment (PISA)
dataset, all scores have been standardized to have mean and standard deviation values equal to
500 and 100 respectively. There are also marginal differences in the number of observations for
the different exams for reasons such as, for example, illness or not arriving on time to the exam.
We provide specific estimation results for each competence. However, because our main
interest is on the overall student performance, rather that specific competences, we also
consider a principal component analysis in order to reduce the dimension of the problem. When
this methodology is applied to our data, we found that the first principal component explained
slightly over 60% of the variability of the four variables. Moreover, all the weights given to the
different variables were positive and of a similar magnitude (around 0.5). This allows us to
interpret this combination as an average of the score obtained in the four competences. We
denote this combination by pc1.
Following the survey by Hanushek and Woessmann (2011) on the determinants of student
Page 11
10
achievement, we consider three groups of control variables in the analysis. The first one
contains innate student’s characteristics. In particular, we include in this group dichotomous
variables that account for gender, immigrant and birth month. The second group of variables
includes student’s family background such as different indicators of the number of books at
home, father’s and mother’s profession as well as different parent educational attainment levels.
The third group of variables reflects institutional aspects such as tracking and repetition
(captured by whether the student followed a strong math academic course or a more applied
math course or if he/she has repeated in his/her primary and secondary education), age and
attendance to 0-2 years early pre-primary education.
Using this information, we define the treatment and the control groups to be used in the
difference in difference analysis in the following way. The treatment group before treatment
contains 10th grade public and charter school students who took the Regional exam in the
2016/17 academic year. Students in the same types of schools who took the exam in 2018/19
belong to the treatment group after treatment. Likewise, the control groups before and after
treatment are formed by students from private schools in the same periods.
The exclusion of the 2017/18 school year in our baseline analysis is because in that year the
code used in the school, family level database is different to the code used in the student level
database, and therefore the information for schools, families and students cannot be linked for
all the control variables used in the analysis. In particular, in the 2017/18 school year, apart
from the test scores, the only available information in is that provided by the students. Thus,
we lose some variables such as students’ age and birth month. We know if the student has
repeated grades but not if the retention took place in the primary or secondary level.
Furthermore, we only have very vague information on father’s and mother’s occupations that
only indicates whether they are fully employed, partially employed, unemployed or inactive.
However, as it will be shown later, we will study the robustness of our results to the inclusion
of the 2017/18 exam information.
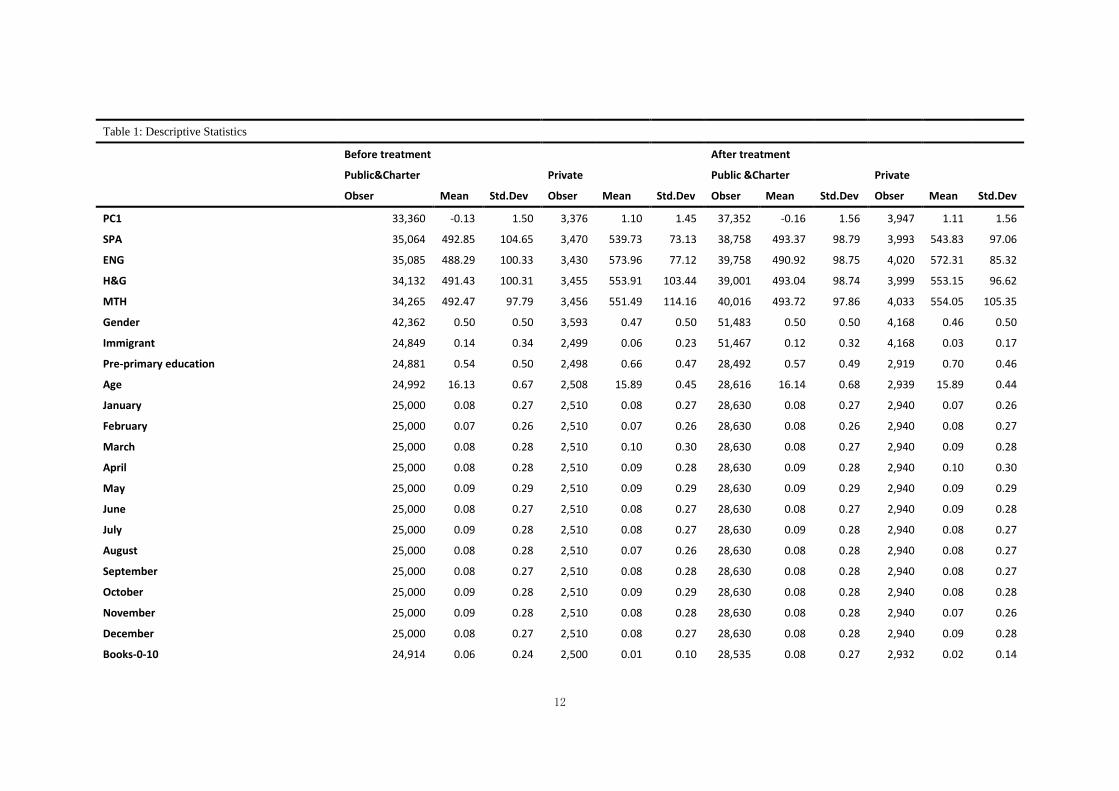
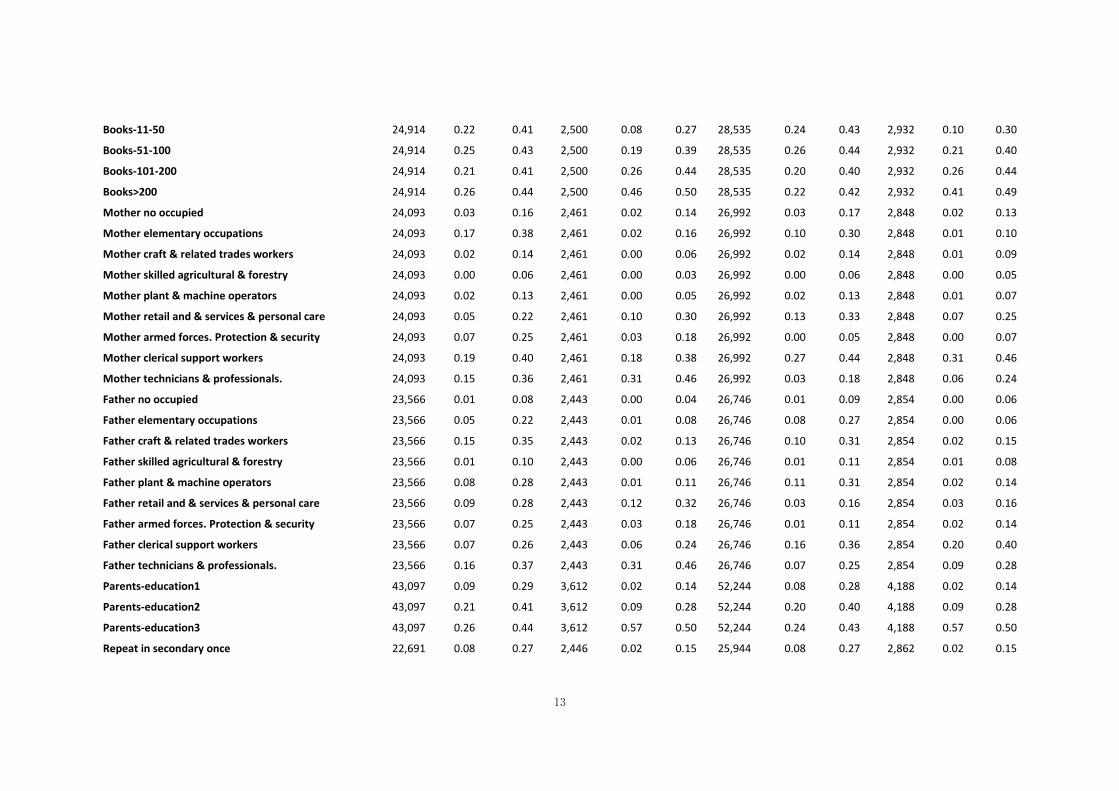
Table 1 shows descriptive statistics of all variables for the treatment and the control groups
Page 12
11
before and after the normative change. A description of these variables can be found in the
Appendix. We can observe better academic performance in all competences for private schools
compared to public and charter schools. However, students in these two types of schools are
different in a number of individual and social characteristics. For example, a higher proportion
of students in private schools attended 0-2 years early preliminary education. Immigrant
population is lower in private schools. Moreover, on average, families of students in private
schools have more books at home, wealthier occupations and a higher educational attainment.
All these differences suggest that a proper analysis requires to control for these characteristics
as well by the different schools.
Page 13
12
Table 1: Descriptive Statistics
Before treatment
After treatment
Public&Charter
Private
Public &Charter
Private
Obser Mean Std.Dev Obser Mean Std.Dev Obser Mean Std.Dev Obser Mean Std.Dev
PC1 33,360 -0.13 1.50 3,376 1.10 1.45 37,352 -0.16 1.56 3,947 1.11 1.56
SPA 35,064 492.85 104.65 3,470 539.73 73.13 38,758 493.37 98.79 3,993 543.83 97.06
ENG 35,085 488.29 100.33 3,430 573.96 77.12 39,758 490.92 98.75 4,020 572.31 85.32
H&G 34,132 491.43 100.31 3,455 553.91 103.44 39,001 493.04 98.74 3,999 553.15 96.62
MTH 34,265 492.47 97.79 3,456 551.49 114.16 40,016 493.72 97.86 4,033 554.05 105.35
Gender 42,362 0.50 0.50 3,593 0.47 0.50 51,483 0.50 0.50 4,168 0.46 0.50
Immigrant 24,849 0.14 0.34 2,499 0.06 0.23 51,467 0.12 0.32 4,168 0.03 0.17
Pre-primary education 24,881 0.54 0.50 2,498 0.66 0.47 28,492 0.57 0.49 2,919 0.70 0.46
Age 24,992 16.13 0.67 2,508 15.89 0.45 28,616 16.14 0.68 2,939 15.89 0.44
January 25,000 0.08 0.27 2,510 0.08 0.27 28,630 0.08 0.27 2,940 0.07 0.26
February 25,000 0.07 0.26 2,510 0.07 0.26 28,630 0.08 0.26 2,940 0.08 0.27
March 25,000 0.08 0.28 2,510 0.10 0.30 28,630 0.08 0.27 2,940 0.09 0.28
April 25,000 0.08 0.28 2,510 0.09 0.28 28,630 0.09 0.28 2,940 0.10 0.30
May 25,000 0.09 0.29 2,510 0.09 0.29 28,630 0.09 0.29 2,940 0.09 0.29
June 25,000 0.08 0.27 2,510 0.08 0.27 28,630 0.08 0.27 2,940 0.09 0.28
July 25,000 0.09 0.28 2,510 0.08 0.27 28,630 0.09 0.28 2,940 0.08 0.27
August 25,000 0.08 0.28 2,510 0.07 0.26 28,630 0.08 0.28 2,940 0.08 0.27
September 25,000 0.08 0.27 2,510 0.08 0.28 28,630 0.08 0.28 2,940 0.08 0.27
October 25,000 0.09 0.28 2,510 0.09 0.29 28,630 0.08 0.28 2,940 0.08 0.28
November 25,000 0.09 0.28 2,510 0.08 0.28 28,630 0.08 0.28 2,940 0.07 0.26
December 25,000 0.08 0.27 2,510 0.08 0.27 28,630 0.08 0.28 2,940 0.09 0.28
Books-0-10 24,914 0.06 0.24 2,500 0.01 0.10 28,535 0.08 0.27 2,932 0.02 0.14
Page 14
13
Books-11-50 24,914 0.22 0.41 2,500 0.08 0.27 28,535 0.24 0.43 2,932 0.10 0.30
Books-51-100 24,914 0.25 0.43 2,500 0.19 0.39 28,535 0.26 0.44 2,932 0.21 0.40
Books-101-200 24,914 0.21 0.41 2,500 0.26 0.44 28,535 0.20 0.40 2,932 0.26 0.44
Books>200 24,914 0.26 0.44 2,500 0.46 0.50 28,535 0.22 0.42 2,932 0.41 0.49
Mother no occupied 24,093 0.03 0.16 2,461 0.02 0.14 26,992 0.03 0.17 2,848 0.02 0.13
Mother elementary occupations 24,093 0.17 0.38 2,461 0.02 0.16 26,992 0.10 0.30 2,848 0.01 0.10
Mother craft & related trades workers 24,093 0.02 0.14 2,461 0.00 0.06 26,992 0.02 0.14 2,848 0.01 0.09
Mother skilled agricultural & forestry 24,093 0.00 0.06 2,461 0.00 0.03 26,992 0.00 0.06 2,848 0.00 0.05
Mother plant & machine operators 24,093 0.02 0.13 2,461 0.00 0.05 26,992 0.02 0.13 2,848 0.01 0.07
Mother retail and & services & personal care 24,093 0.05 0.22 2,461 0.10 0.30 26,992 0.13 0.33 2,848 0.07 0.25
Mother armed forces. Protection & security 24,093 0.07 0.25 2,461 0.03 0.18 26,992 0.00 0.05 2,848 0.00 0.07
Mother clerical support workers 24,093 0.19 0.40 2,461 0.18 0.38 26,992 0.27 0.44 2,848 0.31 0.46
Mother technicians & professionals. 24,093 0.15 0.36 2,461 0.31 0.46 26,992 0.03 0.18 2,848 0.06 0.24
Father no occupied 23,566 0.01 0.08 2,443 0.00 0.04 26,746 0.01 0.09 2,854 0.00 0.06
Father elementary occupations 23,566 0.05 0.22 2,443 0.01 0.08 26,746 0.08 0.27 2,854 0.00 0.06
Father craft & related trades workers 23,566 0.15 0.35 2,443 0.02 0.13 26,746 0.10 0.31 2,854 0.02 0.15
Father skilled agricultural & forestry 23,566 0.01 0.10 2,443 0.00 0.06 26,746 0.01 0.11 2,854 0.01 0.08
Father plant & machine operators 23,566 0.08 0.28 2,443 0.01 0.11 26,746 0.11 0.31 2,854 0.02 0.14
Father retail and & services & personal care 23,566 0.09 0.28 2,443 0.12 0.32 26,746 0.03 0.16 2,854 0.03 0.16
Father armed forces. Protection & security 23,566 0.07 0.25 2,443 0.03 0.18 26,746 0.01 0.11 2,854 0.02 0.14
Father clerical support workers 23,566 0.07 0.26 2,443 0.06 0.24 26,746 0.16 0.36 2,854 0.20 0.40
Father technicians & professionals. 23,566 0.16 0.37 2,443 0.31 0.46 26,746 0.07 0.25 2,854 0.09 0.28
Parents-education1 43,097 0.09 0.29 3,612 0.02 0.14 52,244 0.08 0.28 4,188 0.02 0.14
Parents-education2 43,097 0.21 0.41 3,612 0.09 0.28 52,244 0.20 0.40 4,188 0.09 0.28
Parents-education3 43,097 0.26 0.44 3,612 0.57 0.50 52,244 0.24 0.43 4,188 0.57 0.50
Repeat in secondary once 22,691 0.08 0.27 2,446 0.02 0.15 25,944 0.08 0.27 2,862 0.02 0.15
Page 15
14
Repeat in secondary more than once 22,691 0.00 0.06 2,446 0.00 0.03 25,944 0.00 0.07 2,862 0.00 0.03
Repeat in primary once 24,358 0.17 0.38 2,471 0.05 0.21 27,859 0.17 0.38 2,898 0.04 0.21
Repeat in primary more than once 24,358 0.04 0.20 2,471 0.01 0.09 27,859 0.04 0.20 2,898 0.01 0.08
Page 16
15
5. Methodology
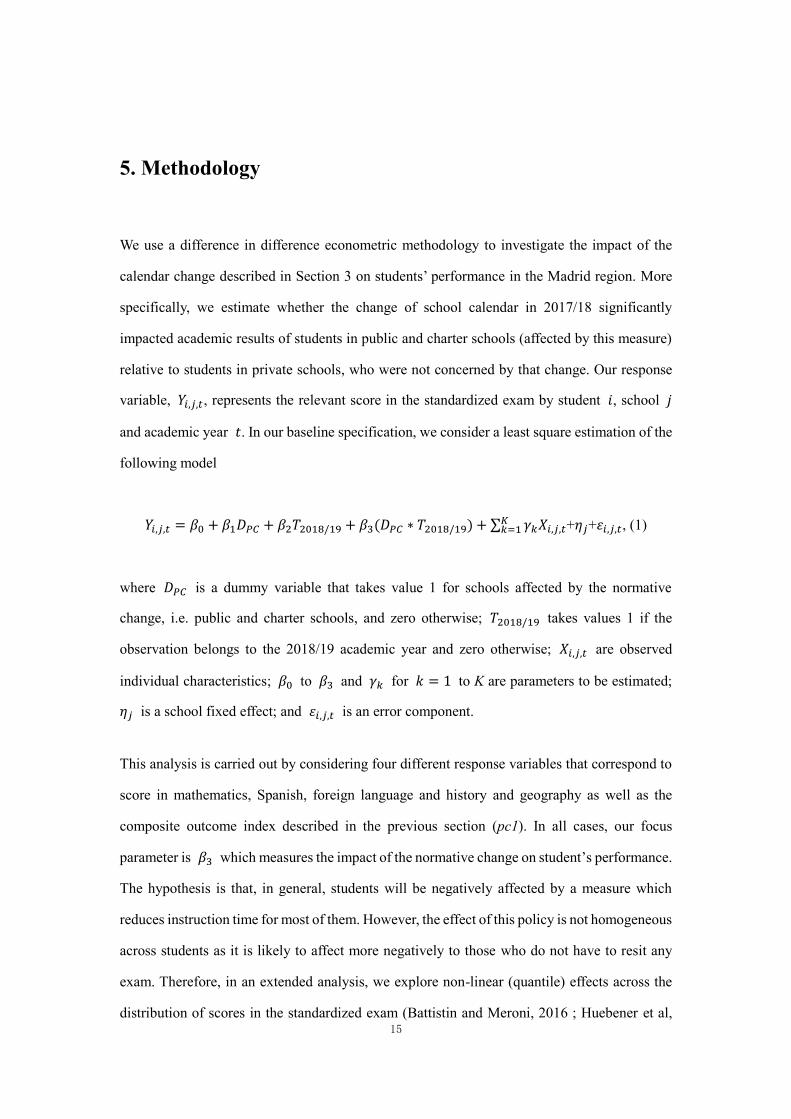
We use a difference in difference econometric methodology to investigate the impact of the
calendar change described in Section 3 on students’ performance in the Madrid region. More
specifically, we estimate whether the change of school calendar in 2017/18 significantly
impacted academic results of students in public and charter schools (affected by this measure)
relative to students in private schools, who were not concerned by that change. Our response
variable, 𝑌𝑖,𝑗,𝑡, represents the relevant score in the standardized exam by student 𝑖, school 𝑗
and academic year 𝑡. In our baseline specification, we consider a least square estimation of the
following model
𝑌𝑖,𝑗,𝑡 = 𝛽0 + 𝛽1𝐷𝑃𝐶 + 𝛽2𝑇2018/19 + 𝛽3(𝐷𝑃𝐶 ∗ 𝑇2018/19) + ∑ 𝛾𝑘𝑋𝑖,𝑗,𝑡𝐾𝑘=1 +𝜂𝑗+𝜀𝑖,𝑗,𝑡, (1)
where 𝐷𝑃𝐶 is a dummy variable that takes value 1 for schools affected by the normative
change, i.e. public and charter schools, and zero otherwise; 𝑇2018/19 takes values 1 if the
observation belongs to the 2018/19 academic year and zero otherwise; 𝑋𝑖,𝑗,𝑡 are observed
individual characteristics; 𝛽0 to 𝛽3 and 𝛾𝑘 for 𝑘 = 1 to K are parameters to be estimated;
𝜂𝑗 is a school fixed effect; and 𝜀𝑖,𝑗,𝑡 is an error component.
This analysis is carried out by considering four different response variables that correspond to
score in mathematics, Spanish, foreign language and history and geography as well as the
composite outcome index described in the previous section (pc1). In all cases, our focus
parameter is 𝛽3 which measures the impact of the normative change on student’s performance.
The hypothesis is that, in general, students will be negatively affected by a measure which
reduces instruction time for most of them. However, the effect of this policy is not homogeneous
across students as it is likely to affect more negatively to those who do not have to resit any
exam. Therefore, in an extended analysis, we explore non-linear (quantile) effects across the
distribution of scores in the standardized exam (Battistin and Meroni, 2016 ; Huebener et al,
Page 17
16
2017). By doing this, we model treatment intensity across the score distribution. More
specifically, we hypothesise that treatment students at the bottom of the performance
distribution will not be so negatively affected by the policy as those in the top of the distribution.
A possible reason is that some of the students who must take resit exams receive classes to
prepare them. Thus, we know that before the calendar change in the 2016/17 school year, 43.6%
of students passed the ordinary final exams and an additional 40.4% passed the extraordinary
final exams, making a total of 84.0%. After the normative change, there was an increase in the
number of students who passed the 10th grade (up to 85.0% in the 2017/18 school year)
6. Analysis of results
6.1. Control variables
Estimation of model (1) in the previous section involves the inclusion of many covariates that
are not the main foci of our analysis. However, this information is interesting by itself as they
inform of the determinants of students’ academic scores. Table 2 shows the estimated impact of
these control variables on scores in each competence as well as the general index pc1 under our
baseline specification (control school year 2016/17). The table also reports relevant information
on the econometric specifications, such as the inclusion of school fixed effects. Generally, the
effects of control variables are in line with the previous literature. More specifically, there is a
small negative effect for girls because their positive relative results in Spanish and English are
more than offset with the negative relative results in Math and Geography and History. The
results by gender in Spanish and Math, competences also assessed by the OECD in PISA, are
in line with the results found in international tests (OECD, 2019). Students who have attended
early school from 0-2 years score significantly better, which is consistent with previous papers
on the importance of early years in the acquisition of both cognitive and non-cognitive skills
(Felfe et al., 2015 and Heckman et al. 2010). Those students that have repeated, either in
primary or in previous course of secondary, have a significant worse performance as has been
pointed out by PISA (PISA, 2018). Even when including retention, age has a significant and
negative effect which can be explained as some students might be in a lagged academic course
Page 18
17
than their corresponding age without having being retained ( if they delay school entry or if
they come from other education systems). We also find evidence of a relative age effect as,
ceteris paribus, students born in the first months of the year tend to perform better than those
born at the end of the year (Dhuey and Bedard, 2006 and Berniell and Estrada 2020). It can be
reported a positive monotonic relationship between the number of books at home and the
student outcome. Hanushek and Woessmann (2011) show that number of books in the students’
home is used as a proxy for socio-economic background finding that the number of books at
home is the most correlated variable with academic achievement. Parents professions also
matter. For example, being technicians, associate professionals, professionals, chief
executives and senior officials increase the expected students’ outcome. In contrast, some
mothers’ or parents’ professions are significantly and negatively correlated with students’
output. This is the case of never been occupied, have elementary occupations, craft and related
trades workers, skilled agricultural and forestry workers, plant and machine operators and
assemblers or working for the armed forced.
Page 19
18
Table 2. Impact of control variables in academic scores for different competences. Difference-in-difference estimation using OLS. School years 2016/17 and
2018/19.
VARIABLES PC1 SPA ENG H&G MTH VARIABLES PC1 SPA ENG H&G MTH
Gender -0.0539*** 15.22*** 13.62*** -18.66*** -27.03*** Mother plant operators -0.062 -4.862 -4.035 1.655 -6.757*
(0.012) (0.770) (0.719) (0.812) (0.857) (0.050) (3.253) (3.046) (3.436) (3.681)
Immigrant -0.015 -5.106*** 6.919*** 0.763 -5.287*** Mother retail and services -0.109*** -6.139*** -4.534*** -6.452*** -4.132**
(0.023) (1.481) (1.382) (1.562) (1.648) (0.023) (1.471) (1.373) (1.551) (1.632)
Pre-primary education 0.0690*** 2.562*** 3.193*** 3.229*** 4.691*** Mother security & armed forces -0.069** -2.031 -4.650** -4.292* -2.506
(0.0123) (0.806) (0.752) (0.851) (0.896) (0.035) (2.271) (2.117) (2.404) (2.536)
Age -0.352*** -22.16*** -23.61*** -16.10*** -4.795*** Mother technician & professionals 0.062*** 0.959 3.527** 3.180** 4.7665***
(0.030) (1.939) (1.796) (2.050) (2.145) (0.022) (1.448) (1.357) (1.530) (1.617)
February -0.024 0.678 -0.681 -2.211 -1.330 Father no occupied -0.294*** -12.84** -21.81*** -8.332 -10.62*
(0.029) (1.939) (1.791) (2.027) (2.137) (0.079) (5.220) (4.856) (5.536) (5.761)
March -0.123*** -3.562* -6.880*** -5.225*** -5.613*** Father elementary occupations -0.095*** -2.628 -9.208*** -0.714 -4.986*
(0.029) (1.873) (1.748) (1.977) (2.085) (0.029) (1.866) (1.739) (1.971) (2.074)
April -0.114*** -4.550** -5.512*** -5.361*** -5.144** Father craft -0.044** -0.520 -7.202*** -0.483 0.345
(0.029) (1.897) (1.769) (2.002) (2.111) (0.021) (1.396) (1.304) (1.474) (1.556)
May -0.147*** -7.084*** -7.779*** -7.662*** -4.234*** Father skilled agricultural -0.207*** -11.58*** -15.54*** -6.377 0.150
(0.029) (1.919) (1.788) (2.025) (2.135) (0.060) (3.898) (3.649) (4.111) (4.336)
June -0.176*** -8.370*** -11.03*** -7.057*** -7.442*** Father plant operator -0.077*** -0.190 -4.731*** -3.645** -4.801***
(0.031) (2.025) (1.889) (2.140) (2.254) (0.023) (1.526) (1.422) (1.611) (1.694)
July -0.216*** -10.60*** -12.92*** -9.973*** -6.321*** Father retail & services 0.059** 3.131* -1.577 4.889*** 5.544***
(0.032) (2.060) (1.920) (2.174) (2.291) (0.027) (1.759) (1.645) (1.861) (1.961)
August -0.285*** -15.60*** -17.84*** -13.46*** -6.607*** Father security & armed forces 0.024 2.567 -1.179 3.829* -0.635
(0.033) (2.167) (2.022) (2.289) (2.411) (0.032) (2.114) (1.973) (3.232) (2.356)
September -0.317*** -16.49*** -19.39*** -16.50*** -5.417** Father technician & professionals 0.100*** 5.292*** 5.265*** 4.027*** 5.070***
Page 20
19
(0.035) (2.247) (2.092) (2.372) (2.495) (0.020) (1.302) (1.217) (1.375) (1.451)
October -0.333*** -17.84*** -19.93*** -18.18*** -4.994* Parents-education-2 0.130*** 4.768*** 8.998*** 7.363*** 3.950***
(0.036) (2.312) (2.154) (2.442) (2.569) (0.019) (1.265) (1.179) (1.336) (1.405)
November -0.341*** -17.99*** -20.57*** -20.06*** -3.995 Parents-education-3 0.415*** 15.05*** 27.90*** 21.56*** 16.06***
(0.037) (2.414) (2.244) (2.549) (2.680) (0.021) (1.349) (1.257) (1.424) (1.499)
December -0.444*** -24.49*** -26.25*** -21.49*** -8.558*** Repeat in Secondary -0.284*** -10.68*** -23.67*** -16.82*** -4.378
(0.039) (2.536) (2.361) (2.677) (2.815) (0.040) (2.560) (2.406) (2.738) (2.871)
Books-11-50 0.360*** 18.87*** 21.57*** 18.95*** 13.41*** Repeat in primary -0.367*** -12.21*** -24.45*** -12.70*** -18.25***
(0.031) (2.007) (1.870) (2.115) (2.234) (0.040) (2.688) (2.372) (2.706) (2.830)
Books-51-100 0.514*** 25.78*** 31.03*** 27.09*** 19.05*** Constant 5.052***
(0.505)
(0.584)
829.8***
(32.49)
842.9***
(30.09)
725.5***
(34.33)
560.9***
(35.94) (0.031) (2.023) (1.884) (2.132) (2.249) (0.505) (32.49) (30.09) (34.33) (35.94)
Books-101-200 0.708*** 33.27*** 41.01*** 37.07*** 28.68*** Number of schools 755 757 758 756 759
(0.032) (2.066) (1.926) (2.178) (2.294) Observations 43,414 44,457 44,730 44,336 44,647
Books>200 0.872*** 38.78*** 47.04*** 47.42*** 38.97*** School fixed effects YES YES YES YES YES
(0.032) (2.068) (1.926) (2.180) (2.299) R-squared 0.138 0.082 0.155 0.085 0.061
Mother no occupied -0.030 -2.996 -3.331 2.013 -2.549
(0.039) (2.548) (2.379) (2.690) (2.830)
Mother elementary occupations -0.036 -0.285 -3.232*** -1.683 -2.676*
(0.022) (1.429) (1.333) (1.508) (1.590)
Mother craft -0.072 -6.943** -2.376 -4.389 -0.389
(0.046) (2.987) (2.793) (3.160) (3.326)
Mother skilled agricultural -0.140 -10.86* -15.78** -6.727 -2.107
(0.108) (6.916) (6.360) (7.400) (7.576)
*** p<0.01, ** p<0.05, * p<0.1 Standard errors in parentheses
Page 21
20
6.2. Impact of the regulatory change
Table 3 reports the estimation of our foci parameters. Two econometric specifications were
considered. The first one corresponds to the estimation shown in table 3 as it contains the
2016/17 & 2018/19 academic years. The second econometric specification also adds the
2017/18 academic year to the estimation sample. In this case we include a specific set of dummy
variables for father and mother occupations in 2017/18 as these variables a differently defined
that year. Regardless of the econometric specification, for the composite index we find that non-
fee-paying schools dummies are positive and significant indicating that after controlling for
socio-economic status students from these school do not perform worse than those from private
schools. The 2018/19 academic year dummy is positive and significant pointing to a better
performance that year. The interaction term between academic year 2018/19 and non-fee-
paying school is negative and significant which clearly indicates that the impact of the change
in the normative regulation had a negative effect on students’ performance. More specifically,
the new normative reduce the expected score by around 0.14 standard deviation units (-0,212
divided by the 1.5 standard deviation of pc1) . It is a remarkable result given that the regulation
change only affected two weeks of classes at the end of the academic year. The normative
change had a negative impact across in each of the academic competences but it was only
significant in Spanish and English.
By competences, the inclusion of the 2017/2018 academic year matters. The effect of the two
weeks reduction is negative and significant for each of the disciples once the whole sample is
taken into consideration.
Table 3. Impact of the regulatory change on academic scores in different competences.
Difference-in-difference estimation using OLS.
School years included 2016/17 & 2018/19
VARIABLES PC1 SPA ENG H&G MTH
Test in 2018/19 0.146*** (0.042)
17.48*** (2.723)
2.864 (2.560)
-0.144 (2.872)
6.012** (3.034)
Public & Charter school 0.254 (**)
(0.114)
4.571
(3.845)
9.545
(3.625)
22.13***
(4.501)
8.215
(8.380)
Test in 2018/19 interacted
with Public & Charter school -0.212***
(0.044)
-20.74***
(2.774)
-5.463**
(2.614)
-3.114
(2.900)
-2.949
(3.100)
Observations 43,414 44,457 44,730 44,336 44,647
R-squared 0.138 0.082 0.155 0.085 0.061
School years included: 2016/17, 2017/18 & 2018/19
VARIABLES PC1 SPA ENG H&G MTH
Test in 2018/19 0.200***
(0.0341) 15.34***
(2.086) 5.552***
(2.020) 7.233***
(2.226) 9.543***
(2.345)
Page 22
21
Public & Charter school 0.295**
(0.115) 4.618
(7.077) 10.41
(6.854) 25.63***
(7.563) 10.63
(7.960)
Test in 2018/19 interacted
with Public & Charter school -0.230***
(0.0352) -16.62***
(2.151) -5.778***
(2.082) -8.488***
(2.295) -6.604***
(2.417) Observations 62,062 63,297 63,728 63,223 63,839 R-squared 0.136 0.094 0.156 0.092 0.063
*** p<0.01, ** p<0.05, * p<0.1 Standard errors in parentheses
6.3. Extended analysis
A relevant political question regards the estimation of the impact of this measure across the
score distribution. In order to do this, we follow previous contributions in the literature and
perform this analysis by means of quantile regressions (Battistin and Meroni, 2016 and
Heubener et al, 2017). We use the quantile regressions with fixed effects estimation following
the method recently proposed by Machado and Silva (2019). These authors propose an
estimator that provides information on how the regressors affect the entire conditional
distribution in a panel data setting. Table 4 shows the estimation results in the aggregate
component pc1 for quantiles 0.01, 0.25, 0.5, 0.75 and 0.99. The estimated coefficient associated
to our focus variable, test in 2018/19 interacted with Public and Charter school, shows that the
intervention becomes more negative the upper the quantile is. At least two plausible
explanations can be used to explain this heterogeneous effect. Firstly, the change in the school
calendar has a more negative effect for those students who are not lagging behind and do not
receive the remedial education (Goodman, 2017) during the weeks between the ordinary and
extraordinary final exam. A second reason is that high performing students make a better use of
instruction time and, therefore, could be more affected by its reduction (Battistin and Meroni,
2016 and Heubener et l, 2017).
Table 4. Impact of the regulatory change on academic scores in different quantiles. Difference-
in-difference estimation for the composite index PC1.
School years included 2016/17 & 2018/19
Variables Q1 Q25 Q50 Q75 Q99
Test in 2018/19 -0.331***
(0.128)
0.012
(0.053)
0.144***
(0.041)
0.282***
(0.053)
0.623***
(0.127)
Public & Charter school 0.209 (0.395)
0.241 (0.164)
0.253** (0.126)
0.266 (0.164)
0.298 (0.393)
Test in 2018/19 interacted
with Public & Charter school -0.081
(0.135)
-0.170***
(0.056)
-0.204***
(0.043)
-0.240***
(0.056)
-0.329**
(0.134)
School years included: 2016/17, 2017/18 & 2018/19
Variables Q1 Q25 Q50 Q75 Q99
Test in 2018/19 -0.254** (0.111)
0.0767* (0.045)
0.200*** (0.0342)
0.327*** (0.0443)
0.638*** (0.105)
Public & Charter school 0.460 0.340** 0.295** 0.249 0.135
Page 23
22
(0.397) (0.162) (0.123) (0.159) (0.379)
Test in 2018/19 interacted
with Public & Charter school -0.142
(0.114) -0.206***
(0.047) -0.230***
(0.035) -0.254***
(0.046) -0.314***
(0.109) *** p<0.01, ** p<0.05, * p<0.1 Standard errors in parentheses.
Page 24
23
In another extended analysis we explored if the estimated heterogeneity across students could
be explained by some specific variable. In particular, in three separate models we considered a
triple difference in difference specification where the focus variable interacts the 2018/19 test
with non-fee paying school and 1) low parent education; 2) repeat in secondary; and 3) students
who chose a strong mathematical course. However, results were not statistically significant in
any case and we do not report them.
Our last extended exercise concerns a pre-testing analysis. In particular, the underlying
assumption in a difference in difference estimation is that the difference between the control
and treatment group is due to the treatment policy. In order to validate this hypothesis,
researchers are increasingly testing for trend differences between these two groups prior to the
intervention (Kahn and Lang, 2019). Thus, we conduct a placebo test in our sample to estimate
the effect of a hypothetical intervention only affecting private schools in the 2017/18 (instead
of 2018/19) academic year. Estimation results are shown in Table 5. It can be observed that the
effect of this intervention would be positive. Furthermore, we looked at trend differences
between private and non-fee paying schools before our estimation sample started in the 2016/17
school year. This type of analysis is possible as the region of Madrid participates in the
international test of PISA of the OECD with an oversample. A naïve comparison of total scores
in the three PISA areas of knowledge, Reading, Science and Mathematics, between PISA 2012
and PISA 2015 does not show any significant performance trend difference in private compared
to non-fee paying schools. More specifically, during this period, the overall score across the
three areas of knowledge increased by 4.7 and 3.6 points in non-fee paying schools and private
schools respectively (OECD, 2013; and OECD 2016). Neither this trend nor specific trends for
each area of knowledge were significant at the conventional levels. If at all, these results
indicate that non-fee paying schools were improving even more than private schools providing
further evidence that our estimation results are not due to any previous pre-trend.
Table 5. Pre-trend test for the 2017/18 academic year. Difference-in-difference estimation using
OLS.
School years included 2016/17 & 2017/18
VARIABLES PC1 SPA ENG H&G MTH
Test in 2018/19 -0.514*** (0.058)
-10.38*** (3.392)
-33.23*** (3.491)
-31.79*** (3.797)
-19.57*** (4.037)
Public & Charter school 0.552**
(0.228)
18.22
(13.45)
12.60
(13.77)
39.25***
(15.03)
28.57*
(16.03)
Test in 2018/19 interacted
with Public & Charter school 0.151***
(0.043)
0.858
(2.503)
9.454***
(2.594)
16.69***
(2.804)
6.819**
(2.995)
Observations 39,687 40,387 40,548 40,224 40,544
R-squared 0.129 0.087 0.150 0.086 0.057
School years included: 2016/17, 2017/18 & 2018/19
VARIABLES PC1 SPA ENG H&G MTH
Page 25
24
Test in 2018/19 -0.543***
(0.053) -16.65***
(3.239) -29.22***
(3.124) -31.74***
(3.448) -22.52***
(3.614)
Public & Charter school 0.197*
(0.114) -2.552
(7.014) 8.061
(6.787) 22.11***
(7.490) 8.329
(7.886)
Test in 2018/19 interacted
with Public & Charter school 0.176*** (0.036)
5.564** (2.213)
6.858*** (2.148)
14.96*** (2.358)
7.313*** (2.485)
Observations 62,062 63,297 63,728 63,223 63,839 R-squared 0.137 0.094 0.158 0.093 0.064
*** p<0.01, ** p<0.05, * p<0.1 Standard errors in parentheses
7. Discussion and concluding remarks
In this paper we consider a quasi-natural experiment consisting in a modification of the school
calendar in the Region of Madrid. This change reduced learning time by two weeks for 42.8%
of non-fee paying school students in compulsory secondary education who passed their
ordinary exams. The remaining students were not affected by this policy. We find that this
intervention diminished the skills of students as measured by an external and standardized test.
Moreover, students in the 75th percentile of the score distribution were relatively more affected
than those in the 25th percentile by 4.4% of a standard deviation (baseline estimation in Table
4).
Whilst the policy intervention considered in this paper took place before the COVID-19
outbreak, it can be used to draw lessons for the possible impact of the school closures triggered
by this crisis. By the summer of 2020 most countries have closed schools for around 12 weeks
of face-to-face learning, a third of the 2019-20 academic year. It is commonly accepted that this
decision is causing major interruption in students’ learning. In particular, based on previous
interruptions in schools, the Royal Society DELVE Initiative (2020) estimates an impact of
between 6% SD to 10% standard deviations for the learning loss of the 12-week lockdown.
Kuhfeld et al. (2020) project the potential impacts of COVID-19 school closures on academic
achievement. They estimate that students are likely to return in fall 2020 with approximately
63-68% of the learning gains in reading relative to a typical school year and with 37-50% of
the learning gains in math. In order to properly interpret these findings, it can be considered
that learning gains in most national and international tests during one year are equal to between
one-quarter and one-third of a standard deviation (Woessman, 2016). Therefore, Kuhfeld’s et
al. projection of learning loses due to covid-19 varies from a minimum of an 8% of the standard
deviation in reading to a maximum of a 22% in math . It is remarkable that despite the relatively
small reduction of instruction time considered in this paper, we estimate a higher effect on
academic outcome than the Royal Society DELVE Initiative (2020) and in line with those of
Kuhfeld et al. (2020). Thus, our baseline estimates are also significant with an overall effect of
14% of the s.d. affecting particularly learning areas such as Spanish (-20.7% s.d) or English (-
Page 26
25
5.5% s.d.) while they are insignificant for Maths and History and Geography.
Students with a higher test scores were more affected by the policy. The calendar change
studied in this paper may differ from the school lockdown produced by COVID-19. This
lockdown is expected to exert an heterogeneous impact with a limited effect among students
from favoured backgrounds but high among lagging and disadvantaged students. It seems very
unlikely that that online education will on average replace the learning lost from school
(Bettinger et al., 2017). Wide variation in the quantity and quality of remote schooling and
home learning support between pupils and schools underlies much of the variation in learning
loss over this period. There will likely be substantial disparities between families in the extent
to which they can help their children learn. Key differences include the amount of time available
to devote to teaching, the non-cognitive skills of the parents, resources, and also the amount of
knowledge. These are relevant issues to explore in future research.
References
Anghel, B., Cabrales, A. and Carro, J.M., 2016. Evaluating a bilingual education program in
Spain: The impact beyond foreign language learning, Economic Inquiry 54 (2), 1202-1223
Aucejo, E.M. and Romano, T.F., 2016. Assessing the effect of school days and absences on
test score performance. Economic Education Review 55, 70–87.
Battistin, E. and Meroni, E.C., 2016. Should we increase instruction time in low achieving
schools? Evidence from Southern Italy. Economic Education Review 55, 39-56.
Banerjee, A.V., Cole, S., Duflo, E., Linden, L., 2007. Remedying education: evidence from
two randomized experiments in India. Quarterly Journal of Economics 122 (3), 1235–1264.
Bellei, C., 2009. Does lengthening the school day increase students' academic
achievement? Results from a natural experiment in Chile. Economic Education Review 28
(5), 629–640.
Berliner, D.C., 1990. What’s all the fuss about instructional time?, In: M. Ben-Peretz & R.
Bromme (Eds): The Nature of Time in School. Theoretical Concepts, Practitioners
Perceptions. New York: Columbia University Teachers College Press: 3-35.
Berniell, I. y Estrada, R., 2020. Poor little children: The socioeconomic gap in parental
responses to school disadvantage. Labour Economics 66.
Page 27
26
Bettinger, E. P., Fox, L., Loeb, S. and Taylor, E. S., 2017. Virtual Classrooms: How Online
College Courses Affect Student Success. American Economic Review 107 (9), 2855-75.
Burgess, S., and Sievertsen, H. H., 2020. Schools, skills, and learning: The impact of COVID-
19 on education. CEPR Policy Portal. Retrieved from https://voxeu.org/article/impact-covid-
19-education.
Burgess, S., 2020. How we should deal with the lockdown learning loss in England’s schools.
CEPR policy portal. Retrieved from https://voxeu.org/article/how-we-should-deal-lockdown-
learning-loss-england-s-schools.
Card, D. and Krueger, A., 1992. ‘Does school quality matter? Returns to education and the
characteristics of public schools in the united states’, Journal of Political Economy 100(1), 1–
40.
Cattaneo, M.A., Oggenfuss, C., Wolter, S.C., 2017. The more, the better? The impact of
instructional time on student performance. Education Economics 25, 433-445.
DELVE Initiative, 2020. Balancing the Risks of Pupils Returning to Schools. DELVE report
No. 4. Published 24 July 2020. Retrieved from https://rs-
delve.github.io/reports/2020/07/24/balancing-the-risk-of-pupils-returning-to-
schools.html.
Dhuey, E. y Bedard, K., 2006. The Persistence of Early Childhood Maturity: International
Evidence of Long-Run Age Effects. Quarterly Journal of Economics 121(4), 1437-1472.
Eide, E. and Showalter, M.H., 1998. The effect of school quality on student performance: a
quantile regression approach, Economics Letters, vol. 58(2), pp. 345–50.
Felfe, C. Nollenberger, N. and Rodríguez-Planas, N., 2015. Can’t buy mommy’s love?
Universal childcare and children’s long-term cognitive development, Journal of Population
Economics 28 (2), 393-422.
Fitzpatrick, M.D., Grissmer, D., Hastedt, S., 2011. What a difference a day makes:
estimating daily learning gains during kindergarten and first grade using a natural
experiment. Economics Education Review 30 (2), 269–279.
Goulas, S. and Megalokonomou, R., 2020. School attendance during a pandemic. Economic
Letters, 193.
Grogger, J., 1996. ‘Does school quality explain the recent black/white wage trend?’, Journal
of Labor Economics, 14(2), 231–53.
Goodman, J.S., 2014. Flaking out: student absences and snow days as disruptions of
instruction time. NBER Work. Pap., 20221.
Hanushek E. and Woessmann, L., 2011. The Economics of International Differences in
Educational Achievement, in Eric A. Hanushek, Stephen Machin and Ludger Woessmann
(Eds.): Handbook of the Economics of Education, Vol. 3, Amsterdam: North Holland, 89-200.
Heckman, JJ., Moon, SH., Pinto, R., Savelyev, P.A.m and Yavitz, A. 2010. The Rate of Return
to the High Scope Perry Preschool Program. Journal of Public Economics 94(1), 114–28.
Page 28
27
Huebener, M., Kuger, S., Marcus, J., 2017. Increased instruction hours and the widening
gap in student performance. Labour Economics, 47, 15–34.
Kahn-Lang, A. and Lang, K., 2019. The promise and pitfalls of differences-in-differences:
Reflections on 16 and pregnant and other applications. Journal of Business & Economic
Statistics 1–14.
Kuhfeld, M., Soland, J., Tarasawa, B., Johnson, A., Ruzek, E., and Liu, J., 2020. Projecting
the potential impacts of COVID-19 school closures on academic achievement.
EdWorkingPaper: 20-226. Retrieved from Annenberg Institute at Brown University:
https://doi.org/10.26300/cdrv-yw05.
Lavy, V., 2012. Expanding school resources and increasing time on task: effects of a
policy experiment in Israel on student academic achievement and behavior. NBER
Work. Pap., 18369.
Lavy, V., 2015. Do differences in schools' instruction time explain international
achievement gaps? Evidence from developed and developing countries. Economic Journal
125 (588), F397–F424.
Machado, J.A.F. and Santos Silva, J.M.C. 2019. Quantiles via Moments. Journal of
Econometrics 213(1), 145-173.
Madrid Regional Ministry of Education, 2018. Implantacion del nuevo calendario escolar
2017-18, https://www.comunidad.madrid/file/134976/download?token=oZMX1YXd
Retrieved on 30 July 2020.
Madrid Regional Education Council, 2018. Documento de propuestas sobre el nuevo
calendario escolar y el delante de las pruebas y evaluación extraordinarias.
https://bit.ly/39F1KYZ Summary in https://bit.ly/3jVGzGU
OECD 2013. PISA 2012 Results: What Makes Schools Successful? Resources, Policies and
Practices Volume IV, OECD: Paris.
OECD 2016. PISA 2015 Database. OECD: Paris.
https://www.oecd.org/pisa/data/2015database/
OECD 2019. PISA 2018 Results. Volume II, Where all Students can succeed. OECD: Paris.
Pischke, J.S., 2007. The impact of length of the school year on student performance and
earnings: evidence from the German short school years, Economic Journal, 117(4), 1216–42.
Rivkin, S.G., Schiman, J.C., 2015. Instruction time, classroom quality, and academic
achievement. Economic Journal 125 (588), F425–F448.
Santibanez, L. and Guarino, C., 2020. The Effects of Absenteeism on Cognitive and Social-
Emotional Outcomes: Lessons for COVID-19. Annenberg Institute at Brown University.
EdworkingPaper: 20-261. Retrieved from Annenberg Institute at Brown University:
https://www.edworkingpapers.com/index.php/ai20-261
Woessmann, L., 2016. The Importance of School Systems: Evidence from International
Differences in Student Achievement. Journal of Economic Perspectives 30/3, 3-32.
Page 29
28
Appendix: definitions of control variables
Gender: takes value 1 if student is female and 0 otherwise, Pre-primary education: indicates attendance to 0-2 years early pre-primary education, Age: student’s age
Immigrant: Immigrant student, January: dummy variable indicating that the student was born in January. Other months of birth are defined similarly. Books-0-10: dummy variable indicating that the total number books in the student’s home was in the
[0,10] range. Variables Books-11-50, Books-51-100, Books-101-200 and Books>200 are similarly defined. Mother no occupied: Mother has never been occupied, Mother elementary occupations: Mother performs elementary occupations, Mother craft: Mother works in the craft sector or as a related trade worker, Mother skilled agricultural: Mother works as a skilled agricultural or forestry worker, Mother plant operators: Mother is plant and machine operator or assembler; Mother retail and services: Mother works in hospitality, retail or other related services, Mother security & armed forces: Mother works in protection, security or armed forces, Mother technician & professionals: Mother is a technician, associate professional, chief executive or senior official, Mother clerical support workers: Mother is a clerical support worker. Father’s occupations are defined likewise. Parents-education1: Mother or father achieved up to compulsory Secondary school, Parents-education2: Mother or father achieved post- compulsory Secondary school, Parents-education3: Mother or parent achieved Undergraduate, Graduate or Upper Vocational Training. Repeat in secondary once, Repeat in secondary more than one, Repeat in primary once and Repeat in primary more than one are 0-1 dichotomous variables indicating whether the student has repeated once or more than one in his/her
previous primary or secondary education.