55
Hyatt Hotels Corporation Investor Fact Book Q4 2019

Hyatt Hotels Corporation Investor Fact Book
Q4 2019

2
Hyatt Hotels Corporation Q4 2019 Fact Book About the Fact Book This fact book is a summary of Hyatt Hotels Corporation’s (the “Company,” “we,” “our” or “us”) historical financial and operational information. As used in this Fact Book, the terms “Company,” “we,” “us,” or “our” mean Hyatt Hotels Corporation and its consolidated subsidiaries. This fact book does not provide the Company’s consolidated financial information and tables. You may access any filed documents at the SEC’s website at www.sec.gov or at Hyatt’s Investor Relations website at http://investors.hyatt.com. Table of Contents Hyatt Hotels Corporation Profile 3
Definitions 4
Segment Realignment 4
Unaudited Historical Segment Information 4
Corporate History 5
Common Dividend Information 10
Segment Financial Summary - Revenues – Adjusted Revenues 11
Segment Financial Summary - Adjusted EBITDA 14
Fee Summary 17
Managed and Franchised Hotels 19
System-wide Comparable Managed and Franchised Hotels Statistics 21
Owned and Leased Hotels 23
Comparable Owned and Leased Hotels Statistics 26
Total Americas Managed and Franchised Hotels 30
Americas Comparable Managed and Franchised Hotels Statistics 33
Total ASPAC Managed and Franchised Hotels 36
ASPAC Comparable Full Service Managed and Franchised Hotels Statistics 38
Total EAME/SW Asia Managed and Franchised Hotels 40
EAME/SW Asia Comparable Full Service Managed and Franchised Hotels Statistics 42
System-wide Comparable Brand Statistics 45
Comparable Owned and Leased Hotels Operating Margin and Owned and Leased Hotels Operating Margin 53
3
Hyatt Hotels Corporation Profile Hyatt Hotels Corporation is a global hospitality company with widely recognized, industry leading brands and a tradition of innovation developed over our more than sixty-year history. Our purpose is to care for people so they can be their best. Our goal is to deliver distinctive experiences for our guests. Our shared core values include respect, integrity, humility, empathy, creativity and fun. Our purpose, goal and values are brought to life by our colleagues, whom we refer to as the Hyatt family. We believe that our colleagues embody our purpose of caring for people, including each other, our guests and ultimately our owners. This commitment to genuine service and care is what differentiates us and drives guest preference.
Hyatt Hotels Corporation, headquartered in Chicago, is a leading global hospitality company with a portfolio of 20 premier brands. As of December 31, 2019, the Company's portfolio included more than 900 hotel, all-inclusive, and wellness resort properties in 65 countries across six continents. The Company's purpose to care for people so they can be their best informs its business decisions and growth strategy and is intended to attract and retain top employees, build relationships with guests and create value for shareholders. The Company's subsidiaries develop, own, operate, manage, franchise, license or provide services to hotels, resorts, branded residences, vacation ownership properties, and fitness and spa locations, including under the Park Hyatt®, Miraval®, Grand Hyatt®, Alila®, Andaz®, The Unbound Collection by Hyatt®, Destination®, Hyatt Regency®, Hyatt®, Hyatt Ziva™, Hyatt Zilara™, Thompson Hotels®, Hyatt Centric®, Caption by Hyatt, Joie de Vivre®, Hyatt House®, Hyatt Place®, tommie™, Hyatt Residence Club® and Exhale® brand names, and operates the World of Hyatt® loyalty program that provides distinct benefits and exclusive experiences to its valued members. For more information, please visit www.hyatt.com. Our colleagues are more than 151,000 individuals working at our corporate and regional offices and our managed, franchised and owned properties around the world.
4
Definitions In this presentation, we have referred to Adjusted EBITDA and Adjusted Revenues. Adjusted EBITDA and Adjusted Revenues, as we define are non-GAAP measures. For our definition of Adjusted EBITDA and a reconciliation of consolidated Adjusted EBITDA to EBITDA and a reconciliation of EBITDA to net income (loss) attributable to Hyatt Hotels Corporation, please refer to Part II, Item 7 “Management’s Discussion and Analysis of Financial Condition and Results of Operations – Key Business Metrics Evaluated by Management – Adjusted EBITDA” of our annual report on Form 10-K or the information posted on the Investor Relations page of the Company’s website, which can be accessed at http://www.hyatt.com and by selecting the Investor Relations link located at the bottom of the page (or http://investors.hyatt.com). Please also see Hyatt’s investor relations website at http://investors.hyatt.com under Investor Relations – Financial Information – Non-GAAP Reconciliations for a reconciliation of various non-GAAP measures to their corresponding GAAP measures presented on a quarterly basis. Effective January 1, 2016, our definition of Adjusted EBITDA has been updated to exclude stock-based compensation expense, to facilitate comparison with our competitors. We have applied this change in the definition of Adjusted EBITDA to historical results to allow for comparability between the periods presented. Effective January 1, 2018, we made two modifications to our definition of Adjusted EBITDA with the implementation of ASU 2014-09 Revenue from Contracts with Customers. Our definition has been updated to exclude Contra revenue which was previously recognized as amortization expense. As this is strictly a matter of financial presentation, we have excluded Contra revenue in order to be consistent with our prior treatment and to reflect the way in which we manage our business. We have also excluded revenues for the reimbursement of costs incurred on behalf of managed and franchised properties and costs incurred on behalf of managed and franchised properties. These revenues and costs previously netted to zero within Adjusted EBITDA. Under ASU 2014-09, the recognition of certain revenue differs from the recognition of related costs, creating timing differences that would otherwise impact Adjusted EBITDA. We have not changed our management of these revenues or expenses, nor do we consider these timing differences to be reflective of our core operations. These changes reflect how our management evaluates each segment’s performance and also facilitate comparison with our competitors. We have applied this change to 2017 quarterly and year end historical results to allow for comparability between the periods presented. Periods 2016 and prior do not reflect changes related to ASU 2014-09. Beginning in 2019, all RevPAR percentage changes are in constant dollars. Constant dollar currency, as we define it, is a non-GAAP measure. Prior to 2019, RevPAR percentage changes are on an “as reported” basis and constant currency basis as noted. For the definition of terms used in this fact book and not defined herein, please see the section titled “DEFINITIONS” of both our most recent earnings release and our earnings release for the relevant fiscal period. All of our earnings releases have been filed on a current report on Form 8-K and can be accessed at the SEC’s website at www.sec.gov or at Hyatt’s investor relations website at http://investors.hyatt.com. Segment Realignment Our results for periods beginning after October 1, 2012 reflect the segment structure of our organization following our realignment, which was effective during the fourth quarter of 2012. Segment results discussed here for the fiscal years 2009, 2010, 2011 and the first three quarters of 2012, have been recast to discuss our results as if our new operating structure had existed in that period. Unaudited Historical Segment Information All historical financial information included herein is unaudited. We have recast our unaudited historical segment information to reflect our reportable segments following our 2012 realignment as if they existed for those prior periods. Our consolidated results were not affected by our change in reportable segments. The unaudited financial information herein is not intended as a substitute for the segment information within the footnotes to the financial statements that have been reported in the Company’s Form 10-Ks.

5
Corporate Highlights 1957 Jay Pritzker purchases the very first Hyatt House hotel from business partners, Mr. Hyatt von Dehn and Mr. Jack Dyer Crouch. The small motor hotel is adjacent to the Los Angeles International Airport in Los Angeles, Calif. 1962 Hyatt goes public, changing its name to Hyatt Corporation. 1963 Advertised as “The World’s First Fly-In Hotels”, Hyatt has three divisions: Hyatt House hotels, Hyatt Chalet motels, and Hyatt Lodges. The properties are primarily in the western United States, but in 1963 Hyatt expands east with a property in Lincolnwood, Ill. near the Pritzker’s home. Hyatt creates an innovative program directed towards executive secretaries responsible for travel arrangements called HERS (Hyatt Executive Reservation Secretaries). 1964 The Company establishes three new regional sales offices, serving Northern California, Southern California and greater Chicago and the Midwest. A toll-free, direct reservation line to Hyatt House Hotels is set up for approximately three-dozen major cities. 1967 The first “Regency” is introduced in Atlanta, Ga. Its first major John Portman designed hotel, Hyatt Regency Atlanta features original, groundbreaking design with a dramatic, 21-story atrium lobby. The revolutionary architecture spawns scores of atrium lobbies around the world, effectively changing the course of the lodging industry and reshaping the Hyatt brand as an innovative and significant global hospitality leader. 1968 In 1968, Hyatt International forms and subsequently becomes a separate public company. 1969 Hyatt Regency Hong Kong welcomes its first guests in 1969 as the first international Hyatt hotel. 1971 Hyatt Regency O’Hare opens its doors. 1972 The Company opens a central reservations office with an 800 number in Omaha, Neb. 1973 Hyatt Regency San Francisco opens its doors. 1976 The Company manages a total of more than 50 hotels. The first Regency Club opens. 1977 Hyatt headquarters moves to Chicago, first to an airport location and later downtown.

6
1979 Hyatt Corporation is taken private by the Pritzker family business interests. 1980 The Company introduces the Grand Hyatt brand as it opens Grand Hyatt New York. Additionally, the Company adds the Park Hyatt brand to its portfolio and solidifies its entry into the luxury resort market with the opening of Hyatt Regency Maui Resort & Spa in Hawaii. Hyatt Regency Chicago opens its west tower, becoming the largest hotel in Chicago with more than 2,000 guestrooms. 1982 Hyatt International is taken private by the Pritzker family business interests. 1987 Hyatt Gold Passport makes its debut. 1988 Camp Hyatt is introduced. 1990s The Company emphasizes the Hyatt touch, placing the tag line “Feel the Hyatt Touch” on Hyatt’s advertising, featuring the new Hyatt crescent logo. The crescent shape is meant to symbolize Hyatt’s “sunrise-to-sunset service.” Hyatt.com is launched and Hyatt Residence Club is born. 1998 Grand Hyatt Shanghai becomes the world’s highest hotel, occupying floors 53–87 of an 88-story tower. 2004 Substantially all hospitality assets are consolidated under a single identity, Global Hyatt Corporation. In December, Hyatt announces it will acquire AmeriSuites, an upscale chain of all suite business class hotels, from affiliates of the Blackstone Group. The AmeriSuites properties are later rebranded as Hyatt Place in 2006. 2005 Hyatt’s corporate office moves into the newly opened Hyatt Center building in downtown Chicago. 2006 Hyatt Place brand debuts in Lombard, Ill. Hyatt acquires a second select service brand, Summerfield Suites, and rebrands the properties to Hyatt Summerfield Suites. 2007 Hyatt introduces the Andaz brand and opens its first hotel without the Hyatt name, the Andaz Liverpool Street in London.
7
2008 Hyatt sells Microtel Inns & Suites and Hawthorn Suites hotel brands to Wyndham Worldwide. Park Hyatt Shanghai takes the title of world’s highest hotel, occupying floors 79–93 of the 101-story Shanghai World Financial Center. 2009 Global Hyatt Corporation changes its name to Hyatt Hotels Corporation. In May, Hyatt launches Hyatt Concierge, becoming the first hospitality company in the world to deploy a designated concierge site on Twitter. In November, Hyatt completes an initial public offering of Class A common stock which begins trading publicly on the New York Stock Exchange under the symbol H. Hyatt at Olive 8 opens and receives the LEED® Silver rating from the U.S. Green Building Council (USGBC), a first for hotel/condominium buildings in the Seattle area. Hyatt at Olive 8 hotel is also one of only 20 hotels in the U.S. to be officially designated "green" by the LEED (Leadership in Energy and Environmental Design) Green Building Rating System. 2010 Hyatt introduces the Hyatt Card, a collaboration with Visa. 2011 Hyatt announces its select service brands are expanding internationally. Hyatt announces that one of its wholly owned subsidiaries acquired a portfolio of assets from LodgeWorks, L.P. and its private equity partners. The transaction includes the purchase of 20 hotels and the management or franchise rights to an additional four hotels. Key members of the LodgeWorks management and development team join Hyatt as part of the transaction. Park Hyatt Paris-Vendôme is awarded a five-star classification of the highest distinction - it is named by the government as one of eight official palace hotels in France. The Company introduces Hyatt Thrive (thrive.hyatt.com), Hyatt's global corporate responsibility platform. 2012 Hyatt evolves its extended-stay brand into a distinctive new hotel concept - Hyatt House®. As a part of the rebranding, all Hyatt Summerfield Suites and 15 Hotel Sierra properties undergo official name and signage changes.
In May, Hyatt completes an approximately $190 million acquisition of its first hotel in Mexico City. Hyatt’s select service brands make its international debut with the opening of Hyatt Place San Jose/Pinares in Costa Rica. Effective October 1, Hyatt realigns its corporate and regional operations.

8
2013 Hyatt acquires The Driskill, a historic landmark hotel in Austin, Texas for approximately $85 million. Hyatt acquires The Peabody Orlando hotel for approximately $717 million in October and rebrands the 1,641-room hotel as Hyatt Regency Orlando. Hyatt Ziva and Hyatt Zilara debut in Mexico as the Company’s first all-inclusive resort brands, marking Hyatt’s entry into the fast growing, all-inclusive segment. 2014 In March, Hyatt closes the sale of 10 Hyatt, Hyatt Place and Hyatt House hotels, totaling 1,560 rooms, for approximately $313 million. Hyatt hosts its first Investor Meeting in Company history. Hyatt Place Shenzhen Dongmen opens in May, marking the official arrival of the Hyatt Place brand in China. Park Hyatt New York opens its doors in August as the flagship hotel of the globally recognized Park Hyatt brand. The Company closes the sale of Hyatt Residential Group in October for approximately $220 million. During the fourth quarter, Hyatt sells 43 select service hotels (5,581 rooms) for approximately $643 million. 2015 In January, Hyatt introduces Hyatt Centric, a new, full service lifestyle brand designed for business and leisure travelers. Hyatt Centric The Loop Chicago opens its doors in April, marking the first hotel launched under the Hyatt Centric brand. The first combined Hyatt Place and Hyatt House hotels open under one roof in September in Charleston, S.C. 2016 In March, Hyatt announces the launch of The Unbound Collection by Hyatt, a global collection of unique and independent stay experiences. Hyatt completes the acquisition of the 380-room Thompson Miami Beach hotel in April for approximately $238 million and rebrands the hotel as The Confidante as part of The Unbound Collection by Hyatt. In July, the Company completes the acquisition of the Royal Palms Resort and Spa in Arizona (119 rooms) for $88 million and rebrands the hotel as part of The Unbound Collection by Hyatt.
9
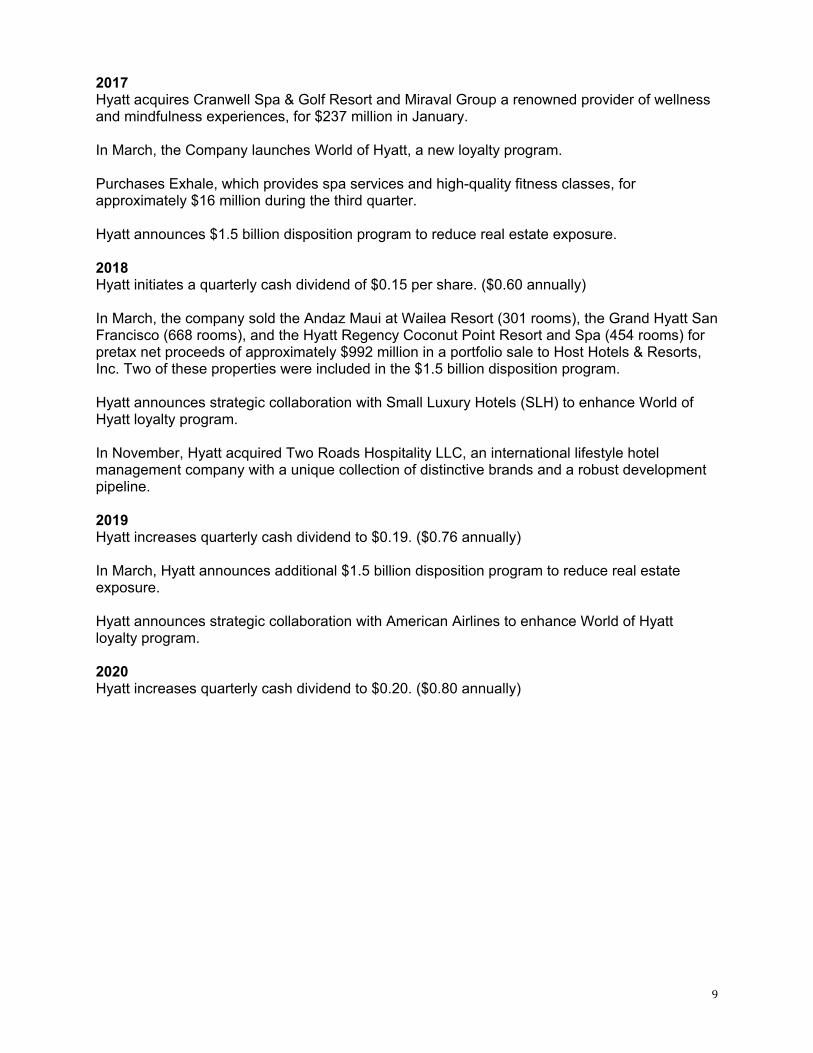
2017 Hyatt acquires Cranwell Spa & Golf Resort and Miraval Group a renowned provider of wellness and mindfulness experiences, for $237 million in January. In March, the Company launches World of Hyatt, a new loyalty program. Purchases Exhale, which provides spa services and high-quality fitness classes, for approximately $16 million during the third quarter. Hyatt announces $1.5 billion disposition program to reduce real estate exposure. 2018 Hyatt initiates a quarterly cash dividend of $0.15 per share. ($0.60 annually) In March, the company sold the Andaz Maui at Wailea Resort (301 rooms), the Grand Hyatt San Francisco (668 rooms), and the Hyatt Regency Coconut Point Resort and Spa (454 rooms) for pretax net proceeds of approximately $992 million in a portfolio sale to Host Hotels & Resorts, Inc. Two of these properties were included in the $1.5 billion disposition program. Hyatt announces strategic collaboration with Small Luxury Hotels (SLH) to enhance World of Hyatt loyalty program. In November, Hyatt acquired Two Roads Hospitality LLC, an international lifestyle hotel management company with a unique collection of distinctive brands and a robust development pipeline. 2019 Hyatt increases quarterly cash dividend to $0.19. ($0.76 annually) In March, Hyatt announces additional $1.5 billion disposition program to reduce real estate exposure. Hyatt announces strategic collaboration with American Airlines to enhance World of Hyatt loyalty program. 2020 Hyatt increases quarterly cash dividend to $0.20. ($0.80 annually)

10
Common Dividend Declared Ex-Date Record Payable Amount Type 2/13/20 2/25/20 2/26/20 3/09/20 0.20 U.S. Currency Total dividends in 2020: 0.20 Declared Ex-Date Record Payable Amount Type 2/13/19 2/26/19 2/27/19 3/11/19 0.19 U.S. Currency 5/16/19 5/28/19 5/29/19 6/10/19 0.19 U.S. Currency 7/31/19 8/26/19 8/27/19 9/9/19 0.19 U.S. Currency 10/30/19 11/25/19 11/26/19 12/9/19 0.19 U.S Currency Total dividends in 2019: 0.76 2/14/18 3/21/18 3/22/18 3/29/18 0.15 U.S. Currency 5/16/18 6/18/18 6/19/18 6/28/18 0.15 U.S. Currency 7/31/18 9/5/18 9/6/18 9/20/18 0.15 U.S. Currency 10/30/18 11/27/18 11/28/18 12/10/18 0.15 U.S. Currency Total dividends in 2018: 0.60
11
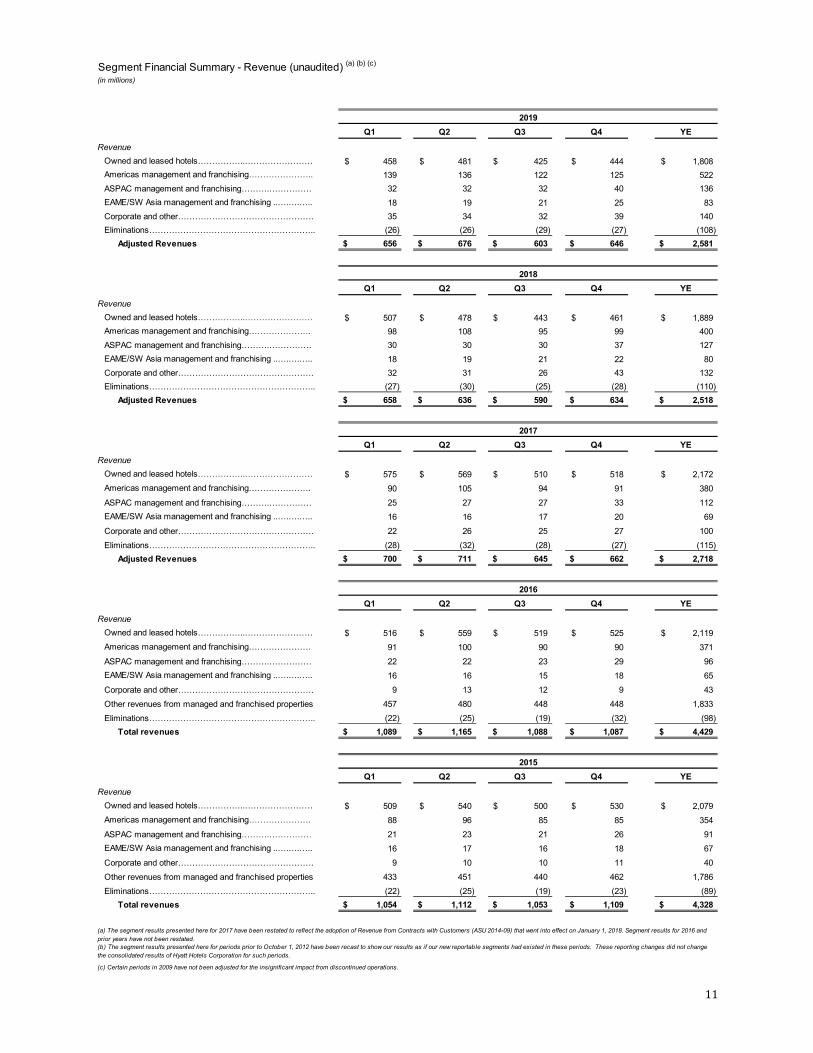
Segment Financial Summary - Revenue (unaudited) (a) (b) (c)
(in millions)
2019Q1 Q2 Q3 Q4 YE
RevenueOwned and leased hotels……………..…………………… 458$ 481$ 425$ 444$ 1,808$ Americas management and franchising………………….. 139 136 122 125 522 ASPAC management and franchising……….…………… 32 32 32 40 136 EAME/SW Asia management and franchising ..….….….. 18 19 21 25 83 Corporate and other………………………………………… 35 34 32 39 140 Eliminations………………………………………………….. (26) (26) (29) (27) (108)
Adjusted Revenues 656$ 676$ 603$ 646$ 2,581$
2018Q1 Q2 Q3 Q4 YE
RevenueOwned and leased hotels……………..…………………… 507$ 478$ 443$ 461$ 1,889$ Americas management and franchising…………………. 98 108 95 99 400 ASPAC management and franchising……….…………… 30 30 30 37 127 EAME/SW Asia management and franchising ..….….….. 18 19 21 22 80 Corporate and other………………………………………… 32 31 26 43 132 Eliminations………………………………………………….. (27) (30) (25) (28) (110)
Adjusted Revenues 658$ 636$ 590$ 634$ 2,518$
2017Q1 Q2 Q3 Q4 YE
RevenueOwned and leased hotels……………..…………………… 575$ 569$ 510$ 518$ 2,172$ Americas management and franchising…………………. 90 105 94 91 380 ASPAC management and franchising……….…………… 25 27 27 33 112 EAME/SW Asia management and franchising ..….….….. 16 16 17 20 69 Corporate and other………………………………………… 22 26 25 27 100 Eliminations………………………………………………….. (28) (32) (28) (27) (115)
Adjusted Revenues 700$ 711$ 645$ 662$ 2,718$
2016Q1 Q2 Q3 Q4 YE
RevenueOwned and leased hotels……………..…………………… 516$ 559$ 519$ 525$ 2,119$ Americas management and franchising…………………. 91 100 90 90 371 ASPAC management and franchising……….…………… 22 22 23 29 96 EAME/SW Asia management and franchising ..….….….. 16 16 15 18 65 Corporate and other………………………………………… 9 13 12 9 43 Other revenues from managed and franchised properties 457 480 448 448 1,833 Eliminations………………………………………………….. (22) (25) (19) (32) (98)
Total revenues 1,089$ 1,165$ 1,088$ 1,087$ 4,429$
2015Q1 Q2 Q3 Q4 YE
RevenueOwned and leased hotels……………..…………………… 509$ 540$ 500$ 530$ 2,079$ Americas management and franchising…………………. 88 96 85 85 354 ASPAC management and franchising……….…………… 21 23 21 26 91 EAME/SW Asia management and franchising ..….….….. 16 17 16 18 67 Corporate and other………………………………………… 9 10 10 11 40 Other revenues from managed and franchised properties 433 451 440 462 1,786 Eliminations………………………………………………….. (22) (25) (19) (23) (89)
Total revenues 1,054$ 1,112$ 1,053$ 1,109$ 4,328$
(c) Certain periods in 2009 have not been adjusted for the insignificant impact from discontinued operations.
(a) The segment results presented here for 2017 have been restated to reflect the adoption of Revenue from Contracts with Customers (ASU 2014-09) that went into effect on January 1, 2018. Segment results for 2016 and prior years have not been restated.(b) The segment results presented here for periods prior to October 1, 2012 have been recast to show our results as if our new reportable segments had existed in these periods. These reporting changes did not change the consolidated results of Hyatt Hotels Corporation for such periods.
12
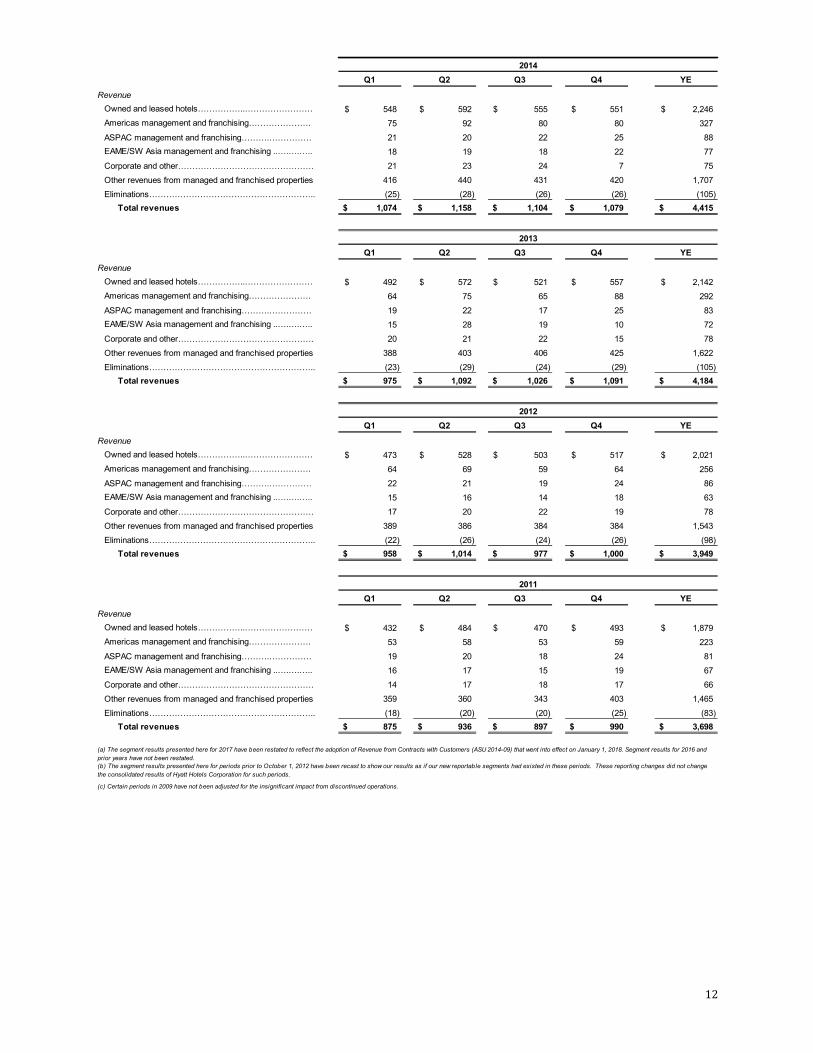
2014Q1 Q2 Q3 Q4 YE
RevenueOwned and leased hotels……………..…………………… 548$ 592$ 555$ 551$ 2,246$ Americas management and franchising…………………. 75 92 80 80 327 ASPAC management and franchising……….…………… 21 20 22 25 88 EAME/SW Asia management and franchising ..….….….. 18 19 18 22 77 Corporate and other………………………………………… 21 23 24 7 75 Other revenues from managed and franchised properties 416 440 431 420 1,707 Eliminations………………………………………………….. (25) (28) (26) (26) (105)
Total revenues 1,074$ 1,158$ 1,104$ 1,079$ 4,415$
2013Q1 Q2 Q3 Q4 YE
RevenueOwned and leased hotels……………..…………………… 492$ 572$ 521$ 557$ 2,142$ Americas management and franchising…………………. 64 75 65 88 292 ASPAC management and franchising……….…………… 19 22 17 25 83 EAME/SW Asia management and franchising ..….….….. 15 28 19 10 72 Corporate and other………………………………………… 20 21 22 15 78 Other revenues from managed and franchised properties 388 403 406 425 1,622 Eliminations………………………………………………….. (23) (29) (24) (29) (105)
Total revenues 975$ 1,092$ 1,026$ 1,091$ 4,184$
2012Q1 Q2 Q3 Q4 YE
RevenueOwned and leased hotels……………..…………………… 473$ 528$ 503$ 517$ 2,021$ Americas management and franchising…………………. 64 69 59 64 256 ASPAC management and franchising……….…………… 22 21 19 24 86 EAME/SW Asia management and franchising ..….….….. 15 16 14 18 63 Corporate and other………………………………………… 17 20 22 19 78 Other revenues from managed and franchised properties 389 386 384 384 1,543 Eliminations………………………………………………….. (22) (26) (24) (26) (98)
Total revenues 958$ 1,014$ 977$ 1,000$ 3,949$
2011Q1 Q2 Q3 Q4 YE
RevenueOwned and leased hotels……………..…………………… 432$ 484$ 470$ 493$ 1,879$ Americas management and franchising…………………. 53 58 53 59 223 ASPAC management and franchising……….…………… 19 20 18 24 81 EAME/SW Asia management and franchising ..….….….. 16 17 15 19 67 Corporate and other………………………………………… 14 17 18 17 66 Other revenues from managed and franchised properties 359 360 343 403 1,465 Eliminations………………………………………………….. (18) (20) (20) (25) (83)
Total revenues 875$ 936$ 897$ 990$ 3,698$
(c) Certain periods in 2009 have not been adjusted for the insignificant impact from discontinued operations.
(a) The segment results presented here for 2017 have been restated to reflect the adoption of Revenue from Contracts with Customers (ASU 2014-09) that went into effect on January 1, 2018. Segment results for 2016 and prior years have not been restated.(b) The segment results presented here for periods prior to October 1, 2012 have been recast to show our results as if our new reportable segments had existed in these periods. These reporting changes did not change the consolidated results of Hyatt Hotels Corporation for such periods.

13
2010Q1 Q2 Q3 Q4 YE
Revenue
Owned and leased hotels……………..…………………… 451$ 483$ 455$ 470$ 1,859$ Americas management and franchising…………………. 47 53 49 50 199
ASPAC management and franchising……….…………… 14 17 17 23 71 EAME/SW Asia management and franchising ..….….….. 16 16 13 20 65
Corporate and other………………………………………… 11 12 11 11 45
Other revenues from managed properties……………….. 322 330 352 364 1,368
Eliminations………………………………………………….. (20) (22) (18) (20) (80) Total revenues 841$ 889$ 879$ 918$ 3,527$
2009Q1 Q2 Q3 Q4 YE
Revenue
Owned and leased hotels……………..…………………… 416$ 459$ 438$ 468$ 1,780$ Americas management and franchising…………………. 46 49 44 48 187
ASPAC management and franchising……….…………… 11 13 12 20 56 EAME/SW Asia management and franchising ..….….….. 14 14 13 19 60
Corporate and other………………………………………… 16 13 10 10 49
Other revenues from managed properties……………….. 303 320 309 346 1,278
Eliminations………………………………………………….. (17) (21) (20) (22) (80) Total revenues 789$ 847$ 806$ 889$ 3,330$
(c) Certain periods in 2009 have not been adjusted for the insignificant impact from discontinued operations.
(a) The segment results presented here for 2017 have been restated to reflect the adoption of Revenue from Contracts with Customers (ASU 2014-09) that went into effect on January 1, 2018. Segment results for 2016 and prior years have not been restated.(b) The segment results presented here for periods prior to October 1, 2012 have been recast to show our results as if our new reportable segments had existed in these periods. These reporting changes did not change the consolidated results of Hyatt Hotels Corporation for such periods.
14
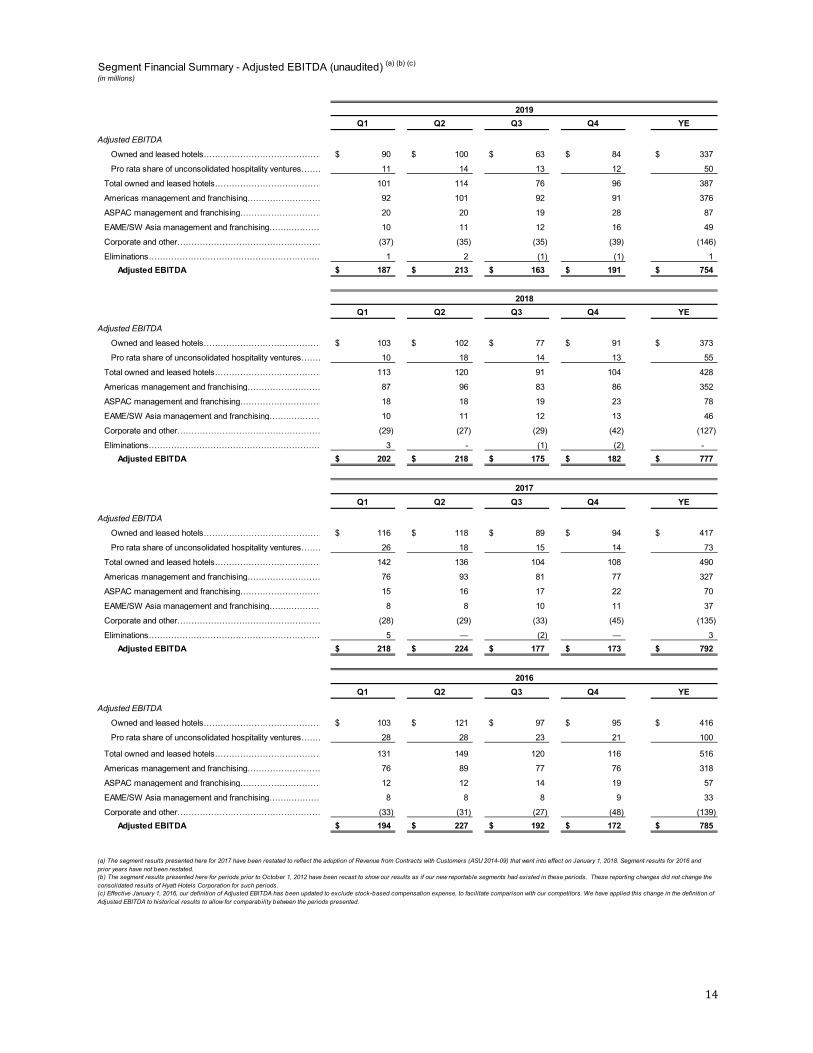
Segment Financial Summary - Adjusted EBITDA (unaudited) (a) (b) (c)
(in millions)
2019Q1 Q2 Q3 Q4 YE
Adjusted EBITDA
Owned and leased hotels…………………………………… 90$ 100$ 63$ 84$ 337$
Pro rata share of unconsolidated hospitality ventures……… 11 14 13 12 50
Total owned and leased hotels………………………………… 101 114 76 96 387
Americas management and franchising……………………… 92 101 92 91 376
ASPAC management and franchising………………………… 20 20 19 28 87
EAME/SW Asia management and franchising…….………… 10 11 12 16 49
Corporate and other…………………………………………… (37) (35) (35) (39) (146)
Eliminations…………………………………………………….. 1 2 (1) (1) 1 Adjusted EBITDA 187$ 213$ 163$ 191$ 754$
2018Q1 Q2 Q3 Q4 YE
Adjusted EBITDA
Owned and leased hotels…………………………………… 103$ 102$ 77$ 91$ 373$
Pro rata share of unconsolidated hospitality ventures……… 10 18 14 13 55
Total owned and leased hotels………………………………… 113 120 91 104 428
Americas management and franchising……………………… 87 96 83 86 352
ASPAC management and franchising………………………… 18 18 19 23 78
EAME/SW Asia management and franchising…….………… 10 11 12 13 46
Corporate and other…………………………………………… (29) (27) (29) (42) (127)
Eliminations…………………………………………………….. 3 - (1) (2) - Adjusted EBITDA 202$ 218$ 175$ 182$ 777$
2017Q1 Q2 Q3 Q4 YE
Adjusted EBITDA
Owned and leased hotels…………………………………… 116$ 118$ 89$ 94$ 417$
Pro rata share of unconsolidated hospitality ventures……… 26 18 15 14 73
Total owned and leased hotels………………………………… 142 136 104 108 490
Americas management and franchising……………………… 76 93 81 77 327
ASPAC management and franchising………………………… 15 16 17 22 70
EAME/SW Asia management and franchising…….………… 8 8 10 11 37
Corporate and other…………………………………………… (28) (29) (33) (45) (135)
Eliminations…………………………………………………….. 5 — (2) — 3 Adjusted EBITDA 218$ 224$ 177$ 173$ 792$
2016Q1 Q2 Q3 Q4 YE
Adjusted EBITDA
Owned and leased hotels…………………………………… 103$ 121$ 97$ 95$ 416$
Pro rata share of unconsolidated hospitality ventures……… 28 28 23 21 100
Total owned and leased hotels………………………………… 131 149 120 116 516
Americas management and franchising……………………… 76 89 77 76 318
ASPAC management and franchising………………………… 12 12 14 19 57
EAME/SW Asia management and franchising…….………… 8 8 8 9 33
Corporate and other…………………………………………… (33) (31) (27) (48) (139) Adjusted EBITDA 194$ 227$ 192$ 172$ 785$
(c) Effective January 1, 2016, our definition of Adjusted EBITDA has been updated to exclude stock-based compensation expense, to facilitate comparison with our competitors. We have applied this change in the definition of Adjusted EBITDA to historical results to allow for comparability between the periods presented.
(b) The segment results presented here for periods prior to October 1, 2012 have been recast to show our results as if our new reportable segments had existed in these periods. These reporting changes did not change the consolidated results of Hyatt Hotels Corporation for such periods.
(a) The segment results presented here for 2017 have been restated to reflect the adoption of Revenue from Contracts with Customers (ASU 2014-09) that went into effect on January 1, 2018. Segment results for 2016 and prior years have not been restated.
15
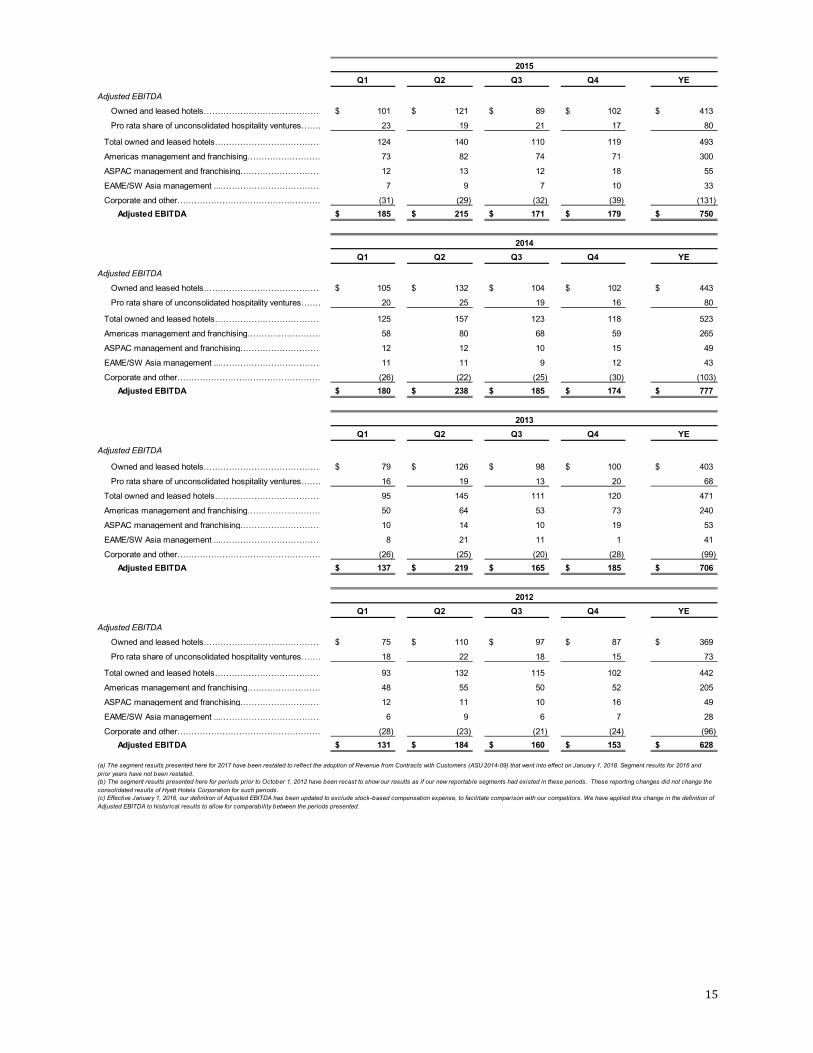
2015Q1 Q2 Q3 Q4 YE
Adjusted EBITDA
Owned and leased hotels…………………………………… 101$ 121$ 89$ 102$ 413$
Pro rata share of unconsolidated hospitality ventures……… 23 19 21 17 80
Total owned and leased hotels………………………………… 124 140 110 119 493
Americas management and franchising……………………… 73 82 74 71 300
ASPAC management and franchising………………………… 12 13 12 18 55
EAME/SW Asia management ...……………………………… 7 9 7 10 33
Corporate and other…………………………………………… (31) (29) (32) (39) (131) Adjusted EBITDA 185$ 215$ 171$ 179$ 750$
2014Q1 Q2 Q3 Q4 YE
Adjusted EBITDA
Owned and leased hotels…………………………………… 105$ 132$ 104$ 102$ 443$
Pro rata share of unconsolidated hospitality ventures……… 20 25 19 16 80
Total owned and leased hotels………………………………… 125 157 123 118 523
Americas management and franchising……………………… 58 80 68 59 265
ASPAC management and franchising………………………… 12 12 10 15 49
EAME/SW Asia management ...……………………………… 11 11 9 12 43
Corporate and other…………………………………………… (26) (22) (25) (30) (103) Adjusted EBITDA 180$ 238$ 185$ 174$ 777$
2013Q1 Q2 Q3 Q4 YE
Adjusted EBITDA
Owned and leased hotels…………………………………… 79$ 126$ 98$ 100$ 403$
Pro rata share of unconsolidated hospitality ventures……… 16 19 13 20 68
Total owned and leased hotels………………………………… 95 145 111 120 471
Americas management and franchising……………………… 50 64 53 73 240
ASPAC management and franchising………………………… 10 14 10 19 53
EAME/SW Asia management ...……………………………… 8 21 11 1 41
Corporate and other…………………………………………… (26) (25) (20) (28) (99) Adjusted EBITDA 137$ 219$ 165$ 185$ 706$
2012Q1 Q2 Q3 Q4 YE
Adjusted EBITDA
Owned and leased hotels…………………………………… 75$ 110$ 97$ 87$ 369$
Pro rata share of unconsolidated hospitality ventures……… 18 22 18 15 73
Total owned and leased hotels………………………………… 93 132 115 102 442
Americas management and franchising……………………… 48 55 50 52 205
ASPAC management and franchising………………………… 12 11 10 16 49
EAME/SW Asia management ...……………………………… 6 9 6 7 28
Corporate and other…………………………………………… (28) (23) (21) (24) (96) Adjusted EBITDA 131$ 184$ 160$ 153$ 628$
(c) Effective January 1, 2016, our definition of Adjusted EBITDA has been updated to exclude stock-based compensation expense, to facilitate comparison with our competitors. We have applied this change in the definition of Adjusted EBITDA to historical results to allow for comparability between the periods presented.
(b) The segment results presented here for periods prior to October 1, 2012 have been recast to show our results as if our new reportable segments had existed in these periods. These reporting changes did not change the consolidated results of Hyatt Hotels Corporation for such periods.
(a) The segment results presented here for 2017 have been restated to reflect the adoption of Revenue from Contracts with Customers (ASU 2014-09) that went into effect on January 1, 2018. Segment results for 2016 and prior years have not been restated.
16
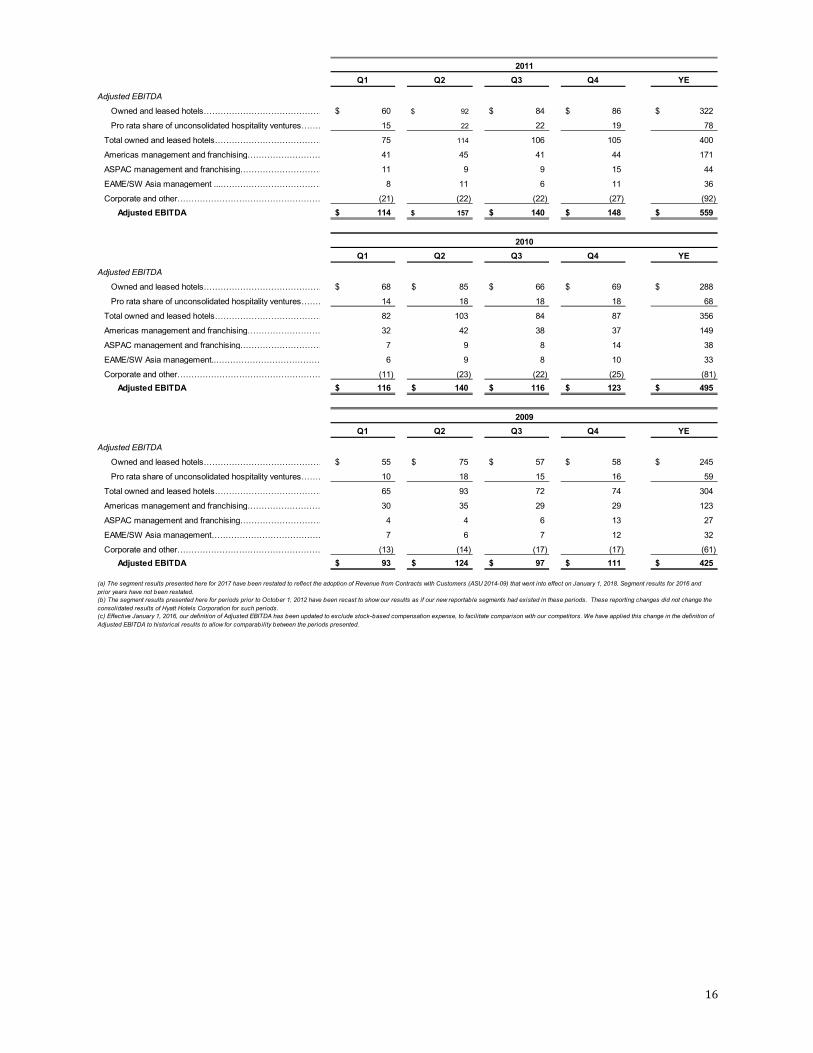
2011Q1 Q2 Q3 Q4 YE
Adjusted EBITDA
Owned and leased hotels…………………………………… 60$ 92$ 84$ 86$ 322$
Pro rata share of unconsolidated hospitality ventures……… 15 22 22 19 78
Total owned and leased hotels………………………………… 75 114 106 105 400
Americas management and franchising……………………… 41 45 41 44 171
ASPAC management and franchising………………………… 11 9 9 15 44
EAME/SW Asia management ...……………………………… 8 11 6 11 36
Corporate and other…………………………………………… (21) (22) (22) (27) (92) Adjusted EBITDA 114$ 157$ 140$ 148$ 559$
2010Q1 Q2 Q3 Q4 YE
Adjusted EBITDA
Owned and leased hotels…………………………………… 68$ 85$ 66$ 69$ 288$
Pro rata share of unconsolidated hospitality ventures……… 14 18 18 18 68
Total owned and leased hotels………………………………… 82 103 84 87 356
Americas management and franchising……………………… 32 42 38 37 149
ASPAC management and franchising………………………… 7 9 8 14 38
EAME/SW Asia management..………………………………… 6 9 8 10 33
Corporate and other…………………………………………… (11) (23) (22) (25) (81) Adjusted EBITDA 116$ 140$ 116$ 123$ 495$
2009Q1 Q2 Q3 Q4 YE
Adjusted EBITDA
Owned and leased hotels…………………………………… 55$ 75$ 57$ 58$ 245$
Pro rata share of unconsolidated hospitality ventures……… 10 18 15 16 59
Total owned and leased hotels………………………………… 65 93 72 74 304
Americas management and franchising……………………… 30 35 29 29 123
ASPAC management and franchising………………………… 4 4 6 13 27
EAME/SW Asia management………………………………… 7 6 7 12 32
Corporate and other…………………………………………… (13) (14) (17) (17) (61) Adjusted EBITDA 93$ 124$ 97$ 111$ 425$
(c) Effective January 1, 2016, our definition of Adjusted EBITDA has been updated to exclude stock-based compensation expense, to facilitate comparison with our competitors. We have applied this change in the definition of Adjusted EBITDA to historical results to allow for comparability between the periods presented.
(b) The segment results presented here for periods prior to October 1, 2012 have been recast to show our results as if our new reportable segments had existed in these periods. These reporting changes did not change the consolidated results of Hyatt Hotels Corporation for such periods.
(a) The segment results presented here for 2017 have been restated to reflect the adoption of Revenue from Contracts with Customers (ASU 2014-09) that went into effect on January 1, 2018. Segment results for 2016 and prior years have not been restated.

17
Fee Summary (unaudited) (a) (b) (c)
(in millions)
2019Q1 Q2 Q3 Q4 YE
Base management fees………………………… 63$ 68$ 64$ 65$ 260$
Incentive management fees…………………… 34 39 33 45 151
Franchise fees…………………………………… 32 38 37 34 141
Other fee revenues……………………………. 12 13 14 17 56
Management, franchise, and other fees 141$ 158$ 148$ 161$ 608$
2018Q1 Q2 Q3 Q4 YE
Base management fees………………………… 53$ 59$ 55$ 58$ 225$
Incentive management fees…………………… 34 38 33 43 148
Franchise fees…………………………………… 28 35 33 31 127
Other fee revenues……………………………. 17 10 12 13 52
Management, franchise, and other fees 132$ 142$ 133$ 145$ 552$
2017Q1 Q2 Q3 Q4 YE
Base management fees………………………… 47$ 52$ 51$ 52$ 202$
Incentive management fees…………………… 30 34 31 40 135
Franchise fees…………………………………… 26 30 30 28 114
Other fee revenues……………………………. 11 14 11 11 47
Management, franchise, and other fees 114$ 130$ 123$ 131$ 498$
2016Q1 Q2 Q3 Q4 YE
Base management fees………………………… 45$ 49$ 49$ 47$ 190$
Incentive management fees…………………… 30 30 25 32 117
Franchise fees…………………………………… 23 27 27 27 104
Other fee revenues……………………………. 9 9 9 10 37
Management, franchise, and other fees 107$ 115$ 110$ 116$ 448$
2015Q1 Q2 Q3 Q4 YE
Base management fees………………………… 44$ 49$ 47$ 47$ 187$
Incentive management fees…………………… 30 30 23 30 113
Franchise fees…………………………………… 21 22 24 21 88
Other fee revenues……………………………. 10 11 9 9 39
Management, franchise, and other fees 105$ 112$ 103$ 107$ 427$
2014Q1 Q2 Q3 Q4 YE
Base management fees………………………… 41$ 48$ 45$ 46$ 180$
Incentive management fees…………………… 27 28 25 31 111
Franchise fees…………………………………… 14 17 18 16 65
Other fee revenues……………………………. 7 10 6 8 31
Management, franchise, and other fees 89$ 103$ 94$ 101$ 387$
(c) Historical numbers are as reported in the most recent public filing in which the respective period was presented, and in certain circumstances have not been adjusted for the insignificant impact from reclassifications or discontinued operations
(b) Historical numbers are as reported in the most recent public filing in which the respective period was presented, except for certain reclassifications that were made to conform to the current year presentation.
(a) The segment results presented here for 2017 have been restated to reflect the adoption of Revenue from Contracts with Customers (ASU 2014-09) that went into effect on January 1, 2018. Segment results for 2016 and prior years have not been restated.
18
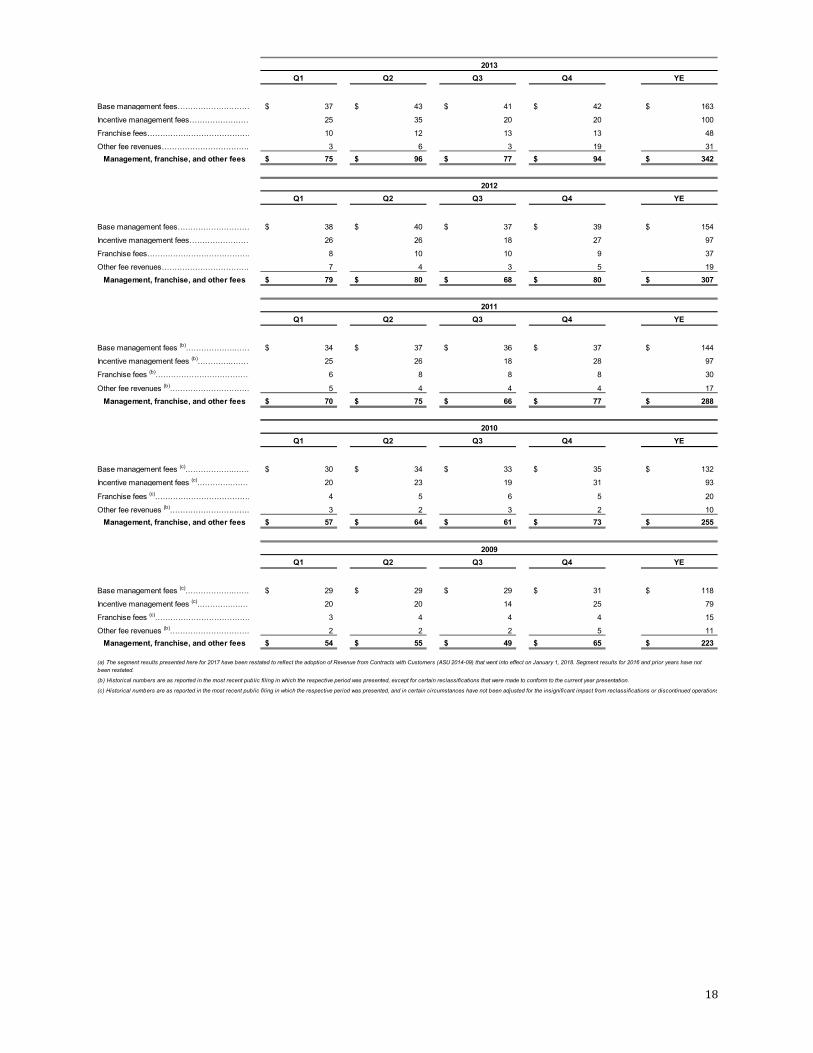
2013Q1 Q2 Q3 Q4 YE
Base management fees………………………… 37$ 43$ 41$ 42$ 163$
Incentive management fees…………………… 25 35 20 20 100
Franchise fees…………………………………… 10 12 13 13 48
Other fee revenues……………………………. 3 6 3 19 31Management, franchise, and other fees 75$ 96$ 77$ 94$ 342$
2012Q1 Q2 Q3 Q4 YE
Base management fees………………………… 38$ 40$ 37$ 39$ 154$
Incentive management fees…………………… 26 26 18 27 97
Franchise fees…………………………………… 8 10 10 9 37
Other fee revenues……………………………. 7 4 3 5 19Management, franchise, and other fees 79$ 80$ 68$ 80$ 307$
2011Q1 Q2 Q3 Q4 YE
Base management fees (b)……………….…… 34$ 37$ 36$ 37$ 144$
Incentive management fees (b)………….……… 25 26 18 28 97
Franchise fees (b)………………………………… 6 8 8 8 30
Other fee revenues (b)…………………………. 5 4 4 4 17Management, franchise, and other fees 70$ 75$ 66$ 77$ 288$
2010Q1 Q2 Q3 Q4 YE
Base management fees (c)……………….…… 30$ 34$ 33$ 35$ 132$
Incentive management fees (c)………….……… 20 23 19 31 93
Franchise fees (c)………………………………… 4 5 6 5 20
Other fee revenues (b)…………………………. 3 2 3 2 10Management, franchise, and other fees 57$ 64$ 61$ 73$ 255$
2009Q1 Q2 Q3 Q4 YE
Base management fees (c)……………….…… 29$ 29$ 29$ 31$ 118$
Incentive management fees (c)………….……… 20 20 14 25 79
Franchise fees (c)………………………………… 3 4 4 4 15
Other fee revenues (b)…………………………. 2 2 2 5 11Management, franchise, and other fees 54$ 55$ 49$ 65$ 223$
(c) Historical numbers are as reported in the most recent public filing in which the respective period was presented, and in certain circumstances have not been adjusted for the insignificant impact from reclassifications or discontinued operations
(b) Historical numbers are as reported in the most recent public filing in which the respective period was presented, except for certain reclassifications that were made to conform to the current year presentation.
(a) The segment results presented here for 2017 have been restated to reflect the adoption of Revenue from Contracts with Customers (ASU 2014-09) that went into effect on January 1, 2018. Segment results for 2016 and prior years have not been restated.
19
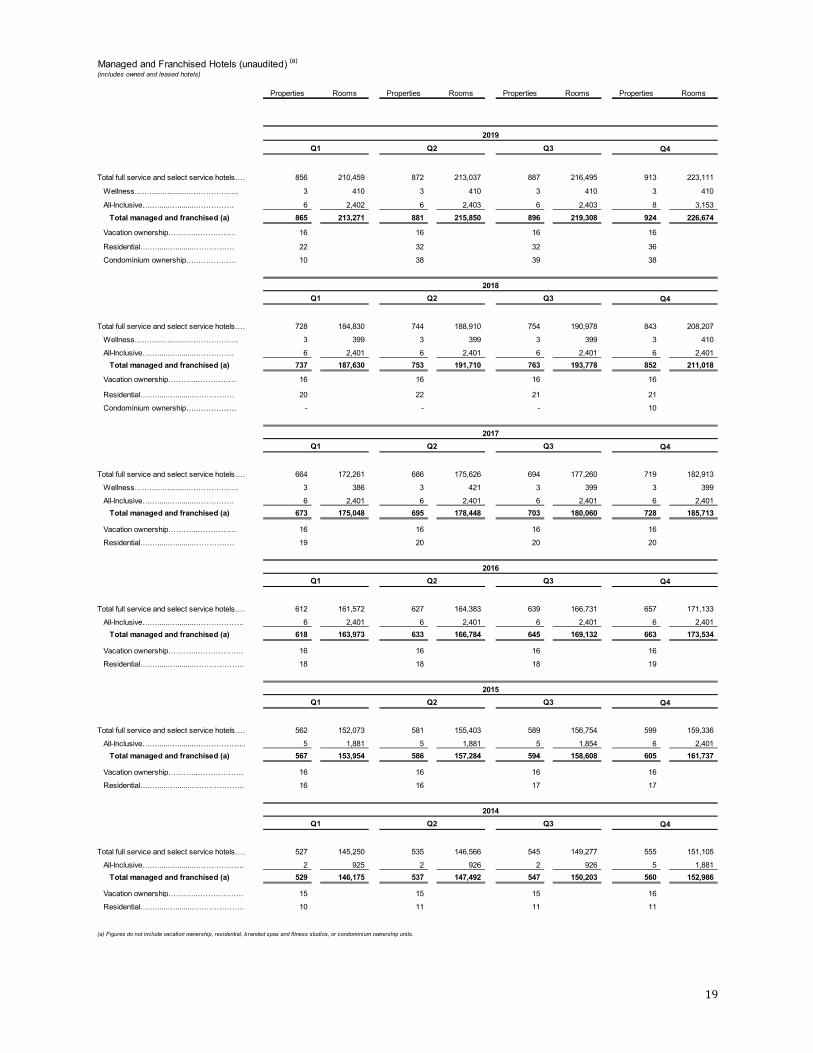
Managed and Franchised Hotels (unaudited) (a)
(includes owned and leased hotels)
Properties Rooms Properties Rooms Properties Rooms Properties Rooms
2019Q1 Q2 Q3 Q4
Total full service and select service hotels…… 856 210,459 872 213,037 887 216,495 913 223,111
Wellness….….....….........……………….. 3 410 3 410 3 410 3 410
All-Inclusive….….....….........…………… 6 2,402 6 2,403 6 2,403 8 3,153 Total managed and franchised (a) 865 213,271 881 215,850 896 219,308 924 226,674
Vacation ownership………..……………. 16 16 16 16
Residential….….....….........……………. 22 32 32 36
Condominium ownership….……………. 10 38 39 38
2018Q1 Q2 Q3 Q4
Total full service and select service hotels…… 728 184,830 744 188,910 754 190,978 843 208,207
Wellness….….....….........……………….. 3 399 3 399 3 399 3 410
All-Inclusive….….....….........…………… 6 2,401 6 2,401 6 2,401 6 2,401 Total managed and franchised (a) 737 187,630 753 191,710 763 193,778 852 211,018
Vacation ownership………..……………. 16 16 16 16
Residential….….....….........……………. 20 22 21 21
Condominium ownership….……………. - - - 10
2017Q1 Q2 Q3 Q4
Total full service and select service hotels…… 664 172,261 686 175,626 694 177,260 719 182,913
Wellness….….....….........……………….. 3 386 3 421 3 399 3 399
All-Inclusive….….....….........…………… 6 2,401 6 2,401 6 2,401 6 2,401 Total managed and franchised (a) 673 175,048 695 178,448 703 180,060 728 185,713
Vacation ownership………..……………. 16 16 16 16
Residential….….....….........……………. 19 20 20 20
2016Q1 Q2 Q3 Q4
Total full service and select service hotels…… 612 161,572 627 164,383 639 166,731 657 171,133
All-Inclusive….….....….........………………. 6 2,401 6 2,401 6 2,401 6 2,401 Total managed and franchised (a) 618 163,973 633 166,784 645 169,132 663 173,534
Vacation ownership………..………………. 16 16 16 16
Residential….….....….........……………….. 18 18 18 19
2015Q1 Q2 Q3 Q4
Total full service and select service hotels…… 562 152,073 581 155,403 589 156,754 599 159,336
All-Inclusive….….....….........……………….. 5 1,881 5 1,881 5 1,854 6 2,401 Total managed and franchised (a) 567 153,954 586 157,284 594 158,608 605 161,737
Vacation ownership………..………………. 16 16 16 16
Residential….….....….........……………….. 16 16 17 17
2014Q1 Q2 Q3 Q4
Total full service and select service hotels…… 527 145,250 535 146,566 545 149,277 555 151,105
All-Inclusive….….....….........………………. 2 925 2 926 2 926 5 1,881 Total managed and franchised (a) 529 146,175 537 147,492 547 150,203 560 152,986
Vacation ownership………..………………. 15 15 15 16
Residential….….....….........……………….. 10 11 11 11
(a) Figures do not include vacation ownership, residential, branded spas and fitness studios, or condominium ownership units.

20
2013Q1 Q2 Q3
Total full service and select service hotels…… 483 134,986 499 139,713 510 141,592 521 144,399
All-Inclusive….….....….........………………. ---- ---- ---- ---- ---- ---- 2 925
Total managed and franchised (a) 483 134,986 499 139,713 510 141,592 523 145,324
Vacation ownership………..………………. 15 15 15 15
Residential….….....….........……………….. 10 10 10 10
2012
Q1 Q2 Q3 Q4
Total managed and franchised (a) 465 131,496 469 133,134 473 133,799 475 133,079
Vacation ownership………..………………. 15 15 15 15
Residential….….....….........……………….. 8 8 8 10
2011Q1 Q2 Q3 Q4
Total managed and franchised (a) 428 124,452 433 125,281 455 128,664 460 130,534
Vacation ownership………..………………. 15 15 15 15
Residential….….....….........……………….. 8 8 8 8
2010Q1 Q2 Q3 Q4
Total managed and franchised (a) 409 121,753 421 123,833 423 124,143 429 125,306
Vacation ownership………..………………. 15 15 15 15
Residential….….....….........……………….. 10 9 9 9
2009
Q4
Total managed and franchised (a) 399 120,031
Vacation ownership………..………………. 15
Residential….….....….........……………….. 10
(a) Figures do not include vacation ownership, residential, branded spas and fitness studios, or condominium ownership units.
Q4

21
System-wide Comparable Managed and Franchised Hotels Statistics (unaudited) (a) (b) (c)
(includes owned and leased hotels)
2019Q1 Q2 Q3 Q4 YE
ADR (b)…………………………………… 185.77$ 186.04$ 178.27$ 181.74$ 182.97$
Occupancy (b)…………………………… 71.1% 77.7% 77.0% 72.0% 74.5%
RevPAR (b)……………………………… 132.17$ 144.48$ 137.33$ 130.93$ 136.27$
RevPAR Change (in constant $)(c)……… 1.8% 1.3% 0.0% (0.5%) 0.7%
2018Q1 Q2 Q3 Q4 YE
ADR (b)…………………………………… 186.63$ 187.92$ 180.80$ 184.10$ 185.10$
Occupancy (b)…………………………… 72.4% 78.0% 77.6% 72.5% 75.2%
RevPAR (b)……………………………… 135.20$ 146.64$ 140.29$ 133.52$ 139.24$
RevPAR Change (c)……………………… 6.0% 4.6% 1.7% 0.1% 3.0%
RevPAR Change (in constant $)(c)……… 4.3% 4.0% 2.8% 1.5% 3.1%
2017Q1 Q2 Q3 Q4 YE
ADR (b)…………………………………… 181.69$ 182.07$ 178.01$ 183.83$ 181.62$
Occupancy (b)…………………………… 70.2% 77.0% 77.5% 72.6% 74.4%
RevPAR (b)……………………………… 127.60$ 140.14$ 137.94$ 133.40$ 135.18$
RevPAR Change (c)……………………… 4.4% 2.4% 1.7% 4.5% 3.3%
RevPAR Change (in constant $)(c)……… 4.7% 2.9% 1.6% 3.8% 3.3%
2016Q1 Q2 Q3 Q4 YE
ADR (b)…………………………………… 179.78$ 183.17$ 179.11$ 180.45$ 180.68$
Occupancy (b)…………………………… 69.5% 76.2% 76.8% 71.2% 73.4%
RevPAR (b)……………………………… 124.92$ 139.50$ 137.59$ 128.54$ 132.67$
RevPAR Change (c)……………………… 0.6% 1.5% 2.6% 1.6% 1.9%
RevPAR Change (in constant $)(c)……… 2.2% 2.3% 2.5% 2.0% 2.5%
2015Q1 Q2 Q3 Q4 YE
ADR (b)…………………………………… 181.42$ 183.63$ 179.06$ 180.56$ 180.74$
Occupancy (b)…………………………… 69.9% 76.3% 76.4% 70.9% 73.3%
RevPAR (b)……………………………… 126.88$ 140.18$ 136.75$ 127.96$ 132.56$
RevPAR Change (c)……………………… 4.6% 2.2% 1.6% 0.9% 2.3%
RevPAR Change (in constant $)(c)……… 7.4% 5.6% 5.4% 3.8% 5.5%
2014Q1 Q2 Q3 Q4 YE
ADR (b)…………………………………… 178.11$ 182.21$ 179.42$ 181.87$ 180.52$
Occupancy (b)…………………………… 69.3% 76.2% 76.0% 70.7% 73.1%
RevPAR (b)……………………………… 123.49$ 138.92$ 136.33$ 128.61$ 131.98$
RevPAR Change (c)……………………… 6.0% 5.5% 7.6% 3.1% 5.5%
RevPAR Change (in constant $)(c)……… 7.7% 6.1% 8.0% 5.1% 6.7%
(a) Inventory included for comparable calculations may vary in each time period based on the definition of comparable hotels on the latest date the information was published.(b) This data represents information reported in the most recent public filing in which the stated period was presented.(c) RevPAR change and RevPAR change (in constant $) is that which was published in the applicable quarterly filing.
22
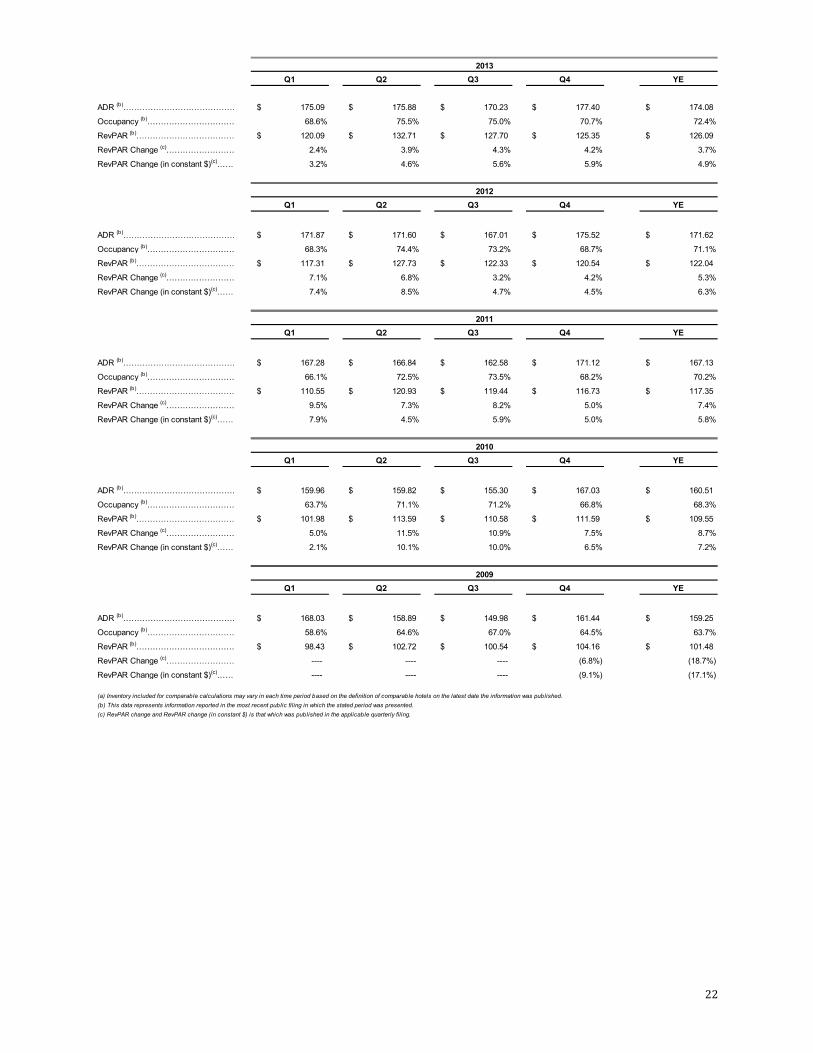
2013Q1 Q2 Q3 Q4 YE
ADR (b)…………………………………… 175.09$ 175.88$ 170.23$ 177.40$ 174.08$
Occupancy (b)…………………………… 68.6% 75.5% 75.0% 70.7% 72.4%
RevPAR (b)……………………………… 120.09$ 132.71$ 127.70$ 125.35$ 126.09$
RevPAR Change (c)……………………… 2.4% 3.9% 4.3% 4.2% 3.7%
RevPAR Change (in constant $)(c)……… 3.2% 4.6% 5.6% 5.9% 4.9%
2012Q1 Q2 Q3 Q4 YE
ADR (b)…………………………………… 171.87$ 171.60$ 167.01$ 175.52$ 171.62$
Occupancy (b)…………………………… 68.3% 74.4% 73.2% 68.7% 71.1%
RevPAR (b)……………………………… 117.31$ 127.73$ 122.33$ 120.54$ 122.04$
RevPAR Change (c)……………………… 7.1% 6.8% 3.2% 4.2% 5.3%
RevPAR Change (in constant $)(c)……… 7.4% 8.5% 4.7% 4.5% 6.3%
2011Q1 Q2 Q3 Q4 YE
ADR (b)…………………………………… 167.28$ 166.84$ 162.58$ 171.12$ 167.13$
Occupancy (b)…………………………… 66.1% 72.5% 73.5% 68.2% 70.2%
RevPAR (b)……………………………… 110.55$ 120.93$ 119.44$ 116.73$ 117.35$
RevPAR Change (c)……………………… 9.5% 7.3% 8.2% 5.0% 7.4%
RevPAR Change (in constant $)(c)……… 7.9% 4.5% 5.9% 5.0% 5.8%
2010Q1 Q2 Q3 Q4 YE
ADR (b)…………………………………… 159.96$ 159.82$ 155.30$ 167.03$ 160.51$
Occupancy (b)…………………………… 63.7% 71.1% 71.2% 66.8% 68.3%
RevPAR (b)……………………………… 101.98$ 113.59$ 110.58$ 111.59$ 109.55$
RevPAR Change (c)……………………… 5.0% 11.5% 10.9% 7.5% 8.7%
RevPAR Change (in constant $)(c)……… 2.1% 10.1% 10.0% 6.5% 7.2%
2009Q1 Q2 Q3 Q4 YE
ADR (b)…………………………………… 168.03$ 158.89$ 149.98$ 161.44$ 159.25$
Occupancy (b)…………………………… 58.6% 64.6% 67.0% 64.5% 63.7%
RevPAR (b)……………………………… 98.43$ 102.72$ 100.54$ 104.16$ 101.48$
RevPAR Change (c)……………………… ---- ---- ---- (6.8%) (18.7%)
RevPAR Change (in constant $)(c)……… ---- ---- ---- (9.1%) (17.1%)
(a) Inventory included for comparable calculations may vary in each time period based on the definition of comparable hotels on the latest date the information was published.(b) This data represents information reported in the most recent public filing in which the stated period was presented.(c) RevPAR change and RevPAR change (in constant $) is that which was published in the applicable quarterly filing.

23
Owned and Leased Hotels (unaudited) (a)
Properties Rooms Properties Rooms Properties Rooms Properties Rooms
Full service hotels
United States…..……..…….…………..…… 22 13,440 22 13,440 21 12,182 21 12,198
Other Americas….……......………………… 2 795 2 795 2 795 2 795
ASPAC…………………………………….… 1 615 1 615 1 615 ---- ----
EAME/SW Asia……………………………… 8 1,593 8 1,593 8 1,593 8 1,593
Select service hotels
United States………..…….…………..……… 1 171 1 171 1 171 1 171
Other Americas….……......………………… 2 293 2 293 2 293 2 293
EAME/SW Asia………..…….…………..…… 1 330 1 330 1 330 1 330 Total full service and select service hotels 37 17,237 37 17,237 36 15,979 35 15,380
Wellness………..…….…………..………… 3 410 3 410 3 410 3 410
Total owned and leased 40 17,647 40 17,647 39 16,389 38 15,790
Full service hotels
United States…..……..…….…………..…… 20 12,226 20 12,217 22 13,440 22 13,440
Other Americas….……......………………… 3 1,548 3 1,548 2 793 2 795
ASPAC…………………………………….… 1 601 1 615 1 615 1 615
EAME/SW Asia……………………………… 8 1,591 8 1,591 8 1,591 8 1,591
Select service hotels
United States………..…….…………..……… 2 320 2 320 2 320 1 171
Other Americas….……......………………… - - 2 293 2 293 2 293
EAME/SW Asia………..…….…………..…… 1 330 1 330 1 330 1 330 Total full service and select service hotels 35 16,616 37 16,914 38 17,382 37 17,235
Wellness………..…….…………..………… 3 399 3 399 3 399 3 410
Total owned and leased 38 17,015 40 17,313 41 17,781 40 17,645
Full service hotels
United States…..……..…….…………..…… 28 16,007 26 14,801 26 14,802 23 13,641
Other Americas….……......………………… 3 1,548 3 1,548 3 1,548 3 1,548
ASPAC…………………………………….… 1 601 1 601 1 601 1 601
EAME/SW Asia……………………………… 9 1,933 9 1,933 9 1,933 9 1,933
Select service hotels
United States………..…….…………..……… 1 171 1 171 1 171 2 320
EAME/SW Asia………..…….…………..…… 1 330 1 330 1 330 1 330 Total full service and select service hotels 43 20,590 41 19,384 41 19,385 39 18,373
Wellness………..…….…………..………… 3 386 3 421 3 399 3 399
Total owned and leased 46 20,976 44 19,805 44 19,784 42 18,772
2018Q1 Q2 Q3 Q4
(a) Figures do not include unconsolidated hospitality ventures, vacation ownership, residential, branded spas and fitness studios, or condominium ownership units.
2019Q1 Q2 Q3 Q4
2017Q1 Q2 Q3 Q4
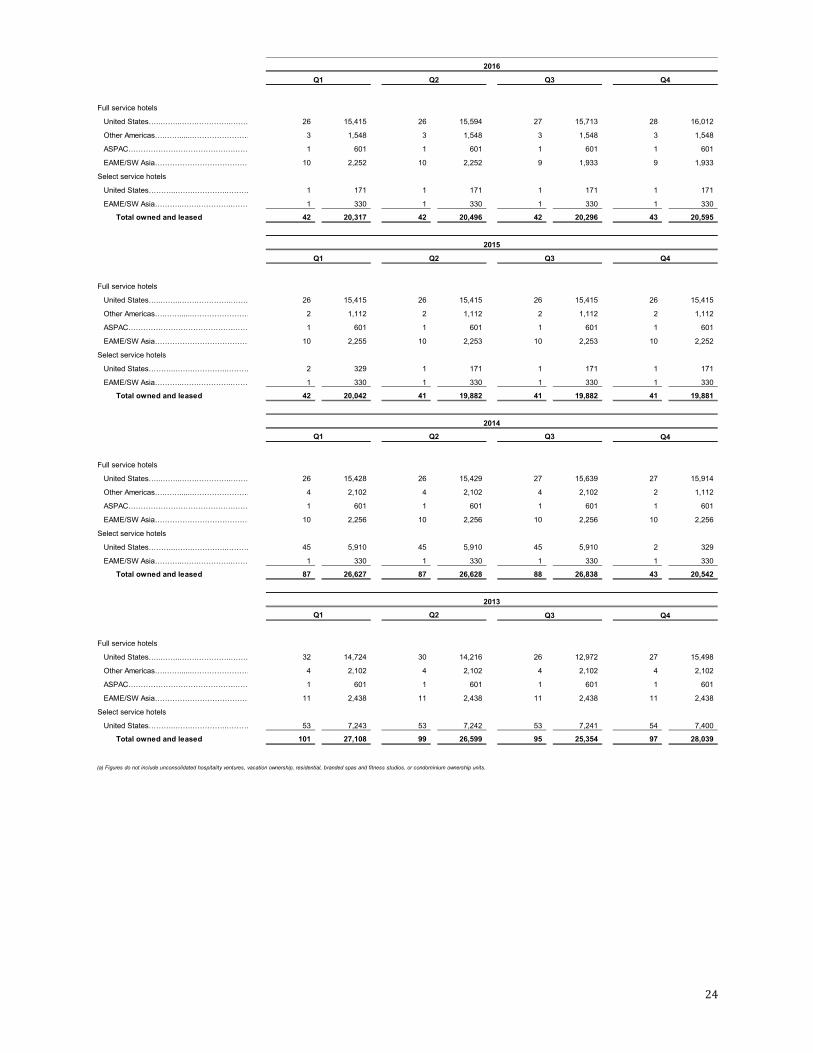
24
Full service hotels
United States…..……..…….…………..……… 26 15,415 26 15,594 27 15,713 28 16,012
Other Americas….……......…………………… 3 1,548 3 1,548 3 1,548 3 1,548
ASPAC…………………………………….…… 1 601 1 601 1 601 1 601
EAME/SW Asia………………………………… 10 2,252 10 2,252 9 1,933 9 1,933
Select service hotels
United States………..…….…………..……… 1 171 1 171 1 171 1 171
EAME/SW Asia………..…….…………..……… 1 330 1 330 1 330 1 330
Total owned and leased 42 20,317 42 20,496 42 20,296 43 20,595
Full service hotels
United States…..……..…….…………..……… 26 15,415 26 15,415 26 15,415 26 15,415
Other Americas….……......…………………… 2 1,112 2 1,112 2 1,112 2 1,112
ASPAC…………………………………….…… 1 601 1 601 1 601 1 601
EAME/SW Asia………………………………… 10 2,255 10 2,253 10 2,253 10 2,252
Select service hotels
United States………..…….…………..……… 2 329 1 171 1 171 1 171
EAME/SW Asia………..…….…………..……… 1 330 1 330 1 330 1 330
Total owned and leased 42 20,042 41 19,882 41 19,882 41 19,881
2014Q1 Q2 Q3 Q4
Full service hotels
United States…..……..…….…………..……… 26 15,428 26 15,429 27 15,639 27 15,914
Other Americas….……......…………………… 4 2,102 4 2,102 4 2,102 2 1,112
ASPAC…………………………………….…… 1 601 1 601 1 601 1 601
EAME/SW Asia………………………………… 10 2,256 10 2,256 10 2,256 10 2,256
Select service hotels
United States………..…….…………..……… 45 5,910 45 5,910 45 5,910 2 329
EAME/SW Asia………..…….…………..……… 1 330 1 330 1 330 1 330
Total owned and leased 87 26,627 87 26,628 88 26,838 43 20,542
2013Q1 Q2 Q3 Q4
Full service hotels
United States…..……..…….…………..……… 32 14,724 30 14,216 26 12,972 27 15,498
Other Americas….……......…………………… 4 2,102 4 2,102 4 2,102 4 2,102
ASPAC…………………………………….…… 1 601 1 601 1 601 1 601
EAME/SW Asia………………………………… 11 2,438 11 2,438 11 2,438 11 2,438
Select service hotels
United States………..…….…………..……… 53 7,243 53 7,242 53 7,241 54 7,400
Total owned and leased 101 27,108 99 26,599 95 25,354 97 28,039
Q2 Q3 Q4
Q1 Q2 Q3 Q4
2015
(a) Figures do not include unconsolidated hospitality ventures, vacation ownership, residential, branded spas and fitness studios, or condominium ownership units.
2016
Q1

25
2012Q1 Q2 Q3 Q4
Full service hotels
United States…..……..…….…………..……… 31 14,535 31 14,535 31 14,536 31 14,536
Other Americas….……......…………………… 3 1,347 4 2,103 4 2,103 4 2,102
ASPAC…………………………………….…… 1 601 1 601 1 601 1 601
EAME/SW Asia………………………………… 9 2,002 9 2,002 9 2,002 11 2,441
Select service hotels
United States………..…….…………..……… 64 8,712 64 8,712 64 8,712 56 7,669
Total owned and leased 108 27,197 109 27,953 109 27,954 103 27,349
2011Q1 Q2 Q3 Q4
Full service hotels
United States…..……..…….…………..……… 28 14,960 28 14,934 32 15,274 31 14,528
Other Americas….……......…………………… 3 1,347 3 1,347 3 1,347 3 1,347
ASPAC…………………………………….…… 1 601 1 601 1 601 1 601
EAME/SW Asia………………………………… 9 2,006 9 2,002 9 2,002 9 2,002
Select service hotels
United States………..…….…………..……… 54 7,041 49 6,525 63 8,562 64 8,712
Total owned and leased 95 25,955 90 25,409 108 27,786 108 27,190
2010Q1 Q2 Q3 Q4
Full service hotels
United States…..……..…….…………..……… 34 17,187 34 17,252 33 16,761 29 15,493
Other Americas….……......…………………… 3 1,347 3 1,347 3 1,347 3 1,347
ASPAC…………………………………….…… 1 601 1 601 1 601 1 601
EAME/SW Asia………………………………… 9 2,011 9 2,011 9 2,006 9 2,006
Select service hotels
United States………..…….…………..……… 55 7,169 55 7,169 54 7,041 54 7,041
Total owned and leased 102 28,315 102 28,380 100 27,756 96 26,488
2009Q4
Full service hotels
United States…..……..…….…………..……… 34 17,488
Other Americas….……......…………………… 3 1,347
ASPAC…………………………………….…… 1 601
EAME/SW Asia………………………………… 9 2,011
Select service hotels
United States………..…….…………..……… 55 7,169
Total owned and leased 102 28,616
(a) Figures do not include unconsolidated hospitality ventures, vacation ownership, residential, branded spas and fitness studios, or condominium ownership units.
26
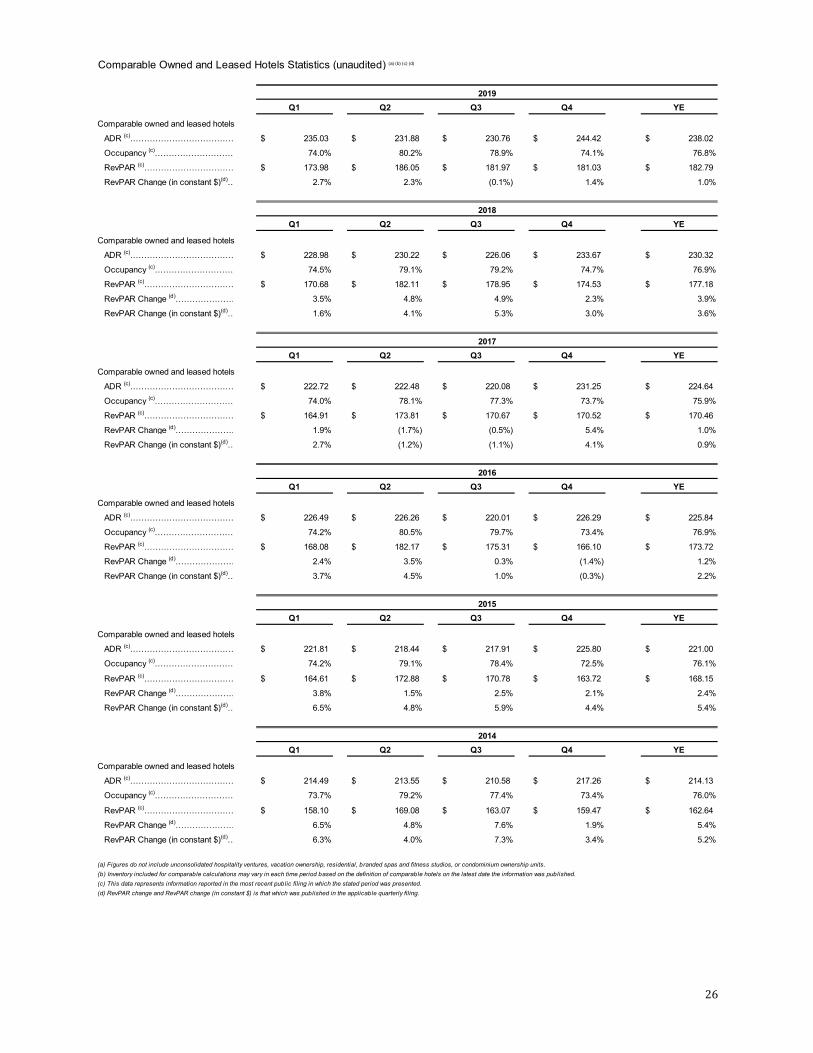
Comparable Owned and Leased Hotels Statistics (unaudited) (a) (b) (c) (d)
2019Q1 Q2 Q3 Q4 YE
Comparable owned and leased hotels
ADR (c)………………………………… 235.03$ 231.88$ 230.76$ 244.42$ 238.02$
Occupancy (c)………………………… 74.0% 80.2% 78.9% 74.1% 76.8%
RevPAR (c)…………………………… 173.98$ 186.05$ 181.97$ 181.03$ 182.79$
RevPAR Change (in constant $)(d)… 2.7% 2.3% (0.1%) 1.4% 1.0%
2018Q1 Q2 Q3 Q4 YE
Comparable owned and leased hotels
ADR (c)………………………………… 228.98$ 230.22$ 226.06$ 233.67$ 230.32$
Occupancy (c)………………………… 74.5% 79.1% 79.2% 74.7% 76.9%
RevPAR (c)…………………………… 170.68$ 182.11$ 178.95$ 174.53$ 177.18$
RevPAR Change (d)………………… 3.5% 4.8% 4.9% 2.3% 3.9%
RevPAR Change (in constant $)(d)… 1.6% 4.1% 5.3% 3.0% 3.6%
2017Q1 Q2 Q3 Q4 YE
Comparable owned and leased hotels
ADR (c)………………………………… 222.72$ 222.48$ 220.08$ 231.25$ 224.64$
Occupancy (c)………………………… 74.0% 78.1% 77.3% 73.7% 75.9%
RevPAR (c)…………………………… 164.91$ 173.81$ 170.67$ 170.52$ 170.46$
RevPAR Change (d)………………… 1.9% (1.7%) (0.5%) 5.4% 1.0%
RevPAR Change (in constant $)(d)… 2.7% (1.2%) (1.1%) 4.1% 0.9%
2016Q1 Q2 Q3 Q4 YE
Comparable owned and leased hotels
ADR (c)………………………………… 226.49$ 226.26$ 220.01$ 226.29$ 225.84$
Occupancy (c)………………………… 74.2% 80.5% 79.7% 73.4% 76.9%
RevPAR (c)…………………………… 168.08$ 182.17$ 175.31$ 166.10$ 173.72$
RevPAR Change (d)………………… 2.4% 3.5% 0.3% (1.4%) 1.2%
RevPAR Change (in constant $)(d)… 3.7% 4.5% 1.0% (0.3%) 2.2%
2015Q1 Q2 Q3 Q4 YE
Comparable owned and leased hotels
ADR (c)………………………………… 221.81$ 218.44$ 217.91$ 225.80$ 221.00$
Occupancy (c)………………………… 74.2% 79.1% 78.4% 72.5% 76.1%
RevPAR (c)…………………………… 164.61$ 172.88$ 170.78$ 163.72$ 168.15$
RevPAR Change (d)………………… 3.8% 1.5% 2.5% 2.1% 2.4%
RevPAR Change (in constant $)(d)… 6.5% 4.8% 5.9% 4.4% 5.4%
2014Q1 Q2 Q3 Q4 YE
Comparable owned and leased hotels
ADR (c)………………………………… 214.49$ 213.55$ 210.58$ 217.26$ 214.13$
Occupancy (c)………………………… 73.7% 79.2% 77.4% 73.4% 76.0%
RevPAR (c)…………………………… 158.10$ 169.08$ 163.07$ 159.47$ 162.64$
RevPAR Change (d)………………… 6.5% 4.8% 7.6% 1.9% 5.4%
RevPAR Change (in constant $)(d)… 6.3% 4.0% 7.3% 3.4% 5.2%
(a) Figures do not include unconsolidated hospitality ventures, vacation ownership, residential, branded spas and fitness studios, or condominium ownership units.(b) Inventory included for comparable calculations may vary in each time period based on the definition of comparable hotels on the latest date the information was published.(c) This data represents information reported in the most recent public filing in which the stated period was presented.(d) RevPAR change and RevPAR change (in constant $) is that which was published in the applicable quarterly filing.

27
2013Q1 Q2 Q3 Q4 YE
Full service
ADR (c)………………………………… 209.94$ 214.76$ 208.88$ 223.01$ 215.19$
Occupancy (c)………………………… 69.7% 78.3% 78.3% 72.5% 74.7%
RevPAR (c)…………………………… 146.42$ 168.18$ 163.50$ 161.60$ 160.78$
RevPAR Change (d)………………… 4.0% 7.0% 6.4% 6.8% 5.9%
RevPAR Change (in constant $)(d)… 3.9% 6.9% 6.1% 6.3% 5.7%
Select service
ADR (c)………………………………… 100.97$ 106.71$ 106.55$ 111.83$ 112.65$
Occupancy (c)………………………… 72.1% 82.1% 79.5% 74.2% 77.8%
RevPAR (c)…………………………… 72.80$ 87.57$ 84.70$ 82.93$ 87.63$
RevPAR Change (d)………………… 6.8% 7.6% 4.4% 3.9% 5.7%
RevPAR Change (in constant $)(d)… 6.8% 7.6% 4.4% 3.9% 5.7%
Comparable owned and leased hotels
ADR (c)………………………………… 182.18$ 186.96$ 183.16$ 221.35$ 212.54$
Occupancy (c)………………………… 70.3% 79.2% 78.6% 72.6% 74.8%
RevPAR (c)…………………………… 128.12$ 148.15$ 143.92$ 160.78$ 159.05$
RevPAR Change (d)………………… 4.5% 7.1% 6.0% 6.2% 5.9%
RevPAR Change (in constant $)(d)… 4.4% 7.1% 5.8% 5.9% 5.7%
2012Q1 Q2 Q3 Q4 YE
Full service
ADR (c)………………………………… 200.47$ 200.18$ 203.28$ 214.23$ 205.90$
Occupancy (c)………………………… 70.2% 78.5% 76.3% 70.7% 73.7%
RevPAR (c)…………………………… 140.77$ 157.23$ 155.12$ 151.36$ 151.75$
RevPAR Change (d)………………… 9.0% 8.0% 4.5% 7.2% 7.1%
RevPAR Change (in constant $)(d)… 9.5% 10.1% 6.5% 7.3% 8.3%
Select service
ADR (c)………………………………… 103.58$ 108.29$ 108.58$ 106.58$ 106.87$
Occupancy (c)………………………… 71.8% 80.9% 82.7% 74.9% 77.6%
RevPAR (c)…………………………… 74.36$ 87.66$ 89.83$ 79.82$ 82.93$
RevPAR Change (d)………………… 4.3% 5.4% 5.1% 9.5% 6.6%
RevPAR Change (in constant $)(d)… 4.3% 5.4% 5.1% 9.5% 6.6%
Comparable owned and leased hotels
ADR (c)………………………………… 172.76$ 173.22$ 173.03$ 180.21$ 174.74$
Occupancy (c)………………………… 70.7% 79.2% 78.2% 71.9% 74.9%
RevPAR (c)…………………………… 122.07$ 137.25$ 135.39$ 129.64$ 130.86$
RevPAR Change (d)………………… 8.3% 7.6% 4.6% 7.5% 7.0%
RevPAR Change (in constant $)(d)… 8.7% 9.4% 6.3% 7.5% 8.1%
(a) Figures do not include unconsolidated hospitality ventures, vacation ownership, residential, branded spas and fitness studios, or condominium ownership units.(b) Inventory included for comparable calculations may vary in each time period based on the definition of comparable hotels on the latest date the information was published.(c) This data represents information reported in the most recent public filing in which the stated period was presented.(d) RevPAR change and RevPAR change (in constant $) is that which was published in the applicable quarterly filing.
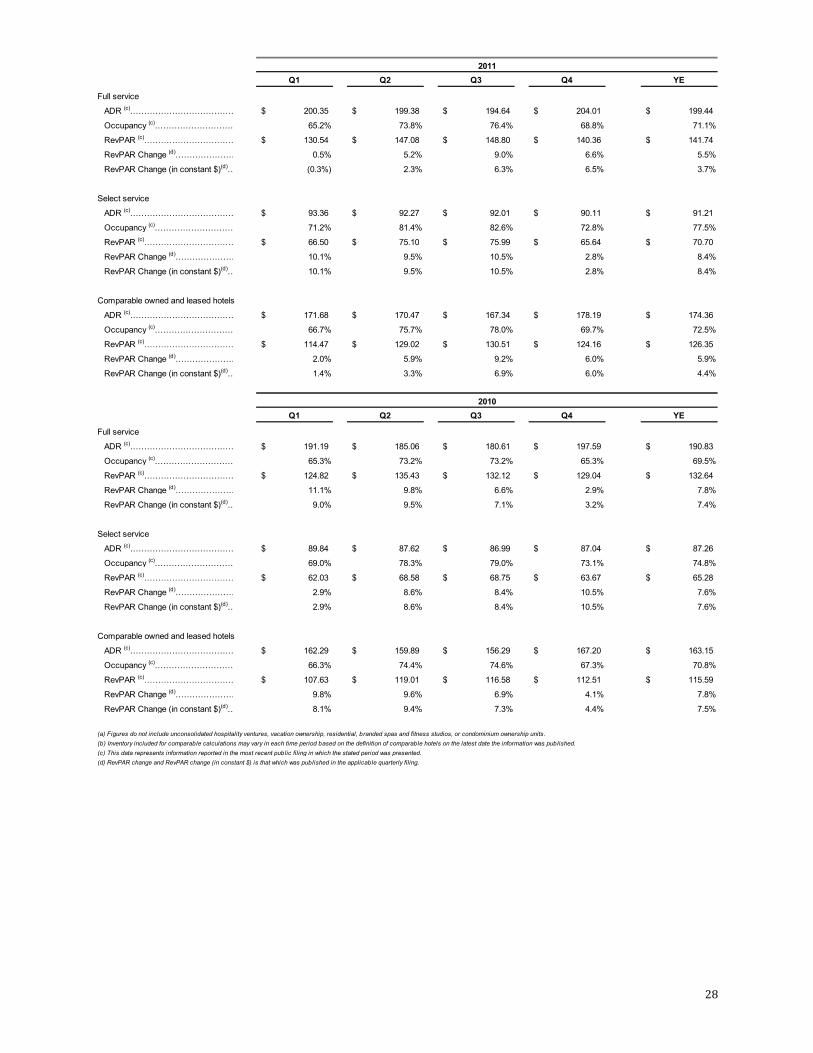
28
2011Q1 Q2 Q3 Q4 YE
Full service
ADR (c)………………………………… 200.35$ 199.38$ 194.64$ 204.01$ 199.44$
Occupancy (c)………………………… 65.2% 73.8% 76.4% 68.8% 71.1%
RevPAR (c)…………………………… 130.54$ 147.08$ 148.80$ 140.36$ 141.74$
RevPAR Change (d)………………… 0.5% 5.2% 9.0% 6.6% 5.5%
RevPAR Change (in constant $)(d)… (0.3%) 2.3% 6.3% 6.5% 3.7%
Select service
ADR (c)………………………………… 93.36$ 92.27$ 92.01$ 90.11$ 91.21$
Occupancy (c)………………………… 71.2% 81.4% 82.6% 72.8% 77.5%
RevPAR (c)…………………………… 66.50$ 75.10$ 75.99$ 65.64$ 70.70$
RevPAR Change (d)………………… 10.1% 9.5% 10.5% 2.8% 8.4%
RevPAR Change (in constant $)(d)… 10.1% 9.5% 10.5% 2.8% 8.4%
Comparable owned and leased hotels
ADR (c)………………………………… 171.68$ 170.47$ 167.34$ 178.19$ 174.36$
Occupancy (c)………………………… 66.7% 75.7% 78.0% 69.7% 72.5%
RevPAR (c)…………………………… 114.47$ 129.02$ 130.51$ 124.16$ 126.35$
RevPAR Change (d)………………… 2.0% 5.9% 9.2% 6.0% 5.9%
RevPAR Change (in constant $)(d)… 1.4% 3.3% 6.9% 6.0% 4.4%
2010Q1 Q2 Q3 Q4 YE
Full service
ADR (c)………………………………… 191.19$ 185.06$ 180.61$ 197.59$ 190.83$
Occupancy (c)………………………… 65.3% 73.2% 73.2% 65.3% 69.5%
RevPAR (c)…………………………… 124.82$ 135.43$ 132.12$ 129.04$ 132.64$
RevPAR Change (d)………………… 11.1% 9.8% 6.6% 2.9% 7.8%
RevPAR Change (in constant $)(d)… 9.0% 9.5% 7.1% 3.2% 7.4%
Select service
ADR (c)………………………………… 89.84$ 87.62$ 86.99$ 87.04$ 87.26$
Occupancy (c)………………………… 69.0% 78.3% 79.0% 73.1% 74.8%
RevPAR (c)…………………………… 62.03$ 68.58$ 68.75$ 63.67$ 65.28$
RevPAR Change (d)………………… 2.9% 8.6% 8.4% 10.5% 7.6%
RevPAR Change (in constant $)(d)… 2.9% 8.6% 8.4% 10.5% 7.6%
Comparable owned and leased hotels
ADR (c)………………………………… 162.29$ 159.89$ 156.29$ 167.20$ 163.15$
Occupancy (c)………………………… 66.3% 74.4% 74.6% 67.3% 70.8%
RevPAR (c)…………………………… 107.63$ 119.01$ 116.58$ 112.51$ 115.59$
RevPAR Change (d)………………… 9.8% 9.6% 6.9% 4.1% 7.8%
RevPAR Change (in constant $)(d)… 8.1% 9.4% 7.3% 4.4% 7.5%
(a) Figures do not include unconsolidated hospitality ventures, vacation ownership, residential, branded spas and fitness studios, or condominium ownership units.(b) Inventory included for comparable calculations may vary in each time period based on the definition of comparable hotels on the latest date the information was published.(c) This data represents information reported in the most recent public filing in which the stated period was presented.(d) RevPAR change and RevPAR change (in constant $) is that which was published in the applicable quarterly filing.
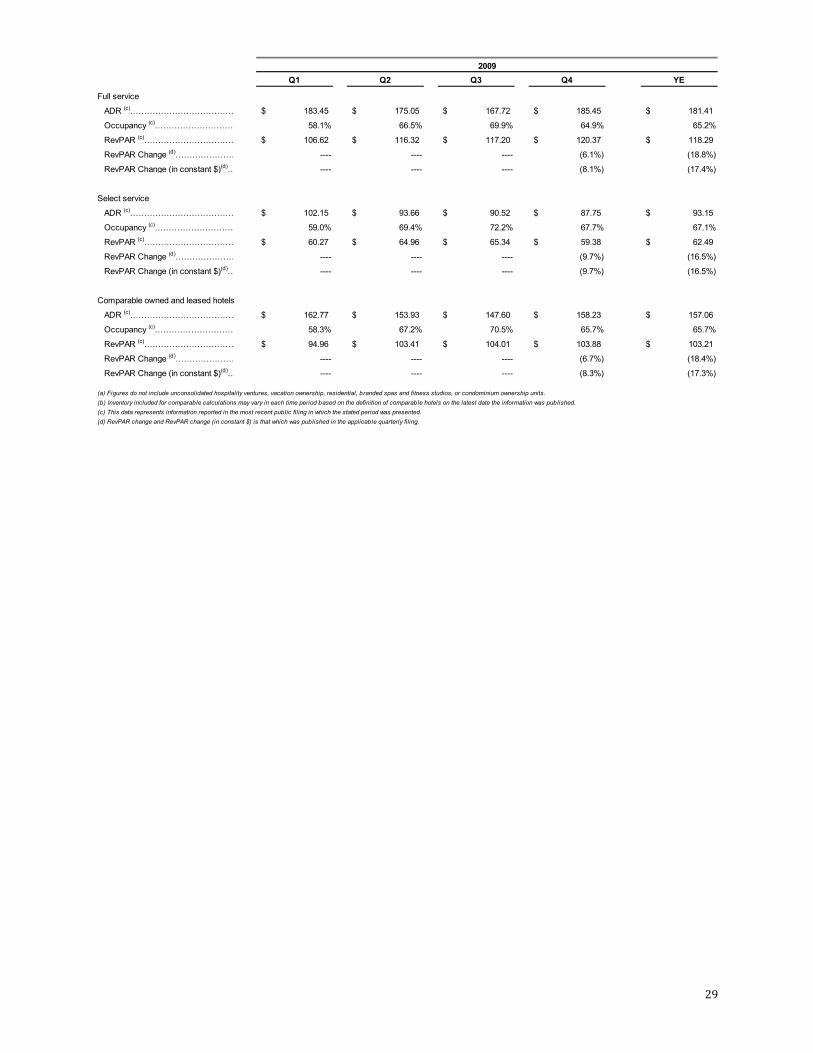
29
2009Q1 Q2 Q3 Q4 YE
Full service
ADR (c)………………………………… 183.45$ 175.05$ 167.72$ 185.45$ 181.41$
Occupancy (c)………………………… 58.1% 66.5% 69.9% 64.9% 65.2%
RevPAR (c)…………………………… 106.62$ 116.32$ 117.20$ 120.37$ 118.29$
RevPAR Change (d)………………… ---- ---- ---- (6.1%) (18.8%)
RevPAR Change (in constant $)(d)… ---- ---- ---- (8.1%) (17.4%)
Select service
ADR (c)………………………………… 102.15$ 93.66$ 90.52$ 87.75$ 93.15$
Occupancy (c)………………………… 59.0% 69.4% 72.2% 67.7% 67.1%
RevPAR (c)…………………………… 60.27$ 64.96$ 65.34$ 59.38$ 62.49$
RevPAR Change (d)………………… ---- ---- ---- (9.7%) (16.5%)
RevPAR Change (in constant $)(d)… ---- ---- ---- (9.7%) (16.5%)
Comparable owned and leased hotels
ADR (c)………………………………… 162.77$ 153.93$ 147.60$ 158.23$ 157.06$
Occupancy (c)………………………… 58.3% 67.2% 70.5% 65.7% 65.7%
RevPAR (c)…………………………… 94.96$ 103.41$ 104.01$ 103.88$ 103.21$
RevPAR Change (d)………………… ---- ---- ---- (6.7%) (18.4%)
RevPAR Change (in constant $)(d)… ---- ---- ---- (8.3%) (17.3%)
(a) Figures do not include unconsolidated hospitality ventures, vacation ownership, residential, branded spas and fitness studios, or condominium ownership units.(b) Inventory included for comparable calculations may vary in each time period based on the definition of comparable hotels on the latest date the information was published.(c) This data represents information reported in the most recent public filing in which the stated period was presented.(d) RevPAR change and RevPAR change (in constant $) is that which was published in the applicable quarterly filing.

30
Total Americas Managed and Franchised Hotels (unaudited) (a)
(includes owned and leased hotels)
Properties Rooms Properties Rooms Properties Rooms Properties Rooms
2019Q1 Q2 Q3 Q4
Full service hotels
United States Managed…………..…...…… 138 62,539 134 61,562 133 61,461 131 62,377
Other Americas Managed…………..…... 26 9,012 26 9,012 26 9,016 26 9,020
United States Franchised…………..…...… 57 17,977 57 17,977 59 18,633 61 19,388
Other Americas Franchised…………..… 5 828 5 828 6 968 6 968
Subtotal…………..…...…………….…… 226 90,356 222 89,379 224 90,078 224 91,753
Select service hotels
United States Managed…………..…...…… 48 6,917 47 6,790 49 7,155 50 7,320
Other Americas Managed…………..…... 10 1,476 10 1,476 10 1,476 12 1,734
United States Franchised…………..…...… 326 44,965 336 46,256 341 46,890 349 48,256
Other Americas Franchised…………..… 7 955 7 955 7 955 7 955 Subtotal…………..…...…………….…… 391 54,313 400 55,477 407 56,476 418 58,265
Total full service and select service hotels 617 144,669 622 144,856 631 146,554 642 150,018
2018Q1 Q2 Q3 Q4
Full service hotels
United States Managed…………..…...…… 96 52,348 95 52,037 96 52,225 143 63,282
Other Americas Managed…………..…... 22 8,776 22 8,780 23 9,152 26 8,935
United States Franchised…………..…...… 50 15,426 53 17,349 52 17,154 52 17,153
Other Americas Franchised…………..… 3 408 5 828 5 828 5 828
Subtotal…………..…...…………….…… 171 76,958 175 78,994 176 79,359 226 90,198
Select service hotels
United States Managed…………..…...…… 52 7,402 53 7,570 52 7,408 48 6,917
Other Americas Managed…………..…... 10 1,476 10 1,476 10 1,476 10 1,476
United States Franchised…………..…...… 293 40,440 299 41,204 306 42,193 320 44,069
Other Americas Franchised…………..… 5 801 5 801 5 684 5 684 Subtotal…………..…...…………….…… 360 50,119 367 51,051 373 51,761 383 53,146
Total full service and select service hotels 531 127,077 542 130,045 549 131,120 609 143,344
2017Q1 Q2 Q3 Q4
Full service hotels
United States Managed…………..…...…… 99 53,525 97 52,835 97 52,889 96 52,378
Other Americas Managed…………..…... 22 7,518 22 7,506 21 7,196 22 8,776
United States Franchised…………..…...… 44 13,526 46 14,222 48 14,859 49 15,228
Other Americas Franchised…………..… 1 44 1 44 2 182 3 408
Subtotal…………..…...…………….…… 166 74,613 166 74,607 168 75,126 170 76,790
Select service hotels
United States Managed…………..…...…… 54 7,653 54 7,653 54 7,653 55 7,802
Other Americas Managed…………..…... 9 1,335 9 1,335 9 1,335 9 1,335
United States Franchised…………..…...… 262 36,008 275 37,781 279 38,336 288 39,806
Other Americas Franchised…………..… 4 682 5 801 5 801 5 801 Subtotal…………..…...…………….…… 329 45,678 343 47,570 347 48,125 357 49,744
Total full service and select service hotels 495 120,291 509 122,177 515 123,251 527 126,534
2016Q1 Q2 Q3 Q4
Full service hotels
United States Managed…………..…...…… 96 52,861 97 53,234 98 53,355 99 53,546
Other Americas Managed…………..…... 17 6,412 18 6,590 19 6,790 21 7,260
United States Franchised…………..…...… 43 13,515 43 13,515 44 13,563 45 13,793
Other Americas Franchised…………..… 1 44 1 44 1 44 1 44
Subtotal…………..…...…………….…… 157 72,832 159 73,383 162 73,752 166 74,643
Select service hotels
United States Managed…………..…...…… 55 7,699 55 7,699 56 7,902 56 7,902
Other Americas Managed…………..…... 7 1,038 7 1,038 7 1,038 9 1,335
United States Franchised…………..…...… 241 32,874 246 33,628 251 34,445 257 35,348
Other Americas Franchised…………..… 2 266 2 266 2 266 3 521 Subtotal…………..…...…………….…… 305 41,877 310 42,631 316 43,651 325 45,106
Total full service and select service hotels 462 114,709 469 116,014 478 117,403 491 119,749
(a) Figures do not include vacation ownership, residential, branded spas and fitness studios, or condominium ownership units.
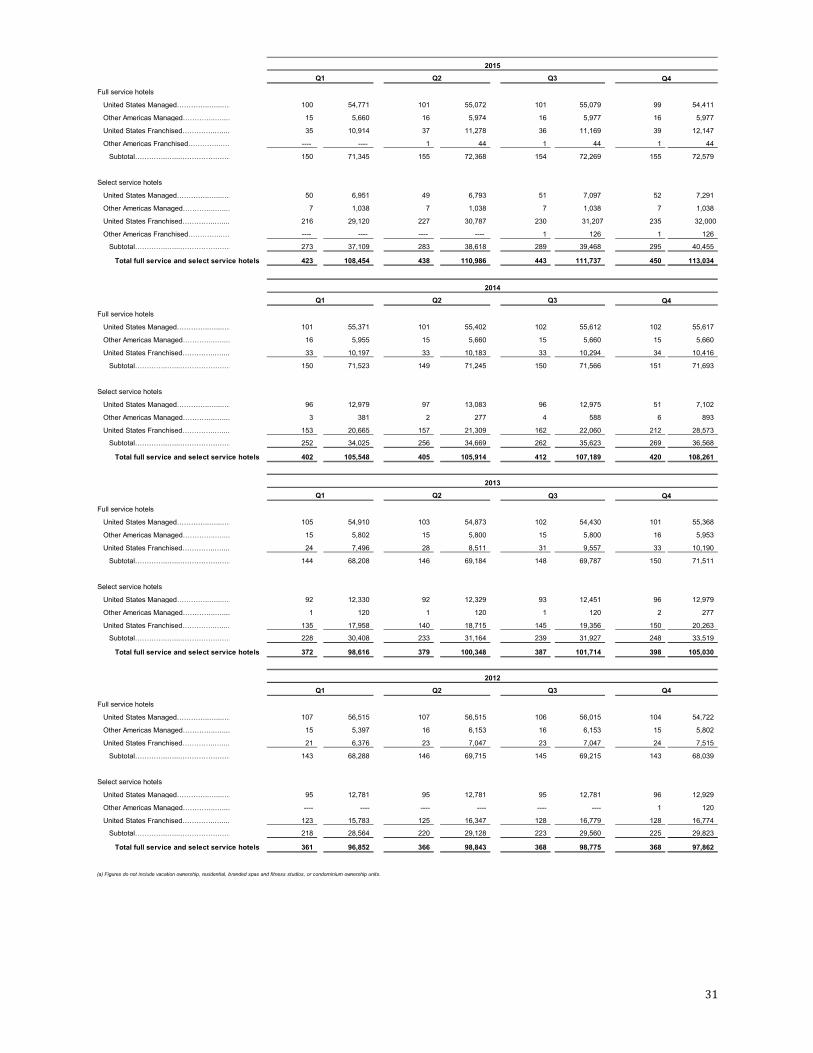
31
2015Q1 Q2 Q3 Q4
Full service hotels
United States Managed…………..…...…… 100 54,771 101 55,072 101 55,079 99 54,411
Other Americas Managed…………..…...… 15 5,660 16 5,974 16 5,977 16 5,977
United States Franchised…………..…...… 35 10,914 37 11,278 36 11,169 39 12,147
Other Americas Franchised…………..….. ---- ---- 1 44 1 44 1 44
Subtotal…………..…...…………….…… 150 71,345 155 72,368 154 72,269 155 72,579
Select service hotels
United States Managed…………..…...…… 50 6,951 49 6,793 51 7,097 52 7,291
Other Americas Managed…………..…...… 7 1,038 7 1,038 7 1,038 7 1,038
United States Franchised…………..…...… 216 29,120 227 30,787 230 31,207 235 32,000
Other Americas Franchised…………..….. ---- ---- ---- ---- 1 126 1 126
Subtotal…………..…...…………….…… 273 37,109 283 38,618 289 39,468 295 40,455
Total full service and select service hotels 423 108,454 438 110,986 443 111,737 450 113,034
2014Q1 Q2 Q3 Q4
Full service hotels
United States Managed…………..…...…… 101 55,371 101 55,402 102 55,612 102 55,617
Other Americas Managed…………..…...… 16 5,955 15 5,660 15 5,660 15 5,660
United States Franchised…………..…...… 33 10,197 33 10,183 33 10,294 34 10,416
Subtotal…………..…...…………….…… 150 71,523 149 71,245 150 71,566 151 71,693
Select service hotels
United States Managed…………..…...…… 96 12,979 97 13,083 96 12,975 51 7,102
Other Americas Managed…………..…...… 3 381 2 277 4 588 6 893
United States Franchised…………..…...… 153 20,665 157 21,309 162 22,060 212 28,573
Subtotal…………..…...…………….…… 252 34,025 256 34,669 262 35,623 269 36,568
Total full service and select service hotels 402 105,548 405 105,914 412 107,189 420 108,261
2013Q1 Q2 Q3 Q4
Full service hotels
United States Managed…………..…...…… 105 54,910 103 54,873 102 54,430 101 55,368
Other Americas Managed…………..…...… 15 5,802 15 5,800 15 5,800 16 5,953
United States Franchised…………..…...… 24 7,496 28 8,511 31 9,557 33 10,190
Subtotal…………..…...…………….…… 144 68,208 146 69,184 148 69,787 150 71,511
Select service hotels
United States Managed…………..…...…… 92 12,330 92 12,329 93 12,451 96 12,979
Other Americas Managed…………..…...… 1 120 1 120 1 120 2 277
United States Franchised…………..…...… 135 17,958 140 18,715 145 19,356 150 20,263
Subtotal…………..…...…………….…… 228 30,408 233 31,164 239 31,927 248 33,519
Total full service and select service hotels 372 98,616 379 100,348 387 101,714 398 105,030
2012Q1 Q2 Q3 Q4
Full service hotels
United States Managed…………..…...…… 107 56,515 107 56,515 106 56,015 104 54,722
Other Americas Managed…………..…...… 15 5,397 16 6,153 16 6,153 15 5,802
United States Franchised…………..…...… 21 6,376 23 7,047 23 7,047 24 7,515
Subtotal…………..…...…………….…… 143 68,288 146 69,715 145 69,215 143 68,039
Select service hotels
United States Managed…………..…...…… 95 12,781 95 12,781 95 12,781 96 12,929
Other Americas Managed…………..…...… ---- ---- ---- ---- ---- ---- 1 120
United States Franchised…………..…...… 123 15,783 125 16,347 128 16,779 128 16,774
Subtotal…………..…...…………….…… 218 28,564 220 29,128 223 29,560 225 29,823
Total full service and select service hotels 361 96,852 366 98,843 368 98,775 368 97,862
(a) Figures do not include vacation ownership, residential, branded spas and fitness studios, or condominium ownership units.
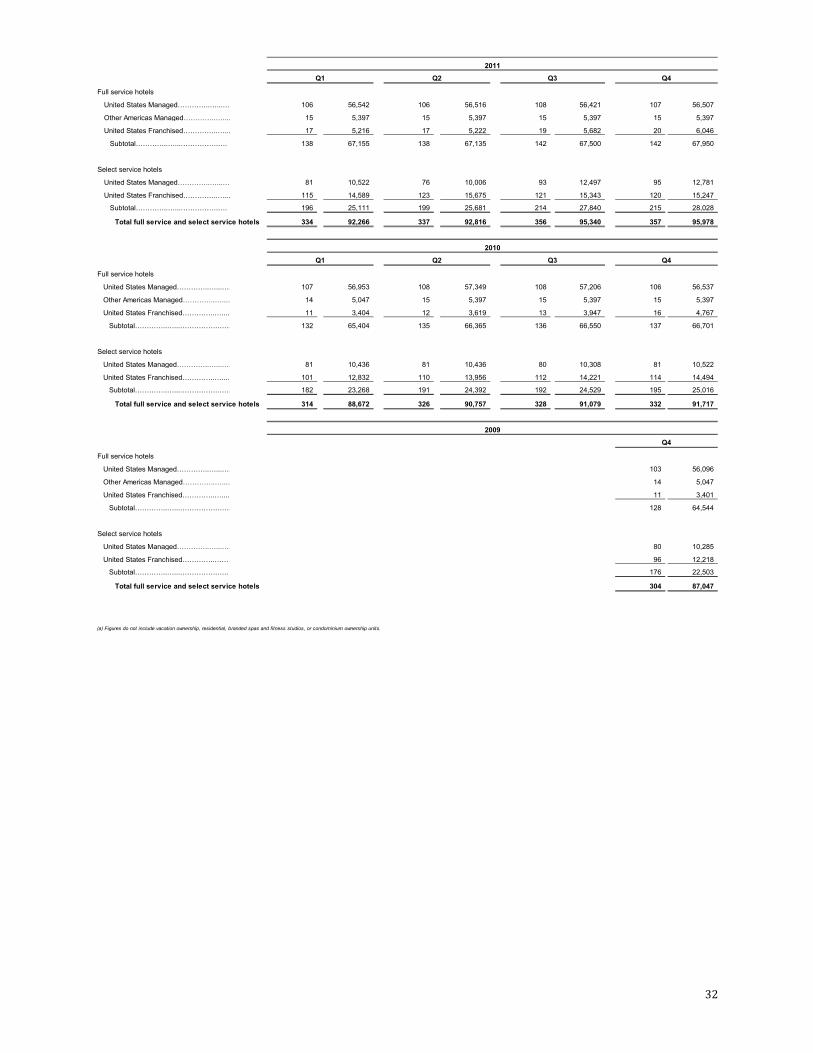
32
2011Q1 Q2 Q3 Q4
Full service hotels
United States Managed…………..…...… 106 56,542 106 56,516 108 56,421 107 56,507
Other Americas Managed…………..…...… 15 5,397 15 5,397 15 5,397 15 5,397
United States Franchised…………..…...… 17 5,216 17 5,222 19 5,682 20 6,046
Subtotal…………..…...…………….…. 138 67,155 138 67,135 142 67,500 142 67,950
Select service hotels
United States Managed…………..…...… 81 10,522 76 10,006 93 12,497 95 12,781
United States Franchised…………..…...… 115 14,589 123 15,675 121 15,343 120 15,247
Subtotal…………..…...…………….…. 196 25,111 199 25,681 214 27,840 215 28,028
Total full service and select service hotels 334 92,266 337 92,816 356 95,340 357 95,978
2010Q1 Q2 Q3 Q4
Full service hotels
United States Managed…………..…...…… 107 56,953 108 57,349 108 57,206 106 56,537
Other Americas Managed…………..…...… 14 5,047 15 5,397 15 5,397 15 5,397
United States Franchised…………..…...… 11 3,404 12 3,619 13 3,947 16 4,767
Subtotal…………..…...…………….…… 132 65,404 135 66,365 136 66,550 137 66,701
Select service hotels
United States Managed…………..…...…… 81 10,436 81 10,436 80 10,308 81 10,522
United States Franchised…………..…...… 101 12,832 110 13,956 112 14,221 114 14,494
Subtotal…………..…...…………….…… 182 23,268 191 24,392 192 24,529 195 25,016
Total full service and select service hotels 314 88,672 326 90,757 328 91,079 332 91,717
2009Q4
Full service hotels
United States Managed…………..…...…… 103 56,096
Other Americas Managed…………..…...… 14 5,047
United States Franchised…………..…...… 11 3,401
Subtotal…………..…...…………….…… 128 64,544
Select service hotels
United States Managed…………..…...…… 80 10,285
United States Franchised…………..…… 96 12,218
Subtotal…………..…...…………….….. 176 22,503
Total full service and select service hotels 304 87,047
(a) Figures do not include vacation ownership, residential, branded spas and fitness studios, or condominium ownership units.

33
Americas Comparable Managed and Franchised Hotels Statistics (unaudited) (a) (b) (c)
(includes owned and leased hotels)
2019Q1 Q2 Q3 Q4 YE
Full service hotels
ADR (c)……………………………………… 216.65$ 215.63$ 205.11$ 209.83$ 211.75$
Occupancy (c)……………………………… 71.8% 79.9% 77.6% 70.5% 74.9%
RevPAR (c)………………………………… 155.54$ 172.28$ 159.14$ 147.84$ 158.68$
RevPAR Change (in constant $)(b)……… 3.1% 2.5% 1.5% (0.6%) 1.7%
Select service hotels
ADR (c)……………………………………… 138.85$ 142.25$ 139.03$ 133.84$ 138.60$
Occupancy (c)……………………………… 71.9% 80.1% 79.2% 71.8% 75.7%
RevPAR (c)………………………………… 99.78$ 113.89$ 110.04$ 96.13$ 104.97$
RevPAR Change (in constant $)(b)……… (1.5%) (2.4%) (2.4%) (1.8%) (2.0%)
2018Q1 Q2 Q3 Q4 YE
Full service hotels
ADR (c)……………………………………… 208.60$ 211.71$ 203.20$ 209.05$ 208.96$
Occupancy (c)……………………………… 73.1% 80.2% 78.4% 72.0% 75.9%
RevPAR (c)………………………………… 152.52$ 169.79$ 159.26$ 150.45$ 158.67$
RevPAR Change (b)……………………… 3.2% 3.8% 2.3% 2.7% 2.9%
RevPAR Change (in constant $)(b)……… 3.1% 4.0% 3.0% 3.4% 3.3%
Select service hotels
ADR (c)……………………………………… 139.09$ 143.12$ 140.19$ 134.94$ 139.52$
Occupancy (c)……………………………… 74.3% 81.6% 80.1% 72.1% 77.1%
RevPAR (c)………………………………… 103.31$ 116.73$ 112.34$ 97.30$ 107.60$
RevPAR Change (b)……………………… 3.7% 2.6% (0.8%) (3.8%) 0.4%
RevPAR Change (in constant $)(b)……… 3.6% 2.6% (0.7%) (3.7%) 0.4%
2017Q1 Q2 Q3 Q4 YE
Full service hotels
ADR (c)……………………………………… 206.80$ 205.82$ 198.09$ 204.69$ 204.59$
Occupancy (c)……………………………… 71.4% 79.5% 78.6% 71.6% 75.4%
RevPAR (c)………………………………… 147.75$ 163.55$ 155.64$ 146.57$ 154.20$
RevPAR Change (b)……………………… 5.0% 1.4% (0.1%) 3.4% 2.4%
RevPAR Change (in constant $)(b)……… 5.1% 1.6% (0.3%) 3.3% 2.4%
Select service hotels
ADR (c)……………………………………… 136.98$ 140.05$ 138.25$ 135.92$ 137.90$
Occupancy (c)……………………………… 72.8% 81.2% 81.9% 74.4% 77.7%
RevPAR (c)………………………………… 99.67$ 113.76$ 113.23$ 101.16$ 107.19$
RevPAR Change (b)……………………… 3.8% 1.8% 1.7% 4.5% 2.9%
RevPAR Change (in constant $)(b)……… 3.9% 1.8% 1.7% 4.5% 2.9%
2016Q1 Q2 Q3 Q4 YE
Full service hotels
ADR (c)……………………………………… 199.44$ 203.73$ 198.22$ 200.54$ 200.71$
Occupancy (c)……………………………… 71.2% 79.9% 79.4% 70.8% 75.3%
RevPAR (c)………………………………… 142.02$ 162.81$ 157.41$ 142.00$ 151.17$
RevPAR Change (b)……………………… 1.3% 2.8% 3.6% 1.5% 2.3%
RevPAR Change (in constant $)(b)……… 2.2% 3.4% 3.8% 1.9% 2.8%
Select service hotels
ADR (c)……………………………………… 132.47$ 137.93$ 137.18$ 132.54$ 135.27$
Occupancy (c)……………………………… 73.3% 81.6% 81.3% 73.0% 77.3%
RevPAR (c)………………………………… 97.06$ 112.61$ 111.56$ 96.77$ 104.61$
RevPAR Change (b)……………………… 6.7% 6.8% 4.6% 3.2% 5.3%
RevPAR Change (in constant $)(b)……… 6.8% 6.9% 4.6% 3.2% 5.4%
(b) RevPAR change and RevPAR change (in constant $) is that which was published in the applicable quarterly filing. (c) This data represents information reported in the most recent public filing in which the stated period was presented.
(a) Inventory included for comparable calculations may vary in each time period based on the definition of comparable hotels on the latest date the information was published.

34
2015Q1 Q2 Q3 Q4 YE
Full service hotels
ADR (c)……………………………………… 193.77$ 198.03$ 193.46$ 196.10$ 195.37$
Occupancy (c)……………………………… 72.1% 80.0% 78.8% 71.0% 75.5%
RevPAR (c)………………………………… 139.74$ 158.48$ 152.45$ 139.30$ 147.50$
RevPAR Change (b)……………………… 7.5% 6.3% 4.0% 4.2% 5.5%
RevPAR Change (in constant $)(b)……… 8.3% 7.3% 5.3% 5.4% 6.6%
Select service hotels
ADR (c)……………………………………… 128.44$ 130.88$ 130.58$ 126.48$ 129.13$
Occupancy (c)……………………………… 72.2% 80.1% 80.9% 73.6% 76.7%
RevPAR (c)………………………………… 92.73$ 104.85$ 105.60$ 93.07$ 99.04$
RevPAR Change (b)……………………… 10.1% 7.2% 7.2% 6.4% 7.7%
RevPAR Change (in constant $)(b)……… 10.1% 7.2% 7.2% 6.4% 7.7%
2014Q1 Q2 Q3 Q4 YE
Full service hotels
ADR (c)……………………………………… 184.59$ 188.49$ 186.19$ 188.62$ 186.87$
Occupancy (c)……………………………… 70.6% 78.9% 78.5% 70.6% 74.7%
RevPAR (c)………………………………… 130.38$ 148.75$ 146.10$ 133.17$ 139.52$
RevPAR Change (b)……………………… 7.7% 5.6% 8.4% 5.0% 6.6%
RevPAR Change (in constant $)(b)……… 8.6% 6.3% 8.8% 5.8% 7.3%
Select service hotels
ADR (c)……………………………………… 117.41$ 121.71$ 123.52$ 121.12$ 121.12$
Occupancy (c)……………………………… 72.5% 80.7% 80.2% 72.3% 76.5%
RevPAR (c)………………………………… 85.17$ 98.24$ 99.11$ 87.60$ 92.65$
RevPAR Change (b)……………………… 7.0% 8.4% 9.7% 7.3% 8.1%
RevPAR Change (in constant $)(b)……… 7.0% 8.4% 9.7% 7.3% 8.2%
2013Q1 Q2 Q3 Q4 YE
Full service hotels
ADR (c)……………………………………… 177.47$ 182.03$ 175.59$ 179.86$ 178.81$
Occupancy (c)……………………………… 69.2% 77.7% 78.1% 70.3% 73.9%
RevPAR (c)………………………………… 122.74$ 141.48$ 137.11$ 126.51$ 132.14$
RevPAR Change (b)……………………… 2.6% 5.5% 7.3% 6.7% 5.6%
RevPAR Change (in constant $)(b)……… 2.8% 5.6% 7.7% 7.3% 5.9%
Select service hotels
ADR (c)……………………………………… 110.08$ 110.40$ 110.57$ 108.13$ 109.82$
Occupancy (c)……………………………… 72.4% 79.8% 79.1% 73.2% 76.1%
RevPAR (c)………………………………… 79.70$ 88.09$ 87.45$ 79.16$ 83.61$
RevPAR Change (b)……………………… 6.4% 6.0% 4.5% 4.0% 5.2%
RevPAR Change (in constant $)(b)……… 6.4% 6.0% 4.5% 4.0% 5.2%
2012Q1 Q2 Q3 Q4 YE
Full service hotels
ADR (c)……………………………………… 171.67$ 173.54$ 168.82$ 174.54$ 172.46$
Occupancy (c)……………………………… 70.3% 77.5% 75.9% 68.1% 72.9%
RevPAR (c)………………………………… 120.60$ 134.56$ 128.12$ 118.81$ 125.67$
RevPAR Change (b)……………………… 8.2% 8.6% 4.0% 5.3% 6.5%
RevPAR Change (in constant $)(b)……… ---- ---- ---- 5.4% 6.8%
Select service hotels
ADR (c)……………………………………… 104.03$ 104.57$ 105.00$ 103.46$ 104.29$
Occupancy (c)……………………………… 70.9% 78.6% 78.7% 72.3% 75.1%
RevPAR (c)………………………………… 73.77$ 82.18$ 82.59$ 74.75$ 78.33$
RevPAR Change (b)……………………… 7.2% 6.4% 6.0% 8.7% 7.0%
RevPAR Change (in constant $)(b)……… ---- ---- ---- 8.7% 7.0%
(b) RevPAR change and RevPAR change (in constant $) is that which was published in the applicable quarterly filing. (c) This data represents information reported in the most recent public filing in which the stated period was presented.
(a) Inventory included for comparable calculations may vary in each time period based on the definition of comparable hotels on the latest date the information was published.

35
2011Q1 Q2 Q3 Q4 YE
Full service hotels
ADR (c)……………………………………… 166.53$ 165.77$ 161.39$ 166.21$ 164.87$
Occupancy (c)……………………………… 66.7% 74.8% 76.2% 67.6% 71.3%
RevPAR (c)………………………………… 111.02$ 124.07$ 123.00$ 112.28$ 117.61$
RevPAR Change (b)……………………… 8.7% 5.6% 7.8% 6.5% 7.1%
Select service hotels
ADR (c)……………………………………… 98.38$ 97.11$ 96.91$ 95.74$ 97.02$
Occupancy (c)……………………………… 68.6% 77.6% 77.8% 69.7% 73.4%
RevPAR (c)………………………………… 67.45$ 75.33$ 75.42$ 66.70$ 71.24$
RevPAR Change (b)……………………… 11.6% 9.6% 8.8% 5.5% 8.8%
2010Q1 Q2 Q3 Q4 YE
Full service hotels
ADR (c)……………………………………… 157.64$ 159.39$ 153.78$ 160.37$ 157.72$
Occupancy (c)……………………………… 64.2% 73.1% 73.3% 64.9% 68.9%
RevPAR (c)………………………………… 101.17$ 116.53$ 112.77$ 104.11$ 108.67$
RevPAR Change (b)……………………… (1.9%) 7.2% 7.9% 4.4% 4.5%
Select service hotels
ADR (c)……………………………………… 94.41$ 93.03$ 92.68$ 91.32$ 92.79$
Occupancy (c)……………………………… 65.0% 73.7% 74.0% 68.8% 70.4%
RevPAR (c)………………………………… 61.39$ 68.59$ 68.62$ 62.83$ 65.35$
RevPAR Change (b)……………………… 2.6% 7.8% 9.1% 9.5% 7.3%
2009Q1 Q2 Q3 Q4 YE
Full service hotels
ADR (c)……………………………………… 169.61$ 159.72$ 148.42$ 154.61$ 157.70$
Occupancy (c)……………………………… 60.7% 67.5% 69.6% 63.8% 65.4%
RevPAR (c)………………………………… 102.92$ 107.87$ 103.33$ 98.69$ 103.19$
Select service hotels
ADR (c)……………………………………… 104.50$ 97.24$ 90.94$ 90.78$ 95.50$
Occupancy (c)……………………………… 57.9% 66.8% 70.5% 64.0% 64.8%
RevPAR (c)………………………………… 60.53$ 64.92$ 64.09$ 58.11$ 61.91$
(b) RevPAR change and RevPAR change (in constant $) is that which was published in the applicable quarterly filing. (c) This data represents information reported in the most recent public filing in which the stated period was presented.
(a) Inventory included for comparable calculations may vary in each time period based on the definition of comparable hotels on the latest date the information was published.

36
Total ASPAC Managed and Franchised Hotels (unaudited) (a)
(includes owned and leased hotels)
Properties Rooms Properties Rooms Properties Rooms Properties Rooms
2019
Full service hotels
Managed…………..…...………………………… 102 33,529 103 33,754 106 34,911 110 36,026
Franchised…………..………………………… 4 1,591 4 1,708 5 1,758 6 1,933
Subtotal…………..…...………….…………. 106 35,120 107 35,462 111 36,669 116 37,959
Select service hotels
Managed…………..…...……………………… 24 4,057 26 4,429 28 4,982 29 5,307
Franchised…………..………………………… ---- ---- ---- ---- ---- ---- 1 160 Subtotal…………..…...………….…………. 24 4,057 26 4,429 28 4,982 30 5,467 Total managed and franchised hotels 130 39,177 133 39,891 139 41,651 146 43,426
2018
Full service hotels
Managed…………..…...………………………… 80 29,244 82 29,772 86 30,871 102 33,570
Franchised…………..………………………… 3 1,286 3 1,286 4 1,591 4 1,591
Subtotal…………..…...………….…………. 83 30,530 85 31,058 90 32,462 106 35,161
Select service hotels
Managed…………..…...……………………… 17 2,921 17 2,921 17 2,921 23 3,903 Subtotal…………..…...………….…………. 17 2,921 17 2,921 17 2,921 23 3,903 Total managed and franchised hotels 100 33,451 102 33,979 107 35,383 129 39,064
2017
Full service hotels
Managed…………..…...………………………… 76 27,940 78 28,483 79 28,831 80 29,173
Franchised…………..………………………… 3 1,286 3 1,286 3 1,286 3 1,286
Subtotal…………..…...………….…………. 79 29,226 81 29,769 82 30,117 83 30,459
Select service hotels
Managed…………..…...……………………… 5 824 9 1,448 9 1,448 15 2,533 Subtotal…………..…...………….…………. 5 824 9 1,448 9 1,448 15 2,533 Total managed and franchised hotels 84 30,050 90 31,217 91 31,565 98 32,992
2016
Full service hotels
Managed…………..…...………………………… 69 25,415 70 25,717 73 26,678 75 27,669
Franchised…………..………………………… 3 1,284 3 1,286 3 1,286 3 1,286
Subtotal…………..…...………….…………. 72 26,699 73 27,003 76 27,964 78 28,955
Select service hotels
Managed…………..…...……………………… 1 138 5 826 5 826 5 826 Subtotal…………..…...………….…………. 1 138 5 826 5 826 5 826 Total managed and franchised hotels 73 26,837 78 27,829 81 28,790 83 29,781
2015
Full service hotels
Managed…………..…...………………………… 64 23,789 65 23,850 66 24,163 68 24,848
Franchised…………..………………………… 2 988 2 988 3 1,282 3 1,284
Subtotal…………..…...………….…………. 66 24,777 67 24,838 69 25,445 71 26,132
Select service hotels
Managed…………..…...……………………… 1 144 1 144 1 144 1 144 Subtotal…………..…...………….…………. 1 144 1 144 1 144 1 144 Total managed and franchised hotels 67 24,921 68 24,982 70 25,589 72 26,276
(a) Figures do not include vacation ownership, residential, branded spas and fitness studios, or condominium ownership units.
Q1 Q2 Q3 Q4
Q4
Q4
Q1 Q2 Q3
Q1 Q2 Q3
Q1 Q2 Q3 Q4
Q1 Q2 Q3 Q4
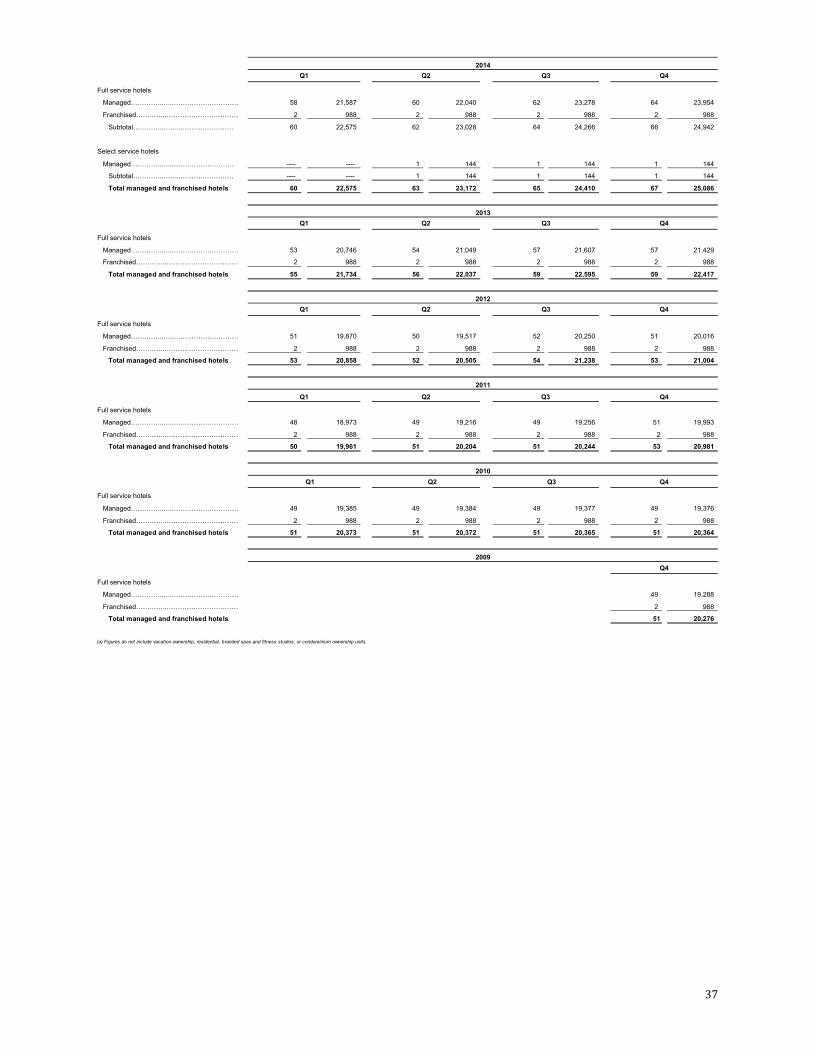
37
2014
Full service hotels
Managed…………..…...………………………… 58 21,587 60 22,040 62 23,278 64 23,954
Franchised…………..…………………………… 2 988 2 988 2 988 2 988
Subtotal…………..…...………….…………. 60 22,575 62 23,028 64 24,266 66 24,942
Select service hotels
Managed…………..…...……………………… ---- ---- 1 144 1 144 1 144
Subtotal…………..…...………….…………. ---- ---- 1 144 1 144 1 144
Total managed and franchised hotels 60 22,575 63 23,172 65 24,410 67 25,086
2013
Full service hotels
Managed…………..…...………………………… 53 20,746 54 21,049 57 21,607 57 21,429
Franchised…………..…………………………… 2 988 2 988 2 988 2 988
Total managed and franchised hotels 55 21,734 56 22,037 59 22,595 59 22,417
2012
Full service hotels
Managed…………..…...………………………… 51 19,870 50 19,517 52 20,250 51 20,016
Franchised…………..…………………………… 2 988 2 988 2 988 2 988
Total managed and franchised hotels 53 20,858 52 20,505 54 21,238 53 21,004
2011Q1 Q2 Q3 Q4
Full service hotels
Managed…………..…...………………………… 48 18,973 49 19,216 49 19,256 51 19,993
Franchised…………..…………………………… 2 988 2 988 2 988 2 988
Total managed and franchised hotels 50 19,961 51 20,204 51 20,244 53 20,981
2010Q1 Q2 Q3 Q4
Full service hotels
Managed…………..…...………………………… 49 19,385 49 19,384 49 19,377 49 19,376
Franchised…………..…………………………… 2 988 2 988 2 988 2 988
Total managed and franchised hotels 51 20,373 51 20,372 51 20,365 51 20,364
2009Q4
Full service hotels
Managed…………..…...………………………… 49 19,288
Franchised…………..…………………………… 2 988
Total managed and franchised hotels 51 20,276
Q4Q1 Q2 Q3
Q1 Q2
Q1 Q2 Q3
(a) Figures do not include vacation ownership, residential, branded spas and fitness studios, or condominium ownership units.
Q4
Q3 Q4

38
ASPAC Comparable Managed and Franchised Hotels Statistics (unaudited) (a) (b) (c)
(includes owned and leased hotels)
2019Q1 Q2 Q3 Q4 YE
Full service hotels
ADR (c)…………………………………………… 207.29$ 197.86$ 190.80$ 205.26$ 200.57$
Occupancy (c)…………………………………… 71.6% 74.8% 76.3% 75.3% 74.5%
RevPAR (c)……………………………………… 148.46$ 148.02$ 145.55$ 154.63$ 149.35$
RevPAR Change (in constant $)(b)……………… 1.2% 1.2% (2.0%) (3.5%) (0.8%)
Select service hotels
ADR (c)……………………………………………. 87.28$ 84.37$ 80.00$ 86.14$ 84.36$
Occupancy (c)……………………………………. 63.6% 70.3% 70.3% 69.7% 68.5%
RevPAR (c)……………………………………….. 55.55$ 59.33$ 56.23$ 60.03$ 57.79$
RevPAR Change (in constant $)(b)……………………… 14.2% 10.3% 5.7% 4.2% 8.4%
2018Q1 Q2 Q3 Q4 YE
Full service hotels
ADR (c)…………………………………………… 214.40$ 205.37$ 194.41$ 208.97$ 205.77$
Occupancy (c)…………………………………… 71.3% 74.9% 77.7% 76.6% 75.4%
RevPAR (c)……………………………………… 152.83$ 153.85$ 150.97$ 160.04$ 155.13$
RevPAR Change (b)………………………………. 12.0% 7.8% 0.7% (0.6%) 4.7%
RevPAR Change (in constant $)(b)……………… 6.7% 4.2% 2.5% 2.1% 3.8%
2017Q1 Q2 Q3 Q4 YE
Full service hotels
ADR (c)…………………………………………… 201.25$ 196.38$ 196.71$ 213.54$ 202.24$
Occupancy (c)…………………………………… 67.8% 72.7% 76.2% 75.4% 73.3%
RevPAR (c)……………………………………… 136.45$ 142.74$ 149.86$ 161.00$ 148.20$
RevPAR Change (b)………………………………. 5.0% 5.4% 5.0% 5.8% 5.4%
RevPAR Change (in constant $)(b)……………… 5.2% 7.2% 6.3% 4.3% 5.8%
2016Q1 Q2 Q3 Q4 YE
Full service hotels
ADR (c)…………………………………………… 208.94$ 204.52$ 200.70$ 207.71$ 205.23$
Occupancy (c)…………………………………… 63.5% 66.3% 70.7% 72.5% 68.4%
RevPAR (c)……………………………………… 132.64$ 135.57$ 141.93$ 150.65$ 140.28$
RevPAR Change (b)………………………………. (1.6%) 0.2% 4.4% 4.3% 1.9%
RevPAR Change (in constant $)(b)……………… 1.9% 1.4% 1.8% 3.6% 2.2%
2015Q1 Q2 Q3 Q4 YE
Full service hotels
ADR (c)…………………………………………… 218.56$ 215.00$ 203.60$ 215.32$ 212.95$
Occupancy (c)…………………………………… 64.5% 66.8% 70.1% 70.3% 67.9%
RevPAR (c)……………………………………… 140.92$ 143.66$ 142.74$ 151.36$ 144.69$
RevPAR Change (b)………………………………. ---- (4.2%) (5.6%) (4.0%) (3.5%)
RevPAR Change (in constant $)(b)……………… 5.8% 2.2% 3.1% 2.1% 3.3%
2014Q1 Q2 Q3 Q4 YE
Full service hotels
ADR (c)…………………………………………… 229.10$ 230.36$ 224.58$ 231.66$ 229.57$
Occupancy (c)…………………………………… 64.3% 67.0% 70.0% 71.0% 68.2%
RevPAR (c)……………………………………… 147.21$ 154.43$ 157.16$ 164.50$ 156.66$
RevPAR Change (b)………………………………. 2.4% 3.6% 3.5% (0.9%) 2.0%
RevPAR Change (in constant $)(b)……………… 7.3% 5.1% 4.1% 3.1% 4.9%
2013Q1 Q2 Q3 Q4 YE
Full service hotels
ADR (c)…………………………………………… 231.82$ 229.60$ 221.84$ 237.50$ 231.26$
Occupancy (c)…………………………………… 63.7% 66.7% 68.1% 70.5% 67.0%
RevPAR (c)……………………………………… 147.65$ 153.03$ 151.10$ 167.40$ 154.97$
RevPAR Change (b)………………………………. (2.6%) (3.5%) (3.0%) (1.3%) (2.6%)
RevPAR Change (in constant $)(b)……………… (0.4%) (0.7%) 2.1% 4.2% 1.3%
(a) Inventory included for comparable calculations may vary in each time period based on the definition of comparable hotels on the latest date the information was published.
(c) This data represents information reported in the most recent public filing in which the stated period was presented.(b) RevPAR change and RevPAR change (in constant $) is that which was published in the applicable quarterly filing.

39
2012Q1 Q2 Q3 Q4 YE
Full service hotels
ADR (c)…………………………………………… 236.27$ 237.41$ 229.64$ 245.02$ 237.13$
Occupancy (c)…………………………………… 63.9% 67.1% 67.9% 68.6% 66.9%
RevPAR (c)……………………………………… 151.02$ 159.24$ 155.98$ 167.97$ 158.59$
RevPAR Change (b)………………………………. 10.2% 8.8% 3.7% 3.1% 6.7%
RevPAR Change (in constant $)(b)……………… ---- ---- ---- 2.9% 6.9%
2011Q1 Q2 Q3 Q4 YE
Full service hotels
ADR (c)…………………………………………… 218.59$ 228.70$ 226.36$ 237.47$ 226.43$
Occupancy (c)…………………………………… 65.9% 66.6% 68.5% 71.9% 68.2%
RevPAR (c)……………………………………… 144.12$ 152.34$ 155.16$ 170.72$ 154.37$
RevPAR Change (b)………………………………. 15.4% 8.7% 10.2% 6.3% 9.8%
2010Q1 Q2 Q3 Q4 YE
Full service hotels
ADR (c)…………………………………………… 197.77$ 207.44$ 203.68$ 226.13$ 209.26$
Occupancy (c)…………………………………… 62.3% 65.9% 68.1% 70.7% 66.8%
RevPAR (c)……………………………………… 123.16$ 136.65$ 138.74$ 159.80$ 139.72$
RevPAR Change (b)………………………………. 25.3% 32.0% 23.8% 19.0% 24.5%
2009Q1 Q2 Q3 Q4 YE
Full service hotels
ADR (c)…………………………………………… 187.60$ 188.04$ 186.24$ 204.05$ 191.99$
Occupancy (c)…………………………………… 54.0% 55.4% 61.0% 66.2% 59.2%
RevPAR (c)……………………………………… 101.34$ 104.20$ 113.65$ 135.09$ 113.67$
(a) Inventory included for comparable calculations may vary in each time period based on the definition of comparable hotels on the latest date the information was published.
(c) This data represents information reported in the most recent public filing in which the stated period was presented.(b) RevPAR change and RevPAR change (in constant $) is that which was published in the applicable quarterly filing.
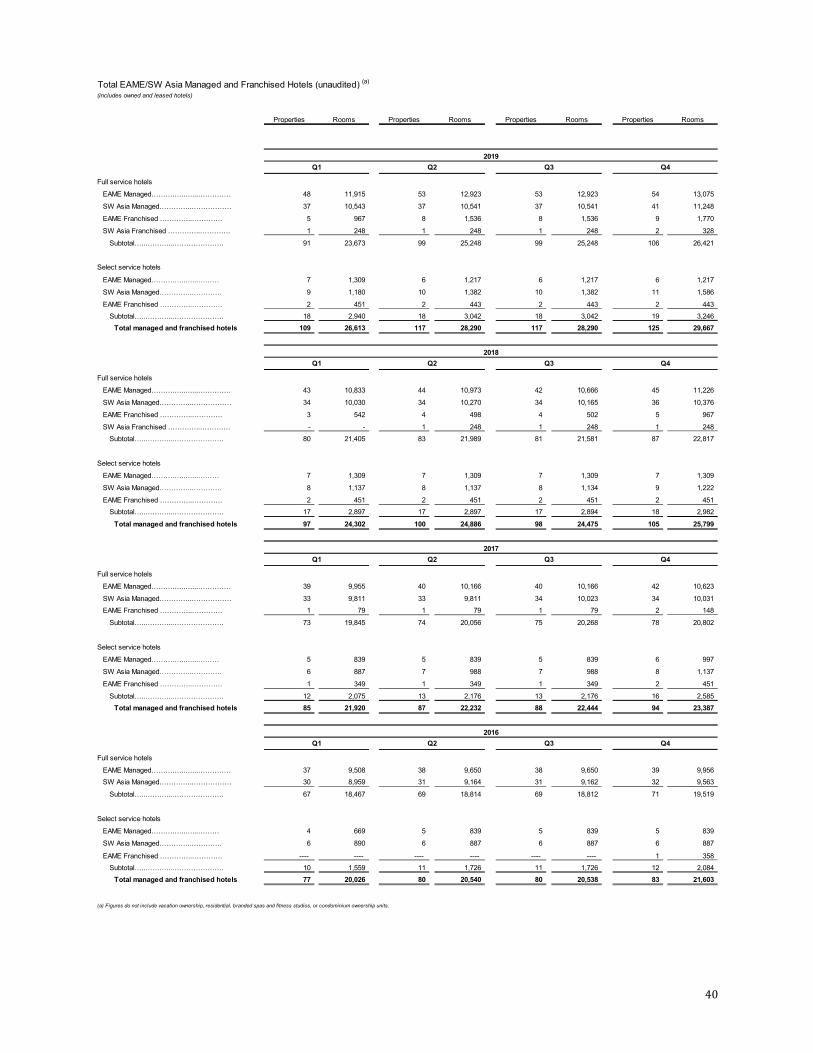
40
Total EAME/SW Asia Managed and Franchised Hotels (unaudited) (a)
(includes owned and leased hotels)
Properties Rooms Properties Rooms Properties Rooms Properties Rooms
2019
Full service hotels
EAME Managed……….…..…...…………… 48 11,915 53 12,923 53 12,923 54 13,075
SW Asia Managed…………..……………… 37 10,543 37 10,541 37 10,541 41 11,248
EAME Franchised …………..…………. 5 967 8 1,536 8 1,536 9 1,770
SW Asia Franchised …………..…………. 1 248 1 248 1 248 2 328
Subtotal…..………...…………………. 91 23,673 99 25,248 99 25,248 106 26,421
Select service hotels
EAME Managed……….…..…...……… 7 1,309 6 1,217 6 1,217 6 1,217
SW Asia Managed…………..…………. 9 1,180 10 1,382 10 1,382 11 1,586
EAME Franchised …………..…………. 2 451 2 443 2 443 2 443 Subtotal…..………...…………………. 18 2,940 18 3,042 18 3,042 19 3,246
Total managed and franchised hotels 109 26,613 117 28,290 117 28,290 125 29,667
2018
Full service hotels
EAME Managed……….…..…...…………… 43 10,833 44 10,973 42 10,666 45 11,226
SW Asia Managed…………..……………… 34 10,030 34 10,270 34 10,165 36 10,376
EAME Franchised …………..…………. 3 542 4 498 4 502 5 967
SW Asia Franchised …………..…………. - - 1 248 1 248 1 248 Subtotal…..………...…………………. 80 21,405 83 21,989 81 21,581 87 22,817
Select service hotels
EAME Managed……….…..…...……… 7 1,309 7 1,309 7 1,309 7 1,309
SW Asia Managed…………..…………. 8 1,137 8 1,137 8 1,134 9 1,222
EAME Franchised …………..…………. 2 451 2 451 2 451 2 451 Subtotal…..………...…………………. 17 2,897 17 2,897 17 2,894 18 2,982
Total managed and franchised hotels 97 24,302 100 24,886 98 24,475 105 25,799
2017
Full service hotels
EAME Managed……….…..…...…………… 39 9,955 40 10,166 40 10,166 42 10,623
SW Asia Managed…………..……………… 33 9,811 33 9,811 34 10,023 34 10,031 EAME Franchised …………..…………. 1 79 1 79 1 79 2 148
Subtotal…..………...…………………. 73 19,845 74 20,056 75 20,268 78 20,802
Select service hotels
EAME Managed……….…..…...……… 5 839 5 839 5 839 6 997
SW Asia Managed…………..…………. 6 887 7 988 7 988 8 1,137
EAME Franchised …………..…………. 1 349 1 349 1 349 2 451
Subtotal…..………...…………………. 12 2,075 13 2,176 13 2,176 16 2,585 Total managed and franchised hotels 85 21,920 87 22,232 88 22,444 94 23,387
2016
Full service hotels
EAME Managed……….…..…...…………… 37 9,508 38 9,650 38 9,650 39 9,956 SW Asia Managed…………..……………… 30 8,959 31 9,164 31 9,162 32 9,563
Subtotal…..………...…………………. 67 18,467 69 18,814 69 18,812 71 19,519
Select service hotels
EAME Managed……….…..…...……… 4 669 5 839 5 839 5 839
SW Asia Managed…………..…………. 6 890 6 887 6 887 6 887
EAME Franchised …………..…………. ---- ---- ---- ---- ---- ---- 1 358 Subtotal…..………...…………………. 10 1,559 11 1,726 11 1,726 12 2,084
Total managed and franchised hotels 77 20,026 80 20,540 80 20,538 83 21,603
(a) Figures do not include vacation ownership, residential, branded spas and fitness studios, or condominium ownership units.
Q1 Q2 Q3 Q4
Q1 Q2 Q3 Q4
Q1 Q2 Q3 Q4
Q1 Q2 Q3 Q4
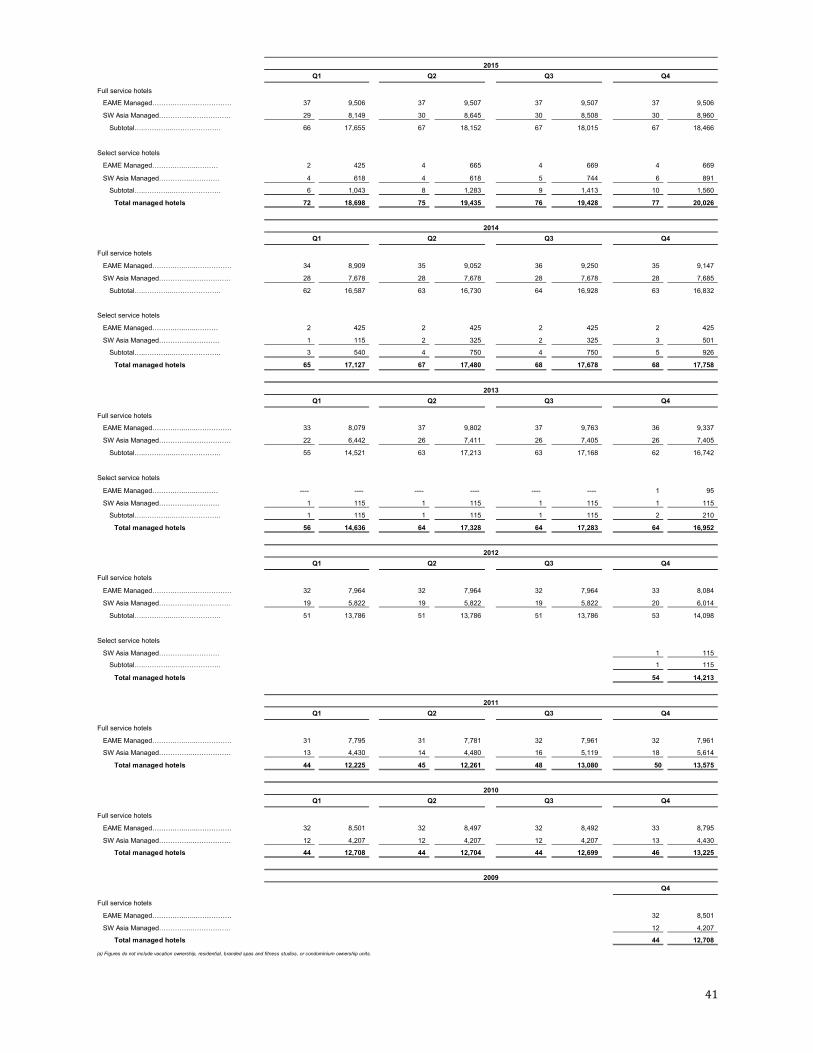
41
2015
Full service hotels
EAME Managed……….…..…...…………… 37 9,506 37 9,507 37 9,507 37 9,506
SW Asia Managed…………..……………… 29 8,149 30 8,645 30 8,508 30 8,960
Subtotal…..………...…………………. 66 17,655 67 18,152 67 18,015 67 18,466
Select service hotels
EAME Managed……….…..…...……… 2 425 4 665 4 669 4 669
SW Asia Managed…………..…………. 4 618 4 618 5 744 6 891
Subtotal…..………...…………………. 6 1,043 8 1,283 9 1,413 10 1,560
Total managed hotels 72 18,698 75 19,435 76 19,428 77 20,026
2014
Full service hotels
EAME Managed……….…..…...…………… 34 8,909 35 9,052 36 9,250 35 9,147
SW Asia Managed…………..……………… 28 7,678 28 7,678 28 7,678 28 7,685
Subtotal…..………...…………………. 62 16,587 63 16,730 64 16,928 63 16,832
Select service hotels
EAME Managed……….…..…...……… 2 425 2 425 2 425 2 425
SW Asia Managed…………..…………. 1 115 2 325 2 325 3 501
Subtotal…..………...…………………. 3 540 4 750 4 750 5 926
Total managed hotels 65 17,127 67 17,480 68 17,678 68 17,758
2013
Full service hotels
EAME Managed……….…..…...…………… 33 8,079 37 9,802 37 9,763 36 9,337
SW Asia Managed…………..……………… 22 6,442 26 7,411 26 7,405 26 7,405
Subtotal…..………...…………………. 55 14,521 63 17,213 63 17,168 62 16,742
Select service hotels
EAME Managed……….…..…...……… ---- ---- ---- ---- ---- ---- 1 95
SW Asia Managed…………..…………. 1 115 1 115 1 115 1 115
Subtotal…..………...…………………. 1 115 1 115 1 115 2 210
Total managed hotels 56 14,636 64 17,328 64 17,283 64 16,952
2012
Full service hotels
EAME Managed……….…..…...…………… 32 7,964 32 7,964 32 7,964 33 8,084
SW Asia Managed…………..……………… 19 5,822 19 5,822 19 5,822 20 6,014
Subtotal…..………...…………………. 51 13,786 51 13,786 51 13,786 53 14,098
Select service hotels
SW Asia Managed…………..…………. 1 115
Subtotal…..………...…………………. 1 115
Total managed hotels 54 14,213
2011
Full service hotels
EAME Managed……….…..…...…………… 31 7,795 31 7,781 32 7,961 32 7,961
SW Asia Managed…………..……………… 13 4,430 14 4,480 16 5,119 18 5,614
Total managed hotels 44 12,225 45 12,261 48 13,080 50 13,575
2010
Full service hotels
EAME Managed……….…..…...…………… 32 8,501 32 8,497 32 8,492 33 8,795
SW Asia Managed…………..……………… 12 4,207 12 4,207 12 4,207 13 4,430
Total managed hotels 44 12,708 44 12,704 44 12,699 46 13,225
2009
Full service hotels
EAME Managed……….…..…...…………… 32 8,501
SW Asia Managed…………..……………… 12 4,207
Total managed hotels 44 12,708
Q4
Q4
Q4
Q1 Q2 Q3 Q4
Q1
Q1 Q2 Q3
Q4Q3Q2
Q1 Q2 Q3
Q1 Q2 Q3 Q4
Q1 Q2 Q3 Q4
(a) Figures do not include vacation ownership, residential, branded spas and fitness studios, or condominium ownership units.
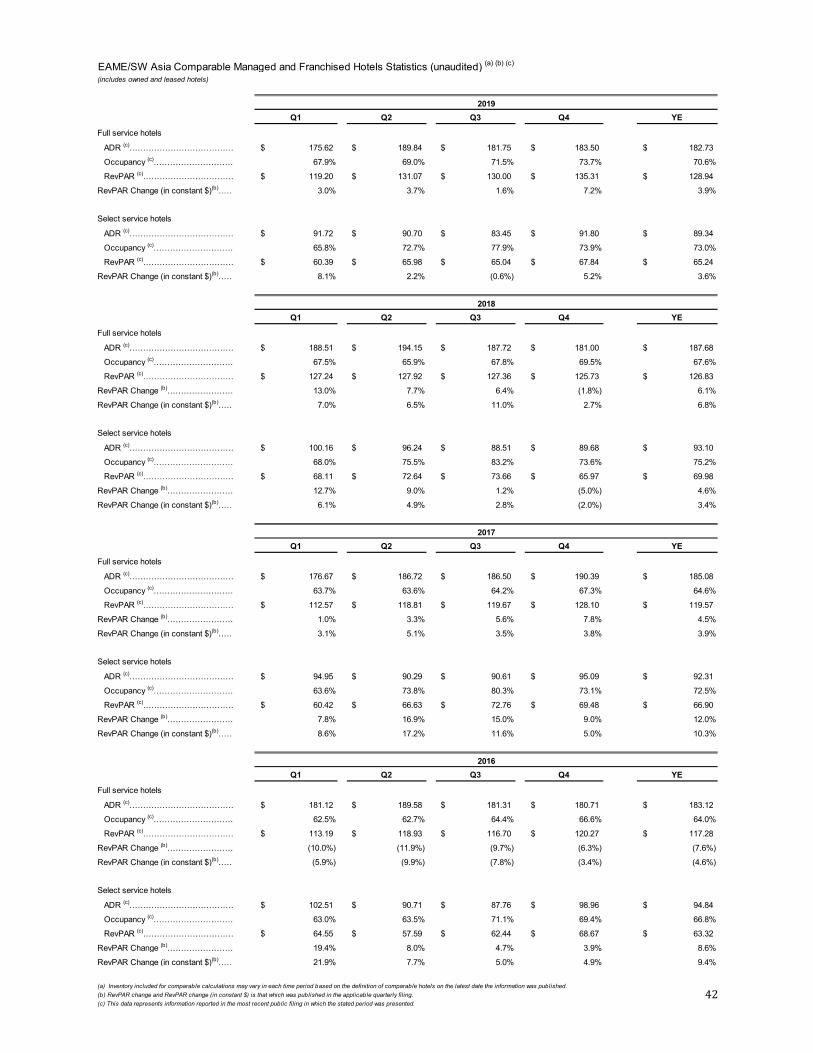
42
EAME/SW Asia Comparable Managed and Franchised Hotels Statistics (unaudited) (a) (b) (c)
(includes owned and leased hotels)
2019Q1 Q2 Q3 Q4 YE
Full service hotels
ADR (c)………………………………… 175.62$ 189.84$ 181.75$ 183.50$ 182.73$
Occupancy (c)………………………… 67.9% 69.0% 71.5% 73.7% 70.6%
RevPAR (c)…………………………… 119.20$ 131.07$ 130.00$ 135.31$ 128.94$
RevPAR Change (in constant $)(b)…… 3.0% 3.7% 1.6% 7.2% 3.9%
Select service hotels
ADR (c)………………………………… 91.72$ 90.70$ 83.45$ 91.80$ 89.34$
Occupancy (c)………………………… 65.8% 72.7% 77.9% 73.9% 73.0%
RevPAR (c)…………………………… 60.39$ 65.98$ 65.04$ 67.84$ 65.24$
RevPAR Change (in constant $)(b)…… 8.1% 2.2% (0.6%) 5.2% 3.6%
2018Q1 Q2 Q3 Q4 YE
Full service hotels
ADR (c)………………………………… 188.51$ 194.15$ 187.72$ 181.00$ 187.68$
Occupancy (c)………………………… 67.5% 65.9% 67.8% 69.5% 67.6%
RevPAR (c)…………………………… 127.24$ 127.92$ 127.36$ 125.73$ 126.83$
RevPAR Change (b)……………………… 13.0% 7.7% 6.4% (1.8%) 6.1%
RevPAR Change (in constant $)(b)…… 7.0% 6.5% 11.0% 2.7% 6.8%
Select service hotels
ADR (c)………………………………… 100.16$ 96.24$ 88.51$ 89.68$ 93.10$
Occupancy (c)………………………… 68.0% 75.5% 83.2% 73.6% 75.2%
RevPAR (c)…………………………… 68.11$ 72.64$ 73.66$ 65.97$ 69.98$
RevPAR Change (b)……………………… 12.7% 9.0% 1.2% (5.0%) 4.6%
RevPAR Change (in constant $)(b)…… 6.1% 4.9% 2.8% (2.0%) 3.4%
2017Q1 Q2 Q3 Q4 YE
Full service hotels
ADR (c)………………………………… 176.67$ 186.72$ 186.50$ 190.39$ 185.08$
Occupancy (c)………………………… 63.7% 63.6% 64.2% 67.3% 64.6%
RevPAR (c)…………………………… 112.57$ 118.81$ 119.67$ 128.10$ 119.57$
RevPAR Change (b)……………………… 1.0% 3.3% 5.6% 7.8% 4.5%
RevPAR Change (in constant $)(b)…… 3.1% 5.1% 3.5% 3.8% 3.9%
Select service hotels
ADR (c)………………………………… 94.95$ 90.29$ 90.61$ 95.09$ 92.31$
Occupancy (c)………………………… 63.6% 73.8% 80.3% 73.1% 72.5%
RevPAR (c)…………………………… 60.42$ 66.63$ 72.76$ 69.48$ 66.90$
RevPAR Change (b)……………………… 7.8% 16.9% 15.0% 9.0% 12.0%
RevPAR Change (in constant $)(b)…… 8.6% 17.2% 11.6% 5.0% 10.3%
2016Q1 Q2 Q3 Q4 YE
Full service hotels
ADR (c)………………………………… 181.12$ 189.58$ 181.31$ 180.71$ 183.12$
Occupancy (c)………………………… 62.5% 62.7% 64.4% 66.6% 64.0%
RevPAR (c)…………………………… 113.19$ 118.93$ 116.70$ 120.27$ 117.28$
RevPAR Change (b)……………………… (10.0%) (11.9%) (9.7%) (6.3%) (7.6%)
RevPAR Change (in constant $)(b)…… (5.9%) (9.9%) (7.8%) (3.4%) (4.6%)
Select service hotels
ADR (c)………………………………… 102.51$ 90.71$ 87.76$ 98.96$ 94.84$
Occupancy (c)………………………… 63.0% 63.5% 71.1% 69.4% 66.8%
RevPAR (c)…………………………… 64.55$ 57.59$ 62.44$ 68.67$ 63.32$
RevPAR Change (b)……………………… 19.4% 8.0% 4.7% 3.9% 8.6%
RevPAR Change (in constant $)(b)…… 21.9% 7.7% 5.0% 4.9% 9.4%
(a) Inventory included for comparable calculations may vary in each time period based on the definition of comparable hotels on the latest date the information was published.
(c) This data represents information reported in the most recent public filing in which the stated period was presented.(b) RevPAR change and RevPAR change (in constant $) is that which was published in the applicable quarterly filing.

43
2015Q1 Q2 Q3 Q4 YE
Full service hotels
ADR (c)………………………………… 205.65$ 211.26$ 209.65$ 197.09$ 202.72$
Occupancy (c)………………………… 64.0% 66.1% 63.8% 64.1% 63.5%
RevPAR (c)…………………………… 131.66$ 139.58$ 133.85$ 126.32$ 128.78$
RevPAR Change (b)……………………… (8.1%) (13.2%) (7.5%) (12.3%) (10.3%)
RevPAR Change (in constant $)(b)…… 1.4% (0.2%) 6.2% (4.0%) 0.8%
2014Q1 Q2 Q3 Q4 YE
Full service hotels
ADR (c)………………………………… 227.07$ 243.68$ 230.41$ 222.93$ 231.49$
Occupancy (c)………………………… 63.7% 66.8% 63.6% 67.6% 65.4%
RevPAR (c)…………………………… 144.56$ 162.71$ 146.59$ 150.65$ 151.50$
RevPAR Change (b)……………………… 3.0% 3.8% 7.2% (3.2%) 2.1%
RevPAR Change (in constant $)(b)…… 5.3% 3.9% 7.8% 2.6% 5.0%
2013Q1 Q2 Q3 Q4 YE
Full service hotels
ADR (c)………………………………… 244.57$ 236.96$ 229.12$ 248.10$ 235.82$
Occupancy (c)………………………… 64.3% 67.3% 60.1% 66.5% 64.2%
RevPAR (c)…………………………… 157.37$ 159.43$ 137.74$ 164.99$ 151.38$
RevPAR Change (b)……………………… 4.6% 5.3% 1.2% 3.3% 3.7%
RevPAR Change (in constant $)(b)…… 6.2% 6.1% 2.4% 5.0% 5.0%
2012Q1 Q2 Q3 Q4 YE
Full service hotels
ADR (c)………………………………… 244.40$ 237.32$ 228.09$ 243.29$ 238.45$
Occupancy (c)………………………… 59.1% 61.1% 56.8% 64.4% 60.4%
RevPAR (c)…………………………… 144.53$ 145.10$ 129.59$ 156.63$ 143.97$
RevPAR Change (b)……………………… (1.8%) (5.1%) (4.1%) (0.8%) (2.9%)
RevPAR Change (in constant $)(b)…… ---- ---- ---- 1.1% 2.5%
2011Q1 Q2 Q3 Q4 YE
Full service hotels
ADR (c)………………………………… 253.70$ 260.01$ 243.56$ 253.89$ 252.90$
Occupancy (c)………………………… 59.8% 62.0% 58.5% 63.1% 60.8%
RevPAR (c)…………………………… 151.62$ 161.19$ 142.37$ 160.30$ 153.86$
RevPAR Change (b)……………………… 3.5% 9.9% 6.7% (3.1%) 4.0%
(a) Inventory included for comparable calculations may vary in each time period based on the definition of comparable hotels on the latest date the information was published.
(c) This data represents information reported in the most recent public filing in which the stated period was presented.(b) RevPAR change and RevPAR change (in constant $) is that which was published in the applicable quarterly filing.

44
2010Q1 Q2 Q3 Q4 YE
Full service hotels
ADR (c)………………………………… 239.61$ 234.76$ 231.00$ 250.52$ 239.28$
Occupancy (c)………………………… 62.3% 63.5% 58.9% 66.9% 62.9%
RevPAR (c)…………………………… 149.22$ 149.16$ 136.08$ 167.69$ 150.55$
RevPAR Change (b)…………………… 12.5% 8.9% 7.8% 2.0% 7.4%
2009Q1 Q2 Q3 Q4 YE
Full service hotels
ADR (c)………………………………… 242.86$ 230.76$ 227.00$ 248.77$ 237.72$
Occupancy (c)………………………… 55.2% 59.4% 56.3% 66.5% 59.4%
RevPAR (c)…………………………… 134.07$ 136.98$ 127.85$ 165.53$ 141.16$
(a) Inventory included for comparable calculations may vary in each time period based on the definition of comparable hotels on the latest date the information was published.
(c) This data represents information reported in the most recent public filing in which the stated period was presented.(b) RevPAR change and RevPAR change (in constant $) is that which was published in the applicable quarterly filing.
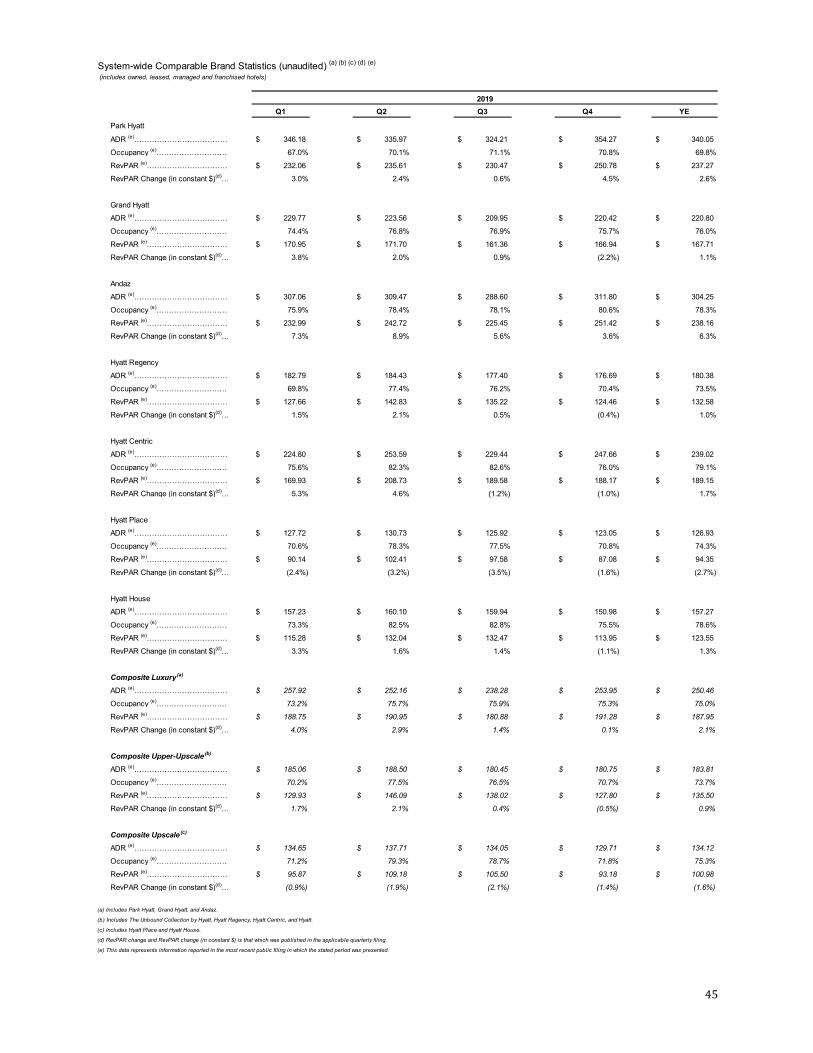
45
System-wide Comparable Brand Statistics (unaudited) (a) (b) (c) (d) (e)
(includes owned, leased, managed and franchised hotels)
2019Q1 Q2 Q3 Q4 YE
Park Hyatt
ADR (e)………………………………… 346.18$ 335.97$ 324.21$ 354.27$ 340.05$
Occupancy (e)………………………… 67.0% 70.1% 71.1% 70.8% 69.8%
RevPAR (e)…………………………… 232.06$ 235.61$ 230.47$ 250.78$ 237.27$
RevPAR Change (in constant $)(d)… 3.0% 2.4% 0.6% 4.5% 2.6%
Grand Hyatt
ADR (e)………………………………… 229.77$ 223.56$ 209.95$ 220.42$ 220.80$
Occupancy (e)………………………… 74.4% 76.8% 76.9% 75.7% 76.0%
RevPAR (e)…………………………… 170.95$ 171.70$ 161.36$ 166.94$ 167.71$
RevPAR Change (in constant $)(d)… 3.8% 2.0% 0.9% (2.2%) 1.1%
Andaz
ADR (e)………………………………… 307.06$ 309.47$ 288.60$ 311.80$ 304.25$
Occupancy (e)………………………… 75.9% 78.4% 78.1% 80.6% 78.3%
RevPAR (e)…………………………… 232.99$ 242.72$ 225.45$ 251.42$ 238.16$
RevPAR Change (in constant $)(d)… 7.3% 8.9% 5.6% 3.6% 6.3%
Hyatt Regency
ADR (e)………………………………… 182.79$ 184.43$ 177.40$ 176.69$ 180.38$
Occupancy (e)………………………… 69.8% 77.4% 76.2% 70.4% 73.5%
RevPAR (e)…………………………… 127.66$ 142.83$ 135.22$ 124.46$ 132.58$
RevPAR Change (in constant $)(d)… 1.5% 2.1% 0.5% (0.4%) 1.0%
Hyatt Centric
ADR (e)………………………………… 224.80$ 253.59$ 229.44$ 247.66$ 239.02$
Occupancy (e)………………………… 75.6% 82.3% 82.6% 76.0% 79.1%
RevPAR (e)…………………………… 169.93$ 208.73$ 189.58$ 188.17$ 189.15$
RevPAR Change (in constant $)(d)… 5.3% 4.6% (1.2%) (1.0%) 1.7%
Hyatt Place
ADR (e)………………………………… 127.72$ 130.73$ 125.92$ 123.05$ 126.93$
Occupancy (e)………………………… 70.6% 78.3% 77.5% 70.8% 74.3%
RevPAR (e)…………………………… 90.14$ 102.41$ 97.58$ 87.08$ 94.35$
RevPAR Change (in constant $)(d)… (2.4%) (3.2%) (3.5%) (1.6%) (2.7%)
Hyatt House
ADR (e)………………………………… 157.23$ 160.10$ 159.94$ 150.98$ 157.27$
Occupancy (e)………………………… 73.3% 82.5% 82.8% 75.5% 78.6%
RevPAR (e)…………………………… 115.28$ 132.04$ 132.47$ 113.95$ 123.55$
RevPAR Change (in constant $)(d)… 3.3% 1.6% 1.4% (1.1%) 1.3%
Composite Luxury(a)
ADR (e)………………………………… 257.92$ 252.16$ 238.28$ 253.95$ 250.46$
Occupancy (e)………………………… 73.2% 75.7% 75.9% 75.3% 75.0%
RevPAR (e)…………………………… 188.75$ 190.95$ 180.88$ 191.28$ 187.95$
RevPAR Change (in constant $)(d)… 4.0% 2.9% 1.4% 0.1% 2.1%
Composite Upper-Upscale (b)
ADR (e)………………………………… 185.06$ 188.50$ 180.45$ 180.75$ 183.81$
Occupancy (e)………………………… 70.2% 77.5% 76.5% 70.7% 73.7%
RevPAR (e)…………………………… 129.93$ 146.09$ 138.02$ 127.80$ 135.50$
RevPAR Change (in constant $)(d)… 1.7% 2.1% 0.4% (0.5%) 0.9%
Composite Upscale (c)
ADR (e)………………………………… 134.65$ 137.71$ 134.05$ 129.71$ 134.12$
Occupancy (e)………………………… 71.2% 79.3% 78.7% 71.8% 75.3%
RevPAR (e)…………………………… 95.87$ 109.18$ 105.50$ 93.18$ 100.98$
RevPAR Change (in constant $)(d)… (0.9%) (1.9%) (2.1%) (1.4%) (1.6%)
(a) Includes Park Hyatt, Grand Hyatt, and Andaz.
(b) Includes The Unbound Collection by Hyatt, Hyatt Regency, Hyatt Centric, and Hyatt.
(c) Includes Hyatt Place and Hyatt House.
(d) RevPAR change and RevPAR change (in constant $) is that which was published in the applicable quarterly filing.
(e) This data represents information reported in the most recent public filing in which the stated period was presented.
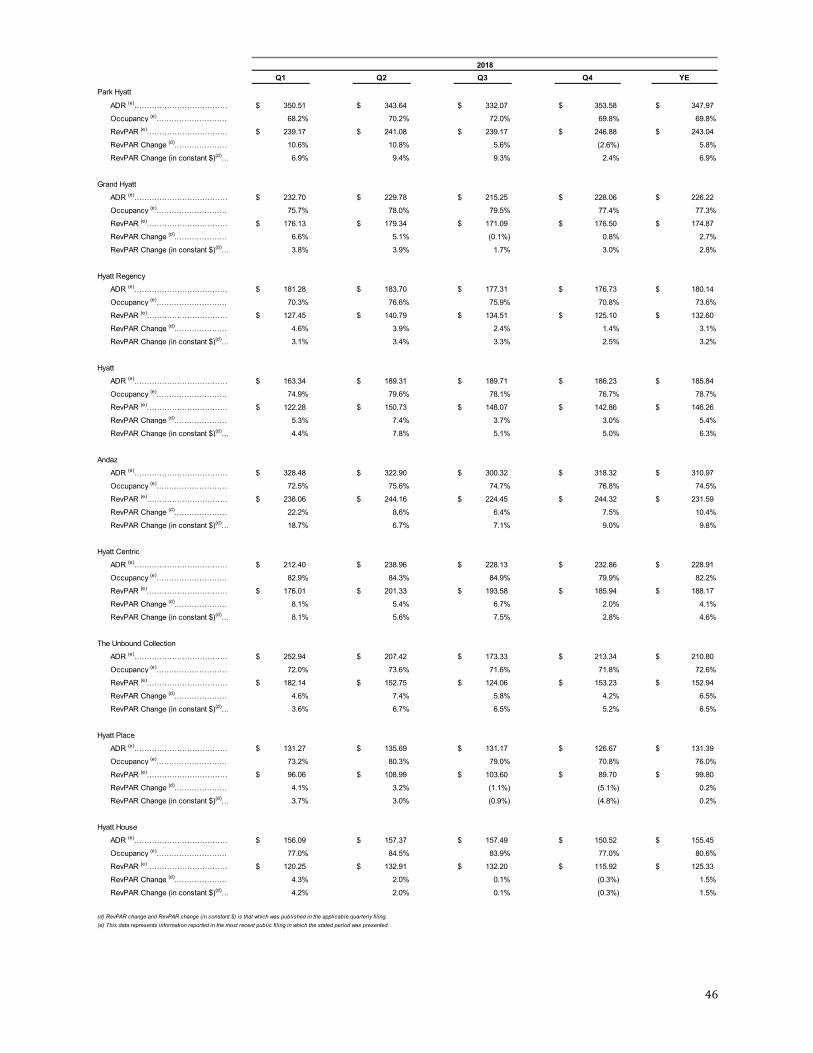
46
2018Q1 Q2 Q3 Q4 YE
Park Hyatt
ADR (e)………………………………… 350.51$ 343.64$ 332.07$ 353.58$ 347.97$
Occupancy (e)………………………… 68.2% 70.2% 72.0% 69.8% 69.8%
RevPAR (e)…………………………… 239.17$ 241.08$ 239.17$ 246.88$ 243.04$
RevPAR Change (d).………………… 10.6% 10.8% 5.6% (2.6%) 5.8%
RevPAR Change (in constant $)(d)… 6.9% 9.4% 9.3% 2.4% 6.9%
Grand Hyatt
ADR (e)………………………………… 232.70$ 229.78$ 215.25$ 228.06$ 226.22$
Occupancy (e)………………………… 75.7% 78.0% 79.5% 77.4% 77.3%
RevPAR (e)…………………………… 176.13$ 179.34$ 171.09$ 176.50$ 174.87$
RevPAR Change (d).………………… 6.6% 5.1% (0.1%) 0.8% 2.7%
RevPAR Change (in constant $)(d)… 3.8% 3.9% 1.7% 3.0% 2.8%
Hyatt Regency
ADR (e)………………………………… 181.28$ 183.70$ 177.31$ 176.73$ 180.14$
Occupancy (e)………………………… 70.3% 76.6% 75.9% 70.8% 73.6%
RevPAR (e)…………………………… 127.45$ 140.79$ 134.51$ 125.10$ 132.60$
RevPAR Change (d).………………… 4.6% 3.9% 2.4% 1.4% 3.1%
RevPAR Change (in constant $)(d)… 3.1% 3.4% 3.3% 2.5% 3.2%
Hyatt
ADR (e)………………………………… 163.34$ 189.31$ 189.71$ 186.23$ 185.84$
Occupancy (e)………………………… 74.9% 79.6% 78.1% 76.7% 78.7%
RevPAR (e)…………………………… 122.28$ 150.73$ 148.07$ 142.86$ 146.26$
RevPAR Change (d).………………… 5.3% 7.4% 3.7% 3.0% 5.4%
RevPAR Change (in constant $)(d)… 4.4% 7.8% 5.1% 5.0% 6.3%
Andaz
ADR (e)………………………………… 328.48$ 322.90$ 300.32$ 318.32$ 310.97$
Occupancy (e)………………………… 72.5% 75.6% 74.7% 76.8% 74.5%
RevPAR (e)…………………………… 238.06$ 244.16$ 224.45$ 244.32$ 231.59$
RevPAR Change (d).………………… 22.2% 8.6% 6.4% 7.5% 10.4%
RevPAR Change (in constant $)(d)… 18.7% 6.7% 7.1% 9.0% 9.8%
Hyatt Centric
ADR (e)………………………………… 212.40$ 238.96$ 228.13$ 232.86$ 228.91$
Occupancy (e)………………………… 82.9% 84.3% 84.9% 79.9% 82.2%
RevPAR (e)…………………………… 176.01$ 201.33$ 193.58$ 185.94$ 188.17$
RevPAR Change (d).………………… 8.1% 5.4% 6.7% 2.0% 4.1%
RevPAR Change (in constant $)(d)… 8.1% 5.6% 7.5% 2.8% 4.6%
The Unbound Collection
ADR (e)………………………………… 252.94$ 207.42$ 173.33$ 213.34$ 210.80$
Occupancy (e)………………………… 72.0% 73.6% 71.6% 71.8% 72.6%
RevPAR (e)…………………………… 182.14$ 152.75$ 124.06$ 153.23$ 152.94$
RevPAR Change (d).………………… 4.6% 7.4% 5.8% 4.2% 6.5%
RevPAR Change (in constant $)(d)… 3.6% 6.7% 6.5% 5.2% 6.5%
Hyatt Place
ADR (e)………………………………… 131.27$ 135.69$ 131.17$ 126.67$ 131.39$
Occupancy (e)………………………… 73.2% 80.3% 79.0% 70.8% 76.0%
RevPAR (e)…………………………… 96.06$ 108.99$ 103.60$ 89.70$ 99.80$
RevPAR Change (d).………………… 4.1% 3.2% (1.1%) (5.1%) 0.2%
RevPAR Change (in constant $)(d)… 3.7% 3.0% (0.9%) (4.8%) 0.2%
Hyatt House
ADR (e)………………………………… 156.09$ 157.37$ 157.49$ 150.52$ 155.45$
Occupancy (e)………………………… 77.0% 84.5% 83.9% 77.0% 80.6%
RevPAR (e)…………………………… 120.25$ 132.91$ 132.20$ 115.92$ 125.33$
RevPAR Change (d).………………… 4.3% 2.0% 0.1% (0.3%) 1.5%
RevPAR Change (in constant $)(d)… 4.2% 2.0% 0.1% (0.3%) 1.5%
(e) This data represents information reported in the most recent public filing in which the stated period was presented.(d) RevPAR change and RevPAR change (in constant $) is that which was published in the applicable quarterly filing.
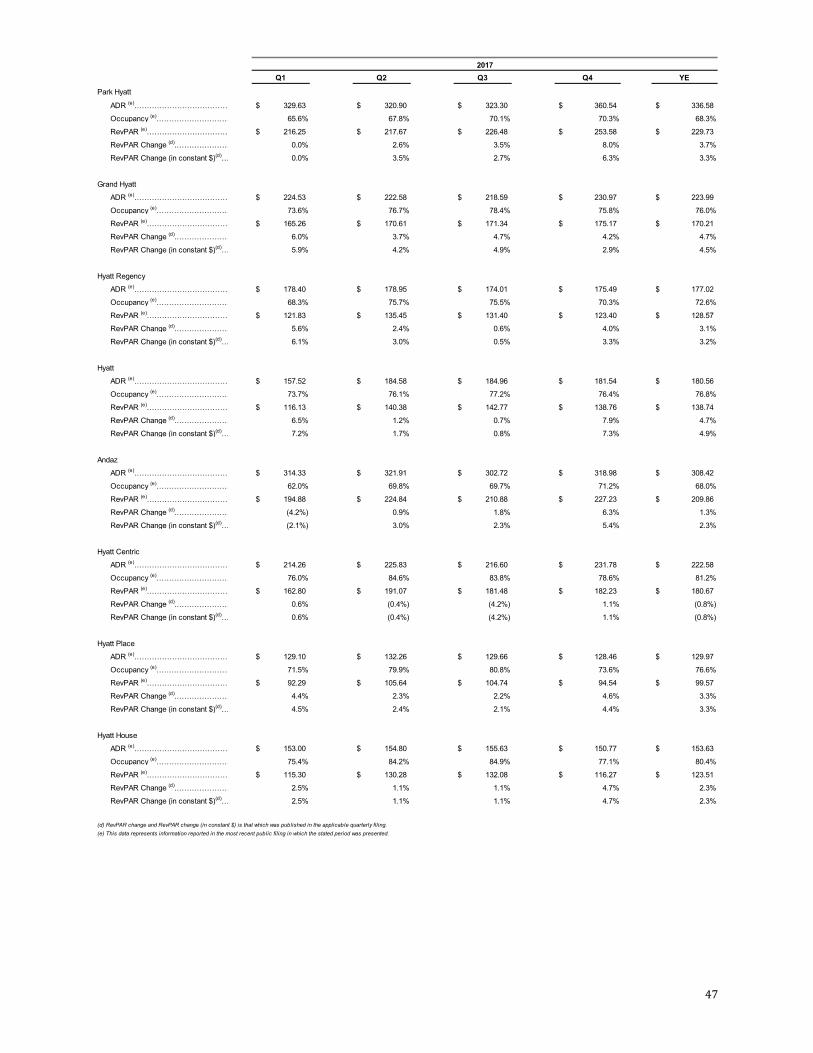
47
2017Q1 Q2 Q3 Q4 YE
Park Hyatt
ADR (e)………………………………… 329.63$ 320.90$ 323.30$ 360.54$ 336.58$
Occupancy (e)………………………… 65.6% 67.8% 70.1% 70.3% 68.3%
RevPAR (e)…………………………… 216.25$ 217.67$ 226.48$ 253.58$ 229.73$
RevPAR Change (d).………………… 0.0% 2.6% 3.5% 8.0% 3.7%
RevPAR Change (in constant $)(d)… 0.0% 3.5% 2.7% 6.3% 3.3%
Grand Hyatt
ADR (e)………………………………… 224.53$ 222.58$ 218.59$ 230.97$ 223.99$
Occupancy (e)………………………… 73.6% 76.7% 78.4% 75.8% 76.0%
RevPAR (e)…………………………… 165.26$ 170.61$ 171.34$ 175.17$ 170.21$
RevPAR Change (d).………………… 6.0% 3.7% 4.7% 4.2% 4.7%
RevPAR Change (in constant $)(d)… 5.9% 4.2% 4.9% 2.9% 4.5%
Hyatt Regency
ADR (e)………………………………… 178.40$ 178.95$ 174.01$ 175.49$ 177.02$
Occupancy (e)………………………… 68.3% 75.7% 75.5% 70.3% 72.6%
RevPAR (e)…………………………… 121.83$ 135.45$ 131.40$ 123.40$ 128.57$
RevPAR Change (d).………………… 5.6% 2.4% 0.6% 4.0% 3.1%
RevPAR Change (in constant $)(d)… 6.1% 3.0% 0.5% 3.3% 3.2%
Hyatt
ADR (e)………………………………… 157.52$ 184.58$ 184.96$ 181.54$ 180.56$
Occupancy (e)………………………… 73.7% 76.1% 77.2% 76.4% 76.8%
RevPAR (e)…………………………… 116.13$ 140.38$ 142.77$ 138.76$ 138.74$
RevPAR Change (d).………………… 6.5% 1.2% 0.7% 7.9% 4.7%
RevPAR Change (in constant $)(d)… 7.2% 1.7% 0.8% 7.3% 4.9%
Andaz
ADR (e)………………………………… 314.33$ 321.91$ 302.72$ 318.98$ 308.42$
Occupancy (e)………………………… 62.0% 69.8% 69.7% 71.2% 68.0%
RevPAR (e)…………………………… 194.88$ 224.84$ 210.88$ 227.23$ 209.86$
RevPAR Change (d).………………… (4.2%) 0.9% 1.8% 6.3% 1.3%
RevPAR Change (in constant $)(d)… (2.1%) 3.0% 2.3% 5.4% 2.3%
Hyatt Centric
ADR (e)………………………………… 214.26$ 225.83$ 216.60$ 231.78$ 222.58$
Occupancy (e)………………………… 76.0% 84.6% 83.8% 78.6% 81.2%
RevPAR (e)…………………………… 162.80$ 191.07$ 181.48$ 182.23$ 180.67$
RevPAR Change (d).………………… 0.6% (0.4%) (4.2%) 1.1% (0.8%)
RevPAR Change (in constant $)(d)… 0.6% (0.4%) (4.2%) 1.1% (0.8%)
Hyatt Place
ADR (e)………………………………… 129.10$ 132.26$ 129.66$ 128.46$ 129.97$
Occupancy (e)………………………… 71.5% 79.9% 80.8% 73.6% 76.6%
RevPAR (e)…………………………… 92.29$ 105.64$ 104.74$ 94.54$ 99.57$
RevPAR Change (d).………………… 4.4% 2.3% 2.2% 4.6% 3.3%
RevPAR Change (in constant $)(d)… 4.5% 2.4% 2.1% 4.4% 3.3%
Hyatt House
ADR (e)………………………………… 153.00$ 154.80$ 155.63$ 150.77$ 153.63$
Occupancy (e)………………………… 75.4% 84.2% 84.9% 77.1% 80.4%
RevPAR (e)…………………………… 115.30$ 130.28$ 132.08$ 116.27$ 123.51$
RevPAR Change (d).………………… 2.5% 1.1% 1.1% 4.7% 2.3%
RevPAR Change (in constant $)(d)… 2.5% 1.1% 1.1% 4.7% 2.3%
(e) This data represents information reported in the most recent public filing in which the stated period was presented.(d) RevPAR change and RevPAR change (in constant $) is that which was published in the applicable quarterly filing.
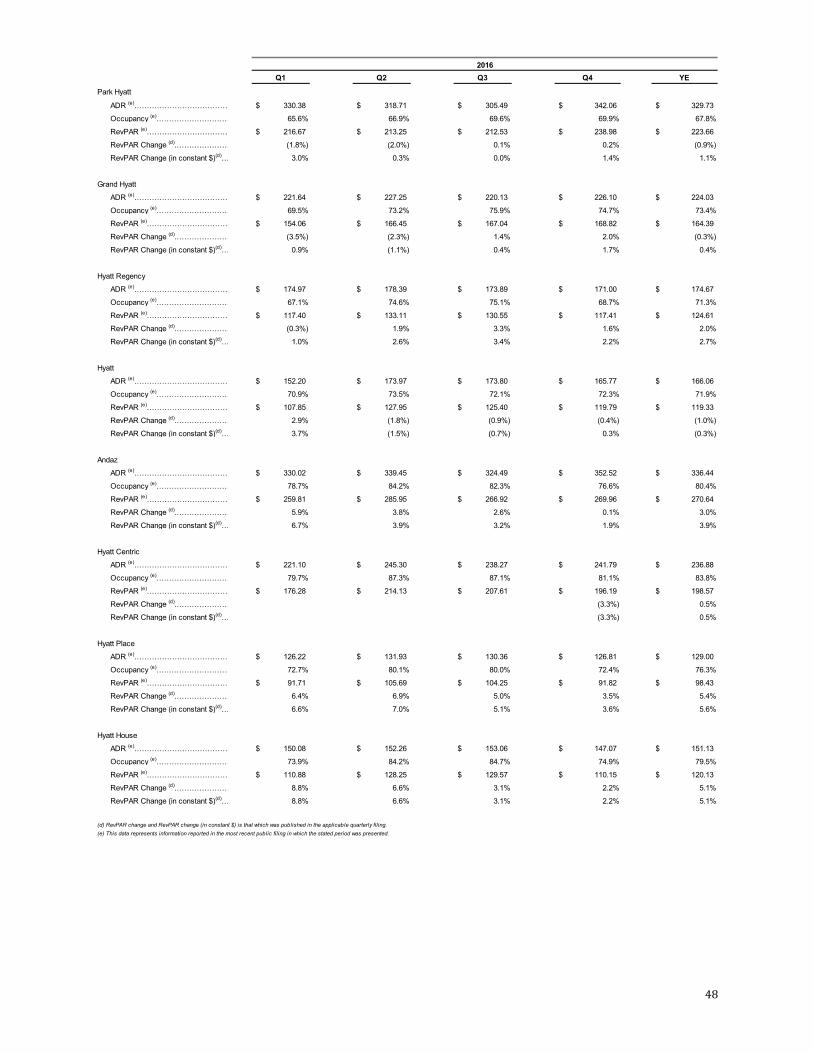
48
2016Q1 Q2 Q3 Q4 YE
Park Hyatt
ADR (e)………………………………… 330.38$ 318.71$ 305.49$ 342.06$ 329.73$
Occupancy (e)………………………… 65.6% 66.9% 69.6% 69.9% 67.8%
RevPAR (e)…………………………… 216.67$ 213.25$ 212.53$ 238.98$ 223.66$
RevPAR Change (d).………………… (1.8%) (2.0%) 0.1% 0.2% (0.9%)
RevPAR Change (in constant $)(d)… 3.0% 0.3% 0.0% 1.4% 1.1%
Grand Hyatt
ADR (e)………………………………… 221.64$ 227.25$ 220.13$ 226.10$ 224.03$
Occupancy (e)………………………… 69.5% 73.2% 75.9% 74.7% 73.4%
RevPAR (e)…………………………… 154.06$ 166.45$ 167.04$ 168.82$ 164.39$
RevPAR Change (d).………………… (3.5%) (2.3%) 1.4% 2.0% (0.3%)
RevPAR Change (in constant $)(d)… 0.9% (1.1%) 0.4% 1.7% 0.4%
Hyatt Regency
ADR (e)………………………………… 174.97$ 178.39$ 173.89$ 171.00$ 174.67$
Occupancy (e)………………………… 67.1% 74.6% 75.1% 68.7% 71.3%
RevPAR (e)…………………………… 117.40$ 133.11$ 130.55$ 117.41$ 124.61$
RevPAR Change (d).………………… (0.3%) 1.9% 3.3% 1.6% 2.0%
RevPAR Change (in constant $)(d)… 1.0% 2.6% 3.4% 2.2% 2.7%
Hyatt
ADR (e)………………………………… 152.20$ 173.97$ 173.80$ 165.77$ 166.06$
Occupancy (e)………………………… 70.9% 73.5% 72.1% 72.3% 71.9%
RevPAR (e)…………………………… 107.85$ 127.95$ 125.40$ 119.79$ 119.33$
RevPAR Change (d).………………… 2.9% (1.8%) (0.9%) (0.4%) (1.0%)
RevPAR Change (in constant $)(d)… 3.7% (1.5%) (0.7%) 0.3% (0.3%)
Andaz
ADR (e)………………………………… 330.02$ 339.45$ 324.49$ 352.52$ 336.44$
Occupancy (e)………………………… 78.7% 84.2% 82.3% 76.6% 80.4%
RevPAR (e)…………………………… 259.81$ 285.95$ 266.92$ 269.96$ 270.64$
RevPAR Change (d).………………… 5.9% 3.8% 2.6% 0.1% 3.0%
RevPAR Change (in constant $)(d)… 6.7% 3.9% 3.2% 1.9% 3.9%
Hyatt Centric
ADR (e)………………………………… 221.10$ 245.30$ 238.27$ 241.79$ 236.88$
Occupancy (e)………………………… 79.7% 87.3% 87.1% 81.1% 83.8%
RevPAR (e)…………………………… 176.28$ 214.13$ 207.61$ 196.19$ 198.57$
RevPAR Change (d).………………… (3.3%) 0.5%
RevPAR Change (in constant $)(d)… (3.3%) 0.5%
Hyatt Place
ADR (e)………………………………… 126.22$ 131.93$ 130.36$ 126.81$ 129.00$
Occupancy (e)………………………… 72.7% 80.1% 80.0% 72.4% 76.3%
RevPAR (e)…………………………… 91.71$ 105.69$ 104.25$ 91.82$ 98.43$
RevPAR Change (d).………………… 6.4% 6.9% 5.0% 3.5% 5.4%
RevPAR Change (in constant $)(d)… 6.6% 7.0% 5.1% 3.6% 5.6%
Hyatt House
ADR (e)………………………………… 150.08$ 152.26$ 153.06$ 147.07$ 151.13$
Occupancy (e)………………………… 73.9% 84.2% 84.7% 74.9% 79.5%
RevPAR (e)…………………………… 110.88$ 128.25$ 129.57$ 110.15$ 120.13$
RevPAR Change (d).………………… 8.8% 6.6% 3.1% 2.2% 5.1%
RevPAR Change (in constant $)(d)… 8.8% 6.6% 3.1% 2.2% 5.1%
(e) This data represents information reported in the most recent public filing in which the stated period was presented.(d) RevPAR change and RevPAR change (in constant $) is that which was published in the applicable quarterly filing.

49
2015Q1 Q2 Q3 Q4 YE
Park Hyatt
ADR (e)………………………………… 340.96$ 332.97$ 320.20$ 345.86$ 334.87$
Occupancy (e)………………………… 66.7% 68.8% 70.0% 69.1% 68.6%
RevPAR (e)…………………………… 227.29$ 228.93$ 223.99$ 239.01$ 229.82$
RevPAR Change (d).………………… (3.9%) (7.1%) (5.1%) (6.9%) (5.8%)
RevPAR Change (in constant $)(d)… 4.1% 2.6% 6.4% 0.4% 3.3%
Grand Hyatt
ADR (e)………………………………… 230.45$ 236.07$ 228.24$ 230.45$ 230.77$
Occupancy (e)………………………… 70.9% 75.3% 74.9% 72.8% 73.4%
RevPAR (e)…………………………… 163.41$ 177.82$ 170.92$ 167.81$ 169.28$
RevPAR Change (d).………………… (1.4%) (2.1%) (2.6%) (2.9%) (2.3%)
RevPAR Change (in constant $)(d)… 2.0% 2.8% 3.6% 1.5% 2.5%
Hyatt Regency
ADR (e)………………………………… 173.36$ 174.61$ 170.25$ 169.77$ 171.76$
Occupancy (e)………………………… 68.5% 75.0% 74.8% 68.1% 71.6%
RevPAR (e)…………………………… 118.79$ 130.97$ 127.31$ 115.68$ 122.99$
RevPAR Change (d).………………… 5.7% 3.2% 1.9% 2.2% 3.3%
RevPAR Change (in constant $)(d)… 8.3% 6.3% 5.3% 4.9% 6.2%
Hyatt
ADR (e)………………………………… 180.29$ 207.82$ 206.38$ 176.31$ 179.02$
Occupancy (e)………………………… 71.4% 81.3% 79.1% 74.8% 73.9%
RevPAR (e)…………………………… 128.70$ 168.86$ 163.33$ 131.93$ 132.26$
RevPAR Change (d).………………… 9.3% 4.7% 4.1% 0.0% 3.9%
RevPAR Change (in constant $)(d)… 10.9% 6.6% 5.6% 1.3% 5.7%
Andaz
ADR (e)………………………………… 322.01$ 339.82$ 325.05$ 347.23$ 333.64$
Occupancy (e)………………………… 76.2% 81.0% 80.0% 77.7% 78.8%
RevPAR (e)…………………………… 245.43$ 275.42$ 260.11$ 269.77$ 262.75$
RevPAR Change (d).………………… 15.1% 7.2% 2.1% 0.8% 5.9%
RevPAR Change (in constant $)(d)… 18.0% 10.2% 4.6% 2.5% 8.4%
Hyatt Place
ADR (e)………………………………… 124.21$ 126.34$ 125.17$ 121.50$ 124.29$
Occupancy (e)………………………… 71.1% 78.6% 79.1% 72.8% 75.4%
RevPAR (e)…………………………… 88.37$ 99.32$ 98.97$ 88.50$ 93.73$
RevPAR Change (d).………………… 11.1% 7.1% 6.5% 5.8% 7.6%
RevPAR Change (in constant $)(d)… 11.2% 7.1% 6.6% 5.9% 7.6%
Hyatt House
ADR (e)………………………………… 140.81$ 142.83$ 145.08$ 140.84$ 142.50$
Occupancy (e)………………………… 74.0% 83.7% 85.7% 76.0% 79.9%
RevPAR (e)…………………………… 104.22$ 119.62$ 124.38$ 106.99$ 113.84$
RevPAR Change (d).………………… 7.7% 7.3% 8.9% 7.7% 7.9%
RevPAR Change (in constant $)(d)… 7.7% 7.3% 8.9% 7.7% 7.9%
(e) This data represents information reported in the most recent public filing in which the stated period was presented.(d) RevPAR change and RevPAR change (in constant $) is that which was published in the applicable quarterly filing.
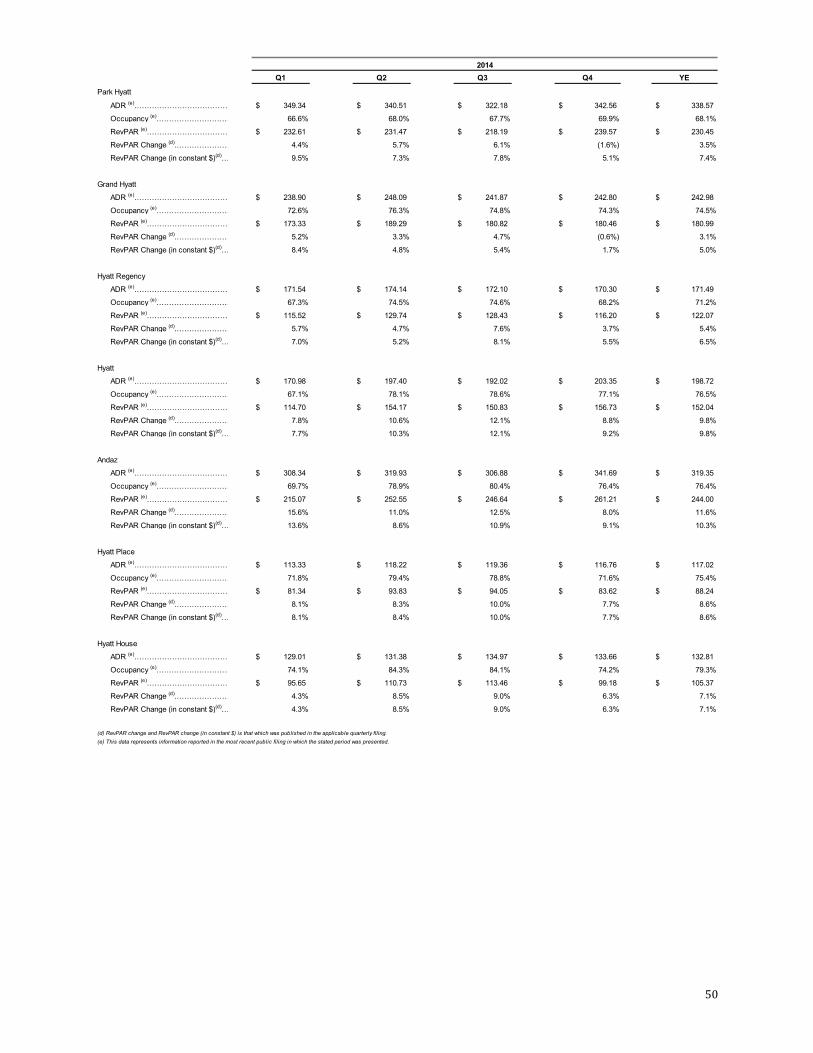
50
2014Q1 Q2 Q3 Q4 YE
Park Hyatt
ADR (e)………………………………… 349.34$ 340.51$ 322.18$ 342.56$ 338.57$
Occupancy (e)………………………… 66.6% 68.0% 67.7% 69.9% 68.1%
RevPAR (e)…………………………… 232.61$ 231.47$ 218.19$ 239.57$ 230.45$
RevPAR Change (d).………………… 4.4% 5.7% 6.1% (1.6%) 3.5%
RevPAR Change (in constant $)(d)… 9.5% 7.3% 7.8% 5.1% 7.4%
Grand Hyatt
ADR (e)………………………………… 238.90$ 248.09$ 241.87$ 242.80$ 242.98$
Occupancy (e)………………………… 72.6% 76.3% 74.8% 74.3% 74.5%
RevPAR (e)…………………………… 173.33$ 189.29$ 180.82$ 180.46$ 180.99$
RevPAR Change (d).………………… 5.2% 3.3% 4.7% (0.6%) 3.1%
RevPAR Change (in constant $)(d)… 8.4% 4.8% 5.4% 1.7% 5.0%
Hyatt Regency
ADR (e)………………………………… 171.54$ 174.14$ 172.10$ 170.30$ 171.49$
Occupancy (e)………………………… 67.3% 74.5% 74.6% 68.2% 71.2%
RevPAR (e)…………………………… 115.52$ 129.74$ 128.43$ 116.20$ 122.07$
RevPAR Change (d).………………… 5.7% 4.7% 7.6% 3.7% 5.4%
RevPAR Change (in constant $)(d)… 7.0% 5.2% 8.1% 5.5% 6.5%
Hyatt
ADR (e)………………………………… 170.98$ 197.40$ 192.02$ 203.35$ 198.72$
Occupancy (e)………………………… 67.1% 78.1% 78.6% 77.1% 76.5%
RevPAR (e)…………………………… 114.70$ 154.17$ 150.83$ 156.73$ 152.04$
RevPAR Change (d).………………… 7.8% 10.6% 12.1% 8.8% 9.8%
RevPAR Change (in constant $)(d)… 7.7% 10.3% 12.1% 9.2% 9.8%
Andaz
ADR (e)………………………………… 308.34$ 319.93$ 306.88$ 341.69$ 319.35$
Occupancy (e)………………………… 69.7% 78.9% 80.4% 76.4% 76.4%
RevPAR (e)…………………………… 215.07$ 252.55$ 246.64$ 261.21$ 244.00$
RevPAR Change (d).………………… 15.6% 11.0% 12.5% 8.0% 11.6%
RevPAR Change (in constant $)(d)… 13.6% 8.6% 10.9% 9.1% 10.3%
Hyatt Place
ADR (e)………………………………… 113.33$ 118.22$ 119.36$ 116.76$ 117.02$
Occupancy (e)………………………… 71.8% 79.4% 78.8% 71.6% 75.4%
RevPAR (e)…………………………… 81.34$ 93.83$ 94.05$ 83.62$ 88.24$
RevPAR Change (d).………………… 8.1% 8.3% 10.0% 7.7% 8.6%
RevPAR Change (in constant $)(d)… 8.1% 8.4% 10.0% 7.7% 8.6%
Hyatt House
ADR (e)………………………………… 129.01$ 131.38$ 134.97$ 133.66$ 132.81$
Occupancy (e)………………………… 74.1% 84.3% 84.1% 74.2% 79.3%
RevPAR (e)…………………………… 95.65$ 110.73$ 113.46$ 99.18$ 105.37$
RevPAR Change (d).………………… 4.3% 8.5% 9.0% 6.3% 7.1%
RevPAR Change (in constant $)(d)… 4.3% 8.5% 9.0% 6.3% 7.1%
(e) This data represents information reported in the most recent public filing in which the stated period was presented.(d) RevPAR change and RevPAR change (in constant $) is that which was published in the applicable quarterly filing.
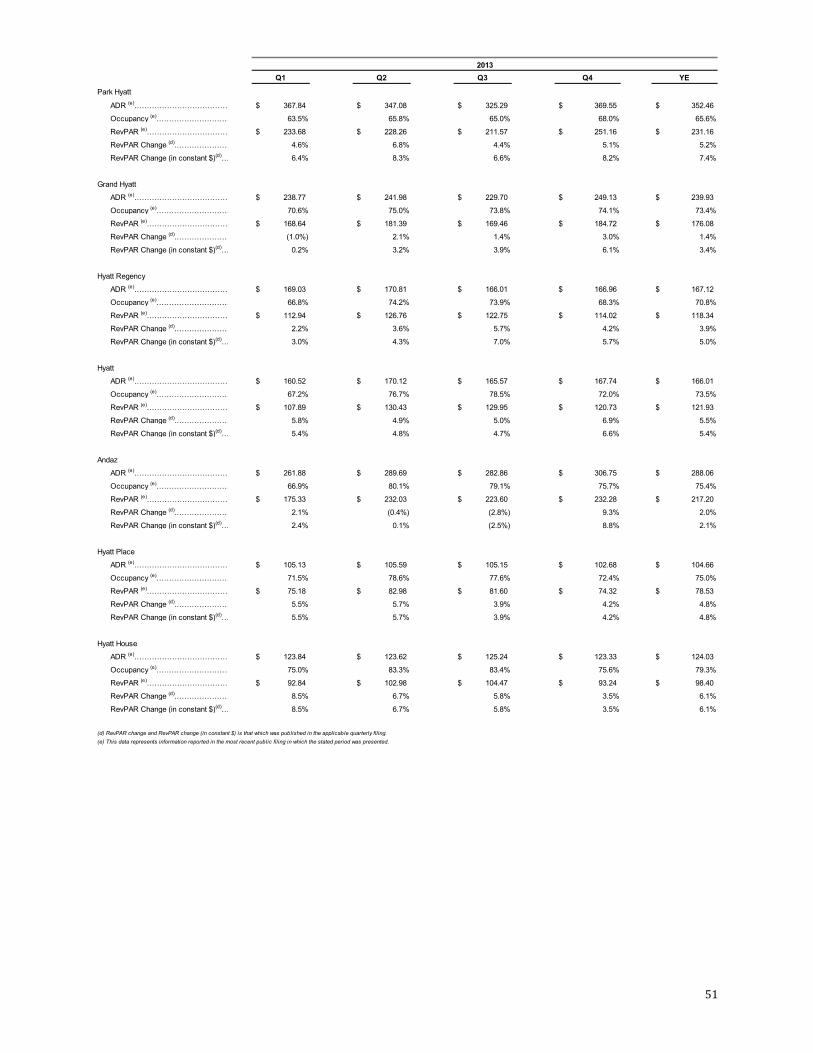
51
2013Q1 Q2 Q3 Q4 YE
Park Hyatt
ADR (e)………………………………… 367.84$ 347.08$ 325.29$ 369.55$ 352.46$
Occupancy (e)………………………… 63.5% 65.8% 65.0% 68.0% 65.6%
RevPAR (e)…………………………… 233.68$ 228.26$ 211.57$ 251.16$ 231.16$
RevPAR Change (d).………………… 4.6% 6.8% 4.4% 5.1% 5.2%
RevPAR Change (in constant $)(d)… 6.4% 8.3% 6.6% 8.2% 7.4%
Grand Hyatt
ADR (e)………………………………… 238.77$ 241.98$ 229.70$ 249.13$ 239.93$
Occupancy (e)………………………… 70.6% 75.0% 73.8% 74.1% 73.4%
RevPAR (e)…………………………… 168.64$ 181.39$ 169.46$ 184.72$ 176.08$
RevPAR Change (d).………………… (1.0%) 2.1% 1.4% 3.0% 1.4%
RevPAR Change (in constant $)(d)… 0.2% 3.2% 3.9% 6.1% 3.4%
Hyatt Regency
ADR (e)………………………………… 169.03$ 170.81$ 166.01$ 166.96$ 167.12$
Occupancy (e)………………………… 66.8% 74.2% 73.9% 68.3% 70.8%
RevPAR (e)…………………………… 112.94$ 126.76$ 122.75$ 114.02$ 118.34$
RevPAR Change (d).………………… 2.2% 3.6% 5.7% 4.2% 3.9%
RevPAR Change (in constant $)(d)… 3.0% 4.3% 7.0% 5.7% 5.0%
Hyatt
ADR (e)………………………………… 160.52$ 170.12$ 165.57$ 167.74$ 166.01$
Occupancy (e)………………………… 67.2% 76.7% 78.5% 72.0% 73.5%
RevPAR (e)…………………………… 107.89$ 130.43$ 129.95$ 120.73$ 121.93$
RevPAR Change (d).………………… 5.8% 4.9% 5.0% 6.9% 5.5%
RevPAR Change (in constant $)(d)… 5.4% 4.8% 4.7% 6.6% 5.4%
Andaz
ADR (e)………………………………… 261.88$ 289.69$ 282.86$ 306.75$ 288.06$
Occupancy (e)………………………… 66.9% 80.1% 79.1% 75.7% 75.4%
RevPAR (e)…………………………… 175.33$ 232.03$ 223.60$ 232.28$ 217.20$
RevPAR Change (d).………………… 2.1% (0.4%) (2.8%) 9.3% 2.0%
RevPAR Change (in constant $)(d)… 2.4% 0.1% (2.5%) 8.8% 2.1%
Hyatt Place
ADR (e)………………………………… 105.13$ 105.59$ 105.15$ 102.68$ 104.66$
Occupancy (e)………………………… 71.5% 78.6% 77.6% 72.4% 75.0%
RevPAR (e)…………………………… 75.18$ 82.98$ 81.60$ 74.32$ 78.53$
RevPAR Change (d).………………… 5.5% 5.7% 3.9% 4.2% 4.8%
RevPAR Change (in constant $)(d)… 5.5% 5.7% 3.9% 4.2% 4.8%
Hyatt House
ADR (e)………………………………… 123.84$ 123.62$ 125.24$ 123.33$ 124.03$
Occupancy (e)………………………… 75.0% 83.3% 83.4% 75.6% 79.3%
RevPAR (e)…………………………… 92.84$ 102.98$ 104.47$ 93.24$ 98.40$
RevPAR Change (d).………………… 8.5% 6.7% 5.8% 3.5% 6.1%
RevPAR Change (in constant $)(d)… 8.5% 6.7% 5.8% 3.5% 6.1%
(e) This data represents information reported in the most recent public filing in which the stated period was presented.(d) RevPAR change and RevPAR change (in constant $) is that which was published in the applicable quarterly filing.

52
2012Q1 Q2 Q3 Q4 YE
Park Hyatt
ADR (e)………………………………… 358.59$ 346.68$ 330.65$ 356.26$ 348.12$
Occupancy (e)………………………… 60.2% 61.2% 60.9% 65.2% 61.9%
RevPAR (e)…………………………… 215.84$ 212.23$ 201.36$ 232.13$ 215.40$
Grand Hyatt
ADR (e)………………………………… 238.35$ 239.95$ 230.62$ 250.79$ 239.90$
Occupancy (e)………………………… 72.1% 74.6% 72.9% 71.9% 72.9%
RevPAR (e)…………………………… 171.88$ 178.97$ 168.01$ 180.40$ 174.81$
Hyatt Regency
ADR (e)………………………………… 165.48$ 166.23$ 161.55$ 166.48$ 165.18$
Occupancy (e)………………………… 66.6% 73.2% 71.5% 66.2% 69.3%
RevPAR (e)…………………………… 110.27$ 121.76$ 115.45$ 110.16$ 114.46$
Hyatt
ADR (e)………………………………… 156.14$ 163.40$ 161.47$ 163.22$ 161.67$
Occupancy (e)………………………… 67.5% 77.8% 78.5% 70.3% 73.5%
RevPAR (e)…………………………… 105.42$ 127.11$ 126.80$ 114.81$ 118.80$
Andaz
ADR (e)………………………………… 259.10$ 282.61$ 284.93$ 291.95$ 280.32$
Occupancy (e)………………………… 68.3% 81.9% 80.1% 71.7% 75.4%
RevPAR (e)…………………………… 176.91$ 231.43$ 228.27$ 209.46$ 211.42$
Hyatt Place
ADR (e)………………………………… 98.47$ 99.11$ 99.02$ 97.40$ 98.52$
Occupancy (e)………………………… 70.4% 77.6% 77.4% 71.0% 74.1%
RevPAR (e)…………………………… 69.34$ 76.93$ 76.61$ 69.16$ 73.01$
Hyatt House
ADR (e)………………………………… 118.85$ 118.85$ 120.38$ 119.03$ 119.30$
Occupancy (e)………………………… 72.3% 81.2% 82.2% 75.7% 77.8%
RevPAR (e)…………………………… 85.90$ 96.55$ 98.92$ 90.06$ 92.87$
(e) This data represents information reported in the most recent public filing in which the stated period was presented.

53
Comparable Owned and Leased Hotels Operating Margin and Owned and Leased Hotels Operating Margin (unaudited) (a) (b) (c) (d)
2019Q1 Q2 Q3 Q4 YE
Owned and leased hotels operating margin percentage (a)..…………….……….......………….. 23.9% 25.3% 19.3% 22.8% 22.9%Percent change (b)……………………….………… (1.6)% (1.1)% (2.0)% (2.4)% (1.7)%Comparable owned and leased hotels operating margin percentage (a)…….…….…………………. 24.7% 26.4% 21.0% 24.6% 24.2%Percent change (b)…………………..….…………… 1.2% 0.1 % (0.2)% ---- ----
2018Q1 Q2 Q3 Q4 YE
Owned and leased hotels operating margin percentage (a)..…………….……….......………….. 25.5% 26.4% 21.3% 25.2% 24.6%Percent change (b)……………………….………… ---- 0.8 % 0.1 % 2.7 % 0.8%Comparable owned and leased hotels operating margin percentage (a)…….…….…………………. 23.5% 26.3% 21.2% 24.6% 24.2%Percent change (b)…………………..….…………… 0.8% 1.6 % 0.7 % 2.4 % 1.4 %
2017Q1 Q2 Q3 Q4 YE
Owned and leased hotels operating margin percentage (a)..…………….……….......………….. 25.5% 25.6% 21.2% 22.5% 23.8%Percent change (b) (d)……………………….………… NA NA NA NA NAComparable owned and leased hotels operating margin percentage (a)…….…….…………………. 23.5% 25.6% 21.1% 22.7% 22.7%Percent change (b) (d)…………………..….………… NA NA NA NA NA
2016Q1 Q2 Q3 Q4 YE
Owned and leased hotels operating margin percentage (a)..…………….……….......………….. 24.6% 26.1% 22.6% 21.0% 23.6%Percent change (b)……………………….………… ---- (1.5)% (0.5)% (3.2)% (1.3)%Comparable owned and leased hotels operating margin percentage (a)…….…….…………………. 25.3% 27.4% 23.4% 22.2% 24.5%Percent change (b)…………………..….…………… ---- ---- 0.8 % (2.3)% (0.3)%
2015Q1 Q2 Q3 Q4 YE
Owned and leased hotels operating margin percentage (a)..…………….……….......………….. 24.6% 27.6% 23.0% 24.2% 24.9%Percent change (b)……………………….………… 0.3 % 0.2 % (1.0)% 1.2 % 0.2 %Comparable owned and leased hotels operating margin percentage (a)…….…….…………………. 25.0% 27.6% 22.4% 24.6% 25.0%Percent change (b)…………………..….…………… 0.5% 1.2 % (0.6)% 1.5 % 0.7 %
(a) This data represents information reported in the most recent public filing in which the stated period was presented.
(b) Percentage change shown is that which was published in the most recent applicable public filing.
(c) The realignment of our reporting structures in October 2012 did not impact the owned and leased segment and therefore these statistics agree to our most recent applicable public filling.
(d) The segment results presented here for 2017 have been restated to reflect the adoption of Revenue from Contracts with Customers (ASU 2014-09) that went into effect on January 1, 2018. Segment results for 2016 and prior years have not been restated.

54
2014Q1 Q2 Q3 Q4 YE
Owned and leased hotels operating margin percentage (a)..…………….……….......………….. 24.3% 27.4% 24.0% 23.0% 24.7%Percent change (b)……………………….………… 3.8 % (0.4)% 0.6 % (0.5)% 0.8 %Comparable owned and leased hotels operating margin percentage (a)…….…….…………………. 25.3% 26.5% 23.1% 23.7% 24.6%Percent change (b)…………………..….…………… 1.2% (0.2)% 1.9 % (0.5)% 0.6 %
2013Q1 Q2 Q3 Q4 YE
Owned and leased hotels operating margin percentage (a)..…………….……….......………….. 20.5% 27.8% 23.4% 23.5% 23.9%Percent change (b)……………………….………… 0.2 % 1.5 % (0.7)% 1.1 % 0.5%Comparable owned and leased hotels operating margin percentage (a)…….…….…………………. 20.0% 26.9% 22.6% 21.9% 22.3%Percent change (b)…………………..….…………… ---- 2.3% 0.2% 0.6 % 1.0%
2012Q1 Q2 Q3 Q4 YE
Owned and leased hotels operating margin percentage (a)..…………….……….......………….. 20.3% 26.3% 24.1% 22.4% 23.4%
Percent change (b)……………………….………… 2.2 % 3.2% 0.7% (0.1)% 1.5%Comparable owned and leased hotels operating margin percentage (a)…….…….…………………. 21.0% 25.7% 23.4% 22.5% 23.1%Percent change (b)…………………..….…………… 1.2 % 1.2% 0.2% (1.1)% 0.4%
2011Q1 Q2 Q3 Q4 YE
Owned and leased hotels operating margin percentage (a)..…………….……….......………….. 18.1% 23.1% 23.4% 22.5% 21.9%Percent change (b)……………………….………… (1.2)% 0.5% 6.0% 3.1% 2.2%Comparable owned and leased hotels operating margin percentage (a)…….…….…………………. 18.8% 23.7% 22.5% 22.7% 21.9%Percent change (b)…………………..….…………… (1.3)% 0.8% 3.5% 1.8% 1.1%
2010Q1 Q2 Q3 Q4 YE
Owned and leased hotels operating margin percentage (a)..…………….……….......…………..
19.3% 22.6% 17.4% 19.4% 19.7%
Percent change (b)……………………….………… 1.5% 2.3% 1.2% 1.7% 1.7%Comparable owned and leased hotels operating margin percentage (a)…….…….…………………. 20.2% 22.4% 18.5% 20.6% 20.8%Percent change (b)…………………..….…………… 2.2% 1.3% 1.3% 2.1% 1.8%
2009Q1 Q2 Q3 Q4 YE
Owned and leased hotels operating margin percentage (a)..…………….……….......………….. 17.8% 20.3% 16.2% 17.7% 18.0%Percent change (b)……………………….………… ---- ---- ---- (3.3)% (8.0)%Comparable owned and leased hotels operating margin percentage (a)…….…….…………………. 17.7% 20.9% 17.1% 18.3% 18.6%Percent change (b)…………………..….…………… ---- ---- ---- (2.2)% (7.0)%
(a) This data represents information reported in the most recent public filing in which the stated period was presented.
(b) Percentage change shown is that which was published in the most recent applicable public filing.
(c) The realignment of our reporting structures in October 2012 did not impact the owned and leased segment and therefore these statistics agree to our most recent applicable public filling.
(d) The segment results presented here for 2017 have been restated to reflect the adoption of Revenue from Contracts with Customers (ASU 2014-09) that went into effect on January 1, 2018. Segment results for 2016 and prior years have not been restated.
55
Hyatt Hotels Corporation Investor Fact Book
Q4 2019


