________________________________ Hybrid of Metaheuristic Methods for Solving the Cell Formation Problem Luong Thuan Thanh Jacques A. Ferland Nguyen Dinh Thuc Van Hien Nguyen March 2012 CIRRELT-2012-14 Bureaux de Montréal : Bureaux de Québec : Université de Montréal Université Laval C.P. 6128, succ. Centre-ville 2325, de la Terrasse, bureau 2642 Montréal (Québec) Québec (Québec) Canada H3C 3J7 Canada G1V 0A6 Téléphone : 514 343-7575 Téléphone : 418 656-2073 Télécopie : 514 343-7121 Télécopie : 418 656-2624 www.cirrelt.ca
Transcript
________________________________
Hybrid of Metaheuristic Methods for
Solving the Cell Formation Problem
Luong Thuan Thanh Jacques A. Ferland Nguyen Dinh Thuc Van Hien Nguyen March 2012 CIRRELT-2012-14
G1V 0A6
Bureaux de Montréal : Bureaux de Québec :
Université de Montréal Université Laval C.P. 6128, succ. Centre-ville 2325, de la Terrasse, bureau 2642 Montréal (Québec) Québec (Québec) Canada H3C 3J7 Canada G1V 0A6 Téléphone : 514 343-7575 Téléphone : 418 656-2073 Télécopie : 514 343-7121 Télécopie : 418 656-2624
www.cirrelt.ca
Hybrid of Metaheuristic Methods for Solving the
Cell Formation Problem
Luong Thuan Thanh1, Jacques A. Ferland1,2,*, Nguyen Dinh Thuc3, Van Hien Nguyen1,4
1 Institute for Computational Science and Technology, Information Technology Park (VNU-IT.park), Quarter 6, Linh Trung Ward, Thu Duc District, Ho Chi Minh City, Vietnam
2 Interuniversity Research Centre on Enterprise Networks, Logistics and Transportation (CIRRELT), and Department of Computer Science and Operations Research, Université de Montréal, C.P. 6128, succursale Centre-ville, Montréal, Canada H3C 3J7
3 Faculty of Information Technology - HCMUS – VNU, 227 Nguyen Van Cu, Dist. 5, Hochiminh city, Vietnam University of Science, Vietnam National University at Ho Chi Minh City, Vietnam
4 Department of Mathematics, University of Namur (FUNDP), rue de Bruxelles 61, B-5000 Namur, Belgium
Abstract. In this paper we solve the cell formation problem with three different hybrids of metaheuristic methods. The first method is an implementation of the simulated annealing method (SA) using different neighborhoods of the current solution. The solution generated at each iteration is obtained by using a diversification of the current solution combined with an intensification to improve this solution. Different diversification and intensification strategies are combined to generate different neighborhoods. The second method is an adaptive simulated annealing method (ASA) where the neighborhood used at each iteration is selected randomly among the four neighborhood identified above. The procedure is adaptive in the sense that the probabilities are updated during the process according to the success of using the different neighborhoods. A third set of methods is derived by modifying the hybrid method (HM) combining a local search algorithm (LSA) with a genetic algorithm (GA) introduced in (Elbenani et al., 2011). All the variants perform well to deal with the 35 benchmark cell formation problems commonly used in the literature, but the dominating one is a modified HM followed by a SA method afterward. It allows improving the best-known solution of 2 of the 35 benchmarked problems used in the literature, reaching the best-known solution of 32 others, and missing the best-known solution of the other one by a factor of 0.016%.
Acknowledgements. This research was supported by the Institute for Computational Science and Technology at Ho Chi Minh City (ICST HCMC), Vietnam.
Results and views expressed in this publication are the sole responsibility of the authors and do not necessarily reflect those of CIRRELT. Les résultats et opinions contenus dans cette publication ne reflètent pas nécessairement la position du CIRRELT et n'engagent pas sa responsabilité.
_____________________________
* Corresponding author: [email protected] Dépôt légal – Bibliothèque et Archives nationales du Québec Bibliothèque et Archives Canada, 2012
swarm optimization, neural networks and fuzzy theory.
In (Ghosh et al., 2010), the authors introduce a survey of various genetic algorithms used to
solve the cell formation problem. The success of genetic algorithms in solving this problem
induced researchers to consider different variants and hybrids in order to generate very
robust techniques.
In this paper, we introduce solution methods hybridizing different approaches. The first
method is an implementation of the simulated annealing (SA) (Kirkpatrick et al., 1983,
Cerny,1994) using different neighborhoods of the current solution. The solution selected in
the neighborhood at each iteration is obtained by applying a diversification strategy to the
current solution and by using an intensification strategy to improve it. The first
intensification strategy is an approximation method used in a local search method (LSA)
introduced in (Elbenani et al., 2011), and the second one relies on the Dinkelbach method
(Dinkelbach 1967). They are combined with two different diversification strategies to
generate four different neighborhoods leading to four variants of the simulated annealing
method. The second method is specified by referring to the Adaptive Large Neighborhood
Search (ALNS) introduced in (Pisinger and Ropke 2007). It is an adaptive simulated
Hybrid of Metaheuristic Methods for Solving the Cell Formation Problem
CIRRELT-2012-14 1
annealing method (ASA) where the neighborhood used at each iteration is selected
randomly among the four neighborhood identified above. The procedure is adaptive in the
sense that the probabilities are updated during the process according to the success of using
the different neighborhoods. A third set of methods are derived by modifying the hybrid
method (HM) combining a local search algorithm (LSA) with a genetic algorithm (GA)
introduced in (Elbenani et al., 2011). The first modification is to replace the
approximation method used in LSA by an Exact procedure based on the Dinkelbach method
to solve fractional programming problem. The second modification is to apply a SA method
afterward on the solution generated with the HM.
Numerical results are obtained comparing numerically the efficiency of the variants with
respect to the best-known solutions of 35 benchmark problems commonly used by authors
to evaluate their methods. All the variants perform well to deal with the cell formation
problem, but the dominating one is the modified HM using the Exact procedure followed by
a SA method afterward. It allows improving the best-known solution of 2 of the 35
benchmarked problems, reaching the best-known solution of 32 others, and missing the
best-known solution of the other one by a factor of 0.016%.
The cell formation problem is summarized in Section 2. Section 3 is devoted to the
simulated annealing procedure. We introduce the different diversification and intensification
strategies to develop the different neighborhoods. The ASA and the modified HM methods
are summarized in Sections 4 and 5, respectively. The Section 6 includes the numerical
results.
2 PROBLEM FORMULATION
To formulate the cell formation problem, consider the following two sets
set of machines: 1, ,
set of parts: 1, , .
I m i m
J n j n
= == =
…
…
The production incidence matrix ijA a = indicates the interactions between the machines
and the parts:
1 if machine process part
0 otherwise.ij
i ja
=
Furthermore, a part j may be processed by several machines. A production cell k
( )1, ,k K= … includes a subset (group) of machines kC I⊂ and a subset (family) of parts
kF J⊂ . The problem is to determine a solution including K production cells
( ) ( ) ( ){ }1 1, = , , , ,K KC F C F C F… as autonomous as possible. Note that the K production
cells induce partitions of the machines set and of the parts set:
{ }
1 2 1 2
1 1
1 2
and
and for all pairs of different cell indices and 1, ,
and .
K K
k k k k
C C I F F J
k k K
C C F Fφ φ
= =
∈
= =
∪…∪ ∪…∪
…
∩ ∩
To illustrate the production cells concept, consider a machine-part incidence matrix in Table
Hybrid of Metaheuristic Methods for Solving the Cell Formation Problem
2 CIRRELT-2012-14
1. Table 2 illustrates a partition into 3 different cells illustrated in the gray zones. The
solution includes the 3 machine groups {(1,4,6), (3,5), (2)} and the 3 part families {(2,4,6,8),
(1,7), (3,5)}. Parts 1 2 3 4 5 6 7 8
1 0 1 0 1 1 1 0 1
2 1 0 1 0 1 0 0 0
3 1 0 1 0 0 0 1 0
4 0 1 0 1 0 1 0 1
5 1 0 0 0 0 0 1 1
Mac
hin
es
6 1 1 0 0 0 1 1 1
Table 1. Incidence matrix
Parts 2 4 6 8 1 7 3 5
1 1 1 1 1 0 0 0 1
4 1 1 1 1 0 0 0 0
6 1 0 1 1 1 1 0 0
3 0 0 0 0 1 1 1 0
5 0 0 0 1 1 1 0 0
Mac
hin
es
2 0 0 0 0 1 0 1 1
Table 2. Matrix solution
The exceptional elements (1,5), (6,1), (6,7), (3,3), (5,8) and (2,1) correspond to entries
having a value 1 that lay outside of the gray diagonal blocks.
Sarker and Khan (2001) carry out a comparative study of different autonomy measures for
the solution of a cell formation problem. In this paper we consider the grouping efficacy Eff
(Kumar and Chandrasekharan 1990) that is mostly used:
1 1
0 0
Out In
In In
a a aEff
a a a a
−= =
+ + (1)
where 1 1
m n
ij
i j
a a= =
=∑∑ denotes the total number of entries equal to 1 in the matrix A, 1
Outa
denotes the number of exceptional elements, and 1 0and In Ina a are the numbers of one and of
zero entries in the gray diagonal blocks, respectively. The objective function of the problem
is maximizing Eff .
To formulate the mathematical formulation of the problem, we introduce the following
binary variables:
Hybrid of Metaheuristic Methods for Solving the Cell Formation Problem
CIRRELT-2012-14 3
{
{
for each pair 1, , ; 1, ,
1 if machine belongs to cell
0 otherwise
for each pair 1, , ; 1, ,
1 if part belongs to cell
0 otherwise.
ik
jk
i m k K
i kx
j n k K
j ky
= =
=
= =
=
… …
… …
To evaluate the objective function Eff, it is easy to verify that
( )
1
1 1 1
0
1 1 1
1 .
K m nout
ij ik jk
k i j
K m nIn
ij ik jk
k i j
a a a x y
a a x y
= = =
= = =
= −
= −
∑∑∑
∑∑∑
In this paper we are considering the following model M(x,y) of the cell partitioning
problem:
( )( )
( )
( )
( )
( )
( )
1 1 1
1 1 1
1
1
1
1
, Max
1
Subject to 1 1, , 2
1 1, , 3
1 1, , 4
1 1, , 5
0 or 1 1, , ; 1, , 6
K m n
ij ik jk
k i j
K m n
ij ik jk
k i j
K
ik
k
K
jk
k
m
ik
i
n
jk
j
ik
j
a x y
M x y Eff
a a x y
x i m
y j n
x k K
y k K
x i m k K
y
= = =
= = =
=
=
=
=
=
+ −
= =
= =
≥ =
≥ =
= = =
∑∑∑
∑∑∑
∑
∑
∑
∑
…
…
…
…
… …
( )0 or 1 1, , ; 1, , 7k j n k K= = =… …
The constraints (2) and (3) ensure that each machine and each part is assigned to exactly
one cell, respectively. The constraints (4) and (5) ensure that each cell includes at least one
machine and one part (no empty cell allowed). Finally, the variables are binary in (6) and
(7). In our numerical experimentation we fix the number K of cells for each problem to its
value in the best-known solution reported in the literature, and constraints (4) and (5)
eliminate any empty cell
Hybrid of Metaheuristic Methods for Solving the Cell Formation Problem
4 CIRRELT-2012-14
3 SIMULATED ANNEALING
To deal with the cell formation problem, we use a straightforward implementation of the
simulated annealing method presented in (Ferland and Costa, 2001.
Procedure Simulated Annealing (N) Initialization:
Let ( )0 0,C F an initial solution; 0TP the initial temperature
Let 0iter : 0; : ; : 0TP TP fcount= = =
Let ( ) ( ) ( )* * 0 0, : , : , ; stop : falseC F C F C F= = =
While not stop
: 0; : 0changes trials= =
While trials SF< and changes coff<
Generate a solution ( ) ( ), ,C F N C F′ ′ ∈
( ) ( ): , ,Eff C F Eff C F′ ′∆ = −
If 0∆ >
then ( ) ( ), : ,C F C F′ ′= and changes := changes + 1
else generate a random number ( )0,1r ∈
If /TPr e∆< then ( ) ( ), : ,C F C F′ ′= and changes := changes + 1
If ( ) ( )* *, ,Eff C F Eff C F′ ′ > then ( ) ( )* *, : ,C F C F′ ′= and fcount := 0
trials := trials + 1
:TP TPα=
Iter := iter + 1
If changes/trials < mpc then fcount := fcount + 1
If iter ≥ itermax or fcount = flimit then stop := true
( )* *,C F is the best solution generated �
In this implementation of the simulated annealing, we complete several iterations with the
same temperature TP. This temperature is modified when the number of trial solutions
(trials) or when the number of times that the current solution is changed (changes) reaches
threshold values Sf or coff, respectively. The parameter α is used to modify the temperature.
Two stopping criteria are used. The first is fixed in terms of the number of different
temperature values used (itermax). To apply the second criterion, we keep track of the
number of consecutive temperature values (fcount) where the number of changes over the
number of trials is smaller than a threshold value mpc. When fcount reaches the value flimit,
the procedure stops.
To complete the presentation of the procedure, we indicate how the initial solution
Hybrid of Metaheuristic Methods for Solving the Cell Formation Problem
CIRRELT-2012-14 5
( )0 0,C F is generated, and we describe the different neighborhoods N that we are using.
3.1 Initial Solution To generate the initial solution, we use a procedure quite similar to the one proposed in
(Rojas et al., 2004) that is introduced in (Elbenani et al., 2011). First we determine K
machine groups 0 0
1 , , KC C… . Then the K part families 0 0
1 , , KF F… are specified on the basis
of the K machines groups known.
Denote
1 1
and n m
i ij j ij
j i
a a a a= =
= =∑ ∑i i
the number of parts processed by machine i and the number of machines processing j,
respectively. To initiate the machine groups formation, select the K machines having the
largest values iai, and assign them to the different groups 0 , 1, .kC k K= … Then each of the
other machines left is assigned to the group 0
kC including machines processing mostly the
same parts. More specifically, denote INA the set of machine left. The assignments are
completed as follows:
I. For all machines i INA∈ , determine the group
( )0 0
0 01, , 1, ,1 1
1 1Min ArgMin
k k
k k k k
n n
ij i j i ij i jk K k Kj ji C i Ck k
k i a a gr a aC C= == =∈ ∈
= − = −
∑ ∑ ∑ ∑
… …
.
II. Determine the machine i INA∈
( ){ }ArgMini INA
i k i∈
=
and assign { }0 0 0 to group ; i.e., .i i igr gr gri C C C i= ∪
III. Eliminate from i INA , and repeat I) until INA becomes empty.
On the basis of the K machine groups 0 0
1 , , KC C… , determine the K part families 0 0
1 , , KF F… .
For each part j, denote
( )0
1 the number of machines in group that are processing part
k
In
j ij
i C
a k a k j∈
= ∑�
( ) ( )0
0 1 the number of machines in group that are not processing part In In
j k ja k C a k k j= −� �
( )( )
1
0
an approximation of the impact on the grouping efficacy of
assigning part to family .
In
j
In
j j
a kEff
a a k
j k
+i
�
�
( ) ( )( )
( )10
1, , 0
Then each part is assigned to the family where ArgMax
In
j
Ink jk K j j
a kj F k j
a a k=
=
+ �
… i
��
�in
Hybrid of Metaheuristic Methods for Solving the Cell Formation Problem
6 CIRRELT-2012-14
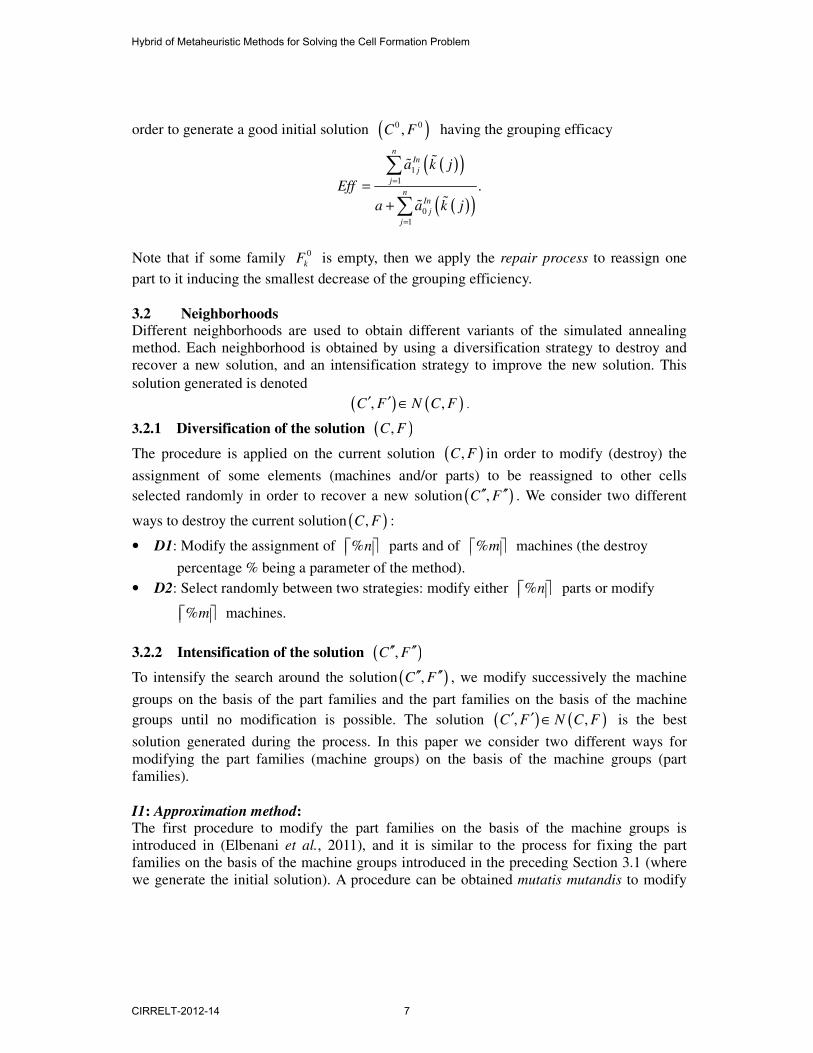
order to generate a good initial solution ( )0 0,C F having the grouping efficacy
( )( )
( )( )
1
1
0
1
.
nIn
j
j
nIn
j
j
a k j
Eff
a a k j
=
=
=
+
∑
∑
��
��
Note that if some family 0
kF is empty, then we apply the repair process to reassign one
part to it inducing the smallest decrease of the grouping efficiency.
3.2 Neighborhoods Different neighborhoods are used to obtain different variants of the simulated annealing
method. Each neighborhood is obtained by using a diversification strategy to destroy and
recover a new solution, and an intensification strategy to improve the new solution. This
solution generated is denoted
( ) ( ), ,C F N C F′ ′ ∈ .
3.2.1 Diversification of the solution ( ),C F
The procedure is applied on the current solution ( ),C F in order to modify (destroy) the
assignment of some elements (machines and/or parts) to be reassigned to other cells
selected randomly in order to recover a new solution ( ),C F′′ ′′ . We consider two different
ways to destroy the current solution ( ),C F :
• D1: Modify the assignment of %n parts and of %m machines (the destroy
percentage % being a parameter of the method).
• D2: Select randomly between two strategies: modify either %n parts or modify
%m machines.
3.2.2 Intensification of the solution ( ),C F′′ ′′
To intensify the search around the solution ( ),C F′′ ′′ , we modify successively the machine
groups on the basis of the part families and the part families on the basis of the machine
groups until no modification is possible. The solution ( ) ( ), ,C F N C F′ ′ ∈ is the best
solution generated during the process. In this paper we consider two different ways for
modifying the part families (machine groups) on the basis of the machine groups (part
families).
I1: Approximation method:
The first procedure to modify the part families on the basis of the machine groups is
introduced in (Elbenani et al., 2011), and it is similar to the process for fixing the part
families on the basis of the machine groups introduced in the preceding Section 3.1 (where
we generate the initial solution). A procedure can be obtained mutatis mutandis to modify
Hybrid of Metaheuristic Methods for Solving the Cell Formation Problem
CIRRELT-2012-14 7
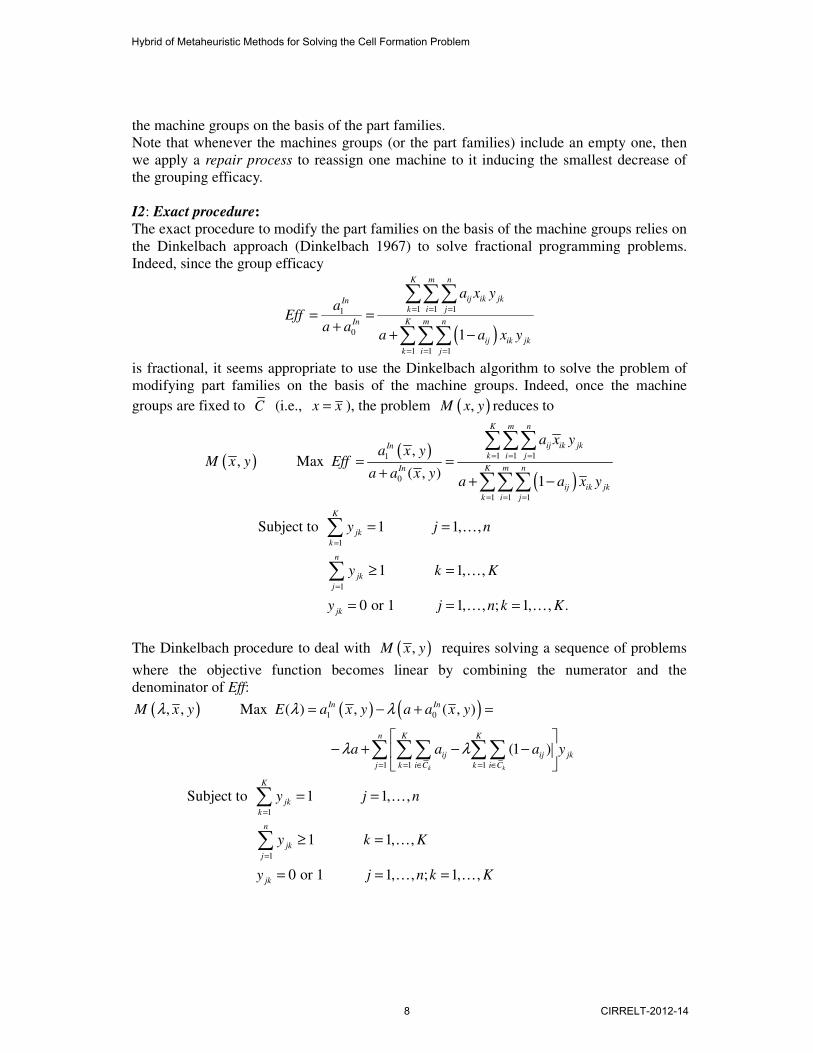
the machine groups on the basis of the part families.
Note that whenever the machines groups (or the part families) include an empty one, then
we apply a repair process to reassign one machine to it inducing the smallest decrease of
the grouping efficacy.
I2: Exact procedure:
The exact procedure to modify the part families on the basis of the machine groups relies on
the Dinkelbach approach (Dinkelbach 1967) to solve fractional programming problems.
Indeed, since the group efficacy
( )
1 1 11
0
1 1 1
1
K m n
ij ik jkInk i j
K m nIn
ij ik jk
k i j
a x ya
Effa a
a a x y
= = =
= = =
= =+
+ −
∑∑∑
∑∑∑
is fractional, it seems appropriate to use the Dinkelbach algorithm to solve the problem of
modifying part families on the basis of the machine groups. Indeed, once the machine
groups are fixed to C (i.e., x x= ), the problem ( ),M x y reduces to
( )( )
( )
1 1 11
0
1 1 1
1
1
,, Max
( , )1
Subject to 1 1, ,
1 1, ,
0 or 1 1, , ; 1, , .
K m n
ij ik jkIn
k i j
K m nIn
ij ik jk
k i j
K
jk
k
n
jk
j
jk
a x ya x y
M x y Effa a x y
a a x y
y j n
y k K
y j n k K
= = =
= = =
=
=
= =+
+ −
= =
≥ =
= = =
∑∑∑
∑∑∑
∑
∑
…
…
… …
The Dinkelbach procedure to deal with ( ),M x y requires solving a sequence of problems
where the objective function becomes linear by combining the numerator and the
denominator of Eff:
( ) ( ) ( )1 0
1 1 1
1
1
, , Max ( ) , ( , )
(1 )
Subject to 1 1, ,
1 1, ,
0 or 1 1, , ; 1, ,
k k
In In
n K K
ij ij jk
j k i C k i C
K
jk
k
n
jk
j
jk
M x y E a x y a a x y
a a a y
y j n
y k K
y j n k K
λ λ λ
λ λ= = ∈ = ∈
=
=
= − + =
− + − −
= =
≥ =
= = =
∑ ∑∑ ∑∑
∑
∑
…
…
… …
Hybrid of Metaheuristic Methods for Solving the Cell Formation Problem
8 CIRRELT-2012-14
for different values of λ . As we shall see, this problem is trivial to solve.
First, introduce the Dinkelbach procedure solving ( ), ,M x yλ :
Dinkelbach procedure
• Initialization.
o Start with the solution ( )0,C F
o Take ( )( )0
10
0 0
0
,λ : ,
( , )
In
In
a x yEff C F
a a x y= =
+, and ζ : = 1.
• Step ζ .
o Solve the problem ( )1, ,M x yζλ −
Let ( ),C F ζ be an optimal solution of this problem.
Let ( )E ζλ be the optimal of this problem.
o Stopping rule. If ( ) 0E ζλ = , then STOP: ( ),C F ζ is an optimal solution and
( ),Eff C F ζ is an optimal value of ( ),M x y ).
o Otherwise, let ( )λ : , .Eff C F ζζ = Let : 1ζ ζ= + , and go back to Step . ζ �
In the Dinkelbach procedure, the initial solution ( )0,C F is the current solution on hand. A
sequence of different part families are generated, and this sequence converges to an optimal
K part families on the basis of the K machine groups C . The algorithm converges since the
sequence { }ζλ is strictly increasing (Crouzeix et al 2008).
Now consider the problem ( ), ,M x yλ . Since the objective function
1 1 1
( ) (1 )k k
n K K
ij ij jk
j k i C k i C
E a a a yλ λ λ= = ∈ = ∈
= − + − −
∑ ∑∑ ∑∑
is separable in j, the optimal assignment of part j is determined by the index { }1, ,k K∈ …
where
1, ,(1 ) Max (1 )
k kk k
ij ij ij ijk K
i C i C i C i C
a a a aλ λ=
∈ ∈ ∈ ∈
− − = − −
∑ ∑ ∑ ∑
…
and assigning k
j F∈ . Note that referring to the formulation of the cell formation problem,
it follows that
Hybrid of Metaheuristic Methods for Solving the Cell Formation Problem
CIRRELT-2012-14 9
the number of 1 in the column that
belong to the rows included in the set (1 )
the number of 0 in the column that
belong to the rows included in the set
k k
k
ij ij
i C i C
k
j
Ca a
j
C
λ
λ∈ ∈
−
− − =
∑ ∑
A similar procedure can be obtained mutatis mutandis to modify the machine groups on the
basis of the part families.
Note that whenever the machines groups (or the part families) include an empty one, then
we apply a repair process to reassign one machine (one part) to it inducing the smallest
decrease of the grouping efficiency. This exact procedure is also used by the authors in
(Khoa et all 2011) to develop a multi starts procedure to solve the Cell Formation Problem.
3.2.3 Four different neighborhoods
In this paper we compare numerically four different variants specified using the following
neighborhoods: 1N : generated with the diversification D1 and the intensification I1 2N : generated with the diversification D1 and the intensification I2 3N : generated with the diversification D2 and the intensification I1 4N : generated with the diversification D2 and the intensification I2.
4 ADAPTIVE SIMULATED ANNEALING
Referring to the Adaptive Large Neighborhood Search (ALNS) proposed by the authors in
(Pisinger and Ropke 2007), we develop a new variant of the Simulated Annealing where the
neighborhood used at each iteration is selected randomly in a set of neighborhoods available.
In our implementation we use the set of neighborhoods { }1 2 3 4, , ,N N N N specified in
Section 3.2.3. A probability is associated with each , 1, , 4,i
iP N i = … and the neighborhood
is selected according to these probabilities.
The same values of the probabilities should be used for a fixed number coiteration of
iterations of the Simulated Annealing procedure before being updated according to the
performance of the neighborhoods iN during the procedure. In order to do this, associate a
score parameter iπ with each neighborhood iN . The scores should be proportional to the
efficiency of the neighborhoods, and hence larger scores induce that the neighborhoods
should be chosen with larger probabilities.
To update the scores after completing coiteration iterations, we specify a scalar
ico indicating the number of times that iN is selected and a value iδ measuring the
efficiency of iN . These values are updated each time neighborhood iN is selected as
follows:
: 1
:
i i
i i
co co
δ δ σ
= +
= +
where
Hybrid of Metaheuristic Methods for Solving the Cell Formation Problem
10 CIRRELT-2012-14
1
2
3
4
if 0 and the best solution is improved
if 0 and the best solution is not improved
if the current solution is modified according to the probability
if the current
σ
σσ
σ
σ
∆ >
∆ >=
solution does not change,
and 1 2 3 40 .σ σ σ σ> > > > Then after completing coiteration iterations, the scores
, 1, , 4,i iπ = … are updated as follows:
( ): Max , 1
: : 0,
ii i
i
i i
co
co
δπ ε ρ π ρ
δ
= − +
= =
and the probabilities , 1, , 4,iP i = … become
4
1
: .i
i
l
l
Pπ
π=
=
∑
The values of ε prevents iπ to become negative, and the value of iπ is modified more
extensively when the value of [ ]0,1ρ ∈ is larger. Moreover, it follows that the probability
iP should increase when the neighborhood iN is successful to increase the value of Eff.
5 MODIFYING THE HYBRID METHOD (HM) IN (Elbenani et al 2011)
The Hybrid Mehod (HM) introduced in (Elbenani et al 2011) generates very good
solutions for the 35 benchmark problems. This hybrid method integrates a Local Seach
Algorithm (LSA) within a steady state Genetic Algorithm (GA).
The LSA includes two different procedures, one to diversify and the other to intensify the
search. They are applied successively for a fixed number of iterations. To diversify more
extensively the feasible domain, a destroying procedure is used to select either a subset of
machines or a subset of parts for which the assignment is modified. Then a recovering
procedure allows generating a new solution by reassigning a new group to each machine or
a new family to each part of the subset in order to reduce the grouping efficacy as little as
possible. Note the difference with the destroying procedure used to specify the
neighborhoods in Section 3.2.1 where the elements are reassigned randomly to a new group
or a new family. The intensification strategy is described in Section 3.2.2 where the
Approximation method (I1) is used to modify the part families (machine groups) on the
basis of the machine groups (part families).
The purpose of the Hybrid Method HM is to allow improving even more the quality of the
solutions using a steady state GA to diversify even more the procedure. Each solution is
encoded as a vector of ( )n m+ elements including the family of each of the n parts and the
group of each of the m machines. To generate the initial population S, we first introduce the
solution generated in Section 3.1. Then each of the other solution in S is obtained according
to the following procedure. First we decide to generate either the machine groups or the part
Hybrid of Metaheuristic Methods for Solving the Cell Formation Problem
CIRRELT-2012-14 11
families, each alternative having a probability of 0.5. If the first alternative is selected, then
each machine i is assigned randomly to a group k. We also prevent that each group is not
empty by applying a repair process to move a machine from the group including the most to
the empty group. Then the part families are determined on the basis of these machine
groups as described in Section 3.1. The LSA is applied to improve the solution which is
included in the population S. The procedure to complete the second alternative is similar.
The role of machines and parts are exchanged.
At each iteration (generation) of the GA, two solutions are selected according to a
tournament strategy based on their fitness measured in term of their Eff. A uniform
crossover is applied to generate two offspring solutions. If required, the repair process is
applied to insure that no group or no family is empty. A mutation operator is specified by
selecting randomly one machine and one part that are reassigned to a new group and a new
family selected randomly. The mutation is performed according to a probability pm. Finally,
the LSA method is applied to improve each offspring solution before updating the
population of solutions.
The GA stops whenever the best solution is not improved for a fixed number nga of
consecutive iterations.
In this paper, we introduce two different modifications of HM, and we compare them
numerically. The first modification (HM_E) is obtained by modifying the LSA to replace the
Approximation method by the Exact procedure to modify the part families (machine groups)
on the basis of the machine groups (part families). The purpose of the second modification
is to verify if the solutions obtained with the methods HM and HM_E can be improved by
applying a SA method afterward to their solutions. The corresponding methods are denoted
HM_SA and HM_E_SA.
6 NUMERICAL RESULTS
To complete the numerical experimentation, we consider the 35 benchmark problems that
are commonly used by authors to evaluate the efficiency of their methods. The first 5
columns of Table 3 indicate the problem number, the reference where it is specified
(Problem source), its size (values of m, n, and K), and the value of its best-known solution
(BKS). Moreover the values of the best-known solutions are identified by refereeing to the
following references (Goncalves and Resende, 2004, James et al., 2007, Luo and Tang,
2009, Mahdavi et al., 2009, Tunnukij and Hicks, 2009, Elbenani et al., 2011, and Ying et al.,
2011). Furthermore, the authors in (Elbenani and Ferland, 2012) are using an exact method
based on the Dinkelbach approach to show that the best-known value is in fact equal to the
optimal value for the following problems: P1 to P17, P19 to P24, P28, P30, P34, and P35.
This is indicated in Table 3 by marking these optimal values with the index *.
The numerical tests are completed on a PC equipped with an INTEL Core 2 Duo processor
running at 2.2 GHZ, and having a 2 GB of central memory on a Linux system. To complete
the comparisons of the variants, we always use the average Eff (Aver. Eff) and the average
solution time (Aver. Time) over 10 runs for solving each problem.
The first part of this section is dedicated to compare the different variants of the SA method.
Then we verify if the adaptive impact allows obtaining better results using the ASA methods.
The different variants of the HM method are compared numerically to verify if the Exact
procedure allows also improvements and to see the benefit of applying a SA method
Hybrid of Metaheuristic Methods for Solving the Cell Formation Problem
12 CIRRELT-2012-14
afterward. Finally, we conclude this section by comparing numerically the best variants of
these three methods.
6.1 The SA method The purpose of this analysis is threefold. First we compare the average group efficacy (A.Eff)
of the four variants of SA. As a consequence we should identify the best diversification (D1
or D2) and the best intensification (I1 or I2) strategies. In the second part, we compare the
impact of the percentage % of modified elements in the diversification strategies. Three
different values are considered: 20%, 30%, and 50%. Finally, we verify how the quality of
the solutions can be improved when the solution time allowed increases.
Comparing the neighborhoods To compare the neighborhoods, we implement the SA method with the following values for
the parameters: 0 100 mpc 0.5 0.2
itermax 10 2 2
TP K
K Sf K coff K
α= = =
= = =
flimit = 5K.
The last four columns of Table 3 include the A.Eff for the SA using the four different
neighborhoods , 1, , 4.iN i = … For each problem, the best value of A.Eff is marked in bold.
To reduce the length of the paper, we report only the table where the percentage is fixed at
30%, but the tables for the other two values of % are quite similar. Additional results
comparing the average A.Eff (Aver. Eff) and the average solution time (Aver. Time) for the
35 problems, and the number of problems where the BKS is reached or exceeded for the
four neighborhoods are included in Table 4. The numerical results in Tables 3 and 4 indicate
that the variants using neighborhoods 2 4 and N N allows generating better results than
using 1 3 and N N . Furthermore, the overall average (last row of the Table 3) for the variant
with 2N exceeds slightly that of BKS, and that of the variant with 4N is slightly smaller
than that of BKS. Hence these variants seem very efficient to solve the cell formation
problem.
This analysis above allows concluding that the intensification strategy I2 seems more
efficient than I1. Furthermore, since the variant 2N is slightly more efficient than 4N , it
follows that the diversification D1 seems to be slightly more efficient than D2 when
combined with the intensification I2.
Table 3: Compare A. Eff of the four neighborhoods when %=30%