Hybrid renewable energy supply for rural healthcare facilities: An approachto quality healthcare delivery
Lanre Olatomiwaa,b,⁎, Richard Blancharda, Saad Mekhilefc, Daniel Akinyeled
a Centre for Renewable Energy Systems Technology, Loughborough University, LE11 3TU, United KingdombDepartment of Electrical & Electronics Engineering, Federal University of Technology, Minna. PMB 65 Minna, Nigeriac Power Electronics and Renewable Energy Research Laboratory (PEARL), Department of Electrical Engineering, University of Malaya, 50603 Kuala Lumpur, Malaysiad Department of Electrical and Electronics Engineering, Faculty of Engineering, University of Lagos, Nigeria
The lack of modern electricity supply has been a major impediment to proper functioning of the healthcarecenters in the rural areas, contributing to high maternal and child mortality rates in a country. Therefore, thisstudy focuses on how to address the identified problem so that the healthcare centers or clinics in the remoteareas can provide timely delivery of medical services for the concerned people. This paper, then, presents theanalysis of stand-alone hybrid renewable energy systems for basic healthcare services in the rural areas, wherethere is no grid energy supply or the supply from the existing grid is erratic and unreliable. One major factor thatinforms the selection of the hybrid energy system in this study is that it promises high reliability compared to asingle energy system. The research presents a statistical analysis of the potential of wind and solar energies for aselected rural locations in Nigeria based on the available long-term hourly and daily meteorological data. Itemploys an optimal technical and economic design and sizing of hybrid electrical power systems’ componentssuch as the wind, PV, battery and inverter systems, using the hybrid optimisation software (HOMER). Resultsshow that Sokoto and Jos sites exist in the high wind potential regions, while the remaining sites are onlysuitable for small wind applications. Values obtained for global radiation show that all the sites enjoy con-siderable solar energy potential suitable for varying degree of solar energy applications. PV/wind/diesel/batteryhybrid system configuration is considered optimum for rural health center at Iseyin, Sokoto, Maiduguri, Jos andEnugu, while hybrid systems involving PV/diesel/battery is considered ideal for Port-Harcourt, due to thequality of renewable energy potential. Hence, it was concluded that, the abundance of wind and solar resourcesin the country create an ideal environment for inclusion of renewable energy systems in the design and im-plementation of standalone power supply systems to improve rural healthcare delivery.
Introduction
Reliable electricity access is a pre-requisite for improving the socialand economic lives of the people in rural areas. It enhances healthcaredelivery, education as well as other developmental growth within thelocal communities. At present, 17% of world population have no accessto electricity, 85% of which lives in rural areas of Sub-Saharan Africa(SSA), South Asia and other developing countries, with SSA having thelargest share of the electricity deficit rate [1].
The majority of these people have limited prospects of gaining ac-cess to electricity in the near future. The implication of this can betranslated as close to 1 billion people around the world are being servedwith healthcare facilities with no electricity access [2]. This deficiency
implies that medical equipment such as ultra sound, autoclave, cen-trifuge and medical x-ray cannot be used in such places as presented inFig. 1. Surgery services sometimes delivered by depending on the am-bient light from windows or kerosene lamps at nights. Reports indicatedthat, quite a number of women die on a daily basis during pregnancyand childbirth in rural places due to poor medical care. By providing atleast a minimum lighting and electric power supply to minor surgicalequipment could reduce the high maternal mortality rate by 70% [2].
Diesel generators have traditionally been used to power most off-grid clinics and hospitals for supplementing the unreliable grid supplyfor grid-connected facilities, but this is associated with attendant costsof diesel fuel and unreliable delivery as well as high CO2, CO andparticulate emissions contributing to air pollution and climate change.
https://doi.org/10.1016/j.seta.2018.09.007Received 15 February 2018; Received in revised form 29 August 2018; Accepted 24 September 2018
⁎ Corresponding author at: Centre for Renewable Energy Systems Technology, Loughborough University, LE11 3TU, United Kingdom.E-mail addresses: [email protected] (L. Olatomiwa), [email protected] (R. Blanchard), [email protected] (S. Mekhilef),
The rural health sector in developing nations are challenged withseveral problems, which have hindered effective delivery of healthcareservices to the people living in the rural communities. For instance,unreliable power supply can render cold-chain activities inoperable;furthermore, the lack of illumination (light) at the clinics at nightsusually keeps patients arriving late in the night for medical attention towait until the following morning before medical attention can be ren-dered to them. This has led to many problems including obstetriccomplications, which is one of the root causes of high maternal mor-tality rate in sub-Saharan Africa region [3]. A lack of antenatal care,absence of skilled birth attendants and limited availability of emer-gency obstetrics procedures due to lack of electricity are reasons for thissituation. Therefore, electricity should be a priority for effective publichealthcare delivery.
In rural areas with no access to electricity from the grid, renewableenergy technology could be a viable option. These alternative tech-nologies for producing electricity have received greater attention inrecent years, due to their cost effectiveness in operation, environmentalfriendliness as well as sustainability [4–12]. In the case of rural healthfacilities, a solar/wind/diesel generator hybrid system can be deployedto cater for the need of un-electrified rural health centres. It will pro-vide means to power critical lighting, mobile communication devicesand certain medical equipment for delivering timely and critical med-ical care for the rural dwellers. Hence, the role of energy supply inhealthcare services delivery in the rural areas where there is no gridextension or reliable power supply cannot be over emphasized.
Renewable energy sources have proven their ability to contributesubstantially to global climate protection efforts by reducing thegreenhouse gas emission while meeting rapid energy growth demand[13–19]. However, in technical terms, a system that wholly depends onsingle-source renewable energy alone is not necessarily considered re-liable, especially for isolated loads in remote areas [4]. This is becauseelectricity supply through a renewable energy source that has a variableor intermittent characteristic, may not guarantee energy production beavailable at all times. This is why a hybrid power system that combinesmore than one source, e.g. conventional and renewable energy systemsor two/more renewable energies, are proposed. A properly selectedrenewable power system is expected to considerably reduce the needfor fossil fuel system use by ensuring a relatively higher renewableenergy penetration. Such a system is also expected to achieve a reliablepower supply, as the conventional power sources will assist the
renewable sources during varying environmental conditions, by bal-ancing the electrical power. Therefore, a hybrid system consisting ofsolar PV, wind, battery and diesel generator systems can be considereda better option for isolated loads. Such an option, where the wind andsolar PV systems are used as main sources of energy, while the dieselgenerator serves as a backup source, and battery bank as a storagesystem is expected to; (i) satisfy the energy demands, (ii) minimize thecosts, (iii) maximize the utilization of renewable sources, (iv) optimizethe operation of battery bank, (v) ensure efficient operation of thediesel generator, and (vi) reduce environment pollution emissions.
Several research studies on off-grid energy systems analysis exist inthe literature for both single-source and hybrid configurations. Thispaper provides a brief survey on them. The techno-economic design ofhybrid systems has been discussed [5]. The techno-economic sizing ofoff-grid hybrid renewable energy system for rural electrification in SriLanka has been presented [20]. The design and economics analysis ofan off-grid energy system has been published with a focus on thehousehold electrification [21]. A paper has been published on techno-economic feasibility of photovoltaic, wind, diesel and hybrid elec-trification systems for Colombia [22]. Furthermore, the techno-eco-nomic analysis of stand-alone hybrid photovoltaic-diesel-battery sys-tems for rural electrification in eastern part of Iran has been presented[23]. A study has been discussing which focuses on the integrated op-timal design and sensitivity analysis of a standalone wind turbinesystem with storage for rural energy supply [24]. The techno-economicfeasibility analysis of a solar-biomass off-grid system has been dis-cussed, with focus on the electrification of remote rural areas in Paki-stan using HOMER software [25]. A study has been published on theoptimal design configuration using HOMER [14,26].
In addition, a review of sustainable energy access and technologieshas been discussed on healthcare facilities focusing on the global south[27]. A study has been published on off-grid systems for rural elec-trification in developing countries with emphasis on definitions, clas-sification and a comprehensive review [28]. A review on planning,configurations, modelling and optimization techniques has been dis-cussed focusing on renewable energy systems for offgrid applications[29].
These existing studies provide relevant simulation, analysis andbackground for this current paper, especially on the technical andeconomic evaluation of the proposed electricity systems. The academiccontributions of these studies are useful for understanding and
Inadequate access to modern energy at rural healthcare facilities
Health worker not attracted to
rural location
Inadequate cold-chain
for essential vaccines, blood and
drugs
Poor equipment sterilization and medical waste dis-infection capacity
Poor lighting for surgery
and difficulty in providing
medical service after
sunset
Lacks communication equipment for referrals, monitoring
and supervision
Unable to power medical
equipment (ultrasound, autoclave,
centrifuge, x-ray)
Poor health status of
rural populace
Poor maternal and
child healthcare
Higher injury risks due to
unmechanize activity or
poor energy solution
Higher incidence of
HIV/AIDS, malarial, and other major
disease
High mortality
rate
Impl
icati
onpr
oble
ms
odical nt nd,e,, x-
Fig. 1. Impact of energy access on rural healthcare services.
L. Olatomiwa et al. Sustainable Energy Technologies and Assessments 30 (2018) 121–138
122
progressing research in the area of review and the techno-economicanalysis of off-grid electricity systems. However, the studies in Refs.[5,14,20–23,25,26] do not consider battery analysis, while the CO2
emissions analysis is not considered in the papers in Refs.[20,21,24–26]. It is of interest in this paper to cover the gaps identifiedin the mentioned studies by presenting a detailed simulation and ana-lysis that includes the battery state-of-charge evaluation in the technicaldesign, coupled with the economic and the CO2 emissions analyses. It isexpected that the research results will form a useful basis for addressingthe problem of a lack of energy supply for healthcare services by localcommunities and policy-makers in different Nigeria, and also for fur-ther research in the area of off-grid systems design and development.
Therefore, this research study discusses the simulation and analysisof stand-alone hybrid renewable energy systems for basic healthcareservices in areas, where there is no grid energy supply or the supplyfrom the existing grid is unreliable. It examines the energy configura-tions that are fueled by the available solar, wind and diesel energyresources of six different locations in Nigeria under different environ-mental conditions such as the solar irradiation, wind and ambienttemperature. The locations used as test cases are North-east(Maiduguri), North-west (Sokoto), North-central (Jos), South-east(Enugu), South-west (Iseyin) and South-south (Port-Harcourt).
The paper uses standard off-grid energy systems methodologiessupported by the Hybrid Optimisation Model for Electric Renewables(HOMER) tool, International Electrotechnical Commission (IEC) stan-dards and some relevant studies in the literature for the simulation andanalysis of the proposed hybrid electricity systems for the intendedhealthcare centres across the country [30–36]. In addition, a real-worldenergy demand profile of a standard rural healthcare center in thecountry has been used as the basis for analysing the energy system.Such an approach provides a practical insight into understanding andascertaining the users’ energy requirements, rather than relying on as-sumptions. A total demand of∼24 kWh/d is used in this research paperand has been estimated by considering all the different appliances inthe health centre and their daily hours of operation. The technicalanalysis involves determining the appropriate sizes of different com-ponents of the hybrid systems, their annual energy generation and thebattery state-of-charge. These will be achieved by using the HOMERsimulation tool to optimise the different energy models or configura-tions that can meet the daily energy demand of the intended healthcarecentres. However, the economic analysis examines the initial capitalcost, net present cost and the cost of energy, while the environmentalanalysis will be considered in terms of the quantity of carbon emissionsthat may be avoided supposing the proposed hybrid electricity systemsare implemented in the specified locations. It is expected that the re-sults of the analysis of the technical, economic and environmental as-pects of the design may be useful for planning stand-alone energygeneration systems for remote healthcare centres in Nigeria, and anyother location around the world.
The remaining part of the paper is arranged as follows: Section 2presents the methods; Section 3 is on results and discussion, whileSection 4 concludes the paper.
Methods
Renewable energy resources assessment
Renewable energy resources can provide electricity for various usesin different off-grid rural areas around the world [37,38]. Among theseveral renewable energy sources, wind and solar can be abundant andeconomically viable in these regions. Hence, they are commonly ex-plored. However, a detailed study and analysis of the available long-term solar radiation and wind data of the specified location is vital fordesign and prediction of the energy output. Such a consideration will behelpful for determining the suitability of renewable energy resourcesfor any specific applications.
Several investigations had been made in Nigeria on solar and windenergy assessment for power generation, but with no particular con-siderations for rural healthcare application. In Ref. [39], solar appli-cations and developments in Nigeria were comprehensively discussed;various irradiation levels as distributed within the six climatic regionacross the country were categorized into zones. Zone I comprised theentire states in the North-Eastern part of the country. This zone has highsolar radiation incident on the horizontal surface and it has great po-tential for large-scale solar power, mostly in the semi-arid region. InZone II, which is made up of the North-West and North-Central parts ofthe country, there is viable solar radiation, which is suitable for mostsolar projects. Zone III, which comprises of all locations in the southernpart of the country, including the coastal region exhibits low potentialof annual global solar radiation, and is only appropriate for stand-alonePV systems. Nevertheless, certain states/locations in the South-Westernand South-Eastern regions are viable for decentralized energy projects.Furthermore, since there are limited meteorological sites in the country,several empirical models were developed for some locations around thecountry, to predict global and diffuse radiation data, needed for diversesolar applications [40–45].
Based on the existing findings, Nigeria has a low to moderate windregime, with the wind speeds ranging from 2.12 to 4.13m/s in thesouth, excluding the coastal regions; while in the northern region, thewind speeds is considered reasonable, ranging from 4.0 to 8.60m/s[46,47]. The sites considered in this study are selected from each of thesix geo-political zones of the country with a site representing each ofthe zones. The locations are characterized by different climatic condi-tions and include: Iseyin (Tropical wet), Sokoto (Tropical dry), Mai-duguri (Hot semi-arid), Jos (Tropical), Enugu (Humid) and Port-Har-court (Equatorial).
In this study, various analyses have been conducted to ascertain thepotential of the two proposed energy sources; wind and solar in theselected sites. The potentials of solar energy resources at the selectedsites were assessment analyzed based on certain key solar resource’sparameters, including monthly and annual global solar radiation (GSR).On the other hand, wind energy potentials were examined based onmonthly mean daily wind speed data.
The meteorological data (wind speed and solar radiation) used inthe analysis were obtained from the Nigerian Metrological Agency(NIMET), located in Oshodi, Lagos [48]. Archived daily wind speeddata spanning over a period between 28 and 39 years were captured at10m height by a cup-generator anemometer at all the locations, while
Table 1Geographic information of the selected locations.
Location Zone Latitude (°N) Longitude (°E) Altitude (meters) Climate type
L. Olatomiwa et al. Sustainable Energy Technologies and Assessments 30 (2018) 121–138
123
the daily global solar radiation on horizontal plane were measuredusing Gunn-Bellani radiometer, with readings ranging between 18 and31 years. These data were computed as average of the data for eachmonth. The geographical information of the selected locations is pre-sented in Table 1.
The methodology and the mathematical models for the energysystems analysis are presented in the following sub-section.
Energy demand assessment of a rural health clinic
The energy demand assessment is a vital step in the energy inter-vention planning and design process, as it provides information con-cerning the various types of electrical appliances, their power ratingand the time of operation within the day. Therefore, a thorough as-sessment of energy demands of a healthcare facility is critical to theselection of the most suitable energy resources. For example, a healthpost that is the most basic health facility within the remote villages, isusually associated with medical services such as: (i) treatment of minorillnesses or injuries, (ii) child deliveries and provision of basic im-munization services.
The energy need of such facilities is considered relatively low, dueto limited availability of medical equipment [49]. On the other hand, ahealth clinic that offers a wider range of medical services than a healthpost, and possesses equipment that allows more medical diagnoses canbe considered high in energy demands. According to United StatesAgency for International Development [50], healthcare facilities cangenerally be categorized into three.
The first category, i.e. Category I, is applicable to the rural localitiesand characterized with limited medical services and staff. In this cate-gory, electricity is often required for lighting during evening hour’soperations and to support limited surgical procedures such as suturing,refrigeration for maintenance of cold-chain vaccines and other medicalsupplies. Basic equipment in such a facility includes the following; acentrifuge, hematology mixer, microscope, incubator and hand-heldpower aspirator. The estimated load demand for this category rangebetween 5 and 10 kWh/day. The second category (Category II), con-tains medical equipment that is similar to the first category, but can aswell accommodate sophisticated medical diagnostic equipment withfrequent usage when compared to facility in the first category. Theother energy-consuming appliance that can be obtained in this categoryincludes: refrigerators often used for food/blood bank storage, com-munications equipment to communicate with medical expert in referralcenters. The estimated energy demand in this category is in the range of10–25 kWh/day. The third category, i.e. Category III usually serves as aprimary referral centre, because it can coordinate the communicationbetween several smaller facilities and major hospital in large towns.This could also contain sophisticated diagnostic equipment such as; x-ray machine and CD4 counters, demanding additional power. Dailytypical energy demand of this facility is in the range of 25–30 kWh.
The listing of various devices’ inventories commonly found in majorhealth facilities is provided in Table 2. The range of energy require-ments signifies the peak power demand expected in a facility whenmost of the devices are operating simultaneously. However, some of thedevices that required high-energy demand could be used intermittentlywhile others are on stand-by power mode. All this needs to be con-sidered while estimating average daily energy demand of any facility,most especially if the facility is equipped with battery-powered storage,for storing excess energy from the generator or RE sources to be usedlater.
A standard rural healthcare facility located in Iseyin district area ofOyo state, Nigeria has been used to create the load profile for five otherhypothetical rural health clinics distributed across different climaticzones of Nigeria as earlier mentioned. This healthcare facility is madeup of an emergency room, a doctor’s consulting room, nurse/injectionroom, one male ward, one female ward, an operating room, a deliveryroom, and a laboratory. The total number of bed spaces in the clinic is
10. In this facility, electricity is required for: (1) Lighting for nighthour’s operations to support limited surgical procedures (such as; su-turing and cesarean section) and to provide illumination in the sur-roundings at night. (2) Refrigerators, to keep cold chain vaccines, bloodbank and other perishable medical supplies at desire temperature. (3)Basic laboratory equipment, including centrifuge, microscope, in-cubator, hematology mixer and hand-held power aspirator. Other ap-pliances that require electrical power include; ceiling/wall fans, TV set,VCR, desktop computer and VHF radio communication equipment toaid communication with nearby referral centres. This rural clinic can beclassified as category II rural health facility. The load descriptions andestimated demand of each facility are presented in Table 2.
Hybrid system component modeling
PV module output powerThe system efficiency and output of a PV system vary for different
day and different seasons of the year due to the changing local me-teorological conditions. Therefore, adequate information on the dailyand seasonal pattern of these meteorological data will enable energyplanners to have a better understanding of the performance of a PVsystem. The PV system power output can be estimated as follows withrespect to the effect of solar radiation and temperature [51,52];
= × + −− −P P G G K T T( / )[1 ( )]PV gen mp STC STC T cell STC (1)
where GSTC is the solar radiation at standard test conditions obtainedfrom manufacturer’s datasheet and G is the solar radiation on inclinedsurface (W/m2); −Pmp STC, and TSTC are respectively the module ratedpower and temperature at standard test conditions obtained frommanufacturer’s datasheet. While KT is the module power temperaturecoefficient. Tcell represents the PV module cell temperature given as[51,52];
= + ⎡⎣
− ⎤⎦
×T T NOCT G( 20800cell amb
(2)
whereTamb is the ambient temperature (°C) and NOCT is the normal celltemperature (°C) usually specified in manufacturer datasheet. Theoverall generated power output of PV panels is obtained by multiplyingpanel output power −P( )pv gen by the numbers of panel N( )pv considered.
= ×−P P Npv t pv gen pv( ) (3)
Wind turbine modelThe principle of electricity generation from the wind is through
conversion of kinetic energy of the wind into electrical energy. Thewind turbine transforms the wind’s kinetic energy in a rotor consistingof two or more blades mechanically coupled to an electric generator.The amount of energy received is enhanced by mounting the turbine ona tall tower. The wind to electrical power may be estimated by thefollowing [14,52–55];
=P ρAV C12m e
3(4)
where p, A, V and Ce represent air density (kg/m3), turbine’s swept area(m2), wind speed (m/s), and the maximum power extraction efficiencyof the wind generator, usually referred to as Bertz limit with peak valueof about 0.59 respectively. This research study focuses on the use of theavailable renewable energy resources (i.e. wind and solar) at the se-lected locations with back-up storage system and diesel generator sys-tems. Therefore, 5 different small commercial wind turbine systemswith rated power ranging from 1 to 5 kW have been considered in thisstudy. The selected wind turbines and their specifications are presentedin Table 3.
Diesel generator modelRenewable energy systems are characterized by an intermittent
L. Olatomiwa et al. Sustainable Energy Technologies and Assessments 30 (2018) 121–138
124
output and are, therefore, integrated with a conventional power sourceto ensure reliable electricity supply to the health centre. The com-plementary characteristic of the hybrid of renewable energy and non-renewable energy sources usually provides a better energy optioncompared to the single source systems. The fuel consumption of thediesel generator (DG), FG (l/h) is modeled in HOMER as follows[52,57]:
= × + ×− −F B P A PG G G rated G G out (5)
where −PG rated is the nominal power of the diesel generator, −PG out is theoutput power, while AG and BG represents the coefficients of fuelconsumption curve as defined by the user (l/kWh). For efficient op-eration of the DG, it is recommended that partial loading, insufficientrun-time to attain operating temperature and the excessive operationshould be avoided. The optimum diesel generator operating rangeshould be 70–89% [58,59].
Renewable fraction (RF) is the total amount of power generated bythe renewable energy sources compared to total power generation fromthe hybrid system. This can be express as [60];
⎜ ⎟= ⎛⎝
−∑∑
⎞⎠
×RFPP
1 100%diesel
RE (6)
where Pdiesel is the power output of the diesel generator and PRE is thepower output of the connected renewable energy sources, solar PV andwind in this case.
Battery energy storageBattery capacity changes constantly in hybrid system due to the
random behaviors of renewable energy resources (varying weathercondition). At any time t, the battery capacity dependent on its previousstate of charge (SOC), available energy from the RE sources in the HRESand the system load demand. The charging process of the battery oc-curs, whenever the energy output of PV modules and wind turbines isgreater than the load demand. The battery charge capacity at thisperiod can be described as [52,61];
= − − + ⎡⎣⎢
− ⎤⎦⎥
×C t C t σ P t P tη
η( ) ( 1). (1 ) ( ) ( )B B T
L
invBatt
(7)
where P t( )L is the load demand, σ is the battery self –discharging rate,ηinv and ηBatt are the inverter and battery efficiency respectively. While,P t( )T is the total power generated by the RE sources in the hybridsystem at time t, given as:
= +P t N P N N( )T pv pv wt wt (8)
where Ppv is the power output of PV panel, Pwt is output power of thewind turbine, Npv and Nwt are number of PV module and wind turbinerespectively.
On a general note, whenever the total power generated by the REsources is insufficient to meet the load demand, the battery bank is indischarge mode. Therefore, the nominal capacity of battery and thecharge quantity of the battery bank at this period can be respectivelymodel as [52,62]:
= ×× ×
C Wh P t ADη η DoD
( ) ( )Batt
L
Batt inv (9)
= − − + ⎡⎣⎢
− ⎤⎦⎥
C t C t σ P tη
P t η( ) ( 1). (1 ) ( ) ( ) /B BL
invT Batt
(10)
where DoD is battery depth of discharge while, AD is the chosen numberof days of autonomy. During this process, the battery discharge effi-ciency (ηbatt disch_ ) is equal to 1, while it varies between (0.65–0.85)during charging period depending on the charging current. At any timet, the battery charge capacity is subject to the following constraints[52,63]:
≤ ≤SOC C t SOC( )min B max (11)
Table 2The load description and estimated demand of the rural health clinic.
Load Description Quantity Rated Power (W) Total Power (W) Daytime hour (h/d) Night hours (h/d) Total on-time (h/d) Total Energy (kWh/d)
L. Olatomiwa et al. Sustainable Energy Technologies and Assessments 30 (2018) 121–138
125
where SOCmax and SOCmin are the maximum and minimum allow bat-tery state of charge respectively. At this point, the maximum chargequantity of battery bank (SOCmax) takes the value of nominal capacityof battery bank (CBatt) and the minimum charge quantity of batterybank (SOCmin) is determined by the maximum depth of discharge.
= −SOC DOD C(1 )min Batt (12)
The operational lifetime of battery can be prolonged if DOD is setwithin the range (30–50)% depending on the manufacturer’s specifi-cations [51].
Hybrid system optimal sizing
In this study, hybrid optimization for multiple electric renewable(HOMER) software has been employed in the simulation, optimalsizing, sensitivity analysis as well as techno-economic evaluation of theproposed hybrid renewable energy system in the selected sites [60]. Acomprehensive framework of optimal sizing and selection of differentconfigurations of energy resources in each of the selected locations isshown in Fig. 2.
HOMER input dataSix types of data are required by HOMER for simulation and opti-
mization. These include meteorological data, load profile, equipmentcharacteristics, search space, economic and technical data [60]. Thefollowing subsections described them in details.
Meteorological data. Hourly values of global solar radiation, wind speedand temperature data are not available at the selected sites, howeverthe available monthly averages were synthesized to hourly data basedon the algorithm provided for its conversion in HOMER [60]. Thesedata serve as energy resources inputs to the software. HOMER utilized
these data to compute power output of solar PV array and windturbines.
Clinics load profile. The load profile of the respective rural health clinicin the considered sites is an essential input parameter to the HOMERmodel, since optimal sizing of different energy sources and the batterystorage device depends on the load profile. As earlier mentioned, eachof the rural healthcare facilities considered for this study is classified asa category II rural health clinic according to United States Agency forInternational Development [50], hence assumed to have identical loadprofile. Therefore, the computation of the energy demand of eachequipment presented in Table 2 with their expected operating hoursknown as watt-hour demand is shown in Fig. 3 for the rural healthfacilities in the selected sites. Based on this profile, average daily energydemand and the peak load are found to be approximately 23.9 kWh and
Sensitivity variables
Simulation and Optimization
Input Data
Siite ’s Meteorological data
Load profile
System economics
Components data and characteristic
Search space (N)
Project constraint data
Start
i = 1
End
Minimize Obj. function subject to constraints
Objectives functions: NPCConstraint: Power balance and
technical constraint
Sort the feasible configurations according to least NPC
Display Optimization results (syst. conf., NPC,
energy production, emission etc)
i = i + 1
i > N
Is configuration i feasible?
Sensitivity analysis
Solar rad. Diesel priceWind speed
no
yes
yes
no
Fig. 2. Comprehensive framework of HOMER optimal sizing procedure.
Fig. 3. Daily load profile of the selected healthcare facilities.
L. Olatomiwa et al. Sustainable Energy Technologies and Assessments 30 (2018) 121–138
126
3.75 kW respectively.It should be noted that, not all the equipment presented in Table 2
are expected to operate simultaneously, because each has specific dailyhours of operation. Major load occurs during the daytime (9am–1pm)and nighttime (7–10pm). This is due to the nature of the rural settingswhere the dwellers visit the clinic in the morning or late evening afterthe day work. Based on this variation, a day-to-day random noise of10% and hour-to-hour random variability of 15% is specified inHOMER. This is done to check the effect of the daily and hourly loadvariation on the hybrid system configuration to avoid underestimatingthe peak load demand of the proposed system.
Hybrid system components data. Assumptions regarding componentspricing and sizing as adopted in the proposed hybrid system, areexpressed below:
a) A 36-cell mono-crystalline PV module with rated capacity 250Wp,manufactured by Canadian Solar Company was selected for simu-lation. The current PV module price in Nigeria’s market is $3160/kW, while the installation cost is $40/kW [64]. Therefore, the ca-pital cost and replacement cost of 1 kWp PV array were taken as$3200 and $3000 respectively. The lifetime of PV arrays was takenas 25 years. The de-rating factor that accounts for losses due totemperature effects, dirt from the PV module’s surface and wiringlosses was considered as 80%, and the ground reflection of themodules were taken as 20% [51]. Different sizes of PV arrays wereconsidered to obtain the optimal size for each site.
b) Three different wind turbine models (1 kW, 3 kW and 5 kW) withtechnical specifications given in Table 3 is considered for the hybridsystem configurations in each site. The initial cost, replacement costand cost of maintenance for each type are specified. In order to findan optimal size, different sizes of each model were analyzed. Theoperational lifetime of the turbines varies between 15 and 20 years.
c) The initial cost of a 1 kW AC diesel generator is $200, with a re-placement cost of $200 and maintenance cost of $0.05/h [64]. Twodifferent sizes (5 kW and 7.5 kW) of diesel generator was con-sidered. The operating lifetime of a diesel generator was taken as15,000 h with a minimum load ratio of 25%.
d) A bi-directional converter is added to maintain the flow of energybetween the alternating current (AC) and direct current (DC) com-ponents. It functions as a rectifier when it converts AC to DC, and asan inverter on the other way around. The initial capital and re-placement cost of the converter used for this study were taken as$245/kW and $245/kW respectively [64]. The operational andmaintenance cost is taken as $10/year [51]. The efficiency of theconverter is 90% and 85% for the rectifier, while the lifetime wastaken as 10 years [65]. Different sizes of converters were consideredduring the analysis.
e) Trojan L16P type battery with rated 6 V nominal voltage, 2kWhnominal capacity, 1075 throughput, 85% round trip efficiency and30% minimum state of charge is considered for this study. The in-itial cost of one unit is $330 [64]. Replacement and operationalmaintenance costs were assumed as $300 and $10/year respectively[62]. In order to find an optimal configuration, the battery bank wasassumed to contain a different number of batteries. Each batterystring contains 10 batteries, and the lifetime energy of each batteryis 1075 kWh throughput [64].
System economic parameters. In HOMER, the system life-cycle cost isrepresented by total net present cost (NPC). The NPC is a composite ofsystem component’s initial capital cost, replacement cost, annualoperating and maintenance cost as well as fuel costs [60].
=NPCC
CRFTotann Tot,
(13)
where CRF is capital recovery factor, and can be evaluated in terms of
interest rate (i) and project lifetime (n) as [60];
= ++ −
CFR i ii
(1 )(1 ) 1
n
n (14)
However, in a PV/wind/diesel/battery hybrid system, total an-nualized cost of the entire hybrid system can be represented as;
∑ ∑ ∑ ∑
∑
= + + +
+
= = = =
=
C C C C C
C
ann TotN
N
ann pvN
N
ann wtN
N
ann DGN
N
ann bat
N
N
ann conv
,1
,1
,1
,1
,
1,
pv wt batt batt
conv
(15)
where Npv, Nwt , NDG, Nbat , and Nconv are numbers of PV modules, windturbine, diesel generator, battery and converter respectively.WhileCann pv, , Cann wt, , C ,ann DG, Cann bat, and Cann conv, are total annualizedcost for each components (PV modules, wind turbine, diesel generatorbattery and converter) as computed from:
= + +C C C Cann ann cap ann rep ann O M, . , . , & (16)
In this study, the project lifetime is considered 25 years and thecurrent annual interest rate in the country is 11%, while the inflationrate stands at 15.1% [66]. These economic parameters are needed tocompute the CRF. Thereafter, HOMER uses the CRF to compute the NPCfor various system configurations. HOMER aims to minimize the totalnet present cost (NPC) and cost of electricity (COE) by finding the op-timal system configuration that matches the load demand and satisfiesthese constraints. It should be noted that all economic factors con-sidered in HOMER are calculated in constant dollar (US$) terms. As atthe time of this research work, USD1 is equivalent to N362.25 Nigeria’snaira.
System technical constraints. Constraints are pre-determined conditionsthe systems must fulfil in HOMER to ensure realistic optimal solution;otherwise, HOMER neglects those systems that do not content thedefined constraints. In this study, the maximum renewable fraction(RF) ranges from 0 to 100% are considered, while maximum unservedenergy is assumed to be 0%. In addition, 0% maximum annual capacityshortage was considered in the simulation. The maximum allowablecapacity shortage factor is a ratio of the total capacity shortage and thetotal annual electric load, which represent the amount of time to whichthe system could not meet the load demand and its reserves. However,this is not the case in this system due to the nature of the load and theintended application which requires 100% reliability. Hourly loadvariation of 10% is considered in the simulation with operatingreserve accounting for sudden spikes in the system. In the case of PVpanel’s output, 25% reserve is considered this is due to its inherentdependence on solar irradiance leading to unpredictable output.
System control/energy managementSystem control parameter defines how the system models the op-
eration of battery and generators in the hybrid system. A dispatchstrategy is a set of rules that controls the operations of the diesel gen-erator and the battery bank. Two types of dispatch strategies areavailable in HOMER, namely; load following and cycle charging [52].In the load-following strategy, a generator produces power that is suf-ficient only to serve the load and does not charge the battery bank.Conversely, in the cycle-charging strategy, the generator operates at itsmaximum rated capacity to serve the load and charges the battery bankwith the excess power. In the proposed system, cycle-charging strategyhas been considered. This means that HOMER will simulate each systemusing this dispatch strategy and subsequently determine the optimalconfiguration.
In a multi-source hybrid energy system, an overall control/energymanagement system to manage the energy flow within the variousconnected energy source and the load is essential. To this aim, an en-ergy management/control system has been designed for the
L. Olatomiwa et al. Sustainable Energy Technologies and Assessments 30 (2018) 121–138
127
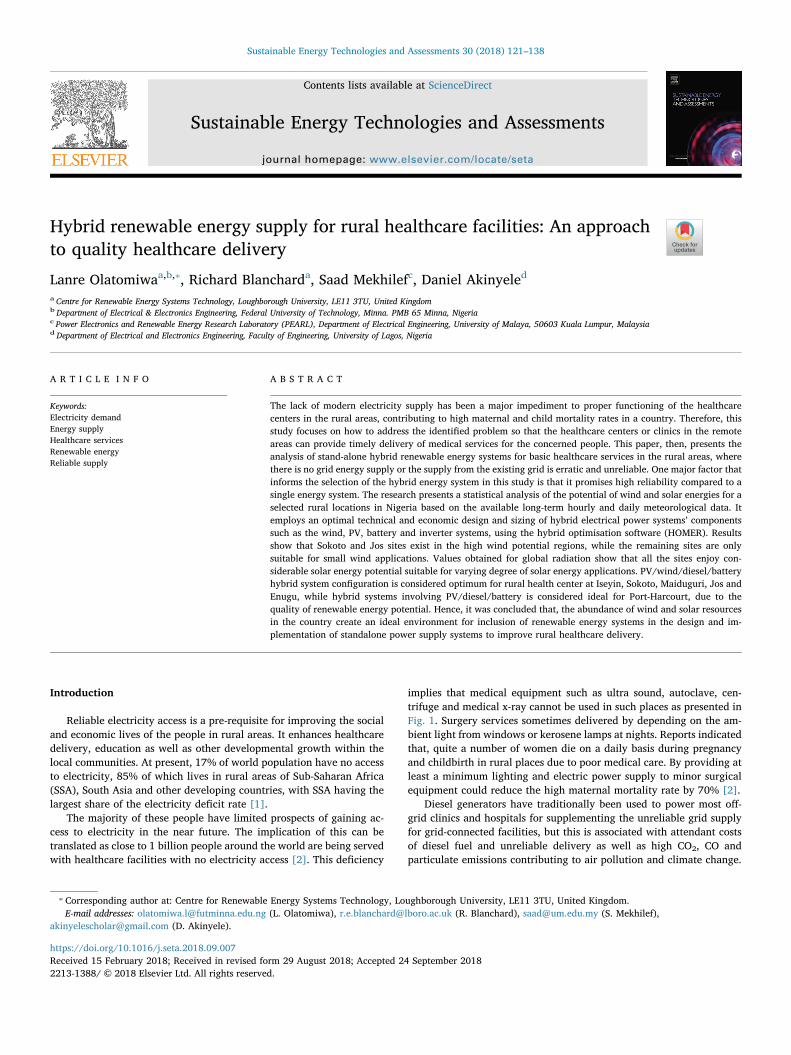
optimization of the energy flows among the various energy sources andthe load. The control strategy is designed to operate in different modesaccording to the flowchart in Fig. 4. In this control system, priority isgiven to RE sources to supply the load, that means, under normal op-erating condition the power output of solar PV (Ppv) and wind turbine(Pwt) will supply the load while excess energy will be used to charge thebattery until maximum state of charge (SOCmax) is reached. Any furtherexcess energy can be used by dump load. In the case of insufficientenergy from either the RE sources or the battery to supply the load, aconventional diesel generator will be operated automatically to supplythe load and charge the battery. The supervisory control is responsiblefor switching from one operating mode to another depending on theatmospheric conditions, the load demand, and the battery SOC. Thedecision to operate any of the energy sources and to charge/dischargethe battery takes place every hour upon the energy balance computa-tion.
Hybrid system optimizationAssessment of optimal system configurations is carried out by op-
timizing the objective function of total life-cycle cost of the entire hy-brid system represented in Fig. 5.
The optimal value of decision variable is determined during theoptimization process. The decision variables considered for this studyare based on the available resources and the load demand. This in-cludes; size of PV panel, number of wind turbine, number of battery andthe size of converter. The objective function is given as:
Minimize:
∑= + +C C C C( )annj
ann cap ann rep ann O M, . , . , &(17)
where j is the number of units of the system component (solar panel,wind turbine, diesel generator, battery and converter). C C,ann cap ann rep, . , .and Cann O M, & is the annualized capital, replacement, operating andmaintenance cost of each system components. The equation can be
rewriten as:
= × + × ×
+
C j N C C K i L y CRF i n
C
( ) {[ ( , , )] ( , )
}
ann ann cap ann rep j j j
ann O M
, . , .
, & (18)
where N is the number of components/capacity, CFR is capital recoveryfactor earlier described in Eq. (14), where n is project lifetime and i isthe real interest rate, which is a function of nominal interest rate (inom)and annual inflation rate (f) defined as;
=−
+i
i fi fnom
(19)
K is single payment present worth factor given as;
∑=+=
×K i L yi
( , , ) 1( 1)j j j
x
y
x L1
j
j (20)
where L and y are respectively the useful lifetime and the number ofreplacement of component during the project lifetime (n).
For each search space in the optimization process, the objectivefunction is minimized subject to the set constraint. The constraints in-clude; energy balance constraint (loss of power supply probability),battery charging and discharging constraints and generator technicalconstraints.
Results and discussion
This section presents the results of various sections of the studyearlier highlighted. A discussion of each of these results is also included.
Renewable energy resources assessment
The potentials of major renewable energy sources (wind and solar)in selected locations across the six geo-political regions of the country,based on long-term daily meteorological data spanning between 18 and
Compute power output of each RE sources on hourly basis over a year (Ppv, Pwt
Hour = i
i =1
i =i+1 Ppv ≥ PL
Ppv +P wt ≥ PL
SOC > SOC min
Mode 1Ppv =P L + P batt
Mode 2Ppv +P wt =P L + P batt
SOC <SOC maxDump excess
Pbch < P bch_max
Charge the batteries with
excess
Charge the batteries with
Pbch_max and dump the excess
Mode 3Ppv +P wt + P bat = P L
Pbdch < P bdch_max
Power the load
Mode 4Run the DG to
power the load and
charge the batteries
SOC ≥ SOC min
Stop the DG
no
no
no
no
yes
yes
yes
no
yes
yes
yes
no
no
yes
Fig. 4. Flowchart of the energy management system adopted in HOMER.
L. Olatomiwa et al. Sustainable Energy Technologies and Assessments 30 (2018) 121–138
128
39 years have been assessed, and the result obtained is discussed in thefollowing section;
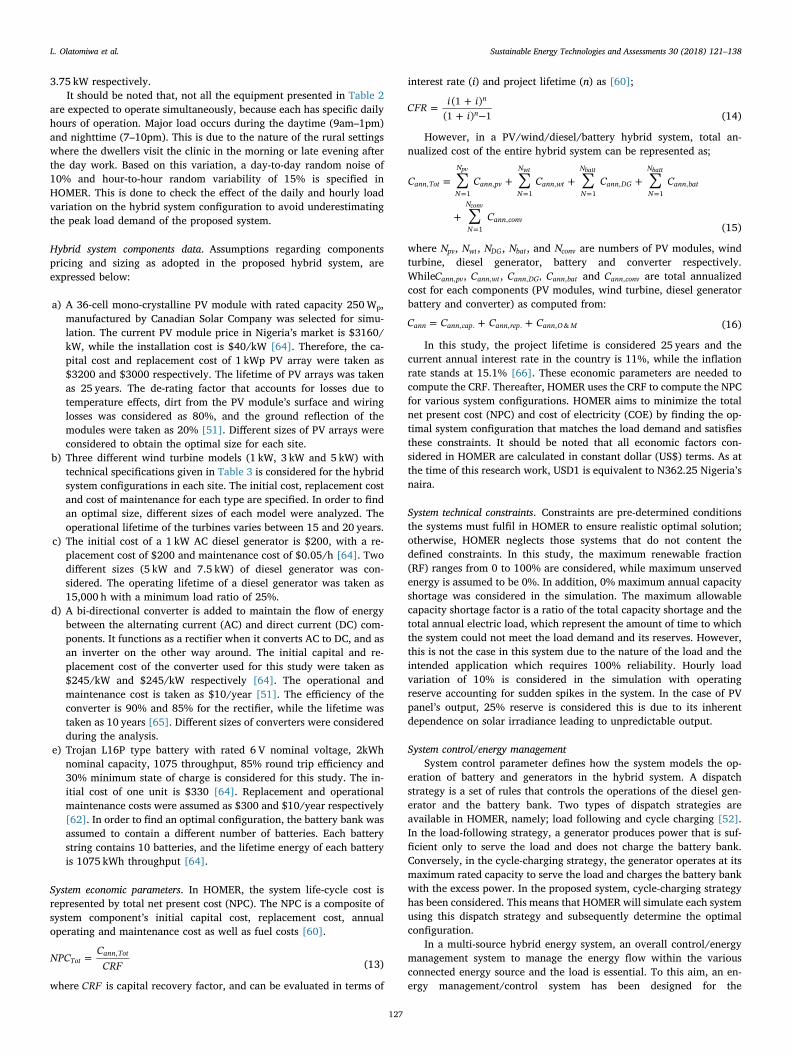
Solar radiation on horizontal surfacesFig. 6 shows the mean monthly radiation for each site.Maiduguri is observed to have the highest global solar radiation
among the selected sites, while the least occurred at Port Harcourt. Themaximum and minimum values for Maiduguri were obtained in Apriland August respectively, while the maximum and minimum value wasobtained in December and July respectively in Port Harcourt. Valuesobtained for the remaining sites can be seen on the figure. It can furtherbe observed from obtained results, that all locations have higher levelsof horizontal global solar radiations during the dry season months(October–April). This shows that the dry season is the best season forsolar energy harvesting as earlier reported in Ref. [49]. During the rainyseason (April–September), the amount of total radiation reduce notablycompare with others.
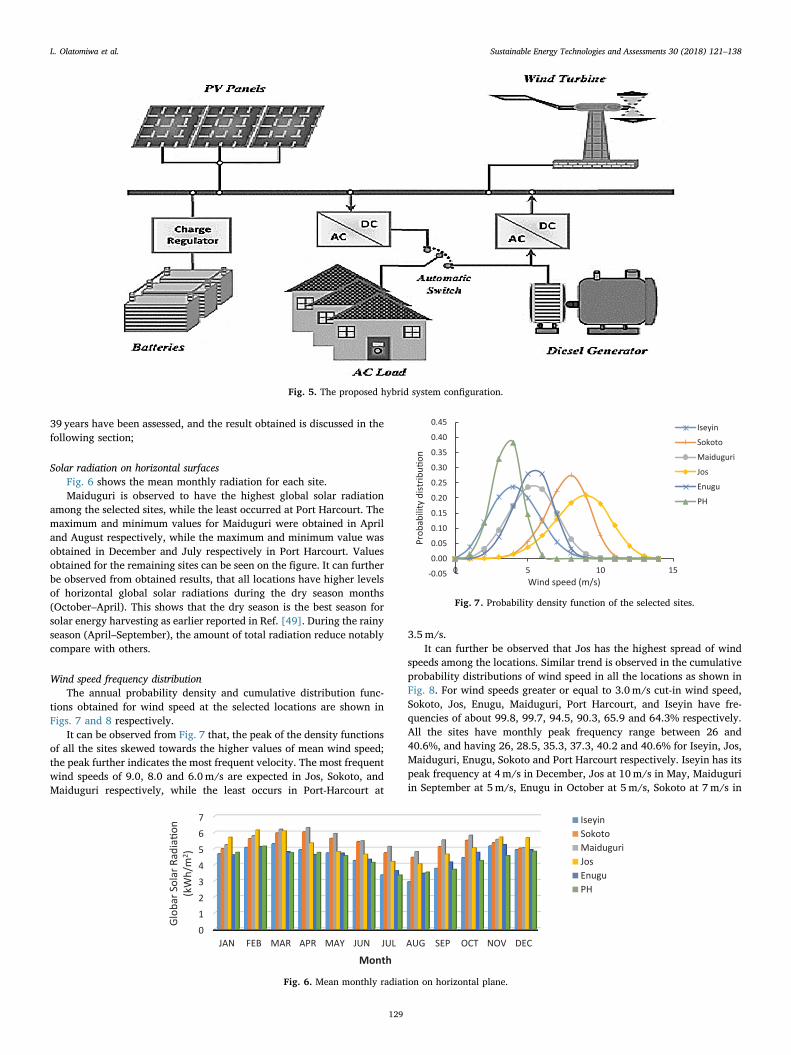
Wind speed frequency distributionThe annual probability density and cumulative distribution func-
tions obtained for wind speed at the selected locations are shown inFigs. 7 and 8 respectively.
It can be observed from Fig. 7 that, the peak of the density functionsof all the sites skewed towards the higher values of mean wind speed;the peak further indicates the most frequent velocity. The most frequentwind speeds of 9.0, 8.0 and 6.0m/s are expected in Jos, Sokoto, andMaiduguri respectively, while the least occurs in Port-Harcourt at
3.5 m/s.It can further be observed that Jos has the highest spread of wind
speeds among the locations. Similar trend is observed in the cumulativeprobability distributions of wind speed in all the locations as shown inFig. 8. For wind speeds greater or equal to 3.0m/s cut-in wind speed,Sokoto, Jos, Enugu, Maiduguri, Port Harcourt, and Iseyin have fre-quencies of about 99.8, 99.7, 94.5, 90.3, 65.9 and 64.3% respectively.All the sites have monthly peak frequency range between 26 and40.6%, and having 26, 28.5, 35.3, 37.3, 40.2 and 40.6% for Iseyin, Jos,Maiduguri, Enugu, Sokoto and Port Harcourt respectively. Iseyin has itspeak frequency at 4m/s in December, Jos at 10m/s in May, Maiduguriin September at 5m/s, Enugu in October at 5m/s, Sokoto at 7m/s in
Fig. 5. The proposed hybrid system configuration.
0
1
2
3
4
5
6
7
JAN FEB MAR APR MAY JUN JUL AUG SEP OCT NOV DEC
Glo
bar
Sola
r Ra
diati
on
(kW
h/m
2 )
Month
IseyinSokotoMaiduguriJosEnuguPH
Fig. 6. Mean monthly radiation on horizontal plane.
-0.05
0.00
0.05
0.10
0.15
0.20
0.25
0.30
0.35
0.40
0.45
0 5 10 15
Prob
abili
ty d
istr
ibuti
on
Wind speed (m/s)
Iseyin
Sokoto
Maiduguri
Jos
Enugu
PH
Fig. 7. Probability density function of the selected sites.
L. Olatomiwa et al. Sustainable Energy Technologies and Assessments 30 (2018) 121–138
129
August and Port Harcourt in January at 4m/s. This confirmed theearlier report from Refs. [46,47] that the country has a low to moderatewind regime, with low wind speeds in the south, excluding the coastalregions; while the wind speeds is considered reasonable good in thenorthern region.
Mean wind speed and mean power densityThe monthly mean wind speeds at 10m height, wind power density
for the selected sites are presented in Table 4. The monthly mean windspeed varies between 3.48m/s in November and 4.71m/s in April forIseyin. The shape parameter k varies between 2.02 and 2.92, while thescale parameter c lies between 3.92 and 5.27m/s. Power density variesbetween 46.48W/m2 in October and 89.69W/m2 (March). The annualmean wind speed and wind power density are found to be 4.16m/s and85.64W/m2 respectively. According to the wind power classificationscheme [67] of Pacific Northwest Laboratory presented in Table 5, themonthly mean and the annual mean power density for Iseyin falls intoClass 1. This is considered poor and may only be suitable for batterycharging, water pumping and other small wind power applications.
The minimum and maximum values of the monthly mean windspeeds are found to be 5.81 and 9.03m/s respectively for Sokoto. Themonthly mean shape parameter (k) has values between 3.17 and 9.94,while the scale parameter c is between 6.30 and 9.72m/s. The monthlymean wind power density varies from 134.79W/m2 in September to494.61W/m2 in January. However, the annual mean power density forthis site stand at 515.40W/m2, which makes the site to ranked at Class7 and thus suitable for grid-connected wind power applications. In thecase of Maiduguri, the minimum and maximum values of the monthlymean wind speeds are 4.49m/s (in September) and 6.10m/s (in March)respectively.
The monthly mean power density varies from 63.90W/m2 inSeptember to 173.38W/m2 in March; with annual mean power densityfor 171.40W/m2, the site is ranked Class 3.
The minimum and maximum values of the monthly mean windspeeds varied from 7.15 (September) to 9.36m/s (December) respec-tively in Jos. The monthly mean shape parameter k ranges between3.50 and 7.55, while the scale parameter c is from 7.82 and 10.23m/s.Monthly mean wind power density varies from 260.83W/m2 inSeptember to 603.38W/m2 in January. The average annual powerdensity stands at 741.20W/m2, making the site to fall in Class 7 of thewind power classification. This classification places Jos on a high po-tential site for large-scale grid-connected wind turbine applications.The wind speed characteristics of Enugu and Port-Harcourt are alsoshown Tables 4 and 5. The minimum and maximum values of windspeed are 4.12 and 6.30m/s respectively for Enugu whereas they existas 2.86 and 3.98m/s in Port-Harcourt for the minimum and maximum.Considering the wind power density, the dry season is found to be thewindiest season for both sites. Monthly wind power ranges from53.50W/m2 in November to 169.32W/m2 in March at Enugu, while itvaries from 19.52 to 44.29W/m2 in November and August respectivelyin Port-Harcourt. With the wind power classification in Table 5, Enugufalls under Class 3, and Port-Harcourt in Class 1, thereby making theEnugu to be fairly considered for wind power applications and Port-Harcourt poor.
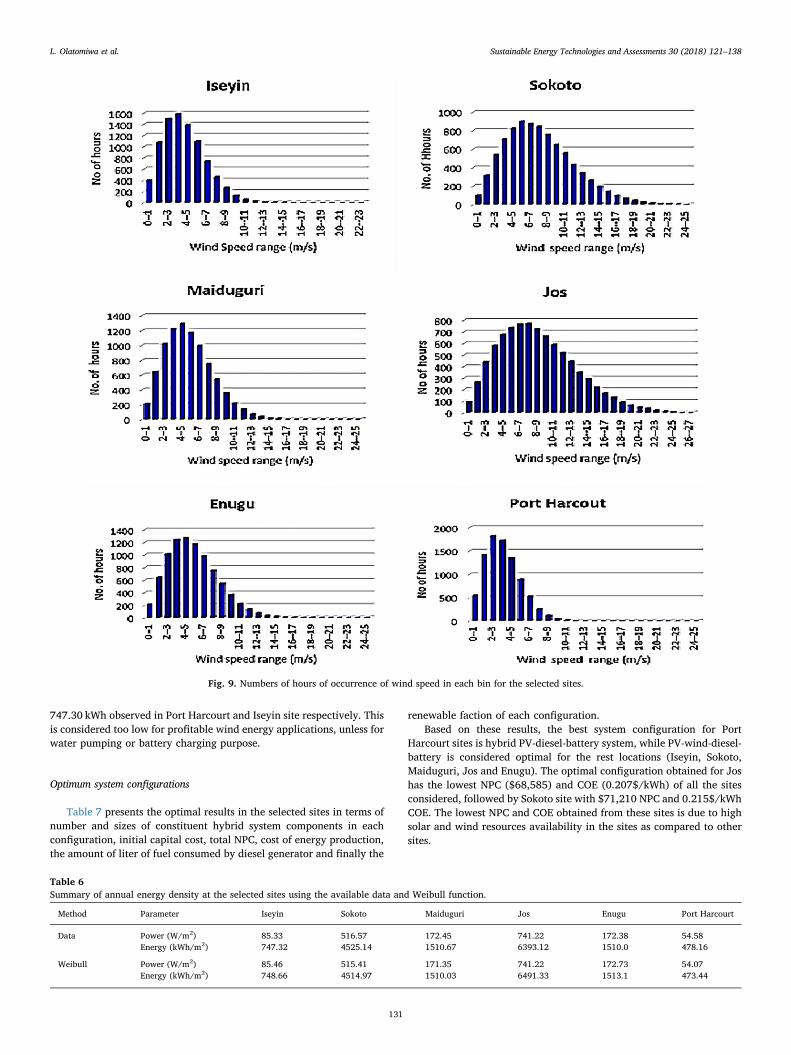
Wind energy densityHourly measured wind data obtained from the respective meteor-
ological stations in each site is divided into bins (0–1, 1–2, 2–3 and soon) and the duration of occurrence of the data at any particular bin iscalculated from the obtained wind speed data as shown in Fig. 9.Thereafter, the probability density function (PDF) for each wind speedrange, energy available in the wind at each range and the total energyexpected in each site is calculated. The summary of the annual energydensity at the selected sites is presented in Table 6 using the availabledata and the Weibull function.
It can be observed from Fig. 9 that, Jos and Sokoto had the highestspread of wind speeds among the selected, this has contributed to highenergy density the two sites. Annual energy density of 478.16 and
0.00
0.20
0.40
0.60
0.80
1.00
0 5 10 15
Cum
ulati
ve d
istr
ibuti
on
Wind speed (m/s)
Iseyin
Sokoto
Maiduguri
Jos
Enugu
PH
Fig. 8. Cumulative density function of the selected site.
Table 4Monthly and annual mean variation of wind speed and power density in the selected sites.
Site Iseyin Sokoto Maiduguri Jos Enugu Port Harcout
V (m/s) P (W/m2) V (m/s) P (W/m2) V (m/s) P (W/m2) V (m/s) P (W/m2) V (m/s) P (W/m2) V (m/s) P (W/m2)
L. Olatomiwa et al. Sustainable Energy Technologies and Assessments 30 (2018) 121–138
130
747.30 kWh observed in Port Harcourt and Iseyin site respectively. Thisis considered too low for profitable wind energy applications, unless forwater pumping or battery charging purpose.
Optimum system configurations
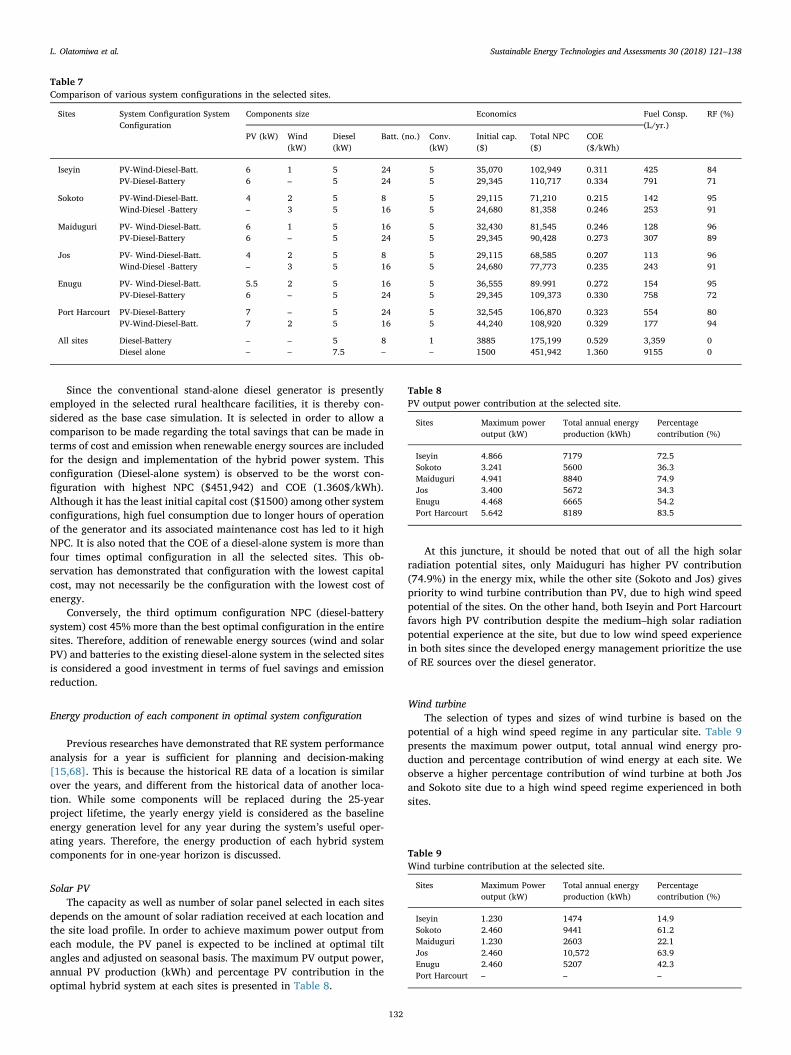
Table 7 presents the optimal results in the selected sites in terms ofnumber and sizes of constituent hybrid system components in eachconfiguration, initial capital cost, total NPC, cost of energy production,the amount of liter of fuel consumed by diesel generator and finally the
renewable faction of each configuration.Based on these results, the best system configuration for Port
Harcourt sites is hybrid PV-diesel-battery system, while PV-wind-diesel-battery is considered optimal for the rest locations (Iseyin, Sokoto,Maiduguri, Jos and Enugu). The optimal configuration obtained for Joshas the lowest NPC ($68,585) and COE (0.207$/kWh) of all the sitesconsidered, followed by Sokoto site with $71,210 NPC and 0.215$/kWhCOE. The lowest NPC and COE obtained from these sites is due to highsolar and wind resources availability in the sites as compared to othersites.
Fig. 9. Numbers of hours of occurrence of wind speed in each bin for the selected sites.
Table 6Summary of annual energy density at the selected sites using the available data and Weibull function.
Method Parameter Iseyin Sokoto Maiduguri Jos Enugu Port Harcourt
Data Power (W/m2) 85.33 516.57 172.45 741.22 172.38 54.58Energy (kWh/m2) 747.32 4525.14 1510.67 6393.12 1510.0 478.16
L. Olatomiwa et al. Sustainable Energy Technologies and Assessments 30 (2018) 121–138
131
Since the conventional stand-alone diesel generator is presentlyemployed in the selected rural healthcare facilities, it is thereby con-sidered as the base case simulation. It is selected in order to allow acomparison to be made regarding the total savings that can be made interms of cost and emission when renewable energy sources are includedfor the design and implementation of the hybrid power system. Thisconfiguration (Diesel-alone system) is observed to be the worst con-figuration with highest NPC ($451,942) and COE (1.360$/kWh).Although it has the least initial capital cost ($1500) among other systemconfigurations, high fuel consumption due to longer hours of operationof the generator and its associated maintenance cost has led to it highNPC. It is also noted that the COE of a diesel-alone system is more thanfour times optimal configuration in all the selected sites. This ob-servation has demonstrated that configuration with the lowest capitalcost, may not necessarily be the configuration with the lowest cost ofenergy.
Conversely, the third optimum configuration NPC (diesel-batterysystem) cost 45% more than the best optimal configuration in the entiresites. Therefore, addition of renewable energy sources (wind and solarPV) and batteries to the existing diesel-alone system in the selected sitesis considered a good investment in terms of fuel savings and emissionreduction.
Energy production of each component in optimal system configuration
Previous researches have demonstrated that RE system performanceanalysis for a year is sufficient for planning and decision-making[15,68]. This is because the historical RE data of a location is similarover the years, and different from the historical data of another loca-tion. While some components will be replaced during the 25-yearproject lifetime, the yearly energy yield is considered as the baselineenergy generation level for any year during the system’s useful oper-ating years. Therefore, the energy production of each hybrid systemcomponents for in one-year horizon is discussed.
Solar PVThe capacity as well as number of solar panel selected in each sites
depends on the amount of solar radiation received at each location andthe site load profile. In order to achieve maximum power output fromeach module, the PV panel is expected to be inclined at optimal tiltangles and adjusted on seasonal basis. The maximum PV output power,annual PV production (kWh) and percentage PV contribution in theoptimal hybrid system at each sites is presented in Table 8.
At this juncture, it should be noted that out of all the high solarradiation potential sites, only Maiduguri has higher PV contribution(74.9%) in the energy mix, while the other site (Sokoto and Jos) givespriority to wind turbine contribution than PV, due to high wind speedpotential of the sites. On the other hand, both Iseyin and Port Harcourtfavors high PV contribution despite the medium–high solar radiationpotential experience at the site, but due to low wind speed experiencein both sites since the developed energy management prioritize the useof RE sources over the diesel generator.
Wind turbineThe selection of types and sizes of wind turbine is based on the
potential of a high wind speed regime in any particular site. Table 9presents the maximum power output, total annual wind energy pro-duction and percentage contribution of wind energy at each site. Weobserve a higher percentage contribution of wind turbine at both Josand Sokoto site due to a high wind speed regime experienced in bothsites.
Table 7Comparison of various system configurations in the selected sites.
L. Olatomiwa et al. Sustainable Energy Technologies and Assessments 30 (2018) 121–138
132
Diesel generatorThe maximum power output, total annual energy output, hours of
operation and percentage contribution of diesel generator in the op-timal hybrid system configuration in each site is presented in Table 10.
Battery energy storage capacityThe hourly battery SOC over a period of one year in the selected
locations is presented in Fig. 10. From this figure, it is observed that thebattery SOC at both Sokoto and Jos sites is constantly at full capacityover the year except for few hours. This is due to the enormous po-tential of RE resources at both sites, resulting in the availability of REsources to meet the clinics load demand at all time. Iseyin and PortHarcourt sites, on the other hand, experienced higher battery depletioncompare to other sites especially during the Month of July, August andSeptember (rainy season). This experience is due to low potential of REsources in meeting the clinic load demand, thus resulting in depletion of
Table 10Diesel generator contribution at the selected site.
Fig. 10. Hourly battery SOC over a year at the selected sites.
L. Olatomiwa et al. Sustainable Energy Technologies and Assessments 30 (2018) 121–138
133
the battery to its minimum state of charge (SOCmin) before the gen-erator comes up to supply the load and charges the batteries. As earlierdiscussed, the number of hours of operation of a diesel generator atthese sites is more than the other sites due to the above reason.
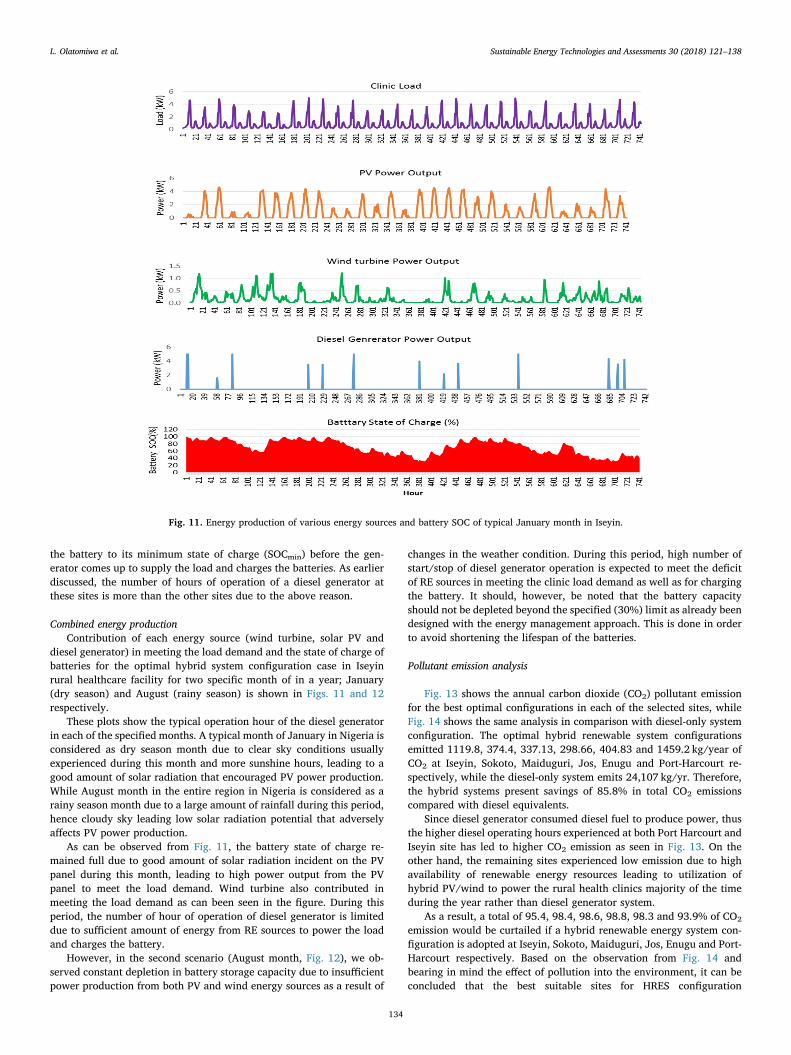
Combined energy productionContribution of each energy source (wind turbine, solar PV and
diesel generator) in meeting the load demand and the state of charge ofbatteries for the optimal hybrid system configuration case in Iseyinrural healthcare facility for two specific month of in a year; January(dry season) and August (rainy season) is shown in Figs. 11 and 12respectively.
These plots show the typical operation hour of the diesel generatorin each of the specified months. A typical month of January in Nigeria isconsidered as dry season month due to clear sky conditions usuallyexperienced during this month and more sunshine hours, leading to agood amount of solar radiation that encouraged PV power production.While August month in the entire region in Nigeria is considered as arainy season month due to a large amount of rainfall during this period,hence cloudy sky leading low solar radiation potential that adverselyaffects PV power production.
As can be observed from Fig. 11, the battery state of charge re-mained full due to good amount of solar radiation incident on the PVpanel during this month, leading to high power output from the PVpanel to meet the load demand. Wind turbine also contributed inmeeting the load demand as can been seen in the figure. During thisperiod, the number of hour of operation of diesel generator is limiteddue to sufficient amount of energy from RE sources to power the loadand charges the battery.
However, in the second scenario (August month, Fig. 12), we ob-served constant depletion in battery storage capacity due to insufficientpower production from both PV and wind energy sources as a result of
changes in the weather condition. During this period, high number ofstart/stop of diesel generator operation is expected to meet the deficitof RE sources in meeting the clinic load demand as well as for chargingthe battery. It should, however, be noted that the battery capacityshould not be depleted beyond the specified (30%) limit as already beendesigned with the energy management approach. This is done in orderto avoid shortening the lifespan of the batteries.
Pollutant emission analysis
Fig. 13 shows the annual carbon dioxide (CO2) pollutant emissionfor the best optimal configurations in each of the selected sites, whileFig. 14 shows the same analysis in comparison with diesel-only systemconfiguration. The optimal hybrid renewable system configurationsemitted 1119.8, 374.4, 337.13, 298.66, 404.83 and 1459.2 kg/year ofCO2 at Iseyin, Sokoto, Maiduguri, Jos, Enugu and Port-Harcourt re-spectively, while the diesel-only system emits 24,107 kg/yr. Therefore,the hybrid systems present savings of 85.8% in total CO2 emissionscompared with diesel equivalents.
Since diesel generator consumed diesel fuel to produce power, thusthe higher diesel operating hours experienced at both Port Harcourt andIseyin site has led to higher CO2 emission as seen in Fig. 13. On theother hand, the remaining sites experienced low emission due to highavailability of renewable energy resources leading to utilization ofhybrid PV/wind to power the rural health clinics majority of the timeduring the year rather than diesel generator system.
As a result, a total of 95.4, 98.4, 98.6, 98.8, 98.3 and 93.9% of CO2
emission would be curtailed if a hybrid renewable energy system con-figuration is adopted at Iseyin, Sokoto, Maiduguri, Jos, Enugu and Port-Harcourt respectively. Based on the observation from Fig. 14 andbearing in mind the effect of pollution into the environment, it can beconcluded that the best suitable sites for HRES configuration
Fig. 11. Energy production of various energy sources and battery SOC of typical January month in Iseyin.
L. Olatomiwa et al. Sustainable Energy Technologies and Assessments 30 (2018) 121–138
134
Fig. 12. Energy production of various energy sources and battery SOC of a typical August month in Iseyin.
0
200
400
600
800
1,000
1,200
1,400
1,600
Iseyin Sokoto Maiduguri Jos Enugu PortHarcourt
Co2
Emis
sion
(kg/
yr.)
Sites
Pollutant Emission (CO2)
Fig. 13. Comparison of CO2 pollutant emission in the entire site.
Iseyin 3.98%
Sokoto1.33%
Maiduguri1.20%
Jos1.06%
Enugu1.44%
Port Harcourt5.19%
Diesel Only (All sites)85.79%
Fig. 14. Comparison of CO2 emission in optimal system configuration anddiesel-only system in the selected sites.
L. Olatomiwa et al. Sustainable Energy Technologies and Assessments 30 (2018) 121–138
135
comprising PV, wind, diesel and battery are Jos, Maiduguri, Sokoto andEnugu rural healthcare facilities. This is basically due to the highestpercentage of CO2 emission reduction in the locations as well as lowNPC compared to other locations as earlier stated.
Conclusions
This study identified a lack of modern electricity supply as a majorimpediment to proper functioning of the healthcare centres in the ruralareas, contributing to high maternal and child mortality rates in acountry. It is against this backdrop that the research work has focusedon how to address the problem so that the healthcare centers or clinicsin the remote areas can provide timely delivery of medical services forthe concerned people. This research study has presented the simulationand analysis of stand-alone hybrid renewable energy systems for basichealthcare services in the rural areas, where there is no grid energysupply or the supply from the existing grid is erratic and unreliable. Ithas considered the energy configurations fueled by the available solar,wind and diesel energy resources of six different locations in Nigeriaunder different environmental conditions such as the solar irradiation,wind and ambient temperature. The locations used as test cases areNorth-east (Maiduguri), North-west (Sokoto), North-central (Jos),South-east (Enugu), South-west (Iseyin) and South-south (Port-Harcourt).
The study has employed standard off-grid energy systems meth-odologies supported by the HOMER tool, IEC standards and relevantstudies in the literature for the simulation and analysis of the proposedhybrid electricity systems for the intended healthcare centres acrossNigeria. In addition, a real-life load demand profile of a standard ruralhealthcare center in the country has been used as the basis of theanalysis of the energy system. This provides a practical approach tounderstanding and ascertaining the users’ energy requirements, ratherthan making assumptions. Therefore, the total demand of about24 kWh/d used in this paper has been developed by considering all thedifferent appliances in the health centre and their daily hours of op-eration.
The technical analysis involved determining the appropriate sizes ofdifferent components of the hybrid systems, their annual energy gen-eration and the battery state of charge. These have been done by usingthe HOMER to optimise the different energy models or configurationsthat can meet the daily energy demand of the healthcare centres.However, the economic analysis examined the initial capital cost, netpresent cost and the cost of energy, while the environmental analysishas been considered in terms of the quantity of carbon emissions thatmay be avoided supposing the proposed hybrid electricity systems areimplemented in the specified locations. It is expected the results of theanalysis of the technical, economic and environmental aspects of thedesign may be useful for planning stand-alone energy generation sys-tems for remote healthcare centres in Nigeria.
The major findings of the research study are summarised as follows:
• The research reveals that the wind system at Iseyin and Maidugurihave the lowest wind power output of 1.23 kW, while those systemsat Sokoto, Jos and Enugu have the highest power output of the samevalue of 2.46 kW. This is because Iseyin location has a low windpower density of 85.33W/m2 compared to 516.57, 741.22 and172.38W/m2 for the other three locations, including Maiduguri.Similarly, the wind power system at Iseyin and Maiduguri producedannual energy of 1474 and 2603 kWh, respectively, compared to9441, 10,572 and, 207 kWh for Sokoto, Jos and Enugu respectively.The results further show that even though Iseyin and Maidugurihave the same maximum wind power output, they have differentenergy output. This is also the case with Sokoto, Jos and Enugu withthe same wind power capacity of 2.46 kW but different annual en-ergy output. Sokoto and Jos may be considered as a potential site forrelatively high wind energy generation compared to the remaining
locations that have low wind speed regimes. This analysis demon-strates that an environmental factor of a location such as the windspeed determines the possible energy output of a wind powersystem.
• Furthermore, the study reveals that though all the locations ex-perience good sunshine, there is still disparity in the annual energygeneration across the country determined by the solar irradiationand temperature factors of the locations. The system at Maidugurithat has a power output of 4.941 kW and produced the highest an-nual energy output of 8840 kWh, while the system at Jos has powerof 3.4 kW and the lowest annual energy output of 5672 kWh. It isclear from the results that the system at Jos with the lowest solarenergy output has the highest wind energy output, while the systemat Maiduguri with relatively lower wind energy output produced thehighest annual solar energy output. Therefore, the percentage con-tribution of each of the renewable energy sources differs by its po-tential in the specified locations. The academic conclusions on this isthat the complementary characteristics of the constituent renewableenergy technologies justifies the hybrid energy configuration as abetter option compared to a single source system based on solar orwind alone.
• In addition, the diesel generator enhances the reliability of the hy-brid system to forestall exceeding the battery’s minimum state ofcharge and a loss of power supply to the health centers over the 24-hour period. The battery state of charge results demonstrate that it ispossible to achieve off-grid energy systems that can be operatedwithin the acceptable battery state of charge limits with a minimumof 0.3 in this study.
• The economic analysis shows that the system at Jos has the lowestnet present cost and cost of energy due to the location’s high windand moderate solar energy resources availability compared to theother locations. The system also has the lowest PV capacity of 4 kWand a wind capacity of 2 kW. The system at Port-Harcourt has thehighest net present cost and the cost of energy in the PV/wind/diesel/battery configuration because of its relatively higher PV ca-pacity and possibly lower renewable energy generation. Therefore,the practical implication of a system having the highest annual re-newable energy generation such as the one at Jos is that has theminimum diesel energy generation requirement. However, thesystem at Port-Harcourt has the highest generator requirements. Thestudy also observed that a 100% diesel system has the highest cost ofenergy. This study finds that the higher the annual energy generatedby a system, the lower the cost of the produced energy per kWh.
• The research demonstrated that CO2 of 24,107 kg/yr is likely to emitby providing electricity to the health centres through a diesel powergenerator alone. This is significantly higher than the predictedemissions, ranging from 404.83 to 1459.2 kg/yr, obtained by usingthe PV/wind/diesel/battery hybrid power systems in the locations.The lowest and the highest values of emissions are obtained for Josand Port-Harcourt, which is consistent with the observation earlierpresented. Therefore, the proposed hybrid solutions promise lowerenvironmental impacts in terms of carbon emissions when they areimplemented due to the high percentage contribution of the re-newable energy resources and low diesel energy consumption.
The implementation of the proposed hybrid renewable energymodel in the rural health clinics will ensure reliability of power supplydue to the complementary characteristics of the constituent renewableenergy technologies in the hybrid system; elongation of the operatinghours in rural health clinics due to availability of general lighting; at-traction of more medical personnel (doctors and nurses), leading toavailability of wider range of medical services, since experts tends to beattracted to rural areas having access to electricity; communicabledisease prevention due to constant sensitization and awareness via TV/VCR jingles in the clinics; improved cold-chain vaccines, drugs, bloodand other medical perishable preservation due to availability of
L. Olatomiwa et al. Sustainable Energy Technologies and Assessments 30 (2018) 121–138
136
electricity to power refrigerators; better emergency services and im-proved referral system via RF communication to the secondaryhealthcare centres among others for better healthcare delivery.
Though, Nigeria has been used a test case in this study, the analysisand the contributions of the paper may be useful for understanding andplanning small-scale hybrid electricity generation in other parts of theworld. Therefore, the research form a basis for a better understanding ofand addressing the problem of a lack of electricity supply to healthcarecentres within villages and peri-urban areas around the world.
Acknowledgments
The first author, a Commonwealth Rutherford Fellow funded by theUK government would like to thank Commonwealth ScholarshipCommission in the UK, Bright Spark Scholarship of University ofMalaya, Malaysia and Centre for Renewable Energy SystemsTechnology, Loughborough University, UK for providing the enablingenvironment for this research. In addition, the entire authors appreciatethe Nigerian Meteorological Agency (NIMET) for providing the re-quired meteorological data for this research.
References
[1] IRENA. International Off-Grid Renewable Energy Conference: Key findings and re-commendations. Available from: http://www.irena.org; 2012.
electricity access in health facilities of sub-Saharan Africa: a systematic review ofdata on electricity access, sources, and reliability. Global Health: Science andPractice 2013;1:249–61.
[4] Akikur RK, Saidur R, Ping HW, Ullah KR. Comparative study of stand-alone andhybrid solar energy systems suitable for off-grid rural electrification: a review.Renewable Sustainable Energy Rev 2013;27:738–52.
[5] Olatomiwa L, Mekhilef S, Huda A, Sanusi K. Techno-economic analysis of hybridPV–diesel–battery and PV–wind–diesel–battery power systems for mobile BTS: theway forward for rural development. Energy Sci Eng 2015.
[6] Akinyele DO, Rayudu RK. Community-based hybrid electricity supply system: apractical and comparative approach. Appl Energy 2016;171:608–28.
[7] Akinyele DO, Nair NKC, Rayudu RK, Chakrabarti B. Decentralized energy genera-tion for end-use applications: Economic, social and environmental benefits assess-ment. In: 2014 IEEE Innovative Smart Grid Technologies - Asia (ISGT ASIA), 2014,pp. 84–9.
[8] Roche O, Blanchard RE. Design of a solar energy centre for providing lighting andincome-generating activities for off-grid rural communities in Kenya. RenewableEnergy 2018;118:685–94.
[9] Akinyele DO. Environmental performance evaluation of a grid-independent solarphotovoltaic power generation (SPPG) plant. Energy 2017;130:515–29.
[10] Bhakta S, Mukherjee V, Shaw B. Techno-economic analysis and performance as-sessment of standalone photovoltaic/wind/hybrid power system in Lakshadweepislands of India. J Renewable Sustainable Energy 2015;7:063117.
[11] Akinyele D, Rayudu R, Blanchard RE. Sustainable microgrids for energy-poorcommunities: a spotlight on the planning dimensions. 2016.
[12] Halabi LM, Mekhilef S, Hossain M. Performance evaluation of hybrid adaptiveneuro-fuzzy inference system models for predicting monthly global solar radiation.Appl Energy 2018;213:247–61.
[13] Azoumah Y, Yamegueu D, Ginies P, Coulibaly Y, Girard P. Sustainable electricitygeneration for rural and peri-urban populations of sub-Saharan Africa: the “flexy-energy” concept. Energy Policy 2011;39:131–41.
[14] Olatomiwa L. Optimal configuration assessments of hybrid renewable power supplyfor rural healthcare facilities. Energy Rep 2016;2:141–6.
[15] Akinyele D, Rayudu R. Strategy for developing energy systems for remote com-munities: insights to best practices and sustainability. Sustainable Energy TechnolAssess 2016;16:106–27.
[16] Bhattacharyya SC. Review of alternative methodologies for analysing off-gridelectricity supply. Renewable Sustainable Energy Rev 2012;16:677–94.
[17] Daud A-K, Ismail MS. Design of isolated hybrid systems minimizing costs and pol-lutant emissions. Renewable Energy 2012;44:215–24.
[18] Halabi LM, Mekhilef S, Olatomiwa L, Hazelton J. Performance analysis of hybridPV/diesel/battery system using HOMER: a case study Sabah, Malaysia. EnergyConvers Manage 2017;144:322–39.
[19] Hossain M, Mekhilef S, Olatomiwa L. Performance evaluation of a stand-alone PV-wind-diesel-battery hybrid system feasible for a large resort center in South ChinaSea, Malaysia. Sustainable Cities Soc 2017;28:358–66.
[20] Kolhe ML, Ranaweera KIU, Gunawardana AS. Techno-economic sizing of off-gridhybrid renewable energy system for rural electrification in Sri Lanka. SustainableEnergy Technol Assess 2015;11:53–64.
[21] Ghafoor A, Munir A. Design and economics analysis of an off-grid PV system forhousehold electrification. Renewable Sustainable Energy Rev 2015;42:496–502.
[22] Mamaghani AH, Escandon SAA, Najafi B, Shirazi A, Rinaldi F. Techno-economic
feasibility of photovoltaic, wind, diesel and hybrid electrification systems for off-grid rural electrification in Colombia. Renewable Energy 2016;97:293–305.
[23] Ghasemi A, Asrari A, Zarif M, Abdelwahed S. Techno-economic analysis of stand-alone hybrid photovoltaic–diesel–battery systems for rural electrification in easternpart of Iran—a step toward sustainable rural development. Renewable SustainableEnergy Rev 2013;28:456–62.
[24] Belouda M, Jaafar A, Sareni B, Roboam X, Belhadj J. Integrated optimal design andsensitivity analysis of a stand alone wind turbine system with storage for ruralelectrification. Renewable Sustainable Energy Rev 2013;28:616–24.
[25] Shahzad MK, Zahid A, ur Rashid T, Rehan MA, Ali M, Ahmad M. Techno-economicfeasibility analysis of a solar-biomass off grid system for the electrification of re-mote rural areas in Pakistan using HOMER software. Renewable Energy2017;106:264–73.
[26] Kumar P, Deokar S. Optimal design configuration using HOMER. Advances inSystems, Control and Automation. Springer; 2018. p. 101–8.
[27] Franco A, Shaker M, Kalubi D, Hostettler S. A review of sustainable energy accessand technologies for healthcare facilities in the Global South. Sustainable EnergyTechnol Assess 2017;22:92–105.
[28] Mandelli S, Barbieri J, Mereu R, Colombo E. Off-grid systems for rural electrifica-tion in developing countries: definitions, classification and a comprehensive lit-erature review. Renewable Sustainable Energy Rev 2016;58:1621–46.
[29] Siddaiah R, Saini R. A review on planning, configurations, modeling and optimi-zation techniques of hybrid renewable energy systems for off grid applications.Renewable Sustainable Energy Rev 2016;58:376–96.
[30] IEEE. Guide for Array and Battery Sizing in Stand-alone Photovoltaic (PV) Systems,IEEE Std. 1562. IEEE; 2007. p. 1–34.
[31] IEEE. IEEE Guide for Optimizing the Performance and Life of Lead-Acid Batteries inRemote Hybrid Power Systems. IEEE Std. 1561. 2007, pp. 1–35.
[32] IEC. Recommendations for Small Renewable Energy and Hybrid Systems for RuralElectrification, IEC Std. 62257. IEC; 2007. p. 1–27.
[33] Bartolucci L, Cordiner S, Mulone V, Rocco V, Rossi JL. Hybrid renewable energysystems for renewable integration in microgrids: influence of sizing on perfor-mance. Energy 2018;152:744–58.
[34] Anoune K, Bouya M, Astito A, Abdellah AB. Sizing methods and optimizationtechniques for PV-wind based hybrid renewable energy system: a review.Renewable Sustainable Energy Rev 2018;93:652–73.
[35] Sawle Y, Gupta S, Bohre AK. Review of hybrid renewable energy systems withcomparative analysis of off-grid hybrid system. Renewable Sustainable Energy Rev2017.
[36] Ganguly P, Kalam A, Zayegh A. Solar–wind hybrid renewable energy system: cur-rent status of research on configurations, control, and sizing methodologies. Hybrid-Renewable Energy Systems in Microgrids. Elsevier; 2018. p. 219–48.
[37] Dihrab SS, Sopian K. Electricity generation of hybrid PV/wind systems in Iraq.Renewable Energy 2010;35:1303–7.
[38] Hiendro A, Kurnianto R, Rajagukguk M, Simanjuntak YM. Techno-economic ana-lysis of photovoltaic/wind hybrid system for onshore/remote area in Indonesia.Energy 2013;59:652–7.
[39] Ohunakin OS, Adaramola MS, Oyewola OM, Fagbenle RO. Solar energy applicationsand development in Nigeria: drivers and barriers. Renewable Sustainable EnergyRev 2014;32:294–301.
[40] Adaramola MS. Estimating global solar radiation using common meteorologicaldata in Akure, Nigeria. Renewable Energy 2012;47:38–44.
[41] Okundamiya M, Nzeako A. Empirical model for estimating global solar radiation onhorizontal surfaces for selected cities in the six geopolitical zones in Nigeria. JControl Sci Eng 2011;2011:9.
[42] Olatomiwa L, Mekhilef S, Shamshirband S, Petkovic D. Potential of support vectorregression for solar radiation prediction in Nigeria. Nat Hazards 2015;77:1055–68.
[43] Olatomiwa L, Mekhilef S, Shamshirband S. Global solar radiation forecasting basedon SVM-wavelet transform algorithm. Int J Intell Syst Appl (IJISA) 2016;8:19–26.
[44] Olatomiwa L, Mekhilef S, Shamshirband S, Petković D. Adaptive neuro-fuzzy ap-proach for solar radiation prediction in Nigeria. Renewable Sustainable Energy Rev2015;51:1784–91.
[45] Olatomiwa L, Mekhilef S, Shamshirband S, Mohammadi K, Petković D, Sudheer C. Asupport vector machine–firefly algorithm-based model for global solar radiationprediction. Sol Energy 2015;115:632–44.
[46] Adaramola MS, Oyewola OM, Ohunakin OS, Akinnawonu OO. Performance eva-luation of wind turbines for energy generation in Niger Delta, Nigeria. SustainableEnergy Technol Assess 2014;6:75–85.
[47] Ohunakin OS. Wind resource evaluation in six selected high altitude locations inNigeria. Renewable Energy 2011;36:3273–81.
[48] NIMET. Nigerian Meteorological Agency. Available from: htttp://www.nimet.gov.ng; 2014.
[49] Olatomiwa L, Mekhilef S, Ohunakin OS. Hybrid renewable power supply for ruralhealth clinics (RHC) in six geo-political zones of Nigeria. Sustainable EnergyTechnol Assess 2016;13:1–12.
[50] USAID. Powering Health. Available from: http://www.poweringhealth.org/index.php; 2014.
[51] Ismail M, Moghavvemi M, Mahlia T. Techno-economic analysis of an optimizedphotovoltaic and diesel generator hybrid power system for remote houses in atropical climate. Energy Convers Manage 2013;69:163–73.
[52] Lambert T, Gilman P, Lilienthal P. Micropower system modeling with HOMER.Integr Altern Sources Energy 2006;1:379–85.
[53] Ohunakin SO, Ojolo SJ, Ogunsina SB, Dinrifo RR. Analysis of cost estimation andwind energy evaluation using wind energy conversion systems (WECS) for elec-tricity generation in six selected high altitude locations in Nigeria. Energy Policy2012;48:594–600.
L. Olatomiwa et al. Sustainable Energy Technologies and Assessments 30 (2018) 121–138
[54] Ohunakin OS, Akinnawonu OO. Assessment of wind energy potential and theeconomics of wind power generation in Jos, Plateau State, Nigeria. EnergySustainable Dev 2012;16:78–83.
[55] Mathew S. Wind Energy: Fundamentals, Resource Analysis and Economics vol. 1.Springer; 2006.
[56] Wood D. Small wind turbines for remote power and distributed generation. WindEng 2010;34:241–54.
[58] Torres M, Lopes LA. Inverter-based diesel generator emulator for the study of fre-quency variations in a laboratory-scale autonomous power system. Energy PowerEng 2013;5:274.
[59] IEC. Recommendations for small renewable energy and hybrid systems for ruralelectrification (Part 7: Generators). IEC; 2008. p. 1–19.
[60] NREL. HOMER PRO Index. 2015.[61] Diaf S, Diaf D, Belhamel M, Haddadi M, Louche A. A methodology for optimal sizing
of autonomous hybrid PV/wind system. Energy Policy 2007;35:5708–18.[62] Adaramola MS, Paul SS, Oyewola OM. Assessment of decentralized hybrid PV solar-
diesel power system for applications in Northern part of Nigeria. Energy SustainableDev 2014;19:72–82.
[63] Akinyele D, Rayudu R, Nair N. Grid-independent renewable energy solutions forresidential use: the case of an off-grid house in wellington, New Zealand. In: Powerand Energy Engineering Conference (APPEEC), 2015 IEEE PES Asia-Pacific, 2015,pp. 1–5.
[64] Ngpricehunter. Available from: http://www.ngpricehunter.com/; May 12, 2015.[65] mygadgetsmall. Available from: http://www.mygadgetsmall.com/; May 20, 2015.[66] Worldbank. Available from: http://data.worldbank.org; 2018.[67] Elliott D, Schwartz M. Wind Energy Potential in the United States PNL-SA-23109
Richland, WA: Pacific Northwest Laboratory; 1993.[68] Kumar A, Mohanty P, Palit D, Chaurey A. Approach for standardization of off-grid
electrification projects. Renewable Sustainable Energy Rev 2009;13:1946–56.
L. Olatomiwa et al. Sustainable Energy Technologies and Assessments 30 (2018) 121–138