Page 1
HydEF project
Driving the hydrology: high-resolution weather generation
Richard Chandler ([email protected] ) Richard Chandler ([email protected] )
Chiara Ambrosino ([email protected] )
Department of Statistical Science
University College London
Steering group meeting, 15th February 2012, Imperial College
Page 2
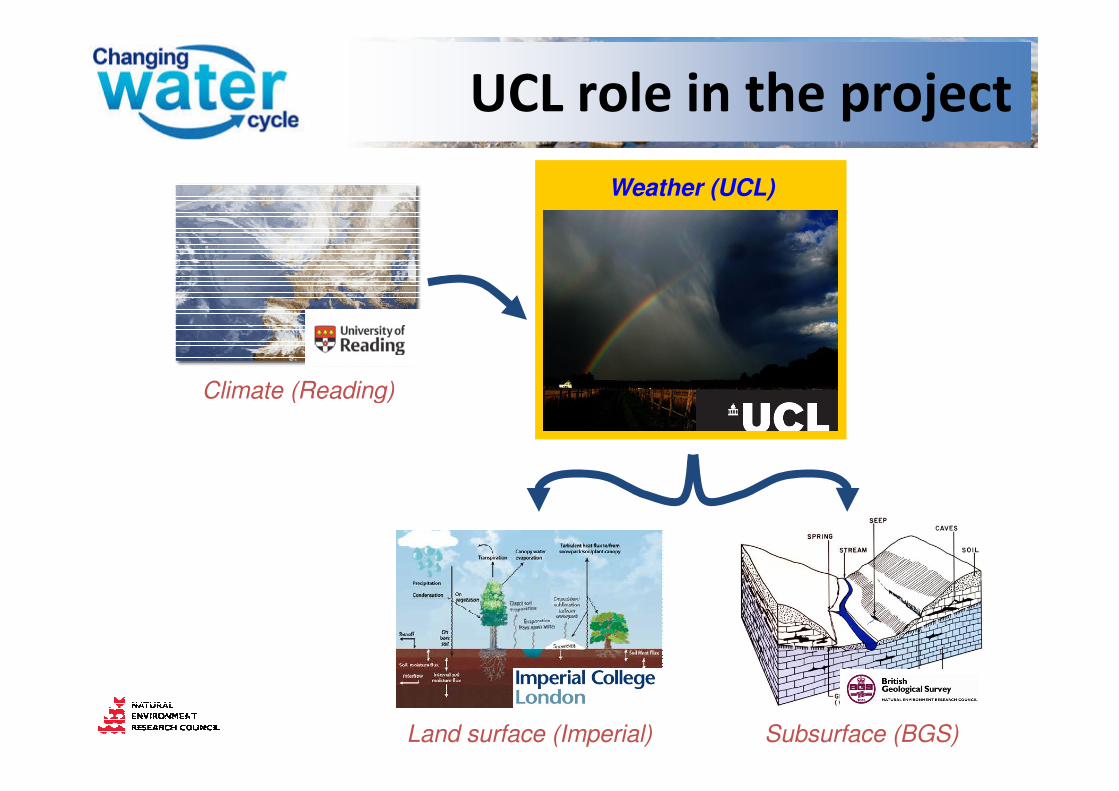
UCL role in the project
Climate (Reading)
Weather (UCL)
Climate (Reading)
Land surface (Imperial) Subsurface (BGS)
Page 3
� To provide high-resolution weather inputs (‘weather
generator’), consistent with large-scale atmospheric
conditions, for input into hydro(geo)logical models
� Multi-site, multivariate, hourly series required� E.g. variables needed by JULES (1km2 resolution?):
Objectives
Rainfall rate Air pressure Snowfall rate Air temperature
� Impacts of changing climate assessed by generating
high-resolution inputs conditioned on large-scale outputs
from climate simulators e.g. GCMs
Rainfall rate Air pressure Snowfall rate Air temperature
Wind speed Specific
humidity
Downward
short-wave
radiation
Downward
long-wave
radiation
Page 4
� Spatial resolution too coarse for many
applications despite improvements in regional
climate models
� Expensive to obtain multiple runs (~1 month for
100-year simulation) for uncertainty assessment /
Why not use climate simulator
outputs directly?
100-year simulation) for uncertainty assessment /
accurate estimation of extremes etc.
� Reproduction of precipitation still problematic
from end-user perspective
� Can’t calibrate to reproduce specific features of
interest in particular application
Page 5
� Idea: build statistical model for relationship
between large-scale circulation and local-scale
weather – use to generate high-resolution data
conditioned on climate simulator output
� Quick to generate multiple simulations & explore
Statistical downscaling and
weather generation
� Quick to generate multiple simulations & explore
uncertainties
� Can calibrate / tailor to specific applications
� BUT existing generators do not use latest
methodological developments and can perform
poorly – hence some criticism in literature � Don’t confuse concept with implementation!
Page 6
� Modern developments based on generalized linear models
(GLMs) allow generation of realistic daily multisite series at
both gauged and ungauged locations
� Probabilistic regression-like framework allowing many
different types of distribution (normal, Poisson, gamma,
binomial, …) and complex relationships
Developments and opportunities
binomial, …) and complex relationships
� Tried and tested for single variables - GLIMCLIM software
(www.homepages.ucl.ac.uk/~ucakarc/work/glimclim.html)
� Competitive with other state-of-the-art tools with respect to
extremes, interannual variability, persistence etc.
� Flexible framework allows physical understanding to
inform model structures (UCL-Reading collaboration)
Page 7
� Extend to simultaneous generation of multiple
weather variables i.e. multivariate generator� Need to preserve inter-variable dependencies
� Provide data at hourly resolution� GLMs probably not appropriate here because of strong
temporal dependence (correlation) within days
Challenges for project
temporal dependence (correlation) within days
� Provide user-friendly interface for model building,
calibration and simulation � GLIMCLIM unwieldy – requires manual editing of
definition files
� Resource: two person-years, + 3% of PI time
Page 8
1.Acquire data2.Identify modelling strategy3.Extend existing software for model
Task list
3.Extend existing software for model calibration and simulation
4.Develop models for Thames and Eden
Page 9
� Hourly data obtained from British Atmospheric
Data Centre (BADC), MIDAS Met Office dataset
� Period: January 1950 – February 2011
� Available variables: rainfall, snow, air pressure,
air temperature, wind speed, downward SW
Data (I)
air temperature, wind speed, downward SW
radiation
� Missing variables: specific humidity and
downward LW radiation� Can be derived from other variables using standard
procedures from literature
Page 10
Data (II)
Hourly data nominally available
� Thames: 157 stations
� Eden: 35 stations
BUT …
(following months of work to preprocess files and extract data)
Page 11
� Not all variables actually available at each station:
Data (III)
Stations with data
Thames (/157) Eden (/35)
Precipitation 71 16
Pressure 52 7
� Short record lengths for some stations / variables
� Additional daily records explored – little additional
data available
Pressure 52 7
Temperature 140 28
Wind speed 135 28
Short-wave radiation 22 2
Page 12
Data availability example –
pressure, Thames catchment
Page 13
Data availability – implications
� Scarce data for some variables potentially large
uncertainty in these variables
� Alternative data sources (e.g. gridded data
products) neglect this uncertainty – what are
implications for hydrological impacts?
⇒
implications for hydrological impacts?
� Approach proposed here: use multiple imputation� Sample “missing” data from conditional distributions
conditioned on all available observations
� GLIMCLIM provides this already for daily data – can
extend as part of weather generator development
Page 14
Modelling strategy (I)
� Identify “short cuts” so that development is
feasible with resource available
� Proposed approach: 1. Use GLM to generate multisite, multivariate daily series
2. Disaggregate to hourly using simple representations of
diurnal cycle for all variables except precipitation e.g. diurnal cycle for all variables except precipitation e.g.
where Yhd is value for hour h on day d; and Ad are
24-hourly mean and range for day d (from daily series);
and αh is value of diurnal cycle at hour h
3. For precipitation, use daily-hourly disaggregation
scheme already developed at Imperial College
hdhdhd YY εα ++= hdhddhd AYY εα ++=or
dY
Page 15
Partitioning of variance for daily-
hourly disaggregation
Examples: wet bulb temperature, by month, 6 sites
Page 16
Modelling strategy (II) – daily
weather generator (WG)
� NB all current multivariate WGs start with
precipitation and then derive other variables –
non-physical � Reflects limitations of statistical techniques in early
1980s
� WG here uses modern statistical methods to � WG here uses modern statistical methods to
preserve physical relationships between
variables as implemented in numerical weather
prediction models (see next slide)
� WG to be driven by indices reflecting results from
Reading team to generate “hydrologically
interesting weather”
Page 17
Modelling strategy (III) – daily
WG structure
PRESSURE
WIND TEMPERATURE PRECIPITATION
(rainfall and snow)(rainfall and snow)
WET BULB SW RADIATION CLOUD
TEMPERATURE COVER
Page 18
Software development
� GLIMCLIM evolved from code written in Fortran
77 in mid 1990s – substantially expanded since� Model structures, site attributes, large-scale climate
covariates etc. defined via definition files
� Manual editing required – tedious and error-prone
� Results need to be exported to other software for further � Results need to be exported to other software for further
processing, visualisation etc.
� Currently working on interface to R (www.R-
project.org)� Freely available
� Object-oriented programming environment – can write
scripts to automate all procedures e.g. updating models
� Excellent graphical facilities for visualisation etc.
Page 19
Model development
� Limited progress to date pending software
development
� Preliminary results available for daily pressure in
Thames catchment� GLM with normal distributions� GLM with normal distributions
� Both mean and variance vary through time – need to
incorporate joint mean-variance modelling into
GLIMCLIM
� Inter-site residual correlations fairly high so imputation
should be fairly precise
Page 20
Any questions?Any questions?