31
| Date post: | 31-Mar-2018 |
| Category: |
Documents |
| Upload: | nguyendung |
| View: | 224 times |
| Download: | 3 times |


TelanganaDistrict Factbook™
Hyderabad District
(Key Socio-economic Data of Hyderabad District, Telangana)January, 2017

Editor & DirectorDr. R.K. Thukral
Research EditorDr. Shafeeq Rahman
Compiled, Researched and Published byDatanet India Pvt. Ltd.D-100, 1st Floor,Okhla Industrial Area, Phase-I,New Delhi-110020.Ph.: 91-11-43580781, 26810964-65-66Email : [email protected] : http://www.datanetindia-ebooks.com
Report No.: DFB/TS-536-0117
ISBN :
First Edition : January, 2017
Price : Rs. 7500/- US$ 200
© 2017 Datanet India Pvt. Ltd.All right reserved. No part of this book may be reproduced, stored in a retrievalsystem or transmitted in any form or by any means, mechanical, photocopying,recording or otherwise without the prior written permission of the publisher.
Printed in India

Hyderabad District at a Glance
District came into Existence -
District Headquarter Hyderabad
Distance from State Capital -
Geographical Area (In Square km.) 217 (Ranks 10th in State and 605th in India)Wastelands Area (In Square km.)(2008-2009)
1.17
Total Number of Households 8,81,512
Population 39,43,323 (Persons), 20,18,575 (Males), 19,24,748 (Females) (Ranks 3rd in Stateand 60th in India)
Population Growth Rate (2001-2011)
2.97 (Persons), 1.89 (Males), 4.12 (Females)
Number of SubDistricts/Towns/Villages
Sub-districts (16), Towns (03) and Villages (0)
Forest Cover (2015) 5.29% of Total Geographical AreaPercentage of Urban/RuralPopulation
100 (Urban), 0 (Rural)
Administrative Language Telugu
Principal Languages (2001) Telugu (46.47%), Urdu (40.74%), Hindi (6.36%), Marathi (1.74%), Tamil (1.50%),Kannada (0.92%) and Others (0.06%)
Population Density 18,172 (Persons per Sq. km.)
Sex Ratio 954 (Females per 1000 Males)
Child Ratio (Age Group 0-6 Year) 914 (Females per 1000 Males)
Number of Live Births (2014) 1,96,952 (Persons), 1,01,032 (Males), 95,920 (Females)
Number of Deaths (2014) 56,171 (Persons), 30,060 (Males), 26,111 (Females)
Literacy Rate (In %age) 83.25 (Persons), 86.99 (Males), 79.35 (Females)
Literates 28,92,155 (Persons), 15,42,688 (Males), 13,49,467 (Females)
Illiterates 10,51,168 (Persons), 4,75,887 (Males), 5,75,281 (Females)
Major Religions Hindu (51.89%), Muslim (43.45%), Christian (2.22%), Jain (0.50%), Sikh (0.29%)and Buddhist (0.03%)
Schedule Caste Population 2,47,927 (Persons), 1,24,313 (Males), 1,23,614 (Females), Percentage of SC inTotal Population (1.79)
Major Schedule Caste Population Madiga (52.76%); Mala, Mala Ayawaru (37.29%); Chamar, Mochi, Muchi,Chamar-Ravidas, Chamar-Rohidas (1.61%); Arwa Mala (1.42%); Mehtar (1.38%)
Schedule Tribe Population 48,937 (Persons), 25,556 (Males), 23,381 (Females), Percentage of ST in TotalPopulation (0.83)
Major Schedule Tribe Population
Sugalis, Lambadis, Banjara (36.79%); Yerukulas, Koracha, Dabba Yerukula,Kunchapuri Yerukula, Uppu Yerukula (11.67%); Pardhan (6.21%); Kondareddis(2.93%); Koya, Doli Koya, Gutta Koya, Kammara Koya, Musara Koya, Oddi Koya,Pattidi Koya, Rajah, Rasha Koya, Lingadhari Koya (ordinary), Kottu Koya, BhineKoya, Rajkoya (2.38%)
Number of Total Workers 14,13,297 (Persons), 10,45,585 (Males), 3,67,712 (Females)Labour Force Participation Rate(2011-2012)
36.79% (Urban)
Major Source of Income IndustryGross District Domestic Product(2014-15) (FRE) (Rs. in Lakh)
125,88,200 At Current Price / 103,38,700 At Constant (2011-2012) Prices
Net District Domestic Product(2014-15) (FRE) (Rs. in Lakh)
116,76,600 At Current Price / At Constant (2011-2012) Prices
Per Capita Income (NDDP, At FactorCost) (2014-15) (FRE) (In Rs.)
2,94,220 At Current Price / - At Constant (2011-2012) Prices
Number of Tourists (2015) 95,98,946 (Domestic Tourist) / 1,22,238 (Foreign Tourist)
Major Tourist Places
Hyderabad, Golkonda Fort, Numaish, St. Josephs Cathedral, Sanghi Temple,Paigah Tombs, Chilkur Balaji Temple, Mecca Masjid, Shankar Mutt, SkandagiriTemple, Ashtalakshmi Temple, Kailasanaadha Temple, Kalibari, Ramalayam, SriPrasanna Venkateswara Swami Temple and Ujjaini Mahakali Temple.
Note: A ll figures for 2011 Census, Otherwise year is mentioned.

No. Particulars Page No.
1 Administrative Setup 1-9
Location Map | District w ith Sub-Districts | Reference Map of District |About District | Administrative Unit | Villages | Towns | Wards
2 Demographics 10-32
Population l Sex Ratio | Density | Child Population | Child Sex Ratio |Decadal Growth | Age Group Population | Age Group Population ofCurrently Married | Economically Active Population | Ageing Population |Dependency Ratio | Single Year Age Population | Scheduled CastePopulation | Scheduled Tribe Population | Religious Population
3 Economy 33-44
GDP/NDP | Per Capita Income | Households by Income Groups |Disposable Income | Banking | District Central Co-operative Banks |Lead Banks | Investment and Debt | Ration Cards Issued
4 Market Size 45-56
Monthly Per Capita Expenditure | Estimated Annual Expenditure /Average Per Capita Consumer Expenditure on Services and DurableGoods
5 Life Style 57-61
Households having Radio/Transistor, Television | Households havingComputer/Laptop/Internet | Households having Telephone/MobilePhone | Households having Bicycle, Scooter/Motor Cycle/Moped &Car/Jeep/Van | Circulation of Dailies
6 Infrastructure 62-78
Occupied Houses used as Shops/Offices | Amenities | Sanitation | Roadlength | Vehicle Registered | Power | Telecommunication | Post Office &PIN Code | Tourism | LPG Distributors
7 Industries 79-152
Factories, Capital Invested and Persons Employed (2 & 3 digit levelIndustries) | Factories by Type of Organisation/Ownership |Consumption of Fuels | Manufacturing Industries Share of GDP |Outstanding Credit of SCBs according to Industrial Occupation | Micro,Small and Medium Enterprises | Registered Factories | Ongoing Projects
8 Labour and Workforce 153-160
Total Workers | Main Workers | Marginal Workers | Non-Workers |Average Wages/Earning per Day Received by Usual Principal ActivityStatus | Employment Indicators
9 Agriculture 161-177
Land Utilisation | Milk, Eggs & Meat Production | Fisheries | VeterinaryInstitutions | Livestock Population | Poultry Population | Farmer
10 Education 178-185
Literacy Rate | Population by Educational Level | Census Houses Usedas School/College etc. | Dropout Rates | Enrolment | Enrolment byMedium of Instruction | Gross/Net Enrolment Ratio | Teachers | GiniCoefficient Education | Population by Mother Tongue
11 Health 186-204
Health Institutions | HIV Patients | Live Births Registered | Still BirthsRegistered | Deaths Registered | Infant Deaths Registered | DisabledPopulation by Type of Disability | Houses used for Hospital/Dispensary |Households by Married Couples per Household and Dwelling Rooms |Maternal and Child Health Indicators (HMIS) | District Level HouseholdHealth Indicators | Family Welfare Programmes | National Family HealthSurvey (NFHS)
12 Environment and Pollution 205-209
Geographical Area | Wastelands | Forest Cover | Rainfall | Sale of Majorand Minor Forest Produce | Latitude, Longitude and Altitude | WaterQuality
13 Housing 210-221
Households | Houseless Households | Houseless Population | Standardof Living Index | Housing Condition | House and Their Uses | SlumPopulation
14 Crime & Law 222-228
Incidence of IPC Crime | Fire Accidents | Petitions | Police Officer/Officials| Judicial Officers
15 Social and Welfare Schemes 229-236
Self-Help Groups (SHGs) | Aadhaar Card (UIDAI) Enrolments
16 Electoral 237-241
Vote Distribution of Major Parties (Parliamentary Election-2014 andAssembly Election 2014) | Name and Address of MPs/MLAs | Electors
17 Annexure - I to III 242-257
18 Useful Contacts 258
19 Abbreviations & Sources 259
20 Concepts and Definitions 260-263
21 Disclaimer & Terms of Use 264

TelanganaDistrict FactbookDistrict Factbook™™ Hyderabad District

1
Hyderabad DistrictTelangana
District FactbookDistrict Factbook™™
Administrative Setup
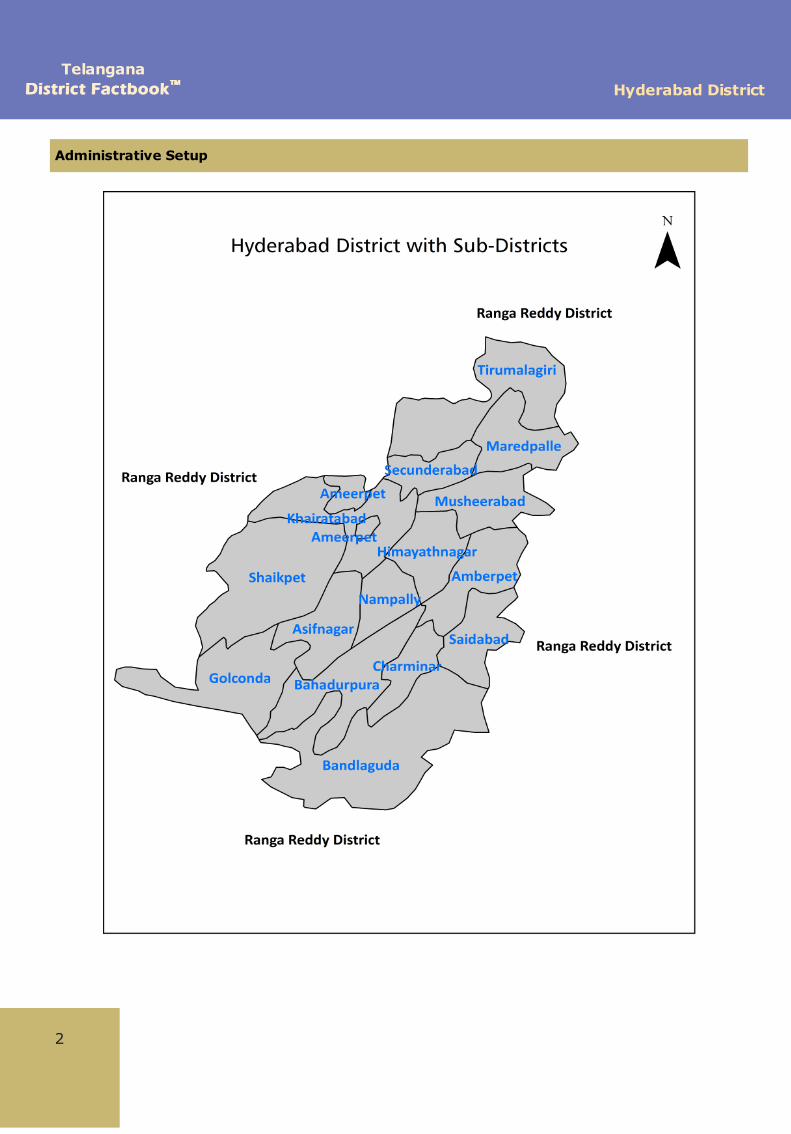
Location Map
TelanganaDistrict FactbookDistrict Factbook™™ Hyderabad District
Administrative Setup
2
3
Hyderabad DistrictTelangana
District FactbookDistrict Factbook™™
Administrative Setup

TelanganaDistrict FactbookDistrict Factbook™™ Hyderabad District
4

5
Hyderabad DistrictTelangana
District FactbookDistrict Factbook™™
About Hyderabad District
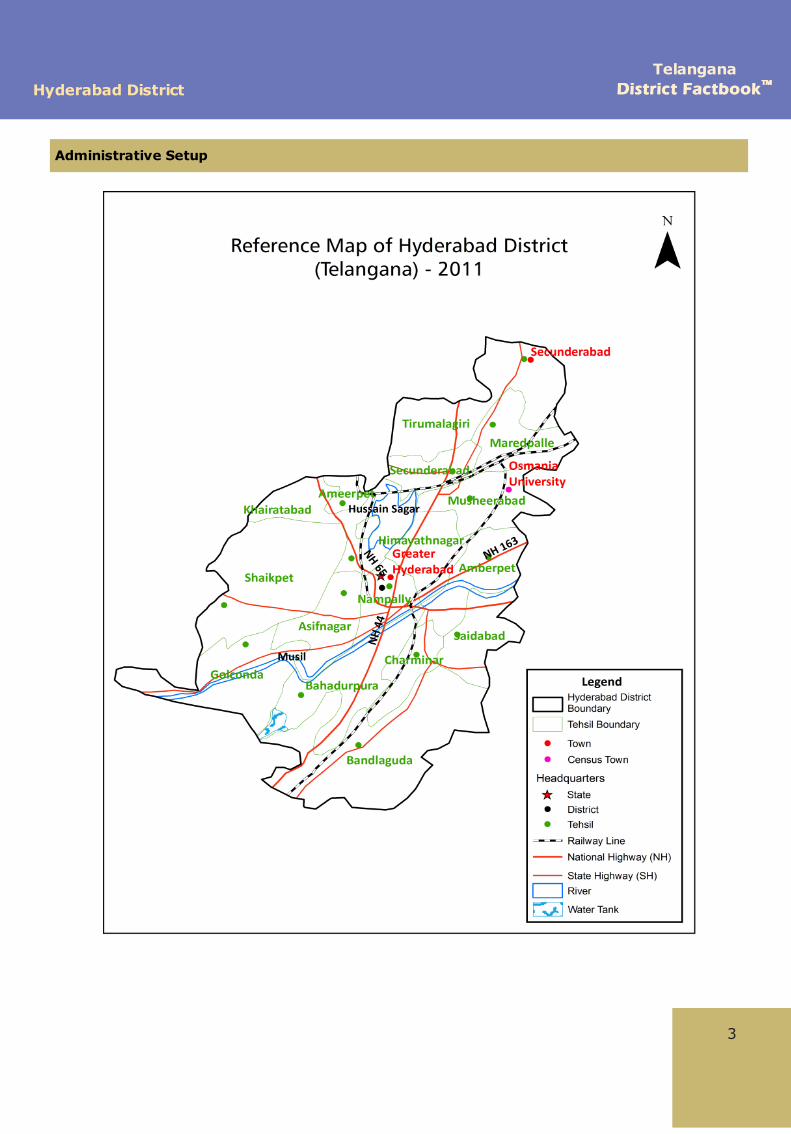
Geographically, the district lies at 17°41'N latitude, 78°53'E longitude and 542 m altitude.The district encompasses a geographical area of 217 sq km and it is bounded by Medakdistrict on the North , Mahabubnagar district on the South , Nalgonda district on theEast and Karnataka on the West . The climate of the district is characterized as tropicalwet and dry climate. Its summers are very hot and humid. The actual rainfall in thedistrict was 551.0 mm in the year of 2015-16.
Administration wise, the district is divided into 16 tehsils includes Amberpeth, Ameerpet,Asifnagar, Bahadurpura, Bandlaguda, Charminar, Golconda, Himayatnagar, Khairtabad,Marredpally, Musheerabad, Nampally, Saidabad, Secunderabad, Shaikpet andTrimulgherry. There are 3 Lok Sabha and 15 Assembly constituencies in the district.
Hyderabad is popularly known as the Pearl City. It is also one of the chief global tradingcentres of large diamonds. The district is industrially well developed and it has manynotable enterprises such as Bharat Heavy Electricals Limited (BHEL),Nuclear FuelComplex (NFC),National Mineral Development Corporation (NMDC),BharatElectronics (BEL),Electronics Corporation of India Limited (ECIL),Defence Research andDevelopment Organisation (DRDO),Hindustan Aeronautics Limited (HAL), Centre forCellular and Molecular Biology (CCMB), Centre for DNA Fingerprinting and Diagnostics(CDFD),State Bank of Hyderabad (SBH) and Andhra Bank (AB). Every year a huge chunkof revenue comes from these enterprises. In the year 2014-2015 the gross domesticproduct in the district was Rs 1,25,88,200 lakh at current price.
Hyderabad is a district of Telangana state with its administrative headquarters located atHyderabad city. The district Hyderabad got its nam e from the two Urdu and Persianwords haydar meaning “lion” and a bad meaning “city or abode”. Both the terms togethermeans “the lion city”. There are also many other interesting stories associated with thename of the district “Hyderabad”. Afterpolice action, the Atraf-a-Balda district andBaghat district was merged and formed the Hyderabad district in 1948. Later in 1978 thedistrict was divided into two parts namely Hyderabad Urban district and Hyderabad Ruraldistrict. With the passage of time, Hyderabad rural district was renamed as Ranga Reddydistrict on the other hand Hyderabad Urban district is the present Hyderabad district.Satya Narayana Nadella, an eminent Indian-American business executive and the currentchief executive officer (CEO) of Microsoft was born on 19 August 1967 in Hyderabad.Earlier, he was served as the Executive Vice President of Microsoft's Cloud andEnterprise group. Sayyid Ahmedullah Qadri also popularly known as Lisan-ul-Mulk,a prominent writer, author, critic, editor-in-chief, Indian independence activist and amost admired figure of Hyderabad was born on 9 August, 1909 in Hyderabad. He was alsoserved as the president ofLutfuddaulah Oriental Research Institute in Hyderabad. He washonoured by the great Padma Shri Award in 1966 for his contribution in the field ofliterature and education.
According to 2011 census the district has a population of 39,43,323 (persons) out ofwhich 20,18,575 (males) and 19,24,748 (females). The district has a sex ratio of 954females for every 1000 males. In the year 2001-2011 the population growth rate in thedistrict was 2.97% (persons) including 1.89 % (males) and 4.12 % (females) . The majorreligions in the district are Hindu and Muslim with 51.89% and 43.45% of the totalpopulation respectively.

TelanganaDistrict FactbookDistrict Factbook™™ Hyderabad District
Hyderabad provides a platform for higher education. The district has 13 universitiesincluding two private, two deemed, six state and three central universities. OsmaniaUniversity, the first university in Hyderabad was established in 1918 and one of the mostfamous institutions of India for international students. The district is fortunate enough tohave India’s first distance learning Open University i.e. Dr. B. R. Ambedkar OpenUniversity, established in 1982. As per 2011 census the literacy rate in the district is83.25% (persons), 86.99% (males) and 79.35% (females).
Zakir Husain, the 3 rd President of India (13 May 1967- 3 May 1969) was born on 8February 1897, in Hyderabad. Earlier he was served as Governor of (1957-1962) andas the Vice President of India (1962-1967). He was also honoured by the Bharat RatnaAward in the year 1963. Asaduddin Owaisi, a distinguished Indian politician, President ofthe All India Majlis-e-Ittehadul Muslimeen and the member of 16 th Lok Sabha was bornon 13 May 1969 in Hyderabad. He is also elected as Member of Parliament (MP) from(2004-09) and (2009-2014) in which he represented the Hyderabad constituency in LokSabha. He was honoured by Sansad Ratna Award for his overall best performance in 15th Lok Sabha in 2014.
Hyderabad offers a variety of tourist places like heritage monuments, lakes, parks,museums and many more which allures numerous travellers from across the world. TheCharminar is the identity of Hyderabad which was built by the founder of Hyderabad i.e.Mohammed Quli Qutb Shah in 1591 at the heart of the Hyderabad city. Mecca Masjid,situated at a distance of a two hundred yards south-west of the Charminar and it wasso named because its bricks were brought from Mecca. It was started by Qutb Shahisbut was completed by Aurangzeb in 1694. Golconda fort is an extraordinary fort whichderived its name from the Telugu terms “Golla Konda” meaning “Shepherd’s Hill”. TaramatiBaradari, located at Ibrahimbagh, on the Osman Sagar (Gandipet) road is a heritagemonument constructed by the Seventh Sultan of Golconda. Some other well knowncentres of attraction of the district are Birla Mandir, Salar Jung Museum, AP StateArchaeological Museum, Nehru Zoological Park, Hussainsagar Lake, Nizam’s Silver JubileeMuseum, Chow Mohalla Palace, etc.
6
7
Hyderabad DistrictTelangana
District FactbookDistrict Factbook™™
Administrative Setup Administrative UnitAdministrative Division:-
Sub-districts:
1. Amberpet 14. Secunderabad
2. Ameerpet 15. Shaikpet
3. Asifnagar 16. Tirumalagiri
4. Bahadurpura
5. Bandlaguda
6. Charminar
7. Golconda
8. Himayathnagar
9. Khairatabad
10. Maredpalle
11. Musheerabad
12. Nampally
13. Saidabad
Towns:
1. GHMC (M Corp.)
2. Osmania University (CT)
3. Secunderabad (CB)
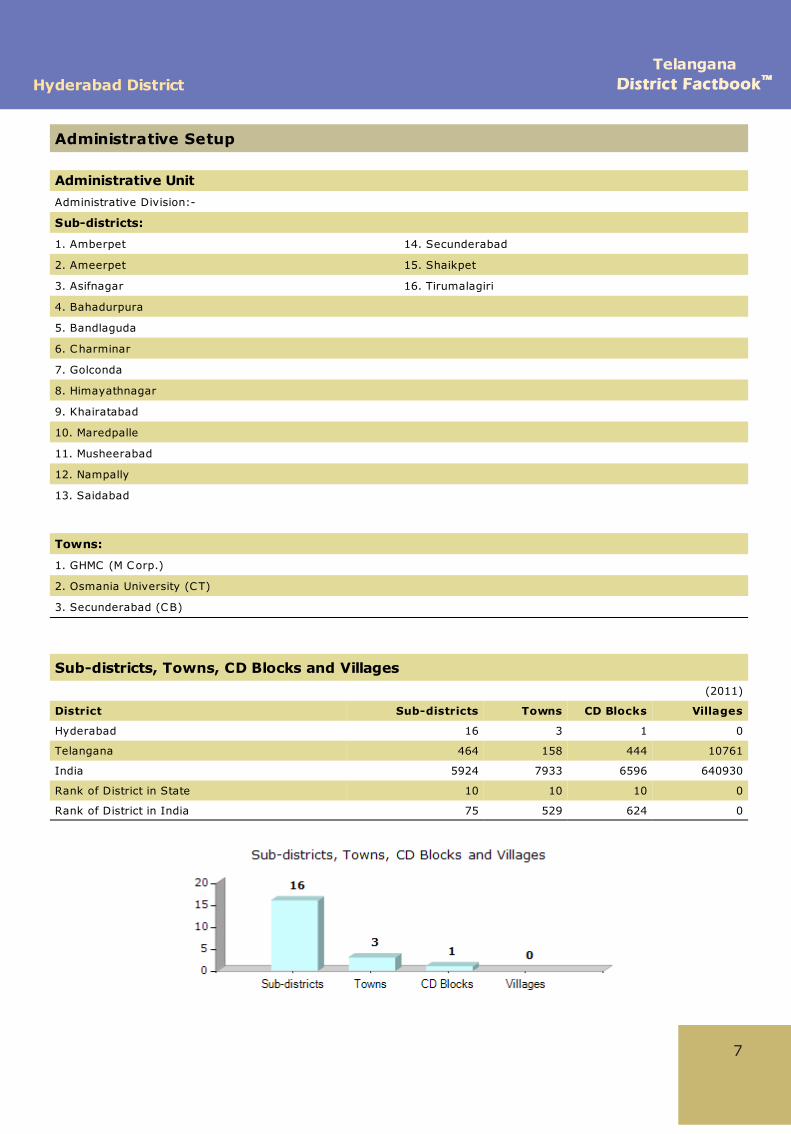
Sub-districts, Towns, CD Blocks and Villages(2011)
District Sub-districts Towns CD Blocks Villages
Hyderabad 16 3 1 0
Telangana 464 158 444 10761
India 5924 7933 6596 640930
Rank of District in State 10 10 10 0
Rank of District in India 75 529 624 0

TelanganaDistrict FactbookDistrict Factbook™™ Hyderabad District
Demographics
Population(2011)
Residence District Persons Male Female
Total Hyderabad 3943323 2018575 1924748
Telangana 35193978 17704078 17489900
India 1210569573 623121843 587447730
Rank of District in State 3 3 3
Rank of District in India 60 60 60
Rural Hyderabad 0 0 0
Telangana 21585313 10797438 10787875
India 833463448 427632643 405830805
Rank of District in State 0 0 0
Rank of District in India 0 0 0
Urban Hyderabad 3943323 2018575 1924748
Telangana 13608665 6906640 6702025
India 377106125 195489200 181616925
Rank of District in State 1 1 1
Rank of District in India 10 10 10
10

TelanganaDistrict FactbookDistrict Factbook™™ Hyderabad District
Economy
BankingHouseholds Availing Banking Services
(2011)
Residence District Total Number ofHouseholds
Total Number ofHouseholds Availing
Banking Services (%)Total Hyderabad 881512 519597 (58.94)
Telangana 8420662 4515061 (53.62)
India 246692667 144814788 (58.70)
Rank of District in State 4 2
Rank of District in India 44 50
Rural Hyderabad 0 0 (0.00)
Telangana 5249286 2598889 (49.51)
India 167826730 91369805 (54.44)
Rank of District in State 0 0
Rank of District in India 0 0
Urban Hyderabad 881512 519597 (58.94)
Telangana 3171376 1916172 (60.42)
India 78865937 53444983 (67.77)
Rank of District in State 2 2
Rank of District in India 11 12
36
47
Hyderabad DistrictTelangana
District FactbookDistrict Factbook™™
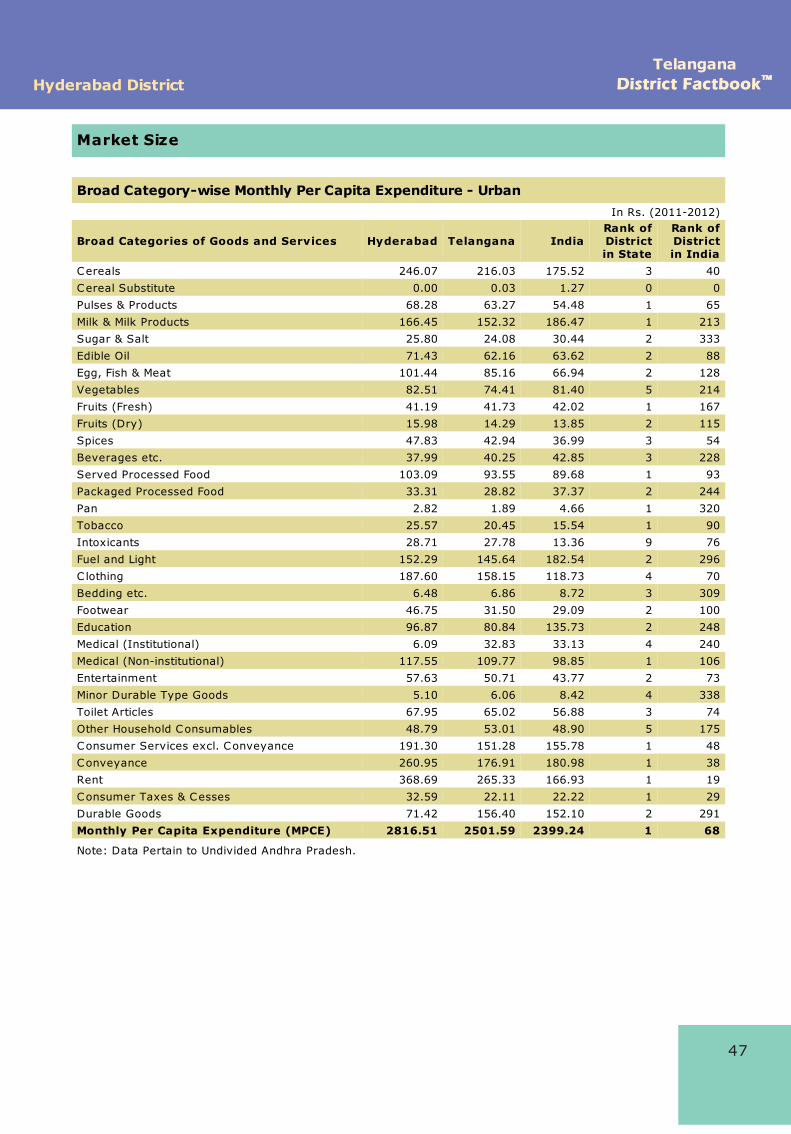
Market Size
Broad Category-wise Monthly Per Capita Expenditure - Urban In Rs. (2011-2012)
Broad Categories of Goods and Services Hyderabad Telangana IndiaRank ofDistrictin State
Rank ofDistrictin India
Cereals 246.07 216.03 175.52 3 40
Cereal Substitute 0.00 0.03 1.27 0 0
Pulses & Products 68.28 63.27 54.48 1 65
Milk & Milk Products 166.45 152.32 186.47 1 213
Sugar & Salt 25.80 24.08 30.44 2 333
Edible Oil 71.43 62.16 63.62 2 88
Egg, Fish & Meat 101.44 85.16 66.94 2 128
Vegetables 82.51 74.41 81.40 5 214
Fruits (Fresh) 41.19 41.73 42.02 1 167
Fruits (Dry) 15.98 14.29 13.85 2 115
Spices 47.83 42.94 36.99 3 54
Beverages etc. 37.99 40.25 42.85 3 228
Served Processed Food 103.09 93.55 89.68 1 93
Packaged Processed Food 33.31 28.82 37.37 2 244
Pan 2.82 1.89 4.66 1 320
Tobacco 25.57 20.45 15.54 1 90
Intoxicants 28.71 27.78 13.36 9 76
Fuel and Light 152.29 145.64 182.54 2 296
C lothing 187.60 158.15 118.73 4 70
Bedding etc. 6.48 6.86 8.72 3 309
Footwear 46.75 31.50 29.09 2 100
Education 96.87 80.84 135.73 2 248
Medical (Institutional) 6.09 32.83 33.13 4 240
Medical (Non-institutional) 117.55 109.77 98.85 1 106
Entertainment 57.63 50.71 43.77 2 73
Minor Durable Type Goods 5.10 6.06 8.42 4 338
Toilet Articles 67.95 65.02 56.88 3 74
Other Household Consumables 48.79 53.01 48.90 5 175
Consumer Services excl. Conveyance 191.30 151.28 155.78 1 48
Conveyance 260.95 176.91 180.98 1 38
Rent 368.69 265.33 166.93 1 19
Consumer Taxes & Cesses 32.59 22.11 22.22 1 29
Durable Goods 71.42 156.40 152.10 2 291
Monthly Per Capita Expenditure (MPCE) 2816.51 2501.59 2399.24 1 68
Note: Data Pertain to Undivided Andhra Pradesh.
57
Hyderabad DistrictTelangana
District FactbookDistrict Factbook™™
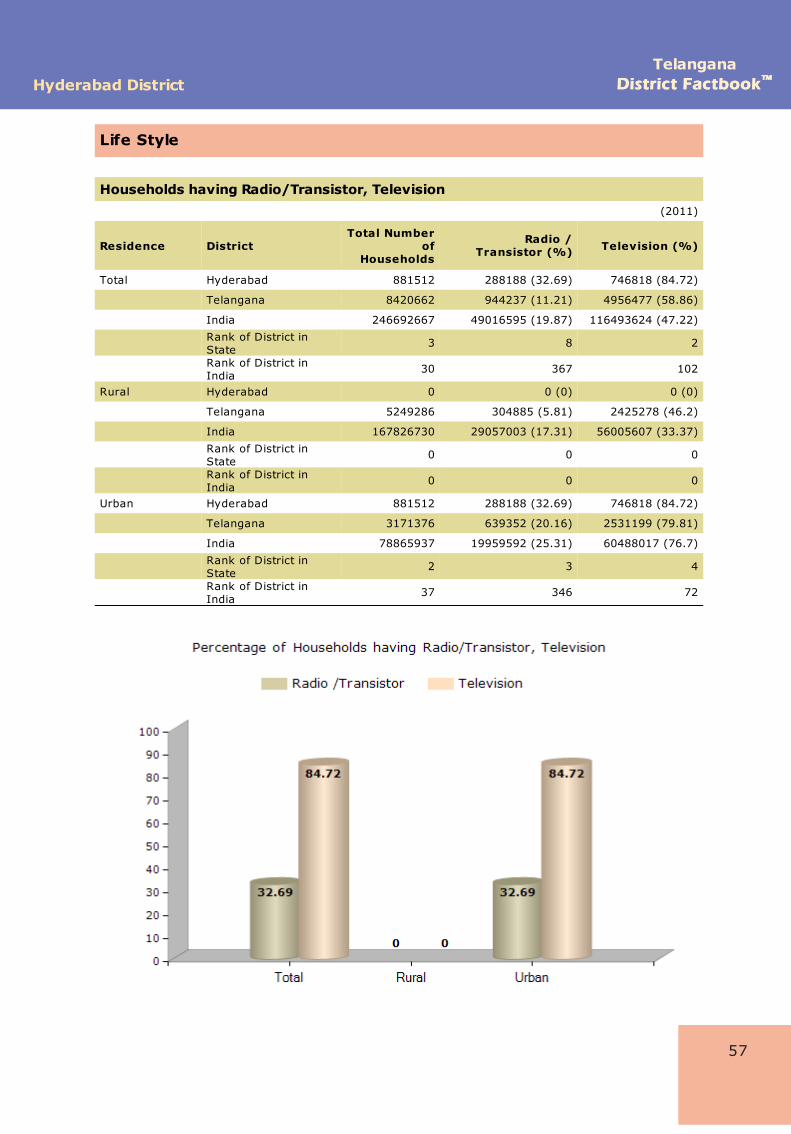
Life Style
Households having Radio/Transistor, Television(2011)
Residence DistrictTotal Number
ofHouseholds
Radio /Transistor (%) Television (%)
Total Hyderabad 881512 288188 (32.69) 746818 (84.72)
Telangana 8420662 944237 (11.21) 4956477 (58.86)
India 246692667 49016595 (19.87) 116493624 (47.22)
Rank of District inState
3 8 2
Rank of District inIndia
30 367 102
Rural Hyderabad 0 0 (0) 0 (0)
Telangana 5249286 304885 (5.81) 2425278 (46.2)
India 167826730 29057003 (17.31) 56005607 (33.37)
Rank of District inState
0 0 0
Rank of District inIndia
0 0 0
Urban Hyderabad 881512 288188 (32.69) 746818 (84.72)
Telangana 3171376 639352 (20.16) 2531199 (79.81)
India 78865937 19959592 (25.31) 60488017 (76.7)
Rank of District inState
2 3 4
Rank of District inIndia
37 346 72

TelanganaDistrict FactbookDistrict Factbook™™ Hyderabad District
Infrastructure
Households by Main Source of Drinking Water - Total(2011)
Particulars Hyderabad Telangana IndiaRank ofDistrictin State
Rank ofDistrictin India
Total Number of Households 881512 8420662 246692667 3 30
Tap water from Treated Source(%)
846470 (96.02) 4156318(49.36)
78873488(31.97)
2 60
Tap water from UntreatedSource (%)
15584 (1.77) 2047925(24.32)
28533688(11.57)
10 517
Total Tap (%) 862054 (97.79) 6204243(73.68)
107407176(43.54)
1 42
Covered Well (%) 1108 (0.13) 40351 (0.48) 3895409 (1.58) 10 609
Un-covered Well (%) 913 (0.10) 403956 (4.80) 23289867(9.44)
3 38
Total Well (%) 2021 (0.23) 444307 (5.28) 27185276(11.02)
6 447
Handpump (%) 2620 (0.30) 847860 (10.07) 82599531(33.48)
6 338
Tubewell/Borehole (%) 6139 (0.70) 651346 (7.74) 20916074(8.48)
8 142
Spring (%) 621 (0.07) 10557 (0.13) 1314556 (0.53) 3 140
River/Canal (%) 84 (0.01) 13540 (0.16) 1550549 (0.63) 1 47
Tank/Pond/Lake (%) 1196 (0.14) 7742 (0.09) 2075181 (0.84) 10 584
Other Sources (%) 6777 (0.77) 241067 (2.86) 3644324 (1.48) 5 118
64

67
Hyderabad DistrictTelangana
District FactbookDistrict Factbook™™
Infrastructure
Households by Type of Fuel used for Cooking(2011)
Resi-dence District
Total Numberof
Households
Type of Fuel Used for Cooking
Fire Wood (%) Crop Residue(%)
Cowdung Cake(%)
Total Hyderabad 881512 32523 (3.69) 3591 (0.41) 1247 (0.14)
Telangana 8420662 3171376 (54.37) 115556 (1.37) 19192 (0.23)
India 246692667 120834388(48.98)
21836915 (8.85) 19609328 (7.95)
Rank of District inState
3 9 3 10
Rank of District inIndia
30 247 302 573
Rural Hyderabad - - (-) - (-) - (-)
Telangana 5249286 4129417 (78.67) 88868 (1.69) 13262 (0.25)
India 167826730 104963972(62.54)
20696938(12.33)
18252466(10.88)
Rank of District inState
0 0 0 0
Rank of District inIndia
0 0 0 0
Urban Hyderabad 881512 32523 (3.69) 3591 (0.41) 1247 (0.14)
Telangana 3171376 449067 (14.16) 26688 (0.84) 5930 (0.19)
India 78865937 15870416 (20.12) 1139977 (1.45) 1356862 (1.72)
Rank of District inState
2 10 3 10
Rank of District inIndia
37 286 264 551
Contd.

79
Hyderabad DistrictTelangana
District FactbookDistrict Factbook™™
Industries
Factories, Capital Invested and Persons Employed Value in Rs. Lakh (2009-2010)
Resi-dence
Parti-culars Hyderabad Telangana India
Rank ofDistrictin State
Rank ofDistrictin India
Total Number of Factories 594 6938 158875 4 77
Fixed Capital 199891.79 3806932.57 135152558.41 6 129
Working Capital 110984.06 1862045.99 38773062.57 4 80
Invested Capital 289929.61 5661352.35 193236508.71 6 133
Outstanding Loans 150904.32 1849083.22 66299569.18 5 94
Number of Workers 24741 552225 9157610 5 91
Total Persons Engaged 32380 648945 11722092 5 89
Wages to Workers 20506.34 292702.10 6893810.30 4 79
Total Emoluments 41247.40 580840.43 14698680.86 4 77
Rural Number of Factories 0 3507 59445 0 0
Fixed Capital 0.00 2637184.35 72858090.83 0 0
Working Capital 0.00 1123358.58 15351594.08 0 0
Invested Capital 0.00 3634424.18 100281635.38 0 0
Outstanding Loans 0.00 1120414.85 32491347.03 0 0
Number of Workers 0 169685 3846032 0 0
Total Persons Engaged 0 213582 4784126 0 0
Wages to Workers 0.00 107831.68 2520923.54 0 0
Total Emoluments 0.00 227773.32 5309664.92 0 0
Urban Number of Factories 594 3431 99430 2 42
Fixed Capital 199891.79 1169748.22 62294467.58 3 67
Working Capital 110984.06 738687.41 23421468.50 3 49
Invested Capital 289929.61 2026928.17 92954873.33 3 66
Outstanding Loans 150904.32 728668.37 33808222.15 2 50
Number of Workers 24741 382540 5311579 4 48
Total Persons Engaged 32380 435363 6937967 4 48
Wages to Workers 20506.34 184870.42 4372886.77 4 46
Total Emoluments 41247.40 353067.11 9389015.94 4 50

TelanganaDistrict FactbookDistrict Factbook™™ Hyderabad District
Labour and Workforce
Main Workers(2011)
Residence Workers Sex Hyderabad Telangana IndiaRank ofDistrictin State
Rank ofDistrictin India
Total Total Main Workers Persons 1096081 13806211 362446420 8 76 Male 861130 8570958 273149359 6 67
Female 234951 5235253 89297061 10 105 Cultivators Persons 14693 3016884 95841357 10 595 Male 9034 1951576 73018105 10 594
Female 5659 1065308 22823252 10 540Agricultural Labourers Persons 16751 4644422 86166871 10 508
Male 10946 2098554 55254927 10 511Female 5805 2545868 30911944 10 483
Household Industries Persons 32500 636457 12331464 9 114 Male 21401 227456 7540121 6 102
Female 11099 409001 4791343 9 110Other Workers Persons 1032137 5508448 168106728 2 22
Male 819749 4293372 137336206 2 23Female 212388 1215076 30770522 2 16
Rural Total Main Workers Persons 0 9637866 245749270 0 0 Male 0 5390242 178034713 0 0
Female 0 4247624 67714557 0 0 Cultivators Persons 0 2930201 92737696 0 0 Male 0 1889981 70469851 0 0
Female 0 1040220 22267845 0 0Agricultural Labourers Persons 0 4426855 80958300 0 0
Male 0 1981608 51639066 0 0Female 0 2445247 29319234 0 0
Household Industries Persons 0 437130 7244556 0 0 Male 0 128619 4170353 0 0
Female 0 308511 3074203 0 0Other Workers Persons 0 1843680 64808718 0 0
Male 0 1390034 51755443 0 0Female 0 453646 13053275 0 0
Urban Total Main Workers Persons 1096081 4168345 116697150 2 13 Male 861130 3180716 95114646 2 15
Female 234951 987629 21582504 2 12 Cultivators Persons 14693 86683 3103661 2 30 Male 9034 61595 2548254 2 70
Female 5659 25088 555407 2 13Agricultural Labourers Persons 16751 217567 5208571 9 98
Male 10946 116946 3615861 5 101Female 5805 100621 1592710 9 76
Household Industries Persons 32500 199327 5086908 3 34 Male 21401 98837 3369768 2 36
Female 11099 100490 1717140 4 31Other Workers Persons 1032137 3664768 103298010 2 13
Male 819749 2903338 85580763 2 14Female 212388 761430 17717247 2 13
154
161
Hyderabad DistrictTelangana
District FactbookDistrict Factbook™™
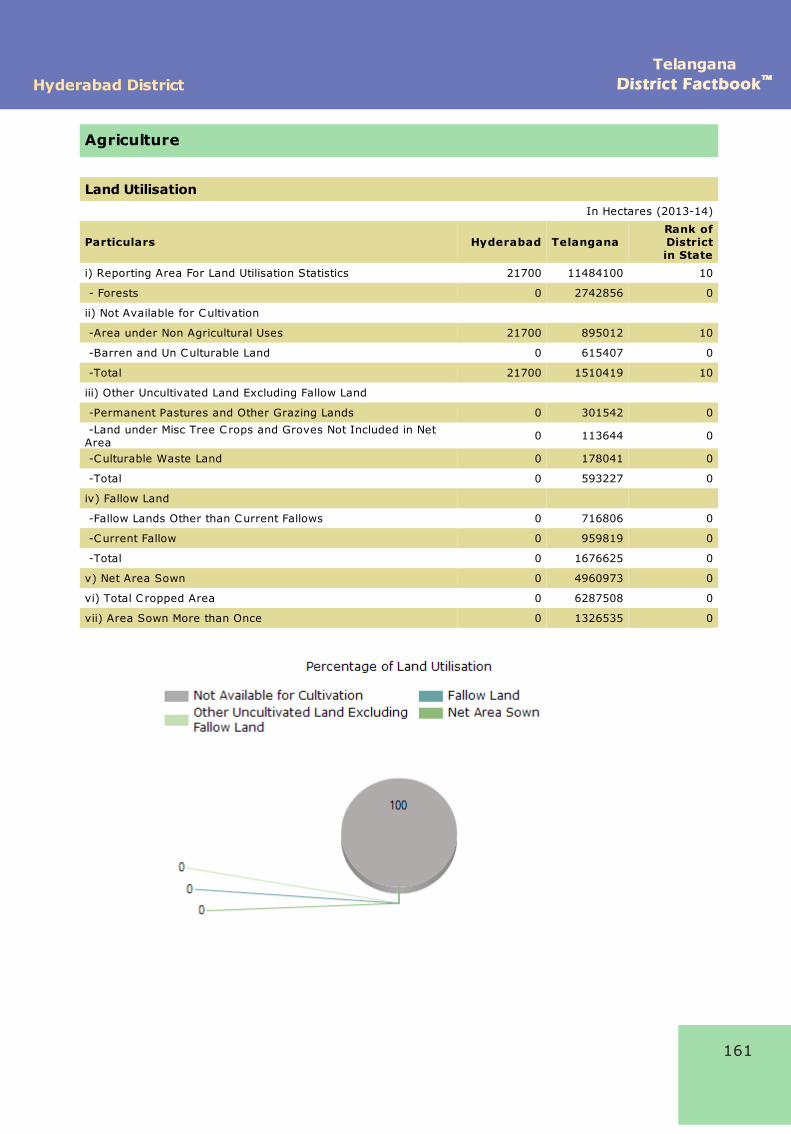
Agriculture
Land UtilisationIn Hectares (2013-14)
Particulars Hyderabad Telangana Rank ofDistrictin State
i) Reporting Area For Land Utilisation Statistics 21700 11484100 10
- Forests 0 2742856 0
ii) Not Available for Cultivation
-Area under Non Agricultural Uses 21700 895012 10
-Barren and Un Culturable Land 0 615407 0
-Total 21700 1510419 10
iii) Other Uncultivated Land Excluding Fallow Land
-Permanent Pastures and Other Grazing Lands 0 301542 0
-Land under Misc Tree Crops and Groves Not Included in NetArea
0 113644 0
-Culturable Waste Land 0 178041 0
-Total 0 593227 0
iv) Fallow Land
-Fallow Lands Other than Current Fallows 0 716806 0
-Current Fallow 0 959819 0
-Total 0 1676625 0
v) Net Area Sown 0 4960973 0
vi) Total C ropped Area 0 6287508 0
vii) Area Sown More than Once 0 1326535 0
TelanganaDistrict FactbookDistrict Factbook™™ Hyderabad District
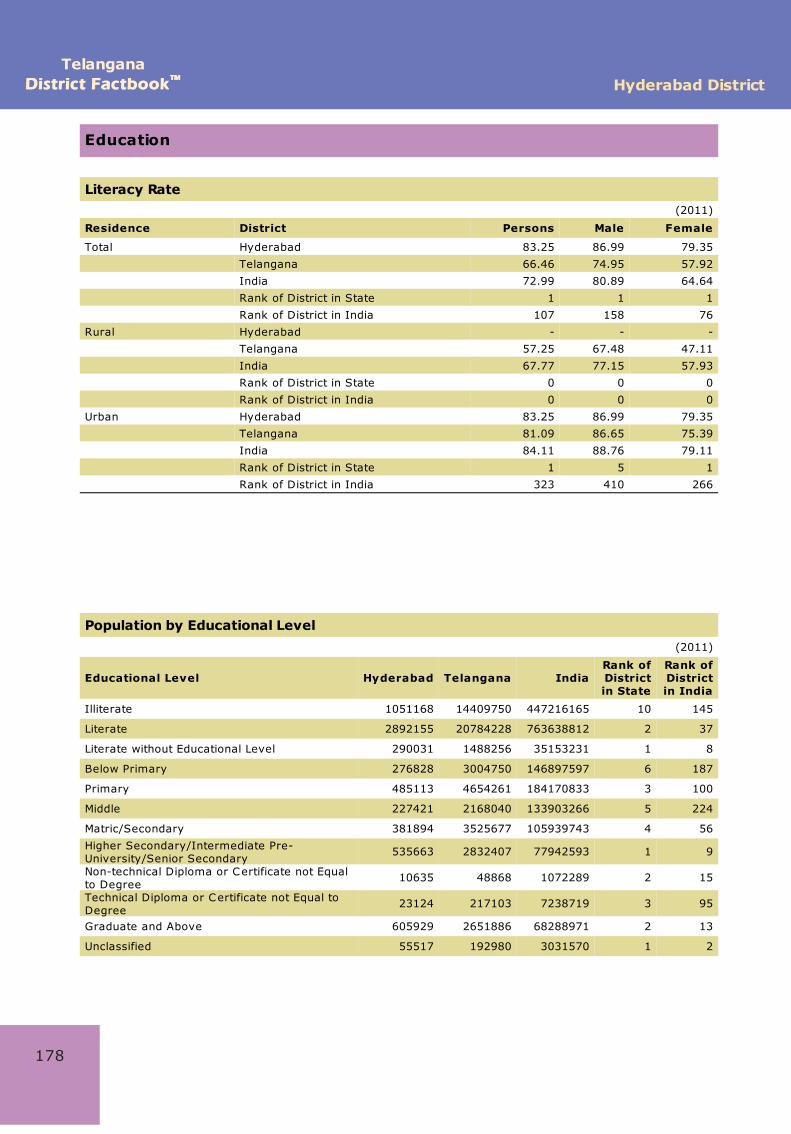
Education
Literacy Rate (2011)
Residence District Persons Male Female
Total Hyderabad 83.25 86.99 79.35
Telangana 66.46 74.95 57.92
India 72.99 80.89 64.64
Rank of District in State 1 1 1
Rank of District in India 107 158 76
Rural Hyderabad - - -
Telangana 57.25 67.48 47.11
India 67.77 77.15 57.93
Rank of District in State 0 0 0
Rank of District in India 0 0 0
Urban Hyderabad 83.25 86.99 79.35
Telangana 81.09 86.65 75.39
India 84.11 88.76 79.11
Rank of District in State 1 5 1
Rank of District in India 323 410 266
Population by Educational Level(2011)
Educational Level Hyderabad Telangana IndiaRank ofDistrictin State
Rank ofDistrictin India
Illiterate 1051168 14409750 447216165 10 145
Literate 2892155 20784228 763638812 2 37
Literate without Educational Level 290031 1488256 35153231 1 8
Below Primary 276828 3004750 146897597 6 187
Primary 485113 4654261 184170833 3 100
Middle 227421 2168040 133903266 5 224
Matric/Secondary 381894 3525677 105939743 4 56
Higher Secondary/Intermediate Pre-University/Senior Secondary
535663 2832407 77942593 1 9
Non-technical Diploma or Certificate not Equalto Degree
10635 48868 1072289 2 15
Technical Diploma or Certificate not Equal toDegree
23124 217103 7238719 3 95
Graduate and Above 605929 2651886 68288971 2 13
Unclassified 55517 192980 3031570 1 2
178

191
Hyderabad DistrictTelangana
District FactbookDistrict Factbook™™
Health
Disabled Population by Type of Disability-Rural (2011)
Type of Disability Sex Hyderabad Telangana IndiaRank ofDistrictin State
Rank ofDistrictin India
Total Number of Disabled Persons Persons 0 621767 18631921 0 0
Male 0 333245 10408168 0 0
Female 0 288522 8223753 0 0
In Seeing Persons 0 109513 3502590 0 0
Male 0 53542 1820936 0 0
Female 0 55971 1681654 0 0
In Hearing Persons 0 80271 3391821 0 0
Male 0 39746 1783386 0 0
Female 0 40525 1608435 0 0
In Speech Persons 0 53235 1303783 0 0
Male 0 29498 734907 0 0
Female 0 23737 568876 0 0
In Movement Persons 0 173136 4035519 0 0
Male 0 104256 2503402 0 0
Female 0 68880 1532117 0 0
Mental Retardation Persons 0 34906 1025560 0 0
Male 0 17995 591408 0 0
Female 0 16911 434152 0 0
Mental Illness Persons 0 12401 495826 0 0
Male 0 6198 283432 0 0
Female 0 6203 212394 0 0
Any Other Persons 0 104859 3292529 0 0
Male 0 54020 1827584 0 0
Female 0 50839 1464945 0 0
Multiple Disability Persons 0 53446 1584293 0 0
Male 0 27990 863113 0 0
Female 0 25456 721180 0 0
205
Hyderabad DistrictTelangana
District FactbookDistrict Factbook™™
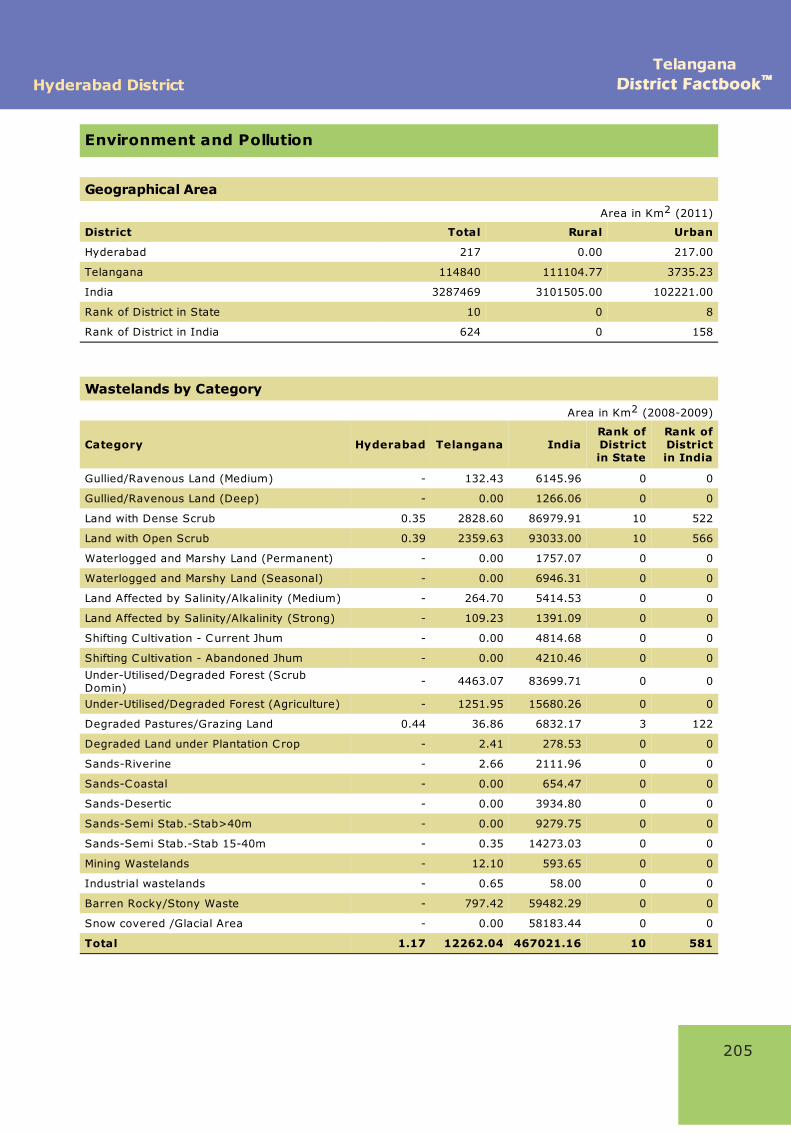
Environment and Pollution
Geographical Area
Area in Km2 (2011)
District Total Rural Urban
Hyderabad 217 0.00 217.00
Telangana 114840 111104.77 3735.23
India 3287469 3101505.00 102221.00
Rank of District in State 10 0 8
Rank of District in India 624 0 158
Wastelands by Category
Area in Km2 (2008-2009)
Category Hyderabad Telangana IndiaRank ofDistrictin State
Rank ofDistrictin India
Gullied/Ravenous Land (Medium) - 132.43 6145.96 0 0
Gullied/Ravenous Land (Deep) - 0.00 1266.06 0 0
Land with Dense Scrub 0.35 2828.60 86979.91 10 522
Land with Open Scrub 0.39 2359.63 93033.00 10 566
Waterlogged and Marshy Land (Permanent) - 0.00 1757.07 0 0
Waterlogged and Marshy Land (Seasonal) - 0.00 6946.31 0 0
Land Affected by Salinity/Alkalinity (Medium) - 264.70 5414.53 0 0
Land Affected by Salinity/Alkalinity (Strong) - 109.23 1391.09 0 0
Shifting Cultivation - Current Jhum - 0.00 4814.68 0 0
Shifting Cultivation - Abandoned Jhum - 0.00 4210.46 0 0
Under-Utilised/Degraded Forest (ScrubDomin)
- 4463.07 83699.71 0 0
Under-Utilised/Degraded Forest (Agriculture) - 1251.95 15680.26 0 0
Degraded Pastures/Grazing Land 0.44 36.86 6832.17 3 122
Degraded Land under Plantation Crop - 2.41 278.53 0 0
Sands-Riverine - 2.66 2111.96 0 0
Sands-Coastal - 0.00 654.47 0 0
Sands-Desertic - 0.00 3934.80 0 0
Sands-Semi Stab.-Stab>40m - 0.00 9279.75 0 0
Sands-Semi Stab.-Stab 15-40m - 0.35 14273.03 0 0
Mining Wastelands - 12.10 593.65 0 0
Industrial wastelands - 0.65 58.00 0 0
Barren Rocky/Stony Waste - 797.42 59482.29 0 0
Snow covered /Glacial Area - 0.00 58183.44 0 0
Total 1.17 12262.04 467021.16 10 581

211
Hyderabad DistrictTelangana
District FactbookDistrict Factbook™™
Housing
Houseless Population(2011)
District Total Rural Urban
Persons Male Female Persons Male Female Persons Male Female
Hyderabad 17903 9487 8416 0 0 0 17903 9487 8416
Telangana 83969 43008 40961 35243 17620 17623 48726 25388 23338
India 1773040 1046871 726169 834692 444450 390242 938348 602421 335927
Rank of District inState
2 2 2 0 0 0 1 1 2
Rank of District inIndia
11 11 7 0 0 0 6 8 5
Standard of Living Index(2007-2008)
DistrictLow (%) High (%)
Total Rural Total Rural
Hyderabad 0.1 - 73.2 -
Telangana 9.5 12.5 19.9 7.2
Rank of District in State 10 0 1 0
Rank of District in India 584 0 9 0
Note: Data Pertain to Undivided Andhra Pradesh.
TelanganaDistrict FactbookDistrict Factbook™™ Hyderabad District
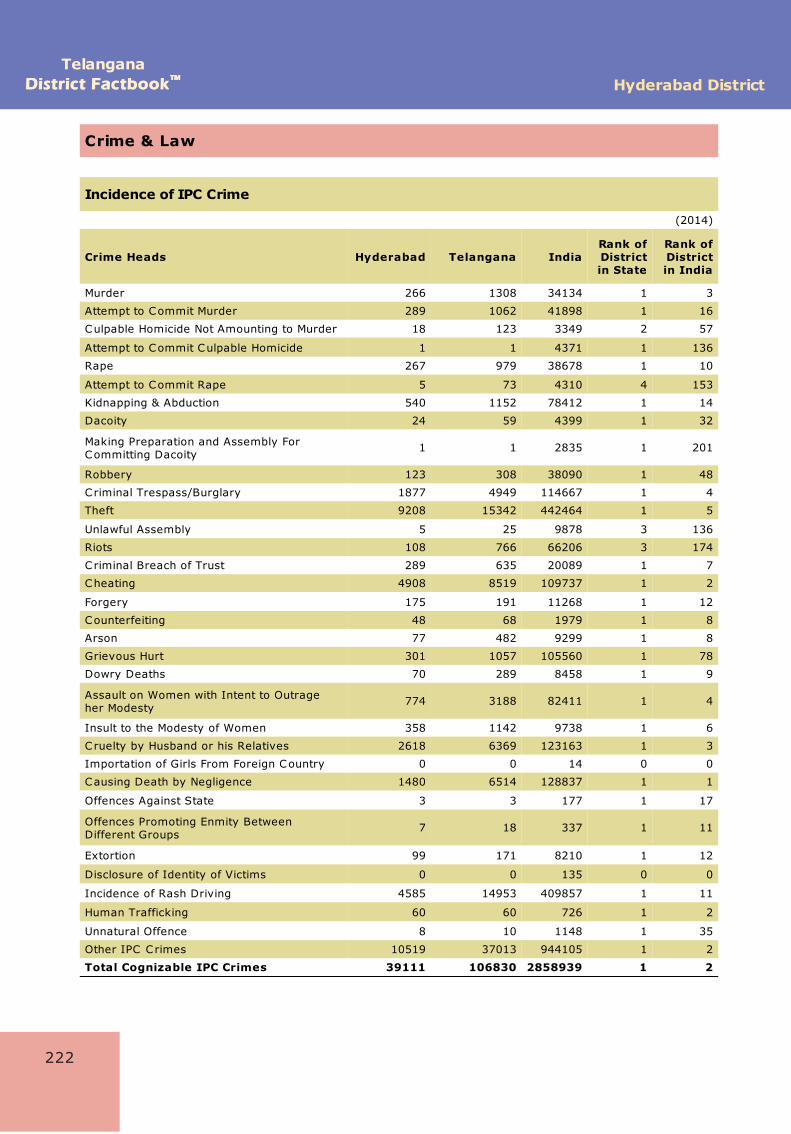
Crime & Law
Incidence of IPC Crime
(2014)
Crime Heads Hyderabad Telangana IndiaRank ofDistrictin State
Rank ofDistrictin India
Murder 266 1308 34134 1 3
Attempt to Commit Murder 289 1062 41898 1 16
Culpable Homicide Not Amounting to Murder 18 123 3349 2 57
Attempt to Commit Culpable Homicide 1 1 4371 1 136
Rape 267 979 38678 1 10
Attempt to Commit Rape 5 73 4310 4 153
Kidnapping & Abduction 540 1152 78412 1 14
Dacoity 24 59 4399 1 32
Making Preparation and Assembly ForCommitting Dacoity
1 1 2835 1 201
Robbery 123 308 38090 1 48
Criminal Trespass/Burglary 1877 4949 114667 1 4
Theft 9208 15342 442464 1 5
Unlawful Assembly 5 25 9878 3 136
Riots 108 766 66206 3 174
Criminal Breach of Trust 289 635 20089 1 7
Cheating 4908 8519 109737 1 2
Forgery 175 191 11268 1 12
Counterfeiting 48 68 1979 1 8
Arson 77 482 9299 1 8
Grievous Hurt 301 1057 105560 1 78
Dowry Deaths 70 289 8458 1 9
Assault on Women with Intent to Outrageher Modesty
774 3188 82411 1 4
Insult to the Modesty of Women 358 1142 9738 1 6
Cruelty by Husband or his Relatives 2618 6369 123163 1 3
Importation of Girls From Foreign Country 0 0 14 0 0
Causing Death by Negligence 1480 6514 128837 1 1
Offences Against State 3 3 177 1 17
Offences Promoting Enmity BetweenDifferent Groups
7 18 337 1 11
Extortion 99 171 8210 1 12
Disclosure of Identity of Victims 0 0 135 0 0
Incidence of Rash Driving 4585 14953 409857 1 11
Human Trafficking 60 60 726 1 2
Unnatural Offence 8 10 1148 1 35
Other IPC Crimes 10519 37013 944105 1 2
Total Cognizable IPC Crimes 39111 106830 2858939 1 2
222
229
Hyderabad DistrictTelangana
District FactbookDistrict Factbook™™
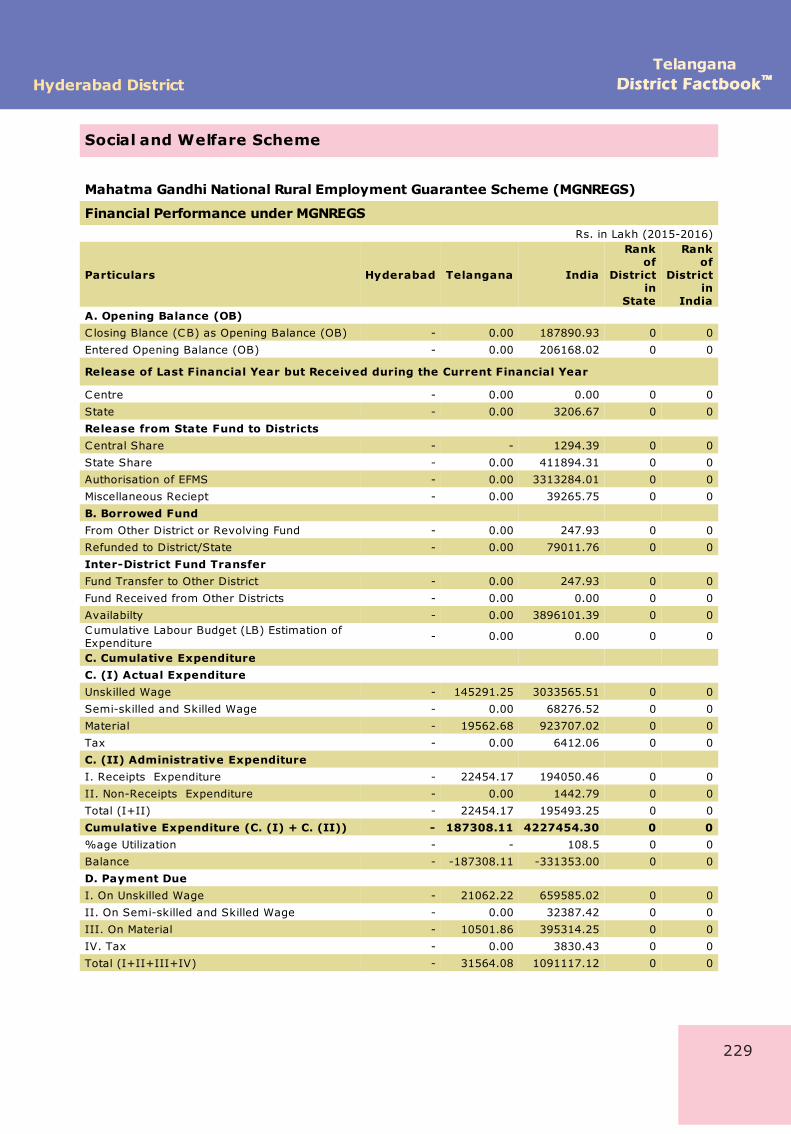
Social and Welfare Scheme
Mahatma Gandhi National Rural Employment Guarantee Scheme (MGNREGS)
Financial Performance under MGNREGSRs. in Lakh (2015-2016)
Particulars Hyderabad Telangana India
Rankof
Districtin
State
Rankof
Districtin
IndiaA. Opening Balance (OB)C losing Blance (CB) as Opening Balance (OB) - 0.00 187890.93 0 0
Entered Opening Balance (OB) - 0.00 206168.02 0 0
Release of Last Financial Year but Received during the Current Financial Year
Centre - 0.00 0.00 0 0
State - 0.00 3206.67 0 0
Release from State Fund to DistrictsCentral Share - - 1294.39 0 0
State Share - 0.00 411894.31 0 0
Authorisation of EFMS - 0.00 3313284.01 0 0
Miscellaneous Reciept - 0.00 39265.75 0 0
B. Borrowed Fund From Other District or Revolving Fund - 0.00 247.93 0 0
Refunded to District/State - 0.00 79011.76 0 0
Inter-District Fund TransferFund Transfer to Other District - 0.00 247.93 0 0
Fund Received from Other Districts - 0.00 0.00 0 0
Availabilty - 0.00 3896101.39 0 0Cumulative Labour Budget (LB) Estimation ofExpenditure
- 0.00 0.00 0 0
C. Cumulative Expenditure C. (I) Actual ExpenditureUnskilled Wage - 145291.25 3033565.51 0 0
Semi-skilled and Skilled Wage - 0.00 68276.52 0 0
Material - 19562.68 923707.02 0 0
Tax - 0.00 6412.06 0 0
C. (II) Administrative Expenditure I. Receipts Expenditure - 22454.17 194050.46 0 0
II. Non-Receipts Expenditure - 0.00 1442.79 0 0
Total (I+II) - 22454.17 195493.25 0 0
Cumulative Expenditure (C. (I) + C. (II)) - 187308.11 4227454.30 0 0%age Utilization - - 108.5 0 0
Balance - -187308.11 -331353.00 0 0
D. Payment DueI. On Unskilled Wage - 21062.22 659585.02 0 0
II. On Semi-skilled and Skilled Wage - 0.00 32387.42 0 0
III. On Material - 10501.86 395314.25 0 0
IV. Tax - 0.00 3830.43 0 0
Total (I+II+III+IV) - 31564.08 1091117.12 0 0
i
TelanganaHyderabad District District Factbook™
Get Complete BookAt Datanet India eBooks Store
www.datanetindia-ebooks.comor go directly at
http://www.datanetindia-ebooks.com/District_Factbook/Telangana/Hyderabad


