19
KNIGHTFRANK.CO.IN JANUARY TO JUNE 2016 RESIDENTIAL & OFFICE HYDERABAD
| Date post: | 23-Jan-2018 |
| Category: |
Real Estate |
| Upload: | knight-frank-india |
| View: | 267 times |
| Download: | 2 times |

KNIGHTFRANK.CO.IN
JANUARY TO JUNE 2016
RESIDENTIAL & OFFICE
HYDERABAD

KNIGHTFRANK.CO.IN
RESIDENTIALRIDING HIGH ON STABILITY
NEW LAUNCHES PICKING UP
HOME SALES CONTINUE TO GROW
KNIGHTFRANK.CO.IN
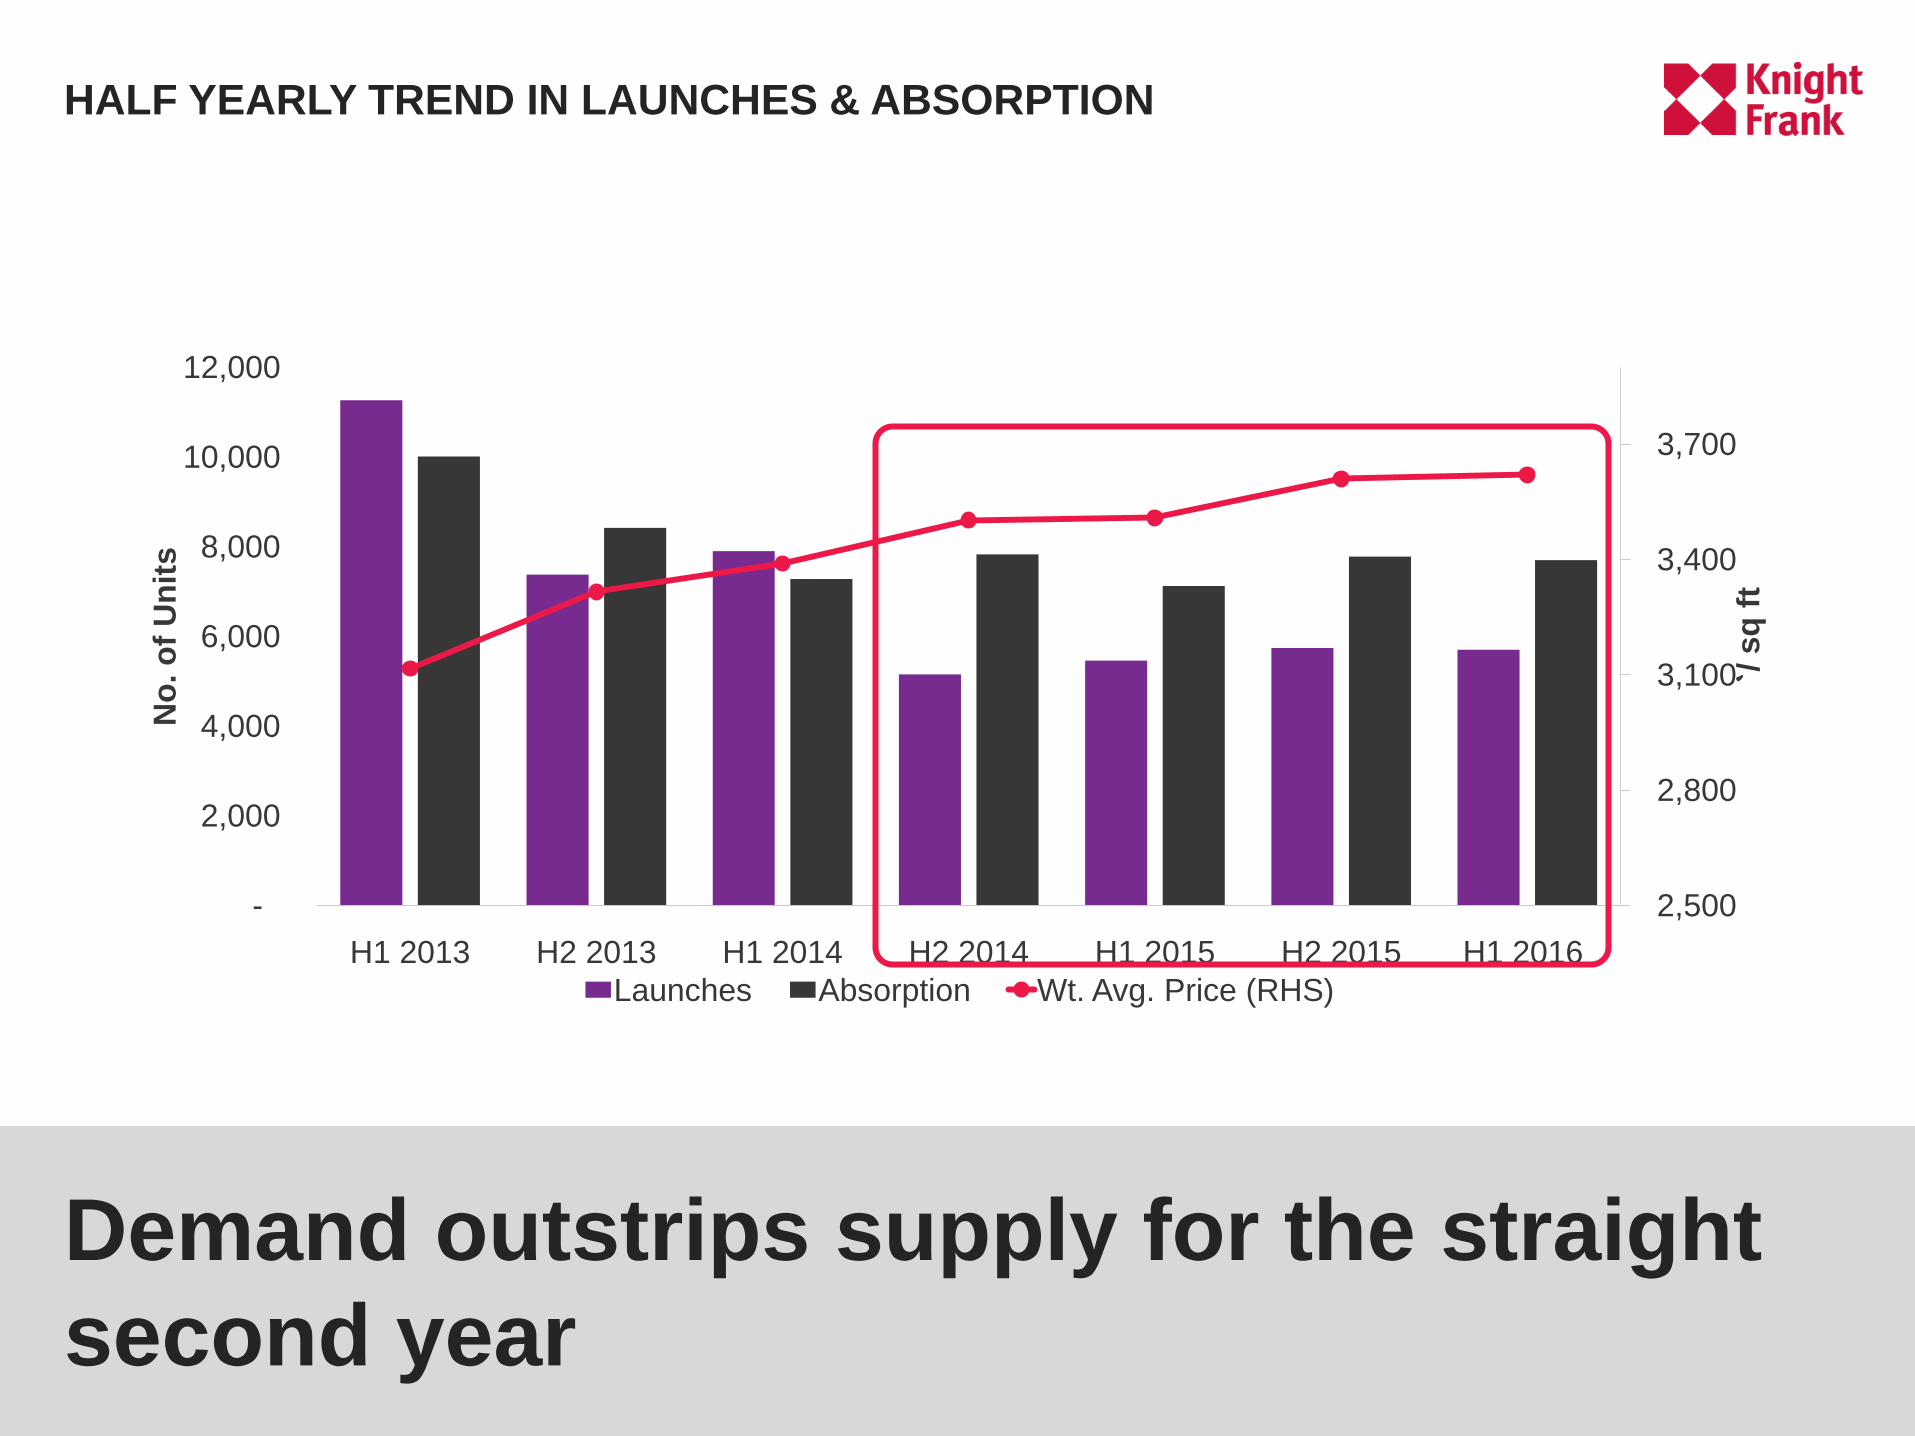
Demand outstrips supply for the straight
second year
HALF YEARLY TREND IN LAUNCHES & ABSORPTION
2,500
2,800
3,100
3,400
3,700
-
2,000
4,000
6,000
8,000
10,000
12,000
H1 2013 H2 2013 H1 2014 H2 2014 H1 2015 H2 2015 H1 2016
`/ s
q f
t
No
. o
f U
nit
s
Launches Absorption Wt. Avg. Price (RHS)

KNIGHTFRANK.CO.IN
Inventory pressure eases off : unsold
inventory is at a five year low
HALF YEARLY TREND IN UNSOLD INVENTORY & QTS
37,0
29
38,2
86
37,8
61
33,5
17
29,4
77
8
8 9
9
8
7
7
8
8
8
8
8
9
9
9
-
5,000
10,000
15,000
20,000
25,000
30,000
35,000
40,000
45,000
H1 2012 H1 2013 H1 2014 H1 2015 H1 2016
Unsold Inventory QTS

KNIGHTFRANK.CO.IN
West Hyderabad- continues to be the
preferred market for new launches
7%
4% 8%
8%
74%
12%
1% 6
%
15%
66%
2%
2% 6%
3%
87%
0%
10%
20%
30%
40%
50%
60%
70%
80%
90%
100%
Central East North South West
H1 2014 H1 2015 H1 2016
HALF YEARLY ZONAL TREND IN NEW LAUNCHES

KNIGHTFRANK.CO.IN
West Hyderabad leads in absorption
11%
12
%
12
%
5%
59
%
11
%
12
%
13
%
7%
57
%
9%
7%
11%
9%
65
%
0%
10%
20%
30%
40%
50%
60%
70%
Central East North South West
H1 2014 H1 2015 H1 2016
HALF YEARLY ZONAL TREND IN ABSORPTION

KNIGHTFRANK.CO.IN
Premium markets hold
steady in sales
Volume: high number of
project launches leads to
inventory pile-up

KNIGHTFRANK.CO.IN
At 23%, Y-o-Y growth in launches puts
additional pressure on premium segment
-
200
400
600
800
2012 H1 2013 H1 2014 H1 2015 H1 2016 H1
New Launches Sales
HALF YEARLY TREND IN NEW LAUNCHES & SALES

KNIGHTFRANK.CO.IN
The premium segment is carrying almost 3 years of
inventory, up from less than 1 year in 2013
-
1,000
2,000
3,000
4,000
5,000
6,000
7,000
-
1.0
2.0
3.0
4.0
5.0
6.0
7.0
8.0
9.0
10.0
H1 2012 H1 2013 H1 2014 H1 2015 H1 2016
No
. o
f q
uart
ers
Weighted Avg Price(Premium Markets) Hyderabad QTS Premium market QTS
WEIGHTED AVERAGE PRICE TREND IN PREMIUM MARKET

KNIGHTFRANK.CO.IN
Central zone healthiest market
9
10
11
12
13
14
15
16
17
18
19
20
0 5 10 15 20 25 30
Age
of
unsold
invento
ry in q
uart
ers
QTS*
MICROMARKET HEALTH
EAST
SOUTH
NORTH
WEST
CENTRAL

KNIGHTFRANK.CO.IN
KEY TAKEAWAYS
STEADY DEMAND AND REDUCING UNSOLD
INVENTORY COUPLED WITH SALES
PRESSURE HAS ENCOURAGED
DEVELOPERS TO INCREASE SUPPLY
UNSOLD INVENTORY AT A 5 YEAR LOW
KNIGHTFRANK.CO.IN
OFFICE MARKET
AT A NEW HIGH
KNIGHTFRANK.CO.IN
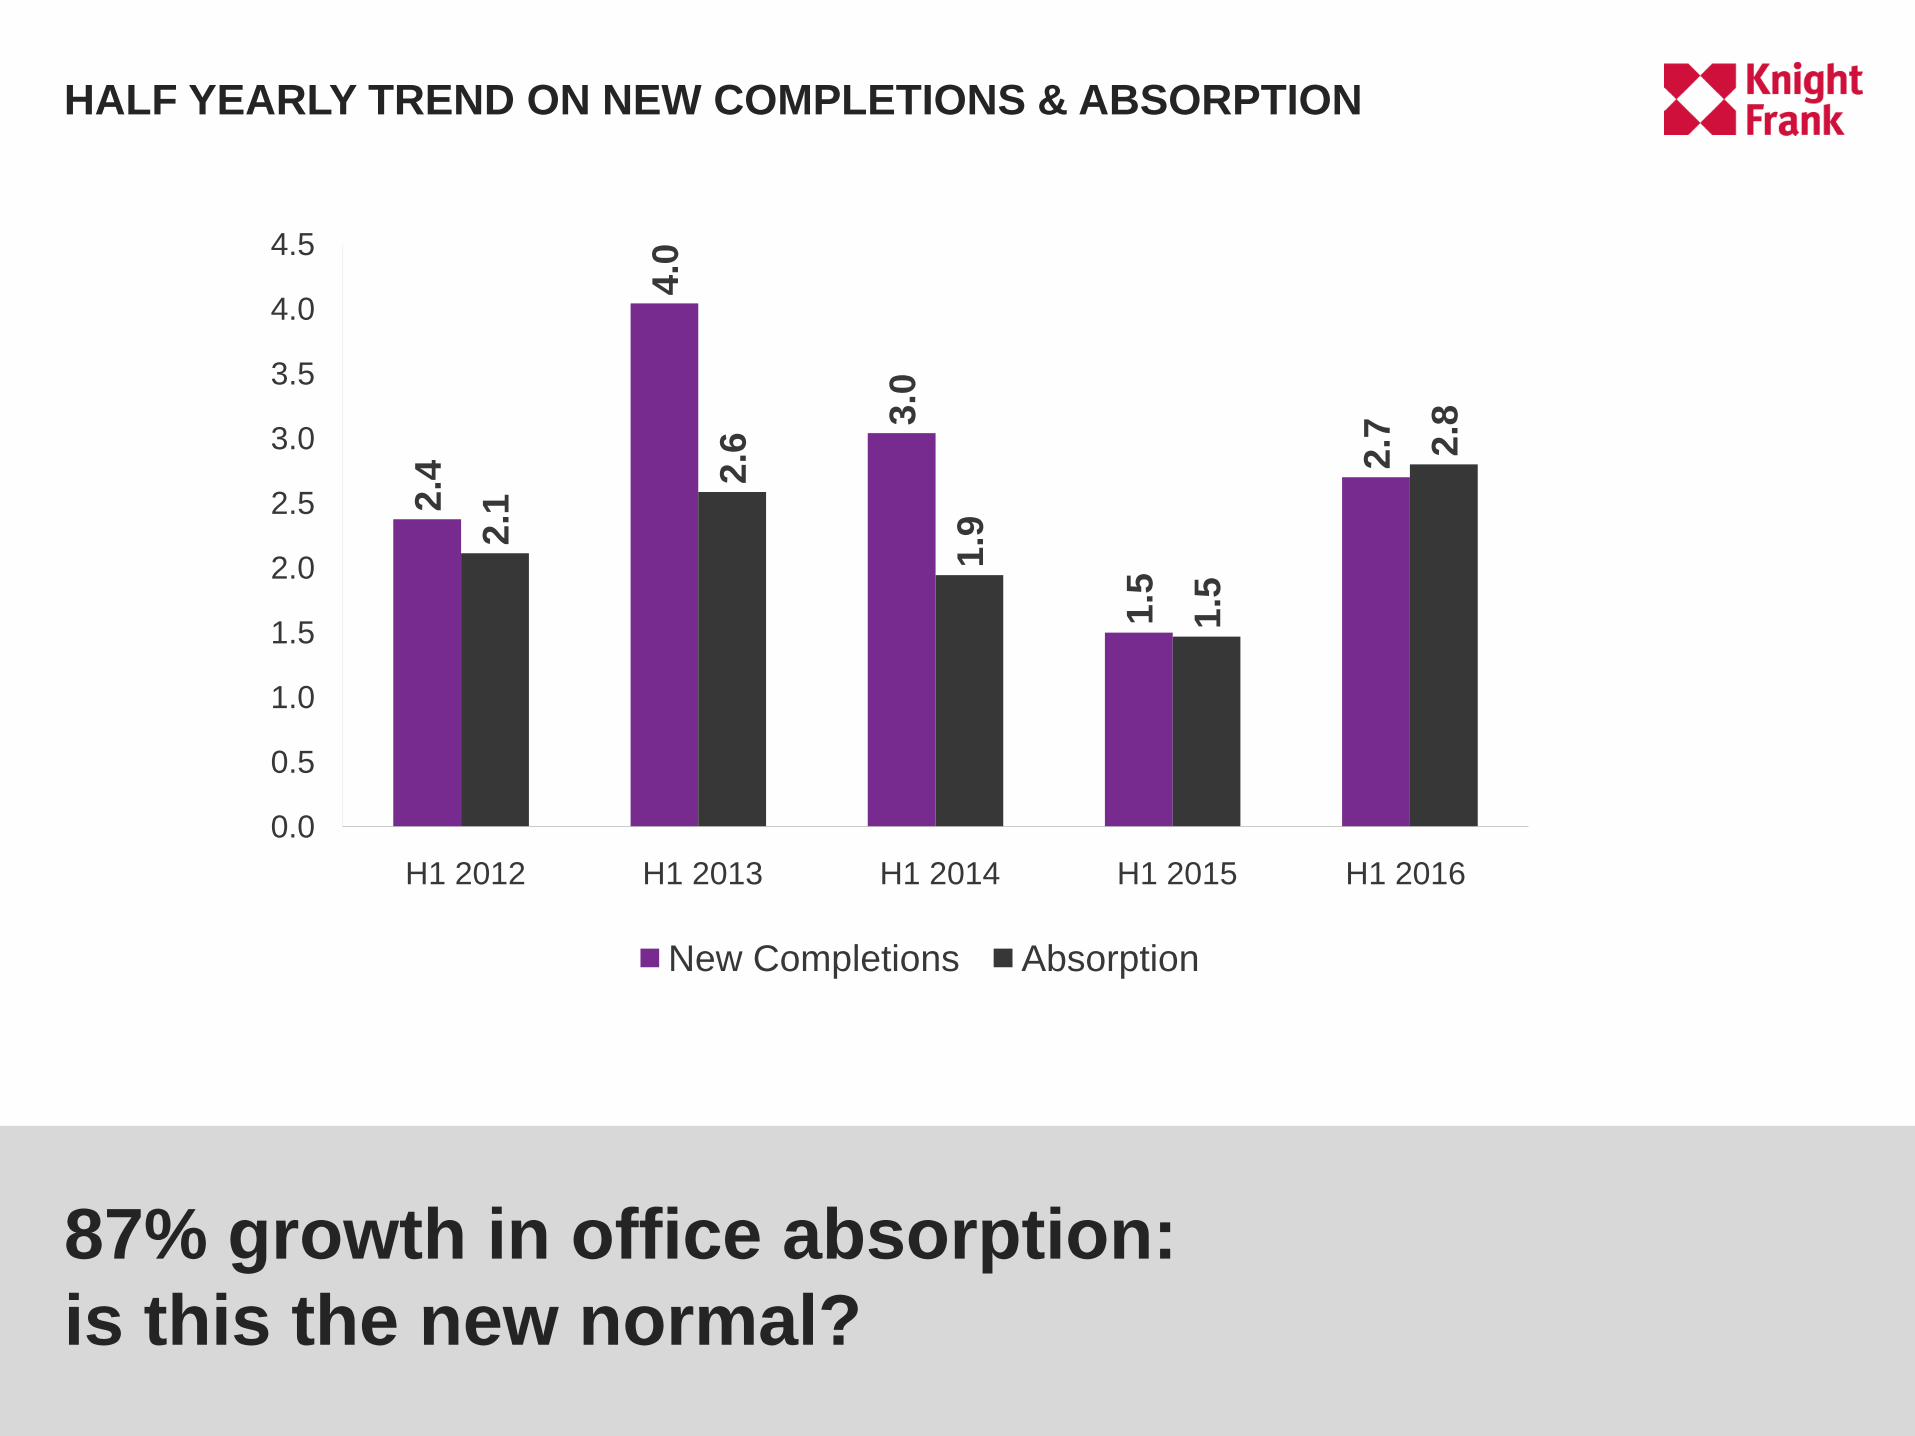
87% growth in office absorption:
is this the new normal?
2.4
4.0
3.0
1.5
2.7
2.1
2.6
1.9
1.5
2.8
0.0
0.5
1.0
1.5
2.0
2.5
3.0
3.5
4.0
4.5
H1 2012 H1 2013 H1 2014 H1 2015 H1 2016
New Completions Absorption
HALF YEARLY TREND ON NEW COMPLETIONS & ABSORPTION
KNIGHTFRANK.CO.IN
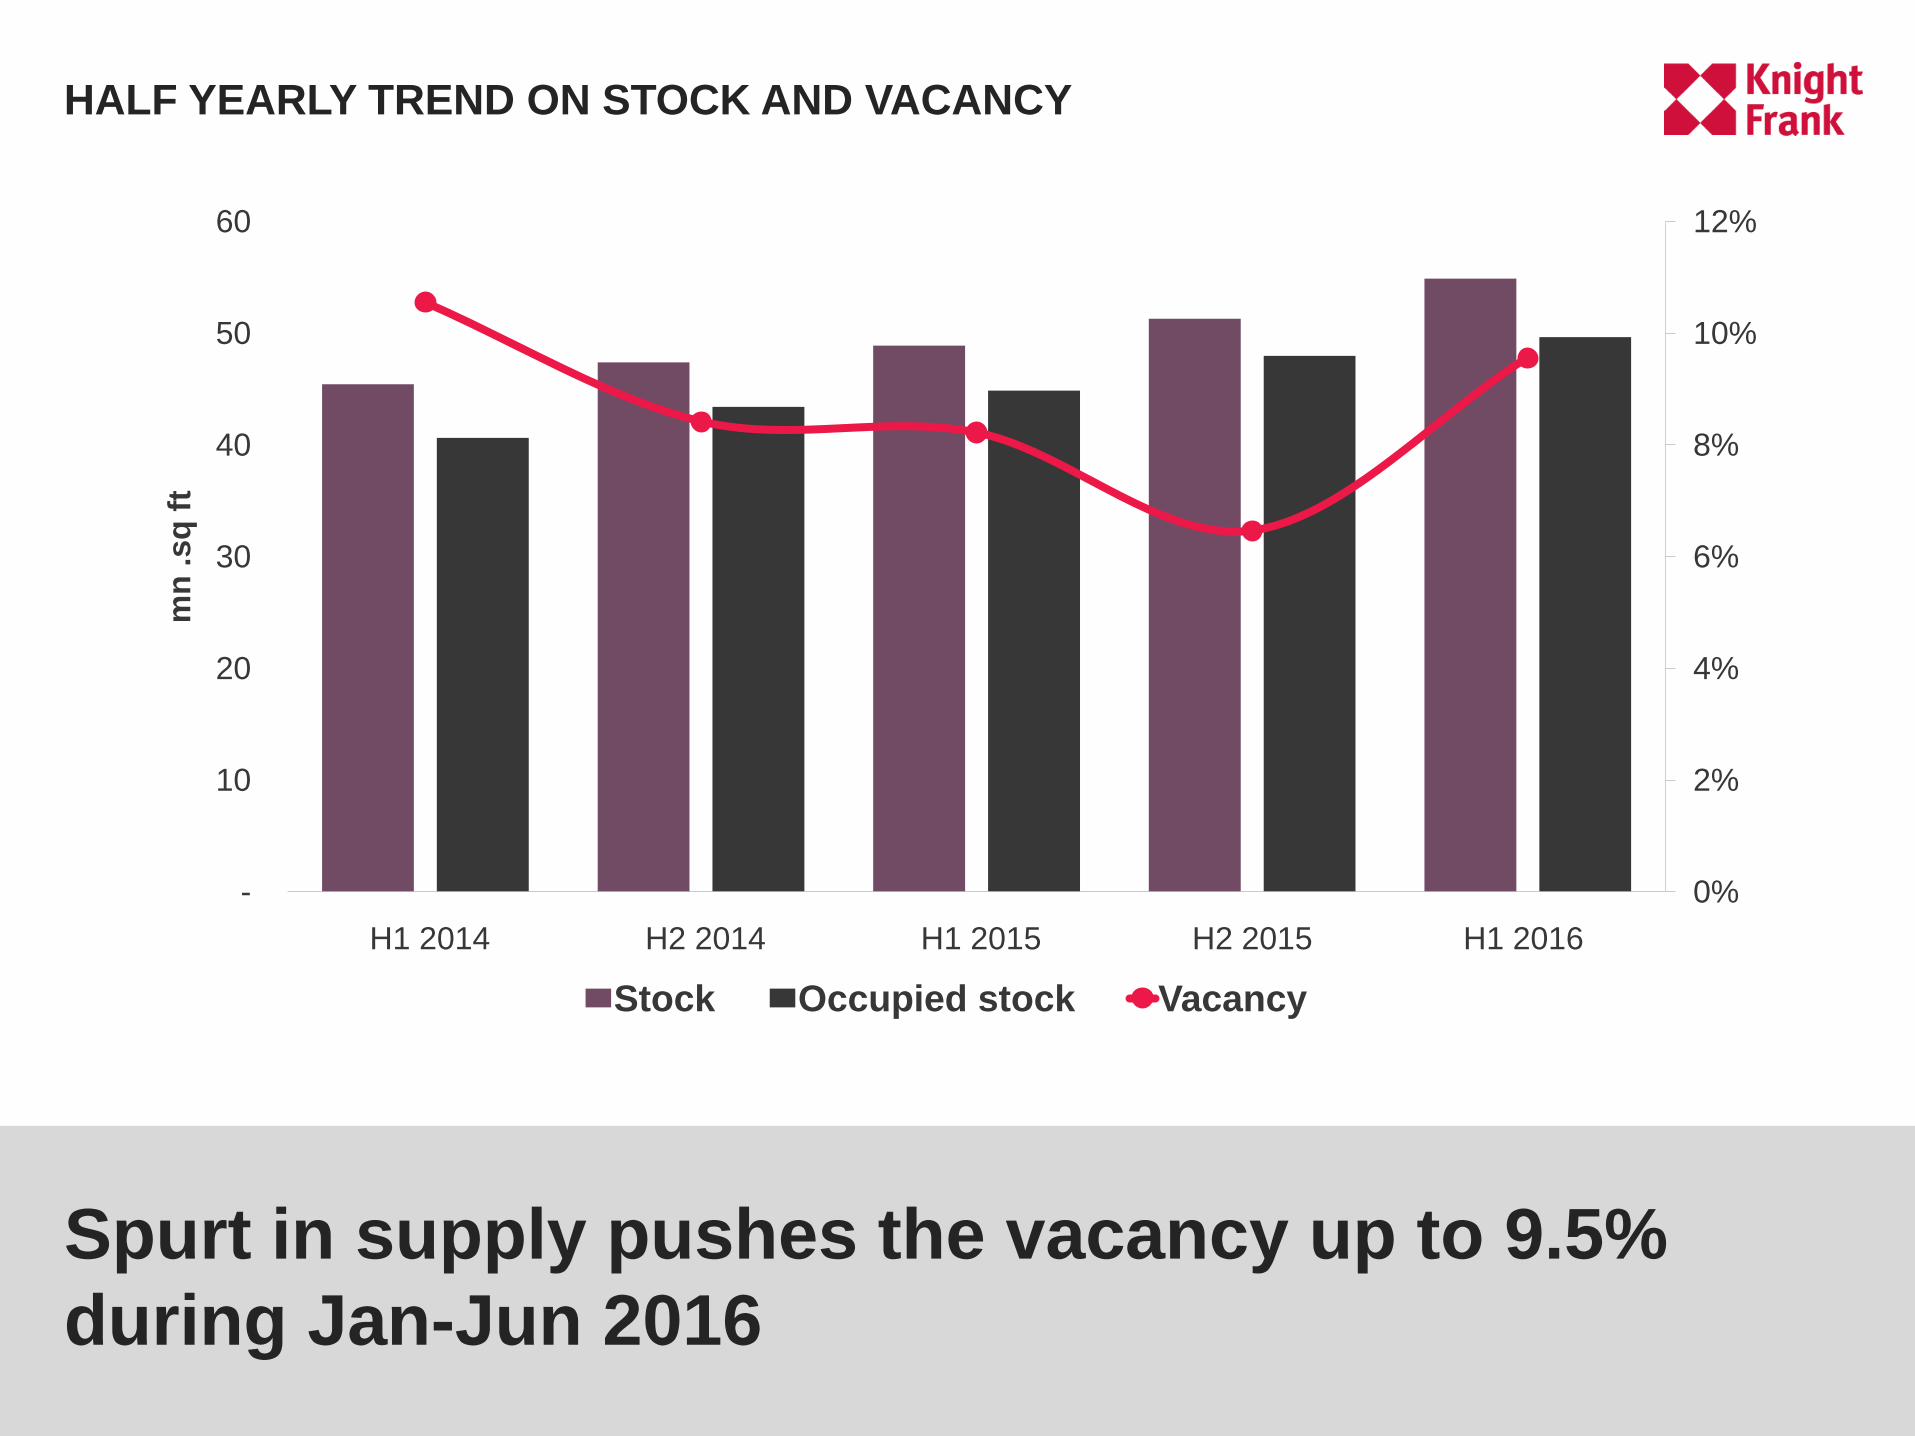
Spurt in supply pushes the vacancy up to 9.5%
during Jan-Jun 2016
0%
2%
4%
6%
8%
10%
12%
-
10
20
30
40
50
60
H1 2014 H2 2014 H1 2015 H2 2015 H1 2016
mn
.sq
ft
Stock Occupied stock Vacancy
HALF YEARLY TREND ON STOCK AND VACANCY
KNIGHTFRANK.CO.IN
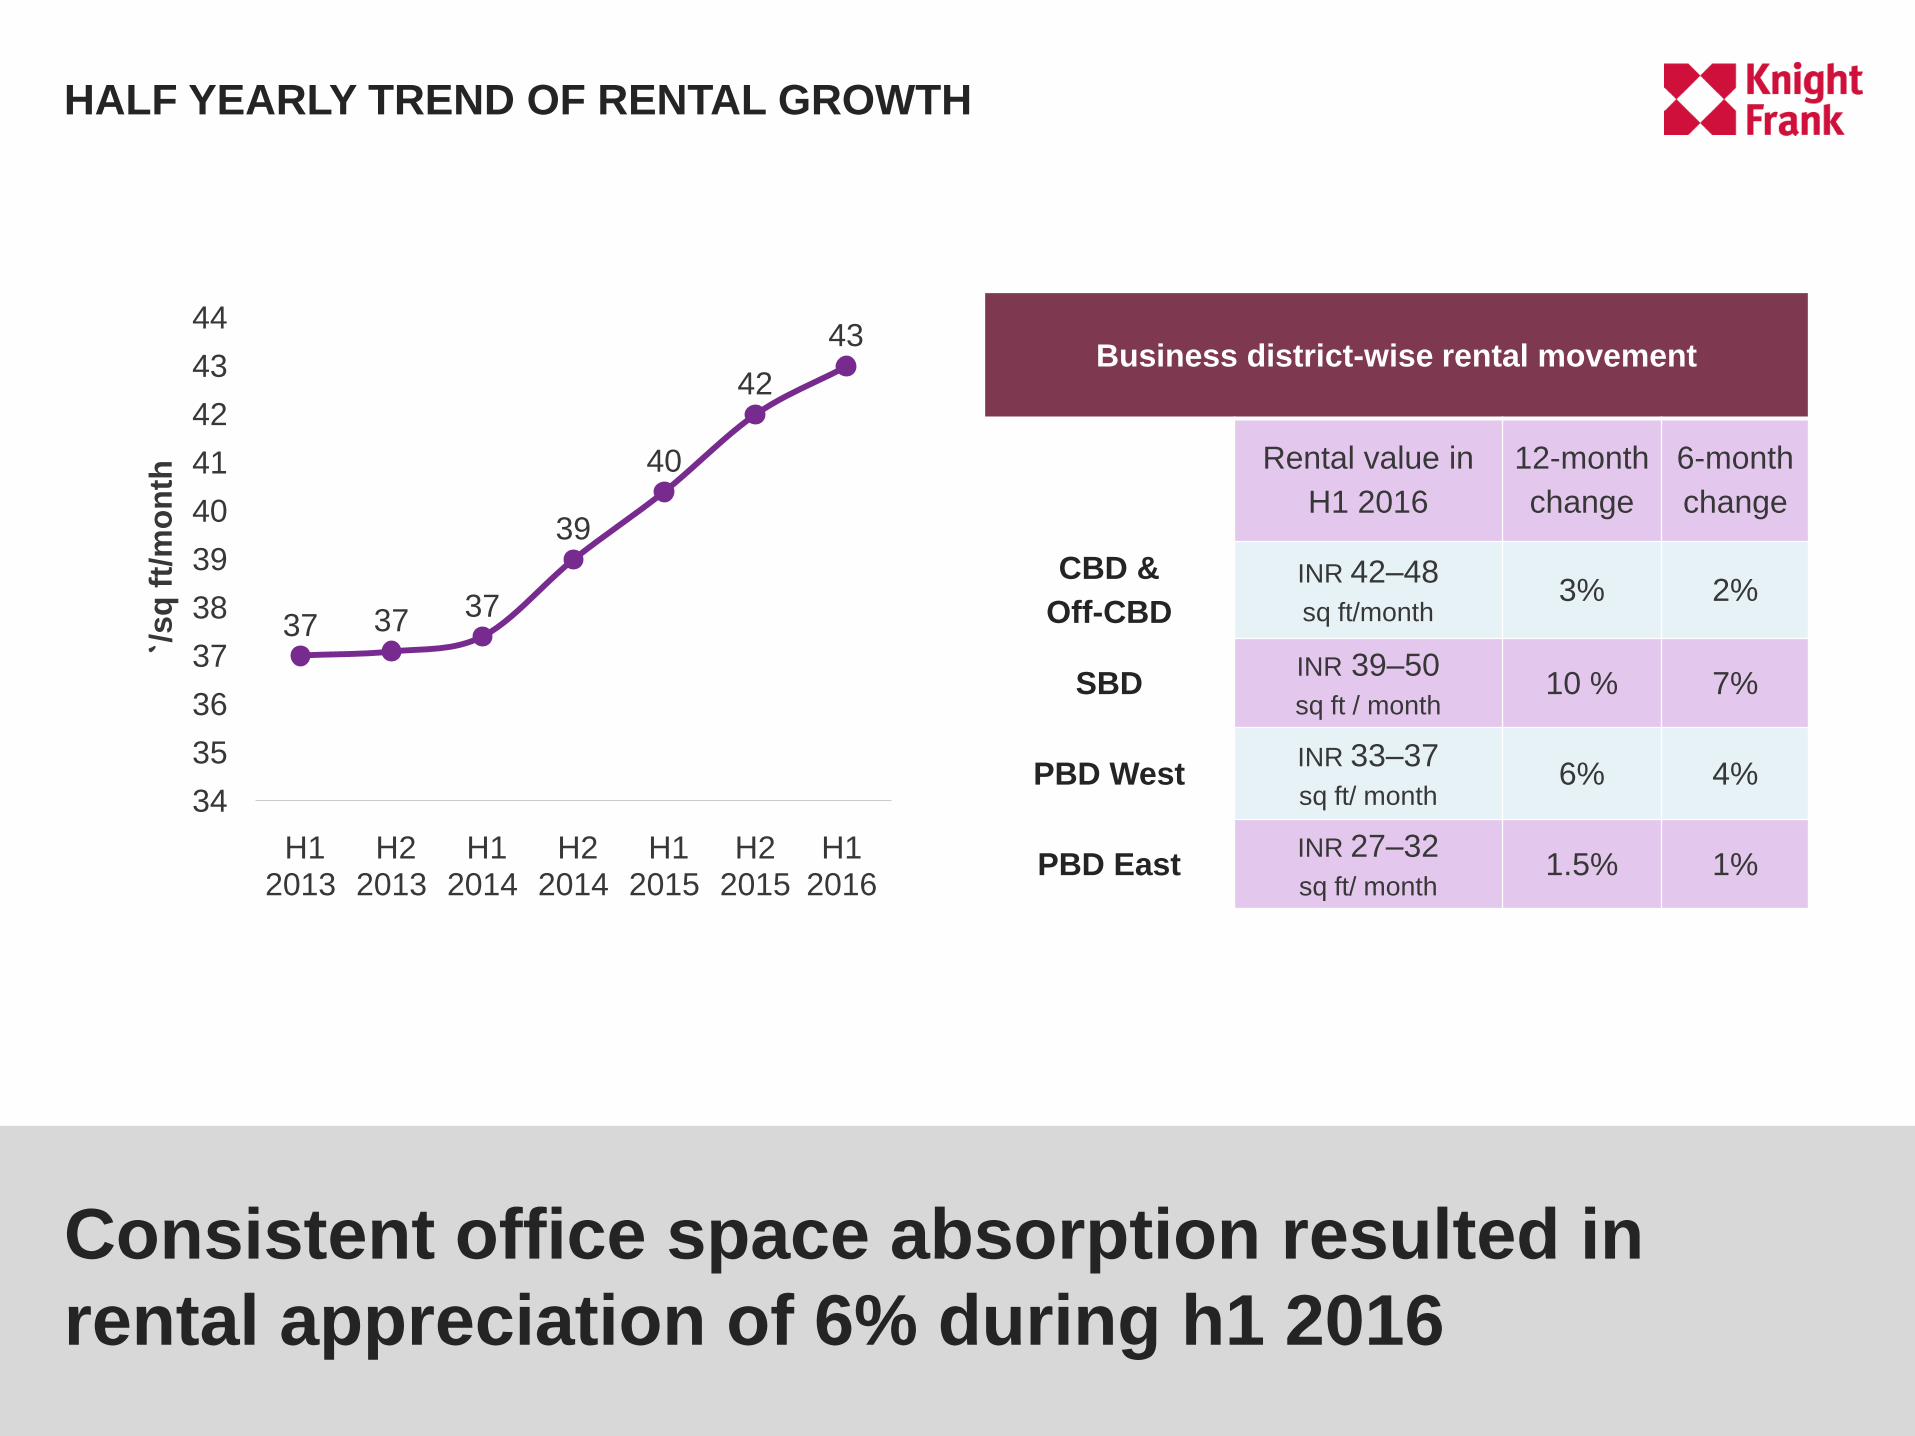
Consistent office space absorption resulted in
rental appreciation of 6% during h1 2016
37 37 37
39
40
42
43
34
35
36
37
38
39
40
41
42
43
44
H1 2013
H2 2013
H1 2014
H2 2014
H1 2015
H2 2015
H1 2016
`/sq
ft/
mo
nth
Business district-wise rental movement
Rental value in
H1 2016
12-month
change
6-month
change
CBD &
Off-CBD
INR 42–48
sq ft/month3% 2%
SBDINR 39–50
sq ft / month10 % 7%
PBD WestINR 33–37
sq ft/ month6% 4%
PBD EastINR 27–32
sq ft/ month1.5% 1%
HALF YEARLY TREND OF RENTAL GROWTH

KNIGHTFRANK.CO.IN
IT/ITeS sector outshines other industries
1%
49
%
2%
48
%
9%
35
%
17
%
39
%
9%
61
%
10
%
20
%
0%
10%
20%
30%
40%
50%
60%
70%
BFSI IT/ITeS Manufacturing Other Services sectors
H1 2015 H2 2015 H1 2016
SECTOR WISE ABSOPRTION

KNIGHTFRANK.CO.IN
SBD increases its share in the total absorption:
Madhapur, Kondapur continue to attract occupiers
0%
10%
20%
30%
40%
50%
60%
70%
CBD & Off CBD SBD PBD West PBD East
H1 2015 H1 2016
BUSINESS DISTRICT WISE ABSOPRTION

KNIGHTFRANK.CO.IN
KEY TAKEAWAYS
OFFICE SPACE TRANSACTION VOLUME
WITNESSED A 91% GROWTH DURING H1 2016
SBD AND PBD WEST THE PREFERRED OFFICE
MARKETS


