Hydraulic Delineation of possible Groundwater Pollution from an industrial River Manfred Koch, Fachgebiet Geohydraulik und Ingenieurhydrologie, Universität GhK Kassel, Kurt-Wolters-Strasse 3, D-34109 Kassel E-mail: [email protected]ABSTRACT In most, but the driest regions in the world, the dominant rivers are effluent; i.e., are gaining water from the ambient groundwater aquifer during most seasons. However, there are instances where large volumes of wastewater discharge from an industrial plant create an `unnatural' industrial river, shifting the natural balance between the river stream and the surrounding groundwater aquifer in such a way that sections of the river may become an influent or loosing stream during long dry seasons, thus creating the potential for aquifer contamination. This appears to be the case for the industrial Fenholloway river in Taylor county, Florida, which is loaded from the outfall of a paper mill plant. To investigate the interaction between this river and the ambient groundwater aquifer and to delineate a possibly contaminated corridor within the aquifer, a field investigation, followed by flow- and particle tracking modeling was carried out. The hydraulic interaction of the stream and the groundwater under seasonal recharge variations is simulated by the USGS MODFLOW model. Lateral ‘stagnant’ points of the hydraulic gradient computed through transient simulations are connected to delineate the maximal contamination corridor along both sides of the stream. As a second approach, particle tracking simulations based on a Green's function analytical solution of the 2-D transient groundwater flow equation is used. Both time-varying Dirichlet boundary conditions and recharge forcing conditions are employed to compute the dynamic movements of water particles out of the river and along its banks. The modeling results show that lateral migration of contaminants close to the industrial discharge point might be up to several thousands of feet in cross-river direction, during times when the normally gaining (effluent) stream becomes sectionally a loosing (influent) stream. The last situation occurs especially during multiyear-long time spans with less-than-normal precipitation which, for Florida, happens during times between major El Niño occurrences; i.e. during La Niña years. 1. INTRODUCTION The Fenholloway river is a small industrial river located in Taylor county in Northwest Florida (Fig. 1). The river has an average flow discharge of 87.1 ft 3 /s. Over the last twenty years strong seasonal variations have been measured at the USGS river gauge station `AT FOLEY' US 19 bridge (Fig. 2). The Buckeye Florida cellulose factory (named henceforth the `B'-plant) is located three hundred feet upstream of this gauge station. Buckeye Florida has been discharging approximately 50 million gallons/day (= 77.5 ft 3 /s of wastewater into the river since operations began in 1954. This amount is approximately equal to the quantity of water Buckeye Florida pumps from underground sources by means of eight production wells (Fig. 2). Additional water entering the hydrological system from timber decomposition, appears to be essentially lost through evaporation. The discharge water from the Buckeye Florida paper mill factory contains various organic constituents (Watts and Riotte, 1991) that are formed during the cellulose manufacturing process. The organic
Transcript
Hydraulic Delineation of possible Groundwater Pollution
from an industrial River
Manfred Koch, Fachgebiet Geohydraulik und Ingenieurhydrologie, Universität GhK Kassel,
In most, but the driest regions in the world, the dominant rivers are effluent; i.e., are gaining water from theambient groundwater aquifer during most seasons. However, there are instances where large volumes of wastewaterdischarge from an industrial plant create an ̀ unnatural' industrial river, shifting the natural balance between the riverstream and the surrounding groundwater aquifer in such a way that sections of the river may become an influent orloosing stream during long dry seasons, thus creating the potential for aquifer contamination. This appears to bethe case for the industrial Fenholloway river in Taylor county, Florida, which is loaded from the outfall of a papermill plant. To investigate the interaction between this river and the ambient groundwater aquifer and to delineatea possibly contaminated corridor within the aquifer, a field investigation, followed by flow- and particle trackingmodeling was carried out. The hydraulic interaction of the stream and the groundwater under seasonal rechargevariations is simulated by the USGS MODFLOW model. Lateral ‘stagnant’ points of the hydraulic gradientcomputed through transient simulations are connected to delineate the maximal contamination corridor along bothsides of the stream. As a second approach, particle tracking simulations based on a Green's function analyticalsolution of the 2-D transient groundwater flow equation is used. Both time-varying Dirichlet boundary conditionsand recharge forcing conditions are employed to compute the dynamic movements of water particles out of the riverand along its banks. The modeling results show that lateral migration of contaminants close to the industrialdischarge point might be up to several thousands of feet in cross-river direction, during times when the normallygaining (effluent) stream becomes sectionally a loosing (influent) stream. The last situation occurs especially duringmultiyear-long time spans with less-than-normal precipitation which, for Florida, happens during times betweenmajor El Niño occurrences; i.e. during La Niña years.
1. INTRODUCTION
The Fenholloway river is a small industrial river located in Taylor county in Northwest Florida (Fig.
1). The river has an average flow discharge of 87.1 ft3 /s. Over the last twenty years strong seasonalvariations have been measured at the USGS river gauge station ̀ AT FOLEY' US 19 bridge (Fig. 2). TheBuckeye Florida cellulose factory (named henceforth the ̀ B'-plant) is located three hundred feet upstreamof this gauge station. Buckeye Florida has been discharging approximately 50 million gallons/day (= 77.5ft3/s of wastewater into the river since operations began in 1954. This amount is approximately equalto the quantity of water Buckeye Florida pumps from underground sources by means of eight productionwells (Fig. 2). Additional water entering the hydrological system from timber decomposition, appearsto be essentially lost through evaporation.
The discharge water from the Buckeye Florida paper mill factory contains various organic constituents(Watts and Riotte, 1991) that are formed during the cellulose manufacturing process. The organic
Fig. 1: Florida map with inlet map of study region, Taylor county
Fig. 2: Study region with Fenholloway river and location of ̀ B'-paper mill. Also depicted are the three
U SGS stream gauge stations, the major monitor wells used and the pumping wells of the plant.
constituents isolated from the lignin residue of Fenholloway river samples (the `Fenextract') can beclassified into purgeable, extractable and NPTOX (Non-Purgeable Total Organic Halogen) organiccompounds. In spite of Watt's and Riotte's detailed chemical analysis of the Fenextract, in general, andof NPTOX, in particular, their exact chemical composition is far from being clarified, being often at thechemical detection limit.
In the summer of 1989, several residents living along the Fenholloway river complained about bad tasteof their well water. A water quality survey of numerous private wells was undertaken by the TaylorCounty and the Florida Health Departments. Although most of the wells showed negative results, someof the wells were positive, i.e., had trace amounts of unidentified organic compounds. In the wake ofthese results, an additional long-term investigation of the flow and the water quality of the Fenhollowayriver/aquifer system was carried out over a period of about one year by FDEP that provided (1) adetailed analysis of the chemistry of the Fenextract (see above); (2) evidence that some wells containtrace amounts of NPTOX, and (3) some geohydrological information about the river/aquifer system.Nevertheless , in spite of these activities, a definite answer as to whether the Fenholloway industrialriver water poses a health risk for adjacent residential water wells, could not be given.
Because of the present uncertainty of possible groundwater contamination due to the Buckeye effluentinto the Fenholloway river, and in order to prevent future health risks from polluted residential waterwells within a certain corridor along the river, FDEP is presently considering connecting thoseresidents to public water supply lines. However, such a plan requires an ‘engineering-approach‘delineation of the possibly contaminated aquifer stripe along the Fenholloway river that can beestablished under various hydraulic and hydrological conditions as they (1) may have occurred in thepast, (2) may be prevalent in the present and (3) may be imminent in the future under various best- and`worst-case' scenarios.
The major goal of the present study is to define the boundaries or ‘water lines‘ of this possibly pollutedcorridor along the Fenholloway river. This goal will be achieved by means of 2D and 3D steady-state andtransient analytical and numerical simulations of the coupled river/groundwater aquifer system. Variousconceptual models of this system that may lead to hypothetical hydraulic conditions which could resultin aquifer contamination from polluted river water were tested using hydrological and meteorologicaldata from both historical records and recent data obtained from a five-month groundwater and streamsurvey of the study region. Estimates of the possible spatial extensions of a contaminant plume emanatingfrom the river over the short and the long-term are established by these models.
2. ANALYSIS OF HYDROLOGICAL DATA
2.1 1994- hydrological field data
As a major part of data gathering , FDEP conducted a comprehensive hydrological field study ofthe Fenholloway river/aquifer system in the first six months of 1994. Beginning in January, 1994, overa timespan of about two months, about 40 surficial monitor wells were drilled in the study area. Inaddition, five stream gauges were installed along sections of the Fenholloway river, particularly at themouths of some ephemeral springs and small tributaries. The data from these monitor wells wascomplemented by wells maintained by Buckeye Inc., by the Suwannee River Water Management District,and by the USGS.
Groundwater and river elevations at these monitor wells and stream gauges were sampled at intervals ofapproximately two weeks between January and June, 1994. In addition to the hydraulic data, chemicaldata for the concentrations of NaCl and of the Total Dissolved Solids (TDS) was gathered at some riverlocations and monitor wells. As a typical representative of the 5-month study period, contour plots forthe piezometric heads (= the water table, since only the upper unconfined aquifer is considered in thepresent study) are shown for 5/25/1994 in Fig. 3. Similar plots are obtained for other sampling dates,with the common feature of a deep drawdown cone of the Buckeye well field in the east, which extends
Fig. 3: Observed water table contours (in ft) for 5/25/1994. The cross-sections are shown in Fig.5
Fig. 4: Modeled water table contours (in ft) using the steady-state hydraulic flow model RESSQ
westwards close to the wastewater discharge ponds. Here the piezometric isolines begin to open underthe influence of the westwardly directed regional groundwater flow, i.e. one observes a typical stagnationpoint behavior.
Based on these observations, both the 2D analytical steady-state hydraulic flow model RESSQ (Javandel
et al., 1984) and the steady-state version of the MODFLOW model (McDonald and Harbaugh, 1984)were used to obtain a basic understanding of the regional groundwater flow pattern and of the influenceof the Buckeye production wells on the latter. Fig. 4 illustrates the modeled water table contours
Fig. 5: Water table elevations along N-S cross-sections A-B (see Fig. 3) for various 1994-dates.
of the calibrated RESSQ-model which has been modified to incorporate a Kozeny correction factor forthe partially penetrating pumping wells of the paper mill (cf. Koch et al., 1994, for details). Thesemodels provide preliminary estimates of the average hydraulic conductivity of the aquifer (K = 250
ft/day) , of capture zones, and of the critical stagnation points of the well-field.
With regard to the objectives of the present study, namely showing evidence for a hydraulic gradientfrom the river towards the aquifer, the inclination of the piezometric isolines downstream of the Buckeyedischarge point as they cross the Fenholloway river indicates that the latter is a gaining (effluent) streamover the total duration of the field survey. This is seen more clearly from a plot of the spatial variationsof the water table elevations along two north-south cross-sections (Fig. 5) . One observes the typicalV-shape for the water table elevation, as is to be expected for a gaining river.
The reason for this unexpected behavior of the observed hydraulic stream-aquifer is that, unlike fornormal climatic years in northern Florida, which usually have wet-seasonal precipitation in January andFebruary, followed by drier months March, April and May, the spring of 1994 was unusually wet.Numerous days of extreme rainfall were recorded in March and April that even caused flooding ofseveral low-lying plains and swamp-areas in the vicinity of the Fenholloway river. Under thesecircumstances the Fenholloway behaves as a `normal' effluent stream.
2.2 Historical hydrological data
As the spring -1994 hydrological field data did not hint of a situation of river-groundwaterinteraction that may lead to seepage of river water into the aquifer, and given that the complaints ofpossible well water contamination had occurred in 1989, a detailed analysis of historical hydrologicaldata was endeavored to better understand the river-aquifer system. The dataset analyzed comprises a)groundwater elevation; b) streamflow and gage heights; c) precipitation and d) El Niño sea-surfacetemperatures.
a) Groundwater elevation data
Fig. 6 depicts monthly groundwater table fluctuations at three wells in the vicinity of the Fenhollowayriver,(see Fig. 1, for location) over the 32-year timespan 1960-1992 . Well USGS-444 is of particularinterest here, since it is the furthest downstream of the B-plant's wastewater effluent point and is lesslikely to be affected by changes of the B-mill's pumping rate due to operational fluctuations of the
factory's production. One noticeable feature of Fig. 6 is the persistent drop of the groundwater tableduring the 1966-1969 and 1987-1991 drought years. For the last drought period---at the end of which theinstrumental study of Watts and Ricotte (1991) was conducted---one observes a rather monotonicdecrease of the piezometric heads of up to five feet in all wells, especially in the USGS-444 well. A linear time-series regression analysis (Koch et al, 1994) indicates, moreover, a pronounced constantdecrease of the groundwater table by several feet over the 30-years period 1962-1992. i.e. there isevidence that over the long-term the aquifer is slowly depleted by the huge amount of groundwaterpumping of the B-factory.
Fig. 6: 1960-1992 monthly groundwater table fluctuations in three wells.
b) Streamflow and gage data
Daily gauge heights and, particularly, inferred streamflow discharge rates measured over the period1964 to 1994 at the USGS river gauge stations ‘NEAR FOLEY‘, ‘AT FOLEY‘ and ‘NEAR PERRY‘give insight into the water budget of the Fenholloway river/aquifer system (Fig. 7). These plotsillustrate convincingly that during most of the lengthy dry episode 1988-1990 the Fenholloway river hasbeen completely dry at the upstream gauge station ‘NEAR FOLEY‘. Therefore, all of the streamflow atthe station ‘AT FOLEY‘, downstream of the effluent point, is made of wastewater itself. Though, evenduring these dry periods, the Fenholloway river could eventually have gained water at thefar-downstream station ‘NEAR PERRY‘, it may be expected that the upper portion of the stream section,closer to the station ‘AT FOLEY‘, lost water into the aquifer. Thus, the river became influentintermittently and could have posed a potential risk for aquifer pollution. This is the ̀ dry-season' scenarioand will be quantified later by the numerical models. The average monthly river gauge heights at thestation ‘AT FOLEY‘ (Fig. 8) illustrate also the various major dry periods of the last 20 years.
Fig. 7: 1974-1992 monthly-averaged, daily discharge rates of the Fenholloway river at USGS
gauge stations `NEAR FOLEY', `AT FOLEY' and `NEAR PERRY' and the mill‘s constant
discharge .
Fig. 8: 1974-1992 monthly river gauge heights at station ‘AT FOLEY'.
c) Precipitation data
Daily precipitation measured at the meteorological station PERRY for the last 30 years wasprocessed by various integration-, trend- and filtering techniques, in order to extract the most salientseasonal and multiyear variations and trends of the rainfall in the region. Since groundwater tableelevations are ultimately related to the effective recharge through rainfall, the analysis of the historicalrainfall variations provides a basis of a proposed `worst-case' drought scenario. The cumulative yearlyprecipitation rates shown in Fig. 9 (left panel) illustrate some cyclic recurrences of wet and dry years,with several dominant multiyear-periods of anomalously low precipitation, such as 1960-1963;1966-1968; 1971-1973 and the most extreme period 1986-1990. Koch et al. (1994) and Sun et al. (1997)
performed both univariate and multivariate time-series analyses of the various data (cf. Maidment,
1992). Autocorrelations of groundwater table elevations and precipitation, as well as cross-correlationsbetween these two variables were calculated. The latter hint of a significant lag-period of thegroundwater table response to variations of the precipitation.
d) El Niño sea-surface data
While originally recognized as a local phenomenon in the eastern part of the Southern Pacific, El
Niño Southern Oscillation (ENSO) effects are increasingly being made responsible for anomalousweather-pattern on a global scale, such as extremely high monsoon rains on the Indian subcontinent andabove-average rainfall on the Australian continent and in some western regions of the North Americancontinent (cf. Ropelewski and Halpert, 1986; 1987). On the other hand, some El Niño episodes (like the1982-1983 event) appear to have produced opposite weather patterns; i.e., drought conditions. This hasalso been the case for parts of the continental U.S. during the 1986-1987 El Niño (Kahya and Dracup,
1993). It can be conjectured that the anomalously low precipitation --- with a subsequent decrease of thestreamflow rate which because of its integrating effect is a better hydrological parameter for quantifyinglong-term climatic variations --- in northern Florida during 1986-1989 is related to this El Niño episodeor, more exactly, to its alternating sister, La Niña.
The El Niño phenomenon is a direct manifestation of ocean-atmosphere coupling. It is usually quantifiedby various ENSO-indices, such as (1) the difference in the normalized atmospheric pressure betweenTahiti measured in the eastern or western section of the Southern Pacific. Fig.9 (right panel) shows thevariations of the average monthly SST, off the coast of Peru, between 1974 and 1993. Anomalously highSST with a cycle-period of 3-5 years---which appears to be also the dominant period of historical ElNiño recurrences ---are clearly visible, with the 1982-1983 episode distinguishing itself by its strength.
Fig. 9: Left panel: 1957-1994 cumulative yearly precipitation at station PERRY; Right panel: 1974-
1993 monthly anomalies of the sea surface temperature in the Pacific Ocean, off the coast of
Peru.
3. HYDRAULIC MODELING OF THE STUDY SITE
3.1 MODFLOW modeling of stream-aquifer interaction: ‘Static water lines‘
3.1.1 Model concept and setup
Using a transient version of the well-known MODFLOW model (McDonald and Harbaugh, 1984)a pre-specified lowering of the groundwater table due to a recharge deficit and drainage during anextended dry season, as it has been observed at some of the wells close to the river during the longdrought period of 1988-1991 (see Figs. 6 to 8), is simulated. We call this the 'static ' model for thedelineation of the extreme ‘static water-lines‘ which can be considered as the outer hydraulic barrier on
both sides of the stream, beyond which loaded river water seeping into the aquifer cannot flow.Therefore, the 'static' model attempts to mimic observed hydraulic conditions that are prone to infiltrationof river water into the surrounding aquifer. It should be clear that it is the variation of the natural rechargeof the aquifer through rainfall that is the physical trigger mechanism for the groundwater tablefluctuations. A deficit of precipitation and increased evaporation during a long dry season is responsiblefor a groundwater table drop, with a minimum river gauge still sustained through the paper mill‘s higheffluent of ~ 50 million gallons per day. This, of course, would not be the case for a natural stream whichis in permanent equilibrium with the surrounding aquifer and where the stream-bed might be drying outcompletely during an extreme drought, as is often the case for the section of the Fenholloway riverupstream of the paper mill’s discharge point.
Prior to the transient simulation of the historical data records, steady-state MODFLOW calibrationmodels, employing the ‘river package‘ , were run using the spring-1994 field data as calibration target(see previous section). Further details on these models and the setup of following transient models, i.e.grid, calibration parameters and boundary conditions used are presented in Koch (1994) and Sun et al.
(1997).
3.1.2 Model results: Delineation of ‘static water lines‘
Numerous calibration simulations were executed, during which the hydraulic conductivity, the riverconductance and the storativity are varied in the model over a reasonable range of values. Among thesemodel cases we show results of a particular simulation model, with the most important hydraulicparameters as indicated: Hydraulic conductivity K=90-120 ft/day, river conductance kr=20000 ft2/day,thickness of the upper (unconfined) aquifer b=1000 ft, and storativity (specific yield) S=0.1. Other modelsare discussed in Koch et al. (1994).
The panels of Fig. 10 show three snapshots of the simulated water table (hydraulic heads) during aprolonged drought season. Starting from an initially effluent stream-aquifer system (at time zero) the slowdrop of the groundwater table elevation owing to the water drainage out of the aquifer is clearlyrecognized by following one particular isoline and watch it moving upstream (in eastern direction) astime increases. At simulation day 240 (top panel), the curvature of these isolines in the very closevicinity of the Fenholloway river is such, that lines orthogonal to the piezometric isolines (which byDarcy's law are the groundwater flow lines) are starting to be directed downstream (westward) andslightly away from the river, i.e., the latter is becoming influent, i.e., it becomes a loosing stream.Therefore, lateral migration of river contaminants into the aquifer becomes now possible.
Two envelopes on each side of the river that define the hydraulic boundaries (barriers) which river watercannot surpass are constructed by connecting those points on a head isoline where it curves toward theriver again. These envelopes are what is called here the ‘static water-lines‘ and they define the mostextreme corridors of possible Fenholloway river/aquifer pollution. The water lines move furtheroutward, away from the river, as the water table continues to drop with increasing length of the dryseason. After 448 days, when the groundwater table in the vicinity of the paper mill’s discharge pointhas dropped by approximately 3 feet, as it was observed during the 1999-1990 drought season in US-well#444--- and, as Figs. 6 to 8 show, also several times before in the period 1960-1990 during long dryseasons---, the water lines have extended to about 1.5 to 2 miles in northern and southern direction fromthe river. After 800 days of dry-season simulation, the groundwater table has decreased further (to ratherunrealistic low values that have not been obseved in the 30-year time span of interest) and the waterlines extend to about 2.5 miles beyond the river. A sensitivity analysis (Koch, 1994; Sun et al. 1997)
shows that the value of the specific yield S has the most tremendous effects on the location of the waterlines, with the latter slightly moving closer to the river with increasing S.
3.2 Green‘s function particle tracking of stream-aquifer infiltration: ‘Dynamic water lines‘
3.2.1 Conceptual and theoretical approach
As a second, more conservative approach of delineating a maximally possible contaminated aquifercorridor along the Fenholloway river, particle tracking simulations with varying water sources andforcing conditions are conducted to compute the dynamic movements of water particles out and alongthe river banks. For this purpose, a new semianalytical hydraulic stream-aquifer model has beendeveloped.
The two panels of Fig. 11 illustrate the underlying conceptual model. The left panel of Fig. 11 showsa 1D cross-section of the aquifer in a plane perpendicular to the stream. Assuming that a negativehydraulic gradient from the river to the aquifer is established after some time since the beginning of thedry season, a river particle will be advected ‘down-gradient‘ (in the y-direction) into the aquifer. At hesame time it will also be dragged downstream by the regional groundwater flow which, due to thetopography of the area , is essentially in the (x)- direction of the average course of the Fenholloway river;i.e., perpendicular to the paper plane. The total horizontal particle movement will be the superpositionof these two directional components, as illustrated in Fig. 11, right panel. The whole process isdynamic because, as the particle propagates into the aquifer, it will sense different piezometric headswhich themselves are changing over time, due to seasonal variations of rainfall recharge. In fact, duringthe wet season, the hydraulic gradient will reverse itself (the river becomes a gaining stream again) andthe river particle may partly move back towards the river bed. However, by then it already hasirreversibly contaminated an aquifer corridor along the river. With this conceptual model,‘dynamic water
lines‘ are then defined by the extreme envelopes of the particle pathlines, as computed for varioushydrological and meteorological scenarios and time periods.
Mathematically, the model is based on a Green's function analytical solution of the 1-D transientgroundwater flow equation for the hydraulic head h(y,t), using the method of images and thesuperposition principle (cf. Koch et al., 1994; Koch and Cekirge, 1996, for details) . The method ofimages is used to incorporate assumed or measured river gauge heights as spatially and time-varyingDirichlet boundary conditions, whereas the superposition principle is employed to add the regionalgroundwater head hreg(x,y,t) to obtain the total solution htot (x,y,t) = h(y,t) + hreg(x,y,t). The modelencompasses a time-dependent source/sink term N(t) that is related to the effective infiltration rechargeof the groundwater aquifer. Initial conditions for hydraulic heads are specified from assumed or measuredaquifer water-table elevations fitted by a Dupuit-Forchheimer functional relationship for the water-tablechange hi(y,to) towards the river bed. Using Darcy's law, local flow velocities are computed from the totalGreen's function solution for the head htot(x,y,t) and integrated over time to provide total path-lengths ofstream particles through the groundwater aquifer. The positions of the two extreme envelopes on bothsides of the stream for a large number of river particles will then delineate the two ‘dynamic water lines‘.
3.2.2 Implementation and setup of the model (wet/dry cycle).
The coding, numerical implementation and practical setup of the Green’s function particle trackingmodel is described in detail in Koch et al. (1994) and Koch and Cekirge (1996). The simulations startat time zero when the river is still effluent. An initial groundwater table hi(y) is assumed and theboundary condition hB(t) is set equal to the river gage elevation above the average water table at thebottom of the stream bed. To mimic possible long-term changes of the net recharge of the aquifer owingto seasonal and multiyear variations of the climatic pattern in Florida (such as those due to El Niño andLa Niña events), and especially cyclic changes from a wet to a dry season and vice versa, a time-dependent source function N(t) of the form N(t) = N0 * sin (2B t /T0) is applied in the model. Here No
is the maximal source/sink rate of the net recharge process and To is the period of the wet/dry season(multiyear) cycle. The choice of the latter is of ultimate importance for the simulation of possible‘worst-case’ stream/aquifer pollution scenarios. In fact, only cycles with long periods To for the wet/dryinterchange will lead to a significant lateral penetration of river particles into the surrounding aquifer,as soon as the groundwater table drops beneath the river gage level. If the drought interval of the cycleis short, the particles barely have time to move into the aquifer, before they are driven back by thereversed gradient that builds up again when the consecutive wet-season interval of the cycle begins.
Fig. 10 : Delineation of static water lines: Snapshots of the simulated water table drop after 240,
448 and 800 days (from top), respectively, of a prolonged drought season (scales in ft).
Fig. 11: Conceptual model for river / aquifer dynamic interaction. Left: 1D cross-section perpendicular
to the stream; Right: Superposition of particle movements perpendicular to the stream and
parallel to the direction of the regional groundwater gradient.
The visual inspection of the time series groundwater table elevations, river gauge heights andprecipitation in Figs. 6- 9 illustrates that these variables have, in addition to the normal seasonal cycle(with a period of about six months), longer cycles with multiyear periods of changes from highs to lowsand vice versa. As discussed in Section 2.2, for Florida, these long-term variations are most likelyrelated to the El Niño/Southern Oscillation (ENSO)--- as indicated by the sea surface temperaturevariations in the south-eastern Pacific Ocean (cf. Fig. 9)---- whereby precipitation above and below thelong-term average of up to 40% can be expected in an El Niño and a La Niña year, respectively (Kahya
and Dracup, 1993; Sun, 1996). This, consequently, implies that in a La Niña year, a lower groundwatertable is to be anticipated within the study region. Since the stream gauge elevations for the Fenhollowayriver remain relatively constant, due to the large industrial discharge (see Figs. 7 and 8), a reversehydraulic gradient from the stream towards the aquifer; i.e. an influent stream, can be created over arelatively long time period. Therefore, a wider corridor of aquifer contamination Cas delineated by the‘dynamic water lines‘--- along the river may be expected in a La Niña year.
3.2.3 Application to the delineation of dynamic water lines
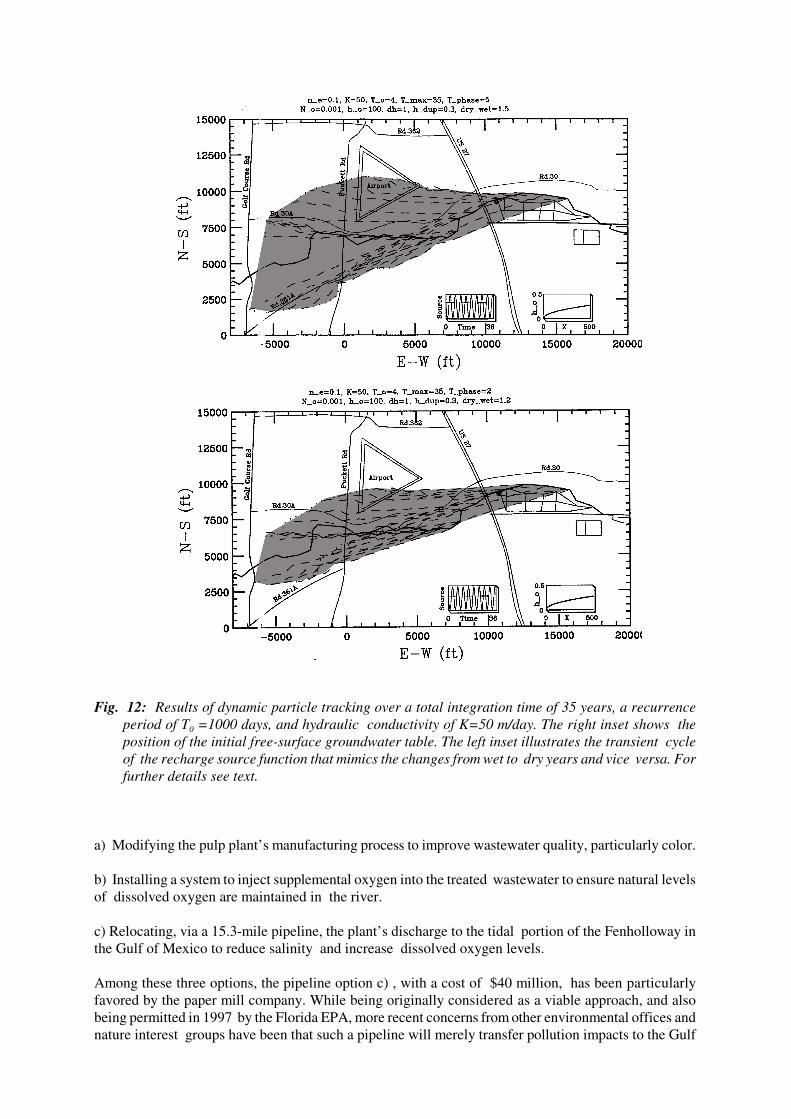
Fig. 12 shows results of two simulations with the dynamic particle tracking to delineate ‘dynamic
water lines‘. A recurrence period To of 1000 days for the wet/dry season cycle, which mimicsapproximately the length of the long-term El Niño/La Niña cycle (Fig, 9) and, therefore, represents akind of ‘worst-case’ scenario, has been used in this calculation. The movements of the river particleshave been tracked over a total time of 35 years, a timespan that comes close to the total time of operationof the paper mill. A rather high hydraulic conductivity of K=50 m/day which, from steady-stateMODFLOW calibrations, was found to be the most appropriate for the upper confined, sandy aquiferwith embedded limestone fractures, is used. The amplitude No of the cyclic effective recharge functionwas adjusted during the calibration phase of the particle tracker in such a way that the observed historical,long-period groundwater table fluctuations of Fig. 6 are roughly matched.
The two panels differ in the ratios of the lengths of the dry- versus the wet time periods within one cycle.The strong influence of the relative durations of the dry versus the wet years on the positions of thewater lines is clearly observable in these plots. One notes that the ratio of the durations of the wet overthe dry period has an effect on the total movements of the river particles. In the top panel of Fig 12, thedry period is much longer than the wet period and the particle will have more time to move into theaquifer before partly returning when the wet season follows. A detailed description of these and otherconsiderations that are required for the appropriate calibration and verification of the particle trackingmodel can be found in Koch et al. (1994) and Koch and Cekirge (1996) where a sensitivity study is alsopresented.
The envelopes of the extreme endpoints of all particle tracers on each side of the stream delineate the‘dynamic water-lines‘ and ‘sandwich’ the maximal corridor of possible aquifer pollution caused by theindustrial Fenholloway river. Fig. 12 illustrates that the particle tracking simulations shown (andnumerous other ones discussed in Koch et al , 1994) result in ‘pollution corridors’ that are somewhatnarrower than those obtained from the ‘static water lines‘ of the transient MODFLOW simulations inthe previous section. The ‘worst-case’ dynamic water lines of Fig. 12 should, therefore, providewater-planning agencies with realistic guidelines for where to draw the ‘safest‘ limits of the proposedpublic water supply lines for the residents that are living along the Fenholloway river.
4. CONCLUSIONS
Potential groundwater contamination adjacent to the Fenholloway river as a consequence of highoutfall from a paper mill plant has been investigated. Physical modeling of the river/groundwaterinteraction has been undertaken in order to define the boundaries (water lines) of a possibly pollutedaquifer-corridor along the Fenholloway river. 2D and 3D steady-state and transient simulation using analytical and numerical models of the coupled river/groundwater aquifer system were carried out.Various conceptual models of this system that might lead to hydraulic conditions prone to aquifercontamination from river water were tested using hydrological and meteorological data from historicalrecords as well as from a five-month groundwater and stream survey of the region. Ultimately, extremeestimates of the possible spatial extensions of a plume emanating from the river over the short and thelong term (worst-case scenarios) were established by two different approaches. The first one is based onthe use of transient MODFLOW simulations and mimics a drop of the water table elevations during along dry season. This approach defines the ‘static water lines‘ as the saddle point of the hydraulicgradient. The second modeling option is based on a new model for dynamic stream/aquifer particletracking, using a Green's function methodology. Using this technique ‘dynamic water lines‘ are definedby the end-locations of river particles tracked over a long time period for a specified dry- and wet seasonscenario. The water lines defined by the two model approaches are consistent with each other overall,though the static water lines define a narrower zone for the possibly contaminated corridor along theFenholloway river than the dynamic water lines.
The sensitivity analysis shows that hydraulic conditions pertinent to the movement of river pollutants intothe aquifer occur during long drought periods, due to a deficit of groundwater recharge which entails anoverall LOWERING of the groundwater table. Various models are run using observed historical climaticand hydrological conditions. In order to establish possible `worst-case' contamination scenarios and toserve as a guideline for water-quality management, the model is also executed with extreme dry and wetyear climatic conditions which, for Florida, are encountered between major El Niño occurrences; i.e.during La Niña years. Under such extreme conditions the modeling results show that lateral migrationof contaminants close to the industrial discharge point might be up to several km in cross-river directionduring times when the normally gaining (effluent) stream becomes sectionally a loosing (influent) stream.
5. EPILOGUE
Since the time of this investigation, numerous environmental and legal activities with respect to theFenholloway river issue have been taking place. Besides the possibility of aquifer pollution fromcontaminated river water, which has been the emphasis of the present study, concern has been on thewater quality of the Fenholloway river itself. The latter being originally classified as a purely industrial(class V) river, Florida EPA has rescinded this statue in 1997 and reclassified the Fenholloway to a classIII, suitable for recreation and being able to serve as a habitat for fish and wildlife. To comply with suchan upgrade and to achieve the water quality improvement required, various proposals have been madesince that time which include
Fig. 12: Results of dynamic particle tracking over a total integration time of 35 years, a recurrence
period of T0 =1000 days, and hydraulic conductivity of K=50 m/day. The right inset shows the
position of the initial free-surface groundwater table. The left inset illustrates the transient cycle
of the recharge source function that mimics the changes from wet to dry years and vice versa. For
further details see text.
a) Modifying the pulp plant’s manufacturing process to improve wastewater quality, particularly color.
b) Installing a system to inject supplemental oxygen into the treated wastewater to ensure natural levelsof dissolved oxygen are maintained in the river.
c) Relocating, via a 15.3-mile pipeline, the plant’s discharge to the tidal portion of the Fenholloway inthe Gulf of Mexico to reduce salinity and increase dissolved oxygen levels.
Among these three options, the pipeline option c) , with a cost of $40 million, has been particularlyfavored by the paper mill company. While being originally considered as a viable approach, and alsobeing permitted in 1997 by the Florida EPA, more recent concerns from other environmental offices andnature interest groups have been that such a pipeline will merely transfer pollution impacts to the Gulf
estuary and lead to a significant deterioration of coastal waters, with subsequent detrimental biologicaleffects on the aquatic ecosystem there.
At the time of this writing , the US EPA has officially rejected the pipeline alternative and requestedthe paper mill to change its pulp manufacturing process, which in any case is not anymore up to the state-of-the-art technology.
ACKNOWLEDGMENTS
I am grateful to my former colleagues and friends Drs. H. M. Cekirge and H. Sun who contributedin an invaluable manner to the success of this project. Thanks are also due the Florida Department ofEnvironmental Protection (FDEP) which financed the initial investigations, and in particular FDEPemployees Richard Harvey, Paul Lee, John Purcell, Rick Copeland, and Richard Waikowicz for thefruitful discussions and their efforts in gathering much of the field data. Finally I acknowledge theBucke- ye paper mill factory, the USGS, and the Florida Climate Center for providing us additionalhydrological data indispensable for the outcome of this study.
REFERENCES
Bear, J., Dynamics of Fluids in Porous Media, Elsevier Inc., New York, NY, 1972.
Javandel, I., Doughty, C., Tsang, C., Groundwater transport: Handbook of Mathematical Models,American Geophysical Union, Washington, DC, 1984.
Kahya, E. and J.A. Dracup, U.S. streamflow patterns in relation to the El N i ñ o / S o u t h e r nOscillation, Water Resour. Res., 29, 2491-2503, 1993.
Koch, M. and H.M. Cekirge, A transient Green's function analytical flow and particle tracking modelto quantify a coupled river-aquifer system: Application to the assessment of possible groundwatercontamination from a Floridan industrial river, In: Advances in Ground Water Pollution Control and
Remediation, M.A. Aral (ed.), NATO ASI Series, Kluwer Academic, Dordrecht, pp. 127-154, 1996.
Koch, M., H.M. Cekirge and H. Sun, Modeling of flow and transport to assess groundwatercontamination in the vicinity of the Fenholloway river, Taylor county, Florida, Technical Report for
the Florida Department of Environmental Protection , Tallahassee, Florida, pp.150, 1994
Maidment D.R., Handbook of Hydrology, McGraw Hill, New York, NY, 1993.
McDonald, M.G. and A.W. Harbaugh, A modular three-dimensional finite difference ground-water flowmodel, USGS Open-file Report 83-875, 1984.
Ropelewski, CF. and N.S. Halpert, North American precipitation and temperature pattern associatedwith the El Niño/Southern Oscillation (ENSO), Mon. Weather Rev., 114, 2352--2362. 1986.
Ropelewski, CF. and N.S. Halpert, Global and regional scale precipitation pattern associated with theEl Niño/Southern Oscillation, Mon. Weather Rev., 115, 1606--1626, 1987.
Sun, H., Annual surface water resources in Florida in response to El Niño and La Niña- southernoscillation of sea surface temperature, 30th International Geological Congress Abstract, Beijing,China, August, 1996.
Sun, H., Koch, M. and Liu, X., Modeling of the interaction of river and groundwater to assessgroundwater contamination by time series, flow modeling and particle tracking methods, In:Hydrogeology, Proceedings of the 30th International Geological Congress, Volume 22,
Hydrogeology, Fei Jin and N.C. Krothe (eds), VSP, Utrecht, Netherlands, pp. 139-178, 1997, 335p.
Watts, G.B. and W. Riotte. Ground Water Investigation Report Number 91-05, Proctor and GambleCellulose Perry, Taylor County, Technical Report to Florida Department of Environmental