43
1 Hydraulic Modeling of the Missoula Ice Dam Failure Christopher R. Goodell, P.E., D.WRE WEST Consultants, Salem, OR

1
Hydraulic Modeling of the Missoula Ice Dam Failure
Christopher R. Goodell, P.E., D.WREWEST Consultants, Salem, OR

Introduction
• 10-40 thousand years ago during the last ice age…
Image courtesy gis4geomorphology.com
Introduction
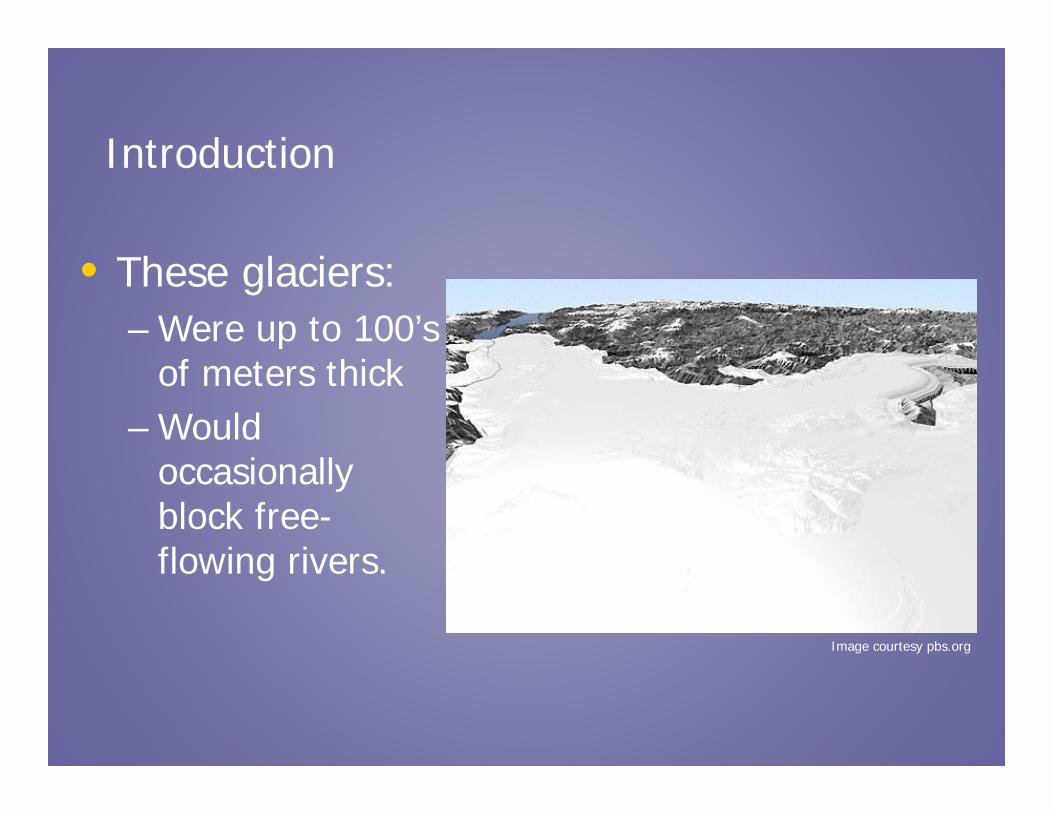
• These glaciers:– Were up to 100’s
of meters thick– Would
occasionally block free-flowing rivers.
Image courtesy pbs.org

Introduction
• Glacier blocked the natural outlet for the Clark Fork River
• With no alternative outlet, the glacial lake rose until it filled to a level that caused the ice dam to break.
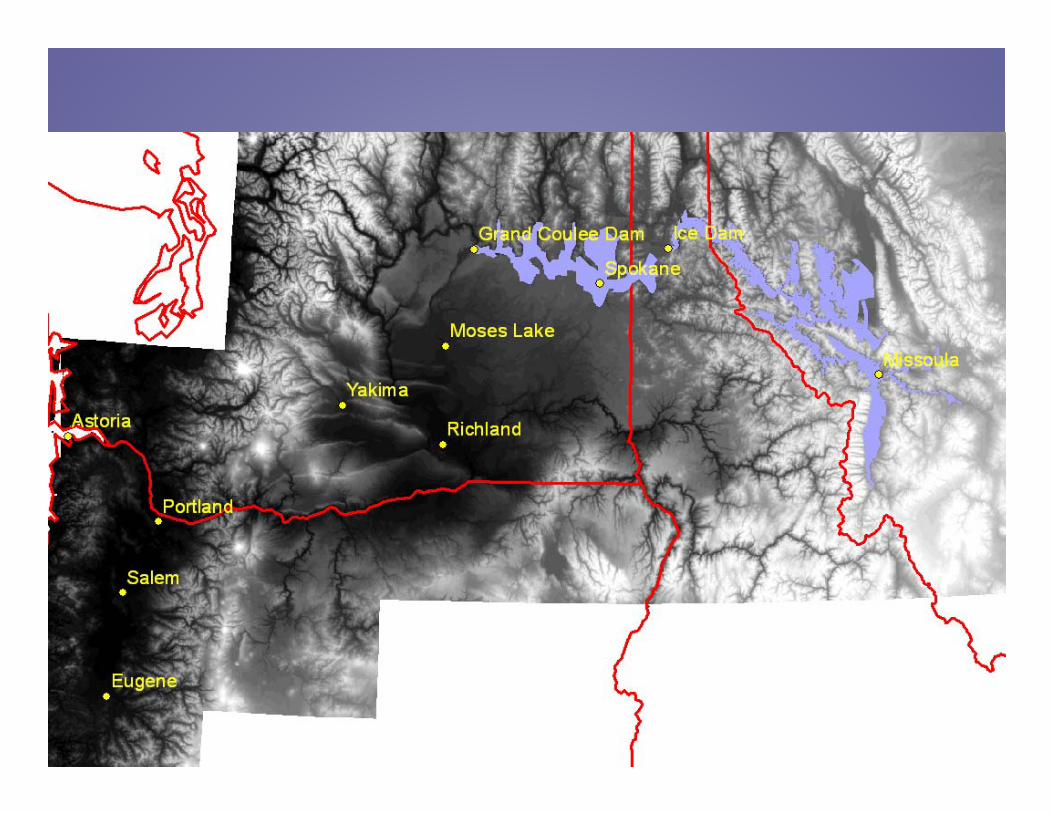
Glacial Lake Missoula
Image courtesy sandpointonline.com, Illustration by Bruce Bjornstad.

Introduction
• Glacial Lake Missoula Stats– About 1,970 ft deep at the ice
dam (Same as Crater Lake)– Surface Area = 2900 sq. miles,
7500 km2
– Volume = 500 miles3, 2084 km3,
1.7 Billion acre-ft. About half of Lake Michigan, or equivalent to Lake Erie and Lake Ontario combined.
– About 290 meters deep at Missoula, MT
Image courtesy hugefloods.com
Image courtesy sites.coloradocollege.edu
Solving the Mystery
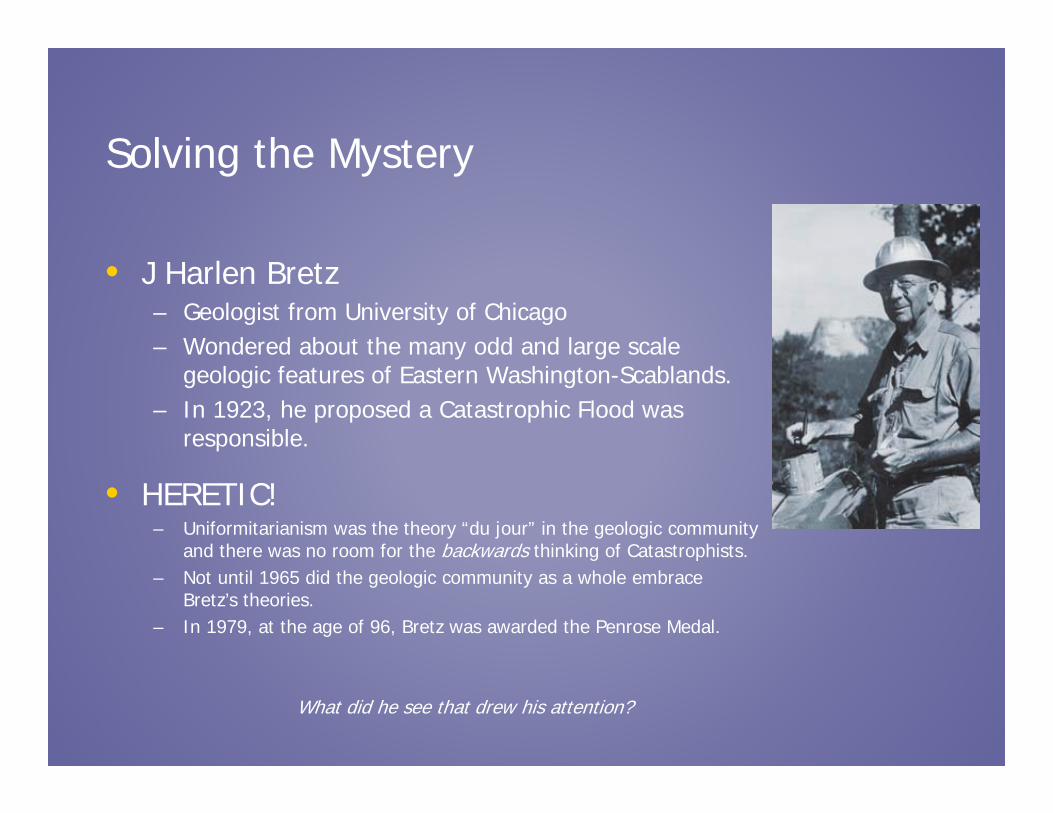
• J Harlen Bretz– Geologist from University of Chicago– Wondered about the many odd and large scale
geologic features of Eastern Washington-Scablands.– In 1923, he proposed a Catastrophic Flood was
responsible.
• HERETIC!– Uniformitarianism was the theory “du jour” in the geologic community
and there was no room for the backwards thinking of Catastrophists.– Not until 1965 did the geologic community as a whole embrace
Bretz’s theories. – In 1979, at the age of 96, Bretz was awarded the Penrose Medal.
What did he see that drew his attention?

Image courtesy tau0.wordpress.com
Solving the MysteryDry Falls
• 3 miles wide (5 times wider than Niagara)
• 350 ft drop! (> 2 times higher than Niagara)
• > 10 times the volume of all the rivers in the world combined.

Solving the MysteryGiant Ripples
hugefloods.com
West Bar Washington
Google Earth
50 ft high with wavelengths of 500 ft

Solving the MysteryGiant Ripples
Markle Pass and Camas Prairie, MT
Camas Prairie, MT, hugefloods.com
Google Earth

Solving the Mystery Giant Ripples???

Solving the MysteryColumbia River Gorge

Solving the Mystery
Rocky Butte

Solving the Mystery Lake Oswego
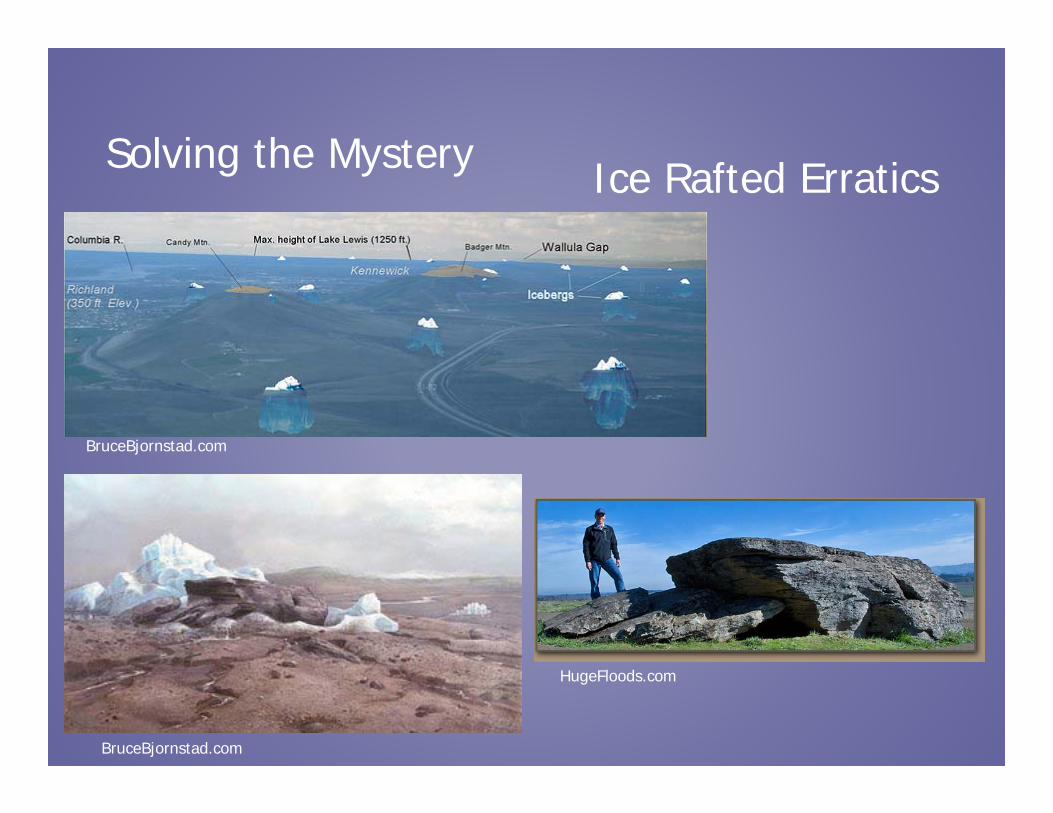
Solving the Mystery Ice Rafted Erratics
BruceBjornstad.com
BruceBjornstad.com
HugeFloods.com

Solving the Mystery
Erratics
Yeager Rock, Mansfield, WA

Solving the MysteryErratics
Badger Coulee Vineyard

Solving the MysteryErratics

Bellevue Erratic
http://pubs.usgs.gov/of/2003/of03-408/

Hydraulic Modeling of the Missoula Floods
• Dam Breach Modeling– Important component
in dam safety programs– Has been applied to
modern-day glacial lake outbursts (Himalayas)… Jokulhlaups

Modeling Approach
• HEC-RAS– One-Dimensional unsteady flow model. – Has Dam Breach capability– Has many built-in stabilizing techniques– But…can it handle this?

Modeling Approach• Terrain Model
– 1o DEM from USGS EROS site, scale 1:250k
– Vertical Resolution – 30 meters, Horizontal Resolution ~ 130 meters
– Converted to an ESRI Grid

Modeling Approach
• Flow Path Approximation– 1-D model– Not as difficult as
first thought!– Aerial Photos and
DEM’s

Initial Spacing about 5 km
Modeling Approach
• 2,346 Cross Sections• 68 Reaches• 34 Junctions• 36 External Boundaries

Modeling Approach
• Inline and Lateral Structures
Modeling Approach
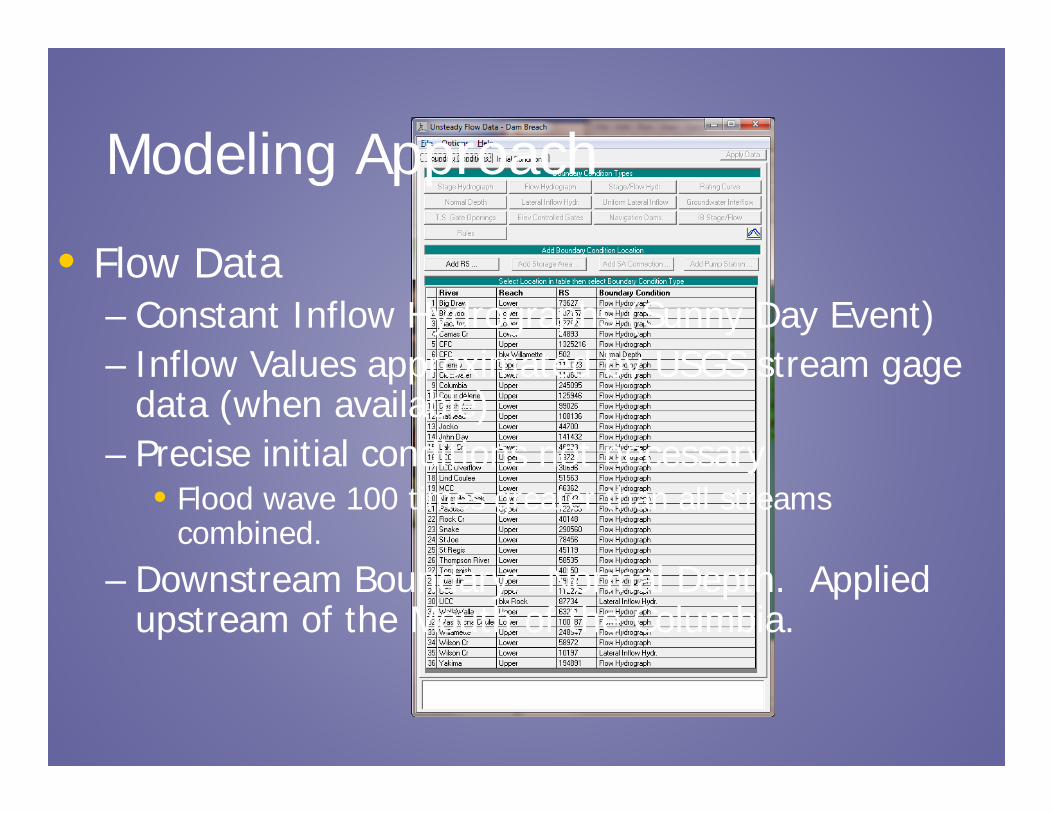
• Flow Data– Constant Inflow Hydrographs (Sunny Day Event)– Inflow Values approximated by USGS stream gage
data (when available)– Precise initial conditions not necessary
• Flood wave 100 times greater than all streams combined.
– Downstream Boundary: Normal Depth. Applied upstream of the Mouth of the Columbia.

Model Development/Assumptions• Defining the Breach
– Piping– 16-24 hr
development– Breach width???
Hubbard Glacier Jokulhlaup

Model Development/Assumptions
• Numerical Stability– 2000 m Blind
Interpolation– Down to 500
m in some areas
– 30 second time step (Courant Condition)
Model Development/Assumptions
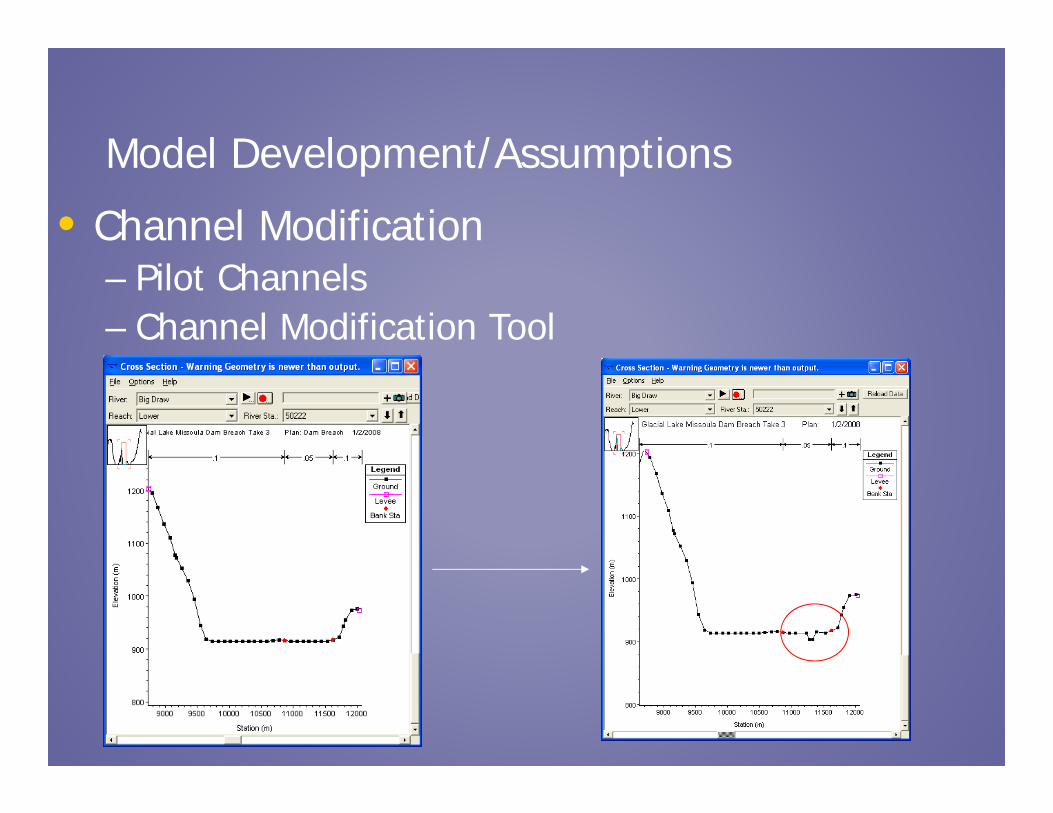
• Channel Modification– Pilot Channels– Channel Modification Tool

Model Development/Assumptions
• Hotstart– Flow Distributions, Junctions & Lateral Structures– Step-Down Scheme

Model Development/Assumptions
• Sediment Transport– Undoubtedly a LOT of sediment movement occurred.– Wind-blown silt thought to accumulate to depths of
several hundred feet in the Eastern Washington Scablands prior to the Missoula Floods
– Where did the silt go? How did it affect the flooding?
– How does this affect the modeling effort?

Model Development/Assumptions
• Advance/Retreat of Glaciers• Flood Morphology
Now thought that each flood event carved a different and new path on its way to the Columbia River Gorge.

Telford-Crab Creek FloodsCheney-Palouse Floods
Research suggests…
This modeling effort attempts to capture the LAST of the Missoula Flood Events
Grand Coulee-Moses Coulee Floods
Model Development/Assumptions

Results• From Geologic Record:
– Maximum Lake Missoula Elevation = 4,200 ft– 386 million cfs peak (50 Amazon Rivers or 10 times all
the rivers in the world combined!)– 30 to 50 mph velocities– 20-40 separate Missoula Floods– Flood waters reached as far upstream the Willamette
Valley as Eugene, OR.

Results• From the HEC-RAS output:
– Breach initiation to Pacific Ocean: 48 hours.– Peak Discharge at Breach: 141 million cfs – 6 days to drain Glacial Lake Missoula.– Peak Discharge at Ocean: 32.6 million cfs.– 4 days to fill up the Willamette Valley, 14 days to drain.– Floodwater traveled 120 miles UP the Snake River, 70
miles UP the Yakima River.– Up to 980 ft inundation depths in Glacial Lake
Columbia, 690 ft below Dry Falls.– 200 ft inundation in Downtown Portland.
Results• From the HEC-RAS output:
– Velocities around 65 ft/s found at Wallula Gap, 26 ft/s through the Columbia River Gorge.
– Flood Depths in the Gorge up to 380 ft. Geologists estimate the maximum to be 980 ft.

Results
Flow Hydrographs
0.00E+00
1.00E+06
2.00E+06
3.00E+06
4.00E+06
5.00E+06
1 2 3 4 5 6 7 8 9 10 11 12 13 14 15
Days
Dis
char
ge (m
3 /s)
Ice Dam Breach
Mouth of Columbia
141 million cfs
32.6 million cfs
Results
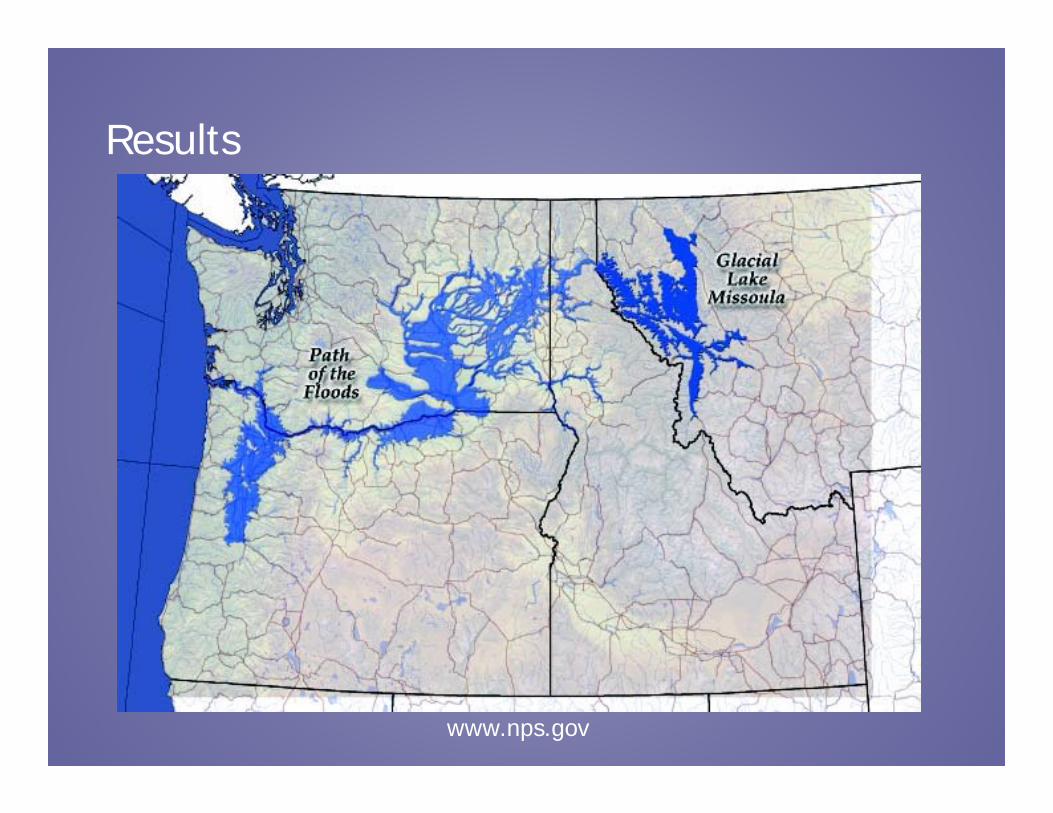
www.nps.gov
Results
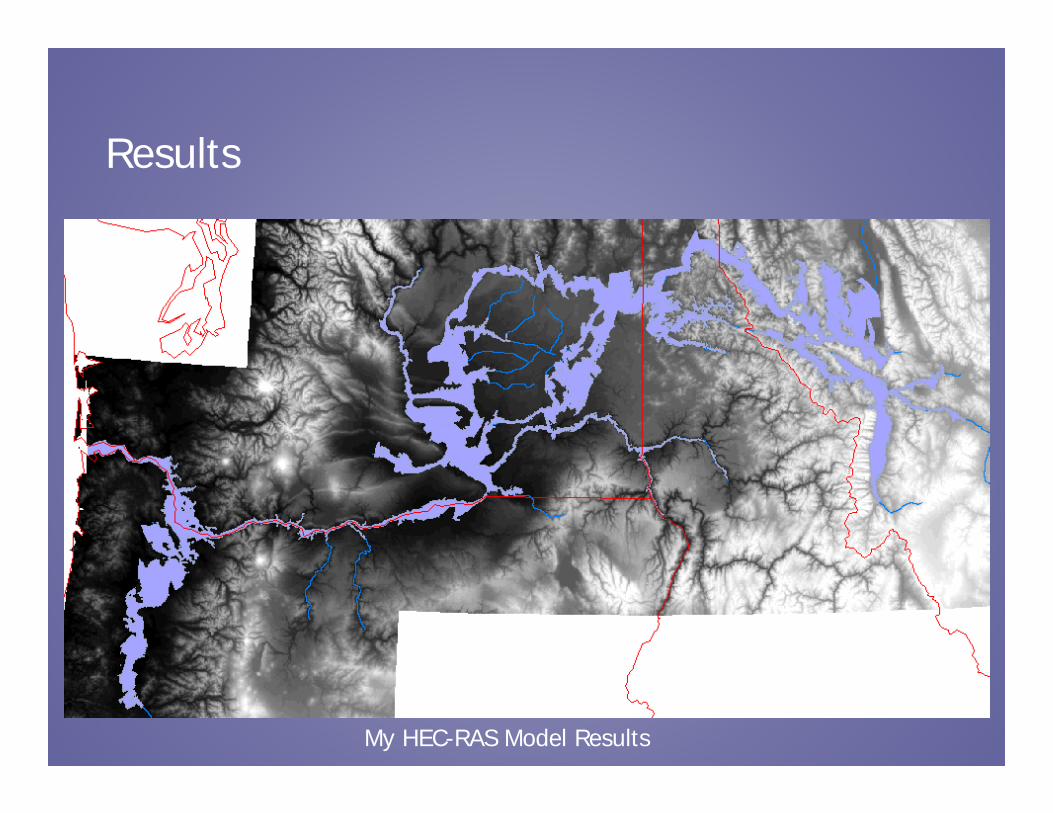
My HEC-RAS Model Results
Results

Results• Wilson, Lake, and Rock Creek Coulees did not flood in model-
geologic evidence suggests otherwise.• This prevented Upper, Middle, and Lower Crab Creek, and Lind
Coulees from flooding. Again, geologic evidence suggests otherwise.
• Shorter breach development times produced slightly higher peak discharges, but not enough to flood the higher elevation coulees.
• Other knobs: Manning’s n values, discharge coefficients, etc.
• Must be a geomorphic explanation to the differences.

41
Results
WilsonRockLake
Cheney Palouse Floods

Conclusions
• HEC-RAS can model an event like the Glacial Lake Missoula Floods
• This Simulation probably better represented the last of the many Glacial Lake Missoula Floods
• Much more research into pre-flood sediment deposits/characteristics to run a sediment transport dam breach model…

THANK [email protected]
www.rasmodel.com
• Alt, David. “Glacial Lake Missoula and Its Humongous Floods”, Mountain Press Publishing, Missoula, MT, 2001.
• Allen, John Elliot; Burns, Marjorie, “Cataclysms on the Columbia”, Timber Press, Portland, OR, 1986.
• www.Hugefloods.com –Great Overall Resource• www.BruceBjornstad.com-Best online collection of erratics.


