Hydro One Networks Inc. 7 th Floor, South Tower 483 Bay Street Toronto, Ontario M5G 2P5 www.HydroOne.com Tel: (416) 345-5240 Cell: (416) 903-5240 [email protected]Oded Hubert Vice President Regulatory Affairs 1 BY COURIER July 20, 2016 Ms. Kirsten Walli Board Secretary Ontario Energy Board Suite 2700, 2300 Yonge Street P.O. Box 2319 Toronto, ON, M4P 1E4 Dear Ms. Walli, EB-2016-0160 – Hydro One Networks Inc.’s 2017 and 2018 Transmission Cost-of-Service Application – Updated Evidence Filing Attached are two (2) paper copies of updated exhibits for Hydro One Networks Inc.'s Transmission Cost-of-Service Application, which was filed with the Ontario Energy Board (“OEB”) on May 31, 2016. The evidence has been updated to reflect: • Decreased pension operating expenses resulting from an updated actuarial valuation report; • Removal of B2M LP costs that were inadvertently included in the original filing; and • Lower OEB assessment costs due to an allocation methodology change that was implemented by the OEB. All changes are numerical in nature, with the exception of the updated actuarial valuation report for the pension plan which is included as a new attachment to Exhibit C1, Tab 4, Schedule 2. The revisions were made as of the date of this letter. These revisions result in OM&A reductions of $12.7 million in 2017 and $11.0 million in 2018 in comparison to Hydro One’s original filing. A detailed list of the updated evidence is provided below:
Transcript
Hydro One Networks Inc. 7th Floor, South Tower 483 Bay Street Toronto, Ontario M5G 2P5 www.HydroOne.com
BY COURIER July 20, 2016 Ms. Kirsten Walli Board Secretary Ontario Energy Board Suite 2700, 2300 Yonge Street P.O. Box 2319 Toronto, ON, M4P 1E4 Dear Ms. Walli, EB-2016-0160 – Hydro One Networks Inc.’s 2017 and 2018 Transmission Cost-of-Service Application – Updated Evidence Filing
Attached are two (2) paper copies of updated exhibits for Hydro One Networks Inc.'s Transmission Cost-of-Service Application, which was filed with the Ontario Energy Board (“OEB”) on May 31, 2016.
The evidence has been updated to reflect:
• Decreased pension operating expenses resulting from an updated actuarial valuation report;
• Removal of B2M LP costs that were inadvertently included in the original filing; and
• Lower OEB assessment costs due to an allocation methodology change that was implemented by the OEB.
All changes are numerical in nature, with the exception of the updated actuarial valuation report for the pension plan which is included as a new attachment to Exhibit C1, Tab 4, Schedule 2. The revisions were made as of the date of this letter.
These revisions result in OM&A reductions of $12.7 million in 2017 and $11.0 million in 2018 in comparison to Hydro One’s original filing.
A detailed list of the updated evidence is provided below:
2
Exhibit Tab Sch. Att. Content
A 2 1 Application
A 3 1 Executive Summary
A 7 2 Hydro One Networks Inc. Transmission Pro Forma Statement of Income Bridge Year (2016) and Test Years (2017 and 2018)
C1 1 1 Cost of Service Summary
C1 2 1 Summary of OM&A Expenditures
C1 3 1 Summary of Common Corporate Costs - OM&A
C1 3 3 Common Corporate Functions and Services and Other OM&A
C1 4 2 Pension Costs
C1 4 2 1 Hydro One Inc. Hydro One Pension Plan: Actuarial Valuation as at December 31, 2015 (June 9, 2016)
C1 6 1 Common Corporate Costs, Cost Allocation Methodology
C1 6 1 1 Review of Allocation of Common Corporate Costs (Transmission) - 2015
C2 1 1 Cost of Service
C2 2 1 Comparison of OM&A Expense by Major Category – Historic, Bridge, and Test Years
E1 1 1 Revenue Requirement
E1 2 1 External Revenues
E2 1 1 Calculation of Revenue Requirement
G1 1 1 Cost Allocation and Rate Pool Revenue Requirement
G1 3 1 Network, Line Connection and Transformation Connection Rate Pools
An electronic copy of the updated evidence and complete application has been filed using the Board’s Regulatory Electronic Submission System and will be posted on the Hydro One website. Sincerely, ORIGINAL SIGNED BY ODED HUBERT Oded Hubert
Filed: 2016-05-31 EB-2016-0160 Exhibit A Tab 1 Schedule 1 Page 1 of 9
EXHIBIT LIST 1
Exhibit Tab Schedule Attachment Contents
A Administration
A 1 1 Exhibit List
A 2 1 Application
A 2 1 1 Certification of Evidence
A 3 1 Executive Summary
A 4 1 Compliance with OEB Filing Requirements for Electricity Transmitters
A 4 2 Summary of Board Directives and Undertakings from Previous Proceedings
A 5 1 Corporate Organization Charts
A 5 2 Governance and Control Framework
A 5 2 1 Hydro One Inc. Mandate for the Board of Directors
A 5 2 2 Hydro One Inc. Nominating, Corporate Governance, Public Policy & Regulatory Committee Mandate
A 5 2 3 Hydro One Inc. Audit Committee Mandate
A 5 2 4 Hydro One Inc. Health, Safety, Environment, First Nations and Métis Committee Mandate
A 5 2 5 Hydro One Inc. Human Resources Committee Mandate
A 5 3 Affiliate Service Agreements
A 5 3 1 Agreement between Hydro One Inc., Hydro One Remote Communities Inc., Hydro One Networks Inc. and Hydro One Telecom Inc. (January 1, 2016)
A 5 3 2 Agreement between Hydro One Networks Inc., Hydro One Remote Communities Inc., Hydro One Inc. and Hydro One Telecom Inc. (January 1, 2016)
A 5 3 3 Agreement between Hydro One Telecom Inc. and Hydro One Networks Inc. (January 1, 2015)
A 5 3 4 Agreement between Hydro One Networks Inc. and Hydro One Remote Communities Inc. (January 1, 2016)
A 5 3 5 Agreement between Hydro One Networks Inc., B2M GP Inc., and B2M Limited Partnership by its general partner B2M GP Inc. (December 17, 2014)
Filed: 2016-05-31 EB-2016-0160 Exhibit A Tab 1 Schedule 1 Page 2 of 9
Exhibit Tab Schedule Attachment Contents
A 5 3 6 Agreement between Hydro One Networks Inc. and Hydro One Telecom Inc. (January 1, 2016)
A 5 3 7 Agreement between Hydro One Networks Inc. and Hydro One Remote Communities Inc. (January 1, 2016)
A 5 3 8 Agreement between Hydro One Remote Communities Inc. and Hydro One Networks Inc. (January 1, 2016)
A 6 1 Accounting Information
A 7 1 Hydro One Transmission Financial Statements - Historic Years (2014- 2015)
A 7 1 1 2014 Hydro One Networks Inc. Transmission Business Financial Statements
A 7 1 2 2015 Hydro One Networks Inc. Transmission Business Financial Statements
A 7 2 Hydro One Networks Inc. Transmission Pro Forma Statement of Income Bridge Year (2016) and Test Years (2017 and 2018)
A 8 1 Hydro One Limited – 2015 Annual Report
A 8 1 1 Hydro One Limited – “Powering Up” Annual Report 2015
A 8 2 Hydro One Inc. - Bridge Year (2016) Quarterly Reports
A 8 2 1 Hydro One Inc. Interim Consolidated Statements of Operations and Comprehensive Income
A 8 2 2 Hydro One Inc. Management’s Discussion and Analysis
A 8 3 Reconciliation of Regulatory Financial Results with Audited Financial Statements (2015)
A 8 4 Rating Agency Reports
A 8 4 1 Standard & Poor’s Rating Services Report (September 18, 2015)
A 8 4 2 Moody’s Investor Service Report (November 5, 2015)
A 8 4 3 DBRS Ratings Report (April 12, 2016)
A 8 5 Prospectus for Most Recent Financing
A 8 5 1 Hydro One Inc. Short Form Base Shelf Prospectus (December 14, 2015)
A 9 1 Stakeholder Consultation
A 9 1 1 Stakeholder Consultation Session Materials and Meeting Notes (April 27, 2016)
A 10 1 Draft Issues List
A 11 1 Witness List
Filed: 2016-05-31 EB-2016-0160 Exhibit A Tab 1 Schedule 1 Page 3 of 9
Exhibit Tab Schedule Attachment Contents
A 11 2 Curricula Vitae
A 12 1 Notices, Procedural Orders, Correspondence
B Transmission System Plan, Performance and Reporting
B1 Transmission System Plan
B1 1 1 Transmission System Plan: Introduction
Part One: Summary of Transmission Business
B1 1 2 Hydro One Transmission Business Overview
B1 1 2 1 Asset List - BES Designation
B1 1 2 2 Transmission System Maps
B1 1 3 Transmission Business Performance
B1 1 3 1 Customer Delivery Point Performance Standard
B1 1 3 2 Description of Reliability Measures
Part Two: Hydro One’s Investment Planning Process
B1 2 1 Hydro One's Investment Planning Process: An Overview
B1 2 2 Identifying Customer Needs
B1 2 2 1 Customer Consultation Report: Development of Transmission Investment Plan
B1 2 2 2 Transmission Customer Engagement: Investing for the Future
B1 2 2 3 Online Consultation Tool
B1 2 3 Identifying System Needs: Regional Planning Process
B1 2 3 1 Letter from IESO on Status of Integrated Regional Resource Plans
Total Rate Base 10,012.2 10,040.0 (27.8) * Hydro One does not calculate actual cash working capital, thus the 2016 approved amount was used for illustrative 9
purposes. 10
11
Total rate base is expected to be $27.8 million below the Board-approved amount, a 12
variance of 0.3%. 13
Filed: 2016-05-31
EB-2016-0160
Exhibit A
Tab 3
Schedule 1
Page 15 of 25
Witness: Oded Hubert
6. PERFORMANCE AND REPORTING 1
2
Hydro One’s new executive leadership and Board of Directors are committed to building 3
a stronger performance management culture and are focused on achieving excellence in 4
execution in all aspects of the company’s work. The ability to measure and track 5
performance is essential to this vision. 6
7
Two critical elements of the journey towards stronger performance culture are: (i) the 8
development of a scorecard; and (ii) the selection of key performance indicators that 9
measure the drivers of the company’s performance and track productivity improvements. 10
Excess Export Service Revenue (18.5) External Secondary Land Use Revenue (26.7) External Station Maintenance and E&CS Revenue 0.7 Tax Rate Changes 0.1 Rights Payments (3.0) Pension Cost Differential 6.0 Long-Term Transmission Future Corridor Acquisition and Development 0.6
CDM Variance Account (54.0) External Revenue – Partnership Transmission Projects Account (0.9) Total Regulatory Accounts for Approval (95.6)
11
12
Updated: 2016-07-20
EB-2016-0160
Exhibit A
Tab 3
Schedule 1
Page 24 of 25
Witness: Oded Hubert
10.1 Bill Impacts 1
2
Exhibit H1, Tab 5, Schedule 1 provides the bill impacts that would result from approval 3
of this Application. Table 14 shows the average bill impacts of the proposed changes in 4
transmission revenue requirement and load forecast in 2017 and 2018. 5
6
Table 14: Average Bill Impacts on Transmission and 7
Net Impact on Average Transmission Rates 3.7% 5.4%
Transmission as a % of Tx-connected customer’s total bill 8.3% 8.3%
Estimated Average Bill impact 0.3% 0.4%
Transmission as a % of Dx -connected customer’s total bill 6.8% 6.8%
Estimated Average Bill Impact 0.3% 0.4% * This amount is net of the $0.3 million in wholesale meter service revenue which accounts for the difference when 9
comparing to the total rates revenue requirement shown in Exhibit E1, Tab 1, Schedule 1. 10
11
The total bill impact for Hydro One medium density residential (R1) customers 12
consuming 350 kWh, 750 kWh and 1800 kWh monthly is determined based on the 13
forecast increase in the customer’s Retail Transmission Service Rates (“RTSR”) as 14
detailed below in Table 15. 15
16
Updated: 2016-07-20
EB-2016-0160
Exhibit A
Tab 3
Schedule 1
Page 25 of 25
Witness: Oded Hubert
Table 15: Medium Density (R1) Residential Customer Bill Impacts 1
Typical R1 Residential Customer
350 kWh 750 kWh 1800 kWh
Total Bill as of Jan 1, 2016* $ 102.95 $ 179.37 $ 379.98
RTSR included in 2016 R1 Customer's Bill $ 4.37 $ 9.36 $ 22.47
2018 Increase in Monthly Bill $ 0.23 $ 0.49 $ 1.18
2018 increase as a % of total bill 0.2% 0.3% 0.3% * Total bill including HST, based on time-of-use RPP commodity pricing and 2016 distribution rates approved per 2
Distribution Rate Order EB-2015-0079. 3 ** The impact on RTSR is assumed to be the net impact on average transmission rates, adjusted for Hydro One's 4
revenue disbursement allocator per approved 2016 UTRs per EB-2015-0311. 5
6
The total bill impact for a typical Hydro One general service energy less than 50 kW 7
is determined based on the forecast increase in the customer’s RTSR as detailed below in 9
Table 16. 10
11
Table 16: Typical General Service Energy less than 50 kW 12
(GSe < 50 kW) Customer Bill Impacts 13
GSe Customer Monthly Bill
1,000 kWh 2,000 kWh 15,000 kWh
Total Bill as of Jan 1, 2016* $ 262.79 $ 492.00 $ 3,471.80
RTSR included in 2016 GSe Customer's Bill $ 10.19 $ 20.39 $ 152.89
Estimated 2017 Monthly RTSR**
$ 10.55 $ 21.11 $ 158.29
2017 increase in Monthly Bill $ 0.36 $ 0.72 $ 5.40
2017 increase as a % of total bill 0.1% 0.1% 0.2%
Estimated 2018 Monthly RTSR**
$ 11.09 $ 22.18 $ 166.32
2018 increase in Monthly Bill $ 0.53 $ 1.07 $ 8.02
2018 increase as a % of total bill 0.2% 0.2% 0.2% * Total bill including HST, based on time-of-use RPP commodity pricing and 2016 distribution rates approved per 14
Distribution Rate Order EB-2015-0079. 15 ** The impact on RTSR is assumed to be the net impact on average transmission rates, adjusted for Hydro One's 16
revenue disbursement allocator per approved 2016 UTRs per EB-2015-0311. 17
Updated: 2016-07-20 EB-2016-0160 Exhibit A Tab 7 Schedule 2 Page 1 of 1
Table 2: 2015 Board-approved versus 2015 Actual OM&A Expenditures 1
OM&A Categories 2015 Board-
approved ($ Million)
2015 Actual ($ Million)
Variance ($ Million)
Sustainment 238.7 233.6 -5.1 Development 12.9 6.1 -6.8 Operations 58.5 59.0 0.5 Customer Care 5.5 5.1 -0.4 Common Corporate & Other Costs 70.2 73.9 3.7 Taxes Other than Income Taxes 66.3 63.9 -2.4 Less settlement reduction -20.0
Exclusion of B2M -0.9 Total OM&A 431.1 441.6 10.5
*Total variance is not the sum of changes noted. 2
3
Hydro One Transmission’s actual 2015 OM&A costs were $10.5 million or 2.4% above 4
Board-approved levels. This difference is explained, in part, by the OM&A reduction 5
prescribed by the settlement agreement (the “2015-2016 Settlement Agreement”) that 6
was accepted by the Board in proceeding EB-2014-0140. Most items were otherwise on 7
or below target. Common Corporate costs increased by 5.3%, but this increase was offset 8
by decreases in Sustainment (2.1%), Development (52.7%) and Taxes Other than Income 9
Tax (3.6%). 10
11
Table 3 compares 2016 projected costs to the 2016 OM&A expenditures approved by the 12
Board in its Decision in proceeding EB-2014-0140. 13
Table 3: 2016 Board-approved versus 2016 Projected OM&A Expenditures 2
OM&A Categories 2016 Board-
approved ($ Million)
2016 Projected ($ Million)
Variance ($ Million)*
Sustainment 241.1 227.5 -13.6 Development 13.4 5.3 -8.1 Operations 59.1 60.0 0.9 Customer Care 5.5 4.1 -1.4 Common Corporate & Other Costs 71.3 72.3 1.0 Taxes other than Income Taxes 67.0 62.9 -4.1 Less settlement reduction -20.0 Exclusion of B2M -0.7 Total OM&A 436.7 432.1 -4.6
*Total variance is not the sum of changes noted. 3
4
Hydro One Transmission’s projected 2016 OM&A costs are $4.6 million or 1.1% below 5
the Board-approved level, which includes the $20.0 million reduction negotiated in the 6
2015-2016 Settlement Agreement. Otherwise, most spending areas are meaningfully 7
below target including Sustainment (5.6%), Development (60.4%) and Taxes other than 8
Table 4: Hydro One Inc. Insurance Costs ($ Millions) 1
Description 2012 2013 2014 2015 2016 2017 2018
Premiums paid for Corporate Functions and Services Insurance Policies *
1.3 1.4 1.5 1.6 2.5 2.7 2.8
Self-insurance Cost 1.3 1.5 2.9 1.2 1.9 1.9 1.9
Total 2.6 2.8 4.4 2.9 4.3 4.5 4.8 *The cost of other insurance coverage that applies to only certain lines of business is captured and reported by the lines of business 2 where the coverage is applicable. 3 4
Hydro One Transmission accounts for $2.6 million of the treasury budget for 2017 and 5
$2.7 million of the budget for 2018. 6
7
2.3 People and Culture 8
9
The “People and Culture” organization ensures that Hydro One has the policies, systems 10
and programs to attract, manage, engage and retain a high performing workforce to 11
execute business strategy. The organization provides human resources consulting, 12
leadership development and recruiting, diversity and resourcing programs, compensation 13
and benefits services, and labour relations services. 14
15
Table 5 provides an overview of the People and Culture organization’s costs over the 16
2012-2018 period. 17
18
Table 5: People and Culture Costs ($ Millions) 19
Description
Historic Years Bridge Year Test Years TX Allocation
Section 1: Going Concern Financial Position ..................................................................................... 4
1.1 Statement of Financial Position ............................................................................................... 4 1.2 Reconciliation of Financial Position ......................................................................................... 5 1.3 Reconciliation of Prior Year Credit Balance ............................................................................ 7
Section 2: Solvency and Hypothetical Windup Financial Position ................................................... 8
2.1 Statement of Solvency Financial Position................................................................................ 8 2.2 Hypothetical Windup Financial Position................................................................................... 9 2.3 Solvency Incremental Cost ....................................................................................................10 2.4 Determination of the Statutory Solvency Excess (Statutory Solvency Deficiency) ...............11
3.1 Contributions for Current Service (Ensuing Year) .................................................................13 3.2 Contributions for Past Service ...............................................................................................14 3.3 Estimated Minimum Employer Contribution (Ensuing Year) .................................................15 3.4 Estimated Maximum Employer Contribution (Ensuing Year) ................................................16 3.5 Timing of Contributions ..........................................................................................................17 3.6 Other Statutory Contributions ................................................................................................17 3.7 Future Contribution Levels .....................................................................................................17
Section 4: Actuarial Certification and Opinion ..................................................................................18
Hydro One Inc. Hydro One Pension Plan Actuarial Valuation as at December 31, 2015 1
http://natct.internal.towerswatson.com/clients/601835/HydroOne2016RETGeneral/Documents/Hydro One 12.31.2015 RPP Valuation VAL.doc
Introduction
Purpose
This report with respect to the Hydro One Pension Plan has been prepared for Hydro One Inc., the plan administrator, and presents the results of the actuarial valuation of the plan as at December 31, 2015.
The principal purposes of the report are:
l to present information on the financial position of the plan on both going concern and solvency bases;
l to review the hypothetical windup status of the plan;
l to provide the basis for employer contributions; and
l to provide certain additional information required for the administration of the plan.
This report outlines the changes in the plan’s financial situation since the previous actuarial valuation at December 31, 2013, provides the information and the actuarial opinion required by the Pension Benefits Act (Ontario) and Regulation thereto and provides the information required to maintain plan registration under the Income Tax Act (Canada) and Regulations thereto.
This report summarizes the results of the actuarial valuation and contains an actuarial opinion as an integral part of the report. Supporting detailed information on the significant terms of engagement, assets, actuarial basis, membership data and plan provisions is contained in the Appendices.
The information contained in this report was prepared for Hydro One Inc., for its internal use and for filing with the Financial Services Commission of Ontario and the Canada Revenue Agency, in connection with the actuarial valuation of the plan prepared by Towers Watson Canada Inc. (“Willis Towers Watson”). This report is not intended, nor necessarily suitable, for other parties or for other purposes. Furthermore, some results in this report are based on assumptions mandated by legislation. These results may not be appropriate for purposes other than those for which they were prepared. Further distribution of all or part of this report to other parties (except where such distribution is required by applicable legislation or except in accordance with our written agreement with Hydro One Inc.) or other use of this report is expressly prohibited without Willis Towers Watson's prior written consent. Willis Towers Watson is available to provide additional information with respect to this report to the above-mentioned intended users upon request.
Significant Events Since Previous Actuarial Valuation
Actuarial Basis
Since the previous actuarial valuation, the assumptions used in the solvency and hypothetical windup valuations have been updated to reflect market conditions at the actuarial valuation date as outlined in Appendix D. In addition, there have been changes to the going concern actuarial basis, as outlined in Appendix C.
Plan Provisions
This actuarial valuation reflects the plan provisions as at December 31, 2015 and does not make any provision for the possibility that a change or action (retroactive or otherwise) may be imposed by order of a regulatory body or a court as we were not aware of any definitive events that would require such change or action at the time this actuarial valuation was completed.
Since the previous valuation, there have been changes to the plan provisions as follows:
l Management employees who were not eligible to elect to become a member of the plan by September 30, 2015 are no longer eligible to join the plan.
l Employee contribution rates were changed as outlined in Appendix F.
l Effective January 1, 2018, a temporary bridge benefit has been added for Society represented employees hired on or after November 17, 2005 as outlined in Appendix F.
These changes had no material impact on the valuation results at December 31, 2015.
Legislative and Actuarial Standards Updates
Since the previous actuarial valuation, the Standards of Practice for Pension Commuted Values published by the Canadian Institute of Actuaries effective February 1, 2011 were revised, effective February 1, 2014, to provide for updates to the mortality assumption as promulgated from time to time by the Actuarial Standards Board (ASB). On December 4, 2014 and April 27, 2015, the ASB proposed to promulgate the use of the mortality rates underlying the 2014 Canadian Pensioners Mortality Table (CPM2014) combined with the mortality improvement scale CPM Improvement Scale B (CPM-B) for calculations, effective October 1, 2015. The updated mortality rates have been reflected for purposes of the solvency and hypothetical windup valuations.
Hydro One Inc.
Hydro One Pension Plan
Actuarial Valuation as at December 31, 2015 3
http://natct.internal.towerswatson.com/clients/601835/HydroOne2016RETGeneral/Documents/Hydro One
12.31.2015 RPP Valuation VAL.doc
Subsequent Events
We completed this actuarial valuation on June 9, 2016.
To the best of our knowledge and on the basis of our discussions with Hydro One Inc., no events
which would have a material financial effect on the actuarial valuation occurred between the actuarial
valuation date and the date this actuarial valuation was completed.
Hydro One Inc. Hydro One Pension Plan
4 Actuarial Valuation as at December 31, 2015
Willis Towers Watson Confidential
Section 1: Going Concern Financial Position
1.1 Statement of Financial Position
(dollar amounts in thousands) December 31, 2015 December 31, 2013 Going Concern Value of Assets $ 6,071,094 $ 5,204,378 Actuarial Liability Active and disabled members $ 2,208,495 $ 2,161,286 Retired members and beneficiaries 3,860,866 3,676,923 Terminated vested members 39,400 33,623 Total $ 6,108,761 $ 5,871,832 Additional voluntary contribution 20 19 Total Actuarial Liability $ 6,108,781 $ 5,871,851 Actuarial Surplus (Unfunded Actuarial Liability) $ (37,687 ) $ (667,473 ) Prior Year Credit Balance (48,000 ) (48,000 ) Actuarial Surplus (Unfunded Actuarial Liability) After Prior Year Credit Balance $ (85,687 ) $ (715,473 )
Comments:
l The financial position of the plan on a going concern basis is determined by comparing the going concern value of assets to the actuarial liability and is a reflection of the assets available for the benefits accrued in respect of credited service prior to the actuarial valuation date assuming the plan continues indefinitely.
l The prior year credit balance is employer contributions made prior to the actuarial valuation date that are in excess of the minimum required and are set aside as a reserve for application towards future contribution requirements.
Hydro One Inc. Hydro One Pension Plan Actuarial Valuation as at December 31, 2015 5
http://natct.internal.towerswatson.com/clients/601835/HydroOne2016RETGeneral/Documents/Hydro One 12.31.2015 RPP Valuation VAL.doc
l The increase in the defined benefit actuarial liability as at December 31, 2015 that would result from a 1% decrease in the assumed liability discount rate is $953,459,000. For purposes of this calculation, no changes were made to any of the other actuarial assumptions or actuarial methods.
1.2 Reconciliation of Financial Position
(dollar amounts in thousands) Actuarial surplus (unfunded actuarial liability) as at December, 2013 before prior year credit balance $ (667,473 ) Net special payments 177,330 Application of:
l Actuarial surplus $ 0 l Prior year credit balance 0 0
Expected interest on:
l Actuarial surplus (unfunded actuarial liability) $ (79,672 ) l Net special payments 10,360 l Application of actuarial surplus 0 l Application of prior year credit balance 0 (69,312 )
Plan experience:
l Investment gains (losses) $ 483,373 l Salary and YMPE gains (losses) 24,170 l Cost-of-living adjustment gains (losses) 16,122 l Retirement gains (losses) 6,603 l Withdrawal gains (losses) (17,534 ) l Mortality gains (losses) 6,360 l Other miscellaneous sources gains (losses) (8,185 ) 510,909
Change in actuarial assumptions $ 10,859 Change in plan provisions 0 Actuarial surplus (unfunded actuarial liability) as at December 31, 2015 before prior year credit balance $ (37,687 )
l Actual contributions do not include amounts which were reported as outstanding contributions at the current actuarial valuation date (nor any applicable interest on such outstanding amounts) but include amounts reported as outstanding contributions at the previous actuarial valuation date and contributed prior to the current actuarial valuation date.
Hydro One Inc. Hydro One Pension Plan Actuarial Valuation as at December 31, 2015 7
http://natct.internal.towerswatson.com/clients/601835/HydroOne2016RETGeneral/Documents/Hydro One 12.31.2015 RPP Valuation VAL.doc
1.3 Reconciliation of Prior Year Credit Balance
(dollar amounts in thousands) Prior year credit balance as at December 31, 2013 $ 48,000 Actual employer contributions:
l Defined benefit normal actuarial cost $ 178,102 l Going concern amortization payments 177,330 l Solvency amortization payments 0 l Transfer deficiency payments 0 l Prior year credit balance 0 l Other contributions 0 355,432
Minimum employer contributions required:
l Defined benefit normal actuarial cost $ (178,102 ) l Going concern amortization payments (177,330 ) l Solvency amortization payments 0 l Transfer deficiency payments 0 l Other contributions 0 (355,432 )
Application against unfunded actuarial liability 0 Prior year credit balance as at December 31, 2015 $ 48,000
Section 2: Solvency and Hypothetical Windup Financial Position
2.1 Statement of Solvency Financial Position
(dollar amounts in thousands) December 31, 2015 December 31, 2013 Solvency Value of Assets Market value of assets $ 6,743,615 $ 5,742,219 Provision for plan windup expenses (16,859 ) (14,356 ) Total Solvency Value of Assets $ 6,726,756 $ 5,727,863 Solvency Liability Active and disabled members $ 2,434,330 $ 2,070,880 Retired members and beneficiaries 3,988,651 3,321,439 Terminated vested members 42,265 30,090 Total $ 6,465,246 $ 5,422,409 Additional voluntary contribution 20 19 Total Solvency Liability $ 6,465,266 $ 5,422,428 Solvency Surplus (Unfunded Solvency Liability) $ 261,490 $ 305,435
Comments:
l The financial position of the plan on a solvency basis is determined by comparing the solvency value of assets to the solvency liability (the actuarial present value of benefits accrued in respect of credited service prior to the actuarial valuation date, calculated as if the plan were wound up on that date).
l The solvency actuarial valuation results presented in this report are determined under a scenario where, following a plan windup, the employer continues its operations.
l Under an amendment to the Regulation to the Pension Benefits Act (Ontario) effective November 26, 1992, the employer had the option to make an election to exclude from the
Hydro One Inc. Hydro One Pension Plan Actuarial Valuation as at December 31, 2015 9
http://natct.internal.towerswatson.com/clients/601835/HydroOne2016RETGeneral/Documents/Hydro One 12.31.2015 RPP Valuation VAL.doc
solvency liability any benefits relating to plant closure and permanent layoff. This plan does not have any such benefits.
l In addition, the Regulation permits certain benefits to be excluded from the solvency liability, without requiring the employer to make an election. Pursuant to the directions from the plan administrator, the value of benefits attributable to future indexation of benefits have been excluded from the solvency valuation. The full defined benefit hypothetical windup liability, taking into account the benefits excluded under the Regulation, is $9,545,090,000 as at December 31, 2015.
l The increase in the defined benefit solvency liability as at December 31, 2015 that would result from a 1% decrease in the assumed liability discount rate is $937,161,000. For purposes of this calculation, no changes were made to any of the other actuarial assumptions or actuarial methods.
2.2 Hypothetical Windup Financial Position
The hypothetical windup valuation results presented in this report are determined under the same scenario used for the solvency valuation.
If the plan were to be wound up on the actuarial valuation date, the hypothetical windup value of assets would be equal to the solvency value of assets. As permitted by the Regulation to the Pension Benefits Act (Ontario), the employer has elected to exclude certain benefits from the solvency liability. The full hypothetical windup liability, taking into account all of the benefits excluded under the Regulation, is $9,545,090,000 as at December 31, 2015. Consequently, the hypothetical windup surplus (unfunded hypothetical windup liability) as at the actuarial valuation date is $(2,818,334,000).
The solvency incremental cost for a given year represents the present value, at the actuarial valuation date, of the expected aggregate change in the defined benefit solvency liability during the year, increased for expected benefit payments during the year. The solvency incremental cost in respect of each year between December 31, 2015 and December 31, 2018, the next valuation date, are derived from the projection of the solvency liability, as follows:
(dollar amounts in thousands) 2016 2017 2018 Projected solvency liability as at beginning of year $ 6,465,266 $ 6,544,378 $ 6,615,885 Solvency incremental cost for the year1 201,022 201,820 206,268 Interest on projected solvency liability, solvency incremental cost and expected benefit payments 188,686
190,970 193,189
Expected benefit payments during year (310,596 ) (321,283 ) (330,710 ) Projected solvency liability as at end of year $ 6,544,378 $ 6,615,885 $ 6,684,633
Note:
1 These amounts are as at the beginning of the year. The solvency incremental cost, adjusted with interest as at December 31, 2015, is $196,132,000 for 2017 and $194,805,000 for 2018.
Hydro One Inc. Hydro One Pension Plan Actuarial Valuation as at December 31, 2015 11
http://natct.internal.towerswatson.com/clients/601835/HydroOne2016RETGeneral/Documents/Hydro One 12.31.2015 RPP Valuation VAL.doc
2.4 Determination of the Statutory Solvency Excess (Statutory Solvency Deficiency)
The minimum funding requirements under the Regulation to the Pension Benefits Act (Ontario) are based on the statutory solvency excess (statutory solvency deficiency) as at the actuarial valuation date. In calculating the statutory solvency excess (statutory solvency deficiency), various adjustments can be made to the solvency financial position including:
l recognition of the present value of existing amortization payments, including any going concern amortization payments established at the actuarial valuation date, due to be paid within the periods prescribed by the Regulation;
l smoothing of the asset value by use of an averaging technique;
l adjustment to the solvency liability by use of an averaging technique in determining the discount rate used to value the liabilities; and
l removal of any prior year credit balance from the asset value.
To the extent that there exists a statutory solvency deficiency, after taking account of these adjustments, additional amortization payments must be made. If there is no statutory solvency deficiency, the statutory solvency excess may be used to reduce the period of any existing solvency amortization payments.
(dollar amounts in thousands) December 31, 2015 December 31, 2013 Solvency surplus (unfunded solvency liability) $ 261,490 $ 305,435 Adjustments to solvency position:
l Present value of existing amortization payments $ 41,929 $ 404,773
l Smoothing of asset value (672,521 ) (537,841 ) l Averaging of liability discount rate 345,438 (20,130 ) l Prior year credit balance (48,000 ) (48,000 ) l Total $ (333,154 ) $ (201,198 )
Hydro One Inc. Hydro One Pension Plan Actuarial Valuation as at December 31, 2015 13
http://natct.internal.towerswatson.com/clients/601835/HydroOne2016RETGeneral/Documents/Hydro One 12.31.2015 RPP Valuation VAL.doc
Section 3: Contribution Requirements
3.1 Contributions for Current Service (Ensuing Year)
(dollar amounts in thousands) December 31, 2015 December 31, 2013 Employer Normal Actuarial Cost Estimated contribution $ 85,632 $ 84,818 Estimated payroll 578,543 523,045 % of payroll 14.8 % 16.2 % Estimated Member Contributions $ 45,183 $ 34,798
Comments:
l The employer defined benefit normal actuarial cost rate changed by (1.3)% of payroll due to the changes in membership profile, by 1.0% of payroll due to changes in actuarial basis and by (1.1)% of payroll due to changes in the plan provisions since the previous actuarial valuation.
l The increase in the employer defined benefit normal actuarial cost rate between the actuarial valuation date and the next actuarial valuation date that would result from a 1% decrease in the assumed liability discount rate, is 7.2% of payroll. For purposes of this calculation, no changes were made to any of the other actuarial assumptions or actuarial methods.
The unfunded actuarial liability, adjusted for the prior year credit balance, is $85,687,000. The going concern amortization payments from the previous actuarial valuation have been eliminated or reduced such that the present value of the remaining payment schedule is equal to the unfunded actuarial liability. The unfunded actuarial liability must be liquidated by employer amortization payments at least equal to the amounts, payable monthly in arrears, and for the periods set forth below in order to comply with the Regulation to the Pension Benefits Act (Ontario).
The statutory solvency deficiency revealed at this actuarial valuation is $71,664,000. This statutory solvency deficiency must be liquidated by employer amortization payments at least equal to the amounts, payable monthly in arrears, and for the periods set forth below in order to comply with the Regulation to the Pension Benefits Act (Ontario).
The employer may establish a letter of credit in order to cover all of or a portion of the above amortization payments, to the extent the letter(s) of credit does not exceed 15% of the solvency liabilities.
Hydro One Inc. Hydro One Pension Plan Actuarial Valuation as at December 31, 2015 15
http://natct.internal.towerswatson.com/clients/601835/HydroOne2016RETGeneral/Documents/Hydro One 12.31.2015 RPP Valuation VAL.doc
3.4 Estimated Maximum Employer Contribution (Ensuing Year)
(dollar amounts in thousands) December 31, 2015 December 31, 2013 Employer Normal Actuarial Cost $ 85,632 $ 84,818 Greater of the Unfunded Actuarial Liability and the Unfunded Hypothetical Windup Liability 2,818,334 2,617,669 Estimated Maximum Employer Contribution $ 2,903,966 $ 2,702,487
Comment:
l The Income Tax Act (Canada) permits the employer to make contributions up to the above amount less the amortization payments made in respect of periods since December 31, 2015, provided that all assumptions made for the purposes of the hypothetical windup valuation remain reasonable at the time each contribution is made. In addition, the maximum employer contribution is to be adjusted with interest for the period between the actuarial valuation date and the date each contribution is made.
Hydro One Inc. Hydro One Pension Plan Actuarial Valuation as at December 31, 2015 17
http://natct.internal.towerswatson.com/clients/601835/HydroOne2016RETGeneral/Documents/Hydro One 12.31.2015 RPP Valuation VAL.doc
3.5 Timing of Contributions
To satisfy the requirements of Ontario pension legislation, the employer normal actuarial cost must be paid monthly and within 30 days of the month to which it pertains while the amortization payments must also be paid monthly but within the period to which they are applicable. Members' contributions must be remitted to the fund monthly and within 30 days of the month to which they pertain.
In addition, within 60 days after this report is filed with the Financial Services Commission of Ontario, the employer must make a special contribution equal to the excess, if any, of:
l the amount of employer contributions (employer normal actuarial cost and amortization payments) that should have been paid after December 31, 2015 according to the minimum contribution requirements revealed by this report (determined with regard to any reported prior year credit balance available to meet these minimum contribution requirements), over
l the actual amount of employer contributions made in respect of periods after December 31, 2015.
Interest must be added to this excess, with such interest determined by reference to the going concern discount rate for payments in respect of employer normal actuarial cost or going concern amortization payments and the solvency discount rate for payments in respect of solvency amortization payments.
To satisfy the requirements of the Income Tax Act (Canada), employer contributions that are remitted to the plan in the taxation year or within 120 days after the end of such taxation year are deductible in such taxation year provided they were made to fund benefits in respect of periods preceding the end of the taxation year.
3.6 Other Statutory Contributions
Additional contributions may be required in respect of the transfer values for members who terminate employment or active plan membership. Where applicable, such additional contributions must be remitted before the related transfer value may be paid in full to the terminated member. Details are provided in Appendix G.
3.7 Future Contribution Levels
Future contribution levels may change as a result of future changes in the actuarial methods and assumptions, the membership data, the plan provisions and the legislative rules, or as a result of future experience gains or losses, none of which have been anticipated at this time. Emerging experience, differing from the assumptions, will result in gains or losses that will be revealed in future actuarial valuations.
Based on the results of these actuarial valuations, we hereby certify that, in our opinion, as at December 31, 2015:
l The plan has a prior year credit balance of $48,000,000. The employer may use this prior year credit balance to meet the future contribution requirements of the plan.
l The actuarial surplus (unfunded actuarial liability), determined by comparing the actuarial liability, the measure of obligations of the plan on a going concern basis, to the going concern value of assets, is $(37,687,000).
l The unfunded actuarial liability, adjusted for the prior year credit balance, is $85,687,000 and must be liquidated by employer amortization payments at least equal to the amounts and for the periods set forth in Section 3 in order to comply with the Regulation to the Pension Benefits Act (Ontario).
l The solvency surplus (unfunded solvency liability), determined by comparing the solvency liability, as defined in the Regulation to the Pension Benefits Act (Ontario), to the solvency value of assets, is $261,490,000.
l The statutory solvency excess (statutory solvency deficiency) revealed at this actuarial valuation is $(71,664,000). This statutory solvency deficiency must be liquidated by employer amortization payments at least equal to the amounts and for the periods set forth in Section 3 in order to comply with the Regulation to the Pension Benefits Act (Ontario).
l The hypothetical windup surplus (unfunded hypothetical windup liability), determined by comparing the hypothetical windup liability, the measure of the obligations of the plan on a hypothetical windup basis including the value of any potential obligations that may have been excluded for purposes of the solvency valuation, to the hypothetical windup value of assets, is $(2,818,334,000).
l The excess actuarial surplus, pursuant to section 147.2(2) of the Income Tax Act (Canada), is $0.
l The rule for computing the employer defined benefit normal actuarial cost is outlined in the table below. Based on the plan membership used for this actuarial valuation (assuming no new
Hydro One Inc. Hydro One Pension Plan Actuarial Valuation as at December 31, 2015 19
http://natct.internal.towerswatson.com/clients/601835/HydroOne2016RETGeneral/Documents/Hydro One 12.31.2015 RPP Valuation VAL.doc
entrants) and the scheduled increases in the employee contribution rates disclosed in the summary of plan provisions, the normal actuarial cost for the next three years is estimated to be:
(dollar amounts in thousands) 2016 2017 2018 Estimated employer normal actuarial cost $ 85,632 79,932 77,446 Estimated payroll 578,543 564,507 554,853 % of payroll 14.8 % 14.2 % 14.0 % Estimated member contributions $ 45,183 47,870 49,267
The employer is required to make normal actuarial cost contributions to the plan in accordance with the above rule until the effective date of the next actuarial opinion.
l The maximum employer contributions permissible under the Income Tax Act (Canada) are described in Section 3.
l The transfer ratio, as defined in the Regulation to the Pension Benefits Act (Ontario), is 0.70. The solvency ratio, defined as the ratio of the solvency value of assets prior to deduction of the provision for plan windup expenses to the solvency liabilities, is not less than 1.00.
l The assessment base determined for the Pension Benefits Guarantee Fund (PBGF) is $0. The PBGF liabilities are $6,465,246,000. Additional liabilities for excluded plant closure benefits, in accordance with section 37(4)(a)(ii) of the Regulation to the Pension Benefits Act (Ontario), are $0.
l In accordance with the Regulation to the Pension Benefits Act (Ontario), the next actuarial valuation should be performed with an effective date not later than December 31, 2018. The basis for employer contributions presented in this report is effective until the next actuarial opinion is filed.
the membership data on which the actuarial valuations are based are sufficient and reliable for
the purposes of the going concern, solvency and hypothetical windup valuations,
the assumptions are appropriate for the purposes of the going concern, solvency and hypothetical
windup valuations, and
the methods employed in the actuarial valuations are appropriate for the purposes of the going
concern, solvency and hypothetical windup valuations.
This report has been prepared, and our opinion has been given, in accordance with accepted actuarial
practice in Canada. The actuarial valuations have been conducted in accordance with our
understanding of the funding and solvency standards prescribed by the Pension Benefits Act (Ontario)
and Regulation thereto, and in accordance with our understanding of the requirements of the Income
Tax Act (Canada) and Regulations thereto. This actuarial opinion forms an integral part of the report.
The results presented in this report have been developed using a particular set of actuarial
assumptions. Other results could have been developed by selecting different actuarial assumptions.
The results presented in this report are reasonable actuarial results based on actuarial assumptions
reflecting our expectation of future events.
Towers Watson Canada Inc.
David Kenny
Fellow of the Canadian Institute of Actuaries
Suzanne Jacques
Fellow of the Canadian Institute of Actuaries
Toronto, Ontario
June 9, 2016
Hydro One Inc. Hydro One Pension Plan Actuarial Valuation as at December 31, 2015 A–1
http://natct.internal.towerswatson.com/clients/601835/HydroOne2016RETGeneral/Documents/Hydro One 12.31.2015 RPP Valuation APP.doc
Appendix A: Significant Terms of Engagement For purposes of preparing this actuarial valuation report, the plan administrator has directed that:
l The actuarial valuation is to be prepared as at December 31, 2015.
l For purposes of the going concern valuation, the terms of engagement require the use of the margins for adverse deviations mentioned in Appendix C.
l For purposes of determining the going concern liability discount rate, the target asset class distribution is to be established in accordance with the investment policy dated November 12, 2015, which is the most up to date version. There are no expectations that this asset class distribution will be modified in the future.
l For purposes of determining the going concern financial position of the plan, the going concern value of assets is to be determined using the averaging technique described in the Asset Valuation Method section in Appendix C.
l For purposes of determining the solvency liabilities of the plan, the value of benefits arising from future indexation are to be excluded, as permitted by the Regulation to the Pension Benefits Act (Ontario), without requiring an election from the employer.
l For purposes of determining the statutory solvency financial position of the plan, the asset value and liability discount rates are to be determined using the averaging techniques described in the Asset Valuation Method and Rationale for Actuarial Assumptions sections in Appendix D.
l Since to the best of the knowledge of the plan administrator, there is no partial plan windup with an effective date prior to the date of this actuarial valuation, involving members employed in Ontario, not yet completed where the partial windup portion of the plan is in a surplus position on the date of this actuarial valuation, this report is to be prepared on the basis that there will be no retroactive changes to previously filed partial windup reports, if any, and neither the applicable pension regulator nor the plan sponsor will order/declare any partial plan windup with an effective date prior to the actuarial valuation date.
l The solvency and hypothetical windup valuation results presented in this report are to be determined under a scenario where the employer continues to operate and certain expenses are paid from the pension fund (consistent with past practice) while the employer pays other plan expenses.
l This report is to be prepared on the basis that the employer is entitled to apply the actuarial surplus, if any, revealed in an actuarial valuation report to meet its contribution requirements under the plan while the plan remains a going concern, to the extent permitted by applicable pension legislation. (This report does not address the disposition of any surplus assets remaining in the event of plan windup.) If an applicable pension regulator or other entity with jurisdiction directs otherwise, certain financial measures contained in this report, including contribution requirements, may be affected.
Should these directions from the plan administrator be amended or withdrawn, Willis Towers Watson reserves the right to amend or withdraw this report.
Hydro One Inc. Hydro One Pension Plan Actuarial Valuation as at December 31, 2015 B–1
http://natct.internal.towerswatson.com/clients/601835/HydroOne2016RETGeneral/Documents/Hydro One 12.31.2015 RPP Valuation APP.doc
Appendix B: Assets
Statement of Market Value
(dollar amounts in thousands) December 31, 2015 December 31, 2013 Total assets $ 6,745,869 $ 5,743,450 Net additional outstanding amounts: l Contributions receivable $ 0 $ 0 l Benefits payable (2,254 ) (1,231 ) l Investment income receivable 0 0 l Total net outstanding amounts $ (2,254 ) $ (1,231 ) Total $ 6,743,615 $ 5,742,219
Comments:
l The invested assets are held by CIBC Mellon under account OHSG10000000.
l The data relating to the invested assets are based on the financial statements issued by KPMG. The data relating to net outstanding amounts were furnished by Hydro One Inc. All such data have been relied upon by Willis Towers Watson following tests of reasonableness with respect to contributions, benefit payments and investment income. However, Willis Towers Watson has not independently audited or verified these data.
The following table shows the target asset allocation stipulated by the plan’s defined benefit component investment policy in respect of various major asset classes and the actual asset allocation as at December 31, 2015.
Target asset allocation 1
Asset allocation as at December 31, 2015 2
Canadian equities 12 % 12 % Foreign equities 38 % 47 % Bonds and debentures 33 % 34 % Real estate and infrastructure 10 % 1 % Cash and short-term investments 2 % 4 % Private Equities 5 % 2 % Total 100 % 100 %
Notes:
1 This information was obtained from the investment policy in effect for the plan as at December 31, 2015. The target asset allocation is expected to remain in effect indefinitely and there are no expectations that the allocation will change in the future.
2 This information was obtained from Hydro One Inc. All such data have been relied upon by Willis Towers Watson and compared against the target asset allocation to assess reasonableness. However, Willis Towers Watson has not independently audited or verified these data.
Hydro One Inc. Hydro One Pension Plan Actuarial Valuation as at December 31, 2015 B–3
http://natct.internal.towerswatson.com/clients/601835/HydroOne2016RETGeneral/Documents/Hydro One 12.31.2015 RPP Valuation APP.doc
Reconciliation of Assets
(dollar amounts in thousands) Assets as at December 31, 2013 $ 5,743,450 Receipts: l Contributions:
– Employer normal actuarial cost $ 178,102 – Employer amortization payments 177,330 – Employer transfer deficiency payments 0 – Members' current service contributions 74,173 – Past service contributions 842 – Reciprocal transfers 267 – Provision for non-investment expenses 0 $ 430,714
l Investment return, net of investment expenses 1,283,944 l Total receipts $ 1,714,658 Disbursements: l Benefit payments:
– Pension payments $ (579,658 ) – Lump sum settlements (75,173 ) – Other benefit payments 0 $ (654,831 )
l Non-investment expenses (57,408 ) l Total disbursements $ (712,239 ) Assets as at December 31, 2015 $ 6,745,869
Comments:
l This reconciliation is based on the financial statements issued by KPMG. All such data have been relied upon by Willis Towers Watson following tests of reasonableness with respect to contributions, benefit payments and investment income. However, Willis Towers Watson has not independently audited or verified these data.
l The rate of return earned on the market value of assets, net of all expenses, from December 31, 2013 to December 31, 2015 is approximately 10.4% per annum.
(dollar amounts in thousands) December 31, 2011 December 31, 2012 December 31, 2013 December 31, 2014 December 31, 2015 Adjusted market value as at December 31, 2011 $ 4,693,703 Net cash flow for 2012 (98,786 ) Assumed investment return (5.5%) 255,473 Adjusted market value as at December 31, 2012 4,850,390 $ 5,004,546 Net cash flow for 2013 (126,979 ) (126,979 ) Assumed investment return (5.5%) 263,326 271,805 Adjusted market value as at December 31, 2013 4,986,737 5,149,372 $ 5,743,450 Net cash flow for 2014 (106,744 ) (106,744 ) (106,744 ) Assumed investment return (5.8%) 286,179 295,612 330,068 Adjusted market value as at December 31, 2014 5,166,172 5,338,240 5,966,774 $ 6,311,204 Net cash flow for 2015 (117,373 ) (117,373 ) (117,373 ) (117,373 ) Assumed investment return (5.8%) 296,282 306,262 342,717 362,695 Adjusted market value as at December 31, 2015 $ 5,345,081 $ 5,527,129 $ 6,192,118 $ 6,556,545 $ 6,745,869 Going Concern Value of Assets Average of the five adjusted market values as at December 31, 2015 $ 6,073,348 Net outstanding amounts (2,254 ) Going concern value of assets as at December 31, 2015 $ 6,071,094
Comments:
l The asset valuation method is described in Appendix C.
l The rate of return earned on the going concern value of assets, net of all expenses, from December 31, 2013 to December 31, 2015 is approximately 10.2% per annum.
Hydro One Inc. Hydro One Pension Plan Actuarial Valuation as at December 31, 2015 C-1
http://natct.internal.towerswatson.com/clients/601835/HydroOne2016RETGeneral/Documents/Hydro One 12.31.2015 RPP Valuation APP.doc
The going concern value of assets was calculated as the average of the market value of assets at the valuation date and the four previous years' adjusted market values. To obtain these adjusted market values, the market values at December 31 of each of the four preceding years were accumulated to the valuation date with net cash flow (i.e., contributions less benefit payments) and assumed investment return. Net cash flow was assumed to occur uniformly throughout each year. Assumed investment return for a year was calculated assuming that each year, the assets earned interest at the going concern discount rate in effect for that year. Finally, this 5-year average of adjusted market values was then adjusted for net additional outstanding amounts.
The objective of the asset valuation method is to produce a smoother pattern of going-concern surplus (deficit) and hence a smoother pattern of contributions, consistent with the long-term nature of a going concern valuation.
Such smoothing is achieved by use of an averaging process which systematically recognizes investment returns different from expectations over a five-year period, with 20% recognized at the valuation date and the remainder at a rate of 20% per year. This method will be expected to average periods of outperformance with periods of underperformance.
The expected return of the going concern discount rate has been selected to equal the expected return on the assets over long periods of time, with a margin for adverse deviations. As such, it is anticipated that, on average, the asset valuation method will tend to produce a result that is somewhat less than the market value of assets.
Actuarial Cost Method
The actuarial liability and the normal actuarial cost were calculated using the projected unit credit cost method.
Prospective benefits were calculated for each active and disabled member according to the plan provisions and actuarial assumptions. The actuarial liability was calculated as the actuarial present value of the member's prospective benefits accrued for credited service to date (the benefit accrual
method). The calculation of the actuarial present value of the member's prospective benefits reflects additional entitlements which may arise due to the application of the 50% employer cost-sharing rule, and is at least equal to the member's contributions with interest.
The actuarial liability for retired members and beneficiaries and terminated vested members was calculated as the actuarial present value of their respective benefits.
The employer normal cost for each active and disabled member was determined as the excess of the total normal cost over the member’s required contributions. The normal actuarial cost for each active and disabled member was calculated as the actuarial present value of the member's prospective benefits accruing in respect of credited service in the ensuing year, but not less than the member's required contributions. The employer normal actuarial cost for each active and disabled member was determined as the excess of the total normal actuarial cost over the member's required contributions. The normal actuarial cost rate determined by the projected unit credit cost method will be stable over time if the demographic characteristics of the active and disabled members remain stable from actuarial valuation to actuarial valuation. All other things being equal, a population of active and disabled members whose average age increases (decreases) between actuarial valuations will result in an increasing (decreasing) normal actuarial cost rate.
Additional Voluntary Contributions
For the purposes of the going concern valuation, the determination of the actuarial liability for the additional voluntary contributions does not involve the use of an actuarial cost method, nor does it involve actuarial assumptions. By definition, the actuarial liability under the additional voluntary contributions corresponds with the market value of the members' additional voluntary contribution accounts at the actuarial valuation date.
Hydro One Inc. Hydro One Pension Plan Actuarial Valuation as at December 31, 2015 C-3
http://natct.internal.towerswatson.com/clients/601835/HydroOne2016RETGeneral/Documents/Hydro One 12.31.2015 RPP Valuation APP.doc
Actuarial Assumptions
December 31, 2015 December 31, 2013 Economic Assumptions (per annum)
Liability discount rate 5.40% 5.80% Rate of salary increase 2.50% plus merit (see table 1) 2.75% plus merit (see table 1) Escalation of YMPE under Canada/Québec Pension Plan 1
3.00% 3.25%
Escalation of Income Tax Act (Canada) maximum pension limitation 2
3.00% 3.25%
Rate of inflation 2.00% 2.25% Interest on members' contributions
2.00% Same
Demographic Assumptions Mortality 95% of the 2014 Private Sector
Canadian Pensioners' Mortality Table, projected generationally using Scale CPM-B
Public Sector Canadian Pensioners’ Mortality Table, projected generationally using Scale CPM-B, not adjusted for pension size
Withdrawal Service-related rates (see Table 2a)
Age-related rates (see Table 2b)
Retirement/pension commencement
Age and service related rates (see Table 3a)
Age and service related rates (see Table 3b)
Disability rates Age-related rates (see Table 4) Same
Other Percentage of members with eligible spouses at pension commencement and electing joint and survivor pension form
90% Same
Years male spouse older than female spouse
3 4
Provision for non-investment expenses
None; return on plan assets is net of all expenses
1 The YMPE of $54,900 for 2016 is the starting value for the YMPE projection as at the current actuarial valuation and is indexed starting in 2016.
2 The Income Tax Act (Canada) maximum pension limit of $2,890 per year of service in 2016 is the starting value for maximum pension limit projection as at the current valuation and is indexed starting in 2016.
Table 1 Salary Increases due to Movement within the Salary Structure
The rationale for the material actuarial assumptions used in the going concern valuation is summarized below.
The going concern assumptions do not include margins for adverse deviations, except as noted below.
Liability discount rate
Actuarial valuation economic assumptions used for establishing the liability discount rate have been developed based on Willis Towers Watson’s capital market model. The capital market model simulates economic variables (e.g. inflation and yields) and asset class returns, with the assumptions being developed through both the analysis of historical rates and returns, and the application of econometric theory. In modeling inflation and bond yields, current conditions and long term expectations are used and the serial correlation inherent in these parameters is recognized.
Our long term nominal rate of return assumption was determined using the expected long term asset mix for the plan, which is consistent with the target mix found in the investment policy in effect for the plan as at the actuarial valuation date.
Based on Willis Towers Watson’s capital market model, a best estimate long term gross nominal rate of return as of December 31, 2015 of 6.05%. The following adjustments were subsequently made before selecting the discount rate assumption:
l Best estimate long term nominal rate of return before adjustments 6.05 % l Adjustment for investment expenses paid by the plan
(excluding active management fees) (0.04 ) l Adjustment for non-investment expenses paid by the plan (0.10 ) l Best estimate long term nominal rate of return after adjustments 5.91 %
In the selection of the discount rate, we have assumed that additional returns associated with employing an active investment management strategy would equal the additional expenses associated with employing such strategy. Consequently, we have disregarded any potential additional returns.
After allowing for a 0.54% margin for adverse deviations, we established the discount rate assumption for the plan as 5.40% (rate is rounded to the nearest 10 basis points).
Hydro One Inc. Hydro One Pension Plan Actuarial Valuation as at December 31, 2015 C-7
http://natct.internal.towerswatson.com/clients/601835/HydroOne2016RETGeneral/Documents/Hydro One 12.31.2015 RPP Valuation APP.doc
Rate of salary increase and service
The assumption reflects an assumed rate of inflation of 2.00% per annum, plus an allowance of 0.50% per annum for the effect of real economic growth and productivity gains in the economy. In addition, an allowance has been made for individual employee merit and promotion based on a scale which varies by age and service as shown in this Appendix C. The merit/promotion assumption is based on discussions with Hydro One Inc. management concerning their future expectations.
Escalation of YMPE under Canada/Québec Pension Plan
The YMPE is indexed annually based on increases in the Industrial Aggregate Wage index for Canada. The assumption reflects an assumed rate of inflation of 2.00% per annum, plus an allowance of 1.00% per annum for the effect of real economic growth and productivity gains in the economy.
Escalation of Income Tax Act (Canada) maximum pension limitation
The maximum pension limitation under the Income Tax Act (Canada) is scheduled to be indexed annually based on assumed increases in the Industrial Aggregate Wage index. The assumption reflects an assumed rate of inflation of 2.00% per annum, plus an allowance of 1.00% per annum for the effect of real economic growth and productivity gains in the economy.
Rate of inflation
The assumption reflects an estimate of future rates of inflation considering economic and financial market conditions at the actuarial valuation date. For the current valuation, the assumed inflation rate is 2.00% per annum. This assumption has been updated since the last actuarial valuation (2.25% per annum) to reflect current long term expectation.
Mortality
The 2014 Private Sector Canadian Pensioners' Mortality Table (CPM2014Priv) is based on a mortality experience study for calendar years 1999 to 2008 conducted by the Canadian Institute of Actuaries on a sample of Canadian registered pension plans. The CPM2014Priv table allows for adjustments to the mortality rates based on pension size and/or industry classification. Improvement Scale B (CPM-B) is a two-dimensional scale developed by the Canadian Institute of Actuaries based primarily on the mortality experience of pensioners under the Canada Pension Plan (CPP) and the Québec Pension Plan (QPP) up to 2007 as well as the assumptions used in the 26th CPP Actuarial Report.
Base mortality rates from the CPM2014Priv table, with a multiplier of 95% based on the plan's actual mortality experience are considered reasonable for the actuarial valuation of the plan. Applying improvement scale CPM-B generationally provides an allowance for improvements in mortality after 2014 and is considered reasonable for projecting mortality experience into the future.
At the previous actuarial valuation, the 2014 Public Sector Canadian Pensioners' Mortality Table projected generationally using CPM-B was used. The mortality table was changed as a result of a review of the actual historical mortality of plan members over the period 2007-2015.
Withdrawal
The rates of withdrawal were developed based on a review of plan experience for the years 2007 to 2015 and an assessment of future expectations.
The rates of withdrawal at the last actuarial valuation were developed based on a review of plan experience, performed by Mercer (Canada) Limited, for the years 2000 to 2006.
Percentage of involuntary terminations of employment
No allowance has been made for involuntary terminations of employment on the basis that the impact of including such an assumption and valuing statutory grow-in rights would not have a material impact on the actuarial valuation results.
Disability incidence/recovery
The rates of disability incidence/recovery are based on a prior assessment performed by Mercer (Canada) Limited. The use of a different assumption would not have a material impact on the actuarial valuation results.
Retirement from active membership
The rates of retirement were developed based on a review of plan experience for the years 2007 to 2015 and an assessment of future expectations. All members are assumed to commence their pension at their retirement date.
The rates of retirement at the last actuarial valuation were developed based on a review of plan experience, performed by Mercer (Canada) Limited, for the years 2000 to 2006.
Pension commencement after termination of employment
All terminated members are assumed to commence their pension at the age that produces the highest liability value based on the plan’s subsidized early retirement reductions applicable to terminated members commencing their pension prior to normal retirement age.
Hydro One Inc. Hydro One Pension Plan Actuarial Valuation as at December 31, 2015 C-9
http://natct.internal.towerswatson.com/clients/601835/HydroOne2016RETGeneral/Documents/Hydro One 12.31.2015 RPP Valuation APP.doc
Percentage of members with eligible spouses at pension commencement and electing joint and survivor pension form
When provided, the actual data for the spouse and form of payment were used for retired members. For other members, the assumed percentage of members with a spouse is based on the percentages for the general population and an assessment of future expectations for members of the plan.
Years male spouse older than female spouse
When provided, the actual data for the spouse were used for retired members. For other members, the assumption is based on surveys of the age difference in the general population, a review of plan data for the years 2006 to 2015, and an assessment of future expectations for members of the plan.
This assumption has been updated from 4 years at the last valuation to 3 years at the current valuation.
Provision for non-investment expenses
The liability discount rate is net of all expenses. The assumed level of expenses reflected in the liability discount rate is based on recent experience of the plan and an assessment of future expectations.
Hydro One Inc. Hydro One Pension Plan Actuarial Valuation as at December 31, 2015 D-1
http://natct.internal.towerswatson.com/clients/601835/HydroOne2016RETGeneral/Documents/Hydro One 12.31.2015 RPP Valuation APP.doc
Appendix D: Actuarial Basis − Solvency and Hypothetical Windup Valuations
Methods
Asset Valuation Method
The market value of assets, adjusted for net outstanding amounts, has been used for the solvency and hypothetical windup valuations. The resulting value has been reduced by a provision for plan windup expenses.
The adjustment in respect of the smoothing of solvency assets for purposes of determining the statutory solvency deficiency was calculated as the difference between the actuarial value of assets used for the going concern valuation and the market value of assets.
Liability Calculation Method
The solvency and hypothetical windup liabilities were calculated using the traditional unit credit cost method.
The solvency and hypothetical windup liabilities for active and disabled members were calculated as the actuarial present value of all benefits accrued up to the actuarial valuation date. This calculation reflects additional entitlements which may arise due to the application of the 50% employer cost-sharing rule, and is at least equal to the member's contributions with interest.
The solvency and hypothetical windup liabilities for retired members and beneficiaries and terminated vested members were calculated as the actuarial present value of their respective benefits.
Other Considerations
The solvency and hypothetical windup valuations have been prepared on a hypothetical basis. In the event of an actual plan windup, the plan assets may have to be allocated between various classes of plan members or beneficiaries as required by applicable pension legislation. Such potential allocation has not been performed as part of these solvency and hypothetical windup valuations.
For the purposes of the solvency and hypothetical windup valuations, the determination of the liability for the additional voluntary contributions does not involve the use of a liability calculation method, nor does it involve actuarial assumptions. By definition, the solvency and hypothetical windup liability under the additional voluntary contributions corresponds with the market value of the members' additional voluntary contribution accounts at the actuarial valuation date.
Hydro One Inc. Hydro One Pension Plan Actuarial Valuation as at December 31, 2015 D-3
http://natct.internal.towerswatson.com/clients/601835/HydroOne2016RETGeneral/Documents/Hydro One 12.31.2015 RPP Valuation APP.doc
Solvency Incremental Cost Actuarial Method
The solvency incremental cost for a given year represents the present value, at the actuarial valuation date, of the expected aggregate change in the defined benefit solvency liability during the year, increased for expected benefit payments during the year.
The solvency incremental cost reflects expected decrements and related changes in membership status, accrual of service, any expected changes in benefits, entitlements, members' contributions, pension formula or increases in the maximum pension limits, and projected pensionable earnings during the year.
The solvency incremental cost has been calculated for each year until the next actuarial valuation date as the projected solvency liability at the end of the year, minus the solvency liability at the beginning of the year, increased for expected benefit payments during the year. Each of these amounts is discounted to the actuarial valuation date using the projected solvency liability discount rate.
The method used to calculate the projected solvency liabilities at each projection year is the same as used in the solvency valuation.
December 31, 2015 December 31, 2013 Economic Assumptions (per annum) Liability discount rate (before averaging for solvency and for hypothetical windup)
l Annuity purchase (non-indexed) 3.10% 3.90% l Annuity purchase (fully-indexed) -0.05% 0.15% l Annuity purchase (partially-indexed) 1 0.74% 1.10% l Commuted value (non-indexed) 2.10% for 10 years, 3.70%
thereafter 3.00% for 10 years, 4.60% thereafter
l Commuted value (fully-indexed) 1.30% for 10 years, 1.80% thereafter
1.70% for 10 years, 2.30% thereafter
l Commuted value (partially-indexed) 1 1.50% for 10 years, 2.30% thereafter
2.00% for 10 years, 2.90% thereafter
Liability discount rate (after averaging for solvency)
l Annuity purchase 3.58% 3.85% l Commuted value 2.52% for 10 years, 3.96%
thereafter 3.08% for 10 years, 4.54% thereafter
Discount rate for determining amortization payments 2
3.40% 3.70%
Escalation of Income Tax Act (Canada) maximum pension limitation 3
1.16% for 10 years, 2.20% thereafter
1.46% for 10 years, 2.43% thereafter
Demographic Assumptions Mortality CPM2014 Canadian
Pensioners' Mortality Table, projected generationally using Scale CPM-B
1994 Uninsured Pensioner Mortality Table, projected generationally using Scale AA
Withdrawal N/A Same Disability incidence/recovery N/A Same Retirement/pension commencement Described in detail on
page D-8 Same
Hydro One Inc. Hydro One Pension Plan Actuarial Valuation as at December 31, 2015 D-5
http://natct.internal.towerswatson.com/clients/601835/HydroOne2016RETGeneral/Documents/Hydro One 12.31.2015 RPP Valuation APP.doc
December 31, 2015 December 31, 2013
Other Percentage of members with eligible spouses at pension commencement and electing joint and survivor pension form
90% Same
Years male spouse older than female spouse 3 4 Percentage of members receiving settlement by commuted value 4
Retired members and beneficiaries: 0% Other members: l not eligible for
retirement: 70% l eligible for retirement:
40%
Same
Provision for expenses l Solvency 0.25% of assets Same l Hypothetical windup 0.25% of assets Same
Notes:
1 Applicable to New Society and New Management members only. 2 Equal to the liability-weighted average of the liability discount rates for settlements by commuted value transfer (rate in effect for the
first 10 years) and annuity purchase. 3 The Income Tax Act (Canada) maximum pension limit of $2,890 per year of service in 2016 is the starting value for maximum
pension limit projection as at the current valuation and is indexed starting in 2016. 4 The balance are assumed to receive settlement by annuity purchase.
The rationale for the material actuarial assumptions used in the solvency and hypothetical windup valuations is summarized below.
The actuarial assumptions used in the solvency and hypothetical windup valuations do not include margins for adverse deviations.
Liability discount rate
Discount Rates for Solvency (before averaging) and Hypothetical Windup
In the event of a plan windup, it is expected that a portion of the liabilities will be settled by a group annuity purchase and the balance of the liabilities will be settled by commuted value transfers.
For the calculation of the portion of the solvency and hypothetical windup liabilities relating to the benefits that are expected to be settled by a group annuity purchase, the liability discount rate corresponds to an approximation of the annuity purchase rates as at the actuarial valuation date following application of the relevant guidance on assumptions for solvency and hypothetical windup valuations issued by the Canadian Institute of Actuaries’ Committee on Pension Plan Financial Reporting. The guidance provides that the approximation of the annuity purchase rate varies in accordance with the duration of the liabilities for non-indexed benefits assumed to be settled by group annuity. The duration of the liabilities assumed to be settled through the purchase of non-indexed annuities is 11.8.
For the calculation of the portion of the solvency and hypothetical windup liabilities relating to the benefits that are expected to be settled by commuted value transfers, the liability discount rates have been determined in accordance with the Standards of Practice for Pension Commuted Values in effect at the valuation date. For this actuarial valuation, the December 2015 rates have been used.
Discount Rates for Solvency (after averaging)
l The average discount rates for calculation of the statutory solvency deficiency are based on the following: Benefits that are expected to be settled by a group annuity purchase:
The average of the annualized approximate annuity purchase rates at December 31, 2015 and the four previous year-ends 1, determined as follows:
Hydro One Inc. Hydro One Pension Plan Actuarial Valuation as at December 31, 2015 D-7
http://natct.internal.towerswatson.com/clients/601835/HydroOne2016RETGeneral/Documents/Hydro One 12.31.2015 RPP Valuation APP.doc
December 31, 2011 3.79% December 31, 2012 3.44% December 31, 2013 4.38% December 31, 2014 3.18% December 31, 2015 3.10% Average 3.58%
Note:
1 The approximate annuity purchase interest rates prior to October 1, 2015 have been adjusted to reflect the change in the mortality table assumption applicable to the determination of liabilities settled by group annuity purchase.
l Benefits that are expected to be settled by commuted value transfers:
The average of the interest rates determined under the Standards of Practice for Pension Commuted Values, published by the Canadian Institute of Actuaries, at December 31, 2015 and the four previous year-ends1, determined as follows:
Rate for 10 years Rate after 10 years December 31, 2011 2.60% 4.10% December 31, 2012 2.40% 3.60% December 31, 2013 3.00% 4.60% December 31, 2014 2.50% 3.80% December 31, 2015 2.10% 3.70% Average 2.52% 3.96%
Note:
1 The Standards of Practice for Pension Commuted Values effective on December 31, 2015 are assumed to have always been in effect when determining the interest rates prior to October 1, 2015.
Escalation of Income Tax Act (Canada) maximum pension limitation
The maximum pension limitation under the Income Tax Act (Canada) is scheduled to be indexed annually based on assumed increases in the Industrial Aggregate Wage index. This assumption has been determined as the underlying inflation rates from the rates applicable to benefits expected to be settled by commuted value transfers (after averaging for solvency). For simplicity, this assumption has also been used for the benefits that are expected to be settled by a group annuity purchase.
For the benefits that are expected to be settled by a group annuity purchase, the assumption has been set following application of the relevant guidance on assumptions for solvency and hypothetical windup valuations issued by the Canadian Institute of Actuaries’ Committee on Pension Plan Financial Reporting.
For benefits that are expected to be settled by commuted value transfers, the assumption has been determined in accordance with the Standards of Practice for Pension Commuted Values in effect at the valuation date. No pre-retirement mortality has been assumed in order to approximate the value of pre-retirement death benefits.
Retirement/pension commencement
For active and disabled members:
l Members eligible to retire: pension commences at the age that produces the highest actuarial value (including statutory grow-in rights).
l Members with age plus continuous service greater than or equal to 55 years and employed in Ontario or Nova Scotia: pension commences at the age that produces the highest actuarial value of pension (including statutory grow-in rights).
l Other members: pension commences at the age that produces the highest actuarial value
For deferred vested members:
l Members are assumed to retire at the earliest age at which they qualify for an unreduced pension.
For the benefits that are expected to be settled by a group annuity purchase, this is consistent with the expected assumption that will be used by insurers to price the group annuity. For benefits that are expected to be settled by commuted value transfers, this assumption is in accordance with the Canadian Institute of Actuaries’ Standards of Practice for Pension Commuted Values.
Percentage of members with eligible spouses at pension commencement and electing joint and survivor pension form
See rationale for going concern assumptions in Appendix C.
Years male spouse older than female spouse
See rationale for going concern assumptions in Appendix C.
Hydro One Inc. Hydro One Pension Plan Actuarial Valuation as at December 31, 2015 D-9
http://natct.internal.towerswatson.com/clients/601835/HydroOne2016RETGeneral/Documents/Hydro One 12.31.2015 RPP Valuation APP.doc
Percentage of members receiving settlement by commuted value transfer
This assumption has been determined by considering the benefit provisions of the plan, legislative requirements to offer specific settlement options to various classes of members, and, in particular, the options to be provided to members upon plan windup.
The assumption also reflects the expectation that members further from retirement are more likely to elect to settle their pension benefit by a commuted value transfer, while members closer to retirement are more likely to elect to settle their pension benefit through a group annuity purchase where this option is available.
Provision for expenses
Allowance was made for normal administrative, actuarial, legal and other costs which would be incurred if the plan were to be wound up (excluding costs relating to the resolution of surplus or deficit issues). The actuarial valuation is premised on a scenario in which the employer continues to operate after the windup date. In establishing the allowance for plan windup costs, certain administrative costs were assumed to be paid from the pension fund (consistent with past practice) while other costs were assumed to be borne directly by the employer.
Demographic and Benefit Projection Actuarial Assumptions
Except as noted below, the projected population, benefits and members' contributions valued in the solvency liability projection are based on the demographic and benefit projection assumptions used for the going concern valuation described in Appendix C.
New entrants
An allowance has been made for new entrants for the Post-Society and PWU groups only, between the current actuarial valuation date and next actuarial valuation date. The new entrants profile is assumed to be similar to the profile of average new entrants in the plan over the years 2008-2012. We have assumed no new entrants under the management group as new management employees are not entitled to join this plan. Membership in the PWU and Society groups is assumed to remain stable over the projection period.
The solvency liability projections for purposes of calculating the solvency incremental cost are based on the assumptions used for the solvency valuation described previously.
Hydro One Inc. Hydro One Pension Plan Actuarial Valuation as at December 31, 2015 E-1
http://natct.internal.towerswatson.com/clients/601835/HydroOne2016RETGeneral/Documents/Hydro One 12.31.2015 RPP Valuation APP.doc
Appendix E: Membership Data
Summary of Membership Data
Active members
December 31, 2015 December 31, 2013 l Number 5,355 5,360 l Average age 44.1 44.1 l Average credited service 13.3 13.5 l Annual payroll $ 543,523,888 $ 512,892,395 l Average salary $ 101,498 $ 95,689 l Accumulated contributions with interest $ 367,013,623 $ 344,471,267
Disabled Members
December 31, 2015 December 31, 2013 l Number 131 127 l Average age 54.9 55.4 l Average credited service 23.4 24.3 l Annual payroll $ 11,169,636 $ 10,152,527 l Average salary $ 85,264 $ 79,941 l Accumulated contributions with interest $ 9,230,244 $ 9,175,783
Comment:
l The following distribution relates to active and disabled members. The following meanings have been assigned to age, credited service and earnings:
December 31, 2015 December 31, 2013 l Number 5,502 5,445 l Average age 71.5 71.1 l Total annual pension $ 240,389,865 $ 215,558,746 l Average annual pension1 $ 43,691 $ 39,588 l Total temporary annual pension $ 24,642,237 $ 25,163,484
Beneficiaries and survivors
December 31, 2015 December 31, 2013 l Number 1,777 1,793 l Average age 80.4 79.9 l Total annual pension $ 44,098,256 $ 41,483,088 l Average annual pension $ 24,816 $ 23,136 l Total temporary annual pension $ 460,627 $ 487,347
Terminated vested members
December 31, 2015 December 31, 2013 l Number 294 292 l Average age 53.5 53.2 l Total annual pension2 $ 2,872,957 $ 2,543,201 l Average annual pension $ 9,772 $ 8,710
Notes:
1 Excluding temporary annual pension. 2 Prior to application of Income Tax Act maximum pension limits.
Hydro One Inc. Hydro One Pension Plan Actuarial Valuation as at December 31, 2015 E-5
http://natct.internal.towerswatson.com/clients/601835/HydroOne2016RETGeneral/Documents/Hydro One 12.31.2015 RPP Valuation APP.doc
Review of Membership Data
The membership data were supplied by Hydro One Inc.’s third-party administrator, Morneau Shepell, as at December 31, 2015.
The membership data have been relied upon by Willis Towers Watson following tests for reasonableness and found to be sufficient and reliable for the purposes of the actuarial valuation. Elements of the data review included the following:
l ensuring that the data were intelligible (i.e., that an appropriate number of records was obtained, that the appropriate data fields were provided and that the data fields contained valid information);
l preparation and review of membership reconciliations to ascertain whether the complete membership of the plan appeared to be accounted for;
l preparation and review of age and service distributions for active and disabled member for reasonableness;
l review of consistency of individual data items and statistical summaries between the current actuarial valuation and the previous actuarial valuation;
l review of reasonableness of individual data items, statistical summaries and changes in such information since the previous actuarial valuation date; and
l comparison of the membership data and the plan’s financial statements for consistency.
However, the tests conducted as part of the membership data review may not have captured certain deficiencies in the data. We have also relied on the certification of the plan administrator as to the quality of the data.
(without beneficiary)1 0 0 0 (148 ) (215 ) (363 ) l Deceased (with beneficiary) (7 ) (4 ) 0 (184 ) 195 0 l New ex-spouse 0 0 0 0 4 4 l Data corrections (1 ) 0 (2 ) 0 0 (3 ) l Net change (5 ) 4 2 57 (16 ) 42 As at December 31, 2015 5,355 131 294 5,502 1,777 13,059 1 Includes pensioners whose guarantee period has expired.
Hydro One Inc. Hydro One Pension Plan Actuarial Valuation as at December 31, 2015 F–1
HTTP://NATCT.INTERNAL.TOWERSWATSON.COM/CLIENTS/601835/HYDROONE2016RETGENERAL/DOCUMENTS/HYDRO ONE 12.31.2015 RPP VALUATION APP.DOC
Appendix F: Summary of Plan Provisions The following is an outline of the principal features of the plan which are of financial significance to valuing the plan benefits. This summary is based on the most recently restated plan document as at January 1, 2000 and amendments up to and including the valuation date, as provided by Hydro One Inc., and does not make any provisions for the possibility that a change or action (retroactive or otherwise) could be imposed by order of a regulatory body or a court. It is not a complete description of the plan terms and should not be relied upon for administration or interpretation of benefits. For a detailed description of the benefits, please refer to the plan document.
Membership
The following categories of employees are members of the Pension Plan:
a) All regular employees (see Note 1a and Note 1b);
b) Employees for whom the Office and Professional Employees International Union was the bargaining agent prior to July 30, 1982;
c) Continuing construction employees who were members admitted to the Ontario Electricity Financial Corporation Pension Plan and its predecessors;
d) Employees who became continuing construction clerical employees after July 29,1982 and before August 8, 1984;
e) Employees who have completed three months of continuous employment as a probationary employee (see Note 1a and Note 1b).
Note 1a: Management employees hired on or after January 1, 2004 and Society represented employees hired on or after November 17, 2005 are eligible after completing three months of continuous employment but are not required to join the Pension Plan.
Note 1b: Management employees who were not eligible to elect to become a member of the Pension Plan on or after September 30, 2015 are no longer eligible to join the Pension Plan.
Any other employee who has completed twenty-four months of continuous employment and who has at least 700 hours of employment or earnings of 35% of the Year’s Maximum Pensionable Earnings (“YMPE”), as defined under the Canada Pension Plan in each of the two previous consecutive calendar years, may elect to become a member of the Pension Plan.
a) Female members whose continuous employment commenced prior to January 1, 1976: The first day of the month when she in fact retires, coincident with or next following the attainment of age 60 or any subsequent month up to the month coincident with or next following her 65th birthday.
b) All other members: The first day of the month coincident with or next following the attainment of age 65.
Amount of Accrued Pension
Life Pension
a) 2% of the member’s “high three-year average” (see Note 5) for each year of credited service, subject to a maximum of 35 years (see Note 2).
Note 2: For Management employees hired on or after January 1, 2004, and Society represented employees hired on or after November 17, 2005 the reference to “high three-year average” is changed to “high five-year average” for pensionable service while a Management or Society-represented employee.
LESS
b) 0.625% of the member’s “high five-year average” up to the “average YMPE” (see Note 5) for each year of credited service included in (a) above subsequent to December 31, 1965, subject to a maximum of 35 years – see Note 3.
Note 3: Effective July 1, 2001, for members of the PWU, and effective January 1, 2004, for Society represented members hired before November 17, 2005; the factor is reduced from 0.625% to 0.50%.
Bridge Pension (see Note 4)
0.625% of the member’s “high five-year average” up to the “average YMPE” (see Note 5) for each year of credited service included in (a) above, subject to a maximum of 30 years, multiplied by 35, and divided by 30. This is generally payable until age 65.
The bridge benefit is reduced for early retirement in accordance with the same early retirement reduction provision applicable to the early retirement life pension described below.
Note 4: For Management employees hired on or after January 1, 2004 and Society represented employees hired on or after November 17, 2005, no bridge pension is payable for pensionable service
Hydro One Inc. Hydro One Pension Plan Actuarial Valuation as at December 31, 2015 F–3
HTTP://NATCT.INTERNAL.TOWERSWATSON.COM/CLIENTS/601835/HYDROONE2016RETGENERAL/DOCUMENTS/HYDRO ONE 12.31.2015 RPP VALUATION APP.DOC
while a Management or Society-represented employee. Effective January 1, 2018, Society represented employees hired on or after November 17, 2005 will be entitled to a bridge benefit equal to 0.625% up to the average YMPE for each year of service from January 1, 2018 onward while the member is earning a benefit under the basic formula.
Note 5: “High three-year average”/ “high five-year average” is the average of the member’s base annual earnings plus bonuses up to a set percentage during the 36/60 consecutive months when the base earnings were highest. For earnings after 1999, the percentage of bonus under the performance achievement plan included in pensionable earnings is 50%. The “average YMPE” is the average of the YMPE’s during the 60 consecutive months when the base earnings were highest.
Early Retirement
Age Plus Service (See Note 7)
A member may retire prior to the normal retirement date without any reduction in the accrued pension, if the sum of the member’s age and years of continuous employment is equal to or greater than 82 or the member has 35 years of continuous employment, whichever occurs first (see Note 6).
Note 6: For Management employees hired on or after January 1, 2004 and Society represented employees hired on or after November 17, 2005, retirement without reduction is available when the sum of the employee’s age and years of pensionable service is equal to or greater than 85 or the employee has 35 years of pensionable service, whichever occurs first.
25 or More Years of Continuous Employment (see Note 7)
A member who does not qualify for the early retirement provisions above who is at least age 55 and has 25 or more years of continuous employment may retire prior to age 60, in which case the member’s accrued pension is reduced by 3% for each year by which early retirement precedes age 60. These reductions also apply to members who elected a deferred pension when they left the Pension Plan and had 25 or more years of continuous employment.
Female Members with More Than 15 Years or Other Members with 15 or More Years but Less than 25 Years of Continuous Employment (see Note 7)
A female member whose continuous employment commenced prior to 1976 with at least 15 years of continuous employment, or any other member with 15 or more years but less than 25 years of continuous employment, who does not qualify for any of the previously mentioned early retirement provisions, may retire within 10 years of normal retirement date. In such a case the member’s accrued pension is reduced by 2% for each year up to five years and 3% for each additional year by which the early retirement date precedes the member’s normal retirement date.
These reductions apply with respect to a female member whose employment commenced prior to 1976 and who has a deferred pension and at least 25 years of continuous employment at retirement. For any other members who have a deferred vested pension and have fewer than 25 years of continuous employment and are at least age 55 when they request that the pension payments begin, the deferred vested pension will be actuarially reduced (unless the member was eligible for an unreduced early retirement provision in effect when the member terminated active employment).
Other Members
A member, who does not qualify under any of the previously mentioned early retirement provisions, may retire within 10 years of normal retirement date. If the retirement occurred prior to July 1, 2012, the member is also required to have at least two years of Pension Plan membership. In such a case, the pension is the actuarial equivalent of the member’s deferred pension provided that the reduction shall not be less than the minimum early retirement reduction required under the Income Tax Act (Canada).
Terminated Members with Deferred Pensions
A terminated member with a deferred pension may retire under any of the previously mentioned provisions for early retirement without reduction provided that such provision was in effect on the date of termination. In addition, if the member’s employment is terminated on or after July 1, 2012, the member may be eligible for grow-in benefits under the Pension Benefits Act (Ontario) (“PBA”), resulting in the member being entitled to early retirement benefits under the Pension Plan that the member would not otherwise be eligible to receive on the date of termination.
Note 7: For Management employees hired on or after January 1, 2004 and Society represented employees hired on or after November 17, 2005 all references to “continuous employment” are to be replaced with “pensionable service” for service while a Management or Society-represented employee.
Postponed Retirement
Members who work past their normal retirement date shall continue to accrue benefits until December 1st of the calendar year they reach age 71 (or the Income Tax Act age limit, if different), they reach the 35 year service limit, or they terminate employment, whichever occurs first. If a member reaches 35 years of service and ceases contributions to the Pension Plan, service after 35 years is not counted in the calculation of the member’s pension, but the pension is calculated using the member’s base earnings up to the date of postponed retirement. If the member works past age 71, the member’s pension will commence to be paid not later than December 1st of the year in which the member turns age 71.
Pension Increases
Pension increases of 100% (see Note 8) of the increase in the Consumer Product Index (“CPI”) (Ontario), for the 12-month period ending in June of the previous year , will be given every January 1
Hydro One Inc. Hydro One Pension Plan Actuarial Valuation as at December 31, 2015 F–5
HTTP://NATCT.INTERNAL.TOWERSWATSON.COM/CLIENTS/601835/HYDROONE2016RETGENERAL/DOCUMENTS/HYDRO ONE 12.31.2015 RPP VALUATION APP.DOC
to pensioners, beneficiaries and terminated employees with deferred pensions to an annual maximum of 8% each year after 1999. Any excess will be carried forward to use in future years up to the 8% limit.
Note 8: For Management employees hired on or after January 1, 2004 and Society represented employees hired on or after November 17, 2005, pension increases of 75% CPI (Ontario) for the 12-month period ending in June of the previous year will be given every January 1, to an annual maximum increase of 5%, with no carry forward.
Disability
A totally disabled employee receives benefits from an income replacement plan and ceases to contribute to the Pension Fund, but continues to accrue credited service. For this member, the base annual earnings for pension purposes are deemed to be increased by the same percentage increases described for pensions above.
Employee Contributions
Members, not represented by the Society or PWU, contribute at the following rates until they complete 35 years of credited service:
On and after April 1, 2015,
i. 6.25% of base annual earnings up to the YMPE; and
ii. 8.25% of base annual earnings in excess of the YMPE;
up to the limits established by the Income Tax Act.
Members represented by the Society hired on or after November 17, 2005 contribute at the following rates until they complete 35 years of credited service (see Note 9):
Up to and including March 31, 2016,
i. 6.50% of base annual earnings up to the YMPE; and
ii. 8.50% of base annual earnings in excess of the YMPE;
On and after April 1, 2016,
i. 7.00% of base annual earnings up to the YMPE; and
ii. 9.00% of base annual earnings in excess of the YMPE;
On and after April 1, 2017,
i. 7.75% of base annual earnings up to the YMPE; and
ii. 9.75% of base annual earnings in excess of the YMPE;
On and after April 1, 2018
i. 8.25% of base annual earnings up to the YMPE; and
ii. 10.75% of base annual earnings in excess of the YMPE;
up to the limits established by the Income Tax Act.
Members represented by the Society hired before November 17, 2005 contribute at the following rates until they complete 35 years of credited service (see Note 9):
Up to and including March 31, 2016,
iii. 6.50% of base annual earnings up to the YMPE; and
iv. 8.50% of base annual earnings in excess of the YMPE;
On and after April 1, 2016,
iii. 7.00% of base annual earnings up to the YMPE; and
iv. 9.00% of base annual earnings in excess of the YMPE;
On and after April 1, 2017,
iii. 7.75% of base annual earnings up to the YMPE; and
iv. 9.75% of base annual earnings in excess of the YMPE;
On and after April 1, 2018
iii. 8.75% of base annual earnings up to the YMPE; and
iv. 11.25% of base annual earnings in excess of the YMPE;
up to the limits established by the Income Tax Act.
Note 9: For Society represented members hired before November 17, 2005, contributions increase by 0.5% in the event that after January 1, 2004 a valuation report reveals that the solvency assets are lower than 106% of the solvency liabilities. Effective April 1, 2018 this clause is no longer applicable.
Members represented by the PWU contribute at the following rates until they complete 35 years of credited service:
Up to and including March 31, 2016,
i. 7.25% of base annual earnings up to the YMPE; and
ii. 9.25% of base annual earnings in excess of the YMPE;
On and after April 1, 2016,
i. 8.25% of base annual earnings up to the YMPE; and
ii. 10.25% of base annual earnings in excess of the YMPE;
On and after April 1, 2017,
i. 8.75% of base annual earnings up to the YMPE; and
ii. 11.25% of base annual earnings in excess of the YMPE;
up to the limits established by the Income Tax Act.
Hydro One Inc. Hydro One Pension Plan Actuarial Valuation as at December 31, 2015 F–7
HTTP://NATCT.INTERNAL.TOWERSWATSON.COM/CLIENTS/601835/HYDROONE2016RETGENERAL/DOCUMENTS/HYDRO ONE 12.31.2015 RPP VALUATION APP.DOC
Death Before Retirement
No Surviving Spouse or Eligible Dependent Children
Fewer than two years of Pension Plan membership (Deaths prior to July 1, 2012)
The member’s beneficiary or estate receives a cash refund of the member’s contributions plus interest.
Two or more years of Pension Plan membership
The beneficiary or estate will receive the following:
• For pre-1987 service: a cash refund of the member’s contributions plus interest.
• For post-1986 service: a lump sum equal to the commuted value of the member’s pension earned since 1986, plus a refund of any excess contributions.
For deaths occurring on or after July 1, 2012, the beneficiary or estate will be entitled to the death benefits described above regardless of the member’s length of service.
Surviving Spouse (see Note 10)
Fewer than two years of Pension Plan membership and less than 10 years of continuous employment
The beneficiary or estate receives a cash refund of the member’s contributions plus interest.
Fewer than two years of Pension Plan membership and more than 10 years of continuous employment
The surviving spouse receives an immediate pension of 66.67% of the member’s accrued pension earned to the date of death.
More than two years of Pension Plan membership, but less than 10 years of continuous employment
For pre-1987 service: The beneficiary or estate receives a cash refund of the member’s contributions plus interest.
For post-1986 service:
• The beneficiary or estate receives a refund of any excess member contributions; and
• The surviving spouse chooses either:
a. a lump-sum payment equal to the commuted value of the pension earned after 1986, or
b. an immediate or deferred pension with a commuted value equal to pension earned after 1986.
More than two years of Pension Plan membership, and more than 10 years of continuous employment
For pre-1987 service: The surviving spouse receives an immediate pension of 66.67% of the member’s accrued pension earned prior to 1987.
For post-1986 service:
• The beneficiary or estate receives a refund of any excess member contributions; and
a. a lump-sum payment equal to the commuted value of the pension earned after 1986, or
b. an immediate or deferred pension with a commuted value equal to pension earned after 1986. The immediate pension will not be less than 66.67% of the pension earned after 1986.
Note 10: For deaths occurring on or after July 1, 2012, the surviving spouse’s entitlement to death benefits for post-1986 service shall be determined without reference to whether the member had more or less than two years of Pension Plan membership. In addition, for deaths occurring on or after July 1, 2012, if the surviving spouse is entitled to the death benefits in respect of the member’s post-1986 service, the surviving spouse is also entitled to an amount equal to the member’s contributions, with interest, in respect of pre-1987 service, rather than the designated beneficiary or estate.
Dependent Children, No Surviving Spouse
If the member completed 10 years of continuous employment, the survivor’s pension is payable to the surviving spouse until death or, if there is no eligible spouse, to the dependent children until age 18 (longer if disabled or in full-time attendance at a school or university). The total benefits paid are subject to a minimum of the member’s contributions with interest. A payment of the commuted value of the member’s deferred pension less the commuted value of the pension payable to any dependent children is made to the beneficiary or estate.
Death After Retirement
A survivor’s pension, being an amount equal to 66.67% of the pension to which the member would have been entitled, is payable on death after retirement to the surviving spouse, subject to other options chosen at the time of retirement. If the survivor spouse subsequently dies and is survived by the dependent children, or the member does not have a surviving spouse and is survived only by dependent children, the 66.67% survivor pension is split among the dependent children and is payable to age 18 (longer if disabled or in full-time attendance at a school or university).
If the member does not have a surviving spouse at retirement, the normal form of pension is a pension payable for life with a guarantee of 60 payments.
Optional forms of pension are available on an actuarially equivalent basis.
Termination of Employment (see Note 12)
Less Than One Year of Pension Plan Membership
A cash refund of the member’s contributions plus interest.
More Than One Year But Fewer Than Two Years of Pension Plan Membership
Hydro One Inc. Hydro One Pension Plan Actuarial Valuation as at December 31, 2015 F–9
HTTP://NATCT.INTERNAL.TOWERSWATSON.COM/CLIENTS/601835/HYDROONE2016RETGENERAL/DOCUMENTS/HYDRO ONE 12.31.2015 RPP VALUATION APP.DOC
The member is entitled to elect a cash refund of the member’s contributions plus interest, or may leave the earned pension benefit in the Pension Plan to be paid upon retirement.
More Than Two Years but fewer than 10 Years of Pension Plan Membership and, either under Age 45, or Fewer Than 10 Years of Continuous Employment
For pre-1987 service: the member is entitled to a cash refund of the member’s contributions plus interest, or may leave all of the earned pension benefit in the Pension Plan until retirement.
For post-1986 service: the member is entitled to leave all of the earned pension benefit in the Pension Plan until retirement; or to transfer (see Note 11) the commuted value of the earned pension.
More Than Two Years but fewer than 10 Years of Pension Plan Membership, and Age 45 or Older with More Than 10 Years of Continuous Employment
For pre-1987 service: the member is entitled to leave all of the earned pension benefit in the Pension Plan until retirement; or to transfer (see Note 11) 75% of the commuted value of the pension and receive a refund of 25% of the commuted value of your earned pension; or to leave 75% of the earned pension benefit in the Pension Plan until retirement, and receive a refund of 25% of the commuted value of the earned pension.
For post-1986 service: the member is entitled to leave all of the earned pension benefit in the Pension Plan until retirement; or to transfer (see Note 11) the commuted value of the earned pension.
More Than 10 Years of Pension Plan Membership, But Younger Than Age 45
For service from 1965 to 1986: the member is entitled to a cash refund of the member’s contributions plus interest; or to leave all of the earned pension benefit in the Pension Plan until retirement; or to leave 75% of the earned pension benefit in the Pension Plan until retirement and receive a refund of 25% of the commuted value of the earned pension.
For post-1986 service: the member is entitled to leave all of the earned pension benefit in the Pension Plan until retirement; or to transfer (see Note 11) the commuted value of the earned pension.
More than 10 Years of Pension Plan Membership and Age 45 or Older
For pre-1965 service: the member is entitled to a cash refund of the member’s contributions plus interest; or to leave all of the earned pension benefit in the Pension Plan until retirement; or to leave 75% of the earned pension benefit in the Pension Plan until retirement and receive a refund of 25% of the commuted value.
For service from 1965 to 1986: the member is entitled to leave all of the earned pension benefit in the Pension Plan until retirement; or to leave 75% of the earned pension benefit in the Pension Plan until retirement and receive a refund of 25% of the commuted value; or to transfer (see Note 11) the greater of the commuted value of 75% of the earned pension or the member’s contributions with interest and receive a refund of 25% of the commuted value of the earned pension.
For post 1986 service: the member is entitled to leave all of the earned pension benefit in the Pension Plan until retirement; or to transfer the commuted value of the earned pension.
If a member is terminated on or after July 1, 2012, the member may be eligible for grow-in benefits under the PBA, which could result in the member being entitled to early retirement benefits under the Pension Plan that the member would not otherwise be eligible to receive on the date of termination. If grow-in benefits apply, this may affect the value of the benefits the member is entitled to receive on termination of employment or retirement.
Note 11: Amounts must be transferred to a pension fund related to another pension plan, a prescribed retirement savings arrangement, or a life annuity which does not commence before the earliest date on which the member would have been entitled to retire.
Note 12: In respect of terminations occurring on or after July 1, 2012, a member is entitled to the earned pension benefits for all service regardless of length of Pension Plan membership, continuous employment or age.
Excess Contributions
Upon the earliest of termination of employment, death or retirement, the amount by which the member’s post-1986 contributions with interest exceed 50% of the commuted value of the vested deferred pension accrued after 1986 is refunded to the member (or to the spouse, beneficiary or estate, as applicable in the case of death before retirement).
Upon termination of employment, if a member who has attained age 45 and completed 10 or more years of continuous employment elects to fully divest the pension accrued prior to 1987, the member is entitled to receive the amount by which the contributions with interest made after 1964 but prior to 1987 exceeds the commuted value of the pension accrued after 1964 but prior to 1987. (See Note 13)
Note 13: For terminations occurring on or after July 1, 2012, entitlement to excess contributions in respect of pre-1987 service shall be determined without reference to age or years of continuous employment.
Maximum Benefits
The benefits in respect of continuous employment after 1991 are limited to the maximum allowable under the Income Tax Act (Canada).
Hydro One Inc. Hydro One Pension Plan Actuarial Valuation as at December 31, 2015 G–1
http://natct.internal.towerswatson.com/clients/601835/HydroOne2016RETGeneral/Documents/Hydro One 12.31.2015 RPP Valuation APP.doc
Appendix G: PBGF Assessment, Transfer Ratio and Solvency Ratio
PBGF Assessment
(dollar amounts in thousands) December 31, 2015 PBGF Assessment Solvency liability: l Total $ 6,465,246 l Ontario PBGF liability 6,465,246 l Ontario additional PBGF liability 0 Solvency value of assets: l Total $ 6,743,595 l Ontario PBGF assets 6,743,595 PBGF assessment base $ 0 Plan membership (including inactive members): l Total 13,059 l Ontario 13,059
Comments:
l The solvency value of assets reflects net outstanding amounts. The solvency value of assets is prior to deduction of a provision for plan windup expenses.
l For the purposes of calculating the PBGF assessment base, the solvency value of assets and the solvency liability exclude the additional voluntary contribution provision.
l The Ontario PBGF liability used for purposes of calculating the PBGF assessment excludes the Ontario additional PBGF liability.
l As specified in the Regulation to the Pension Benefits Act (Ontario), the additional PBGF liability is the additional solvency liability for plant closure and permanent layoff benefits excluded for those Ontario members who are immediately eligible for the benefit at the actuarial valuation date, if any.
(dollar amounts in thousands) December 31, 2015 Transfer Ratio Solvency value of assets $ 6,743,615 Lesser of estimated employer contributions for the period until the next actuarial valuation and prior year credit balance $ 48,000 Hypothetical windup liability $ 9,545,090 Transfer ratio 0.70 Solvency Ratio Solvency value of assets $ 6,743,615 Solvency liability $ 6,465,266 Solvency ratio Not less than 1.00
Comments:
l The solvency value of assets reflects net outstanding amounts. The solvency value of assets is prior to deduction of a provision for plan windup expenses.
l As the transfer ratio is less than 1.00, transfer deficiencies must be paid over a maximum period of five years unless the cumulative transfer deficiencies are within the limits prescribed by the Regulation to the Pension Benefits Act (Ontario) or the employer remits additional contributions in respect of the transfer deficiencies. Pursuant to Regulations 19(4) or 19(5) to the Pension Benefits Act (Ontario), approval of the Superintendent will be required to make commuted value transfers if there has been a significant decline in the transfer ratio after the actuarial valuation date.
l Based on the solvency ratio defined as the ratio of solvency value of assets to solvency liabilities, the next actuarial valuation of the plan is due with an effective date not later than December 31, 2018.
Hydro One Inc. Hydro One Pension Plan Actuarial Valuation as at December 31, 2015 I–1
http://natct.internal.towerswatson.com/clients/601835/HydroOne2016RETGeneral/Documents/Hydro One 12.31.2015 RPP Valuation APP.doc
VP Customer Service (Note 1) Meter to Bill (Note 1)
Corporate Affairs First Nations and Métis Relations Bad Debt and Goodwill SVP Customer and Corporate Relations
Information Services
Corporate Projects Information Technology
Security Operations
Inergi LP (outsourced services)
Finance Human Resources ‐ Pay Services
Accounts Payable
People and Culture General Counsel & Secretariat
Audit VP Chief Risk Officer
Note 1‐ Department participated in 2015 Time Study; see Section V.
D. BLACK & VEATCH’S ASSIGNMENT
Forthe2015Review,ourassignmentwasto:
a. EvaluatewhethertheexistingCommonCorporateCostAllocationMethodologycontinuestobeappropriateforHydroOne,andidentifychangesthatarenecessaryordesirable.
Hydro One Networks Inc. | COMMON CORPORATE COSTS (TRANSMISSION) ‐ 2015
BLACK & VEATCH | Summary 5
b. ReviewHydroOne’sapplicationoftheOEB‐acceptedCommonCorporateCostAllocationMethodologytotheBP2017‐2018,inconnectionwithits2017‐2018Transmissionratesapplication.
Task 1. Reviewed Hydro One’s current organizational structure and identified departments that perform the functions and services included in Common Corporate Costs.
Hydro One Networks Inc. | COMMON CORPORATE COSTS (TRANSMISSION) ‐ 2015
BLACK & VEATCH | Review Application of Methodology to BP 2017‐2018 12
Task 5. Distributed Common Corporate Costs (time for labour resources and cost for non‐labour and Inergi resources) reflected in BP 2017‐2018 for departments identified in Task 1, among the activities identified in Task 2.
Task 7. Any portion of an activity that was not assigned to a specific business unit due to its generalized nature was allocated among business units using cost drivers, as described in Task 7. Assigned cost drivers
while respecting Hydro One’s strategic objectives and resource
requirements.
Network Operations
Operates the largest electricity delivery system in Ontario and one of
the largest in North America for the needs of the Province of Ontario.
Hydro One has a highly skilled and experienced workforce using first‐
class operating systems located in a state‐of‐the‐art Control Centre.
Hydro One is a team working together and safely to ensure Ontario has
a safe, reliable supply of electricity.
Transmission Asset Management
Provide asset strategies, investment plans and work definition for the
sustainment of the transmission grid to enable safe, reliable, efficient
and cost effective delivery in a customer‐focused commercial culture
that increases enterprise value for our shareholder that provides
increased value to our customers.
VP‐ Planning
Oversees Distribution Asset Management, Transmission Asset Management, Planning and Optimization, Network Connections and Development, System Planning, and Reliability, Strategies, and Compliance.
EVP Office‐ Operations Oversight of Operations group.
Outsourcing Services Manage overall business relationship between Hydro One and Inergi LP.
Strategic Services
Supports the executive team by advancing key strategic initiatives and
interfacing with Lines of Business to assist in the implementation of
these initiatives, coordinating the development of processes to ensure
alignment within the Company and a focus on our key priorities, and
providing support to the President and CEO and the Leadership Team.
Information Services
Corporate Projects
Deliver the projects necessary to maintain and enhance the core
services Hydro One provides to its customers across the province.
Project delivery is completed by leveraging both internal and external
expertise to design and construct using standard and repeatable
methods that lead to safe, reliable and cost effective operations of
those assets.
Information Technology Information technology security; Enterprise IT architecture; Service
Hydro One Networks Inc. | COMMON CORPORATE COSTS (TRANSMISSION) ‐ 2015
BLACK & VEATCH | Exhibit A A‐4
FUNCTIONS AND SERVICES DESCRIPTION
delivery; Technology services; Governance of IT architecture, Business
analysis and information management, Project management; Inergi &
Telecom services management. Applications; Compliance security; Data
services; Information services; IT operations; System architecture.
Security Operations
Incident reporting and security awareness; Threat intelligence
gathering; Physical security and asset threat and risk assessments;
Investigations; Theft of electricity consultation and detection;
Workplace violence prevention and response; Contract security
procurement assistance; Overall security and asset protection advice;
Security infrastructure Capital and OM&A investment planning and
project management.
Customer & Corporate Relations
Customer Care Services
Service the approximately 1.1 million distribution customers. Improve
customer satisfaction through strategic system and process
1 Includes recovery of Interest Capitalized on the Niagara Reinforcement Project. 2 2 External revenues addressed in Exhibit E1, Tab 2, Schedule 1. 3 3 Export revenue is addressed in Exhibit H1, Tab 4, Schedule 1. 4 4 See Exhibit F1, Tab 1, Schedule 3 for further details. 5 5 Low Voltage Switch Gear is addressed in Exhibit G1, Tab 3, Schedule 1. 6
7
The increase in 2018 rates revenue requirement is primarily due to the increase in core 8
rate base as reflected in the increase in depreciation and the return on capital. Also 9
contributing the increased rate base is due to higher income taxes. These increases are 10
partially offset by a lower cost of debt, lower OM&A, and a higher export revenue credit. 11
12
Table 5 illustrates the value of the key impacts on the movement in the rates revenue 13
requirement. 14
Updated: 2016-07-20
EB-2016-0160
Exhibit E1
Tab 1
Schedule 1
Page 6 of 6
Witness: Glenn Scott
Table 5: Components of Change to Rates Revenue Requirement 2017 vs. 2018 1
Description Amount ($M)
Decrease in OM&A (1.9)
Rate Base Growth 77.5
Decrease in Cost of Debt (3.7)
No Change in Cost of Equity -
Tax - timing differences and other 9.1
External Revenue (0.3)
Increase in Export Revenue Credit (0.9)
No Change in Regulatory Accounts
Disposition -
Increase in Low Voltage Switch Gear 0.7
Other -
Total change 80.5
1 Net of External Revenue 2
3
Exhibit G1, Tab 1, Schedule 1 provides information on how the rates revenue 4
17 *This amount is net of the $0.3million in WMS revenue which accounts for the difference when 18 comparing to the total rates revenue requirement shown in Exhibit E1, Tab 1, Schedule 1. 19
This exhibit describes the activities to determine the transmission rates revenue 6
requirement for the Network, Line Connection, and Transformation Connection rate 7
pools, and provides a summary of the associated asset value and rates revenue 8
requirement. A detailed account of the 2017 and 2018 transmission rates revenue 9
requirement by rate pool is provided in Exhibit G2, Tab 5, Schedule 1. 10
11
2. ALLOCATION OF REVENUE REQUIREMENT TO RATE POOLS 12
13
The allocation of the transmission rates revenue requirement to the rate pools is 14
summarized in Figure 1. This process is the same as was presented in Hydro One’s 15
2015/2016 Transmission Rate Application approved by the Board in Proceeding EB-16
2014-0140. 17
18
Figure 1: Schematic Outlining the Allocation of Revenue Requirement to Rate Pools 19
20 1 The term “Assigned” refers to a value that is designated to a particular Functional Category or Rate Pool (e.g. Export Revenues are 21
directly assigned to the Network Rate Pool) 22 2 The term “Allocated” indicates that a parameter(s) is used to calculate the proportion of the values that are designated to more than 23
one Functional Category or Rate Pool (e.g. load forecast data is applied to the value of Dual Function Line assets to determine the 24 proportion of its value that is allocated to the Network Functional Category and to the Line Connection Functional Category) 25
As illustrated in Figure 1, once the allocation of revenue requirement components into the 1
functional categories is completed, as described in Exhibit G1, Tab 2, Schedule 1, then 2
the next steps include: 3
4
1. Mapping of allocated transmission costs from the functional categories to the 5
assigned rate pools; and 6
2. Assignment and allocation of the rates revenue requirement offset components 7
such as: Export Transmission Service (“ETS”) revenue credit and associated 8
variance accounts, regulatory assets (if applicable), the Low Voltage Switchgear 9
(“LVSG”) credit, Wholesale Meter Service (“WMS”) revenue and other external 10
revenues into the rate pools. 11
12
These two steps are discussed further in Section 2.1 and Section 2.2 respectively. 13
14
2.1 Mapping of Functional Category to Rate Pool 15
16
The allocated transmission costs that are derived using the cost allocation methodology 17
described in Exhibit G1, Tab 2, Schedule 1, are aggregated from the functional categories 18
to the three rate pools: Network, Line Connection, and Transformation Connection; as 19
shown in Table 1 and described below. 20
21
Table 1: Functional Category to Rate Pool Mapping 22
Functional Category Rate Pool Network Network Network Portion of DFL Network Line Connection Line Connection Line Connection Portion of DFL Line Connection Transformation Connection Transformation Connection Generation Line Connection Network Generation Transformation Connection Network Common and Other Prorate to Network, Line and Transformation
2017 2018 Network 98.7 97.8 Line Connection 20.9 21.0 Transformation Connection 60.0 58.9 Network - Dual Function Line 15.3 15.6 Line Connection - Dual Function Line 3.2 3.3 Generation Line Connection 3.6 3.5 Generation Transformation Connection 1.9 1.9 Common 137.9 136.8 Other Assets 8.0 8.1
OM&A 205.1 41.5 102.9 349.5 Taxes other than Income Taxes 37.6 9.4 16.6 63.6 Depreciation of Fixed Assets 218.6 53.0 111.0 382.6 Capitalized Depreciation (7.1) (1.8) (3.2) (12.1) Asset Removal Costs 31.4 8.0 14.0 53.4 Other Amortization 7.0 1.7 3.1 11.8 Return on Debt 170.5 42.5 75.1 288.2 Return on Equity 229.6 57.3 101.1 388.0 Income Taxes 48.1 12.0 21.2 81.3
SUB-TOTAL 940.9 223.6 441.9 1,606.3 Less External Revenues (16.5) (3.9) (7.8) (28.2) Less WMS Revenue 0.0 0.0 (0.3) (0.3) Less Regulatory Asset Credit (22.6) (5.4) (10.6) (38.6) Less Export Revenue Variance (9.2) 0.0 0.0 (9.2) Less Export Revenues (39.2) 0.0 0.0 (39.2) Plus LVSG Credit 0.0 0.0 14.0 14.0
TOTAL* 853.4 214.3 437.1 1,504.7 *This amount is net of the $0.3million in WMS revenue which accounts for the difference when comparing to the total rates revenue
requirement shown in Exhibit E1, Tab 1, Schedule 1.
Network Line Connection Transformation Connection Total
OM&A 204.1 41.7 101.1 346.9 Taxes other than Income Taxes 38.0 9.5 16.9 64.3 Depreciation of Fixed Assets 230.7 56.1 117.3 404.1 Capitalized Depreciation (7.5) (1.9) (3.4) (12.8) Asset Removal Costs 40.6 10.3 18.3 69.2 Other Amortization 6.0 1.5 2.7 10.1 Return on Debt 178.5 44.5 79.3 302.2 Return on Equity 243.7 60.8 108.2 412.6 Income Taxes 53.4 13.3 23.7 90.4
SUB-TOTAL 987.4 235.8 464.0 1,687.2 Less External Revenues (16.7) (4.0) (7.8) (28.5) Less WMS Revenue 0.0 0.0 (0.3) (0.3) Less Regulatory Asset Credit (22.6) (5.4) (10.6) (38.6) Less Export Revenue Variance (9.2) 0.0 0.0 (9.2) Less Export Revenues (40.1) 0.0 0.0 (40.1) Plus LVSG Credit 0.0 0.0 14.7 14.7
TOTAL* 898.9 226.4 460.0 1,585.3 * This amount is net of the $0.3million in WMS revenue which accounts for the difference when comparing to the total rates revenue
requirement shown in Exhibit E1, Tab 1, Schedule 1. 2
Table 2: Average Bill Impacts on Transmission and 1
Distribution-connected Customers 2
2016 2017 2018
Rates Revenue Requirement ($ millions) 1 1,480.5 1,504.7 1,585.3 % Increase in Rates RR over prior year 1.6% 5.4% % Impact of load forecast change 2.1% 0.0%
Net Impact on Average Transmission Rates 3.7% 5.4%
Transmission as a % of Tx-connected customer’s Total Bill 8.3% 8.3% Estimated Average Bill impact 0.3% 0.4%
Transmission as a % of Dx -connected customer’s Total Bill 6.8% 6.8% Estimated Average Bill Impact 0.3% 0.4%
1 This amount is net of the $0.3million in WMS revenue which accounts for the difference when comparing 3 to the total rates revenue requirement shown in Exhibit E1, Tab 1, Schedule 1. 4
5
The total bill impact for a typical Hydro One medium density residential (R1) customer 6
consuming 350 kWh, 750 kWh and 1800 kWh monthly is determined based on the 7
forecast increase in the customer’s Retail Transmission Service Rates (“RTSR”) as 8
detailed below in Table 3. 9
10
Table 3: Typical Medium Density (R1) Residential Customer Bill Impacts 11
Typical R1 Residential Customer 350 kWh 750 kWh 1800 kWh Total Bill as of Jan 1, 20161 $ 102.95 $ 179.37 $ 379.98 RTSR included in 2016 R1 Customer's Bill $ 4.37 $ 9.36 $ 22.47 Estimated 2017 Monthly RTSR2 $ 4.52 $ 9.69 $ 23.26 2017 increase in Monthly Bill $ 0.15 $ 0.33 $ 0.79
2017 increase as a % of total bill 0.1% 0.2% 0.2% Estimated 2018 Monthly RTSR2 $ 4.75 $ 10.18 $ 24.44 2018 increase in Monthly Bill $ 0.23 $ 0.49 $ 1.18
2018 increase as a % of total bill 0.2% 0.3% 0.3% 1 Total bill including HST, based on time-of-use RPP commodity pricing and 2016 distribution rates 12
approved per Distribution Rate Order EB-2015-0079. 13 2 The impact on RTSR is assumed to be the net impact on average transmission rates, as per Table 2, 14
adjusted for Hydro One's revenue disbursement allocator per approved 2016 UTRs per EB-2015-0311. 15
is determined based on the forecast increase in the customer’s Retail Transmission 3
Service Rates (“RTSR”) as detailed below in Table 4. 4
5
Table 4: Typical General Service Energy less than 50 kW 6
(GSe < 50 kW) Customer Bill Impacts 7
GSe Customer Monthly Bill 1,000 kWh 2,000 kWh 15,000 kWh Total Bill as of Jan 1, 20161 $ 262.79 $ 492.00 $ 3,471.80 RTSR included in 2016 GSe Customer's Bill $ 10.19 $ 20.39 $ 152.89 Estimated 2017 Monthly RTSR2 $ 10.55 $ 21.11 $ 158.29 2017 increase in Monthly Bill $ 0.36 $ 0.72 $ 5.40
2017 increase as a % of total bill 0.1% 0.1% 0.2% Estimated 2018 Monthly RTSR2 $ 11.09 $ 22.18 $ 166.32 2018 increase in Monthly Bill $ 0.53 $ 1.07 $ 8.02
2018 increase as a % of total bill 0.2% 0.2% 0.2% 1 Total bill including HST, based on time-of-use RPP commodity pricing and 2016 distribution rates 8
approved per Distribution Rate Order EB-2015-0079. 9 2 The impact on RTSR is assumed to be the net impact on average transmission rates, as per Table 2, 10
adjusted for Hydro One's revenue disbursement allocator per approved 2016 UTRs per EB-2015-0311. 11
TRANSMISSION RATE SCHEDULES
EFFECTIVE DATE: BOARD ORDER: REPLACING BOARD ORDER: Page 1 of 6 January 1, 2017 EB-201X-XXXX EB-2015-0311 Ontario Uniform Transmission January 14, 2016 Rate Schedule
2017 ONTARIO UNIFORM TRANSMISSION RATE SCHEDULES
EB-201X-XXXX
The rate schedules contained herein shall be effective January 1, 2017
EFFECTIVE DATE: BOARD ORDER: REPLACING BOARD ORDER: Page 2 of 6 January 1, 2017 EB-201X-XXXX EB-2015-0311 Ontario Uniform Transmission January 14, 2016 Rate Schedule
TERMS AND CONDITIONS (A) APPLICABILITY The rate schedules contained herein pertain to the transmission service applicable to: •The provision of Provincial Transmission Service (PTS) to the Transmission Customers who are defined as the entities that withdraw electricity directly from the transmission system in the province of Ontario. •The provision of Export Transmission Service (ETS) to electricity market participants that export electricity to points outside Ontario utilizing the transmission system in the province of Ontario. The Rate Schedule ETS applies to the wholesale market participants who utilize the Export Service in accordance with the Market Rules of the Ontario Electricity Market, referred to hereafter as Market Rules. These rate schedules do not apply to the distribution services provided by any distributors in Ontario, nor to the purchase of energy, hourly uplift, ancillary services or any other charges that may be applicable in electricity markets administered by the Independent Electricity System Operator (IESO) of Ontario.
(B) TRANSMISSION SYSTEM CODE The transmission service provided under these rate schedules is in accordance with the Transmission System Code (Code) issued by the Ontario Energy Board (OEB). The Code sets out the requirements, standards, terms and conditions of the transmitter’s obligation to offer to connect to, and maintain the operation of, the transmission system. The Code also sets out the requirements, standards, terms and conditions under which a Transmission Customer may connect to, and remain connected to, the transmission system. The Code stipulates that a transmitter shall connect new customers, and continue to offer transmission services to existing customers, subject to a Connection Agreement between the customer and a transmitter. (C) TRANSMISSION DELIVERY POINT The Transmission Delivery Point is defined as the transformation station, owned by a transmission company or by the Transmission Customer, which steps down the voltage from above 50 kV to below 50 kV and which connects the customer to the transmission system. The demand registered by two or more meters at any one delivery point shall be aggregated for the purpose of assessing transmission charges at that delivery point if the corresponding distribution feeders from that delivery point, or the plants taking power from that delivery point, are owned by the same entity within the meaning of
Ontario’s Business Corporations Act. The billing demand supplied from the transmission system shall be adjusted for losses, as appropriate, to the Transmission Point of Settlement, which shall be the high voltage side of the transformer that steps down the voltage from above 50 kV to below 50 kV.
(D) TRANSMISSION SERVICE POOLS The transmission facilities owned by the licenced transmission companies are categorized into three functional pools. The transmission lines that are used for the common benefit of all customers are categorized as Network Lines and the corresponding terminating facilities are Network Stations. These facilities make up the Network Pool. The transformation station facilities that step down the voltage from above 50 kV to below 50 kV are categorized as the Transformation Connection Pool. Other electrical facilities (i.e. that are neither Network nor Transformation) are categorized as the Line Connection Pool. All PTS customers incur charges based on the Network Service Rate (PTS-N) of Rate Schedule PTS. The PTS customers that utilize transformation connection assets owned by a licenced transmission company also incur charges based on the Transformation Connection Service Rate (PTS-T). The customer demand supplied from a transmission delivery point will not incur transformation connection service charges if a customer fully owns all transformation connection assets associated with that transmission delivery point. The PTS customers utilize lines owned by a licenced transmission company to connect to Network Station(s) also incur charges based on the Line Connection Service Rate (PTS- L). The customer demand supplied from a transmission delivery point will not incur line connection service charges if a customer fully owns all line connection assets connecting that delivery point to a Network Station. Similarly, the customer demand will not incur line connection service charges for demand at a transmission delivery point located at a Network Station. (E) MARKET RULES The IESO will provide transmission service utilizing the facilities owned by the licenced transmission companies in Ontario in accordance with the Market Rules. The Market Rules and appropriate Market Manuals define the procedures and processes under which the transmission service is provided in real or operating time (on an hourly basis) as well as service billing and settlement processes for transmission service charges based on rate schedules contained herein.
TRANSMISSION RATE SCHEDULES
EFFECTIVE DATE: BOARD ORDER: REPLACING BOARD ORDER: Page 3 of 6 January 1, 2017 EB-201X-XXXX EB-2015-0311 Ontario Uniform Transmission January 14, 2016 Rate Schedule
(F) METERING REQUIREMENTS In accordance with Market Rules and the Transmission System Code, the transmission service charges payable by Transmission Customers shall be collected by the IESO. The IESO will utilize Registered Wholesale Meters and a Metering Registry in order to calculate the monthly transmission service charges payable by the Transmission Customers. Every Transmission Customer shall ensure that each metering installation in respect of which the customer has an obligation to pay transmission service charges arising from the Rate Schedule PTS shall satisfy the Wholesale Metering requirements and associated obligations specified in Chapter 6 of the Market Rules, including the appendices therein, whether or not the subject meter installation is required for settlement purposes in the IESO-administered energy market. A meter installation required for the settlement of charges in the IESO-administered that energy market may be used for the settlement of transmission service charges. The Transmission Customer shall provide to the IESO data required to maintain the information for the Registered Wholesale Meters and the Metering Registry pertaining to the metering installations with respect to which the Transmission Customers have an obligation to pay transmission charges in accordance with Rate Schedule PTS. The Metering Registry for metering installations required for the calculation of transmission charges shall be maintained in accordance with Chapter 6 of the Market Rules. The Transmission Customers, or Transmission Customer Agents if designated by the Transmission Customers, associated with each Transmission Delivery Point will be identified as Metered Market Participants within the IESO’s Metering Registry. The metering data recorded in the Metering Registry shall be used as the basis for the calculation of transmission charges on the settlement statement for the Transmission Customers identified as the Metered Market Participants for each Transmission Delivery Point. The Metering Registry for metering installations required for calculation of transmission charges shall also indicate whether or not the demand associated with specific Transmission Delivery Point(s) to which a Transmission Customer is connected attracts Line and/or Transformation Connection Service Charges. This information shall be consistent with the Connection Agreement between the Transmission Customer and the licenced Transmission Company that connects the customer to the IESO-Controlled Grid.
(G) EMBEDDED GENERATION The Transmission Customers shall ensure conformance of Registered Wholesale Meters in accordance with Chapter 6 of Market Rules, including Metering Registry obligations, with respect to metering installations for embedded generation that is located behind the metering installation that measures the net demand taken from the transmission system if (a) the required approvals for such generation are obtained after October 30, 1998; and (b) the generator unit rating is 2 MW or higher for renewable generation and 1 MW or higher for non- renewable generation; and (c) the Transmission Delivery Point through which the generator is connected to the transmission system attracts Line or Transformation Connection Service charges. These terms and conditions also apply to the incremental capacity associated with any refurbishments approved after October 30, 1998, to a generator unit that was connected through an eligible Transmission Delivery Point on or prior to October 30, 1998 and the approved incremental capacity is 2 MW or higher for renewable generation and 1 MW or higher for non-renewable generation. The term renewable generation refers to a facility that generates electricity from the following sources: wind, solar, Biomass, Bio-oil, Bio-gas, landfill gas, or water. Accordingly, the distributors that are Transmission Customers shall ensure that connection agreements between them and the generators, load customers, and embedded distributors connected to their distribution system have provisions requiring the Transmission Customer to satisfy the requirements for Registered Wholesale Meters and Metering Registry for such embedded generation even if the subject embedded generator(s) do not participate in the IESO-administered energy markets. (H) EMBEDDED CONNECTION POINT In accordance with Chapter 6 of the Market Rules, the IESO may permit a Metered Market Participant, as defined in the Market Rules, to register a metering installation that is located at the embedded connection point for the purpose of recording transactions in the IESO-administered markets. (The Market Rules define an embedded connection point as a point of connection between load or generation facility and distribution system). In special situations, a metering installation at the embedded connection point that is used to settle energy market charges may also be used to settle transmission service charges, if there is no metering installation at the point of connection of a
TRANSMISSION RATE SCHEDULES
EFFECTIVE DATE: BOARD ORDER: REPLACING BOARD ORDER: Page 4 of 6 January 1, 2017 EB-201X-XXXX EB-2015-0311 Ontario Uniform Transmission January 14, 2016 Rate Schedule
distribution feeder to the Transmission Delivery Point. In above situations: •The Transmission Customer may utilize the metering installation at the embedded connection point, including all embedded generation and load connected to that point, to satisfy the requirements described in Section (F) above provided that the same metering installation is also used to satisfy the requirement for energy transactions in the IESO- administered market. •The Transmission Customer shall provide the Metering Registry information for the metering installation at the embedded connection point, including all embedded generation and load connected to that point, in accordance with the requirements described in Section (F) above so that the IESO can calculate the monthly transmission service charges payable by the Transmission Customer.
TRANSMISSION RATE SCHEDULES
EFFECTIVE DATE: BOARD ORDER: REPLACING BOARD ORDER: Page 5 of 6 January 1, 2017 EB-201X-XXXX EB-2015-0311 Ontario Uniform Transmission January 14, 2016 Rate Schedule
APPLICABILITY: The Provincial Transmission Service (PTS) is applicable to all Transmission Customers in Ontario who own facilities that are directly connected to the transmission system in Ontario and that withdraw electricity from this system.
Monthly Rate ($ per kW) Network Service Rate (PTS-N): 3.68
$ Per kW of Network Billing Demand 1,2
Line Connection Service Rate (PTS-L): 0.92
$ Per kW of Line Connection Billing Demand 1,3
Transformation Connection Service Rate (PTS-T): 2.22
$ Per kW of Transformation Connection Billing Demand 1,3,4
The rates quoted above shall be subject to adjustments with the approval of the Ontario Energy Board.
Notes: 1 The demand (MW) for the purpose of this rate schedule is measured as the energy consumed during the clock hour, on a “Per Transmission Delivery Point” basis. The billing demand supplied from the transmission system shall be adjusted for losses, as appropriate, to the Transmission Point of Settlement, which shall be the high voltage side of the transformer that steps down the voltage from above 50 kV to below 50 kV at the Transmission Delivery Point.
2. The Network Service Billing Demand is defined as the higher of (a) customer coincident peak demand (MW) in the hour of the month when the total hourly demand of all PTS customers is highest for the month, and (b) 85 % of the customer peak demand in any hour during the peak period 7 AM to 7 PM (local time) on weekdays, excluding the holidays as defined by IESO. The peak period hours will be between 0700 hours to 1900 hours Eastern Standard Time during winter (i.e. during standard time) and 0600 hours to 1800 hours Eastern Standard Time during summer (i.e. during daylight savings time), in conformance with the meter time standard used by the IMO settlement systems.
3. The Billing Demand for Line and Transformation Connection Services is defined as the Non-Coincident Peak demand (MW) in any hour of the month. The customer demand in any hour is the sum of (a) the loss-adjusted demand supplied from the transmission system plus (b) the demand that is supplied by an embedded generator unit for which the required government approvals are obtained after October 30, 1998 and which have installed capacity of 2MW or more for renewable generation and 1 MW or higher for non-renewable generation, on the demand supplied by the incremental capacity associated with a refurbishment approved after October 30, 1998, to a generator unit that existed on or prior to October 30, 1998.. The term renewable generation refers to a facility that generates electricity from the following sources: wind, solar, Biomass, Bio-oil, Bio-gas, landfill gas, or water. The demand supplied by embedded generation will not be adjusted for losses.
4. The Transformation Connection rate includes recovery for OEB approved Low Voltage Switchgear compensation for Toronto Hydro Electric System Limited and Hydro Ottawa Limited.
TERMS AND CONDITIONS OF SERVICE: The attached Terms and Conditions pertaining to the Transmission Rate Schedules, the relevant provisions of the Transmission System Code, in particular the Connection Agreement as per Appendix 1 of the Transmission System Code, and the Market Rules for the Ontario Electricity Market shall apply, as contemplated therein, to services provided under this Rate Schedule.
TRANSMISSION RATE SCHEDULES
EFFECTIVE DATE: BOARD ORDER: REPLACING BOARD ORDER: Page 6 of 6 January 1, 2017 EB-201X-XXXX EB-2015-0311 Ontario Uniform Transmission January 14, 2016 Rate Schedule
RATE SCHEDULE: (ETS) EXPORT TRANSMISSION SERVICE
APPLICABILITY: The Export Transmission Service is applicable for the use of the transmission system in Ontario to deliver electrical energy to locations external to the Province of Ontario, irrespective of whether this energy is supplied from generating sources within or outside Ontario.
Hourly Rate Export Transmission Service Rate (ETS): $1.85 / MWh
The ETS rate shall be applied to the export transactions in the Interchange Schedule Data as per the Market Rules for Ontario’s Electricity Market. The ETS rate shall be subject to adjustments with the approval of the Ontario Energy Board. TERMS AND CONDITIONS OF SERVICE: The attached Terms and Conditions pertaining to the Transmission Rate Schedules, the relevant provisions of the Transmission System Code and the Market Rules for the Ontario Electricity Market shall apply, as contemplated therein, to service provided under this Rate Schedule.
TRANSMISSION RATE SCHEDULES
EFFECTIVE DATE: BOARD ORDER: REPLACING BOARD ORDER: Page 1 of 6 January 1, 2018 EB-201Y-YYYY EB-201X-XXXX Ontario Uniform Transmission Month Day, Year Rate Schedule
2018 ONTARIO UNIFORM TRANSMISSION RATE SCHEDULES
EB-201Y-YYYY
The rate schedules contained herein shall be effective January 1, 2018
EFFECTIVE DATE: BOARD ORDER: REPLACING BOARD ORDER: Page 2 of 6 January 1, 2018 EB-201Y-YYYY EB-201X-XXXX Ontario Uniform Transmission Month Day, Year Rate Schedule
TERMS AND CONDITIONS (A) APPLICABILITY The rate schedules contained herein pertain to the transmission service applicable to: •The provision of Provincial Transmission Service (PTS) to the Transmission Customers who are defined as the entities that withdraw electricity directly from the transmission system in the province of Ontario. •The provision of Export Transmission Service (ETS) to electricity market participants that export electricity to points outside Ontario utilizing the transmission system in the province of Ontario. The Rate Schedule ETS applies to the wholesale market participants who utilize the Export Service in accordance with the Market Rules of the Ontario Electricity Market, referred to hereafter as Market Rules. These rate schedules do not apply to the distribution services provided by any distributors in Ontario, nor to the purchase of energy, hourly uplift, ancillary services or any other charges that may be applicable in electricity markets administered by the Independent Electricity System Operator (IESO) of Ontario.
(B) TRANSMISSION SYSTEM CODE The transmission service provided under these rate schedules is in accordance with the Transmission System Code (Code) issued by the Ontario Energy Board (OEB). The Code sets out the requirements, standards, terms and conditions of the transmitter’s obligation to offer to connect to, and maintain the operation of, the transmission system. The Code also sets out the requirements, standards, terms and conditions under which a Transmission Customer may connect to, and remain connected to, the transmission system. The Code stipulates that a transmitter shall connect new customers, and continue to offer transmission services to existing customers, subject to a Connection Agreement between the customer and a transmitter. (C) TRANSMISSION DELIVERY POINT The Transmission Delivery Point is defined as the transformation station, owned by a transmission company or by the Transmission Customer, which steps down the voltage from above 50 kV to below 50 kV and which connects the customer to the transmission system. The demand registered by two or more meters at any one delivery point shall be aggregated for the purpose of assessing transmission charges at that delivery point if the corresponding distribution feeders from that delivery point, or the plants taking power from that delivery point, are owned by the same entity within the meaning of
Ontario’s Business Corporations Act. The billing demand supplied from the transmission system shall be adjusted for losses, as appropriate, to the Transmission Point of Settlement, which shall be the high voltage side of the transformer that steps down the voltage from above 50 kV to below 50 kV.
(D) TRANSMISSION SERVICE POOLS The transmission facilities owned by the licenced transmission companies are categorized into three functional pools. The transmission lines that are used for the common benefit of all customers are categorized as Network Lines and the corresponding terminating facilities are Network Stations. These facilities make up the Network Pool. The transformation station facilities that step down the voltage from above 50 kV to below 50 kV are categorized as the Transformation Connection Pool. Other electrical facilities (i.e. that are neither Network nor Transformation) are categorized as the Line Connection Pool. All PTS customers incur charges based on the Network Service Rate (PTS-N) of Rate Schedule PTS. The PTS customers that utilize transformation connection assets owned by a licenced transmission company also incur charges based on the Transformation Connection Service Rate (PTS-T). The customer demand supplied from a transmission delivery point will not incur transformation connection service charges if a customer fully owns all transformation connection assets associated with that transmission delivery point. The PTS customers utilize lines owned by a licenced transmission company to connect to Network Station(s) also incur charges based on the Line Connection Service Rate (PTS- L). The customer demand supplied from a transmission delivery point will not incur line connection service charges if a customer fully owns all line connection assets connecting that delivery point to a Network Station. Similarly, the customer demand will not incur line connection service charges for demand at a transmission delivery point located at a Network Station. (E) MARKET RULES The IESO will provide transmission service utilizing the facilities owned by the licenced transmission companies in Ontario in accordance with the Market Rules. The Market Rules and appropriate Market Manuals define the procedures and processes under which the transmission service is provided in real or operating time (on an hourly basis) as well as service billing and settlement processes for transmission service charges based on rate schedules contained herein.
TRANSMISSION RATE SCHEDULES
EFFECTIVE DATE: BOARD ORDER: REPLACING BOARD ORDER: Page 3 of 6 January 1, 2018 EB-201Y-YYYY EB-201X-XXXX Ontario Uniform Transmission Month Day, Year Rate Schedule
(F) METERING REQUIREMENTS In accordance with Market Rules and the Transmission System Code, the transmission service charges payable by Transmission Customers shall be collected by the IESO. The IESO will utilize Registered Wholesale Meters and a Metering Registry in order to calculate the monthly transmission service charges payable by the Transmission Customers. Every Transmission Customer shall ensure that each metering installation in respect of which the customer has an obligation to pay transmission service charges arising from the Rate Schedule PTS shall satisfy the Wholesale Metering requirements and associated obligations specified in Chapter 6 of the Market Rules, including the appendices therein, whether or not the subject meter installation is required for settlement purposes in the IESO-administered energy market. A meter installation required for the settlement of charges in the IESO-administered that energy market may be used for the settlement of transmission service charges. The Transmission Customer shall provide to the IESO data required to maintain the information for the Registered Wholesale Meters and the Metering Registry pertaining to the metering installations with respect to which the Transmission Customers have an obligation to pay transmission charges in accordance with Rate Schedule PTS. The Metering Registry for metering installations required for the calculation of transmission charges shall be maintained in accordance with Chapter 6 of the Market Rules. The Transmission Customers, or Transmission Customer Agents if designated by the Transmission Customers, associated with each Transmission Delivery Point will be identified as Metered Market Participants within the IESO’s Metering Registry. The metering data recorded in the Metering Registry shall be used as the basis for the calculation of transmission charges on the settlement statement for the Transmission Customers identified as the Metered Market Participants for each Transmission Delivery Point. The Metering Registry for metering installations required for calculation of transmission charges shall also indicate whether or not the demand associated with specific Transmission Delivery Point(s) to which a Transmission Customer is connected attracts Line and/or Transformation Connection Service Charges. This information shall be consistent with the Connection Agreement between the Transmission Customer and the licenced Transmission Company that connects the customer to the IESO-Controlled Grid.
(G) EMBEDDED GENERATION The Transmission Customers shall ensure conformance of Registered Wholesale Meters in accordance with Chapter 6 of Market Rules, including Metering Registry obligations, with respect to metering installations for embedded generation that is located behind the metering installation that measures the net demand taken from the transmission system if (a) the required approvals for such generation are obtained after October 30, 1998; and (b) the generator unit rating is 2 MW or higher for renewable generation and 1 MW or higher for non- renewable generation; and (c) the Transmission Delivery Point through which the generator is connected to the transmission system attracts Line or Transformation Connection Service charges. These terms and conditions also apply to the incremental capacity associated with any refurbishments approved after October 30, 1998, to a generator unit that was connected through an eligible Transmission Delivery Point on or prior to October 30, 1998 and the approved incremental capacity is 2 MW or higher for renewable generation and 1 MW or higher for non-renewable generation. The term renewable generation refers to a facility that generates electricity from the following sources: wind, solar, Biomass, Bio-oil, Bio-gas, landfill gas, or water. Accordingly, the distributors that are Transmission Customers shall ensure that connection agreements between them and the generators, load customers, and embedded distributors connected to their distribution system have provisions requiring the Transmission Customer to satisfy the requirements for Registered Wholesale Meters and Metering Registry for such embedded generation even if the subject embedded generator(s) do not participate in the IESO-administered energy markets. (H) EMBEDDED CONNECTION POINT In accordance with Chapter 6 of the Market Rules, the IESO may permit a Metered Market Participant, as defined in the Market Rules, to register a metering installation that is located at the embedded connection point for the purpose of recording transactions in the IESO-administered markets. (The Market Rules define an embedded connection point as a point of connection between load or generation facility and distribution system). In special situations, a metering installation at the embedded connection point that is used to settle energy market charges may also be used to settle transmission service charges, if there is no metering installation at the point of connection of a
TRANSMISSION RATE SCHEDULES
EFFECTIVE DATE: BOARD ORDER: REPLACING BOARD ORDER: Page 4 of 6 January 1, 2018 EB-201Y-YYYY EB-201X-XXXX Ontario Uniform Transmission Month Day, Year Rate Schedule
distribution feeder to the Transmission Delivery Point. In above situations: •The Transmission Customer may utilize the metering installation at the embedded connection point, including all embedded generation and load connected to that point, to satisfy the requirements described in Section (F) above provided that the same metering installation is also used to satisfy the requirement for energy transactions in the IESO- administered market. •The Transmission Customer shall provide the Metering Registry information for the metering installation at the embedded connection point, including all embedded generation and load connected to that point, in accordance with the requirements described in Section (F) above so that the IESO can calculate the monthly transmission service charges payable by the Transmission Customer.
TRANSMISSION RATE SCHEDULES
EFFECTIVE DATE: BOARD ORDER: REPLACING BOARD ORDER: Page 5 of 6 January 1, 2018 EB-201Y-YYYY EB-201X-XXXX Ontario Uniform Transmission Month Day, Year Rate Schedule
APPLICABILITY: The Provincial Transmission Service (PTS) is applicable to all Transmission Customers in Ontario who own facilities that are directly connected to the transmission system in Ontario and that withdraw electricity from this system.
Monthly Rate ($ per kW) Network Service Rate (PTS-N): 3.86
$ Per kW of Network Billing Demand 1,2
Line Connection Service Rate (PTS-L): 0.97
$ Per kW of Line Connection Billing Demand 1,3
Transformation Connection Service Rate (PTS-T): 2.33
$ Per kW of Transformation Connection Billing Demand 1,3,4
The rates quoted above shall be subject to adjustments with the approval of the Ontario Energy Board.
Notes: 1 The demand (MW) for the purpose of this rate schedule is measured as the energy consumed during the clock hour, on a “Per Transmission Delivery Point” basis. The billing demand supplied from the transmission system shall be adjusted for losses, as appropriate, to the Transmission Point of Settlement, which shall be the high voltage side of the transformer that steps down the voltage from above 50 kV to below 50 kV at the Transmission Delivery Point.
2. The Network Service Billing Demand is defined as the higher of (a) customer coincident peak demand (MW) in the hour of the month when the total hourly demand of all PTS customers is highest for the month, and (b) 85 % of the customer peak demand in any hour during the peak period 7 AM to 7 PM (local time) on weekdays, excluding the holidays as defined by IESO. The peak period hours will be between 0700 hours to 1900 hours Eastern Standard Time during winter (i.e. during standard time) and 0600 hours to 1800 hours Eastern Standard Time during summer (i.e. during daylight savings time), in conformance with the meter time standard used by the IMO settlement systems.
3. The Billing Demand for Line and Transformation Connection Services is defined as the Non-Coincident Peak demand (MW) in any hour of the month. The customer demand in any hour is the sum of (a) the loss-adjusted demand supplied from the transmission system plus (b) the demand that is supplied by an embedded generator unit for which the required government approvals are obtained after October 30, 1998 and which have installed capacity of 2MW or more for renewable generation and 1 MW or higher for non-renewable generation, on the demand supplied by the incremental capacity associated with a refurbishment approved after October 30, 1998, to a generator unit that existed on or prior to October 30, 1998.. The term renewable generation refers to a facility that generates electricity from the following sources: wind, solar, Biomass, Bio-oil, Bio-gas, landfill gas, or water. The demand supplied by embedded generation will not be adjusted for losses.
4. The Transformation Connection rate includes recovery for OEB approved Low Voltage Switchgear compensation for Toronto Hydro Electric System Limited and Hydro Ottawa Limited.
TERMS AND CONDITIONS OF SERVICE: The attached Terms and Conditions pertaining to the Transmission Rate Schedules, the relevant provisions of the Transmission System Code, in particular the Connection Agreement as per Appendix 1 of the Transmission System Code, and the Market Rules for the Ontario Electricity Market shall apply, as contemplated therein, to services provided under this Rate Schedule.
TRANSMISSION RATE SCHEDULES
EFFECTIVE DATE: BOARD ORDER: REPLACING BOARD ORDER: Page 6 of 6 January 1, 2018 EB-201Y-YYYY EB-201X-XXXX Ontario Uniform Transmission Month Day, Year Rate Schedule
RATE SCHEDULE: (ETS) EXPORT TRANSMISSION SERVICE
APPLICABILITY: The Export Transmission Service is applicable for the use of the transmission system in Ontario to deliver electrical energy to locations external to the Province of Ontario, irrespective of whether this energy is supplied from generating sources within or outside Ontario.
Hourly Rate Export Transmission Service Rate (ETS): $1.85 / MWh
The ETS rate shall be applied to the export transactions in the Interchange Schedule Data as per the Market Rules for Ontario’s Electricity Market. The ETS rate shall be subject to adjustments with the approval of the Ontario Energy Board. TERMS AND CONDITIONS OF SERVICE: The attached Terms and Conditions pertaining to the Transmission Rate Schedules, the relevant provisions of the Transmission System Code and the Market Rules for the Ontario Electricity Market shall apply, as contemplated therein, to service provided under this Rate Schedule.
* The sum of 12 monthly charge determinants for the year
Note 6: Calculated data in shaded cells.
Note 1: FNEI Rates Revenue Requirement and Charge Determinants per Board Decision and Order on EB-2009-0387 dated December 9, 2010. Set as Interim on December 29, 2015 under EB-2015-0368.Note 2: CNPI Rates Revenue Requirement and Charge Determinants per OEB Decision EB-2014-0204 dated June 25, 2015 and 2016 order under EB-2015-0354, issued January 14, 2016.Note 3: GLPT Rates Revenue Requirement and Charge Determinants per OEB Decision EB-2014-0238, issued December 18, 2014 and 2016 order under EB-2015-0337, issued January 14, 2016.Note 4: H1N Rates Revenue Requirement and Charge Determinants as proposed in application EB-2016-0160.Note 5: B2M LP 2016 Revenue Requirement per Board Decision and Order EB-2015-0026 dated December 29, 2015. 2016 Rate Order approved on January 14, 2016.
* The sum of 12 monthly charge determinants for the year
Note 6: Calculated data in shaded cells.
TransmitterRevenue Requirement ($)
TransmitterTotal Annual Charge Determinants (MW)*
TransmitterUniform Rates and Revenue Allocators
Note 1: FNEI Rates Revenue Requirement and Charge Determinants per Board Decision and Order on EB-2009-0387 dated December 9, 2010. Set as Interim on December 29, 2015 under EB-2015-0368.Note 2: CNPI Rates Revenue Requirement and Charge Determinants per OEB Decision EB-2014-0204 dated June 25, 2015 and 2016 order under EB-2015-0354, issued January 14, 2016.Note 3: GLPT Rates Revenue Requirement and Charge Determinants per OEB Decision EB-2014-0238, issued December 18, 2014 and 2016 order under EB-2015-0337, issued January 14, 2016.Note 4: H1N Rates Revenue Requirement and Charge Determinants as proposed in application EB-2016-0160.Note 5: B2M LP 2016 Revenue Requirement per Board Decision and Order EB-2015-0026 dated December 29, 2015. 2016 Rate Order approved on January 14, 2016.


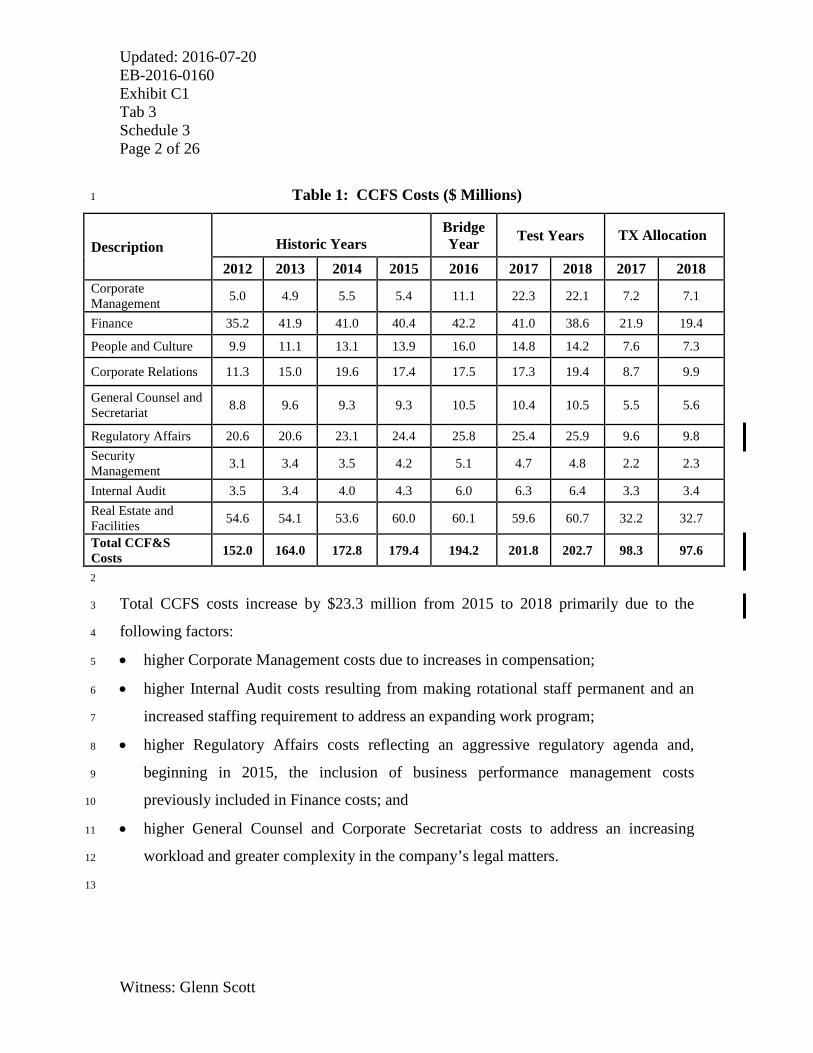


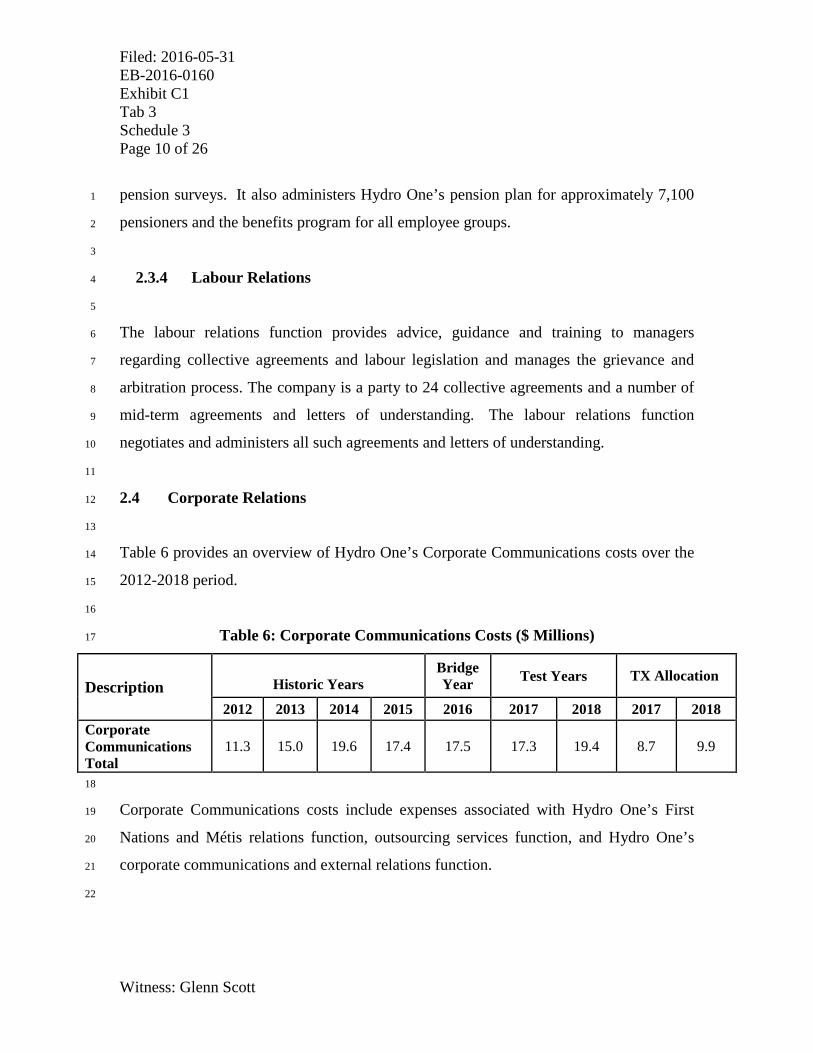


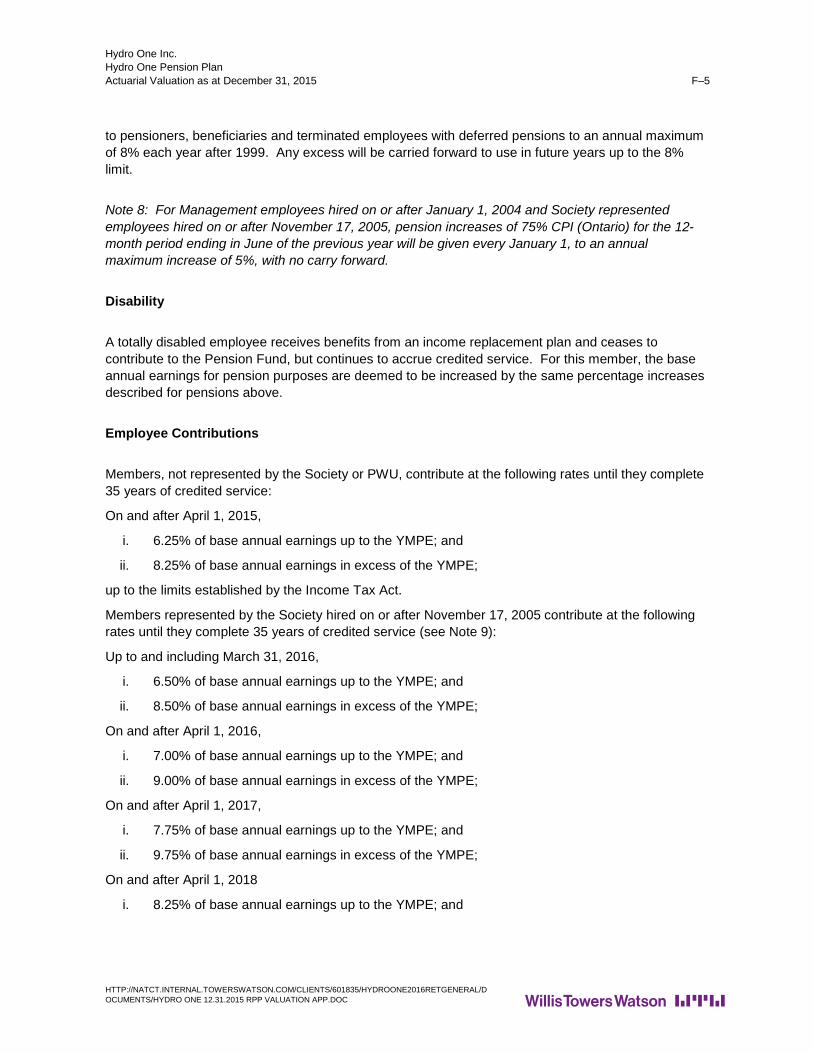


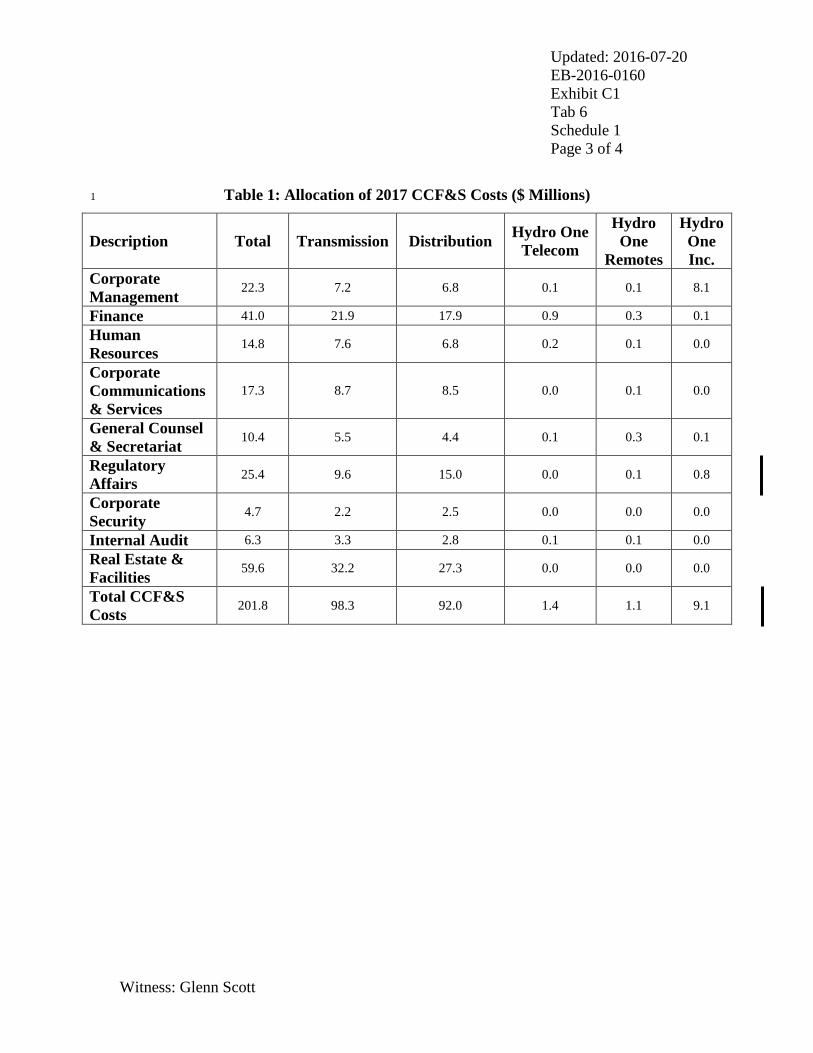


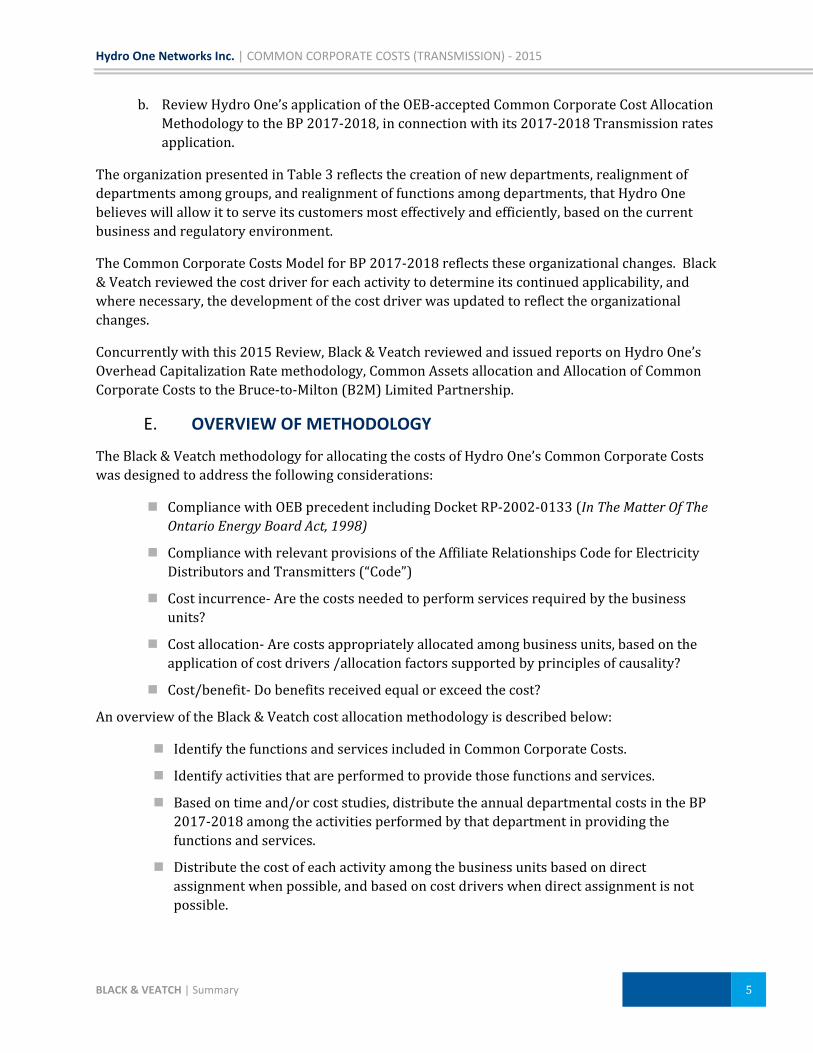


![Toronto Hydro Corporation · Toronto Hydro Corporation NOTES TO INTERIM CONSOLIDATED FINANCIAL STATEMENTS [all tabular amounts in thousands of dollars, unaudited] September 30, …](https://static.documents.pub/doc/80x56/5ae50e617f8b9a5b348f97dd/toronto-hydro-corporation-hydro-corporation-notes-to-interim-consolidated-financial.jpg)


