Mechanical Engineering Publications Mechanical Engineering 2015 Hydrocarbon Liquid Production via Catalytic Hydroprocessing of Phenolic Oils Fractionated from Fast Pyrolysis of Red Oak and Corn Stover Douglas C. Ellio Pacific Northwest National Laboratory Huamin Wang Pacific Northwest National Laboratory Marjorie Rover Iowa State University, [email protected]Lysle Ervin Whitmer Iowa State University, [email protected]Ryan G. Smith Iowa State University, [email protected]See next page for additional authors Follow this and additional works at: hp://lib.dr.iastate.edu/me_pubs Part of the Biochemical and Biomolecular Engineering Commons , Biomechanical Engineering Commons , Bioresource and Agricultural Engineering Commons , and the Complex Fluids Commons e complete bibliographic information for this item can be found at hp://lib.dr.iastate.edu/ me_pubs/150. For information on how to cite this item, please visit hp://lib.dr.iastate.edu/ howtocite.html. is Article is brought to you for free and open access by the Mechanical Engineering at Iowa State University Digital Repository. It has been accepted for inclusion in Mechanical Engineering Publications by an authorized administrator of Iowa State University Digital Repository. For more information, please contact [email protected].
Hydrocarbon Liquid Production via CatalyticHydroprocessing of Phenolic Oils Fractionatedfrom Fast Pyrolysis of Red Oak and Corn StoverDouglas C. ElliottPacific Northwest National Laboratory
Follow this and additional works at: http://lib.dr.iastate.edu/me_pubsPart of the Biochemical and Biomolecular Engineering Commons, Biomechanical Engineering
Commons, Bioresource and Agricultural Engineering Commons, and the Complex FluidsCommons
The complete bibliographic information for this item can be found at http://lib.dr.iastate.edu/me_pubs/150. For information on how to cite this item, please visit http://lib.dr.iastate.edu/howtocite.html.
This Article is brought to you for free and open access by the Mechanical Engineering at Iowa State University Digital Repository. It has been acceptedfor inclusion in Mechanical Engineering Publications by an authorized administrator of Iowa State University Digital Repository. For moreinformation, please contact [email protected].
Hydrocarbon Liquid Production via Catalytic Hydroprocessing ofPhenolic Oils Fractionated from Fast Pyrolysis of Red Oak and CornStover
AbstractPhenolic oils were produced from fast pyrolysis of two different biomass feedstocks, red oak and corn stover,and evaluated in hydroprocessing tests for production of liquid hydrocarbon products. The phenolic oils wereproduced with a bio-oil fractionating process in combination with a simple water wash of the heavy ends fromthe fractionating process. Phenolic oils derived from the pyrolysis of red oak and corn stover were recoveredwith yields (wet biomass basis) of 28.7 and 14.9 wt %, respectively, and 54.3% and 60.0% on a carbon basis.Both precious metal catalysts and sulfided base metal catalyst were evaluated for hydrotreating the phenolicoils, as an extrapolation from whole bio-oil hydrotreatment. They were effective in removing heteroatomswith carbon yields as high as 81% (unadjusted for the 90% carbon balance). There was substantial heteroatomremoval with residual O of only 0.4% to 5%, while N and S were reduced to less than 0.05%. Use of theprecious metal catalysts resulted in more saturated products less completely hydrotreated compared to thesulfided base metal catalyst, which was operated at higher temperature. The liquid product was 42–52%gasoline range molecules and about 43% diesel range molecules. Particulate matter in the phenolic oilscomplicated operation of the reactors, causing plugging in the fixed-beds especially for the corn stoverphenolic oil. This difficulty contrasts with the catalyst bed fouling and plugging, which is typically seen withhydrotreatment of whole bio-oil. This problem was substantially alleviated by filtering the phenolic oils beforehydrotreating. More thorough washing of the phenolic oils during their preparation from the heavy ends ofbio-oil or online filtration of pyrolysis vapors to remove particulate matter before condensation of the bio-oilfractions is recommended.
Keywordsbiomass, pyrolysis, fraction, hydrotreating, catalysis, fuels, chemical and biological engineering, agriculturaland biosystems engineering, bioeconomy institute, center for sustainable environmental technologies
DisciplinesBiochemical and Biomolecular Engineering | Biomechanical Engineering | Bioresource and AgriculturalEngineering | Complex Fluids
CommentsReprinted with permission from ACS Sustainable Chem. Eng., 2015, 3 (5), pp 892–902. Copyright 2015American Chemical Society.
AuthorsDouglas C. Elliott, Huamin Wang, Marjorie Rover, Lysle Ervin Whitmer, Ryan G. Smith, and Robert C.Brown
This article is available at Iowa State University Digital Repository: http://lib.dr.iastate.edu/me_pubs/150
Hydrocarbon Liquid Production via Catalytic Hydroprocessing ofPhenolic Oils Fractionated from Fast Pyrolysis of Red Oak and CornStoverDouglas C. Elliott* and Huamin Wang
Pacific Northwest National Laboratory, P.O. Box 999, MSIN P8-60, Richland, Washington 99352, United States
Marjorie Rover, Lysle Whitmer, Ryan Smith, and Robert Brown
Iowa State University, Biorenewables Research Laboratory Building, Ames, Iowa 50011, United States
ABSTRACT: Phenolic oils were produced from fast pyrolysisof two different biomass feedstocks, red oak and corn stover,and evaluated in hydroprocessing tests for production of liquidhydrocarbon products. The phenolic oils were produced with abio-oil fractionating process in combination with a simplewater wash of the heavy ends from the fractionating process.Phenolic oils derived from the pyrolysis of red oak and cornstover were recovered with yields (wet biomass basis) of 28.7and 14.9 wt %, respectively, and 54.3% and 60.0% on a carbonbasis. Both precious metal catalysts and sulfided base metalcatalyst were evaluated for hydrotreating the phenolic oils, asan extrapolation from whole bio-oil hydrotreatment. Theywere effective in removing heteroatoms with carbon yields as high as 81% (unadjusted for the 90% carbon balance). There wassubstantial heteroatom removal with residual O of only 0.4% to 5%, while N and S were reduced to less than 0.05%. Use of theprecious metal catalysts resulted in more saturated products less completely hydrotreated compared to the sulfided base metalcatalyst, which was operated at higher temperature. The liquid product was 42−52% gasoline range molecules and about 43%diesel range molecules. Particulate matter in the phenolic oils complicated operation of the reactors, causing plugging in the fixed-beds especially for the corn stover phenolic oil. This difficulty contrasts with the catalyst bed fouling and plugging, which istypically seen with hydrotreatment of whole bio-oil. This problem was substantially alleviated by filtering the phenolic oils beforehydrotreating. More thorough washing of the phenolic oils during their preparation from the heavy ends of bio-oil or onlinefiltration of pyrolysis vapors to remove particulate matter before condensation of the bio-oil fractions is recommended.
Fast pyrolysis of biomass is widely held to be a viable technologyfor the direct production of liquid fuels.1 The bio-oil productfrom such processes, however, is not considered of sufficientquality for direct use as petroleum refinery feedstock. Bio-oil fuelproperties can be improved considerably via catalytic hydro-treatment and catalytic cracking.2 Hence, catalytic hydro-processing has been developed to convert the highly oxygenatedbio-oil components into hydrocarbon liquids.3 Much of therecent work in bio-oil hydrotreating has been performed usingprecious metal catalysts4 in small batch reactors for short periodsof time.5 In contrast, the work reported here is performed incontinuous-flow reactor configuration with a presulfided catalystthat is resistant to sulfur poisoning and has been operated fordays and weeks on stream.6
Lindfors et al.2 used fractionation of bio-oil prior to upgradingas a more efficient way of producing liquid fuels versus treatingthe whole bio-oil. Due to the mixture of different functional
groups in whole bio-oil, problems are created because thesefunctional groups react under specific conditions utilizingdifferent catalysts.2,3 Sugar-type compounds are known to besusceptible to coking, and the removal of this fraction prior toupgrading protocols would be advantageous.2 In comparison tothe water-soluble phase of bio-oil, the water-insoluble phase ismore difficult to upgrade because of high molecular weightaromatic structures derived from pyrolysis of the biomass ligninfraction.7 Effective bio-oil fractionation prior to upgrading maybe a valuable approach of producing liquid fuels and chemicalsversus upgrading whole bio-oil.2,8
Iowa State University has developed a fractionating bio-oilrecovery system that allows for collection of bio-oil as heavy-ends(stage fraction (SF) 1 and SF 2), intermediate fractions (SF 3 and
Received: January 9, 2015Revised: April 8, 2015Published: April 13, 2015
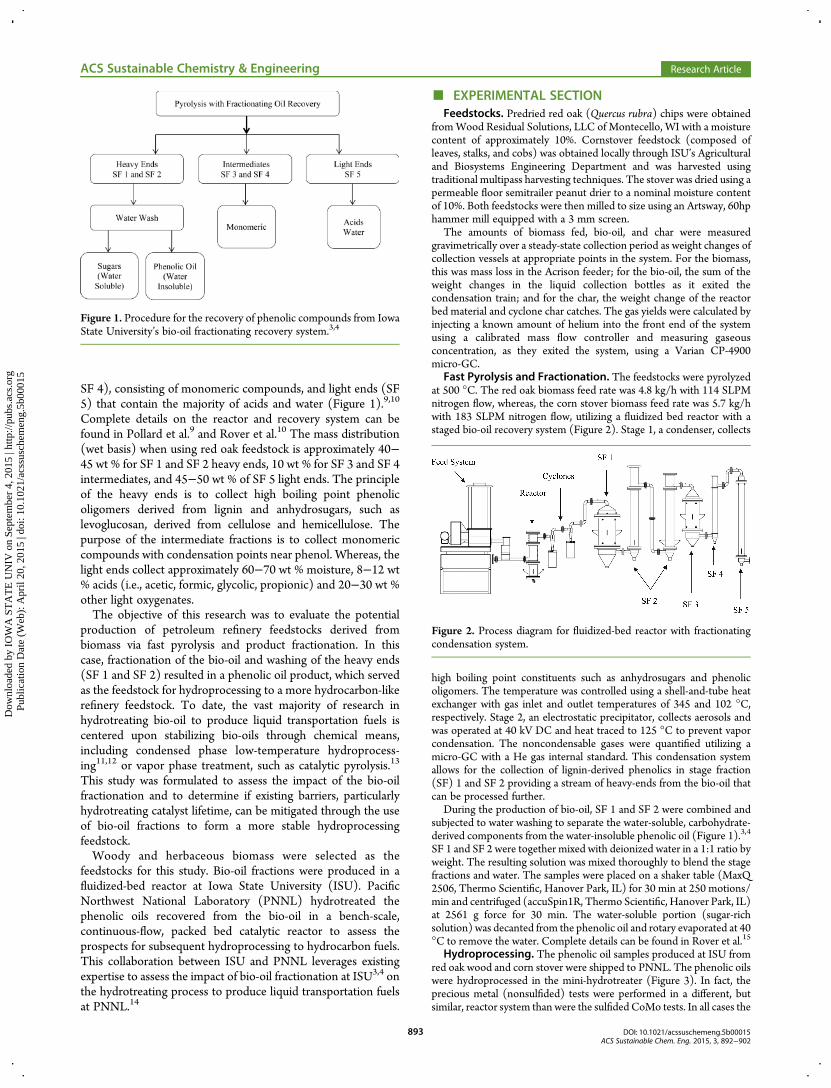
SF 4), consisting of monomeric compounds, and light ends (SF5) that contain the majority of acids and water (Figure 1).9,10
Complete details on the reactor and recovery system can befound in Pollard et al.9 and Rover et al.10 The mass distribution(wet basis) when using red oak feedstock is approximately 40−45 wt % for SF 1 and SF 2 heavy ends, 10 wt % for SF 3 and SF 4intermediates, and 45−50 wt % of SF 5 light ends. The principleof the heavy ends is to collect high boiling point phenolicoligomers derived from lignin and anhydrosugars, such aslevoglucosan, derived from cellulose and hemicellulose. Thepurpose of the intermediate fractions is to collect monomericcompounds with condensation points near phenol. Whereas, thelight ends collect approximately 60−70 wt % moisture, 8−12 wt% acids (i.e., acetic, formic, glycolic, propionic) and 20−30 wt %other light oxygenates.The objective of this research was to evaluate the potential
production of petroleum refinery feedstocks derived frombiomass via fast pyrolysis and product fractionation. In thiscase, fractionation of the bio-oil and washing of the heavy ends(SF 1 and SF 2) resulted in a phenolic oil product, which servedas the feedstock for hydroprocessing to a more hydrocarbon-likerefinery feedstock. To date, the vast majority of research inhydrotreating bio-oil to produce liquid transportation fuels iscentered upon stabilizing bio-oils through chemical means,including condensed phase low-temperature hydroprocess-ing11,12 or vapor phase treatment, such as catalytic pyrolysis.13
This study was formulated to assess the impact of the bio-oilfractionation and to determine if existing barriers, particularlyhydrotreating catalyst lifetime, can be mitigated through the useof bio-oil fractions to form a more stable hydroprocessingfeedstock.Woody and herbaceous biomass were selected as the
feedstocks for this study. Bio-oil fractions were produced in afluidized-bed reactor at Iowa State University (ISU). PacificNorthwest National Laboratory (PNNL) hydrotreated thephenolic oils recovered from the bio-oil in a bench-scale,continuous-flow, packed bed catalytic reactor to assess theprospects for subsequent hydroprocessing to hydrocarbon fuels.This collaboration between ISU and PNNL leverages existingexpertise to assess the impact of bio-oil fractionation at ISU3,4 onthe hydrotreating process to produce liquid transportation fuelsat PNNL.14
■ EXPERIMENTAL SECTIONFeedstocks. Predried red oak (Quercus rubra) chips were obtained
fromWood Residual Solutions, LLC of Montecello, WI with a moisturecontent of approximately 10%. Cornstover feedstock (composed ofleaves, stalks, and cobs) was obtained locally through ISU’s Agriculturaland Biosystems Engineering Department and was harvested usingtraditional multipass harvesting techniques. The stover was dried using apermeable floor semitrailer peanut drier to a nominal moisture contentof 10%. Both feedstocks were then milled to size using an Artsway, 60hphammer mill equipped with a 3 mm screen.
The amounts of biomass fed, bio-oil, and char were measuredgravimetrically over a steady-state collection period as weight changes ofcollection vessels at appropriate points in the system. For the biomass,this was mass loss in the Acrison feeder; for the bio-oil, the sum of theweight changes in the liquid collection bottles as it exited thecondensation train; and for the char, the weight change of the reactorbed material and cyclone char catches. The gas yields were calculated byinjecting a known amount of helium into the front end of the systemusing a calibrated mass flow controller and measuring gaseousconcentration, as they exited the system, using a Varian CP-4900micro-GC.
Fast Pyrolysis and Fractionation. The feedstocks were pyrolyzedat 500 °C. The red oak biomass feed rate was 4.8 kg/h with 114 SLPMnitrogen flow, whereas, the corn stover biomass feed rate was 5.7 kg/hwith 183 SLPM nitrogen flow, utilizing a fluidized bed reactor with astaged bio-oil recovery system (Figure 2). Stage 1, a condenser, collects
high boiling point constituents such as anhydrosugars and phenolicoligomers. The temperature was controlled using a shell-and-tube heatexchanger with gas inlet and outlet temperatures of 345 and 102 °C,respectively. Stage 2, an electrostatic precipitator, collects aerosols andwas operated at 40 kV DC and heat traced to 125 °C to prevent vaporcondensation. The noncondensable gases were quantified utilizing amicro-GC with a He gas internal standard. This condensation systemallows for the collection of lignin-derived phenolics in stage fraction(SF) 1 and SF 2 providing a stream of heavy-ends from the bio-oil thatcan be processed further.
During the production of bio-oil, SF 1 and SF 2 were combined andsubjected to water washing to separate the water-soluble, carbohydrate-derived components from the water-insoluble phenolic oil (Figure 1).3,4
SF 1 and SF 2 were together mixed with deionized water in a 1:1 ratio byweight. The resulting solution was mixed thoroughly to blend the stagefractions and water. The samples were placed on a shaker table (MaxQ2506, Thermo Scientific, Hanover Park, IL) for 30 min at 250 motions/min and centrifuged (accuSpin1R, Thermo Scientific, Hanover Park, IL)at 2561 g force for 30 min. The water-soluble portion (sugar-richsolution) was decanted from the phenolic oil and rotary evaporated at 40°C to remove the water. Complete details can be found in Rover et al.15
Hydroprocessing. The phenolic oil samples produced at ISU fromred oak wood and corn stover were shipped to PNNL. The phenolic oilswere hydroprocessed in the mini-hydrotreater (Figure 3). In fact, theprecious metal (nonsulfided) tests were performed in a different, butsimilar, reactor system than were the sulfidedCoMo tests. In all cases the
Figure 1. Procedure for the recovery of phenolic compounds from IowaState University’s bio-oil fractionating recovery system.3,4
Figure 2. Process diagram for fluidized-bed reactor with fractionatingcondensation system.
ACS Sustainable Chemistry & Engineering Research Article
hydrotreater was configured as a single pass, cocurrent, continuous,down-flow reactor. The system can operate at up to 12.4 MPa (1800psig) with a maximum catalyst temperature 400 °C. It is described indetail by Elliott et al.16
The mini-scale hydrotreaters (30 mL fixed bed) were built for bio-oilupgrading by catalytic hydroprocessing. Tests with the red oak phenolicoil were completed with either sulfided or nonsulfided catalysts as shownin Table 1.Campaigns were performed for each feed over the course of a five-day
test, and the products and feed were collected to assess performance foreach phenolic oil feed type with the two catalyst systems to compare tothe results with conventional whole (unfractionated) bio-oil. For all ofthe reported tests, the products and data were collected over the entireperiod with individual products and data sets collected in operatingwindows from 2 to 6 h long. The hydrogen consumption has beencalculated and the yield of gas and oil products determined.For the CoMo tests, the catalyst bed was sulfided in situ. The reactor
tube containing the catalyst was heated to 150 °C in H2 flow, heatedfrom 150 to 350 °C over 3 h in flow of H2 and sulfiding agent (35% di-tert-butyl-disulfide (DTBDS) in decane), and then heated to 400 °C andheld for 5 h with H2 and sulfiding agent flowing.For the hydroprocessing tests, the flow ratio of H2/liquid was 2500 L
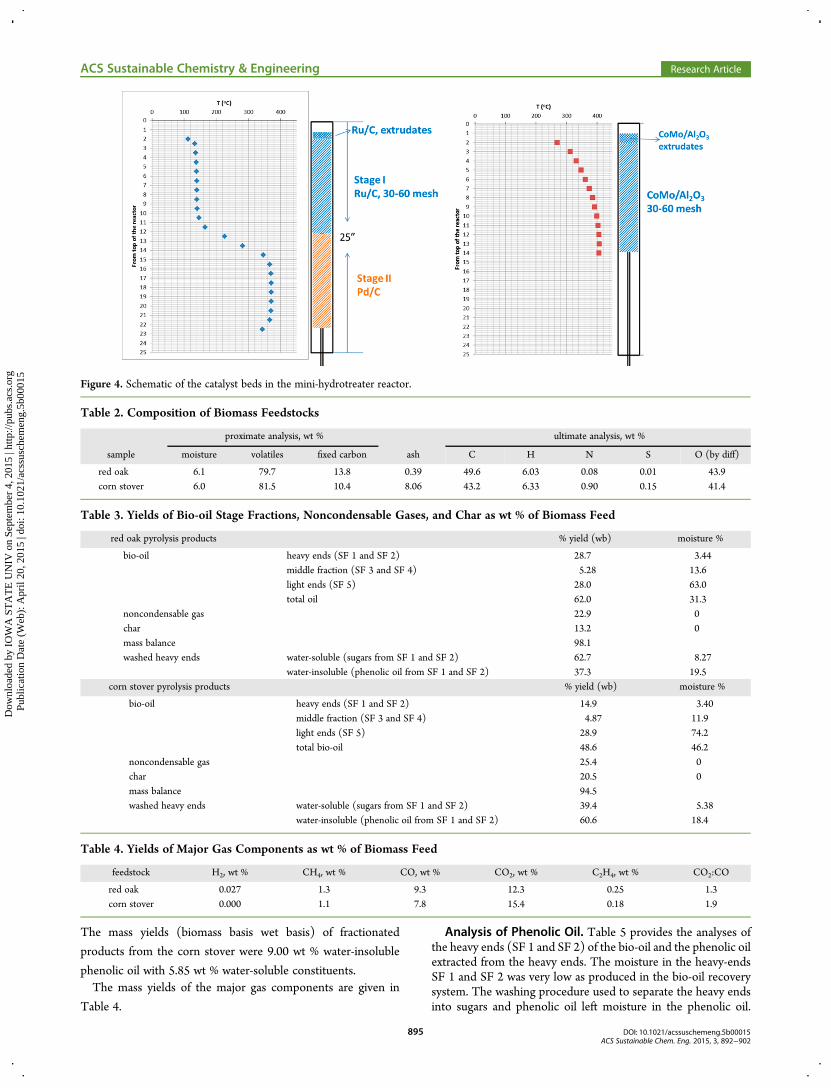
H2 (L bio-oil)−1. The operating pressure was typically 12 MPa (1780psi). Hydrogen consumption was calculated by difference betweenhydrogen fed to the reactor and the hydrogen recovered in the gasproduct. When using the sulfided catalyst, DTBDS was added to thephenolic oil at an amount equal to 150 ppm of S. Figure 4 shows aschematic of the catalyst beds with a superimposed temperature profile
for the single stage and the two-stage testing modes. The temperatureswere measured at the center line of the catalyst bed by a thermocouple,which was adjustable within a full length thermowell. The isothermalportions of the catalyst bed are clearly shown and the lengths of theisothermal portions of the catalyst were used to calculate the spacevelocity. The liquid hourly space velocity used in these studies was litersof phenolic oil feed per liter of catalyst bed per hour.
Analytical Methods.Moisture content of the heavy ends from SF 1and SF 2 were determined by titration using Karl Fisher described inliterature.17 The water-insoluble content (often used as an estimationfor amount of phenolic monomer/oligomers) was determined by an80:1 water-to- bio-oil ratio and described by Pollard et al.3 The ultimateanalysis of the phenolic oil and feedstocks weredetermined utilizingElementar, vario MICRO cube (Elementar, Hanau, Germany)elemental analyzer, with oxygen determination by difference. Aminimum of three trials was performed with standard deviationcalculated.
The phenolic oils and hydrotreated products were characterized atPNNL for elemental analysis including C, H, N (ASTM D5291), O(ASTM D5373), and S (ASTM D1552), total acid number (TAN,ASTM D3339), water content (ASTM D6869), metals content (ICP-OES, QC standards tested before and after the unknowns), and filterablesolids for the phenolic oils were determined using ASTM D7579.Viscosity and density were determined with the Stabinger apparatususing ASTM D7042. In addition, the products were analyzed bysimulated distillation (ASTM D2887) in order to assess the relativeamounts of fuel products in the gasoline, diesel, jet fuel, heavy oil, andresidual ranges. Semiquantitative analysis of the two phenolic oils wasperformed with gas chromatography−mass spectrometry (GC−MS).Using a DB-5 column over a temperature program, separation of thephenolic oils was performed and mass spectrometric analysis under-taken with a mass selective detector. Using the Agilent peak matchingprogram, tentative identifications were applied to the components andtheir relative quantities determined based on total ion current.
■ RESULTS
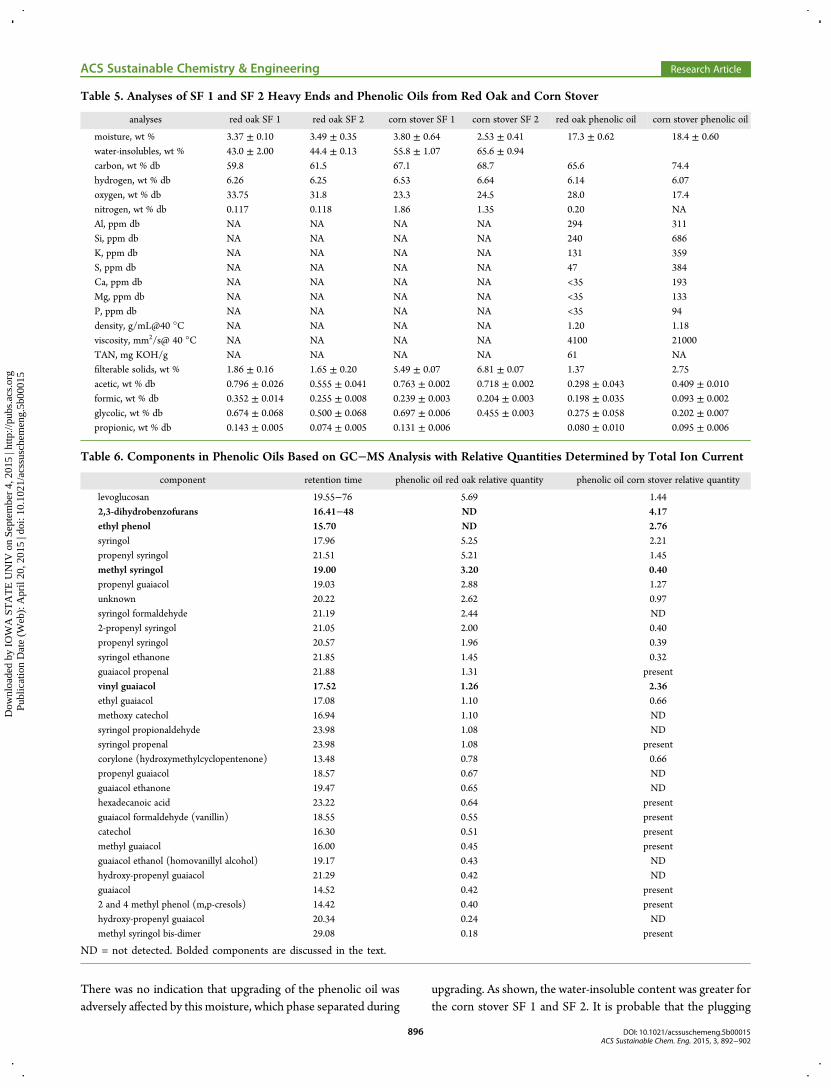
Feedstocks. Results from the analyses of the feedstocks asfed to the fast pyrolysis system are shown in Table 2. The maindifference between the feedstocks is the ash, which was 20 timeshigher in corn stover than in oak.
Fast Pyrolysis and Fractionation Results. The yields ofthe major components (bio-oil, char, and gas) in the fastpyrolysis experiments are shown in Table 3. The high overallmass balances for both oak and corn stover suggest goodoperations. The yields of the three major classes of bio-oilfractions are also given in Table 3. The heavy ends fractions wereseparated offline into sugar solution (water-soluble) andphenolic oil (water-insoluble) streams using the water washtechnique described in the methods section. Rover et al.15
reported that the water-soluble and partially soluble constituentsin red oak bio-oil that were carried into the sugars stream were6.5 wt % constituents other than sugars for SF 1 and 3.2 wt % forSF 2. On a biomass basis, the mass yields (wet basis) offractionated products from the red oak were 10.7 wt % water-insoluble phenolic oil with 18.0 wt % water-soluble constituents.
Figure 3. Schematic of the minireactor hydrotreater system.
Table 1. Summary of Hydrotreater Tests with Red Oak Phenolic Oil
temperature, °C pressure, MPa LHSV catalyst TOS, h comment
350 10.5 0.5 5%Pd/5%Rea 6 plug140/370 12.1 0.2/0.2 7.8%Rua/2.5%Pda 24 feed line plugged140/370 12.1 0.1/0.1 7.8%Rua/2.5%Pda 48 catalyst bed clear400 10.4 0.5 CoMo oxides presulfidedb 5 catalyst bed fouled400 12.5 0.2 CoMo oxides presulfidedb 18 catalyst bed fouled
aPNNL fabricated on granular carbon, 30−60 mesh. bAlfa Aesar #40435, 3.5% CoO, 14%MoO3 on alumina, ground to 30−60 mesh.
ACS Sustainable Chemistry & Engineering Research Article
The mass yields (biomass basis wet basis) of fractionated
products from the corn stover were 9.00 wt % water-insoluble
phenolic oil with 5.85 wt % water-soluble constituents.The mass yields of the major gas components are given in
Table 4.
Analysis of Phenolic Oil. Table 5 provides the analyses ofthe heavy ends (SF 1 and SF 2) of the bio-oil and the phenolic oilextracted from the heavy ends. The moisture in the heavy-endsSF 1 and SF 2 was very low as produced in the bio-oil recoverysystem. The washing procedure used to separate the heavy endsinto sugars and phenolic oil left moisture in the phenolic oil.
Figure 4. Schematic of the catalyst beds in the mini-hydrotreater reactor.
Table 2. Composition of Biomass Feedstocks
proximate analysis, wt % ultimate analysis, wt %
sample moisture volatiles fixed carbon ash C H N S O (by diff)
There was no indication that upgrading of the phenolic oil wasadversely affected by this moisture, which phase separated during
upgrading. As shown, the water-insoluble content was greater forthe corn stover SF 1 and SF 2. It is probable that the plugging
Table 5. Analyses of SF 1 and SF 2 Heavy Ends and Phenolic Oils from Red Oak and Corn Stover
analyses red oak SF 1 red oak SF 2 corn stover SF 1 corn stover SF 2 red oak phenolic oil corn stover phenolic oil
moisture, wt % 3.37 ± 0.10 3.49 ± 0.35 3.80 ± 0.64 2.53 ± 0.41 17.3 ± 0.62 18.4 ± 0.60water-insolubles, wt % 43.0 ± 2.00 44.4 ± 0.13 55.8 ± 1.07 65.6 ± 0.94carbon, wt % db 59.8 61.5 67.1 68.7 65.6 74.4hydrogen, wt % db 6.26 6.25 6.53 6.64 6.14 6.07oxygen, wt % db 33.75 31.8 23.3 24.5 28.0 17.4nitrogen, wt % db 0.117 0.118 1.86 1.35 0.20 NAAl, ppm db NA NA NA NA 294 311Si, ppm db NA NA NA NA 240 686K, ppm db NA NA NA NA 131 359S, ppm db NA NA NA NA 47 384Ca, ppm db NA NA NA NA <35 193Mg, ppm db NA NA NA NA <35 133P, ppm db NA NA NA NA <35 94density, g/mL@40 °C NA NA NA NA 1.20 1.18viscosity, mm2/s@ 40 °C NA NA NA NA 4100 21000TAN, mg KOH/g NA NA NA NA 61 NAfilterable solids, wt % 1.86 ± 0.16 1.65 ± 0.20 5.49 ± 0.07 6.81 ± 0.07 1.37 2.75acetic, wt % db 0.796 ± 0.026 0.555 ± 0.041 0.763 ± 0.002 0.718 ± 0.002 0.298 ± 0.043 0.409 ± 0.010formic, wt % db 0.352 ± 0.014 0.255 ± 0.008 0.239 ± 0.003 0.204 ± 0.003 0.198 ± 0.035 0.093 ± 0.002glycolic, wt % db 0.674 ± 0.068 0.500 ± 0.068 0.697 ± 0.006 0.455 ± 0.003 0.275 ± 0.058 0.202 ± 0.007propionic, wt % db 0.143 ± 0.005 0.074 ± 0.005 0.131 ± 0.006 0.080 ± 0.010 0.095 ± 0.006
Table 6. Components in Phenolic Oils Based on GC−MS Analysis with Relative Quantities Determined by Total Ion Current
component retention time phenolic oil red oak relative quantity phenolic oil corn stover relative quantity
problems in the reactors, especially for the corn stover oils, wasdue to the high water-insolubles content, which likely containedparticulate matter. The acid content of the phenolic oils for bothred oak and corn stover were very low to start with (≤0.8 wt %db). The water wash removed as much as 56% of the acid fromthe water-insoluble portion of the heavy ends (SF 1 and SF 2)The results of GC-MS analysis of the phenolic oils are shown
in Table 6. The phenolic oil is aptly named as the vast majority ofthe volatile components are phenolic in nature. For the most partthey are syringol (2,6-methoxy phenol) or guaiacol (2-methoxyphenol) analogs with substituents on the 4-position.There is a significant amount of levoglucosan in both phenolicoils. Comparison of the relative amounts of components showsthat most are common in both phenolic oils, at similarconcentrations. However, the corn stover phenolic oil has alarge dihydrobenzofuran fraction, as well as ethyl phenol, whichwere not found in the red oak phenolic oil. On the other hand,the red oak contained a much larger fraction of methyl syringolwhile the corn stover had a larger fraction of vinyl guaiacol. It iswell-known that bio-oil analysis by GC-MS is limited because ofthe low volatility and thermal instability of much of the product.Because the phenolic oils contain the oligomeric phenols, it wasexpected to quantify only a fraction of all components. However,this data indicates that the phenolic oils contained volatilemonomeric compounds, as well.The phenolic oil products were also analyzed by 13C nuclear
magnetic resonance (NMR) spectrometry. In Table 7, the
functional groups determined by NMR for an oak fast pyrolysisbio-oil from PNNL can be compared with the red oak phenolicoil and the corn stover phenolic oil. Both phenolic oils containless nonphenolic type components than the whole bio-oil. Thecorn stover phenolic oil contains more carbonyl/carboxyl typesas well as more carbons, which are not directly bonded with anyoxygen. The ratio of aliphatic to aromatic carbons underscoresthe conclusion that the phenolics are concentrated in thephenolic oil.
Hydroprocessing Results. In the first experiment (seeTable 1.) using a single temperature stage with a Pd−Re/Ccatalyst, the test was short-lived and was terminated after only 6 hdue to an increase in pressure drop across the reactor. This effectis typical for unfractionated bio-oil and indicates an excessiveamount of catalyst fouling, leading to blockage of the reactorflow.18 In this test, the examination of the bed following the testindicated that the blockage may have been due to fine particulatebuildup in the fixed catalyst bed rather than fouling by cross-linking reactions of the highly reactive components in thefeedstock. Subsequent tests with precious metal catalyst utilizedthe two-stage hydroprocessing concept, which has been found toalleviate the catalyst fouling difficulty.Using two sequential beds of different precious metal catalysts
at different temperatures, the pressure drop build-up in thereactor was avoided. The first bed was filled with the more activeruthenium metal on carbon extrudate operated at a lowertemperature to avoid methane formation (which would beexpected at temperatures of 300 °C19 or above) but stillhydrogenate the more active components in the phenolic oil andthereby stabilize the feedstock for higher temperature hydro-processing. The second bed was filled with a palladium ongranular carbon catalyst, which has been found to be useful forbio-oil hydroprocessing.20 The first test at higher space velocitywas ended early when a plug occurred in the feed line, apparentlydue to particulate in the feedstock being caught in the smalldiameter (1/8″) tubing. The second test at lower space velocitywas kept on line for 48 h and terminated as planned when usingthe mini-hydrotreater with the larger diameter (1/4″) feed line.
Table 7. 13C NMR Analysis of Bio-oil and Phenolic Oils
The hydroprocessing tests showed good results using the two-stage catalytic hydroprocessing strategy. Equal-sized catalystbeds, a Ru/C catalyst bed operated at 140 °C and a Pd/C catalystbed operated at 370 °C, were used with the entire reactor at 12.5MPa operating pressure. The hydrogen flow was in great excess,as is typical for hydrotreating.In the case of the use of a sulfided catalyst, the typical catalyst
bed fouling seen with fast pyrolysis bio-oil was not found after thetest was terminated early, based on pressure drop build-up duringthe test. Instead, fine particulate was found packed in the catalystbed at two intervals in the heat-up zone of the bed. Use of thelower space velocity in the second test allowed a longer operatingwindow, even somewhat in excess of the allowance for lowerfeedstock processing rate, but the bed still became blocked. Thisresult suggests that a filtering preliminary step will be required forprocessing the phenolic oil. The typical catalyst bed following anexperimental run with phenolic oil had evidence of carbonaceousparticulate packed “tight” into the catalyst bed, as shown inFigure 5. The balance of the catalyst beds were free-flowing andeasily removed from the reactor tube for analysis.
Mass balances for red oak runs ranged from 87 to 97% for thesteady-state windows calculated, with carbon balances somewhatlower, ranging from 80 to 92%. Because the liquid and gaseousproducts were all measured, the carbon loss can be attributed toexperimental error and to deposits on the catalyst particles. Theprocess results for hydrotreating with the two catalyst schemesare shown in Tables 8 and 9. The hydrogen consumption valuesare in the range expected for bio-oil hydrotreating. Thesomewhat higher numbers for the CoMoS test can be explainedby the higher temperature operation resulting in betterdeoxygenation, density reduction and gas formation.The products from the red oak phenolic oil tests are shown in
Table 10. These catalytic hydroprocessing experiments resultedin mostly deoxygenated products but required long processingresidence times, resulting in low processing space velocities. Theprecious metal catalysts, which were operated at lower spacevelocity but also lower temperature, resulted in more saturatedproduct oil (higher hydrogen to carbon ratio), but the sulfidedCoMo catalyst was more effective in hydrodeoxygenation. Thelow overall recovery of elements, (C+H+O) < 100, in the highLHSV test with the CoMoS catalyst along with the significant
Table 8. Results from Hydroprocessing Red Oak Phenolic Oil with Ru−Pd Catalysts
TOS, h
mass yield, oilproduct,
g dry/g dry feed
carbon yield, oilproduct,
g C/g C in feed
oil productdensity,g/mL
gas yield,g per g dry feed
produced wateryield,
g per g dry feedH2 consumed,g H2/g dry feed mass balance, % carbon balance, %
amount of dissolved water in the product, suggests that theoxygen content was actually higher than reported by the analysis.Hydrotreating of the nitrogen content was also effective, beingreduced below the level of detection. The sulfur level is quite lowin the phenolic oil, but its removal to below the level of detectionwas also determined.The yield of hydrocarbon liquids, when normalized for the
deficient carbon balance, ranges from 0.88 and 0.90 g C/g C infeed. These numbers are higher than reported for hydrotreatingof whole red oak bio-oil, wherein the results are around 0.82,although the catalyst bed composition was not perfectlycomparable.16
13CNMR analysis of the products also shows dramatic changesin carbon types (Table 11). There are very few oxygenates left.The Ru/Pd two-stage catalyst bed was most active for saturatingthe hydrocarbon products. The shift in the entries in the two lastcolumns shows the catalyst deactivation as the test progressed,wherein the deoxygenation and saturation were less prevalent.Two of the hydrotreated products from red oak phenolic oil
(CoMo 12−18 h and Ru/Pd 24−30h) were also analyzed by gaschromatography simulated distillation (SimDist ASTM D2887).This method is standardized for analysis of diesel fuels, so itsapplication to these products, which are more comparable tosweet crude, shows the important difference in the lowtemperature distillate range. As shown in Figure 6, there was asignificant portion of the hydrotreated products that falls in thegasoline range. There was a small tail in each product that fell intothe distillation range of heavy oil, but not much more than wasfound in the diesel standard fuel.A hydrotreating test was also completed with the corn stover
phenolic oil using the nonsulfided catalysts. Initial tests with thecorn stover phenolic oil all ended after only a short period of timeon stream without useful results because of plugging in the feedline by particulate. A successful process test using the two-stagecatalyst bed (Ru/C @ 140 °C and Pd/C @ 370 °C, all at 12MPa) could only be completed after filtering the phenolic oil.The filtration could only be accomplished with dilution of thephenolic oil with 10 wt % isopropanol. When the diluted andfiltered phenolic oil was used as the feedstock, the test wasoperated for 48 h and was terminated as planned, similar to the
red oak phenolic oil test. The used catalyst bed exhibiting nopressure drop build-up is shown schematically in Figure 7. Theentire test was operated at the low liquid hourly space velocity of0.1 L/L/h in the isothermal portion of each catalyst bed.
The results for the corn stover phenolic oil hydrotreating testare given in Table 12 and the feed and product analyses areshown in Table 13. The yield of hydrocarbon liquids, whennormalized for the deficient carbon balance, are 0.790 and 0.821g C/g C in feed, for the two cases given. These numbers arehigher than reported for hydrotreating of whole bio-oil produced
Figure 6. SimDist of hydrotreated red oak phenolic oil from low LHSV tests.
Figure 7. Schematic of the catalyst beds after use with corn stoverphenolic oil.
ACS Sustainable Chemistry & Engineering Research Article
from a similar herbaceous feedstock, switchgrass, wherein theresults are around 0.75.16
■ DISCUSSION
The red oak phenolic oil performed well for up to 48 h whenusing certain catalyst configurations but was still susceptible tocatalyst bed fouling and plugging in other cases. The phenolic oil,like phase-separated “pyrolytic lignin,” has some advantages forupgrading compared to whole bio-oil, including higher yields ofgasoline and diesel range molecules and less tendency to coke.21
Use of the mini-hydrotreater with the larger diameter feed line(1/4″ versus 1/8″) facilitated operation by avoiding feed lineblockage by particulate. However, the unfiltered corn stoverphenolic oil had sufficient filterable solids, which resulted incatalyst bed blockage in any case. Filtering of the solids from thecorn stover phenolic oil after dilution of 10 wt % isopropanolresulted in a smooth operation, similar to that of the red oakphenolic oil.The products from the tests with different catalysts and
phenolic oil feedstock were all similar. The light oil phaseproduct was sufficiently hydrotreated so that nitrogen and sulfurwere at or below the level of detection, while the residual oxygencontent was low, less than 5%. The density of the products variedfrom 0.79 up to 0.88 g/mL over the period of the longer tests,which correlated with a change of the hydrogen to carbon atomicratio from 1.9 down to 1.7, suggesting some loss of catalystactivity through the test.The product gas composition showed some interesting
variations with catalyst, feedstock, and space velocity, as shownin Table 14. The composition is presented on a hydrogen-freebasis and shows only the product gases. For these tests there was
a large excess of hydrogen, as is typical for hydrotreating,amounting to about 95 vol % of the process off-gas. There aresignificant differences between the two phenolic oil types in thathydrotreatment of red oak phenolic oil produced much lesspropane and more methane. The propane is most likely a resultof the isopropyl alcohol solvent present in the test. The Re-promoted Pd catalyst resulted in a much higher methane productthan the Pd alone (the Ru was operated at low temperature tominimize its well-known methanation activity) whereas theCoMoS catalyst also produced more methane, as well as theother hydrocarbons, probably due to its higher temperatureoperation. CO production is associated with the use of the Ru−Pd catalyst system with either phenolic oil because of the lessermethanation activity of Pd. The product gas would likely berecycled through a membrane recovery system for hydrogen,followed by processing through a steam reformer to producemore hydrogen.The variation in the mineral content in the phenolic oils and
the fate of the minerals in the hydroprocessing tests weredetermined. In the case of the red oak phenolic oil, the mineralcontent is primarily Al and Si with lesser amounts of K and S (seeTable 5). Analysis of the catalyst bed fractions after the tests (seeTable 15) shows that mineral deposition is noticeable for bothcatalyst systems. In the test with Ru−Pd two-stage bed, theamount of K, as well as Ca, Fe, and Na, was actually lower in thefront-end catalyst bed of Ru/C after use, suggesting that thoseelements are transported from the bed. In the second bedcomposed of the Pd/C catalyst, those four elements are alsoreduced from starting catalyst levels, suggesting that they wereflushed from the second bed as well. Significant deposits of Si andAl from the phenolic oil are found in the second portion of theRu/C catalyst bed, which correlates with the portion of “slightlytight” catalyst (“slightly tight” in this instance means that thecatalyst particles adhered to each other, apparently due to a lightdeposit, and did not flow freely from the reactor tube withoutprodding). Further in the reactor, they are reduced in the Pd/Ccatalyst bed from the levels measured in the fresh Pd/C, perhapssuggesting their higher solubility at higher temperature. Thereare no signs of the other metals from the reactor walls (Ni, Cr,Mo), apparently suggesting that corrosion of the reactor walls isnot significant. The ruthenium analysis reports a lower level inthe used catalysts. Carbon deposition in the pores of the catalysthas been determined to be the agent diluting the rutheniumconcentration rather than actual leaching of the metal from thesupport.This effect was confirmed previously with the CoMo catalyst
wherein the carbon deposition was quantified by direct elementalanalysis.16 In the catalyst bed of sulfided CoMo on Al2O3, the Cais only reduced (at levels similar to Co, Mo, Al) by the dilution of
Table 12. Results from Hydroprocessing Corn Stover Phenolic Oil
TOS, h
mass yield, oilproduct,
g dry/g dry feed
carbon yield, oilproduct,
g C/g C in feed
oil productdensity,g/mL
gas yield,g per g dry feed
produced wateryield,
g per g dry feedH2 consumed,g H2/g dry feed mass balance, % carbon balance, %
the catalyst with carbon particulate, while the K, Fe, and Na areactually deposited onto the catalyst in the front end of the bed.Similar deposition of Si is also evident. The other catalystcomponents Al, P, and W show evidence of leaching from thecatalyst as their relative amounts are less than the diluted Co andMo major catalyst components.Sulfur analysis of samples of the catalyst gave conflicting results
relative to the sulfidation of the precious metal catalysts. In thered oak phenolic oil case, the highest sulfur loading of the Rucatalyst is consistent with a 12% sulfidation as RuS2 but it is lowerthan the fresh catalyst analysis. A typical level, based on literaturereports, is 40% Ru sulfidation in a hydrothermal environment.22
The sulfur loading of the Pd catalyst relative to the fresh catalystis evident but is much less than on the Ru catalyst by an order ofmagnitude. Also, sulfidation of the CoMo catalyst was verifiedwherein the sulfur content was equivalent to molar ratioequivalent to the CoMo loading ranged from 1.1 to 1.3 overthe catalyst bed. The ratio of S to metals in the CoMo catalystsuggested that the metals were 70 to 83% of fully sulfided.In the case of the corn stover phenolic oil, trace mineral
content was more significant, about three times the Al and K,with eight times as much S and significant amounts of Ca,Mg andP, which were not measurable in the red oak phenolic oil (seeTable 5). However, it is likely that most of this mineral matterwas removed during the solvent dilution and filtration prior tohydrotreating. Analysis of the catalyst bed fractions after the tests(see Table 16) showed that mineral deposition was not
significant when processing the corn stover phenolic oil. Theamount of Ca was higher at the front of the first catalyst (Ru/C)bed, and K was higher at the front of the second catalyst (Pd/C)bed, but in the balance of the beds they were actually lower thanin the fresh catalysts. Si was actually lower in the catalyst bedsafter use. The amount of sulfur was elevated in the front of the Rubed, but was actually lower in the used Pd bed, compared to thefresh Pd catalyst. These results suggest that sulfidation of the Rucatalyst may be a significant long-term operational problem,while Pd may be more resistant in this operating environment.The analyses seem to show that the K, Al, and Fe all migratedfrom the Ru bed to the Pd bed.
■ AUTHOR INFORMATIONCorresponding Author*D. C. Elliott. E-mail: [email protected]. Tel.: 509-375-2248. Fax 509-372-4732.NotesThe authors declare no competing financial interest.
■ ACKNOWLEDGMENTSThis work was supported by the U.S. Department of Energy aspart of the Bio-oil Stabilization and Commoditization FOA#0686 under Contract No. EE0006066 with Iowa StateUniversity (ISU) and Contract No. DE-AC05-76RL01830 atthe Pacific Northwest National Laboratory (PNNL). The
Table 15. Catalyst Analyses before and after Hydroprocessing Red Oak Phenolic Oil (ppm, Dry Basis)
authors gratefully acknowledge the support of the BioenergyTechnologies Office and program manager Prasad Gupta.Andrew Friend, Jordan Funkhouser, and Martin Haverly atISU are acknowledged for their participation in production of thepyrolysis fractions as well as Hannah Pinnt, John Hoyt, andChristine Thomas in their contribution to bio-oil character-ization. Suh-Jane Lee and Asanga Padmaperuma at PNNL areacknowledged for their participation in the operations of themini-hydrotreater.
■ REFERENCES(1) Bridgwater, A. V. Review of fast pyrolysis of biomass and productupgrading. Biomass Bioenergy 2012, 38, 68−94.(2) Lindfors, C.; Kuoppala, E.; Oasmaa, A.; Solantausta, Y.; Arpiainen,V. Fractionation of bio-oil. Energy Fuels 2014, 28, 5785.(3) Elliott, D. C. Historical developments in hydroprocessing bio-oils.Energy Fuels 2007, 21, 1792−1815.(4) Wang, H.; Male, J.; Wang, Y. Recent advances in hydrotreating ofpyrolysis bio-oil and its oxygen-containing model compounds. ACSCatal. 2013, 3, 1047−1070.(5) de Miguel Mercader, F.; Koehorst, P. J. J.; Heeres, H. J.; Kersten, S.R. A.; Hogendoorn, J. A. Competition between hydrotreating andpolymerization reactions during pyrolysis oil hydrodeoxygenation.AIChE J. 2011, 57 (11), 3160−3170). Ardiyanti, A. R.; Khromova, S.A.; Venderbosch, R. H.; Yakovlev, V. A.; Melian-Cabrera, I. V.; Heeres,H. J. Catalytic hydrotreatment of fast pyrolysis oil using bimetallic Ni-Cucatalysts on various supports. Appl. Catal., A 2012, 449, 121−130.(6) Zacher, A. H.; Olarte, M. V.; Santosa, D. M.; Elliott, D. C.; Jones, S.B. A review and perspective of recent bio-oil hydrotreating research.Green Chem. 2014, 16, 491−516.(7) Ben, H.; Mu, W.; Deng, Y.; Ragauskas, A. J. Production ofrenewable gasoline from aqueous phase hydrogenation of ligninpyrolysis oil. Fuel 2013, 103, 1148.(8) Mercader, F. dM.; Groeneveld, M. J.; Kersten, S. R. A.; Geantet, C.;Toussaint, G.; Way, N. W. J.; et al. Hydrodeoxygenation of pyrolysis oilfractions: Process understanding and quality assessment through co-processing in refinery units. Energy Environ. Sci. 2011, 4, 985.(9) Pollard, A. S.; Rover, M. R.; Brown, R. C. Characterization of bio-oilrecovered as stage fractions with unique chemical and physicalproperties. J. Anal. Appl. Pyrol 2012, 93, 129−138.(10) Rover, M. R.; Johnston, P. A.; Whitmer, L. E.; Smith, R. G.;Brown, R. C. The effect of pyrolysis temperature on recovery of bio-oilas distinctive stage fractions. J. Anal. Appl. Pyrol. 2014, 105, 262−268.(11) Wildschut, J.; Mahfud, F. H.; Venderbosch, R. H.; Heeres, H. J.Hydrotreatment of fast pyrolysis oil using heterogeneous noble-metalcatalysts. Ind. Eng. Chem. Res. 2009, 48, 10324−10334.(12) Oasmaa, A.; Elliott, D. C. Process for stabilizing fast pyrolysis oiland stabilized fast pyrolysis oil. U.S. Patent US 20120285079 A1,November 15, 2012.(13) Mihalcik, D. J.; Mullen, C. A.; Boateng, A. A. Screening acidiczeolites for catalytic fast pyrolysis of biomass and its components. J. Anal.Appl. Pyrol. 2011, 92, 224−232.(14) Elliott, D. C.; Hart, T. R.; Neuenschwander, G. G.; Rotness, L. J.;Olarte, M. V.; Zacher, A. H.; Solantausta, Y. Catalytic hydroprocessingof fast pyrolysis bio-oil from pine sawdust. Energy Fuels 2012, 26, 3891−3896.(15) Rover, M. R.; Johnston, P. A.; Jin, T.; Smith, R. G.; Brown, R. C.;Jarboe, L. Production of clean pyrolytic sugars for fermentation. Chem.Sus. Chem. 2014, 7, 1662.(16) Elliott, D. C.; Wang, H.; French, R.; Deutch, S.; Iisa, K.Hydrocarbon liquid production from biomass via hot-vapor filtered fastpyrolysis and catalytic hydroprocessing of the bio-oil. Energy Fuels 2014,28, 5909−5917.(17) Rover, M. R.; Johnston, P. A.; Lamsal, B. P.; Brown, R. C. Totalwater-soluble sugars quantification in bio-oil using the phenol−sulfuricacid assay. J. Anal. Appl. Pyrol. 2013, 104, 194−201.(18) Elliott, D. C.; Hart, T. R.; Neuenschwander, G. G.; Rotness, L. J.;Zacher, A. H. Catalytic hydroprocessing of biomass fast pyrolysis bio-oil
to produce hydrocarbon products. Environ. Prog. Sustainable Energy2009, 28 (3), 441−449.(19) Elliott, D. C.; Hart, T. R. Catalytic hydroprocessing of chemicalmodels for bio-oil. Energy Fuels 2009, 23, 631−637.(20) Elliott, D. C.; Hart, T. R.; Hu, J.; Neuenschwander, G. G.Palladium catalyzed hydrogenation of bio-oils and organic compounds.U.S. Patent US 7425657 B1, September 16, 2008.(21) Elliott, D. C.; Neuenschwander, G. G.; Hart, T. R. Hydro-processing bio-oil and products separation for coke production. ACSSust. Chem. Eng. 2013, 1, 389−392.(22) Dreher, M.; Johnson, B.; Peterson, A. A.; et al. Catalysis insupercritical water: Pathway of the methanation reaction and sulfurpoisoning over a Ru/C catalyst during the reforming of biomolecules. J.Catal. 2013, 301, 38−45.
ACS Sustainable Chemistry & Engineering Research Article