Page 1
ORIGINAL ARTICLE
Hydrochemical assessment of pond and stream waternear abandoned barite mine sites in parts of Oban massifand Mamfe Embayment, Southeastern Nigeria
Christopher Iorfa Adamu • Therese Nganje •
Aniekan Edet
Received: 31 March 2013 / Accepted: 21 August 2013 / Published online: 27 September 2013
� Springer-Verlag Berlin Heidelberg 2013
Abstract Hydrochemical studies were carried out in parts
of Oban Massif and Mamfe Embayment, Southeastern
Nigeria to examine the contributions of barite mining
activities on water quality. Pond and stream water samples
were collected from six abandoned barite mines and
adjoining streams areas during dry and wet seasons. These
samples were analysed for physicochemical parameters
using standard techniques. The results showed that the
quality of water samples in the vicinity of barite mine sites
was characterized by low pH, low mineralization, high
suspended solids and deep colour. Sodium (Na?) and cal-
cium (Ca2?) are the dominant cations and bicarbonate
(HCO3-) and sulphate (SO4
2-) the dominant anions. The
low concentration of dissolved silica, relatively high con-
centrations of Na?, HCO3- and SO4
2- suggest a combined
influence of silicate, carbonate and weathering of mine
spoils. The total dissolved solids, total suspended solids,
electrical conductivity and major ions (except Na? and K?)
are higher for water draining barite mines from Cretaceous
sediments, while Na?, K?, Ba2? are higher in basement
rock areas. Correlation and factor analyses suggest that the
main components of the water samples are related to
anthropogenic, geogenic, mineralization and environmen-
tal controls, while Gibbs diagram plots indicate weathering
as the main process controlling the chemistry of water.
Computed values of hardness and some irrigational
parameters showed that the pond and stream water samples
are generally soft and can be used for irrigation. Generally,
the water quality satisfied the WHO (2008) and NIS (2007)
standards for domestic, agriculture and industrial.
However, there is the need to assess the impact of the
pollution on the ecosystem and human health while
remediation measures are being considered.
Keywords Hydrochemistry � Assessment �Barite Mines � Surface water � Nigeria
Introduction
In the last few years, mining of barite mineral in Nigeria
has increased tremendously due to the fact that the Federal
Government has encouraged and emphasized the sourcing
and utilization of local raw materials, especially as related
to the oil and gas industry (NEST 1995; Adamu et al.
2009). This action of the government had resulted in the
indiscriminate mining of barite by the rural communities
without adequate consideration to the environmental deg-
radation, especially with the disposal of mine wastes and
restoration of the land areas. Today, abandoned mine pits
characterizes most of these barite mining areas including
the present study area. The exposed mine spoils, which are
composed of fragments of barite, sulphides and the host
rocks are associated with a myriad of environmental haz-
ards (Nganje et al. 2010, 2011; Moncur et al. 2006).
Generally mining affects water resources at various stages
of the life cycle of the mine and even after abandonment
(Jung 2001). For example, Younger et al. (2002) noted that
the mining process, mineral processing, mine dewatering,
seepage of contaminated leachate into the environment, the
flooding of mine and discharge of untreated water are some
of the environmental issues associated with mining. Water
contaminated with mine waste from perennial ponds and
streams are used by the local people for drinking and
agricultural purposes. In Southeastern Nigeria, most rural
C. I. Adamu � T. Nganje � A. Edet (&)
Department of Geology, University of Calabar, P.O. Box 3609,
UPO, Calabar 540001, Nigeria
e-mail: [email protected]
123
Environ Earth Sci (2014) 71:3793–3811
DOI 10.1007/s12665-013-2757-5
Page 2
communities, including the project area do not have access
to potable water. These communities rely on water from
streams, rivers and ponds for their daily water needs. Since
the quality of water is affected by the characteristics of the
environment of circulation and occurrence, such sources
are invariably exposed to anthropogenic pollutants from
the activities of barite mining in the area.
In spite of the potential threat to human health and the
ecosystem, the geo environmental problems of barite
mining on water quality have not been well studied and
documented in the area. Previous studies on barite in the
area focused on the genesis and distribution of barites
(Oden 2001), quality of barites (Egeh et al. 2004) and on
water quality assessment near abandoned barite mines
(Adamu et al. 2009). Hence not much has been done on the
natural processes that govern the chemical composition of
the surface waters near these barite mines and environs.
Hence, the increased knowledge of the surface water
quality in these areas will enhance the understanding of
hydrochemical systems that will guide the sustainable
development of water resources and the effective planning
and management of surface water resources in barite
mining areas.
In the past, barite was not considered as a major source
of environmental contaminant because it is an insoluble
compound (Hem 1985). However, Dogan (1999) revealed
that the problem of mining barite is a function of lithology,
climate, hydrology and the local inventory of acid-gener-
ating sulphides and acid-neutralizing carbonates as typified
in the Magampata barite region of Andhra Pradesh in India
(Nagaraju et al. 2006) and Homer Lokve barite mine in
Croatia (Franciskovic-Bilinski 2006). Generally, environ-
mental pollution from mining activities has continued to
generate unpleasant implications for health and economic
development in Nigeria (Adiuku-Brown and Ogezi 1991;
Chukwuma 1995; Adamu 2000). Despite the public and
international agencies policy focused on this problem, the
situation in Nigeria seems to be degenerating and therefore
demands urgent attention. To date, there are no clear pol-
icies in Nigeria aimed at coordinating and monitoring the
relationship between sustainable development and envi-
ronmental management (NEST 1995; Bell and Rusell
2002). Presently, the environmental protection legislation
in Nigeria is poorly enforced. Hence the need to employ
geoenvironmental studies as analytical tool to understand
the relationship between land use activities and environ-
mental contamination. This is important in Nigeria and
other developing nations, where environmental consider-
ation usually takes a second place to economic growth.
Consequently, this study was borne-out of the need to
evaluate the quality of surface water resources within the
barite mines and its environs. The aim of the study there-
fore, was to assess the impact of barite mining activities on
the quality of surface water; examine the degree and extent
of any pollution; appraise the controls and consequence of
any established pollution as well as suggest ways to ame-
liorate their possible effects.
Study area description
Physical characteristics
The study area is situated between latitudes 05�300–06�100N and longitudes 08�000–08�500E and covers parts of
the Oban Massif and the Mamfe Embayment, southeastern
Nigeria (Fig. 1). The area is situated within the subequa-
torial climate of Nigeria with total annual rainfall varying
between 180 and 200 cm. The annual temperature varies
between 25 and 30 �C (Iloeje 1997). The area experiences
two seasons: the wet (April to October) and dry (November
to March) seasons. The mean humidity decreases from
80 % in the rainy season to as low as 60 % in the dry
season.
The relief of the study area varies from the low-lying
northern fringes in the sedimentary areas to high elevations
towards Oban Massif in the south. The elevation ranges
from 100 m in the Mamfe Embayment in the north to more
than 500 m above sea level in the Oban Massif in the south
(Iloeje 1997). The area is drained by the Cross River with
major tributaries being Udip, Udam, Ukong, Bogai, Lak-
poi, Okwo and Okpon rivers, and many perennial streams
which take their rise from Enugu escarpment and the
Cameroon highlands.
Geology and hydrogeology
The geology of the study area falls within parts of the
Cretaceous sediments of Mamfe Embayment and that of
the Precambrian Basement Complex of Oban Massif (Edet
1993), Fig. 1. Rocks of the Oban Massif are mainly phyl-
lites, schists, gneisses and amphibolites. These are intruded
by pegmatites, granites, granodiorites tonalities, monzo-
nites and dolerites. Associated with these intrusives are
charnockites which occur as enclaves in gneisses and
granodiorites (Rahman et al. 1981; Ekwueme 1995a, b).
Overlying the Oban Massif is the Albian Mamfe For-
mation of Asu River Group, the oldest formation within the
Mamfe Embayment. The rocks of the formation comprise
the continental arkosic sandstones, bluish grey/black to
olivine brown shale and sandy shale, fine-grained mica-
ceous calcareous sandstone and siltstone with limestone
lenses. The shales are often carbonaceous and pyritic which
indicates that the sediments were deposited under a poorly
oxygenated shallow water environment of restricted cir-
culation, an indication of low energy environment (Petters
3794 Environ Earth Sci (2014) 71:3793–3811
123
Page 3
et al 1987). The Mamfe Formation is succeeded by the
middle Cenomanian–Turonian Eze-Aku Formation. This
geologic formation covers the northern flanks of the study
area and consists of greyish shale and siltstone with int-
erbedded sandstone and limestone intercalations. Rocks of
the Eze-Aku Formation are texturally similar to those of
Asu River Group and could have been deposited under
similar conditions (Petters et al. 1987).
The study area falls into the Hydrogeological Group II
(sandstone-siltstone-limestone unit) of Cross River State
(CRBDA 1992; Petters 1989; Okereke et al. 1998). This
group consists of shales of the Asu River Group, Eze Aku
Shales and Nkporo Shales as well as the Sandstones of the
Ajali Formation and the sandstone lenses of Eze Aku
Shales and Nkporo Shales (Petters 1989). Groundwater
occurrence in this group is dependent almost entirely on
joint pattern (CRBDA 1992). The depth to water table is
generally less than 25 m. For example, water levels for 8
UNICEF RUWATSAN boreholes drilled in Obubra zone
range from 2.14 to 9.15 m. This area also holds very low
prospects for groundwater except where boreholes are
located within the sandstones through careful geophysical
investigations (Petters 1989).
Barite mineralization
The schists and phyllites (Oban Massif) and the shales and
sandstones (Mamfe Embayment) play host for the barite
deposits of hydrothermal type mineralization in the
area (Adamu 2000, 2011; Egeh et al 2004; Akpeke 2008).
The mineralization in the Benue Trough where the study
area is situated is structurally controlled and restricted to
gentle dipping veins, fault zones and bedding planes (Olade
1976). These structures were controlled by later
Fig. 1 Geological sketch map of parts of southeastern Nigeria showing study area including the sampled locations
Environ Earth Sci (2014) 71:3793–3811 3795
123
Page 4
compression related to geotectonic events in the Pre-Tu-
ronian and Santonian times (Nwabufo-Ene 1993). Most of
the shear zones containing the barite deposits are within the
Mamfe Embayment with only a few within the Oban
Massif. The shear zones within the Oban Massif trend in
the N-S direction and are associated with quartz, Fe-oxides
and sulphides. The barite at these sites varied from brown
(stained with Fe-oxides) to transparent with cleavage line
in 3D. The barite deposits in the Mamfe Embayment trends
in the N-S and NE-SW directions and are associated with
less quartz and Fe-oxides but with increased sulphide and
calcite minerals. The barite minerals vary from dark yel-
low, sulphide stained to transparent in colour and are of
high quality with specific gravity of 4.26 with more than
92 % BaSO4 at Agoi Ibami, Yala and Agoi Ibiami (Oden
2001). However, the quality is poor at some areas, where
these barite minerals occurred in association with sulphides
and Fe-oxides.
Materials and methods
Sampling was carried out from six abandoned barite mine
sites. Two of the mine sites at Akpet 1 and Ibogo are
located within the Precambrian Basement Complex of
Oban Massif, while four sites at Nde, Alese, Okumurutet
and Iyametet are situated within the Cretaceous Mamfe
Embayment (Table 1, Figs. 1, 2). Sixty water samples were
collected from mine ponds and adjoining streams during
two sampling campaign periods comprising the wet (July
2009) and dry (February, 2010) seasons.
The pond and stream water physical parameters
including temperature, electrical conductivity (EC), total
dissolved solids (TDS), pH, dissolved oxygen (DO) and
turbidity, were measured in the field using a multi-purpose
water quality meter model PHT-027. A HACH Spectro-
photometer (model DR 3007) was used for the determi-
nation of colour and total suspended solids (TSS). Dry
Table 1 Sample location and
description
See Fig. 1
Mine site Sample ID Source Stratigraphic unit Host rock Age
Nde W1 Sandstone/Shale
Alese W6 Sandstone/Shale
Okumurutet W11 Mamfe embayment Shale/Dolomite Cretaceous
Okumurutet W12 Mine pond Shale/Dolomite
Iyametet W16 Shale/Siltstone
Akpet I W21 Schists
Akpet I W22 Oban massif Schists Precambrian
Ibongo W26 Schists
Nde W2 Sandstone/Shale
Nde W3 Sandstone/Shale
Nde W4 Sandstone/Shale
Nde W5 Sandstone/Shale
Alese W7 Sandstone/Shale
Alese W8 Mamfe embayment Sandstone/Shale
Alese W9 Sandstone/Shale
Alese W10 Sandstone Cretaceous
Okumurutet W13 Shale/Limestone
Okumurutet W14 Shale/Dolomite
Okumurutet W15 Shale
Iyametet W17 Stream Shale/Siltstone
Iyametet W18 Shale/Siltstone
Iyametet W19 Shale/Siltstone
Iyametet W20 Shale/Siltstone
Akpet I W23 Phyillite
Akpet I W24 Schists
Akpet I W25 Schists
Ibongo W27 Oban massif Gneiss Precambrian
Ibongo W28 Gneiss
Ibongo W29 Schists
Ibongo W30 Schists
3796 Environ Earth Sci (2014) 71:3793–3811
123
Page 5
clean and sterilized 1-litre polyethylene bottles were used
for sampling. The sample bottles were thoroughly rinsed
with aliquots of the water, prior to sampling. The collected
samples were labelled, kept in a cooler and transported to
the laboratory where they were preserved in the refrigerator
prior to instrumental analysis.
In the laboratory, the water samples were filtered
through 0.45-mm Millipore membrane filters to remove the
suspended materials. The water samples were analysed for
Ba2?, Ca2?, Mg2?, Na?, K?, HCO3-, SO4
2-, Cl-, NO3-,
PO42-, NH4
?, and SiO2 (Table 2) The analytical precision
was maintained by running the known standards and
duplicates after every 15 samples. The overall precision,
expressed as percent relative standard cations (%RSC) was
within 10 % and overall data reproducibility for anions was
found within 5 %. Details on analytical methods are pre-
sented in Adamu (2011). The irrigational parameters were
calculated using equations in Table 3. The statistical
analyses including descriptive statistics, correlation and
linear regression were performed using STATISTICA�
software.
Results and analysis
Table 4 contains the descriptive statistics of the physical
and chemical parameters for the pond and stream water
samples from all the sampled locations for the dry and wet
seasons, and rain water sample. Table 5 includes a sum-
mary of physicochemical parameters for the different water
types, basins and seasons. The data from the present study
(Tables 4, 5) are also compared with existing water quality
guidelines (World Health Organization WHO 1993, 1996,
2004, 2008; Nigerian Industrial Standard, NIS 2007).
Pond water chemistry
The temperature of the pond water varies between 28.6 and
30.0 �C with a mean and median of 29.13 and 29 �C. The
low standard deviation value of 0.35 suggests low variation
of temperature between the wet and dry season. The colour
of the pond water samples at all locations varies from 15
(Mamfe Embayment, ME) in the dry season (DS) to 470 Pt/
Co (Oban Massif, OM) in the dry season. The mean values
of colour for the dry and wet seasons are 133 and 153.75
Pt/Co. The TSS range from 8 to 900 mg/l with mean of
Fig. 2 A typical a barite mine area and b pond water (After Adamu
et al. 2009)
Table 2 Sample Methods of
analysis used in the present
study
Parameter Method Remarks
Ba Induced couple plasma mass spectrophotometer ACME Laboratory Limited,
Vancouver, Canada
Na, K Flame atomic emission spectrophotometer
Ca, Mg EDTA
SiO2 Molybdosilicate titration (ALPHA 1995) Benue state rural water supply
and sanitation agency
NH4 Nesslerization (BERWASSA), Makurdi, Nigeria
Cl Mohr titration
HCO3 Hydrochloric acid titration
SO4 Turbidimetry
NO3, PO4 Spectrophotometric techniques
Environ Earth Sci (2014) 71:3793–3811 3797
123
Page 6
31.80 and 212.30 mg/l for the dry and wet seasons. pH of
the pond water varies from 4.70 (OM; DS) to 6.2 (ME; DS)
indicating acidic water. All the samples display pH values
below the (1993, 2004) standard of 6.5–8.5. EC of the pond
water varies from 52 (OM, DS) to 600 lS/cm (ME, DS).
The EC values of all the water samples is below the WHO
(2004) standard of 1,500 lS/cm. TDS values range from 30
to 430 mg/l, which is below the WHO (2004) standard of
1000 mg/l. TSS vary from 8 to 900 mg/l, while the dis-
solved oxygen (DO) varies between 2 and 4.6 mg/l. DO
concentration for all the pond water samples is not within
the standard value of 5 mg/l minimum for potable water.
The maximum concentrations of cations (mg/l) indicate
that Na (ME, DS) [ Mg (ME, DS) [ Ca (ME, DS) [ K
(ME, DS). The concentrations are below the WHO (2004)
standard.
Barium in the pond water varies between 0.01 (ME,
WS) and 2.00 mg/l (OM, DS). This range of values is
below the WHO standard of 0.7 mg/l. However, one
sample from Ibongo (OM, DS) representing 6.25 % of all
the samples has barium content above the WHO standard.
Chloride content varies from 0.00 (ME, WS) to 22.10 mg/l
(ME, WS). Sulphate content ranges between 8.0 (ME, WS)
and 31 mg/l (ME, DS). Bicarbonate content ranges from 3
(OM, DS) to 100 mg/l (ME, DS). Nitrate and phosphates
varies between 6 (ME, DS) to 32 mg/l (OM, DS) and 0.0
(ME/OM, DS) to 0.60 mg/l (OM/ME, DS/WS). The con-
tents of the anions were below the WHO standard.
The six mine sites were divided into two groups on the
basis of lithology and hydrochemical characteristics. The
first group comprised Akpet 1 and Ibogo Mines charac-
terized by low ionic concentrations (Table 5). These mines
were associated with the less reactive crystalline rocks of
the Oban Massif. The mines were, however enriched in Ba
relative to the mines in the sedimentary area. This was
attributed to the age of the mines and poor quality of the
barite which resulted from Fe-oxide impurities, tourmaline
inclusions and lateritic soils (Ekwueme 1995b). The second
group included the mines at Nde, Alese, Okumurutet and
Iyametet located in the Mamfe Embayment. This group
was characterized by high ionic concentrations. The high
concentrations of dissolved ions were attributed to intense
weathering of the sedimentary rocks and associated sulp-
hides, which alongside its gangue minerals were more
abundant in the sedimentary area relative to the crystalline
basement area (Ekwueme 1995b).
Stream water chemistry
The temperature of the stream water varies from 28 (ME,
WS) to 30 �C (ME, DS). The colour of the stream water
samples ranges from a low of 3.4 to a high of 600 Pt/Co in
the wet season. The mean values of colour for the dry and
wet seasons are 149.5 and 151.14 Pt/Co. The pH values of
stream water samples of the study area varies between 4.30
(OM, DS) and 7.00 (ME, WS) with mean value of 5.85.
More than 90 % of the samples had pH \ 7.00. EC is
directly related to the concentrations of ions in water. EC
of the stream water varies from 56 (OM, WS) to 520 lS/
cm (ME, DS). The EC for all the stream water samples are
below the permissible unit of 1,400 lS/cm. The TDS of the
water samples ranges from 40 (OM, WS) to 410 mg/l (ME,
DS). According to WHO (1993) specification, TDS up to
500 mg/l is desirable for drinking water. This study shows
that more than 90 % of the stream water samples are below
the desirable unit of TDS, which can be used for drinking
without any risk.
The DO value for the stream water samples varies from
1.20 mg/l (ME, DS) to 5 mg/l (ME, WS). More than 90 %
of the samples had DO \ 5.0 mg/l probably due to high
presence of materials of high organic content leading to
oxygen depletion (Alam et al. 2012). The total hardness
(TH) varies from 0.5 (ME, WS) to 113 (ME, DS) with an
average of 19.33 mg/l. Four samples representing 9 %
from the ME in the dry season, had TH [ 75 mg/l (Soft)
but \150 mg/l (Moderately hard), using the classification
of Sawyer and McCarthy (1967). The high TH in some
locations is attributed to the presence of carbonate rocks.
The chloride concentration varies from 0.6 (ME, WS) to
23 mg/l (ME, WS) with an average of 10.40 mg/l. The
concentration of chloride in the stream water is below the
desirable limit of 250 mg/l (WHO 1993, 2004). The
Table 3 Equations for calculating irrigational water parameters
No Irrigational water parameter Equation Reference
1 Sodium adsorption ratio SAR = Na/[(Ca2? ? Mg2?)/2]� Richards (1954)
2 Percent sodium % Na = [(Na2? ?K?)/(Ca2?? Mg2? ? Na? ? K?)] 9 100 Wilcox (1955)
3 Total hardness TH = 2.5 Ca2? ? 4.1 Mg2? Todd (1980)
4 Residual sodium carbonate RSC = (HCO3- ? CO3
2-) - (Ca2? ? Mg2?) Eaton (1950)
5 Permeability index PI = [Na? ? HHCO3-/ (Ca2? ? Mg2? ? Na?)]*100 Ragunath (1987)
6 Kelly’s index KI = Na?/(Ca2? ? Mg2?) Kelly (1940) and Paliwal (1967)
7 Magnesium ratio Mg2?/Ca2? Nagaraju et al. (2006)
3798 Environ Earth Sci (2014) 71:3793–3811
123
Page 7
Ta
ble
4S
um
mar
yst
atis
tics
of
wat
erp
hy
sico
chem
ical
dat
afr
om
the
stu
dy
area
for
the
dry
and
wet
seas
on
s
Sourc
eP
ond
(n=
16)
Str
eam
(n=
44)
Rai
n(n
=3)
Sta
ndar
d
Sta
tist
ics
Mea
nM
edia
nM
inim
um
Max
imum
Std
.Dev
.M
ean
Med
ian
Min
imum
Max
imum
Std
.Dev
.M
ean
Med
ian
Min
imum
Max
imum
Std
.Dev
.W
HO
NIS
(2007
)E
U(1
975
)
Tem
p�C
29.2
329.0
028.6
030.0
00.4
229.2
429.0
028.0
030.0
00.4
923.6
724.0
023.0
024.0
00.5
8
Colo
ur
pt/
Co
143.4
459.0
015.0
0470.0
0154.9
1167.1
0126.0
03.4
0600.0
0133.2
810.0
010.0
08.0
012.0
02.0
050
pH
5.5
25.5
54.7
06.2
00.4
85.8
56.0
04.8
07.0
00.5
05.3
35.0
05.0
06.0
00.5
86.5
–8.5
6.5
–8.5
10
TD
Sm
g/l
150.3
1131.0
030.0
0430.0
0101.4
3152.6
8140.5
040.0
0410.0
095.8
58.0
08.0
06.0
010.0
02.0
01000
500
1500
EC
lS
/cm
214.9
4195.0
052.0
0600.0
0143.4
8221.3
4196.0
056.0
0520.0
0125.3
512.6
713.0
010.0
015.0
02.5
21400
1000
1250
TS
Sm
g/l
121.7
531.0
08.0
0900.0
0252.3
3255.3
0122.0
06.0
0870.0
0253.9
9
DO
mg/l
3.2
32.8
02.0
04.6
00.9
43.0
62.8
01.2
05.0
00.9
53.9
73.8
03.5
04.6
00.5
75
55
TH
mg/l
14.2
412.5
02.3
057.0
013.1
619.3
38.1
00.5
0113.0
028.7
25.1
35.6
03.5
06.3
01.4
6100
Ba2
?m
g/l
0.3
90.2
00.0
12.0
00.4
90.2
70.1
20.0
01.2
00.3
10.7
0.7
0.1
Na?
mg/l
3.8
43.0
70.5
020.1
04.4
75.9
12.7
50.0
131.0
08.4
53.5
00.8
00.7
09.0
04.7
6200
200
100
K?
mg/l
2.4
52.1
00.3
45.2
01.4
12.0
41.6
00.1
05.1
01.4
112
12
Ca2
?m
g/l
2.3
82.1
20.0
35.8
51.7
23.4
42.1
00.0
216.4
04.3
31.9
72.2
01.3
02.4
00.5
975
100
Mg
2?
mg/l
2.0
21.1
00.2
014.0
03.2
92.6
71.0
50.0
517.5
04.6
00.0
60.0
60.0
40.0
80.0
2100
0.2
50
SiO
2m
g/l
0.4
00.1
10.0
21.4
00.4
70.3
80.3
00.0
11.5
00.3
6
NH
4?
mg/l
0.8
61.0
00.1
02.0
00.5
80.9
60.9
00.0
62.4
00.6
61.5
Cl-
mg/l
9.2
19.5
00.0
022.1
05.4
110.4
010.0
00.6
023.0
04.1
6250
200
SO
42-
mg/l
18.2
518.5
08.0
031.0
06.0
215.4
114.5
01.3
032.0
07.6
6400
100
250
HC
O3-
mg/l
46.4
444.0
03.0
0100.0
024.5
756.8
050.0
014.0
0150.0
033.9
97.0
07.0
06.0
08.0
01.0
030
NO
3-
mg/l
16.6
918.0
03.0
032.0
07.8
018.1
819.0
04.0
036.0
08.1
050
50
PO
4-
mg/l
0.1
20.0
20.0
00.6
00.2
10.0
40.0
10.0
00.3
00.0
7
WH
O(1
993
,1996
,2004
,2008)
Environ Earth Sci (2014) 71:3793–3811 3799
123
Page 8
occurrence of high levels of nitrate in water is a prominent
problem in many parts of the world. The concentration of
nitrate in the study area varies from 4 (ME, DS) to 36 (OM,
DS) with an average of 18.18 mg/l. It is found that all the
stream water samples did not exceed the desirable limit of
45 mg/l (WHO 1993, 2004). Sulphate concentration varies
between 1.3 (ME, WS) and 32.0 mg/l (OM, DS) with an
average of 15.41 mg/l. These values are within the WHO
(2004) desirable limit of 250 mg/l.
Rain water chemistry
The pH values of the rain water samples of the study area
vary from 5.00 to 6.00 with mean of 5.33. This shows that
the rain water is mainly of acidic nature, besides the values
are below the WHO (2004) standard of 6.5–8.5. The EC of
the rain water samples was\15.00 lS/cm (mean 12.67 lS/
cm). The average TDS is less than 10 mg/l. The EC and
TDS values of the rain water samples are below the NIS
(2007) and WHO (2004) limits of 1,500 lS/cm and
1,000 mg/l, respectively. The concentrations of ions in the
rain water samples were \10 mg/l.
Table 4 shows that although waters from the abandoned
mine ponds are more mineralized than stream and rain
waters due to high concentrations of TDS and ions (except
NO3, NH4 and PO4), the difference was not statistically
significant. The water samples were therefore adjudged to
have a common source. The depletion in concentration of
dissolved solids in the stream waters was attributed to
dilution by surface run-off. The washing of solids into the
streams by run-off also contributed to the high level of
suspended matter in stream waters. The elevated concen-
trations of nitrates, ammonium and phosphates in stream
waters are attributed to the use of manures and fertiliser in
crop production as well as indiscriminate dumping of
organic waste into or close to the streams in the area.
Seasonal and spatial variation
The highest values of physical parameters in both seasons
(Table 6) were below the maximum acceptable limits
(WHO; NIS 2007). However, colour, pH, TSS and tem-
perature exceeded these limits. Test of significance for the
relation of physical parameters between different seasons
by z test was significant (z calculated [ z critical of 1.96 at
P \ 0.05) for most physical parameters (TDS, EC, DO,
HT). However, the z test indicated that there was no sig-
nificant difference between values of the different physical
parameters from samples of the pond water and the stream
water samples with the exception of TSS in both seasons
Table 5 Mean values of pond water and stream water physicochemical data from the study area for the different geologic area and seasons
Source Pond water Stream water WHO NIS (2007) EU (1975)
Basin ME ME OM OM ME ME OM OM
Season D W D W D W D W
Temp 29.30 29.20 29.40 29.00 29.53 28.93 29.54 29.00
Colour 51.00 86.00 270.00 266.67 160.87 200.36 125.14 151.14 50
pH 5.70 5.80 5.27 5.00 5.99 5.80 5.66 5.86 6.5–8.5 6.5–8.5 10
TDS 237.60 134.00 115.67 66.67 212.00 144.40 122.86 73.14 1000 500 1500
EC 324.80 178.00 204.33 104.00 288.00 217.40 201.71 106.57 1400 1000 1250
TSS 31.00 147.40 32.00 320.00 112.13 350.13 48.71 565.43
DO 3.28 3.32 2.90 3.33 2.49 3.53 2.61 3.71 5 5 5
TH 25.00 10.00 10.43 7.17 37.83 9.47 12.90 7.21 100
Ba2? 0.27 0.11 1.01 0.43 0.32 0.14 0.57 0.18 0.7 0.7 0.1
Na? 6.43 3.21 3.01 1.40 11.48 3.79 2.23 2.19 200 200 100
K? 4.22 1.19 2.17 1.90 3.52 1.39 0.76 1.53 12 12
Ca2? 3.60 1.86 2.05 1.52 5.65 2.11 3.24 1.71 75 100
Mg2? 3.89 1.33 1.26 0.80 5.78 1.18 1.18 0.72 100 0.2 50
SiO2 0.05 0.43 0.27 1.07 0.11 0.46 0.43 0.79
NH4? 1.40 0.62 0.93 0.27 1.27 0.72 1.14 0.61 1.5
Cl- 8.00 11.26 9.33 7.67 10.53 9.95 11.29 10.20 250 200
SO42- 21.00 16.00 21.00 14.67 16.07 10.61 26.83 12.89 400 100 250
HCO3- 72.20 40.60 29.00 30.67 94.00 43.27 37.71 25.14 30
NO3- 11.20 17.00 18.67 23.33 15.87 19.20 22.00 17.14 50 50
PO43- 0.02 0.23 0.20 0.01 0.01 0.07 0.03 0.01
ME Mamfe Embayment, OM Oban massif, D dry season, W wet season
3800 Environ Earth Sci (2014) 71:3793–3811
123
Page 9
Table 6 Summary statistics of water geochemical data from the study area in (A) dry season and (B) wet season
Parameter Units Mean SD Median Minimum Maximum CV SK WHO NIS (2007) EU (1975)
A
Temp �C 29.43 0.17 29.6 28.5 30 0 -0.76
Colour Pt/Co 140.25 96.76 119 15 470 69 1.46 50
pH 5.71** 0.38 5.76 4.7 6.8 7 -0.02 6.5–8.5 6.5–8.5 10
TDS mg/l 202.88*,** 64.86 160 85 430 32 1.05 1,000 500 1,500
EC lS/cm 292.83*,** 81.56 242 130 600 28 0.81 1,400 1,000 1,250
TSS mg/l 84.67*,** 30.85 60 8 200 36 0.81
DO mg/l 2.84 0.3 2.4 2 4.6 11 1.04 5 5 5
Hardness mg/l 24.93* 20.87 16.8 2.6 112.75 80 1.74 100
Ba2? mg/l 0.46*,** 0.32 0.21 0 2 71 1.62 0.7 0.7 0.1
Na? mg/l 6.71* 6.72 3.065 0.01 30 75 1.64 200 200 100
K? mg/l 3.01* 1.41 2.6 0.5 5.2 47 -0.18 12 12
Ca2? mg/l 4.34* 3.17 3.17 0.03 16.4 69 1.76 75 100
Mg2? mg/l 3.44* 3.49 1.7 0.2 17.5 72 1.65 100 0.2 50
SiO2 mg/l 0.19* 0.15 0.1 0.02 0.6 79 1.11
NH4? mg/l 1.20* 0.42 1.2 0.08 2.4 35 -0.1 1.5
Cl- mg/l 10.32 1.77 10 4 16 17 -0.16 250 200
SO42- mg/l 21.20*,** 3.83 20 10 32 18 -0.13 400 100 250
HCO3- mg/l 67.58* 29.24 66 3 142 43 0.48 30
NO3- mg/l 16.33* 4.53 16.33 3 36 28 0.47 50 50
PO43- mg/l 0.04* 0.08 0.01 0 0.6 75 5.1
B
Temp �C 28.92 0.2 28.8 28 29.7 0 -1.17
Colour Pt/Co 184 105.73 120.36 3.4 400 87 1.39 50
pH 5.67** 0.33 5.73 4.6 6.6 6 -0.69 6.5–8.5 6.5–8.5 10
TDS mg/l 119.94* 64.73 67.36 30 390 54 1.39 1,000 500 1,500
EC lS/cm 173.89* 87.05 91 52 500 50 1.48 1,400 1,000 1,250
TSS mg/l 439.74* 184.8 469.87 6 900 42 1.62
DO mg/l 3.45 0.4 3 2.4 4.6 12 3.02 5 5 5
Hardness mg/l 8.53 7.19 7.7 1.2 29.05 82 0.83 100
Ba2? mg/l 0.19*,** 0.1 0.1 0.01 0.5 53 2.88 0.7 0.7 0.1
Na? mg/l 3.14* 1.79 2.53 0.5 16 57 0.98 200 200 100
K? mg/l 1.49* 0.3 1.49 0.2 3 20 0.94 12 12
Ca2? mg/l 1.89* 1.65 2 0.02 6.7 87 0.62 75 100
Mg2? mg/l 1.02* 0.88 1 0.14 3 86 1.07 100 0.2 50
SiO2 mg/l 0.57 0.3 0.6 0.05 1.4 53 -0.35
NH4? mg/l 0.58* 0.26 0.4 0.06 1.2 45 -0.25 1.5
Cl- mg/l 10.08 4.21 10 0 23 42 0.06 250 200
SO42- mg/l 13.57*,** 2.74 10.4 8 22 20 1.39 400 100 250
HCO3- mg/l 36.44* 8.8 33 14 70 24 -1.21 30
NO3- mg/l 19.73* 3.64 18.86 6 31 18 -0.23 50 50
PO43- mg/l 0.07 0.06 0.02 0 0.6 86 2.85
Standard = Maximum acceptable limit (NIS 2007; WHO 1993, 1996, 2004, 2008)
CV coefficient of variation, SK skewness
* Significant seasonal variation at p \ 0.05 using z test
** Significant spatial variation at p \ 0.05 using z test
Environ Earth Sci (2014) 71:3793–3811 3801
123
Page 10
and pH, TDS and EC in the dry season. Comparison of the
values of the physical parameters with those of the stream
water samples shows higher values for the pond water
except for pH and DO (Table 5). The pond water is more
saline than the stream water due to high concentrations of
TDS and commensurately high EC. Contrary, the stream
water was more coloured with commensurately high TSS
However, the z test indicates that there was no significant
difference between values of the different physical
parameters from the mine pond and stream waters with the
exception of TSS and colour. Ellis (1993) attributed the
colour of natural waters to organic matter, which may
occur in the dissolved state, in colloidal suspension, or as
coarse-suspended matter. The high levels of suspended
matter in the water samples were attributed to the disper-
sion of mine spoils. In addition, the presence of acidic
waters in the study area was due to decaying organic matter
in the soil and oxidation of sulphides from mine spoils.
Normally, the pH of mine water is B3.5 (Rose and Cravotta
1998). However, for the study area, the pH values on the
average were [3.5 due to buffering by carbonates and
crystalline rocks, which underline the area.
The major anions (HCO3-, SO4
2-, NO3-, Cl-) consti-
tuted more than 80 % of the TDS in both seasons. Bicar-
bonate is the dominant anion accounting for more than
50 % of the total anions in water. Bicarbonate ion was
followed by sulphate ion (SO42-) which accounted for
about 15 % of total anions. Nitrate (NO3-) constituted
about 12 % of total anions. The content of chloride ion
constituted only about 8 % of total anions. The major
cations (Na?, Ca2?, Mg2?, and K?) constituted less than
20 % of TDS. Sodium and calcium accounted for about
5 % (31 %) and 3 % (19 %) of the TDS (cations),
respectively. The contents of magnesium (Mg2?) and
potassium (K?) constituted less than 4 % (25 %) each of
the TDS (cations). The levels of minor dissolved solids
(NH4?, SiO2 and PO4
3-) were low (\3 mg/l) with little or
no contribution to the total ionic budget. The comparative
minor dissolved ionic composition of the hydrochemical
data showed that the order of concentration of minor dis-
solved solids was NH4? [ SiO2 [ PO4
3-.
The highest values of chemical parameters in both
seasons were within maximum acceptable limits of NIS
(2007) and WHO, except for barium (Ba). Test of signifi-
cance for the relation of chemical parameters between
different seasons by z test was significant (z calcu-
lated [ z critical of 1.96 at P \ 0.05) for most chemical
parameters. The z test indicates that there is no significant
difference between levels of chemical parameters from the
mine pond water and the stream water, except for Ba and
SO42- in both seasons. The mean concentrations of
chemical parameters (Na?, K?, Ca2?, Mg2?, Cl-, HCO3-,
SiO2, NH4?) were higher in the mine pond waters than the
stream waters except for NO3 and PO4. Test of significance
for the relation of chemical parameters between pond and
stream water samples by z test was not significant (z cal-
culated [ z critical of 1.96 at P \ 0.05). Hence less
emphasis was placed in the study on water types (sources).
Water type
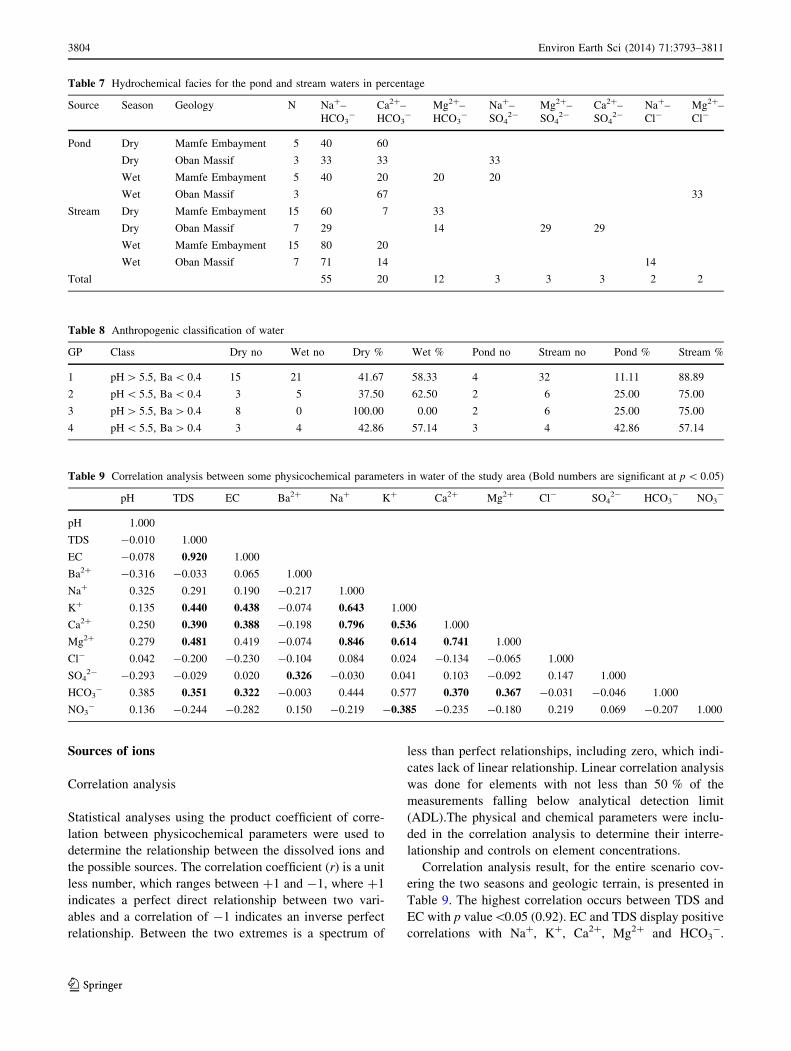
Hydrochemical classification
Major ions were plotted on a trilinear Piper diagram (Piper
1944) to evaluate the hydrochemistry of the different
waters (Fig. 3). Majority of the water type falls in the field
Na?–HCO3- and Ca2?–HCO3
- (Table 7). These water
types made up 55 and 20 % of the different water types in
the area. This was followed by Mg2?–HCO3- (12 %);
Na?–SO42-, Mg2?–SO4
2-, Ca2?–SO42- (3 % each);
Na?–Cl- and Mg2?–Cl- (2 % each). The Na?–HCO3-
occurs in all scenarios, except for the pond water sample in
the wet season from Oban Massif. The Ca2?–HCO3- water
type was found in all the scenarios of sampling, except for
the stream water sample in the dry season from Oban
Massif. Abundance of this water type is probably the result
of dissolution of feldspar and carbonate minerals from the
rock matrix. The source (s) of other water types is due to
minor variations in the lithology of the bedrock.
Anthropogenic classification
The water samples were classified into four groups based
on pH and Ba which represent the influence of barite
mining activities. Following the method of Sinclair (1974),
the threshold values were 5.5 and 0.4 mg/l for pH and Ba,
respectively. These threshold values were then used to
divide the samples into four classes (Table 8). The samples
of group 1 (GP 1) are relatively high in pH ([5.5) and low
in Ba (\0.4 mg/l) and accounted for 41.67 and 58.33 % of
water samples in the dry and wet seasons, respectively.
This group (GP 1) also accounted for 11.11 and 88.89 %
for the pond and stream water samples, respectively. This
is the slightly acidic-low barium group. Group 2 (GP 2) is
the low pH (\5.5)—low barium (\0.4 mg/l) group and
accounted for 37.50 and 62.50 % of water samples,
respectively, for the dry and the wet seasons. The GP 2 also
accounted for 25 and 75 % of the pond and stream samples.
Group 3 (GP 3) is the high pH ([5.5) and high Ba
([0.4 mg/l) group. This group (GP 3) accounted for 100 %
of samples in the dry season with no sample in the wet
season and 25 and 75 %, respectively, for the pond and
stream waters. Group 4 (GP 4) comprised samples that are
relatively low in pH (\5.5) but high in Ba ([0.4 mg/l) and
accounted for 42.86 and 57.14 % of water samples in the
3802 Environ Earth Sci (2014) 71:3793–3811
123
Page 11
wet and the dry seasons, respectively. The same group (GP
4) had 42.86 and 57.14 % of the pond and river water
samples, respectively. This is the low acidic–high barium
group that is considered most hazardous. The implication
of the classification is that group 1 is controlled mainly by
natural and geogenic (weathering) processes, group 2 by
geogenic and environmental processes, group 3 by
environmental and anthropogenic activities and group 4 by
anthropogenic activities. It must, however, be noted that
the high percentage for stream water samples is due to the
fact that the stream water samples for the two seasons (44)
were higher than that of the pond water samples (16). High
percentage for wet dry season may be attributed to high
rate of dissolution relative to the dry season.
Fig. 3 Piper’s trilinear diagram
of hydrochemical data in the
study area a wet season, b dry
season
Environ Earth Sci (2014) 71:3793–3811 3803
123
Page 12
Sources of ions
Correlation analysis
Statistical analyses using the product coefficient of corre-
lation between physicochemical parameters were used to
determine the relationship between the dissolved ions and
the possible sources. The correlation coefficient (r) is a unit
less number, which ranges between ?1 and -1, where ?1
indicates a perfect direct relationship between two vari-
ables and a correlation of -1 indicates an inverse perfect
relationship. Between the two extremes is a spectrum of
less than perfect relationships, including zero, which indi-
cates lack of linear relationship. Linear correlation analysis
was done for elements with not less than 50 % of the
measurements falling below analytical detection limit
(ADL).The physical and chemical parameters were inclu-
ded in the correlation analysis to determine their interre-
lationship and controls on element concentrations.
Correlation analysis result, for the entire scenario cov-
ering the two seasons and geologic terrain, is presented in
Table 9. The highest correlation occurs between TDS and
EC with p value\0.05 (0.92). EC and TDS display positive
correlations with Na?, K?, Ca2?, Mg2? and HCO3-.
Table 7 Hydrochemical facies for the pond and stream waters in percentage
Source Season Geology N Na?–
HCO3-
Ca2?–
HCO3-
Mg2?–
HCO3-
Na?–
SO42-
Mg2?–
SO42-
Ca2?–
SO42-
Na?–
Cl-Mg2?–
Cl-
Pond Dry Mamfe Embayment 5 40 60
Dry Oban Massif 3 33 33 33
Wet Mamfe Embayment 5 40 20 20 20
Wet Oban Massif 3 67 33
Stream Dry Mamfe Embayment 15 60 7 33
Dry Oban Massif 7 29 14 29 29
Wet Mamfe Embayment 15 80 20
Wet Oban Massif 7 71 14 14
Total 55 20 12 3 3 3 2 2
Table 8 Anthropogenic classification of water
GP Class Dry no Wet no Dry % Wet % Pond no Stream no Pond % Stream %
1 pH [ 5.5, Ba \ 0.4 15 21 41.67 58.33 4 32 11.11 88.89
2 pH \ 5.5, Ba \ 0.4 3 5 37.50 62.50 2 6 25.00 75.00
3 pH [ 5.5, Ba [ 0.4 8 0 100.00 0.00 2 6 25.00 75.00
4 pH \ 5.5, Ba [ 0.4 3 4 42.86 57.14 3 4 42.86 57.14
Table 9 Correlation analysis between some physicochemical parameters in water of the study area (Bold numbers are significant at p \ 0.05)
pH TDS EC Ba2? Na? K? Ca2? Mg2? Cl- SO42- HCO3
- NO3-
pH 1.000
TDS -0.010 1.000
EC -0.078 0.920 1.000
Ba2? -0.316 -0.033 0.065 1.000
Na? 0.325 0.291 0.190 -0.217 1.000
K? 0.135 0.440 0.438 -0.074 0.643 1.000
Ca2? 0.250 0.390 0.388 -0.198 0.796 0.536 1.000
Mg2? 0.279 0.481 0.419 -0.074 0.846 0.614 0.741 1.000
Cl- 0.042 -0.200 -0.230 -0.104 0.084 0.024 -0.134 -0.065 1.000
SO42- -0.293 -0.029 0.020 0.326 -0.030 0.041 0.103 -0.092 0.147 1.000
HCO3- 0.385 0.351 0.322 -0.003 0.444 0.577 0.370 0.367 -0.031 -0.046 1.000
NO3- 0.136 -0.244 -0.282 0.150 -0.219 -0.385 -0.235 -0.180 0.219 0.069 -0.207 1.000
3804 Environ Earth Sci (2014) 71:3793–3811
123
Page 13
Barium and sulphate are positively correlated reflecting the
dissolution of barite mineral. The correlation between Ca2?
and HCO3- and Ca2? and Mg2? suggest the weathering of
calcite and dolomite minerals, especially from Mamfe
Embayment. The correlation between Na? and K?, Ca2?,
Mg2? may be attributed to cation exchange (Edet et al.
2012), while that between K? and NO3- is due to poor
waste management.
Poor correlations between the different parameters are
attributed to variability, and differences in geochemical
behaviour of parameters (Cox 1995; Edet et al. 2003;
Nganje et al. 2010). Within the study area, ions are released
into the drainage system from different sources including
weathering of different rocks types, oxidation of sulphides,
barite, silicates, carbonates and other minerals. Minor
contributions included atmospheric fall-out and agricul-
tural practices. The different sources of ions are responsible
for the variability in elemental content in the drainage
system. This is supported by the high coefficient of varia-
tions values (Table 6), and lack of strong correlation
between parameters (Table 9).
Factor analysis
Factor analysis is a multivariate statistical method which
yields the general relationship between measured chemical
variables by showing multivariate patterns that may help to
classify the original data. The geological interpretation of
factors gives an insight into the main processes, which may
govern the distribution of hydrochemical variables. Factor
analysis can identify several pollution factors reasonably
but the interpretation of these factors in terms of actual
controlling sources and processes is highly subjective
(Matalas and Reiher 1967; Bahar and Reza 2010). R-mode
factor analysis on the combined data sets provided four
factors with eigenvalue [1 that explained approximately
71.53 % of the variability of the data (Table 10). Factor 1
has an eigenvalue of 4.30 and explains 35.83 % of the total
variance and shows high loadings on Na?, K?, Ca2?, Mg2?
and HCO3-. The high loading for these ions EC, TDS, Na?
and Cl- indicates silicate and carbonate mineral
dissolution.
The Na?, K?, Ca2? and Mg2? may also reflect the
contributions of other hydrochemical processes (ion
exchange, soil CO2 or from bacterial degradation). Factor 2
has an eigenvalue of 1.87 and explains 15.56 % of the total
variance with high loading on EC, TDS and Cl-. This is
attributed to mineral dissolution and absence of halite in
the area. Factor 3 has an eigenvalue of 1.39 and explains
11.59 % of the total variance. It shows high loadings on
pH, Ba? and SO42-, which is attributed to dissolution of
barite mineral. Factor 4 has an eigenvalue of 1.03 and
explains 8.55 % of the total variance. It shows high
loadings on NO3-. This reveals atmospheric and pollution
sources (Jeong 2001) and poor waste management.
Processes controlling water chemistry
Water rock interaction plays a significant role in water
quality, which is useful for understanding the source of
ions in water (Prasanna et al. 2011). The Gibbs diagram
was therefore used to determine the source of ions in water.
Figure 4 illustrates that all the samples, with the exception
of the rain water, fall in the rock weathering field, sug-
gesting weathering of minerals such as silicates, carbonates
and barites. It is therefore obvious that mineral dissolution
is the major processes that regulate water chemistry in the
area. Hence, saturation index (SI) of the water samples
were calculated using the geochemical equilibrium model
MINTEQA2 (Parkhurst and Appelo 1999), Table 11.
Nearly all the samples are oversaturated with respect to
barite (SI [ 0). Therefore, the water chemistry seems to be
largely affected by the dissolution of barite and carbonate
minerals.
Irrigational water quality assessment
The quality of any water for irrigation use is determined by
the concentration and composition of dissolved
Table 10 Factor analysis between some physicochemical parameters
in water of the study area (Bold numbers are significant at p \ 0.05)
Source Parameter Factor
1 2 3 4
Pond and
Stream
pH 0.379 -0.070 0.614 0.498
TDS 0.288 0.859 0.006 -0.070
EC 0.225 0.892 -0.078 -0.108
Ba2? -0.234 0.262 -0.647 0.299
Na? 0.937 0.022 0.084 -0.045
K? 0.752 0.305 -0.064 -0.163
Ca2? 0.818 0.210 0.018 -0.120
Mg2? 0.815 0.302 0.076 0.010
Cl- 0.218 -0.517 -0.227 0.259
SO42- 0.113 -0.097 -0.836 0.030
HCO3- 0.547 0.361 0.135 0.236
NO3- -0.236 -0.200 -0.080 0.812
Eigenval 4.299 1.868 1.390 1.026
% total
variance
35.829 15.563 11.586 8.549
Cumul.
Eigenval
4.299 6.167 7.557 8.583
% Cumul.
variance
35.829 51.392 62.977 71.526
Environ Earth Sci (2014) 71:3793–3811 3805
123
Page 14
constituents in the water. A lot of chemical constituents
affect the suitability of water for irrigation based on the
total concentration of soluble salts and the relative pro-
portion of major cations. The suitability of water for irri-
gation depends on the effect of mineral constituent of water
for both plants and soil (Wilcox 1955).
Sodium adsorption ratio (SAR)
Excess Na? in water produces undesirable effects of
changing soil properties and reducing soil permeability
(Kelly 1940). Hence, assessment of Na is essential when
considering the suitability of water for irrigation. The
degree to which irrigation water enters into cation
exchange reactions in soil can be indicated by the SAR. Na
replacing adsorbs Ca2? and Mg2? causes damage to soil
structure. Table 12 shows that all the samples from the dry
and wet seasons and Mamfe Embayment and Oban Massif
are excellent for irrigation purposes.
Percent sodium (% Na)
Water for irrigation containing large amounts of sodium is
a special concern due to sodium’s hazard on soil. Excess
sodium in water produces undesirable effects of reducing
soil permeability (Subba Rao 2006). Hence the assessment
of percentage of sodium in irrigation water was performed.
The classification of water on the basis of %Na is given in
Table 12. The table shows that 20, 29, 14, 14 % of pond
water from Mamfe Embayment (dry season, DS), stream
water from Oban massif (DS), stream water from Mamfe
Embayment (wet season, WS) and stream water from Oban
Massif (WS) are excellent for irrigation while 28 % of all
the stream water samples from Mamfe Embayment with
[80 % Na are unsuitable for irrigation.
1
10
100
1000
10000
0.00 0.20 0.40 0.60 0.80 1.00
Na/(Na+Ca)
TD
S (m
g/l)
PDME
PDOM
SDME
SDOM
PWME
PWOM
SWME
SWOM
Rain
Evaporation Dominance
Rock weathering Dominance
Atomspheric Precipitation Dominance
Fig. 4 Gibbs (1970) diagram showing mechanism controlling water
chemistry in the study area (PDME pond water dry season, Mamfe
Embayment; PDOM pond water dry season, Oban Massif; SDME
stream water dry season, Mamfe Embayment; SDOM stream water,
dry season, Oban Massif; PWME pond water wet season, Mamfe
Embayment; PWOM pond water wet season, Oban Massif; SWME
stream water wet season, Mamfe Embayment; SWOM stream water,
wet season, Oban Massif)
Table 11 Saturation indices for mineral phases in the study area
Mineral Nde Alese Okumurutet Iyametet Akpet I Ibogo
Angliste (PbSO4) -1.6 (-2.1) -2.3 (-3.3) -3.2 ( -4.4) -4.0 (-6.00) -3.8 (-4.6) -3.7 (-4.4)
Barite (BaSO4) 0.2 (0.08) 0.6 (0.30) -0.16 (0.4) 0.5 (0.30) 0.7 (0.2) 1.1 (0.6)
Epsomite (MgSO4) -6.1 (6.4) -6.2 (6.7) -5.3 (-6.6) -5.3 (-7.2) -6.0 (-3.2) -5.9 (-7.6)
Gypsum (CaSO4) 2H20) -3.3 (-4.1) -3.7 ( -5.7) -2.9 (-5.0) -3.3 (-6.2) -3.4 (-6.6) -3.2 (-4.2)
Covellite (CuS) -26.2 (-27) -25.2 (-30.2) -26.7 (-4.6) -26.8 (-26.3) -23.5 (-39.6) -27.1 (-30.3)
Greemokite (CdS) -11.1 (-14) -10.8 (-16.11) -11.7 (-16.3) -16.5 (-20.4) -14.0 (-18) -11.2 (-14.5)
Galena (PbS) -9.5 (-11.1) -9.5 (-12.9) -10.2 (-13.0) -10.8 (-13.3) -9.0 (-11.7) -9.7 (-13)
Sphaletite (ZnS) -9.4 (-10.6) -9.4 ( 10.2) -10.1 (-11.0) -10.29 (-12.4) -9.4 (-11.2) -9.3 (-10.8)
Pyrite (FeS2) -6.3 (-6.8) -6.6 (-7.2) -726 (-7.7) -7.6 (-8.0) -6.4 (-6.8) -6.3 (-6.4)
Al (OH)3 -8.7 (-9.8) -9.0 (-10.0) -9.2 (-11.0) -8.8 (-9.6) -8.4 (-10.0) -8.2 (-9.2)
Fe (OH)3 -5.6 (-6.6) -5.4 ( -6.6) -6.0 (-7.2) -5.2 (-6.8) -4.8 (-0.8) -5.0 (-7.0)
Goethite (FeOOH) -7.2 (-9.0) -6.8 (-8.8) -7.0 (-9.2) -6.6 (-8.8) -6.4 (-8.2) -7.1 (-7.2)
Henatite (Fe2O3) -6.9 (-8.2) -6.8 (-9.0) -5.7 (-9.11) -5.3 (-80 -5.9 (-85) -6.6 (-9.2)
Magnetite (Fe3O4) -6.4 (-7.8) -6.49 (-7.8) -5.3 (-8.0) -5.0 (-7.1) -5.6 (-7.7) -6.2 (-8.0)
Cxalcite (CaCO3) -4.2 (-6.0) -4.4 (-6.2) -2.8 (-7.4) -2.7 (-7.2) -4.6 (-6.8) -5.1 (-6.9)
Siderite (FeCO3) -2.6 (-2.8) -2.6 (-3.0) -1.5 (-4.4) -1.2 (-1.8) -2.0 (-3.0.) -2.3 (-3.1)
Cerusite (PbCO3) -1.1 (-2.1) -1.6 (-1.8) -1.5 (-3.0) -2.0 (-2.6) -3.5 (-5.40) -4.2 (-6.0)
Witherite (ZnCO3) -6.0 (-8.4) -5.4 (-8.8) -5.2 (-9.0) -4.2 (-7.0) -5.7 (-7.80) -6.1 (-8.1)
Otavite (CdCO3) -4.3 (-6.3) -3.9 (-6.6) -3.7 (-7.1) -3.5 (-6.8) -3.8 (-6.90) -4.3 (-6.4)
Values in brackets are for wet season
3806 Environ Earth Sci (2014) 71:3793–3811
123
Page 15
Residual sodium carbonate (RSC)
When total carbonate concentration exceed the total
amount of Ca and Mg, the water quality may be impaired
for irrigational use. When the excess carbonate becomes
too high, it combines with Ca and Mg and precipitates.
Hence, the relative abundance of Na with respect alkaline
earths and the quantity of bicarbonates and carbonate in
excess of alkaline earths also influence the suitability of
water for irrigation use. In the pond and stream water, most
of the samples fall in the good category indicating water fit
for irrigation use (Table 12). However, 7 % of the stream
water samples from Mamfe Embayment (DS) were clas-
sified as doubtful for irrigation use.
Total dissolved solids (TDS) and electrical conductivity
(EC)
According to TDS classification, all the samples fall in the
fresh category indicating that the pond and stream water
are fit for irrigation (Table 12). The EC is usually con-
sidered important in classifying irrigation water. High EC
Table 12 Assessment of pond and stream waters for irrigation use
Parameter Range Class Pond Pond Pond Source Season Geology Stream Stream
Pond Stream Stream
Dry Dry Wet Wet Dry Dry Wet Wet
ME OM ME OM ME OM ME OM
Total no of samples (n) 5 3 5 3 15 7 15 7
Sodium adsorption ratio (SAR) \10.0 Excellent 100 100 100 100 100 100 100 100
10.0–18.0 Good
18.0–26.0 Doubtful
[26.0 Unsuitable
Percent sodium (% Na) \20 Excellent 20 29 14 14
20–40 Good 20 33 20 43 7
40–60 Permissible 60 67 40 67 60 14 21 86
60–80 Doubtful 20 33 40 13 14 33
[80 Unsuitable 7 28
Electrical conductivity (EC) lS/cm \250 Excellent 67 100 80 100 33 71 53 100
250–750 Good 33 20 67 29 47
750–2,000 Permissible
2,000–3,000 Doubtful
[3,000 Unsuitable
Residual sodium carbonate \1.25 Good 100 100 100 100 93 100 100 100
1.25–2.5 Doubtful 7
[2.5 Unsuitable
Kelly’s index (KI) [1 20 33 40 20 29 60
\1 80 67 60 100 80 71 40 100
Total dissolved solids (TDS) mg/l \1,000 Fresh 100 100 100 100 100 100 100 100
1,000–3,000 Slightly saline
3,000–10,000 Moderately saline
[10,000 High saline
Total hardness (TH) mg/l \75 Soft 100 100 100 100 73 100 100 100
75–150 Moderately hard 27
150–300 Hard
[300 Very hard
Permeability index (PI) % [75 Excellent 100 100 100 100 100 100 100 100
25–75 Good
\25 Unsuitable
Magnesium ratio (MH) % \50 % Suitable 80 67 20 67 13 71 20 14
[50 % Unsuitable 20 33 80 33 87 29 80 86
ME Mamfe Embayment, OM Oban Massif
Environ Earth Sci (2014) 71:3793–3811 3807
123
Page 16
leads to formation of saline soil (Nagarajan et al. 2010).
Most of the water samples from this study indicates good to
excellent water for irrigation with EC \ 250 lS/cm
(Table 12).
Permeability index (PI)
The permeability index indicates whether water is suitable
for irrigation. Doneen (1964) classified water as Class I
with permeability index [75 % (Excellent); Class II hav-
ing PI of between\75 to[25 % (Good) and Class III with
PI \ 25 % (Unsuitable). All the samples fall in the Class I
category, indicating excellent water for irrigation
(Table 12).
Total hardness (TH)
Water hardness refers to the soap neutralizing effect of
water. According to USGS hardness scale, majority of the
samples fall in the soft category. However, 27 % of stream
water from the Mamfe Embayment in the dry season fall in
the moderate category (Table 12).
Kelly index (KI)
.On the basis of Kelly’s index, the pond and stream water
samples are classified for irrigation use. A Kelly index [1
indicates excess of sodium in water (Kelly 1940; Paliwal
1967). Therefore water with KI \ 1 is suitable for irriga-
tion, whereas water with KI [ 1 is unsuitable. From
table 12, most of the water samples are suitable for irri-
gation use.
Magnesium hazard (MH)
Calcium and magnesium maintain a state of equilibrium in
most waters. In equilibrium, more magnesium will
adversely affect crop yields. It is observed that most of the
water contains more Ca and Mg. In this study, most of the
pond water samples from ME (DS), OM (DS & WS) and
stream water (OM, dry season) are suitable for irrigation
use (Table 12).
Discussions and environmental management
implications
The physical parameters (temperature, colour, pH, TDS,
EC, TSS and DO) showed significant variations. Temper-
ature (CV = 0.02 %) exhibited the least relative variabil-
ity, while colour (CV = 87 %) exhibited the highest
relative variability. Generally, the physical parameters
varied greatly amongst the different mine sites. High
variability was attributed to the changes in environmental,
geological or anthropogenic conditions (Lee et al. 2005).
The temperature values (28–30 �C) recorded for the water
samples were close to the atmospheric temperature
(23–32 �C) recorded during the sampling periods. The low
variability in temperature values was attributed to the high
heat capacity of water to act as a ‘‘thermal buffer’’ (Adamu
and Nyiatagher 2005).
There was no significant difference at p \ 0.05 between
values of colour observed from the pond water and stream
water samples. However, the mean value of colour in the
stream water was higher than the mean value of the pond
water (Table 5). High values of colour have been variously
attributed to iron content in water (Udom et al. 1998) and
suspended matter (Hem 1985). Thus the high values of
suspended particles recorded in this study and the observed
brownish/yellowish iron precipitates on river beds during
the field study may suggest these factors as impacting the
colour of water in the study area.
There was statistically significant difference (p \ 0.05)
in mean pH values between the pond water and stream
water samples. Besides, the mean values of pH obtained for
both dry and wet seasons (Table 5) were not within the
limits of 6.5–8.5 stipulated for drinking water by WHO and
NIS (2007), indicating the slightly to moderately acidic
nature of the water. According to Hem (1985), surface
water acidity is rare and can only occur in the presence of
strong mineral acids or carbonic acids. It is reasonable to
suggest that dissolution of CO2 from atmosphere, and
leaching of organic acid from decaying organic matter and
soils contribute to acidity of water in the study area
(Nganje et al. 2010). The relatively lower mean values of
pH in the mine area compared to the stream water samples
suggested the presence of strong mineral acids, most
probably from the weathering of sulphides, sulphates and
Fe-oxides in mine spoils.
The mean TDS values of the pond water samples for the
dry (202.88 mg/l) and wet seasons were significantly
(p \ 0.05) higher than the mean values for the stream
water samples. This indicated higher mineral dissolution in
the mine area compared to the streams. The mining of
barite, resulted in a marked increase in surface area of
mineralized rocks exposed to the atmosphere, which
induces chemical reactions leading to enhanced dissolu-
tion. The electrical conductivity followed the same trend as
the TDS.
The present study shows that Cl- and NO3- exhibited
low variability, while SiO2 and Ca exhibited high vari-
ability in the dry and wet seasons (Table 5). The cations
(Na?, K?, Mg2? and Ca2?) had concentrations generally
below \50 mg/l in waters from the pond and stream
waters. The enhanced level of Ba2? (*2 mg/l) in the mine
area relative to the stream waters was attributed to
3808 Environ Earth Sci (2014) 71:3793–3811
123
Page 17
weathering of barite (BaSO4). The relatively high contents
of Ba indicated that the waters from the area were con-
taminated from barite mining activities. This is also con-
sistent with elevated levels of Ba and SO4 in waters in
other areas affected by barite mining activities. The con-
tents of Ba were attributed to the oxidation and hydrolysis
of BaSO4 (Baldi et al. 1996).
Sodium and bicarbonate were the dominant cation and
anion, respectively. This reflected the excess of HCO3-
over alkaline earths (Ca2? ? Mg2?) concentrations.
According to Lee et al. (2005), the Na–HCO3 water type is
an indication of cation exchange processes. The probable
sources of carbonates were carbonate dissolution, dissoci-
ation of carbonic acid and silicate weathering (Nganje et al.
2010). According to Moncur et al. (2006), the dissolution
of carbonate and alumino-silicates released HCO3, which
neutralized the H? released by the oxidation of sulphide
minerals. Geochemical modelling using MINTEQA2�
indicated that the waters in the study area are undersatu-
rated with respect to calcite (Table 6), suggesting that
calcite dissolution is an important pH-buffering reaction in
the waters in this area. The mean values of SO4, in both
seasons, from the mine area were statistically significantly
different (p \ 0.05) from mean values in the stream water
samples. The source of SO4 was related to the oxidation of
the barite and pyrite, from the mine spoils (Akpeke 2008).
The study area is a rural agricultural set up, where more
than 90 % of the inhabitants are engaged in subsistence
agriculture. Land is intensively cultivated and domestic
animals are reared for food production. Some expanse of
land is, however, covered with thick vegetation and has
experienced minimal anthropogenic inputs. Manufacturing
industries are non-existence in the area. Some of the
inhabitants of the area are presently engaged in local
mining of barite.
In future, the uncontrolled disposal of the mine waste
materials will result in the contamination of water by
barium, suspended sediments and acidic mine drainage.
Streams draining the mine dump sites and ponds are used
for domestic, fishing and irrigation purposes. The common
diet of the wild and domestic animals and inhabitants is
locally grown crops. It is likely that animals and inhabit-
ants in the area might be accumulating barium through
ingesting tailings (Alloway 1990), through diet grown on
the contaminated soils (Cox 1995; Siegel 2002), and
drinking of contaminated water (Adiuku-Brown and Ogezi
1991; Adamu 2000) as well as feeding on fish from con-
taminated streams. The enhanced levels of Ba in the water
samples implied that it was accessible and may have had
some health implications on the animals and human beings
in the area through bioaccumulation and biomagnifications
of contaminants in animals and man (Alloway 1990; Siegel
2002). This is a health risk, especially for babies and
children in the study area (Adamu 2011). Besides, the pH
of the water is also low and may contribute in the further
dispersion of pollutants. Unfortunately, it was not possible
to sample crops, human and animal tissues in the area for
toxicological investigation.
High TSS and colour of the surface streams could lead
to poor penetration of light caused by absorbent or
reflecting pollutants (Hem 1985). This together with low
DO stream water diminished algal productivity and
decreased aquatic food.
Summary and conclusion
Water quality in the vicinity of barite mine sites shows that
the waters were characterized by low pH, low minerali-
zation, high suspended solids and high colour. Sodium
(Na?) and calcium (Ca2?) were the dominant cations and
bicarbonate (HCO3-) and sulphate (SO4
2-) the dominant
anions. The low concentration of dissolved silica, relatively
high concentrations of Na, HCO3 and SO4 suggest a
combined influence of silicate, carbonate and weathering of
mine spoils.
The TDS, TSS, EC and major ions (except Na? and K?)
are higher for water draining barite mines from Cretaceous
sediments, while Na?, K?, Ba2? are higher in basement
rock areas. Computed values of hardness and some irri-
gational parameters show that the pond and stream waters
are generally soft and can be used for irrigation. Correla-
tion and factor analyses indicate the association of physi-
cochemical parameters to be related to geogenic
environmental and anthropogenic controls. Generally, the
water quality satisfied the WHO (2008) and NIS (2007)
standards for domestic, agriculture and industrial.
Acknowledgments This study is part of the PhD dissertation of the
first author. The authors are grateful to the Benue State Government
for financial support. We appreciate the support and assistance we
received from the traditional rulers and youth leaders of Nde, Alese,
Okumurutet, Iyametet, Akpet 1 and Ibogo communities during the
field work. The support and encouragement from Prof. C. S. Okereke
of the Department of Geology University of Calabar is also
acknowledged.
References
Adamu CI (2000) Environmental geochemical studies of Arufu Pb–
Zn–Ag mining districts, Northeastern Nigeria. M.Sc. Thesis.
University of Calabar, Nigeria
Adamu CI (2011) Geoenvironmental studies of barite mines in parts
of Oban Massif and Mamfe embayment, Southeastern Nigeria.
PhD Dissertation. University of Calabar, Nigeria
Adamu CI, Nyiatagher T (2005) Physico-chemical and bacteriolog-
ical quality of surfacewater of River Benue, Nigeria. Glob J Geol
Sci 3(1):45–48
Environ Earth Sci (2014) 71:3793–3811 3809
123
Page 18
Adamu CI, Nganje TN, Edet A (2009) Hydrochemistry of waters near
some barite mining areas, Cross River State, Nigeria. DAAD
Alumni expert seminar on ‘‘Mining and Water’’ October 5th–
9th, Namibia
Adiuku-Brown ME, Ogezi AE (1991) Heavy metal pollution from
mining practices: a case study of Zurak. J Mining Geol
27(2):205–211
Akpeke GB (2008) Investigation of the origin, nature and occurrence
of barite mineralization in CRS, Southeastern Nigeria. PhD
Dissertation University of Calabar, Nigeria
Alam M, Sumbul R, Aslam M (2012) Hydrochemical investigation
and quality assessment of groundwater in rural areas of Delhi,
India. Environ Earth Sci 66:97–110
Alloway BJ (1990) Heavy metals in Soil. J Agric Scis 241:1511–1514
ALPHA (1995) Study methods for the examination of water and
waste, 2nd edn. DC Willey, Washington
Bahar MM, Reza MS (2010) Hydrochemical characteristics and
quality assessment of shallow groundwater in a coastal area of
southwest Bangladesh. Environ Earth Sci 61:1065–1073
Baldi F, Pepi M, Burini D, Kniewald G, Scali D, Lanciotti E (1996)
Dissolution of barium from barite in sewage sludges and cultures
of Desulforibrin desulfuricans. Appl Environ mineral
67(7):2398–2404
Bell RG, Rusell C (2002) Environmental policy for developing
countries. Issues in science and technology. Springer University
Press, New York
Chukwuma C (1995) Evaluating baseline data for Cu, Mn, Ni and Zn
in rice, yams, cassava and guinea grass from cultivated soils in
Nigeria. Agric Ecosyst Environ 53:47–61
Cox PA (1995) The elements on earth: Inorganic geochemistry in the
environment. Oxford University Press, New York
Cross River Basin Development Authority, CRBDA (1992) Inventory
of Natural Site Conditions-Soil, Slope, Hydrology, Landuse and
Vegetation throughtout the areas of operation of the Authority.
Surveys and Mapping Geodata Ltd (Nigeria) with Institute of
Applied Geosciences (Germany), pp 145
Dogan PA (1999) Characterization of mine waste for prediction of
acid mine drainage. In: Azcue JM (ed) Environmental impact of
mining activities. Springer, Heidelberg, pp 19–38
Doneen LD (1964) Notes on water quality in agriculture. Published in
Water Science and Engineering University of California, Davis
Eaton FM (1950) Significance of carbonates in irrigation waters. Soil
Sci 39:123–133
Edet AE (1993) Hydrogeology of parts of Cross River State, Nigeria:
Evidence from Aero-Geological and Surface Resistivity Studies.
PhD Dissertation, University of Calabar, Calabar, Nigeria
Edet AE, Markel BI, Offiong OE (2003) Trace element hydrochem-
ical assessment of the Calabar coastal plain aquifer, Southeastern
Nigeria: using statistical methods. Environ Geol 44:137–149
Edet AE, Worden RH, Mohammed EA, Preston MR (2012)
Hydrogeochemical processes in a populated shallow Coastal
Plain Sand Aquifer southeastern Nigeria. Environ Earth Sci
65:1933–1953
Egeh EU, Ekwueme BN, Akpeke B (2004) The appraisal of a
proposed barite quarry in Akpet area, Cross River State, from
resistivity investigation. Global J Geol Sci 2(2):171–175
Ekwueme BN (1995a) Geochemistry of the crystalline basement
rocks in SW Ugep, Nigeria. Dee-Ford J Pure Appl Sci 1:15–28
Ekwueme BN (1995b) Geological excursion guide book. Bachude
Print Press, Calabar
Ellis KU (1993) Surface water pollution and its control. Macmillan
Press, London
European Union, EU (1975) Council Directive 75/440/EEC of 16
June 1975 concerning the quality required of surface water
intended for the abstraction of drinking water in the Member
States as amended by Council Directive 79/869/EEC (further
amended by Council Directive 81/855/EEC and Council Regu-
lation 807/2003/EC) and both amended by Council Directive
91/692/EEC (further amended by Regulation 1882/2003/EC)
Franciskovic-Bilinski S (2006) Barium anomaly in Kupa River
Drainage Basin. J Geochem Explor 88:106–109
Gibbs RJ (1970) Mechanisms controlling water chemistry. Science
170:1088–1090
Hem JD (1985) Study and interpretation of the chemical character-
istics of natural waters. US Geol. Survey Water Supply Paper
1473, 3rd edn. Harvard University Press, Massachusetts
Iloeje NP (1997) A new geography of Nigeria. Longman Ltd, Benin
Jeong CH (2001) Effect of landuse and urbanization on hydrochem-
istry and contamination of groundwater from Taejon area,
Korea. J Hydrol 253:194–210
Jung MC (2001) Heavy metal contamination of soils and waters in
and around the Inacheon Au-Ag mine, Korea. Appl Geochem
16:1369–1375
Kelly WP (1940) Permissible composition and concentration of
irrigated waters. Proc AFCS 66:607
Lee JS, Chon HT, Jung MC (2005) Toxic risk assessment and
environmental contamination of heavy metals around abandoned
metal mine sites in Korea, Key Eng. Materials 277:542–547
Matalas CN, Reiher JB (1967) Some comments on the use of factor
analysis. Water Resour 3:213–223
Moncur MC, Ptacek CJ, Blowers DW, Jambor JL (2006) Release,
transport and attenuation of metals from an old tailings
impoundment. Appl Geochem 20:639–659
Nagarajan R, Rajmohan N, Mahendran U, Senthamilkumar S (2010)
Evaluation of groundwater quality and its suitability for drinking
and agricultural use in Thanjavur city, Tamil Nadu, India.
Environ Monit Assess 171(1–4):289–308. doi:10.1007/s1066-
009-1279-9
Nagaraju A, Suresh S, Killam K, Hudson-Edwards K (2006)
Hydrogeochemistry of waters of Mangompeta barite mining
area, Cuddapah Basin, Andhra Pradesh, India. Turkish J Environ
Sci 30:203–219
NEST (1995) The challenge of sustainable development in Nigeria.
In: Aina TA, Salan AT (eds) Nigerian Environmental study
Action Team Report. Nigeria pp 16–44
Nganje TN, Adamu CI, Ugbaja AN, Ebieme E, Sikakwe GU (2010)
Environemntal contamination of trace elements in the vicinity of
Okpara coal mine, Enugu Southeastern Nigeria. Arabian J
Geosci. doi:10.1007/-S12517-010-0673-7
Nganje TN, Adamu CI, Ugbaja AN, Ebieme E, Sikakwe GU (2011)
Environmental contamination of trace elements in the vicinity of
Okpara coal mine, Enugu Southeastern Nigeria. Arabian J
Geosci 4(1 & 2):195–200
Nigerian Industrial Standard, NIS (2007) Nigerian Standards for
drinking water quality. SON Wuse, Abuja
Nwabufo-Ene KE (1993) Non – oil mineral exploration in Nigeria.
J Sci Technol 1(1):15–30
Oden MI (2001) Mineral potentials of Cross River State; Strategies
for optimal utilization. Paper presented at the 1st NNDC
stakeholders forum and workshop, Calabar, 2001
Okereke CS, Esu EO, Edet AE (1998) Determination of potential
groundwater sites using geological and geophysical techniques
in the Cross River State, Southeasthern Nigeria. J Afr Earth Sci
27(1):149–163
Olade MA (1976) On the genesis of Pb–Zn deposits in Nigeria’s Benue
rift (aulacogen): a reinterpretation. J Mining Geol 13:20–27
Paliwal KV (1967) Effect of Gypsum application on the quality of
irrigated waters. Madras Agric J 59:646–647
Parkhurst DL, Appelo CAJ (1999) Users guide to PHREEQC (version
2)—a computer program for speciation, batch – reactions one-
dimensional transport, and inverse geochemical calculations. US
Geol. Survey Water Resour. Invest. Rept
3810 Environ Earth Sci (2014) 71:3793–3811
123
Page 19
Petters SW (1989) A regional hydrogeological study of rural water
supply options for planning and implementations of phase II
rural water programme of Cross River State. DFRRI, Cross
River State, Unpublished report
Petters SW, Okereke CS, Nwajide CS (1987) Geology of the Mamfe
Rift Southeastern Nigeria. In: Matheis G, Schadelimeirer HS
(eds) Current research in African Earth Sciences. Balkema,
Rotterdam, pp 299–302
Piper AM (1944) A graphical procedure in geochemical interpretation
of water analysis. Trans Am Geophys Union 25:914–923
Prasanna MV, Chidambaram S, Gireesh TV, Jabir Ali TV (2011) A
study on hydrochemical characteristics of surface and subsurface
water in and around Perumal Lake, Cuddalore district, Tamil
Nadu, South India. Environ Earth Sci 63:31–47
Ragunath HM (1987) Groundwater. Wiley Eastern Ltd, New Delhi
Rahman AAMS, Ukpong EE, Azumatullah M (1981) Geology of
parts of the Oban Massif, Southeastern Nigeria. J Mining Geol
18(1):60–65
Richards LA (1954) Diagnosis and improvement of saline alkali soils.
US Department of Agriculture, Handbook 60, pp 160
Rose AW, Cravotta CA (1998) Geochemistry of coal mine drainage.
In: Brady KBC, Smith MW, Schueck J (eds) Coal mine drainage
prediction and pollution prevention in Pennsylvania. Dept. of
Enviro. Protection, Harrisburg, pp 53–82
Sawyer CN, McCarthy PL (1967) Chemistry for sanitary engineers,
2nd edn. McGraw Hill, New York
Siegel FR (2002) Environmental geochemistry of potential toxic
metals. Springer, Heidelberg
Sinclair AJ (1974) Selection of thresholds in geochemical data using
probability graphs. J Geochem Explor 3:129–149
Subba Rao N (2006) Seasonal variation of groundwater quality in a part
of Guhur district, Andhra Pradesh India. Environ Geol 49:413–429
Todd DK (1980) Groundwater hydrology, 2nd edn. Wiley, New York
Udom GJ, Esu EO, Ekwere SJ (1998) Status of groundwater in
Calabar Municipality, Southeastern Nigeria. Global J Pure Appl
Sci 4(2):163–169
WHO (2008) Guideline for drinking-water quality (3rd edn incorpo-
rating 1st and 2nd Agenda) vol 1, Recommandations Genva
Wilcox LV (1955) Classification and use of irrigation water. USDA
circular, Washington
World Health Organization, WHO (1993) Guideline for drinking
water quality, Geneva
World Health Organization, WHO (1996) Guideline for drinking
water quality, vol 1. Geneva, pp 53–73
World Health Organization, WHO (2004) Guideline for drinking
water quality, Geneva
Younger P, Banwart S, Hedin R (2002) Mine water hydrology,
pollution and remediation. Kluwer, Dordrecht
Environ Earth Sci (2014) 71:3793–3811 3811
123