9

Korea-Australia Rheology Journal September 2008 Vol. 20, No. 3 165
Korea-Australia Rheology JournalVol. 20, No. 3, September 2008 pp. 165-173
Hydrogel microrheology near the liquid-solid transition
Travis Larsen, Kelly Schultz and Eric M. Furst*
Department of Chemical Engineering and Center for Molecular and Engineering Thermodynamics,University of Delaware, Newark, DE 19716
(Received May 21, 2008)
Abstract
Multiple particle tracking microrheology is used to characterize the viscoelastic properties of biomaterialand synthetic polymer gels near the liquid-solid transition. Probe particles are dispersed in the gel pre-cursors, and their dynamics are measured as a function of the extent of reaction during gel formation. Weinterpret the dynamics using the generalized Stokes-Einstein relationship (GSER), using a form of theGSER that emphasizes the relationship between the probe particle mean-squared displacement and thematerial creep compliance. We show that long-standing concepts in gel bulk rheology are applicable tomicrorheological data, including time-cure superposition to identify the gel point and critical scaling expo-nents, and the power-law behavior of incipient network's viscoelastic response. These experiments providevaluable insight into the rheology, structure, and kinetics of gelling materials, and are especially powerfulfor studying the weak incipient networks of dilute gelators, as well as scarce materials, due to the small sam-ple size requirements and rapid data acquisition.
Keywords : hydrogel, peptide, microrheology, particle tracking, superposition, critical gel
1. Introduction
New synthetic biomaterials that assemble or self-assem-
ble to form hydrogel networks are of great interest for
numerous therapeutic applications. Such hydrogelators
have shown exciting potential for use in wound healing,
drug delivery, and tissue engineering (Ellis-Behnke et al.,
2006; Davis et al., 2005; Grinstaff, 2007; Peppas et al.,
2000; Hoffman, 2002; Langer and Peppas, 2003; Lee and
Mooney, 2001; Rajagopal and Schneider, 2004; Lutolf and
Hubbell, 2005; Stevens and George, 2005). For biomate-
rials, characterizing the evolution of the micro-scale vis-
coelastic properties, structure, degree of heterogeneity, and
kinetics of network formation through the liquid-solid (sol-
gel) transition is particularly important. For instance, cell
encapsulation in a three-dimensional hydrogel network is
important for tissue engineering and wound healing appli-
cations because it improves cell proliferation and tissue
organization when compared to growth on a two-dimen-
sional surface. However, biological properties such as cell
attachment and mobility, nutrient transport, and suspension
homogeneity are dependent on the material structure and
elasticity (Mikos et al., 2006; Davis and Vacanti, 1996),
porosity (Chin and Vacanti, 2008; Wu et al., 2008), and
gelation kinetics (Haines-Butterick et al., 2007), respec-
tively. Thus, microrheology, in which the thermal motion
of dispersed microspheres is used to probe the material
rheology, has been increasingly applied to study these
hydrogelators (Tseng et al., 2002; Gardel et al., 2003; Xu
et al., 2005; Veerman et al., 2006; Zimenkov et al., 2006;
Savin and Doyle, 2007).
There are several advantages for using microrheology to
study hydrogelators. The initial stages of gelation are often
rapid, and the mechanical properties of the incipient net-
works are weak. Microrheology provides sensitivity to the
viscoelastic properties at lower moduli (≤5 Pa), while also
providing the ability to measure several decades of times-
cales (1 ms−10 s) with short measurement acquisition
times (~30 sec). Microrheology typically requires small
sample volumes (<50 µL), which makes it possible to
investigate the rheological properties of scarce materials.
Microrheology also minimizes the risk of disturbing the
fragile microstructure as it develops, since external forces
are not applied. Despite the importance of microrheology
for characterizing these emerging biomaterials, methods
for determining key physical characteristics of the liquid-
solid transition have only recently been reported by Larsen
and Furst (2008).
Before discussing microrheology near the liquid-solid
transition in greater detail, we first review the physical
characteristics of gelation. The liquid-solid transition is
similar to a continuous thermodynamic phase transition.
Gelation exhibits critical behavior, including a critical*Corresponding author: [email protected]© 2008 by The Korean Society of Rheology
Travis Larsen, Kelly Schultz and Eric M. Furst
166 Korea-Australia Rheology Journal
point (the gel point), the divergence of certain physical
properties, and scaling behavior near the gel point. The
critical gel point is defined as the extent of reaction p at
which the first percolating cluster spans the sample-space,
pc. Rheological properties, such as the zero shear viscosity
η0, equilibrium compliance and longest relaxation time
τL, diverge at the critical gel point (Stauffer et al., 1982;
Joanny, 1982). Defining the extent of reaction, or distance
from the gel point, as , the scaling relationships
are η0~ε−k, ~ε−z and τL~ε−y, where k, z and y are critical
scaling exponents (Stauffer et al., 1982; Martin et al.,
1988; 1989; Adolf and Martin, 1990). These scaling expo-
nents are not independent, but are related by y=k+z
(Adolf and Martin, 1990).
The critical scaling behavior near the gel point results in
an unusual feature of gels, first identified by Winter and
Chambon (1986; 1987): at the gel point, the viscoelastic
moduli of the incipient network exhibit power-law scaling
with frequency G' ~G'' ~ωn. The critical relaxation expo-
nent n is related to the critical exponents of the compliance
and longest relaxation time by the scaling relationship
n= z /y.
In bulk rheology, monitoring the loss tangent tanδ=G''/
G' of a material as a function of the extent of gelation pro-
vides a more robust method for identifying the gel point
than measurements of diverging properties, such as the vis-
cosity, relaxation time or compliance (Winter and Cham-
bon, 1986; 1987; Winter and Mours, 1997; Scanlan and
Winter, 1991). The gel point and relaxation exponent pro-
vide valuable information about the gelation kinetics and
characteristics of the network connectivity (Scanlan and
Winter, 1991).
Unfortunately, accurate measurements of tanδ can be dif-
ficult using microrheology. To understand why, consider
that microrheology relates the ensemble averaged mean-
squared displacement (MSD) of embedded probes to the
viscoelastic properites of the material by the generalized
Stokes-Einstein relation (GSER),
(1)
where D is the probe particle diameter, is the Laplace
transform of the relaxation modulus and is the
Laplace transform of the mean-squared displacement.
While the viscoelastic moduli can be determined from Eq.
(1), doing so involves approximations or numerical trans-
formations of the discrete data that introduce noise, result-
ing in a sometimes ambiguous interpretation of tanδ
(Mason, 2000). Eq. (1) also requires a sufficient range of
timescales or frequencies, which is sometimes not possible
to obtain, for instance, when the material is gelling quickly
or the dynamics are subject to static and dynamic errors at
short lag times (Bobroff, 1986; Savin and Doyle, 2005).
We recently showed that it is possible to identify the gel
point, critical relaxation exponent, and dynamic scaling
exponents of hydrogels directly from the mean-squared
displacement data obtained in microrheology (Larsen and
Furst, 2008). Our approach relies on the direct relationship
between the creep compliance J(τ) and the MSD. Spe-
cifically, using the relationship between the Laplace trans-
forms of the creep compliance and the relaxation modulus
J(s)=1/s (Ferry, 1980), the GSER can be rewritten as
(Palmer et al., 1998)
. (2)
More intuitively, the probe particle motion in microrhe-
ology is a measure of the strain deformation ( /a2)
that results from the average thermal stress imparted on the
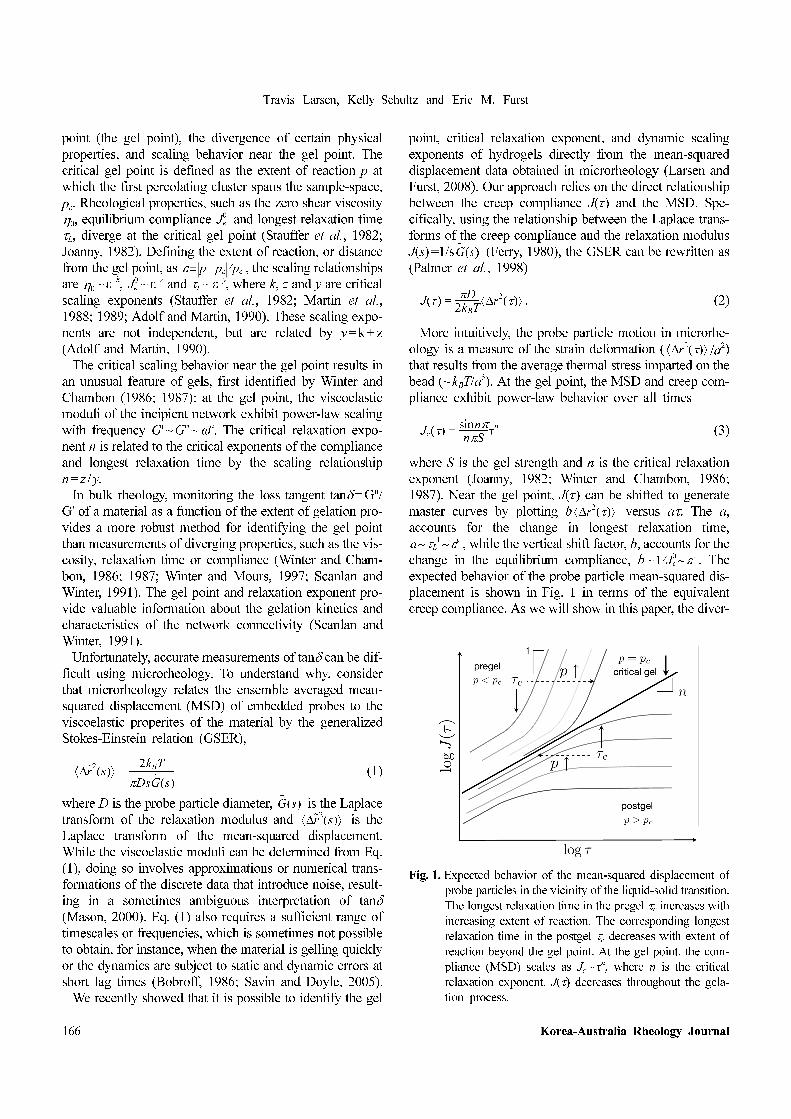
bead (~kBT/a3). At the gel point, the MSD and creep com-
pliance exhibit power-law behavior over all times
(3)
where S is the gel strength and n is the critical relaxation
exponent (Joanny, 1982; Winter and Chambon, 1986;
1987). Near the gel point, J(τ) can be shifted to generate
master curves by plotting b versus aτ. The a,
accounts for the change in longest relaxation time,
, while the vertical shift factor, b, accounts for the
change in the equilibrium compliance, b~ . The
expected behavior of the probe particle mean-squared dis-
placement is shown in Fig. 1 in terms of the equivalent
creep compliance. As we will show in this paper, the diver-
Je0
ε p pc– pc⁄≡
Je0
r2
∆ s( )⟨ ⟩2kBT
πDsG s( )---------------------=
G s( )
r2
∆ s( )⟨ ⟩
G s( )
J τ( )πD
2kBT----------- r
2∆ τ( )⟨ ⟩=
r2
∆ τ( )⟨ ⟩
Jc τ( )nπsin
nπS-------------τ
n=
r2
∆ τ( )⟨ ⟩
a τL1–
εy
∼ ∼
1 Je0
⁄ εz
∼
Fig. 1. Expected behavior of the mean-squared displacement of
probe particles in the vicinity of the liquid-solid transition.
The longest relaxation time in the pregel τc increases with
increasing extent of reaction. The corresponding longest
relaxation time in the postgel τe decreases with extent of
reaction beyond the gel point. At the gel point, the com-
pliance (MSD) scales as Jc~τn, where n is the critical
relaxation exponent. J(τ) decreases throughout the gela-
tion process.

Hydrogel microrheology near the liquid-solid transition
Korea-Australia Rheology Journal September 2008 Vol. 20, No. 3 167
gence of the reciprocal values of the shift factors, a−1 and
b−1, near the sol-gel transition can be used to determine the
gel point, pc. The critical exponents, y, z and n are then
obtained from the scaling of the shift factors as a function
of the distance from the gel point, ε.
Our aim here is to compare microrheology data from
several materials as they pass through the sol-gel transition.
The first material we discuss is a peptide hydrogel that
undergoes a dynamic, time-dependent sol-gel transition;
thus, the extent of reaction is a function of time. We com-
pare this to equilibrated, covalently cross-linked networks
with a well-defined extent of cross-linking. The first cova-
lent system is polyacrylamide. The second covalently
cross-linked material is composed of maleimide-function-
alized high molecular weight heparin and a bis-thiol PEG
cross-linker. Before discussing our results, we detail the
experimental methods used in this work. We conclude the
paper with key observations of successes and limitations in
applying microrheology to characterize the gel transition.
2. Experimental section
Materials. The 20-residue peptide MTHR (VKVKVKV
KVDPPTKVTVKVKV-NH2) consists of an alternating
sequence of valine and lysine residues flanking a central
tetrapeptide sequence with a high β-turn propensity.
MTHR is identical to the previously described parent pep-
tide MAX1, with a single amino acid substitution at the
15th residue position, which replaces a lysine with a thre-
onine (K15T) (Pochan et al., 2003). Gelation of this pep-
tide is designed to be responsive to changes in the
environmental conditions. Increasing the pH or ionic
strength reduces or screens the repulsive forces between
positively-charged lysine residues, triggering the peptide to
assemble into a highly cross-linked β-hairpin-rich fila-
mentous network (Schneider et al., 2002; Pochan et al.,
2003; Ozbas et al., 2004). The synthesis and purification of
the peptide follows standard solid-phase fmoc protocols, as
described in detail elsewhere (Pochan et al., 2003).
Chemically cross-linked polyacrylamide is a polymeric
gel that forms via the free-radical polymerization of acry-
lamide monomers. Cross-linking between polymer mole-
cules is induced by the addition of bis-acrylamide, a
covalently-linked acrylamide dimer that randomly incor-
porates into growing filaments during polymerization. The
extent of reaction is directly proportional to the amount of
bis-acrylamide. Therefore, equilibrated samples can be pre-
pared at various points during the gelation process by vary-
ing the concentration of bis-acrylamide. The polymeri-
zation reaction is monitored using UV-vis spectroscopy to
ensure adequate time (~6 hrs) is allowed for the samples to
reach equilibrium conversion before measurements are
taken. The acrylamide and bis-acrylamide are obtained
from commercial suppliers (Sigma-Aldrich) and used as
received without further purification.
The reaction of maleimide-functionalized high molecular
weight heparin (HMWH) and bis-functional poly(ethylene
glycol) (PEG) results in covalently cross-linked heparin-
PEG hydrogels (HMWH-PEG). Heparin, a polysaccharide
which is a glycosaminoglycan, is used as a backbone and
functionalized with maleimide groups. The maleimide
groups chemically bond with the terminal thiol groups of
the poly(ethylene glycol). Data can be taken throughout the
gelation process, capturing the hydrogel at various extents
of reaction in time and composition. High molecular
weight heparin is functionalized by dissolution of heparin
sodium salt (Grade I-A from porcine intestinal mucosa,
Sigma-Aldrich) in 2-(Nmorpholino) ethanesulfonic acid
(MES, Sigma-Aldrich) buffer containing N-(3-dimethy-
laminopropyl)-N'-ethylcarbodimide hydrochloride (EDC-
HCl, Sigma-Aldrich, 3 equivalents to COOH groups to
HMWH), 1-hydroxybenzotriazole hydrate (HOBT, Sigma-
Aldrich) or N-hydroxy succinimide (NHS, Sigma-Aldrich,
3 equivalents to COOH groups in HMWH) and N-(2-ami-
noethyl) maleimide (AEM, Sigma-Aldrich) (Nie et al.,
2007). The functionality of the HMWH is controlled by the
pH of the reaction solution and is purified by dialysis and
characterized using NMR (Nie et al., 2007). A HMWH
with 4.2 maleimide group functionality is used for kinetic
studies. Poly(ethylene glycol) (Average Mn 10,000 g/mol,
Sigma-Aldrich, 2 mmol OH groups) is dithiolized in a
reaction mixture with mercaptopropionic acid (Sigma, Ald-
rich, 40 mmol), p-toluenesulfonic acid (Sigma-Aldrich, 0.4
mmol) and dithiothreitol (DTT, Sigma-Aldrich, 1 mmol)
dissolved in toluene. The solution is refluxed with stirring
over a period of 24 hours and percipitated in cold acid (Nie
et al., 2007). Hydrogels are made by dissolving the appro-
priate amount of HMWH and PEG separately in phosphate
buffered saline (pH 7.4, Invitrogen Corp.).
Sample preparation−Microrheology samples are pre-
pared in a similar manner for each reaction system. MTHR
peptide gel samples are made by dispersing lyophilized
peptide in water (conductivity 18.2 MΩ ·cm) and then ini-
tiating gelation by adding buffer to increase the pH. The
final sample contains 0.15 wt% peptide in pH 8.5 buffer
(50 mM BTP).
Polyacrylamide samples are prepared at 3.0 wt% total
acrylamide, 0.0 -0.1 wt% bis-acrylamide cross-linker, 0.5
wt% ammonium persulfate initiator, and 0.1% TEMED
catalyst. All materials are obtained commercially (Sigma-
Aldrich), and stock solutions are made daily and degassed
to remove dissolved oxygen, which is known to retard the
polymerization reaction. HMWH-PEG gels are initiated by
mixing of the two solutions of maleimide-functionalized
HMWH and dithiol PEG. Fluorescent polystyrene tracer
particles (D=1.05±0.01 µm, Polysciences, Warrington,
PA) are washed three times, sonicated, and added to a final
concentration of 0.15 v% before gelation is initiated.
Travis Larsen, Kelly Schultz and Eric M. Furst
168 Korea-Australia Rheology Journal
Multiple particle tracking microrheology−Sample prep-
aration procedures have been detailed previously (Larsen
and Furst, 2008). Immediately after gelation is initiated,
sample solutions are introduced into rectangular capillary
cells (0.20×2.00×50 mm, Vitrotubes, Vitrocom), which
serve as sample chambers. Excess air is removed, and the
cells are sealed to a microscope slide with fast-curing UV
epoxy (Norland Products, NOA 81). For the time-depen-
dent gelators, measurements begin immediately and are
taken until the particle motion ceases. Data for the poly-
acrylamide samples is collected after 6 hours to ensure the
reaction has equilibrated.
Samples are imaged using an inverted epifluorescence
microscope (N.A. 1.2, 63× water-immersion objective,
1.0× tube lens, Axiovert 200, Zeiss). A high-speed CMOS
camera (Phantom v5.1, Vision Research) is used to capture
the motion of ~150 particles at 30Hz for a total of 800
frames. A weighted centroid method developed by Crocker
and Grier (1996) is used to determine particle trajectories,
from which the ensemble-averaged mean-squared dis-
placement, , is calculated. Sources of static error
are accounted for by using a high-magnification immersion
objective to increase the number of pixels per particle and
remove background fluorescence, while dynamic error is
reduced by using a short exposure time (σ=1000 µs)
(Savin and Doyle, 2005).
3. Results and discussion
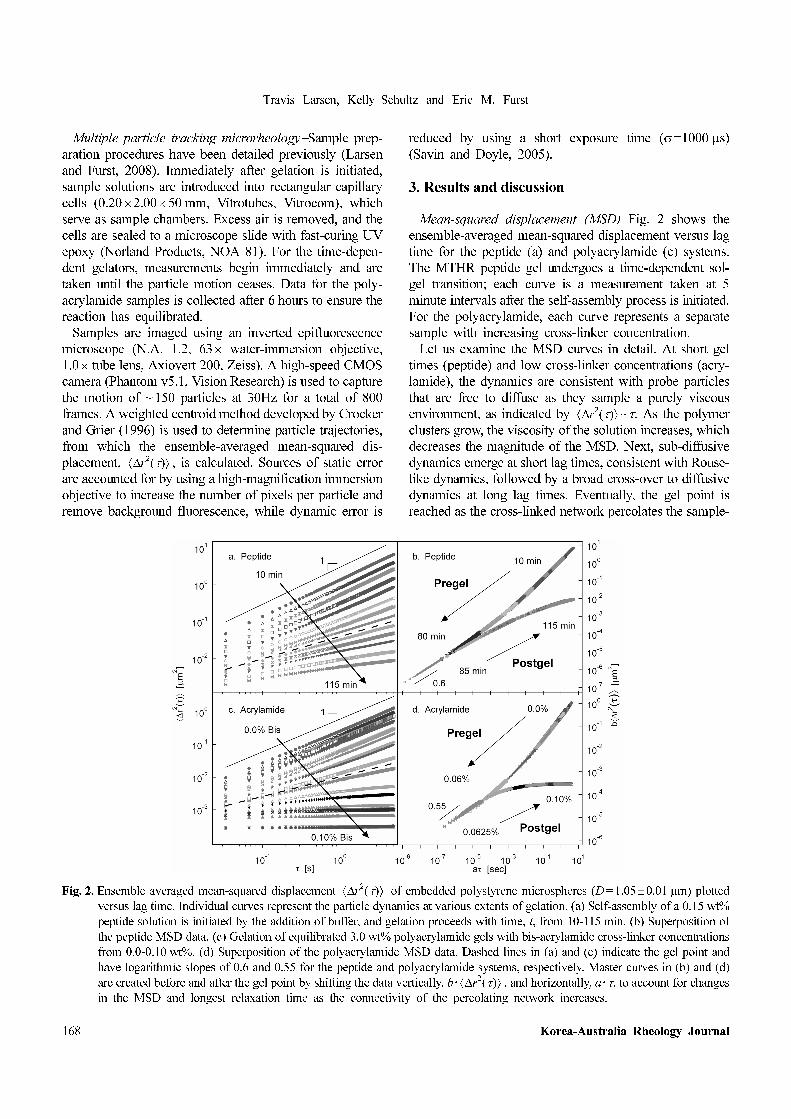
Mean-squared displacement (MSD)−Fig. 2 shows the
ensemble-averaged mean-squared displacement versus lag
time for the peptide (a) and polyacrylamide (c) systems.
The MTHR peptide gel undergoes a time-dependent sol-
gel transition; each curve is a measurement taken at 5
minute intervals after the self-assembly process is initiated.
For the polyacrylamide, each curve represents a separate
sample with increasing cross-linker concentration.
Let us examine the MSD curves in detail. At short gel
times (peptide) and low cross-linker concentrations (acry-
lamide), the dynamics are consistent with probe particles
that are free to diffuse as they sample a purely viscous
environment, as indicated by ~τ. As the polymer
clusters grow, the viscosity of the solution increases, which
decreases the magnitude of the MSD. Next, sub-diffusive
dynamics emerge at short lag times, consistent with Rouse-
like dynamics, followed by a broad cross-over to diffusive
dynamics at long lag times. Eventually, the gel point is
reached as the cross-linked network percolates the sample-
r2
∆ τ( )⟨ ⟩
r2
∆ τ( )⟨ ⟩
Fig. 2. Ensemble averaged mean-squared displacement of embedded polystyrene microspheres (D=1.05±0.01 µm) plotted
versus lag time. Individual curves represent the particle dynamics at various extents of gelation. (a) Self-assembly of a 0.15 wt%
peptide solution is initiated by the addition of buffer, and gelation proceeds with time, t, from 10-115 min. (b) Superposition of
the peptide MSD data. (c) Gelation of equilibrated 3.0 wt% polyacrylamide gels with bis-acrylamide cross-linker concentrations
from 0.0-0.10 wt%. (d) Superposition of the polyacrylamide MSD data. Dashed lines in (a) and (c) indicate the gel point and
have logarithmic slopes of 0.6 and 0.55 for the peptide and polyacrylamide systems, respectively. Master curves in (b) and (d)
are created before and after the gel point by shifting the data vertically, b · , and horizontally, a ·τ, to account for changes
in the MSD and longest relaxation time as the connectivity of the percolating network increases.
r2
∆ τ( )⟨ ⟩
r2
∆ τ( )⟨ ⟩
Hydrogel microrheology near the liquid-solid transition
Korea-Australia Rheology Journal September 2008 Vol. 20, No. 3 169
space and forms an incipient gel.
Beyond the gel point, continued gelation results in
increasing connectivity, which forms a viscoelastic solid,
as indicated by the onset of an elastic plateau at long lag
times. While the Rouse-like sub-diffusive dynamics persist
at short lag times with the same power-law scaling, the
longest relaxation time continuously decreases, and the
plateau extends to shorter lag times. At the longest times
and highest cross-linker concentration, the thermal motion
of the embedded particles is completely arrested by the gel
network.
Gel point and critical behavior−As noted earlier, the gel
point and critical scaling exponents can be found using the
principles of time-cure superposition (Adolf and Martin,
1990). Individual MSD curves are multiplied by a time
shift factor a and an MSD shift factor b to construct pre-
and postgel master curves shown in Fig. 2(b) and (d).
Shifting for the pregel curve begins at the lowest extent of
gelation, where the particle dynamics are diffusive, and
continues until curves can no longer be successfully super-
imposed. After this point, a second postgel curve begins at
the highest extent of gelation, where particle motion is
arrested by the elastic gel network, and continues until the
final MSD curve near the gel point is added. The resulting
master curves converge and exhibit a common logarithmic
slope α=dln /dlnτ, which, in the case of the sys-
tems shown here, is between 0.55≤α≤0.6.
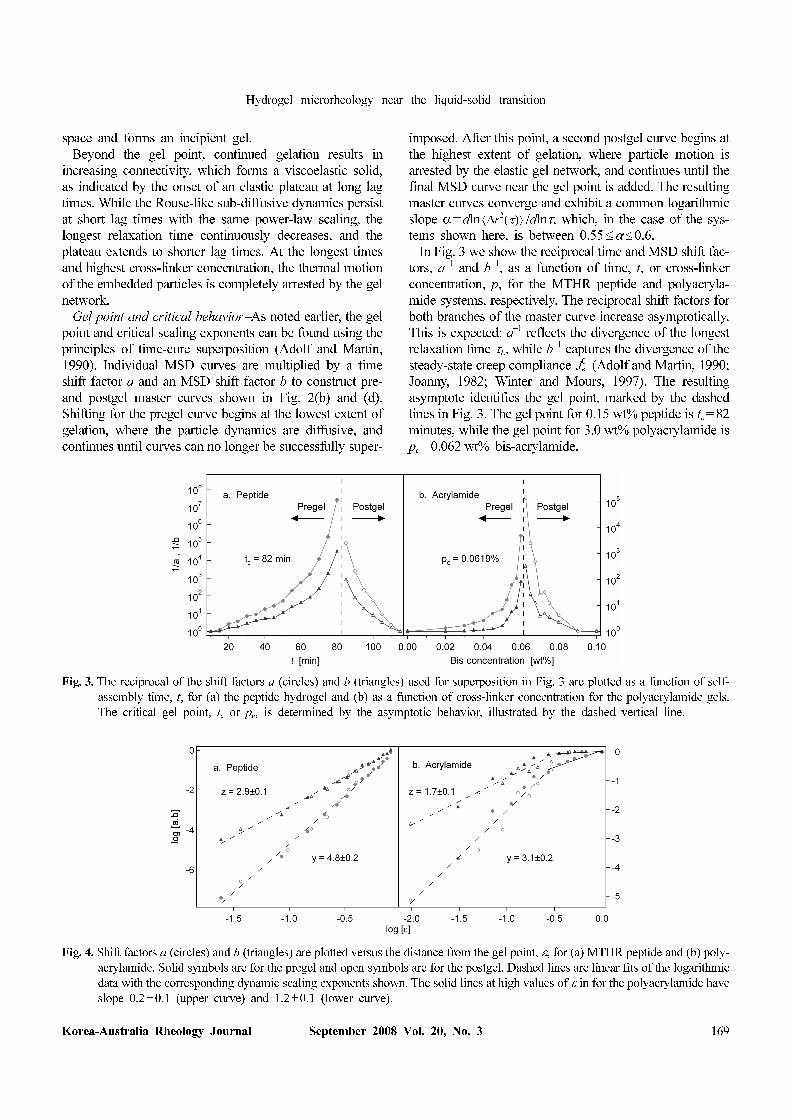
In Fig. 3 we show the reciprocal time and MSD shift fac-
tors, a−1 and b−1, as a function of time, t, or cross-linker
concentration, p, for the MTHR peptide and polyacryla-
mide systems, respectively. The reciprocal shift factors for
both branches of the master curve increase asymptotically.
This is expected: a−1 reflects the divergence of the longest
relaxation time τL, while b−1 captures the divergence of the
steady-state creep compliance (Adolf and Martin, 1990;
Joanny, 1982; Winter and Mours, 1997). The resulting
asymptote identifies the gel point, marked by the dashed
lines in Fig. 3. The gel point for 0.15 wt% peptide is tc=82
minutes, while the gel point for 3.0 wt% polyacrylamide is
pc=0.062 wt% bis-acrylamide.
r2
∆ τ( )⟨ ⟩
Je0
Fig. 3. The reciprocal of the shift factors a (circles) and b (triangles) used for superposition in Fig. 3 are plotted as a function of self-
assembly time, t, for (a) the peptide hydrogel and (b) as a function of cross-linker concentration for the polyacrylamide gels.
The critical gel point, tc or p
c, is determined by the asymptotic behavior, illustrated by the dashed vertical line.
Fig. 4. Shift factors a (circles) and b (triangles) are plotted versus the distance from the gel point, ε, for (a) MTHR peptide and (b) poly-
acrylamide. Solid symbols are for the pregel and open symbols are for the postgel. Dashed lines are linear fits of the logarithmic
data with the corresponding dynamic scaling exponents shown. The solid lines at high values of ε in for the polyacrylamide have
slope 0.2±0.1 (upper curve) and 1.2±0.1 (lower curve).

Travis Larsen, Kelly Schultz and Eric M. Furst
170 Korea-Australia Rheology Journal
With the gel point identified, we next define the distance
from the gel point, . Recall that the longest
relaxation time and creep compliance are expected to
exhibit power-law behavior, τL=ε−y and (Adolf and
Martin, 1990). We can now calculate the scaling exponents
y and z.
Fig. 4 shows a and b versus ε. We indeed observe the
expected power law behavior. For the peptide system, the
power law is well-defined for the observed range 0.03
≤ε≤1. Since a and b are inversely proportional to τL and
, the slopes of the lines shown in Fig. 4 give the critical
exponents y and z for both the pre- and postgels. In both
systems, there is excellent agreement between the scaling
exponents found for the pregel and postgel. The scaling
exponents determined for the MTHR peptide are y=
4.8±0.2 and z =2.9±0.1 while those for the polyacryla-
mide gel are y= 3.1±0.1 and z=1.7±0.1. These values are
consistent with those predicted for the percolation univer-
sality class, in which y=4 and z=8/3, assuming the hydro-
dynamic screening of Rouse dynamics (Martin et al.,
1988). In contrast, the exponents predicted from Zimm the-
ory (unscreened hydrodynamic interactions) are y=8/3 and
z=8/3 (Martin et al., 1988), and de Gennes' electrical net-
work analogy leads to y=2.69 and z=1.94 (Derrida et al.,
1983).
We now examine the polyacrylamide data in more detail,
noting that the shift factors for this system exhibit sig-
nificantly more noise than the peptide, as well as a devi-
ation from the expected power-law behavior at higher
values of ε. A significant contributor of noisy data is the
inherent uncertainty in the extent of reaction that comes
with making many samples. We find that degassing the
samples prior to use is a critical step in the sample prep-
aration, indicating the sensitivity of the free-radical poly-
merization reaction to environmental and preparation
conditions.
The deviation from the power law exponent in the poly-
acrylamide data shown in Fig. 4(b) between 0.3≤ε≤1 is
more interesting, and highlights a subtle issue in the time-
cure superposition analysis. In this range of ε, the time shift
factor appears to scale with a lower power law exponent,
as indicated by the solid line in the figure with slope
1.2±0.1. This represents a limitation in the time-cure
superposition analysis of microrheological data: accurate
superposition of both time and compliance are only pos-
sible when the longest relaxation time is in the vicinity of
the window of lag times over which the probe particle
dynamics are sampled in the experiment. Consider the ini-
tial stages of polymerization. As large molecules form, the
viscosity will increase (the expected dependence is η0~ε−k).
Correspondingly, the mean-squared displacement will
decrease. This is because the compliance is related to both
the viscosity and longest relaxation time by .
However, if τL<<τmin, where τmin is the shortest lag time of
the particle tracking, the shift of the MSD curve will be
ambiguous. One could shift the next MSD curve either in
time (along the abscissa) or in MSD (along the ordinate).
In the latter case, the shift factor will be b' ~εk instead of
the expected b' ~εy−k, where z =y−k. Because the MSD is
diffusive for τ>>τL (thus, ~τ), the same shift
value is obtained if the MSD is shifted along the abscissa.
This is the case shown in Fig. 4(b). Indeed, the power law
exponent in this range of ε is close to y− z=1.4, and the
corresponding MSD shift is negligible in the same region.
Without information with regard to the longest relaxation
timescale, the data should be shifted along the ordinate,
which reflects the increasing viscosity of the polymerizing
solution. However, this can only be done in the case of
purely diffusive probe dynamics when τ>>τL.
Finally, the critical relaxation exponent, n, can be cal-
culated from the dynamic scaling exponents, using the
relationship n=z/y (Adolf and Martin, 1990). The critical
scaling exponents for the MTHR peptide and polyacry-
lamide hydrogels are n=0.60±0.02 and n=0.55±0.03,
respectively, which is in agreement with Rouse dynamics
of fractal clusters, for which n=2/3. Furthermore, the cal-
culated critical exponents are consistent with the slope of
the MSD curves close to the gel transition point. We com-
pare the critical relaxation exponent to the MSD for poly-
acrylamide in Fig. 5. Closest to the gel point, the curves
obey nearly power-law behavior. Identical power-law
dynamics can be observed in MSD curves further from the
gel point at short lag times, reflecting the shorter relaxation
time of the polymer clusters (in the pregel) or polymer net-
work (in the postgel). In the pre-gel, the initial power-law
ε p pc– pc⁄≡
Je0
εz–
=
Je0
Je0
τL η0⁄∼
r2
∆ τ( )⟨ ⟩
Fig. 5. MSD curves from Fig. 2c for 3.0 wt% polyacrylamide
gels near the critical gel point. The gel point corresponds
to frequency-independent power-law scaling of the creep
compliance, where the dashed lines indicate a slope
α=0.55. Before the gel point, subdiffusive behavior is
seen at short times, while relaxation towards diffusion
occurs at long lag times. After the gel point, an elastic pla-
teau emerges, characteristic of a viscoelastic solid.
Hydrogel microrheology near the liquid-solid transition
Korea-Australia Rheology Journal September 2008 Vol. 20, No. 3 171
crosses over to diffusive dynamics, while in the post-gel,
the same power-law crosses over to arrested dynamics.
4. Application to other systems
HMWH-PEG hydrogels−Another hydrogel system we
have studied consists of malemide functionalized high
molecular weight heparin (HMWH) as a backbone poly-
mer that is cross-linked with dithiolized poly(ethylene gly-
col) (PEG). In contrast to the previous peptide and
acrylamide gels, this system is similar to a vulcanization
type gelation process, but in the dilute regime. For lower
maleimide functionalities (~4), we measure the material
rheology as a function of gel time.
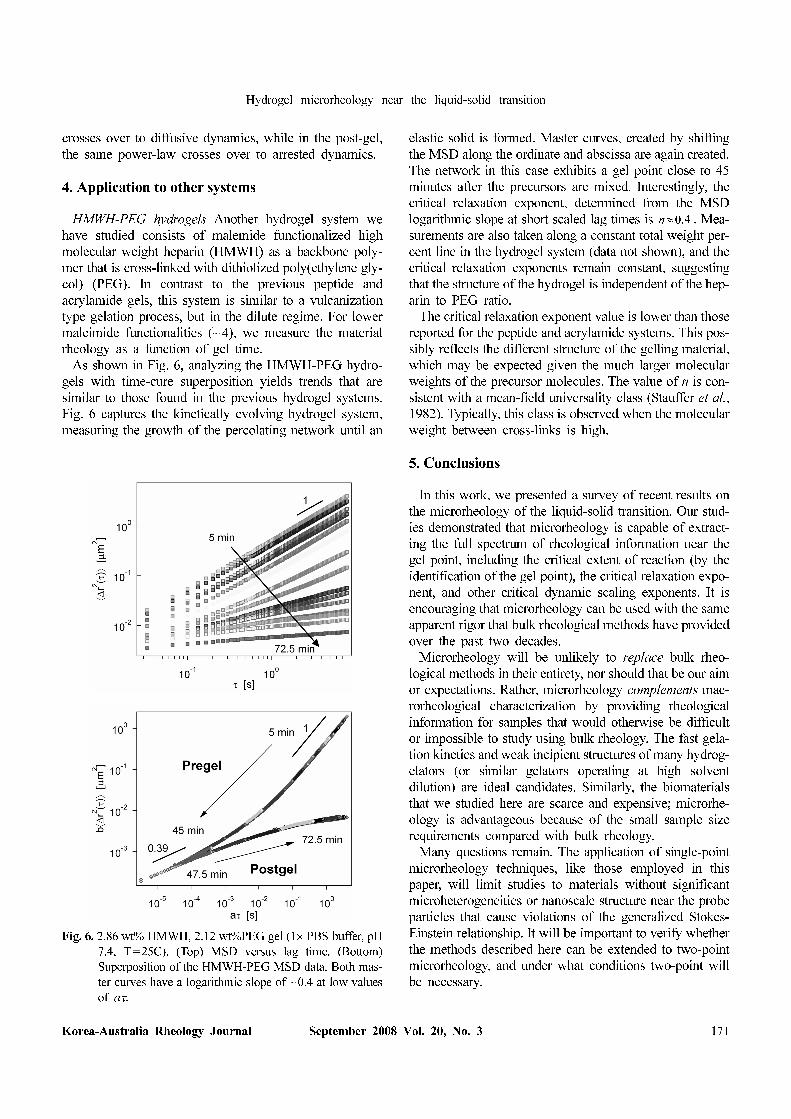
As shown in Fig. 6, analyzing the HMWH-PEG hydro-
gels with time-cure superposition yields trends that are
similar to those found in the previous hydrogel systems.
Fig. 6 captures the kinetically evolving hydrogel system,
measuring the growth of the percolating network until an
elastic solid is formed. Master curves, created by shifting
the MSD along the ordinate and abscissa are again created.
The network in this case exhibits a gel point close to 45
minutes after the precursors are mixed. Interestingly, the
critical relaxation exponent, determined from the MSD
logarithmic slope at short scaled lag times is . Mea-
surements are also taken along a constant total weight per-
cent line in the hydrogel system (data not shown), and the
critical relaxation exponents remain constant, suggesting
that the structure of the hydrogel is independent of the hep-
arin to PEG ratio.
The critical relaxation exponent value is lower than those
reported for the peptide and acrylamide systems. This pos-
sibly reflects the different structure of the gelling material,
which may be expected given the much larger molecular
weights of the precursor molecules. The value of n is con-
sistent with a mean-field universality class (Stauffer et al.,
1982). Typically, this class is observed when the molecular
weight between cross-links is high.
5. Conclusions
In this work, we presented a survey of recent results on
the microrheology of the liquid-solid transition. Our stud-
ies demonstrated that microrheology is capable of extract-
ing the full spectrum of rheological information near the
gel point, including the critical extent of reaction (by the
identification of the gel point), the critical relaxation expo-
nent, and other critical dynamic scaling exponents. It is
encouraging that microrheology can be used with the same
apparent rigor that bulk rheological methods have provided
over the past two decades.
Microrheology will be unlikely to replace bulk rheo-
logical methods in their entirety, nor should that be our aim
or expectations. Rather, microrheology complements mac-
rorheological characterization by providing rheological
information for samples that would otherwise be difficult
or impossible to study using bulk rheology. The fast gela-
tion kinetics and weak incipient structures of many hydrog-
elators (or similar gelators operating at high solvent
dilution) are ideal candidates. Similarly, the biomaterials
that we studied here are scarce and expensive; microrhe-
ology is advantageous because of the small sample size
requirements compared with bulk rheology.
Many questions remain. The application of single-point
microrheology techniques, like those employed in this
paper, will limit studies to materials without significant
microheterogeneities or nanoscale structure near the probe
particles that cause violations of the generalized Stokes-
Einstein relationship. It will be important to verify whether
the methods described here can be extended to two-point
microrheology, and under what conditions two-point will
be necessary.
n 0.4≈
Fig. 6. 2.86 wt% HMWH, 2.12 wt%PEG gel (1× PBS buffer, pH
7.4, T=25C). (Top) MSD versus lag time. (Bottom)
Superposition of the HMWH-PEG MSD data. Both mas-
ter curves have a logarithmic slope of ~0.4 at low values
of aτ.
Travis Larsen, Kelly Schultz and Eric M. Furst
172 Korea-Australia Rheology Journal
Acknowledgments
We thank J. Schneider and K. Rajagopal for providing
peptide samples, K. Kiick and A. Baldwin for providing
HMWH-PEG samples and P. Spicer for stimulating dis-
cussions. Funding for this work was provided by the
National Institutes of Health (1 R01 EB003172-01 and 2
P20 016472-04) and the Procter and Gamble Company.
References
Adolf, D. and J. E. Martin, 1990, Time cure superposition during
cross-linking, Macromolecules 23, 3700-3704.
Bobroff, N., 1986, Position measurement with a resolution and
noise-limited instrument, Rev. Sci. Instrum. 57, 1152-1157.
Chin, K. and J. P. Vacanti, 2008, Hydrogel-perfluorocarbon com-
posite scaffold promotes oxygen transport to immobilized
cells, Biotech. Prog. 24, 358-366.
Crocker, J. C. and D. G. Grier, 1996, Methods of digital video
microscopy for colloidal studies, J. Coll. Int. Sci. 179, 298-310.
Davis, M. E., J. P. M. Motion, D. A. Narmoneva, T. Takahashi,
D. Hakuno, R. D. Kamm, S. G. Zhang and R. T. Lee, 2005,
Injectable self-assembling peptide nanofibers create intramy-
ocardial microenvironments for endothelial cells, Circulation
111, 442-450.
Davis, M. W. and J. P. Vacanti, 1996, Toward development of an
implantable tissue engineered liver, Biomaterials 17, 365-372.
Derrida, B., D. Stauffer, H. J. Herrmann and J. Vannimenus,
1983, Transfer-matrix calculation of conductivity in 3-dimen-
sional random resistor networks at percolation-threshold, J.
Phys. Lett. (France) 44, L701-L706.
Ellis-Behnke, R. G., Y. X. Liang, S. W. You, D. K. C. Tay, S. G.
Zhang, K. F. So and G. E. Schneider, 2006, Nano neuro knit-
ting: peptide nanofiber scaffold for brain repair and axon
regeneration with functional return of vision, Proc. Natl. Acad.
Sci. USA 103, 5054-5059.
Ferry, J., 1980, Viscoelastic properties of polymers, Wiley, New
York.
Gardel, M. L., M. T. Valentine, J. C. Crocker, A. R. Bausch and
D. A. Weitz, 2003, Microrheology of entangled F-actin solu-
tions, Phys. Rev. Lett. 91, 158302.
Grinstaff, M. W., 2007, Designing hydrogel adhesives for corneal
wound repair, Biomaterials 28, 5205-5214.
Haines-Butterick, L., K. Rajagopal, M. Branco, D. Salick, R.
Rughani, M. Pilarz, M. S. Lamm, D. J. Pochan and J. P.
Schneider, 2007, Controlling hydrogelation kinetics by peptide
design for three-dimensional encapsulation and injectable
delivery of cells, Proc. Natl. Acad. Sci. 104, 7791-7796.
Hoffman, A. S., 2002, Hydrogels for biomedical applications,
Adv. Drug Delivery Rev. 43, 3-12.
Joanny, J. F., 1982, Flow birefringence at the sol-gel transition, J.
Phys. (France) 43, 467-473.
Langer, R. and N. A. Peppas, 2003, Advances in biomaterials,
drug delivery, and bionanotechnology, AIChE J. 49, 2990-
3006.
Larsen, T. H. and E. M. Furst, 2008, Microrheology of the liquid-
solid transition during gelation, Phys. Rev. Lett. 100, 146001.
Lee, K. and D. J. Mooney, 2001, Hydrogels for tissue engi-
neering, Chem. Rev. 101, 1869-1879.
Lutolf, M. P. and J. A. Hubbell, 2005, Synthetic biomaterials as
instructive extracellular microenvironments for morphogenesis
in tissue engineering, Nat. Biotechnol. 23, 47-55.
Martin, J. E., D. Adolf and J. P. Wilcoxon, 1988, Viscoelasticity
of near-critical gels, Phys. Rev. Lett. 61, 2620-2623.
Martin, J. E., D. Adolf and J. P. Wilcoxon, 1989, Viscoelasticity
near the sol-gel transition, Phys. Rev. A 39, 1325-1332.
Mason, T. G., 2000, Estimating the viscoelastic moduli of com-
plex fluids using the generalized Stokes-Einstein equation,
Rheol. Acta 39, 371-378.
Mikos, A. G., S. W. Herring, P. Ochareon, J. Elisseeff, H. H. Lu,
R. Kandel, F. J. Schoen, M. Toner, D. Mooney, A. Atala, M. E.
Van Dyke, D. Kaplan and G. Vunjak-Novakovic, 2006, Engi-
neering complex tissues, Tissue Engineering 12, 3307-3339.
Nie, T., A. Baldwin, N. Yamaguchi and K. L. Kiick, 2007, Pro-
duction of heparin-functionalized hydrogels for the develop-
ment of responsive and controlled growth factor delivery
systems, J. Controlled Release 122, 287-296.
Ozbas, B., J. Kretsinger, K. Rajagopal, J. P. Schneider and D. J.
Pochan, 2004, Salt-triggered peptide folding and consequent
self-assembly into hydrogels with tunable modulus, Macro-
molecules 37, 7331-7337.
Palmer, A., J. Y. Xu and D. Wirtz, 1998, High-frequency vis-
coelasticity of crosslinked actin filament networks measured
by diffusing wave spectroscopy, Rheol. Acta 37, 97-106.
Peppas, N. A., P. Bures, W. Leobandung and H. Ichikawa, 2000,
Hydrogels in pharmaceutical formulations, Eur. J. Pharmacol.
Biopharm. 50, 27-46.
Pochan, D., J. P. Schneider, J. Kretsinger, B. Ozbas, K. Rajagopal
and L. Haines, 2003, Thermally reversible hydrogels via
intramolecular folding and consequent self-assembly of a de
Novo designed peptide, J. Am. Chem. Soc. 125, 11802-11803.
Rajagopal, K. and J. P. Schneider, 2004, Self-assembling peptides
and proteins for nanotechnological applications, Curr. Opin.
Struct. Biol. 14, 480-486.
Savin, T. and P. S. Doyle, 2005, Static and dynamic errors in par-
ticle tracking microrheology, Biophys. J. 88, 623-638.
Savin, T. and P. S. Doyle, 2007, Electrostatically tuned rate of
peptide self-assembly resolved by multiple particle tracking,
Soft Matter 3, 1194-1202.
Scanlan, J. C. and H. H. Winter, 1991, Composition dependence
of the viscoelasticity of end-linked poly(dimethylsiloxane) at
the gel point, Macromolecules 24, 47-54.
Schneider, J. P., D. J. Pochan, B. Ozbas, K. Rajagopal, L. Pakstis
and J. Kretsinger, 2002, Responsive hydrogels from the
intramolecular folding and self-assembly of a designed pep-
tide, J. Am. Chem. Soc. 124, 15030-15037.
Stauffer, D., A. Coniglio and M. Adam, 1982, Gelation and crit-
ical phenomena, Adv. Polym. Sci. 44, 103-158.
Stevens, M. M. and J. H. George, 2005, Exploring and engi-
neering the cell surface interface, Science 310, 1135-1138.
Tseng, Y., K. M. An and D. Wirtz, 2002, Microheterogeneity
controls the rate of gelation of actin filament networks, J. Biol.
Chem. 277, 18143-18150.

Hydrogel microrheology near the liquid-solid transition
Korea-Australia Rheology Journal September 2008 Vol. 20, No. 3 173
Veerman, C., K. Rajagopal, C. S. Palla, D. J. Pochan, J. P.
Schneider and E. M. Furst, 2006, Gelation kinetics of beta-hair-
pin peptide hydrogel networks, Macromolecules 39, 6608-6614.
Winter, H. H. and F. Chambon, 1986, Analysis of linear vis-
coelasticity of a cross-linking polymer at the gel point, J.
Rheol. 30, 367-382.
Winter, H. H. and F. Chambon, 1987, Linear viscoelasticity at the
gel point of a cross-linking PDMS with imbalanced stoichi-
ometry, J. Rheol. 31, 683-697.
Winter, H. H. and M. Mours, 1997, Rheology of polymers near
liquid-solid transitions, Adv. Polym. Sci. 134, 165-234.
Wu, D. Q., Y. X. Sun, X. D. Xu, S. X. Cheng, X. Z. Zhang and
R. X. Zhuo, 2008, Biodegradable and pH-sensitive hydrogels
for cell encapsulation and controlled drug release, Biomacro. 9,
1155-1162.
Xu, C. Y., V. Breedveld and J. Kopecek, 2005, Reversible hydro-
gels from self-assembling genetically engineered protein block
copolymers, Biomacro. 6, 1739-1749.
Zimenkov, Y., S. N. Dublin, R. Ni, R. S. Tu, V. Breedveld, R. P.
Apkarian and V. P. Conticello, 2006, Rational design of a
reversible pH-responsive switch for peptide self-assembly, J.
Am. Chem. Soc. 128, 6770-6771.


