AbstractTraditional methods to measure water in nominally anhydrous minerals (NAMs) are, for example, Fourier transformed infrared (FTIR) spectroscopy or secondary ion mass spectrometry (SIMS). Both well-established methods provide a low detection limit as well as high spatial resolution yet may require elaborate sample orientation or destructive sample prepa-ration. Here we analyze the water content in erupted volcanic clinopyroxene phenocrysts by proton–proton scattering and reproduce water contents measured by FTIR spectroscopy. We show that this technique provides significant advantages over other methods as it can provide a three-dimensional distribution of hydrogen within a crystal, making the identification of potential inclusions possible as well as elimination of surface contamination. The sample analysis is also independent of crystal structure and orientation and independent of matrix effects other than sample density. The results are used to validate the accuracy of wavenumber-dependent vs. mineral-specific molar absorption coefficients in FTIR spectroscopy. In addition, we present a new method for the sample preparation of very thin crystals suitable for proton–proton scattering analysis using relatively low accelerator potentials.
Nominally anhydrous minerals (NAMs) such as clinopy-roxene incorporate hydrogen in association with structural defects such as cation vacancies (e.g., 2H+ vs. Mg2+) and charge deficiencies (e.g., Al3+ + H+ vs. Si4+). There it is bonded to oxygen and, regarded as an oxide component, can be expressed as water concentration. The role of this water component in geology is important since it has a big influ-ence on mantle rheology, magma genesis and evolution as
well as the character of volcanic eruptions. By measuring the water content in NAMs from volcanic rocks or mantle xeno-liths, geologists can gain information on magmatic water contents as well as the storage capacity of water in the man-tle of planetary bodies (e.g., Bolfan-Casanova 2005; Peslier 2010; Sundvall and Stalder 2011; Weis et al. 2015, 2017). For the analysis of OH in NAMs, various methods can be applied such as Fourier transformed infrared (FTIR) spec-troscopy (e.g., Skogby 2006), secondary ion mass spectrom-etry (SIMS) (e.g., Wade et al. 2008), elastic recoil detec-tion analysis (ERDA) (e.g., Withers et al. 2012) or Raman spectroscopy (e.g., Thomas et al. 2008; Bolfan-Casanova et al. 2014). All of these methods have specific advantages such as good spatial resolution (e.g., SIMS and Raman) but also disadvantages including the need for crystal orientation for more precise measurements, strong matrix effects (e.g., FTIR, Raman and SIMS) or the limitation of only analyzing the surface layer with potential contamination (e.g., SIMS and ERDA). Especially FTIR spectroscopy has been applied as a common method for quantification of water in NAMs. However, results from this technique can vary since they depend on the orientation of the crystals, three-dimensional differences of the water contents within the samples and
most importantly the calibration of molar absorption coef-ficients. Another potential method to analyze the water component in NAMs is the use of the proton–proton scat-tering technique (e.g., Wegdén et al. 2005; Gose et al. 2008; Thomas et al. 2008). Advantages of this particular analyti-cal method are its possible high spatial resolution (≤ 1 µm), lack of need for crystal orientation and the ability to provide a three-dimensional distribution of the hydrogen and thus water content in a crystal (e.g., Reichart et al. 2002, 2004a, b; Borysiuk et al. 2013). This in particular can provide a way to identify hydrogen diffusion profiles or to measure fluid or melt inclusions deeper within crystals. In addition, the method does not rely on absorption coefficients or cali-brations accounting for matrix effects but requires only any standard material with known hydrogen content. The method then provides an actual “total” concentration of hydrogen atoms within the sample. One possible problem with this technique is sample thickness which is dependent on the maximum energy of the bombarding proton beam and it may be required that samples must be very thin (~ 10 µm). Such thin samples may be difficult to prepare and handle and in addition other features such as inclusions which may be important for other specific analyses can get lost. In this study, we measure the water content in clinopyroxene crys-tals from previously well-studied volcanic rocks and man-tle xenoliths by proton–proton scattering experiments. We apply two experimental systems with different proton beam energies. In addition, we performed FTIR measurements on selected crystals and compare the results from both ana-lytical methods. Further, this article provides a new method for the preparation of thin samples in such a way that the crystals overall remain at a size and thickness which allows easy handling and the possibility for further analysis with different methods.
Samples
The majority of clinopyroxene crystals in this study come from ankaramite lava samples from Tanganasoga volcano on El Hierro, Canary Islands (Carracedo et al. 2001; Long-pre et al. 2009; Weis et al. 2016a). Further, clinopyroxene crystals from a mantle xenolith from Kilbourne Hole, New Mexico (Kil and Wendlandt 2004; Harvey et al. 2012), were analyzed. The water contents of clinopyroxene crystals in these samples have previously been well studied through FTIR spectroscopy (e.g., Sundvall and Skogby 2011; Weis et al. 2016a). All clinopyroxenes in this study are diopsides (see Weis et al. 2016a).
Methods and sample preparation
FTIR spectroscopy
Loose clinopyroxene crystals (n = 5) of a size suitable for FTIR analysis (≥ 300 µm) were hand-picked from crushed rock material under a binocular microscope. Individual clino-pyroxene crystals were then mounted in thermoplastic resin for further processing. With the help of crystal morphology and optical microscopy (extinction angles), the selected crystals (n = 5) were oriented along their (100) and (010) crystal faces, on which the directions of the main refractive indices (α, β and γ) occur. A detailed procedure of the crystal alignment is described in Stalder and Ludwig (2007). Various particle size grades of Al2O3-grinding paper were used to thin and polish the oriented crystals to a thickness of a few hundred micrometers. The final crystal thickness for FTIR analysis varied between 200 and 500 µm for both the (100) and (010) orientations.
Polarized FTIR spectra of clinopyroxene were acquired in the range 2000–5000 cm−1 with a spectral resolution of 4 cm−1. Measurements were done along the directions of the main refractive indices (α, β and γ) to obtain the total absorb-ance: Atotal = Aα + Aβ + Aγ. Aα and Aγ were measured on the (010) crystal face and Aβ on (100). The orientated and polished crystals (n = 4) were measured in the sample compartment of a Bruker Vertex 70 spectrometer equipped with a NIR source (halogen lamp), a CaF2 beamsplitter, a wiregrid polarizer (KRS-5) and a MCT as well as an InSb detector. To further investigate inclusions within crystals measurements were done with a Bruker Hyperion FTIR microscope and an InSb detec-tor. To avoid cracks and inclusions in the crystals small circu-lar as well as squared apertures were applied (≤ 200 µm) for masking during analysis. For each individual spectrum, 128 scans were taken and averaged. The obtained spectra were then baseline corrected by a polynomial function and the individual OH-bands were fitted with the software PeakFit and subse-quently used for further calculations. Corresponding water contents were then calculated using both the wavenumber-dependent calibration function established by Libowitzky and Rossman (1997) and the mineral-specific (augite) calibration of Bell et al. (1995).
For the Lund sample set (n = 8), unpolarized FTIR meas-urements (see Kovacs et al. 2008) were done since an orienta-tion and polishing would have caused the loss of the drilled wells. Measuring conditions and data processing were the same as for the polarized measurements.
Physics and Chemistry of Minerals
1 3
Preparation of thin samples for proton–proton experiments
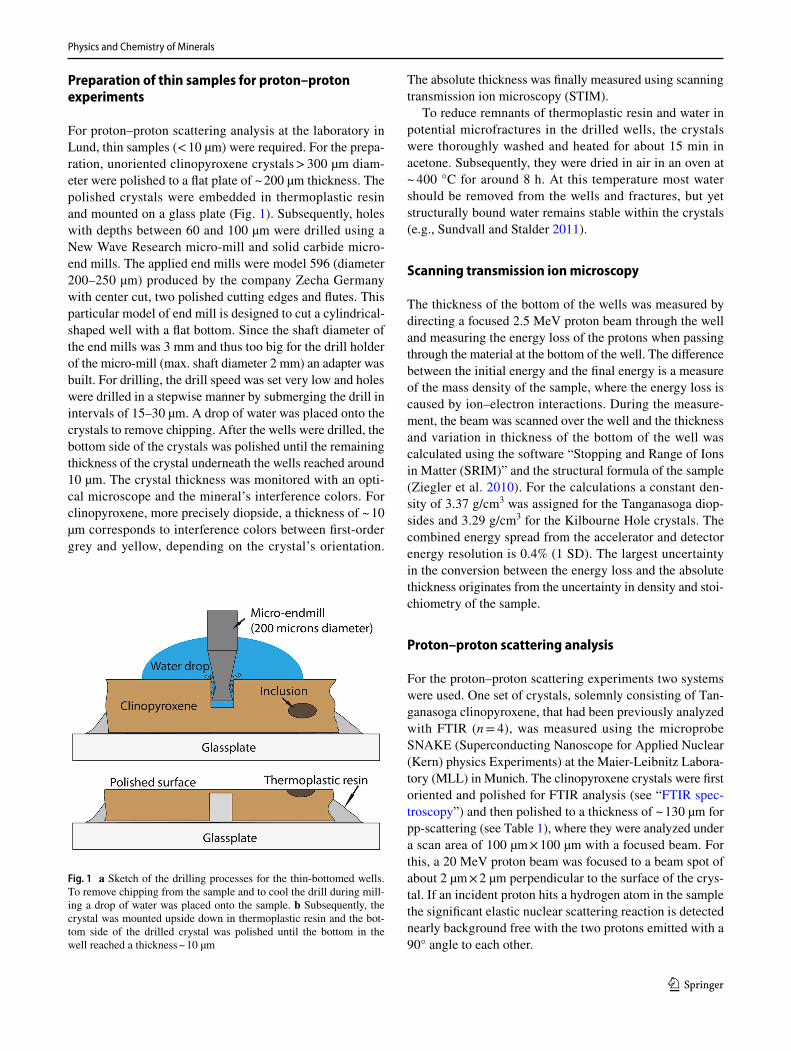
For proton–proton scattering analysis at the laboratory in Lund, thin samples (< 10 µm) were required. For the prepa-ration, unoriented clinopyroxene crystals > 300 µm diam-eter were polished to a flat plate of ~ 200 µm thickness. The polished crystals were embedded in thermoplastic resin and mounted on a glass plate (Fig. 1). Subsequently, holes with depths between 60 and 100 µm were drilled using a New Wave Research micro-mill and solid carbide micro-end mills. The applied end mills were model 596 (diameter 200–250 µm) produced by the company Zecha Germany with center cut, two polished cutting edges and flutes. This particular model of end mill is designed to cut a cylindrical-shaped well with a flat bottom. Since the shaft diameter of the end mills was 3 mm and thus too big for the drill holder of the micro-mill (max. shaft diameter 2 mm) an adapter was built. For drilling, the drill speed was set very low and holes were drilled in a stepwise manner by submerging the drill in intervals of 15–30 µm. A drop of water was placed onto the crystals to remove chipping. After the wells were drilled, the bottom side of the crystals was polished until the remaining thickness of the crystal underneath the wells reached around 10 µm. The crystal thickness was monitored with an opti-cal microscope and the mineral’s interference colors. For clinopyroxene, more precisely diopside, a thickness of ~ 10 µm corresponds to interference colors between first-order grey and yellow, depending on the crystal’s orientation.
The absolute thickness was finally measured using scanning transmission ion microscopy (STIM).
To reduce remnants of thermoplastic resin and water in potential microfractures in the drilled wells, the crystals were thoroughly washed and heated for about 15 min in acetone. Subsequently, they were dried in air in an oven at ~ 400 °C for around 8 h. At this temperature most water should be removed from the wells and fractures, but yet structurally bound water remains stable within the crystals (e.g., Sundvall and Stalder 2011).
Scanning transmission ion microscopy
The thickness of the bottom of the wells was measured by directing a focused 2.5 MeV proton beam through the well and measuring the energy loss of the protons when passing through the material at the bottom of the well. The difference between the initial energy and the final energy is a measure of the mass density of the sample, where the energy loss is caused by ion–electron interactions. During the measure-ment, the beam was scanned over the well and the thickness and variation in thickness of the bottom of the well was calculated using the software “Stopping and Range of Ions in Matter (SRIM)” and the structural formula of the sample (Ziegler et al. 2010). For the calculations a constant den-sity of 3.37 g/cm3 was assigned for the Tanganasoga diop-sides and 3.29 g/cm3 for the Kilbourne Hole crystals. The combined energy spread from the accelerator and detector energy resolution is 0.4% (1 SD). The largest uncertainty in the conversion between the energy loss and the absolute thickness originates from the uncertainty in density and stoi-chiometry of the sample.
Proton–proton scattering analysis
For the proton–proton scattering experiments two systems were used. One set of crystals, solemnly consisting of Tan-ganasoga clinopyroxene, that had been previously analyzed with FTIR (n = 4), was measured using the microprobe SNAKE (Superconducting Nanoscope for Applied Nuclear (Kern) physics Experiments) at the Maier-Leibnitz Labora-tory (MLL) in Munich. The clinopyroxene crystals were first oriented and polished for FTIR analysis (see “FTIR spec-troscopy”) and then polished to a thickness of ~ 130 µm for pp-scattering (see Table 1), where they were analyzed under a scan area of 100 µm × 100 µm with a focused beam. For this, a 20 MeV proton beam was focused to a beam spot of about 2 µm × 2 µm perpendicular to the surface of the crys-tal. If an incident proton hits a hydrogen atom in the sample the significant elastic nuclear scattering reaction is detected nearly background free with the two protons emitted with a 90° angle to each other.
Fig. 1 a Sketch of the drilling processes for the thin-bottomed wells. To remove chipping from the sample and to cool the drill during mill-ing a drop of water was placed onto the sample. b Subsequently, the crystal was mounted upside down in thermoplastic resin and the bot-tom side of the drilled crystal was polished until the bottom in the well reached a thickness ~ 10 µm
Physics and Chemistry of Minerals
1 3
Note that the nuclear scattering signal is generated from all hydrogen atoms, and not only by OH-bonds. The meas-ured quantity unit is hydrogen atoms per cm2. Assuming that all hydrogen is bound as OH, this is converted into wt. ppm H2O using a crystal density of 3.37 g/cm3, an atomic density of 9.93 × 10²² at/cm3 and an average thickness deter-mined by energy loss measurement of the protons. The sig-nal is not influenced by any chemical environment, structural defects or orientation of the crystal. Therefore, except for density, the calibration does not depend on sample proper-ties and only the efficiency of the detector system has to be calibrated once like described in Moser et al. (2015). In this analysis, we used two crystals of the hydrous min-eral zoisite (see Hurlbut 1969; O’Leary et al. 2007; Weis et al. 2016b) with 93 and 61 µm thickness, respectively, and calibrated the coincidence filter system assuming that hydrogen is present as nominal content of the stoichiometry Ca2.03Mg0.01Al2.98(SiO4)3.00(OH)0.98F0.02 corresponding to 2.01 wt% H2O (O’Leary et al. 2007). This water content is in agreement to the water content of 2.0 wt% measured by wet-chemical analysis (see Hurlbut 1969). The density of the zoisite crystal was taken to be 3.36 g/cm3 (Hurlbut 1969).
For the current setup we found a limit of a few at-ppm hydrogen corresponding to about 1 wt. ppm (H2O) in the analyzed samples, whereas a detection limit better than 0.1 at-ppm hydrogen has previously been achieved in Reich-art et al. (2004a). Transmission of the protons is required, but at the used energy, up to 150-µm-thick samples can be analyzed. The coincident protons are detected by a box of four 1-mm-thick silicon strip detectors as described in detail in Reichart et al. (2016). The system has a lateral resolution of about 2 µm and the uncertainty in the depth scale de-convoluted from the energy signal of the protons is about 1% of the sample thickness [Moser et al. (2015)], considering a homogeneous density of the sample. However, the energy resolution of the detectors including the energy spread of the protons along the path lengths (z) results in a depth resolu-tion (peak width of an infinite thin hydrogen layer) of about 6 µm at the front surface (z = 0) and a factor of two better at the back surface (z = max). Local inhomogeneity or inclu-sions in the sample with different density will be observed in the hydrogen map due to a shift or broadening of the energy signal from hydrogen on the surfaces. A vacuum level of 1 × 10⁷ mbar is sufficient for analyses and coating of the sample is not necessary as MeV protons penetrate the sam-ple and energy resolution is not affected by charging effects of the (grounded) sample. The orientation of the sample or channeling effects does not have to be considered at these energies and divergence (45 mrad) of the microprobe beam.
A second set of very thin crystals (n = 8), including crys-tals from Tanganasoga and Kilbourne Hole, was analyzed at the Lund Ion Beam Analysis Facility (LIBAF) at the Department of Nuclear Physics at Lund University. This
system is equipped with an annular Double Sided Silicon Strip Detector (DSSSD), consisting of 2048 segments and an accelerator reaching a maximum proton energy of 3 MeV, and is described in more detail in Borysiuk et al. 2013. The analysis in Lund was conducted with a 2.5 MeV proton beam focused down to a beam spot size of 5 µm × 5 µm which was directed into and scanned over the bottom of the well. By let-ting the protons pass through the well before interaction with the sample there was no risk of losing any scattered protons by interaction with the walls of the well. Lateral and depth resolution of the system are 5 and 0.8 µm respectively (Ros et al. 2014). The well of the crystal was first located using an optical microscope in the analysis chamber. Subsequently, a quick STIM evaluation of the well was done and a flat area was then selected for a longer measurement (30 min). The obtained data were normalized to a set of pieces, of differ-ent thickness, from a muscovite crystal (NRM#23069) with a water content of 4.13 wt% (Kristiansson et al. 2013). The utilized beam current during the analysis was between 20 and 100 pA. The current is dependent on sample mass den-sity and lower currents are needed for thicker or denser areas to avoid flooding the detector with protons. The vacuum level in the beamline and experimental chamber was below 2 × 10⁻⁵ mbar.
Results
FTIR
All clinopyroxenes showed spectra with vibrational bands expected for diopside (Fig. 2) (e.g., Skogby 2006) and were similar to spectra obtained for samples in Weis et al. (2016a). The spectra were free from OH-bearing impurities or inclusions unless specifically studied. Overall water con-tents of the four analyzed crystals ranged between 515 and 772 wt. ppm H2O for the Libowitzky and Rossman (1997) calibration and between 554 and 928 wt. ppm H2O for the mineral-specific calibration of Bell et al. (1995). All results are presented in Table 1. Potential uncertainties for calcu-lated clinopyroxene H2O contents can arise from imperfect baseline correction and measurements of the crystal thick-ness. However, due to the good quality of the spectra and the large thickness of the crystals a maximum uncertainty of ± 10% is assumed for the precision of the calculated clino-pyroxene water contents. Further, the uncertainty regarding the accuracy of the water contents due to the calibration for absorption coefficients is another ± 10% (cf. Libowitzky and Rossman 1997) resulting in an overall uncertainty of ± 20% for the calculated clinopyroxene water contents. For the Lund sample set values ranged from 283 to 716 wt. ppm H2O. The error for unpolarised measurements is yet big-ger, as the method relies on a statistical approach, with the
Physics and Chemistry of Minerals
1 3
precision for measurements of ten crystals per sample being ± 20% (see Kovacs et al. 2008). Since in this study only sin-gle crystals were analyzed with unpolarized measurements, precision is exceeding ± 20% by far, raising the total uncer-tainty to higher than ± 30%.
Preparation of thin samples
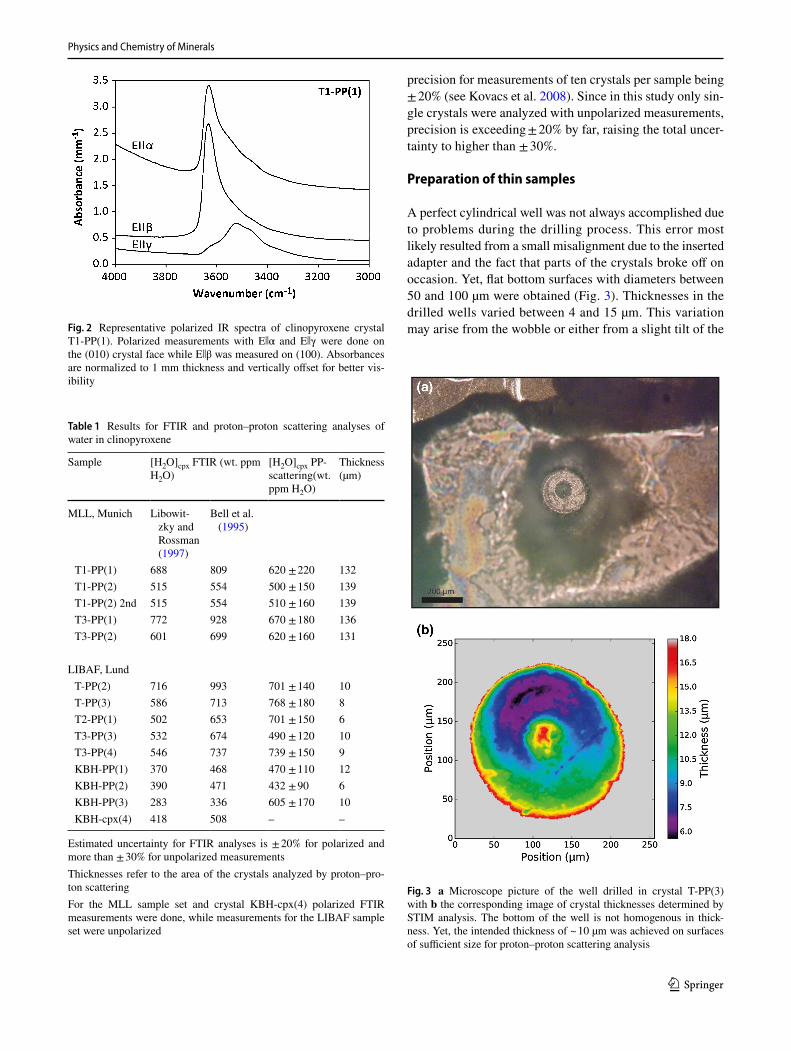
A perfect cylindrical well was not always accomplished due to problems during the drilling process. This error most likely resulted from a small misalignment due to the inserted adapter and the fact that parts of the crystals broke off on occasion. Yet, flat bottom surfaces with diameters between 50 and 100 µm were obtained (Fig. 3). Thicknesses in the drilled wells varied between 4 and 15 µm. This variation may arise from the wobble or either from a slight tilt of the Fig. 2 Representative polarized IR spectra of clinopyroxene crystal
T1-PP(1). Polarized measurements with Eǀǀα and Eǀǀγ were done on the (010) crystal face while Eǀǀβ was measured on (100). Absorbances are normalized to 1 mm thickness and vertically offset for better vis-ibility
Table 1 Results for FTIR and proton–proton scattering analyses of water in clinopyroxene
Estimated uncertainty for FTIR analyses is ± 20% for polarized and more than ± 30% for unpolarized measurementsThicknesses refer to the area of the crystals analyzed by proton–pro-ton scatteringFor the MLL sample set and crystal KBH-cpx(4) polarized FTIR measurements were done, while measurements for the LIBAF sample set were unpolarized
Fig. 3 a Microscope picture of the well drilled in crystal T-PP(3) with b the corresponding image of crystal thicknesses determined by STIM analysis. The bottom of the well is not homogenous in thick-ness. Yet, the intended thickness of ~ 10 µm was achieved on surfaces of sufficient size for proton–proton scattering analysis
Physics and Chemistry of Minerals
1 3
crystal during polishing of the bottom surface. In some cases pieces of the bottom of the wells broke off; however, thin areas large enough for analysis still remained.
Proton–proton scattering analysis
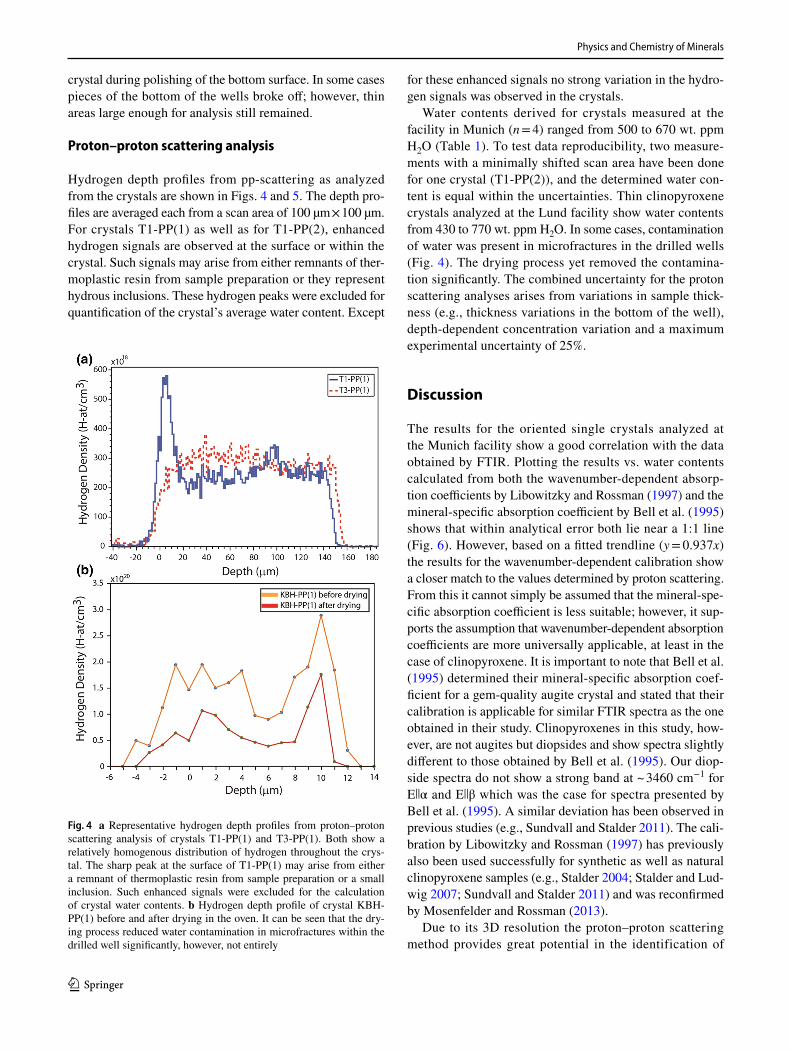
Hydrogen depth profiles from pp-scattering as analyzed from the crystals are shown in Figs. 4 and 5. The depth pro-files are averaged each from a scan area of 100 µm × 100 µm. For crystals T1-PP(1) as well as for T1-PP(2), enhanced hydrogen signals are observed at the surface or within the crystal. Such signals may arise from either remnants of ther-moplastic resin from sample preparation or they represent hydrous inclusions. These hydrogen peaks were excluded for quantification of the crystal’s average water content. Except
for these enhanced signals no strong variation in the hydro-gen signals was observed in the crystals.
Water contents derived for crystals measured at the facility in Munich (n = 4) ranged from 500 to 670 wt. ppm H2O (Table 1). To test data reproducibility, two measure-ments with a minimally shifted scan area have been done for one crystal (T1-PP(2)), and the determined water con-tent is equal within the uncertainties. Thin clinopyroxene crystals analyzed at the Lund facility show water contents from 430 to 770 wt. ppm H2O. In some cases, contamination of water was present in microfractures in the drilled wells (Fig. 4). The drying process yet removed the contamina-tion significantly. The combined uncertainty for the proton scattering analyses arises from variations in sample thick-ness (e.g., thickness variations in the bottom of the well), depth-dependent concentration variation and a maximum experimental uncertainty of 25%.
Discussion
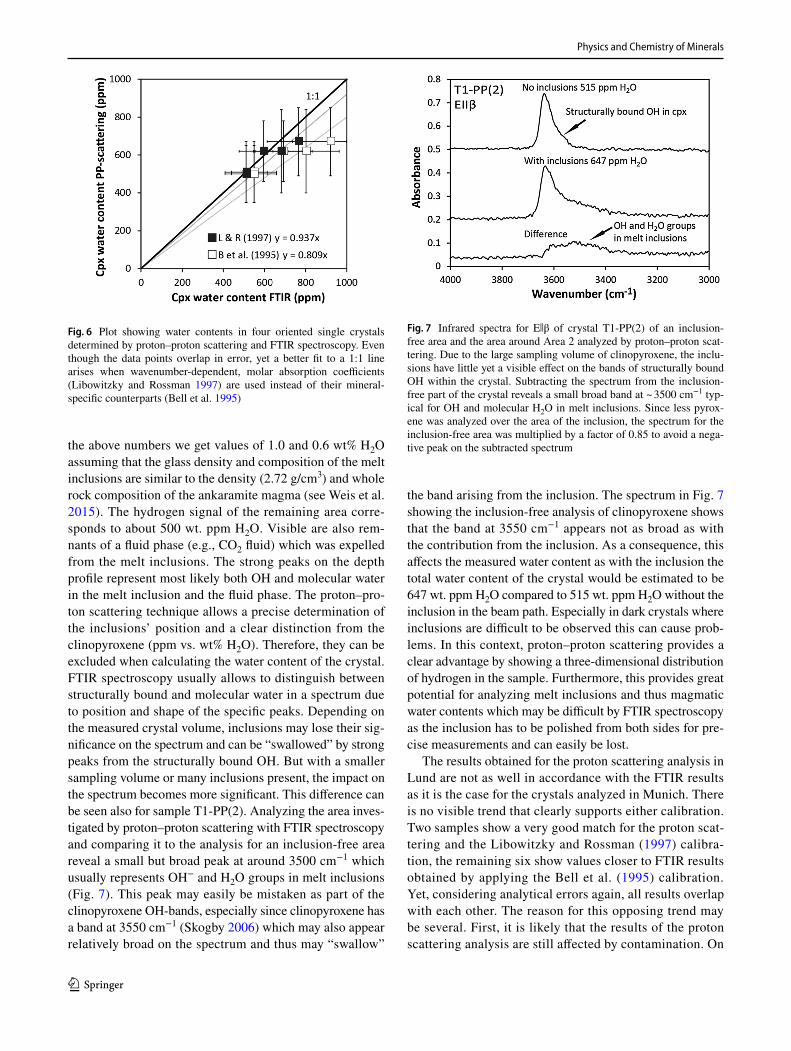
The results for the oriented single crystals analyzed at the Munich facility show a good correlation with the data obtained by FTIR. Plotting the results vs. water contents calculated from both the wavenumber-dependent absorp-tion coefficients by Libowitzky and Rossman (1997) and the mineral-specific absorption coefficient by Bell et al. (1995) shows that within analytical error both lie near a 1:1 line (Fig. 6). However, based on a fitted trendline (y = 0.937x) the results for the wavenumber-dependent calibration show a closer match to the values determined by proton scattering. From this it cannot simply be assumed that the mineral-spe-cific absorption coefficient is less suitable; however, it sup-ports the assumption that wavenumber-dependent absorption coefficients are more universally applicable, at least in the case of clinopyroxene. It is important to note that Bell et al. (1995) determined their mineral-specific absorption coef-ficient for a gem-quality augite crystal and stated that their calibration is applicable for similar FTIR spectra as the one obtained in their study. Clinopyroxenes in this study, how-ever, are not augites but diopsides and show spectra slightly different to those obtained by Bell et al. (1995). Our diop-side spectra do not show a strong band at ~ 3460 cm−1 for Eǀǀα and Eǀǀβ which was the case for spectra presented by Bell et al. (1995). A similar deviation has been observed in previous studies (e.g., Sundvall and Stalder 2011). The cali-bration by Libowitzky and Rossman (1997) has previously also been used successfully for synthetic as well as natural clinopyroxene samples (e.g., Stalder 2004; Stalder and Lud-wig 2007; Sundvall and Stalder 2011) and was reconfirmed by Mosenfelder and Rossman (2013).
Due to its 3D resolution the proton–proton scattering method provides great potential in the identification of
Fig. 4 a Representative hydrogen depth profiles from proton–proton scattering analysis of crystals T1-PP(1) and T3-PP(1). Both show a relatively homogenous distribution of hydrogen throughout the crys-tal. The sharp peak at the surface of T1-PP(1) may arise from either a remnant of thermoplastic resin from sample preparation or a small inclusion. Such enhanced signals were excluded for the calculation of crystal water contents. b Hydrogen depth profile of crystal KBH-PP(1) before and after drying in the oven. It can be seen that the dry-ing process reduced water contamination in microfractures within the drilled well significantly, however, not entirely
Physics and Chemistry of Minerals
1 3
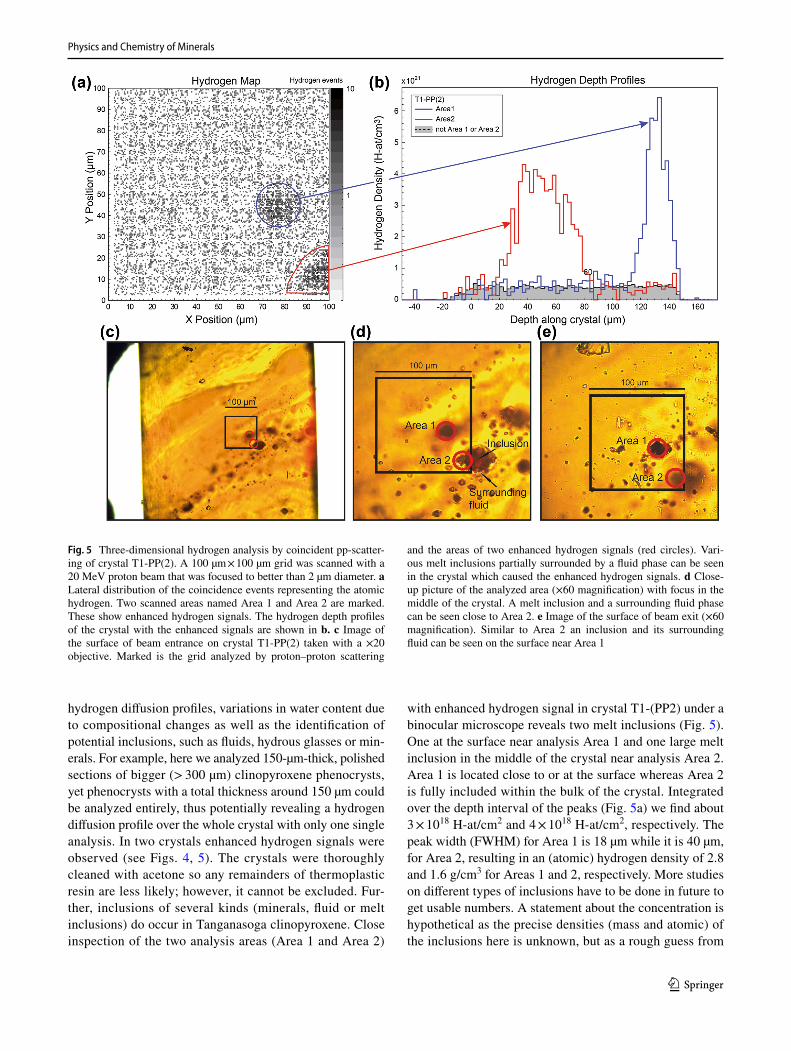
hydrogen diffusion profiles, variations in water content due to compositional changes as well as the identification of potential inclusions, such as fluids, hydrous glasses or min-erals. For example, here we analyzed 150-µm-thick, polished sections of bigger (> 300 µm) clinopyroxene phenocrysts, yet phenocrysts with a total thickness around 150 µm could be analyzed entirely, thus potentially revealing a hydrogen diffusion profile over the whole crystal with only one single analysis. In two crystals enhanced hydrogen signals were observed (see Figs. 4, 5). The crystals were thoroughly cleaned with acetone so any remainders of thermoplastic resin are less likely; however, it cannot be excluded. Fur-ther, inclusions of several kinds (minerals, fluid or melt inclusions) do occur in Tanganasoga clinopyroxene. Close inspection of the two analysis areas (Area 1 and Area 2)
with enhanced hydrogen signal in crystal T1-(PP2) under a binocular microscope reveals two melt inclusions (Fig. 5). One at the surface near analysis Area 1 and one large melt inclusion in the middle of the crystal near analysis Area 2. Area 1 is located close to or at the surface whereas Area 2 is fully included within the bulk of the crystal. Integrated over the depth interval of the peaks (Fig. 5a) we find about 3 × 10¹⁸ H-at/cm2 and 4 × 10¹⁸ H-at/cm2, respectively. The peak width (FWHM) for Area 1 is 18 µm while it is 40 µm, for Area 2, resulting in an (atomic) hydrogen density of 2.8 and 1.6 g/cm3 for Areas 1 and 2, respectively. More studies on different types of inclusions have to be done in future to get usable numbers. A statement about the concentration is hypothetical as the precise densities (mass and atomic) of the inclusions here is unknown, but as a rough guess from
Fig. 5 Three-dimensional hydrogen analysis by coincident pp-scatter-ing of crystal T1-PP(2). A 100 µm × 100 µm grid was scanned with a 20 MeV proton beam that was focused to better than 2 µm diameter. a Lateral distribution of the coincidence events representing the atomic hydrogen. Two scanned areas named Area 1 and Area 2 are marked. These show enhanced hydrogen signals. The hydrogen depth profiles of the crystal with the enhanced signals are shown in b. c Image of the surface of beam entrance on crystal T1-PP(2) taken with a ×20 objective. Marked is the grid analyzed by proton–proton scattering
and the areas of two enhanced hydrogen signals (red circles). Vari-ous melt inclusions partially surrounded by a fluid phase can be seen in the crystal which caused the enhanced hydrogen signals. d Close-up picture of the analyzed area (×60 magnification) with focus in the middle of the crystal. A melt inclusion and a surrounding fluid phase can be seen close to Area 2. e Image of the surface of beam exit (×60 magnification). Similar to Area 2 an inclusion and its surrounding fluid can be seen on the surface near Area 1
Physics and Chemistry of Minerals
1 3
the above numbers we get values of 1.0 and 0.6 wt% H2O assuming that the glass density and composition of the melt inclusions are similar to the density (2.72 g/cm3) and whole rock composition of the ankaramite magma (see Weis et al. 2015). The hydrogen signal of the remaining area corre-sponds to about 500 wt. ppm H2O. Visible are also rem-nants of a fluid phase (e.g., CO2 fluid) which was expelled from the melt inclusions. The strong peaks on the depth profile represent most likely both OH and molecular water in the melt inclusion and the fluid phase. The proton–pro-ton scattering technique allows a precise determination of the inclusions’ position and a clear distinction from the clinopyroxene (ppm vs. wt% H2O). Therefore, they can be excluded when calculating the water content of the crystal. FTIR spectroscopy usually allows to distinguish between structurally bound and molecular water in a spectrum due to position and shape of the specific peaks. Depending on the measured crystal volume, inclusions may lose their sig-nificance on the spectrum and can be “swallowed” by strong peaks from the structurally bound OH. But with a smaller sampling volume or many inclusions present, the impact on the spectrum becomes more significant. This difference can be seen also for sample T1-PP(2). Analyzing the area inves-tigated by proton–proton scattering with FTIR spectroscopy and comparing it to the analysis for an inclusion-free area reveal a small but broad peak at around 3500 cm−1 which usually represents OH− and H2O groups in melt inclusions (Fig. 7). This peak may easily be mistaken as part of the clinopyroxene OH-bands, especially since clinopyroxene has a band at 3550 cm−1 (Skogby 2006) which may also appear relatively broad on the spectrum and thus may “swallow”
the band arising from the inclusion. The spectrum in Fig. 7 showing the inclusion-free analysis of clinopyroxene shows that the band at 3550 cm−1 appears not as broad as with the contribution from the inclusion. As a consequence, this affects the measured water content as with the inclusion the total water content of the crystal would be estimated to be 647 wt. ppm H2O compared to 515 wt. ppm H2O without the inclusion in the beam path. Especially in dark crystals where inclusions are difficult to be observed this can cause prob-lems. In this context, proton–proton scattering provides a clear advantage by showing a three-dimensional distribution of hydrogen in the sample. Furthermore, this provides great potential for analyzing melt inclusions and thus magmatic water contents which may be difficult by FTIR spectroscopy as the inclusion has to be polished from both sides for pre-cise measurements and can easily be lost.
The results obtained for the proton scattering analysis in Lund are not as well in accordance with the FTIR results as it is the case for the crystals analyzed in Munich. There is no visible trend that clearly supports either calibration. Two samples show a very good match for the proton scat-tering and the Libowitzky and Rossman (1997) calibra-tion, the remaining six show values closer to FTIR results obtained by applying the Bell et al. (1995) calibration. Yet, considering analytical errors again, all results overlap with each other. The reason for this opposing trend may be several. First, it is likely that the results of the proton scattering analysis are still affected by contamination. On
Fig. 6 Plot showing water contents in four oriented single crystals determined by proton–proton scattering and FTIR spectroscopy. Even though the data points overlap in error, yet a better fit to a 1:1 line arises when wavenumber-dependent, molar absorption coefficients (Libowitzky and Rossman 1997) are used instead of their mineral-specific counterparts (Bell et al. 1995)
Fig. 7 Infrared spectra for Eǀǀβ of crystal T1-PP(2) of an inclusion-free area and the area around Area 2 analyzed by proton–proton scat-tering. Due to the large sampling volume of clinopyroxene, the inclu-sions have little yet a visible effect on the bands of structurally bound OH within the crystal. Subtracting the spectrum from the inclusion-free part of the crystal reveals a small broad band at ~ 3500 cm−1 typ-ical for OH and molecular H2O in melt inclusions. Since less pyrox-ene was analyzed over the area of the inclusion, the spectrum for the inclusion-free area was multiplied by a factor of 0.85 to avoid a nega-tive peak on the subtracted spectrum
Physics and Chemistry of Minerals
1 3
some profiles some maxima in hydrogen density are still present even after the drying process (Fig. 4b). Although, these areas are excluded from the water content calculation there might still be a slight overall contamination affecting this process. The samples were dried for 8 h which might not have been sufficient to remove the water in fractures in all the crystals. The samples simply should be dried longer or at slightly higher temperatures. Further, since the FTIR measurements on the Lund sample set were not polarized the error is much larger. The method applying unpolarized measurements usually relies on a statistical approach based on the amount of measured crystals (Kovacs et al. 2008). At least ten crystals or more are considered to provide a good accuracy and precision, which is not the case in our study. Hence, the unpolarized measurements in this study should be treated with great care. We additionally ana-lyzed one more crystal from Kilbourne Hole with polar-ized FTIR measurements. The crystal was found to contain 418 wt. ppm H2O applying the calibration by Libowitzky and Rossman (1997), which gives a better match with the proton scattering data (Table 1). This further confirms that there is a variation in the dataset obtained by unpolarized measurements and the values are less precise. For a direct comparison between proton scattering and FTIR results the sample set analyzed in Munich is considered more reli-able as here polarized FTIR measurements were done and since there was no sign of any contamination affecting the proton scattering results.
Due to the small thickness of the analyzed crystal parts in the drilled well the obtained data are not so much rep-resentative of a potential three-dimensional distribution of hydrogen within the whole crystal as it is the case for thicker samples. Yet lateral hydrogen distributions which are sufficient to determine diffusion profiles or compo-sition-related changes in hydrogen concentration can be measured if the bottom of the drilled wells provides a sufficient surface area. The preparation of a well within a thicker crystal made it easy to handle them during mounting for the proton scattering analysis. The thin and near-transparent bottom of the drilled well further offers a possibility for Raman measurements, in particular trans-mission Raman spectroscopy (e.g., Weis et al. in press). The crystals’ color and transparency have a big effect on Raman measurements since dark-colored crystals promote sample heating which can cause heat emission background or sample damage. This effect is less for more transpar-ent samples and will thus improve the spectral quality. In addition, the thicker parts of the crystal remain suitable for other analytical techniques such as FTIR spectroscopy or SIMS.
Summary and conclusions
In this study, water contents of clinopyroxene phenocrysts from various volcanic systems were successfully deter-mined by proton–proton scattering analysis. A new method for sample preparation of thin crystal areas suitable for proton beams with relatively low energies was presented. The method applying flat end mills and drilling wells with thin bottoms into the crystals was shown to work, although samples may need to be thoroughly dried to avoid water contamination in microfractures. The data presented here demonstrate the potential of the proton–proton scattering method for the identification and measurement of hydrous inclusions which can be difficult with other methods such as FTIR spectroscopy. Moreover, this work shows that wave-number-dependent absorption coefficients may be more generally applicable for clinopyroxenes compared to their available mineral-specific counterparts.
Acknowledgements We thank Valentin Troll, Frances Deegan, Kirsten Zaczek and Juan Carlos Carracedo for providing the samples from the Canary Islands. Further, we thank George Rossman and Jed Mosen-felder for providing the clinopyroxene from Kilbourne Hole and the zoisite samples. Lisa Samrock, Soophie Omidian and Per-Olof Pers-son are thanked for their help with sample preparation. We thank Peter Lazor for his helpful input for the development of the drilling method. Financial support for this project was provided by the Swedish Research Council (Grant no. VR 2011-5430). The data for this paper are available in the text, tables, and references therein and from the corresponding author on request. Finally, we thank Eugen Libowitzky and one anonymous reviewer for their helpful comments that contrib-uted to improving this work.
Open Access This article is distributed under the terms of the Crea-tive Commons Attribution 4.0 International License (http://creat iveco mmons .org/licen ses/by/4.0/), which permits unrestricted use, distribu-tion, and reproduction in any medium, provided you give appropriate credit to the original author(s) and the source, provide a link to the Creative Commons license, and indicate if changes were made.
References
Bell DR, Ihinger PD, Rossman GR (1995) Quantitative analysis of trace OH in garnet and pyroxenes. Am Mineral 80:465–474
Bolfan-Casanova N (2005) Water in the Earth’s mantle. Mineral Mag 69:229–257
Bolfan-Casanova N, Montagnac G, Reynard B (2014) Measurement of water contents in olivine using Raman spectroscopy. Am Mineral 99:149–156
Borysiuk M, Ros L, Kristiansson P, Skogby H, Abdel N, Elfman M, Golubev P, Nilsson EJC, Pallon J (2013) Hydrogen analysis and profiling with a position sensitive detector. Nucl Instrum Meth B 306:49–53
Carracedo JC, Badiola ER, Guillou H, de La Nuez J, Pérez Torrado FJ (2001) Geology and volcanology of La Palma and El Hierro, Western Canaries. Estud Geol 57:175–273
Gose J, Reichart P, Dollinger G, Schmädicke E (2008) Water in natural olivine—determined by proton–proton scattering analysis. Am Mineral 93:1613–1619
Harvey J, Yoshikawa M, Hammond SJ, Burton KW (2012) Decipher-ing the trace element characteristics in Kilbourne Hole peridotite xenoliths: melt-rock interaction and metasomatism beneath the Rio Grande Rift, SW USA. J Petrol 53:1709–1742
Hurlbut CS (1969) Gem zoisite from Tanzania. Am Mineral 54:702–709
Kil Y, Wendlandt RF (2004) Pressure and temperature evolution of upper mantle under the Rio Grande rift. Contrib Miner Petrol 148:2665–2680
Kovacs I, Hermann J, O’Neill H, Fitz Gerald J, Sambridge M, Horvath G (2008) Quantitative absorbance spectroscopy with unpolarized light: Part II. Experimental evaluation and development of a pro-tocol for quantitative analysis of mineral IR spectra. Am Mineral 93:765–778
Kristiansson P, Borysiuk M, Ros L, Skogby H, Abdel N, Elfman M, Nilsson EJC, Pallon J (2013) Quantitative hydrogen analysis in minerals based on a semi-empirical approach. Nucl Instrum Meth B 306:253–256
Libowitzky E, Rossman GR (1997) An IR absorption calibration for water in minerals. Am Mineral 82:1111–1115
Longpre MA, Troll VR, Hansteen TH, Anderson E (2009) Ankaramitic lavas and clinopyroxene megacrysts from the Tanganasoga Vol-cano, El Hierro Island (Canary Archipelago). Eos Trans AGU, 90(52) (Fall Meet Suppl Abstract V51A-1662)
Mosenfelder J, Rossman GR (2013) Analysis of hydrogen and fluorine in pyroxenes: II. Clinopyroxene. Am Mineral 98:1042–1054
Moser M, Reichart P, Bergmaier A, Greubel C, Schiettekatte F, Doll-inger G (2015) Hydrogen analysis depth calibration by CORTEO Monte-Carlo simulation. Nucl Instrum Meth B 371:161–166
O’Leary JA, Rossman GR, Eiler JM (2007) Hydrogen analysis in minerals by continuous-flow mass spectrometry. Am Mineral 92:1990–1997
Peslier AH (2010) A review of water contents of nominally anhydrous natural minerals in the mantles of Earth, Mars and the Moon. J Volcanol Geotherm Res 197:239–258
Reichart P, Dollinger G, Bergmaier A, Datzmann G, Hauptner A, Körner H-J (2002) Sensitive 3D hydrogen microscopy by pro-ton–proton scattering. Nuclear Nucl Instrum Meth B 197:134–149
Reichart P, Datzmann G, Hauptner A, Hertenberger R, Wild C, Doll-inger G (2004a) Three-dimensional hydrogen microscopy in dia-mond. Science 306:1537–1540
Reichart P, Dollinger G, Bergmaier A, Datzmann G, Hauptner A, Körner H-J, Krücken R (2004b) 3D hydrogen microscopy with sub-ppm detection limit. Nucl Instrum Meth B 219:980–987
Reichart P, Moser M, Greubel C, Peeper K, Dollinger G (2016) Deu-terium microscopy using 17 MeV deuteron-deuteron scattering. Nucl Instrum Meth B 371:178–184
Ros L, Borysiuk M, Kristiansson P, Abdel N, Elfman M, Nilsson EJC, Pallon J (2014) Calibration of an elastic recoil setup for D/H-ratios close to natural abundance. Nucl Instrum Meth B 332:187–190
Skogby H (2006) Water in natural mantle minerals I: pyroxenes. Rev Mineral Geochem 62:155–168
Stalder R (2004) Influence of Fe, Cr and Al on hydrogen incorporation in orthopyroxene. Eur J Mineral 16:703–711
Stalder R, Ludwig T (2007) OH incorporation in synthetic diopside. Eur J Mineral 19:373–380
Sundvall R, Skogby H (2011) Hydrogen defect saturation in natural pyroxene. Phys Chem Miner 38:335–344
Sundvall R, Stalder R (2011) Water in upper mantle pyroxene meg-acrysts and xenocrysts: a survey study. Am Mineral 96:1215–1227
Thomas S-M, Thomas R, Davidson P, Reichart P, Koch-Müller M, Dollinger G (2008) Application of Raman spectroscopy to quan-tify trace water concentrations in glasses and garnets. Am Mineral 93:1550–1557
Wade JA, Plank T, Hauri EH, Kelley KA, Roggensack K, Zimmer M (2008) Prediction of magmatic water contents via measurement of H2O in clinopyroxene phenocrysts. Geology 36:799–802
Wegdén M, Kristiansson P, Skogby H, Auzelyte V, Elfman M, Malmqvist KG, Nilsson C, Pallon J, Shariff A (2005) Hydrogen depth profiling by p–p scattering in nominally anhydrous miner-als. Nucl Instrum Meth B 231:524–529
Weis FA, Skogby H, Troll VR, Deegan FM, Darehn B (2015) Mag-matic water contents determined through clinopyroxene: exam-ples from the Western Canary Islands, Spain. Geochem Geophys Geosyst 16:2127–2146
Weis FA, Stalder R, Skogby H (2016a) Experimental hydration of natural volcanic clinopyroxene phenocrysts under hydrothermal pressures (0.5–3 kbar). Am Mineral 101:2233–2247
Weis FA, Lazor P, Skogby H, Stalder R, Eriksson L (2016b) Polarized IR and Raman spectra of zoisite: insights into the OH-dipole ori-entation and luminescence. Eur J Mineral 28:537–543
Weis FA, Bellucci JJ, Skogby H, Stalder R, Nemchin AA, Whitehouse MJ (2017) Water content in the Martian mantle: a Nakhla perspec-tive. Geochim Cosmochim Acta 212:84–98
Withers AC, Bureau H, Raepsaet C, Hirschmann MM (2012) Calibra-tion of infrared spectroscopy by elastic recoil detection analysis of H in synthetic olivine. Chem Geol 334:92–98
Ziegler JF, Ziegler MD, Biersack JP (2010) SRIM-the stopping and range of ions in matter. Nucl Instrum Meth B 268:1818–1823