+ All Categories
Home > Documents > Hydrogen Fueling Stations · PDF fileHydrogen Fueling Stations Infrastructure Dr. Nan Qin ......

Hydrogen Fueling Stations · PDF fileHydrogen Fueling Stations Infrastructure Dr. Nan Qin ......

Date post: 12-Mar-2018
Category:
Upload: buitram
View: 216 times
Download: 0 times
Share this document with a friend
26
Hydrogen Fueling Stations Infrastructure Dr. Nan Qin Dr. Paul Brooker University of Central Florida Florida Solar Energy Center 1679 Clearlake Road Cocoa, FL 32922-5703 E-mail: [email protected] Sesha Srinivasan Tuskegee University Submitted to: Ms. Denise Dunn Research and Innovative Technology Administration 1200 New Jersey Avenue, SE Washington, DC 20590 E-mail: [email protected] Contract Number: DTRT13-G-UTC51 Semi-annual Project Report EVTC Report Number: EVTC-RR-02-14 March 2014 The contents of this report reflect the views of the authors, who are responsible for the facts and the accuracy of the information presented herein. This document is disseminated under the sponsorship of the U.S. Department of Transportation’s University Transportation Centers Program in the interest of information exchange. The U.S. Government assumes no liability for the contents or use thereof.
Transcript

Hydrogen Fueling Stations Infrastructure

Dr. Nan Qin

Dr. Paul Brooker

University of Central Florida

Florida Solar Energy Center

1679 Clearlake Road

Cocoa, FL 32922-5703

E-mail: [email protected]

Sesha Srinivasan

Tuskegee University

Submitted to:

Ms. Denise Dunn

Research and Innovative Technology Administration

1200 New Jersey Avenue, SE

Washington, DC 20590

E-mail: [email protected]

Contract Number: DTRT13-G-UTC51

Semi-annual Project Report

EVTC Report Number: EVTC-RR-02-14

March 2014

The contents of this report reflect the views of the authors, who are responsible for the facts and the

accuracy of the information presented herein. This document is disseminated under the sponsorship of

the U.S. Department of Transportation’s University Transportation Centers Program in the interest of

information exchange. The U.S. Government assumes no liability for the contents or use thereof.

Acronyms and Abbreviations

CaFCP California Fuel Cell Partnership

DOE US Department of Energy

EC Early Commercial Station

EVTC Electric Vehicle Transportation Center

FCEV Fuel Cell Electric Vehicle

H2A Hydrogen Analysis model

HSCC Hydrogen Station Cost Calculation

LS Larger Stations

MS More Stations

NREL National Renewable Energy Laboratory

PSA Pressure Swing Adsorption

SMR Steam Methane Reformer

SOTA State-of-the-art

STREET Spatially & Temporally Resolved Energy & Environment Tool

UCD University of California, Davis

Table of Contents

1. Introduction .......................................................................................................................................... 1

2. Hydrogen Fueling Stations .................................................................................................................... 1

2.1. Onsite Steam Methane Reforming ............................................................................................... 2

2.2. Onsite Electrolysis of Water .......................................................................................................... 2

2.3. Liquid or Gaseous Hydrogen Delivery ........................................................................................... 2

2.4. Pipeline Delivery ........................................................................................................................... 3

2.5. Mobile Refueling ........................................................................................................................... 3

2.6. Comparison of Different Types of Fueling Stations ...................................................................... 4

2.7. Fueling Stations with 35 MPa and 70 MPa Dispensers ................................................................. 5

3. Codes and Standards ............................................................................................................................ 6

4. Cost Estimates for the Fueling Stations ................................................................................................ 7

5. Hydrogen Fueling Stations Rollout Strategy ....................................................................................... 13

6. Conclusions and Future Work ............................................................................................................. 18

7. Appendix ............................................................................................................................................. 20

8. References .......................................................................................................................................... 23

1

1. INTRODUCTION Fuel Cell Electric Vehicles (FCEVs) can provide customers with the benefits of low to zero

greenhouse gas emissions, high performance, and comfort without compromising range and refill

time. With three major automakers (Honda, Hyundai, and Toyota) planning to introduce

consumer FCEVs by the end of 2015, FCEVs will play an increasingly important role in the

electric vehicle arena. Building hydrogen fueling infrastructure has been identified as a major

obstacle in FCEV commercialization.[1] This report is part of an ongoing effort within an

Electric Vehicle Transportation Center (EVTC) project: “Fuel Cell Vehicle Technologies,

Infrastructure and Requirements.” This report is based on a survey of recent literature on several

key aspects of a hydrogen infrastructure: types of hydrogen fueling stations, station costs, station

rollout strategy, and codes and standards. The majority of hydrogen infrastructure studies focus

on California’s pioneering model of deploying and testing small fleets of FCEVs and

demonstrational hydrogen fueling stations. Valuable lessons can be learned from California’s

experiences and used by other states to plan and prepare for the challenges and opportunities that

hydrogen transportation might bring.

2. HYDROGEN FUELING STATIONS Hydrogen fueling stations are one of the most important building blocks of the FCEV

transportation infrastructure. In contrast to conventional gas stations where gasoline is delivered

by tanker trucks, hydrogen fuel can be either delivered by trucks, by hydrogen pipelines, or

produced onsite at the fueling stations. Despite the many variations on the station design, most

stations required the following hardware:

Hydrogen production equipment (for on-site hydrogen production types of stations only)

Purification system: to purify hydrogen to meet the purity standards for fuel cell vehicles

Storage vessels: to store hydrogen in gaseous or liquid form

Compressor: minimize storage volume and prepare the gas for pumping into high

pressure (35 MPa-70MPa) vehicle storage tanks

Safety equipment (e.g. pressure relief valves, vent stack, hydrogen sensors, fencing)

Mechanical equipment (e.g. underground piping, valves)

Electrical equipment (e.g. control panels, high-voltage connections, meters)

2

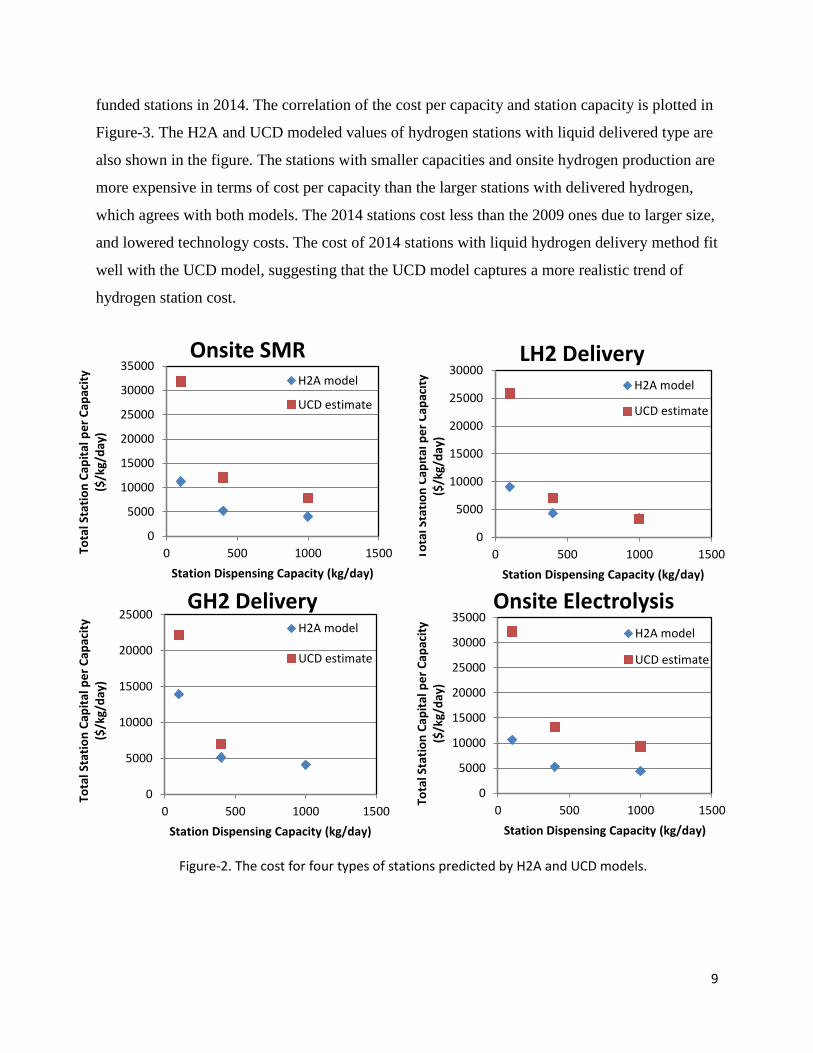
Hydrogen fueling stations can be in many various types that mainly differ in hydrogen forming

methods and hydrogen delivery methods. Some currently employed stations types and their

capacities are shown in Table 1.

2.1. ONSITE STEAM METHANE REFORMING Hydrogen fueling stations equipped with a steam methane reformer (SMR) is capable of

converting other fuels (natural gas, biogas, etc.) to hydrogen. This method works by exposing

e.g. methane to catalyst at a high temperature to produce a mixture of hydrogen and carbon

monoxide called syngas. The syngas further react with the catalyst to form more hydrogen and

carbon dioxide. The carbon dioxide is then removed by a pressure swing adsorption (PSA)

system. The reforming reaction for hydrogen production can be simplified as: [2]

CH4 + 2H2O → 4H2 + CO2

The configuration in this type of hydrogen station requires a water tank, a reformer containing a

series of reactors, a purification system PSA, buffers and hydrogen compressor, filters, air dryers

and compressors, and hydrogen dispensing pumps (Figure-A1).[3] The approximate hydrogen

fueling capacity of this type station is 100-1000 kg/day depending on the size of the reformer and

the number of dispensing pumps.[4]

2.2. ONSITE ELECTROLYSIS OF WATER In this method, electricity from grid or intermittent electricity is used produce hydrogen from

water. An electric current is passed through water with presence of an electrolyte membrane and

catalysts to split water into hydrogen and oxygen. The hydrogen is compressed or stored for

fueling FCEVs. Most commercial electrolyzers today are capable of electricity to hydrogen

efficiencies above 75%, with many reaching 80-85%, while 90% has been demonstrated in

laboratories. A typical electrolyzer station will require a water tank, deionizer, electrolyzer,

purifier, buffers, compressors, air dryer, filters, and dispensers (Figure-A2).[3] The capacity of

this type of station is relatively small (30-100 kg/day).

2.3. LIQUID OR GASEOUS HYDROGEN DELIVERY Hydrogen is produced at a central point such as a hydrogen generating plant. It can be neither

delivered to fueling stations in a gaseous form via “tube trailers” or in liquid form via “Dewar”

tanker trucks (Figure-A3). The liquid hydrogen is liquefied by supercooling the gas to a

3

cryogenic temperature of -253 °C. When delivered as a liquid form, the fuel can be either stored

in a liquid form or can be gasified at ambient temperature with vaporization stacks at the station,

and then compressed and stored for dispensing (Figure-A4).[4] Since the hydrogen is not

produced onsite, the required elements are buffers, dispensing pumps, compressor, dryer, and air

filters.

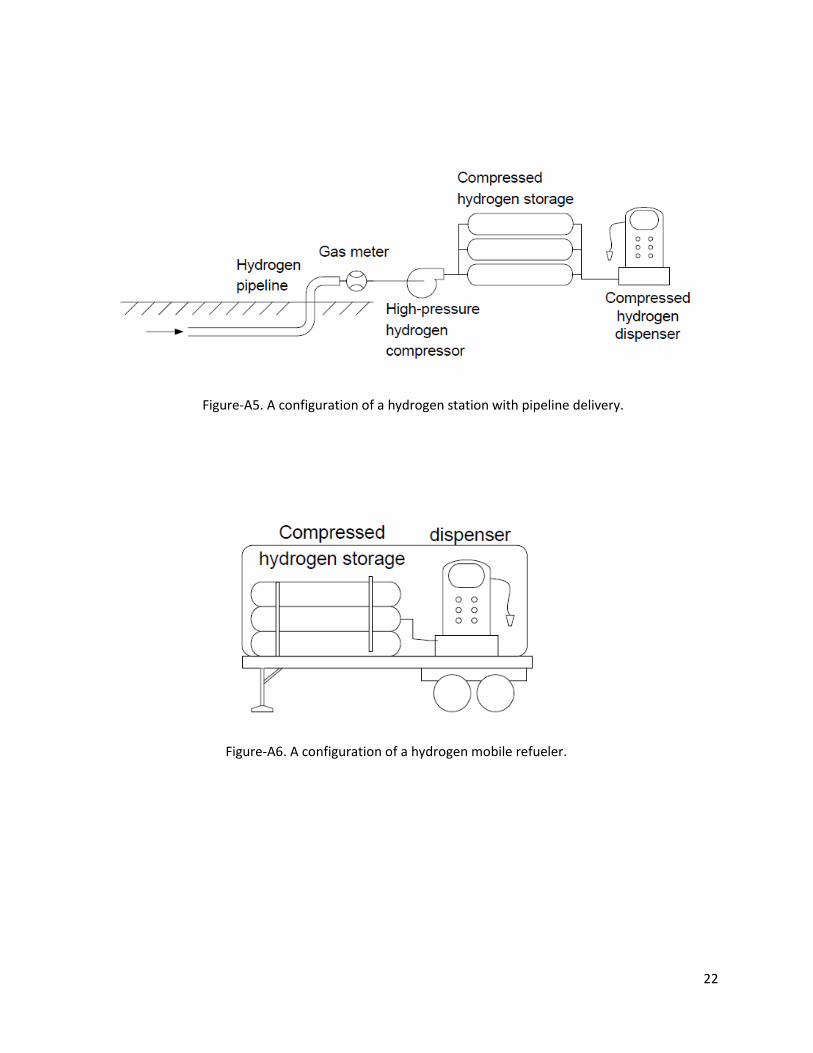
2.4. PIPELINE DELIVERY Hydrogen pipelines are used to transport hydrogen from the point of production to the point of

demand. They are typically built to deliver hydrogen between gasoline refineries and chemical

plants. The hydrogen fueling stations can take advantage of the existing 700 miles pipeline in the

United States.[4] Hydrogen is drawing from the pipeline at its service pressure, purified, and

compressed and stored at the stations for dispensing. In the future, a designated hydrogen fueling

pipeline may be built to roll out a more mature hydrogen fueling network. In addition, some

studies indicate possibilities of blending a certain percentage of hydrogen with natural gas in the

natural gas pipelines and then re-separating out hydrogen for fueling stations. A relatively low

percentage (e.g., 10%) blends is suggested to minimize the pipeline safety issues, but further

study is still needed.[5] The equipment needed in a fueling station are buffers, dispensing pumps,

compressor, dryer, and air filters (Figure-A5).[3]

2.5. MOBILE REFUELING Mobile refuelers deliver hydrogen storage tanks to a fueling site where they are stationed

temporarily (Figure-A6).[3] This method is commonly used temporarily for fueling stations that

are under construction or for short term events.

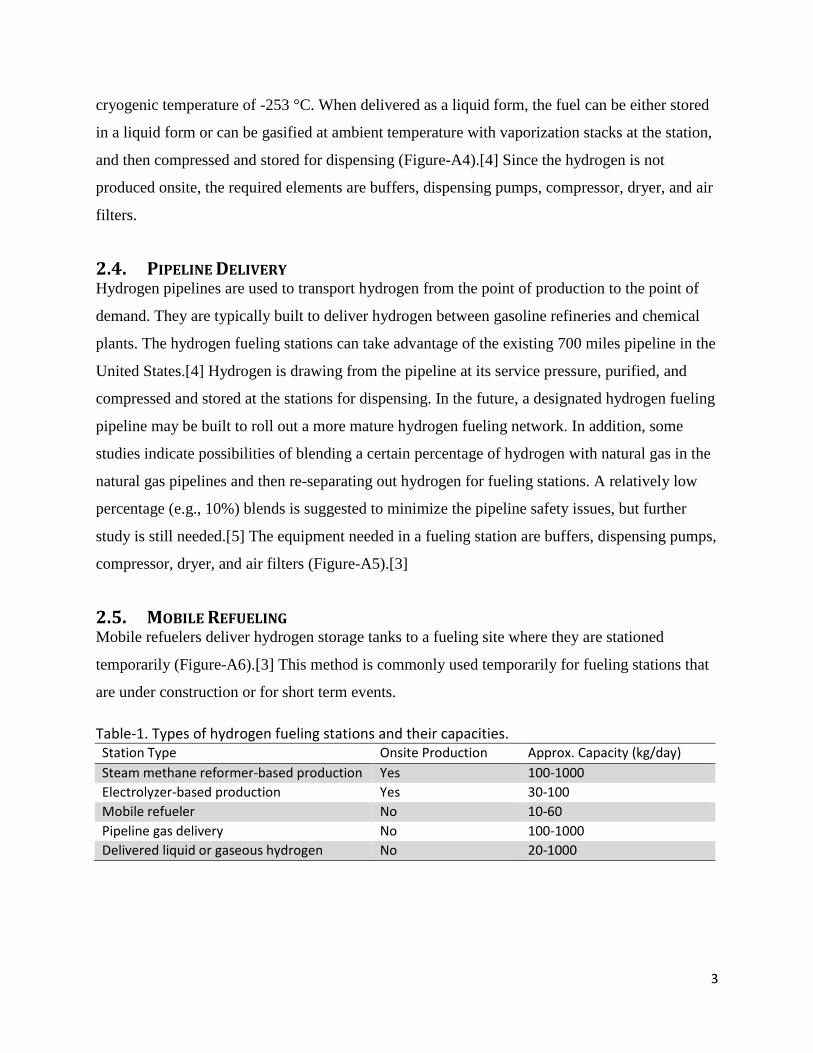
Table-1. Types of hydrogen fueling stations and their capacities. Station Type Onsite Production Approx. Capacity (kg/day)

Steam methane reformer-based production Yes 100-1000

Electrolyzer-based production Yes 30-100

Mobile refueler No 10-60

Pipeline gas delivery No 100-1000

Delivered liquid or gaseous hydrogen No 20-1000

4

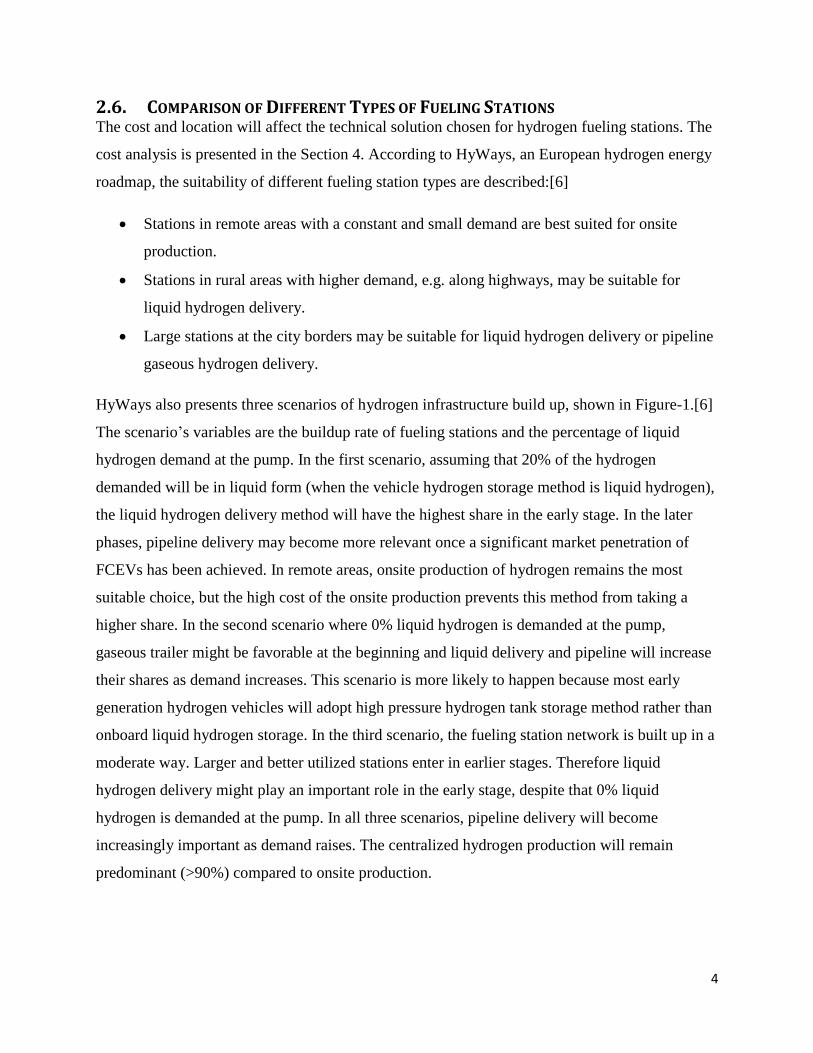
2.6. COMPARISON OF DIFFERENT TYPES OF FUELING STATIONS The cost and location will affect the technical solution chosen for hydrogen fueling stations. The

cost analysis is presented in the Section 4. According to HyWays, an European hydrogen energy

roadmap, the suitability of different fueling station types are described:[6]

Stations in remote areas with a constant and small demand are best suited for onsite

production.

Stations in rural areas with higher demand, e.g. along highways, may be suitable for

liquid hydrogen delivery.

Large stations at the city borders may be suitable for liquid hydrogen delivery or pipeline

gaseous hydrogen delivery.

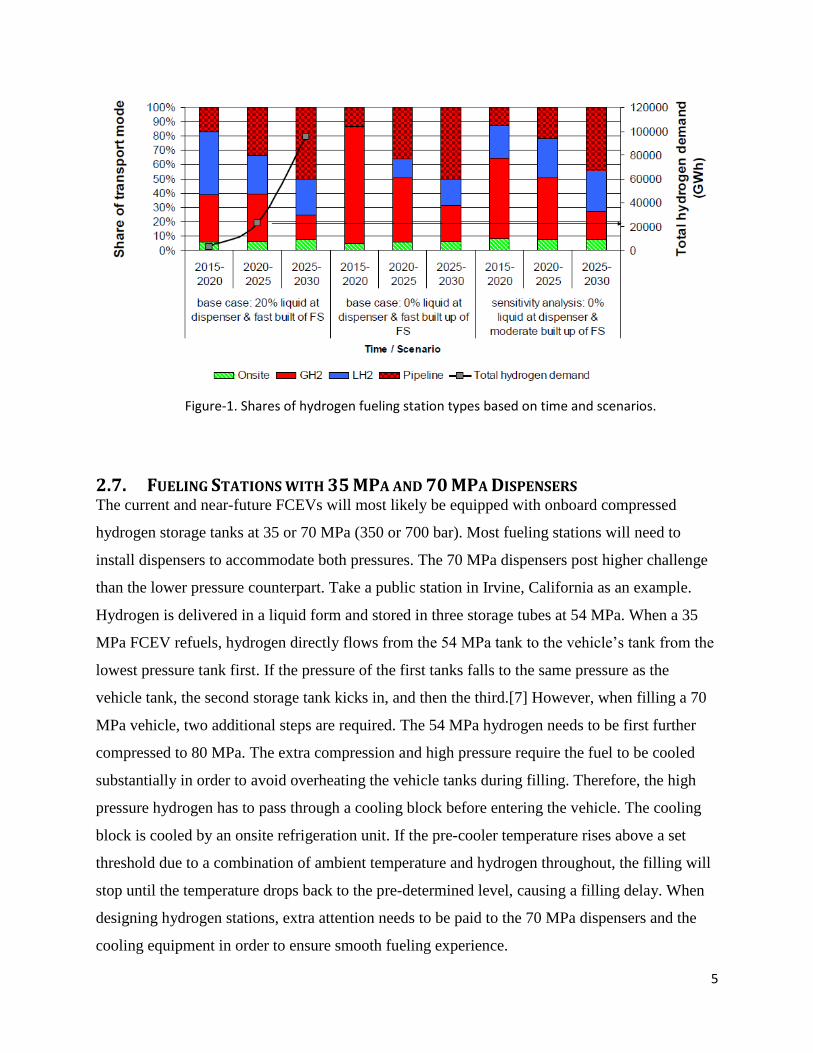
HyWays also presents three scenarios of hydrogen infrastructure build up, shown in Figure-1.[6]

The scenario’s variables are the buildup rate of fueling stations and the percentage of liquid

hydrogen demand at the pump. In the first scenario, assuming that 20% of the hydrogen

demanded will be in liquid form (when the vehicle hydrogen storage method is liquid hydrogen),

the liquid hydrogen delivery method will have the highest share in the early stage. In the later

phases, pipeline delivery may become more relevant once a significant market penetration of

FCEVs has been achieved. In remote areas, onsite production of hydrogen remains the most

suitable choice, but the high cost of the onsite production prevents this method from taking a

higher share. In the second scenario where 0% liquid hydrogen is demanded at the pump,

gaseous trailer might be favorable at the beginning and liquid delivery and pipeline will increase

their shares as demand increases. This scenario is more likely to happen because most early

generation hydrogen vehicles will adopt high pressure hydrogen tank storage method rather than

onboard liquid hydrogen storage. In the third scenario, the fueling station network is built up in a

moderate way. Larger and better utilized stations enter in earlier stages. Therefore liquid

hydrogen delivery might play an important role in the early stage, despite that 0% liquid

hydrogen is demanded at the pump. In all three scenarios, pipeline delivery will become

increasingly important as demand raises. The centralized hydrogen production will remain

predominant (>90%) compared to onsite production.

5

2.7. FUELING STATIONS WITH 35 MPA AND 70 MPA DISPENSERS The current and near-future FCEVs will most likely be equipped with onboard compressed

hydrogen storage tanks at 35 or 70 MPa (350 or 700 bar). Most fueling stations will need to

install dispensers to accommodate both pressures. The 70 MPa dispensers post higher challenge

than the lower pressure counterpart. Take a public station in Irvine, California as an example.

Hydrogen is delivered in a liquid form and stored in three storage tubes at 54 MPa. When a 35

MPa FCEV refuels, hydrogen directly flows from the 54 MPa tank to the vehicle’s tank from the

lowest pressure tank first. If the pressure of the first tanks falls to the same pressure as the

vehicle tank, the second storage tank kicks in, and then the third.[7] However, when filling a 70

MPa vehicle, two additional steps are required. The 54 MPa hydrogen needs to be first further

compressed to 80 MPa. The extra compression and high pressure require the fuel to be cooled

substantially in order to avoid overheating the vehicle tanks during filling. Therefore, the high

pressure hydrogen has to pass through a cooling block before entering the vehicle. The cooling

block is cooled by an onsite refrigeration unit. If the pre-cooler temperature rises above a set

threshold due to a combination of ambient temperature and hydrogen throughout, the filling will

stop until the temperature drops back to the pre-determined level, causing a filling delay. When

designing hydrogen stations, extra attention needs to be paid to the 70 MPa dispensers and the

cooling equipment in order to ensure smooth fueling experience.

Figure-1. Shares of hydrogen fueling station types based on time and scenarios.

6

3. CODES AND STANDARDS Codes dictate when and where requirements apply, and standards direct how to meet those

requirements. Fuel cell vehicle stakeholders such as government agencies, standards

development organizations, and industries are responsible for leading the effort to develop key

codes and standards. As fuel cell fueling stations represent a series of emerging technologies,

new standards and codes associated are still under development or revision. For instance,

contaminants such as carbon monoxide and hydrogen sulfide are impurities in the hydrogen fuel

that are produced by reforming techniques from methane or biogas. They are most harmful to

proton exchange membrane fuel cells (PEMFC) as they will poison the platinum catalyst.

International Organization for Standardization (ISO) has set a purity of 99.97 % H2 as a standard

for PEMFCs with a maximum allowance of 0.2 ppm for carbon monoxide and 4 ppb for

hydrogen sulfide (ISO 14687-2:2012). Since new technologies have been continuously

developed to reduce the platinum catalyst loading in the fuel cell, the fuel standard may need to

be revised to accommodate these changes. This research effort is conducted by Los Alamos

National Laboratory (LANL) and ASTM International supported by the US Department of

Energy (DOE) Hydrogen and Fuel Cells Program.[8]

For all hydrogen station types described in above section, the compression, storage, and

dispensing of hydrogen gas should follow certain codes and standards. For example, some

pioneer hydrogen fueling stations in the State of California followed the Society of Automotive

Engineers (SAE) standard J2601: “Fueling Protocols for Light Duty Gaseous Hydrogen Surface

Vehicles” for their hydrogen fuel dispensers [4, 9, 10] This standard applies to light duty

vehicles fueling for vehicles with storage capacity from 1 to 10 kg H2 for 70 MPa and 1 to 7.5 kg

for 35 MPa. The criteria include maximum fuel temperature at the dispenser nozzle, the

maximum fuel flow rate, the maximum rate of pressure increase and other performance criteria

based on the cooling capability of the station’s dispenser.[11]

The National Renewable Energy Laboratory (NREL) published a list of codes and standards

applicable for U.S. hydrogen infrastructure projects. They categorize the codes and standards in

sixteen aspects: annual inspections, balance of plant, canopy tops, compressed hydrogen gas

storage, compression systems and equipment, design, dispensing, fire safety, liquid hydrogen

storage, dispensing/operations/maintenance safety, on-site hydrogen production, operation

7

approvals, setbacks and footprints, outdoor gaseous systems, transportation, and vaporizers.[12]

The website fuelcellstandards.com contains a database of over 300 world-wide hydrogen and

fuel cell standards and is also a good source to locate codes and standards relevant to hydrogen

fueling stations.[13] In addition, the California Fuel Cell Partnership (CaFCP) and California

Department of Food and Agriculture are developing test methods for evaluating metering

equipment and dispensers for the purpose of selling hydrogen as a vehicle fuel in California. This

standard will very likely to be adopted by more states as hydrogen fueling stations roll out.[14]

4. COST ESTIMATES FOR THE FUELING STATIONS The cost analysis of hydrogen fueling stations is a complex issue due to a number of reasons.

Unlike gasoline, hydrogen can be generated from multiple feedstocks such as natural gas,

ethanol, biomass, water, using multiple sources of energy such as fossil fuel, nuclear power,

solar energy, and wind energy, etc. Hydrogen can be either produced at centralized locations and

delivered to fueling stations, or generated on-site. Therefore, depending on the locations of the

fueling stations (distances from a centralized hydrogen production plant) and accessibility or

emphasis on the renewable energy, the cost for the stations may vary significantly. Moreover,

factors such as government incentives, increased scale of FCEVs fleets, increased utilization

efficiencies, and economies of scale associated with high capacity stations all play important

roles in the final cost of the fueling stations. Several efforts conducted by different entities have

developed several models to estimate the cost: (1) the Hydrogen Analysis (H2A) model

developed by the US Department of Energy’s Fuel Cell Technologies Office, (2) models

developed by University of California, Davis (UCD), (3) Hydrogen Station Cost Calculation

(HSCC) developed by the National Renewable Energy Laboratory (NREL), and (4) recent

hydrogen station installation estimates in California.

The H2A model was developed with input and deliberation from industrial stakeholders such as

American Electric Power, BOC Gases, British Petroleum, Chevron, ExxonMobil, etc. H2A case

studies include both onsite production types and delivery types of hydrogen fueling stations. The

current cases refer to technology status in 2010 and assume deployment five year later in 2015

with mass production.[15] UCD studies were conducted by collecting inputs from multiple

stakeholders such as California Fuel Cell Partnership (CaFCP), Chevron, DOE, General Motors,

8

Honda Motor Company, Shell Hydrogen, Toyota Motor Company, etc. It also takes

consideration of different types of fueling stations into the cost estimates. [16] In contrast, results

from the HSCC do not distinguish between stations of different production or delivery types.

Their cost estimates apply to various types of hydrogen stations that are likely to be installed

over the next 5 to 10 years.[17] The recent hydrogen stations installed in California offer

invaluable real-world data of the hydrogen fueling station costs, which is used to evaluate the

model predictions.

Table-2 depicts the cost estimates of four types of fueling stations from H2A prediction of 2015

and UCD prediction for 2012-2014. Cost per capacity ($/kg/day) is widely used as a

measurement for the economics of hydrogen fueling stations. The Total capital is equal to the

Cost per capacity multiplied by the Station capacity. UCD values are generally higher than the

H2A values. It is due to that the UCD study takes into account of a baseline cost for site

preparation, permitting, engineering, utility installation, and buildings, assuming all new stations

being built from the ground up. In both models, a clear trend of cost per capacity reduction is

shown for all station types (Figure-2). This can be attributed to economies of scale. The stations

utilizing onsite hydrogen production have higher costs than the ones using delivered hydrogen

due to the added complexity of the station design.

Table-2. Cost estimates for hydrogen fueling stations based on the H2A and UCD models

GH2 Delivery LH2 Delivery Onsite SMR Onsite Electrolysis

Station Capacity (kg/day)

Cost per Capacity

($/kg/day)

Total Capital ($M)

Cost per Capacity

($/kg/day)

Total Capital ($M)

Cost per Capacity

($/kg/day)

Total Capital ($M)

Cost per Capacity

($/kg/day)

Total Capital ($M)

H2A model for 2015

100 13900 1.39 9025 0.903 11230 1.12 10610 1.06

400 5100 2.04 4305 1.72 5182 2.07 5242 2.10

1000 4097 4.10 3435 3.44 4013 4.01 4394 4.39

UCD model for 2012-2014

100 22200 2.22 25800 2.58 31800 3.18 32200 3.22

400 7025 2.81 7025 2.81 12025 4.81 13125 5.25

1000 n/a n/a 3210 3.21 7760 7.76 9260 9.26

GH2 = gaseous hydrogen, LH2 = liquid hydrogen, SMR = steam methane reforming

The real-world hydrogen station cost estimates are good benchmarks to verify the validity of

models. Table-3 shows the cost estimates of early demonstration stations in 2009 and recently

9

funded stations in 2014. The correlation of the cost per capacity and station capacity is plotted in

Figure-3. The H2A and UCD modeled values of hydrogen stations with liquid delivered type are

also shown in the figure. The stations with smaller capacities and onsite hydrogen production are

more expensive in terms of cost per capacity than the larger stations with delivered hydrogen,

which agrees with both models. The 2014 stations cost less than the 2009 ones due to larger size,

and lowered technology costs. The cost of 2014 stations with liquid hydrogen delivery method fit

well with the UCD model, suggesting that the UCD model captures a more realistic trend of

hydrogen station cost.

0

5000

10000

15000

20000

25000

0 500 1000 1500

Tota

l Sta

tio

n C

apit

al p

er

Cap

acit

y ($

/kg/

day

)

Station Dispensing Capacity (kg/day)

GH2 Delivery H2A model

UCD estimate

0

5000

10000

15000

20000

25000

30000

0 500 1000 1500Tota

l Sta

tio

n C

apit

al p

er

Cap

acit

y ($

/kg/

day

)

Station Dispensing Capacity (kg/day)

LH2 Delivery H2A model

UCD estimate

0

5000

10000

15000

20000

25000

30000

35000

0 500 1000 1500Tota

l Sta

tio

n C

apit

al p

er

Cap

acit

y ($

/kg/

day

)

Station Dispensing Capacity (kg/day)

Onsite SMR H2A model

UCD estimate

0

5000

10000

15000

20000

25000

30000

35000

0 500 1000 1500

Tota

l Sta

tio

n C

apit

al p

er

Cap

acit

y ($

/kg/

day

)

Station Dispensing Capacity (kg/day)

Onsite Electrolysis H2A model

UCD estimate

Figure-2. The cost for four types of stations predicted by H2A and UCD models.

10

Table-3. Cost estimates of early demonstration and recently funded hydrogen fueling stations in California.

Hydrogen Stations Station Capacity (kg/day)

Cost per Capacity ($/kg/day)

Total Capital ($M)

Hydrogen stations 2009

onsite electrolysis (Emeryville) 60 92667 5.56

Electrolysis (CSULA) 60 73333 4.40

Onstei SMR 100 40300 4.03

LH2 Delivery (Askland) 180 33111 5.96

Onsite SMR (UCLA) 140 30857 4.32

GH2 Truck (Harbor city) 100 24700 2.47

LH2 Delivery (SFO) 120 20083 2.41

Hydrogen stations planned for 2014

GH2 truck (APCI, 2Stns) 180 12702 2.29

LH2 truck (Linde, 3 Stns.) 350 7209 2.52

LH2 truck (Air Lquide, 1 Stn.) 200 12170 2.43

Onsite Electrolysis (H2 Frontier, 1 Stn.) 105 43956 4.62

0

10000

20000

30000

40000

50000

60000

70000

80000

90000

100000

0 200 400 600 800 1000 1200

Tota

l Sta

tio

n C

apit

al p

er

Cap

acit

y ($

/kg/

day

)

Station Dispensing Capacity (kg/day)

H2A 2015 LH2 delivery model

UCD 2012-2014 LH2 deliverymodel

Figure-3. Comparisons of model predicted hydrogen station cost with the cost of real-world

stations in California. Legend: Circle=gaseous H2 delivery; Diamond=liquid H2 delivery;

Square=onsite SMR; Triangle=onsite electrolysis. The red legends represent the stations built in

2009, and the blue ones represent station planned for 2014.

11

The HSCC model does not distinguish between station types. Its classification system takes into

account the degree of station market readiness, capacity, and volume of stations produced.[17] It

classifies hydrogen fueling station into four categories:

(1) State-of-the-art Stations (SOTA): the stations would include the most recent generation

of major components, and be installed and operated within the 2011-2012 timeframe.

(2) Early Commercial Station (EC): the stations are financially viable with little government

support. They are sized to support growing demand in a promising market region and to

ensure adequate return on investment. The station design enables cost reductions because

it is replicable.

(3) More Stations (MS): Same EC deployed in larger numbers.

(4) Larger Stations (LS): identical to EC, but designed for higher volume output, with 2000

kg/day as an upper limit. MS and LS are installed later than EC stations.

Table-4 shows the cost estimates of the four classes of stations based on HSCC model. This

model also simulates station costs in the state of California over time from 2009 to 2030. This

result as well as its comparison to other models is shown in Figure-4.[17] It predicts that the

station cost will rapidly drop as EC begin to install in a 2014-2018 timeframe. With a nominal

capacity of 450 kg/day, an average capital investment of $2.8 million per station is estimated.

And the cost will continue to decline at a slower rate and reach $3200 per kg/day at 2025, which

aligns with the low UCD prediction of liquid H2 delivery stations.

Table-4. Cost estimates for hydrogen fueling stations based on the HSCC model. Station Attribute SOTA EC MS LS

Introduction timeframe 2011-2012 2014-2016 after 2016 after 2016 Total Capacity (kg/day) 160 450 600 1500

Utilization (%) 57 74 76 80

Capital cost per capacity ($/kg/day) 16570 6220 5150 3370 Total capacity ($M) 2.65 2.8 3.09 5.05

12

The station cost reduction will play a crucial role in the successful introduction of FCEVs.

Above mentioned models and real-world examples demonstrate the importance of more and

larger stations. In addition, a feedback from a “Hydrogen Infrastructure Market Readiness”

workshop hosted by NREL in concludes the following strategies for the reduction of station

costs:[18]

(1) Expand and enhance supply chains for production of high-performance, lower-cost parts.

(2) Reduce cost of hydrogen compression

(3) Develop high-pressure hydrogen delivery and storage components.

(4) Develop standard station designs.

(5) Harmonize/standardize dispensing equipment specifications.

(6) Develop “type approvals” for use in permitting.

(7) Improve information and training available to safety and code officials.

(8) Develop mechanisms for planning station rollouts and sharing early market information.

Figure-4. Cost estimate of hydrogen fueling stations in California between 2009 and 2030.

13

5. HYDROGEN FUELING STATIONS ROLLOUT STRATEGY California has been a leading advocate for fuel cell transportation technologies. In 2012-2013 the

State redoubled efforts to expand hydrogen fueling station deployments in preparation for

anticipated introduction of commercial fuel cell vehicles by major auto makers starting in 2015-

2017. CaFCP propose a set of evaluation criteria to steer the station build-out:[1]

(1) Does it add capacity in one of the early market communities in the timeframes needed?

(2) Does it support automakers plans for customer locations?

(3) Does the station have a stated plan for customer service enhancements (hours of

operation, on-site attendant, signage, etc.)?

(4) Does it help bridge a distance between several other existing stations?

(5) Does it include new hydrogen production or storage technology identified by CEC,

CARB or DOE as a need or transitional technology?

(6) Does it provide renewable hydrogen?

(7) Does it provide fuel for non-vehicle applications (combined heat/power, forklifts, etc)?

(8) Does it provide opportunities for local business or local jobs?

The hydrogen fueling station rollout strategy has evolved over time. One of the earliest policy

initiatives was aimed at creating a “hydrogen highway” with hydrogen stations every 20 miles

along highways in California. This plan would have created many underutilized stations as many

would be located in rural areas and would not benefit the early FCEV adopters. A second policy

proposed placements of hydrogen stations according to population density within major

metropolitan areas in the state. It failed to consider that different cities or areas may adopt the

technology at a different rate. Currently, “clustering” strategies are considered a more realistic

approach for early stations siting with efficient use of stations at low cost. Clustering focuses on

introduction of both hydrogen vehicles and refueling stations in a limited number of geographic

areas such as smaller cities (e.g. Santa Monica, Irvine) within a larger region (e.g. the Los

Angeles Basin). By concentrating early stations in a cluster area, a certain level of consumer

convenience can be achieved with minimum number of strategically planed stations. Connector

stations can be added to facilitate travel between clusters to create a hydrogen transportation

network.

14

A good example of a “cluster” rollout strategy is a study conducted by the Institute of

Transportation Studies at UCD.[19] They researched 12 clusters in the Los Angeles Basin areas

that are likely to have most early FCEV adopters. The approximate boundaries of the clusters are

shown in Figure-5. They utilized the population density and traffic flow information within the

clusters to analyze consumer convenience of early station networks. In this study, the total

hydrogen demand is estimated based on an average of 0.7 kg hydrogen per day (a mid-size

FCEV wit fuel economy of 60 miles per kg, driven 15,000 miles per year). The utilization

efficiency was assumed to be 70% of maximum capacity. Therefore, all scenarios have a total

hydrogen station capacity of at least 1 kg per day for each FCEV. They also conducted workshop

and interviews for different stakeholders and concluded several underlying factors to consider

when planning the number, location, size and type of stations:

(1) It is important to locate the stations near early adopters to render a short travel time from

drivers’ homes to the stations.

(2) A minimum of 2 stations is needed per cluster to ensure reliability.

(3) The stations should offer easy, quick, and familiar, or even a new “high-tech” setting to

increase customer acceptance

(4) Station capital cost and operating costs.

(5) Technology readiness greatly determines the size and type of stations.

(6) California requires that state-funded hydrogen stations derive 33% of the hydrogen from

renewable sources. It may cause some trade-off between economics and sustainability.

UCD’s model predicts transition paths starting with 8 stations in 4 clusters in 2009 to 2011, and

developing to 20 stations in 6 cluster in 2012 to 2014, and eventually 42 stations in all 12

clusters in 2015 to 2017 (Table-5). The number of connection stations also increases to connect

clusters. The later-introduced stations also increase in capacities from the initial 100 kg/day to

1000 kg/day. The hydrogen cost and average travel time decreases due to the economics of scale

and increased density of stations.

15

Table-5. Hydrogen fueling station rollout strategy by UCD. 2009-2011

636 FCEVs 2012-2014 3442 FCEVs

2015-2017 25000 FCEVs

# Stations 8 20 42

# Clusters 4 (2 Sta./Cluster) 6 (3 Sta/Cluster) 12 (3 Sta./Cluster)

# Conn. Sta. 0 2 6

Station Mix 4 mobile refuelers 4 SMRs(100kg.day)

8 mobile refuelers 12 SMRs(250kg.day)

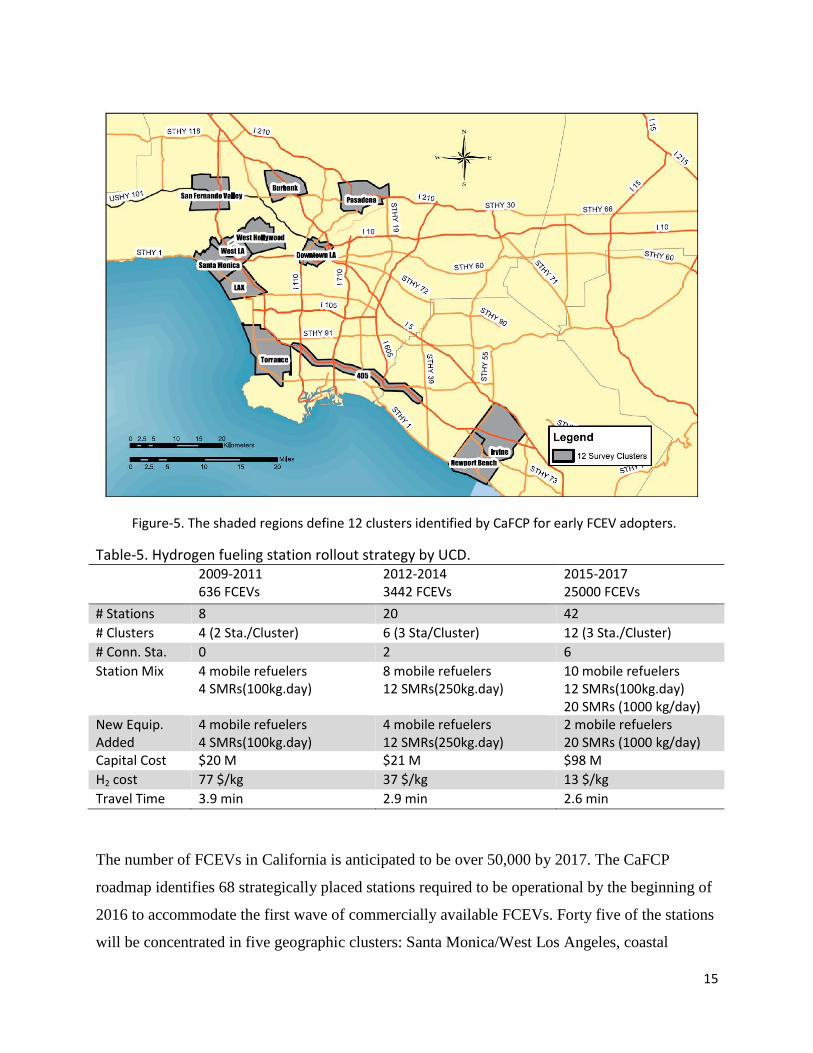
10 mobile refuelers 12 SMRs(100kg.day) 20 SMRs (1000 kg/day)

New Equip. Added

4 mobile refuelers 4 SMRs(100kg.day)

4 mobile refuelers 12 SMRs(250kg.day)

2 mobile refuelers 20 SMRs (1000 kg/day)

Capital Cost $20 M $21 M $98 M

H2 cost 77 $/kg 37 $/kg 13 $/kg

Travel Time 3.9 min 2.9 min 2.6 min

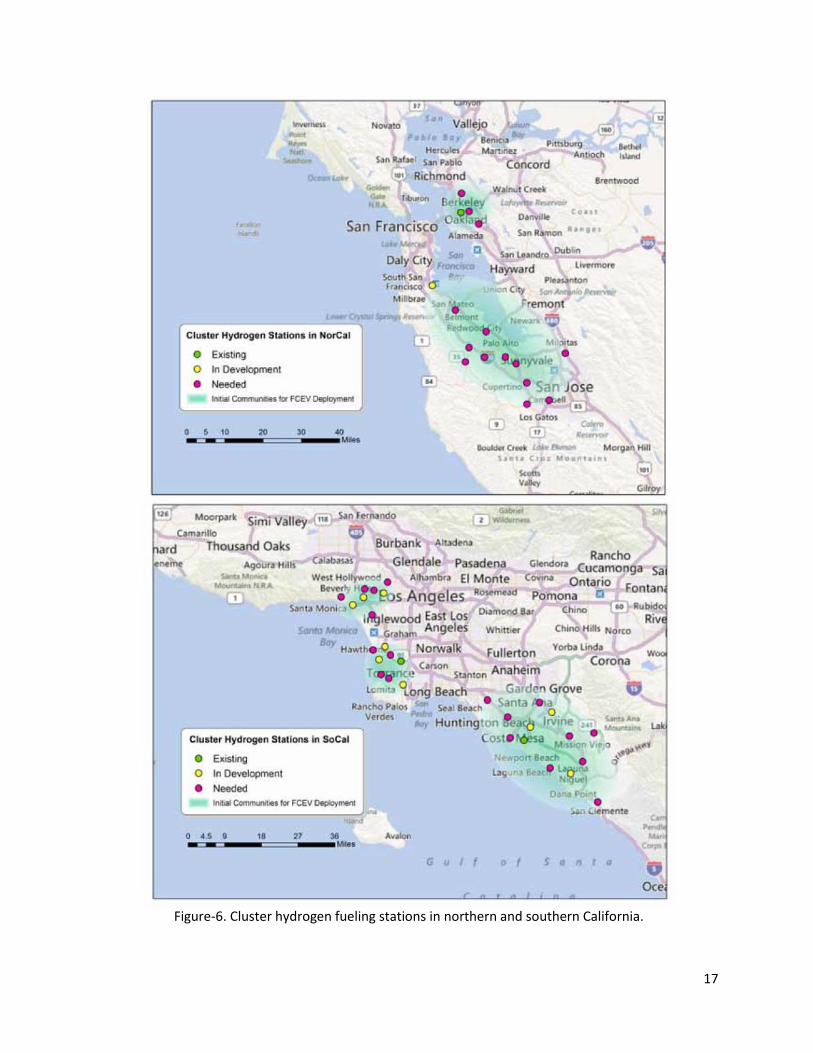
The number of FCEVs in California is anticipated to be over 50,000 by 2017. The CaFCP

roadmap identifies 68 strategically placed stations required to be operational by the beginning of

2016 to accommodate the first wave of commercially available FCEVs. Forty five of the stations

will be concentrated in five geographic clusters: Santa Monica/West Los Angeles, coastal

Figure-5. The shaded regions define 12 clusters identified by CaFCP for early FCEV adopters.

16

Southern Orange County, and Torrance with nearby coastal cities, Berkeley, and San Francisco

South Bay. An additional 23 stations will be seeding other early markets as well as connecting

these clusters into a regional hydrogen network.[20] As of July 2012, California has 19 hydrogen

stations in operation or planned (either new construction or expansion of existing stations). The

National Fuel Cell Research Center, a CaFCP member, analyzed the clusters with their Spatially

& Temporally Resolved Energy & Environment Tool (STREET) model to determine the

locations of the stations in the above mentioned five clusters. The optimal results of the 45

stations are displayed in Figure-6. The concentration is the hydrogen stations is equivalent to ~5-

7% of existing gasoline stations within a cluster, providing a maximum of 6 minutes travel time

between stations. The estimated incentive funding for all 68 stations are $65-67 millions. If the

initial “clustering” build-out strategy of hydrogen infrastructure in California is successful, it

may be adopted by other U.S. states to eventually build a nationwide hydrogen transportation

network.

17

Figure-6. Cluster hydrogen fueling stations in northern and southern California.

18

6. CONCLUSIONS AND FUTURE WORK The biggest obstacle to introducing FCEVs to the market is the lack of hydrogen fueling

infrastructure. A hydrogen infrastructure rollout is a significant undertaking that requires careful

planning, synergistic efforts among governments, academia, and industrial stakeholders.

Our research has thus far identified the most feasible types of hydrogen fueling stations: (1)

stations relying on hydrogen produced in centralized locations and delivered via liquid hydrogen

trucks, compressed hydrogen tube trailers, or pipelines; (2) stations with onsite hydrogen

production from water electrolyzers or steam methane reformers. Hydrogen can be produced in

centralized facilities at relatively low costs but with additional delivery costs. The onsite

production of hydrogen at fueling stations (i.e., forecourt hydrogen) eliminates transportation and

delivery costs, but the hydrogen production costs are likely to be higher due to small scales.

Hydrogen can be produced in centralized facilities at relatively low costs, but the delivery costs

may be higher than the onsite produced hydrogen. On the other hand, onsite produced hydrogen

stations can eliminate delivery costs, but the hydrogen production costs are likely to be higher.

The onsite hydrogen production stations are most suitable for remote areas with smaller

consumer concentration while stations relying on hydrogen delivery are more suited for urban

areas with high demand. Stations should equip with both 35 MPa and 70 MPa dispensers to

cover both types of FCEVs. Smaller scale fueling stations (100-350kg/day) are likely to be

installed to accommodate early markets. Larger stations with 1000+ kg/day capacity will be

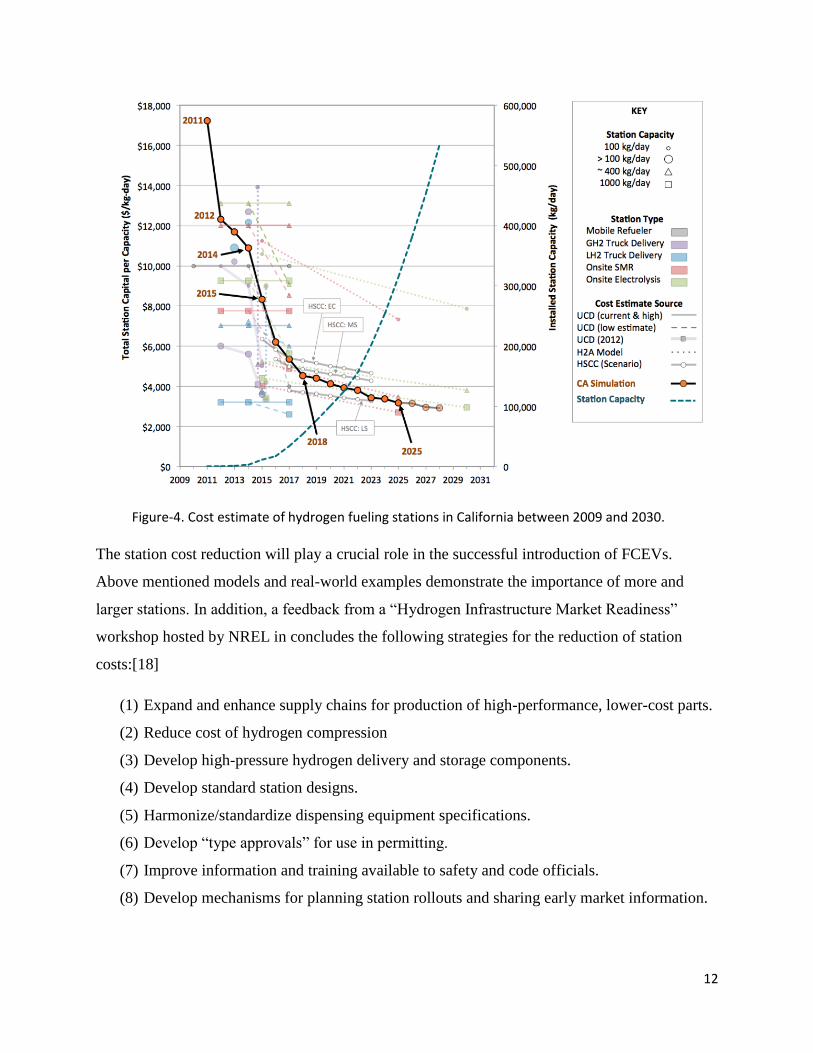
economically favored as more consumers adopt FCEV transportation. The costs of fueling

stations will drop due to the lowering cost of components, standardization of station design, and

economies of scale. The projected capital cost per capacity of fueling stations is $3200/kg/day by

2025. Government incentives and funding are critical in the early stages of building and

operating hydrogen fueling stations in selected geographic “clusters.” The clusters with

strategically placed fueling stations will serve as seeding elements to spur FCEV market growth.

When planning to build a hydrogen fueling station, there are currently sixteen categories of

codes and standards to follow. New codes and standards are still under development to

accommodate the fast development of fuel cell and fueling station technologies.

California is a leading state in implementing hydrogen fueling infrastructures. Sixty-eight

stations are anticipated by the beginning of 2016, forty-five of which will be concentrated in the

19

San Francisco and Los Angeles areas. The lessons learned during the station planning, building,

and operation will be valuable for other states planning on constructing or expanding their

hydrogen infrastructures.

In the next report, we will attempt to perform a case study on a fuel cell/battery hybrid bus

recently acquired by NASA - Kennedy Space Center. We will evaluate FCEV technologies in

the aspects of fuel cell system efficiency, range, durability, and lifespan given current catalyst,

membrane and hydrogen storage system technology and identify obstacles for mass production.

We will compare the “well to wheel” hydrogen production cost and greenhouse gas generation to

fossil fuels and other alternative fuels. We will also collate data to project consumer costs of

FCEVs.

20

7. APPENDIX

Figure-A2. A configuration of an onsite electrolysis station.

Figure-A1. A configuration of an onsite SMR station.

21

Figure-A4. A configuration of a hydrogen station with liquid hydrogen delivery.

Figure-A3. A configuration of a hydrogen station with gaseous hydrogen delivery.

22

Figure-A5. A configuration of a hydrogen station with pipeline delivery.

Figure-A6. A configuration of a hydrogen mobile refueler.

23

8. REFERENCES [1] "Hydrogen fuel cell vehicle and station deployment plan: a strategy for meeting the challenge

ahead," California Fuel Cell Partnership2009. [2] J. J. Brey, A. F. Carazo, and R. Brey, "Analysis of a hydrogen station roll-out strategy to introduce

hydrogen vehicles in Andalusia," International Journal of Hydrogen Energy, vol. 39, pp. 4123-4130, 2014.

[3] J. Weinert, "A near-term economic analysis of hydrogen fueling stations," Master Thesis, Institue of Transportation Studies, University of California, Davis, 2005.

[4] T. Lipman, M. Witt, and M. Elke, "Lessons learned from the installation an operation of northerm California's first 70-MPa hydrogen fueling station," International Journal of Hydrogen Energy, vol. 38, pp. 15868-15877, 2013.

[5] F. Oney, T. N. Vezirolu, and Z. Dulger, "Evaluation of pipline transportation of hydrogen and natural gas mixtures," International Journal of Hydrogen Energy, vol. 19, pp. 813-822, 1994.

[6] "HyWays final report-socio/economic analysis phase II," European Commission DG Research2007.

[7] T. Brown, S. Stephens-Romero, and G. S. Samuelsen, "Quantitative analysis of a successful public hydrogen station," International Journal of Hydrogen Energy, vol. 37, pp. 12731-12740, 2012.

[8] T. Rockward, C. Quesada, K. Rau, E. Brosha, F. Garzon, and R. Mukundan, "Hydrogen Fuel Quality," DOE Hydrogen and Fuel Cells Program FY 2013 Annual Progress Report2013.

[9] V. Mohan, A. Shah, J. W. Sheffield, and K. B. Martin, "Design of a hydrogen community," International Journal of Hydrogen Energy, vol. 37, pp. 1214-1219, 2012.

[10] S. Stephens-Romero and G. S. Samuelsen, "Demonstration of a Novel Assessment methodology for hydrogen infrastructure deployment," International Journal of Hydrogen Energy, vol. 34, pp. 628-641, 2009.

[11] "SAE J2601: Fueling Protocols for Light Duty Gaseous Hydrogen Surface Vehicles," SAE International2010.

[12] "Hydrogen Vehicle and Infrastructure Codes and Standards Citations," National Renewable Energy Laboratory.

[13] http://www.fuelcellstandards.com/home.html. [14] http://cafcp.org/station_codes_standards_and_regulations. [15] http://www.hydrogen.energy.gov/h2a_analysis.html. [16] J. Ogden, J. Cunningham, and M. Nicholas, "Roadmap for hydrogen and fuel cell vehicles in

California: a transition strategy through 2017," University of California-Davis Institute of Transportation Studies2010.

[17] M. Melaina and M. Penev, "Hydrogen station cost estimates-comparing hydrogen station cost calculator results with other recent estimates," National Renwable Energy Laboratory2013.

[18] M. W. Melaina, D. Steward, and M. Penev, "Hydrogen infrastructure market readiness: opportunities and potential for near-term cost reductions," National Renewable Energy Laboratory2012.

[19] J. Ogden and M. Nicholas, "Analysis of a "cluster" strategy for introducing hydrogen vehicles in southern California," Energy Policy, vol. 39, pp. 1923-1938, 2011.

[20] "A California Road Map: Bringing hydrogen fuel cell electric vehicles to the golden state," California Fuel Cell Partnership2012.


Recommended