Hydrogen production by photocatalytic water-splitting using nitrogen and metal co-doped TiO 2 powder photocatalyst Munevver Zeynep Selcuk • Mehtap Safak Boroglu • Ismail Boz Received: 13 September 2011 / Accepted: 29 February 2012 / Published online: 18 March 2012 Ó Akade ´miai Kiado ´, Budapest, Hungary 2012 Abstract Nitrogen-doped titanium dioxide (N–TiO 2 ) powders were synthesized by hydrolysis and used as a support for doping with various metals, such as, Fe, Cr, Ni, and Pt. Aqueous solutions of metal salts were used as a metal source and metals were deposited on N–TiO 2 powders. Ni–N–TiO 2 catalysts with various nickel concentrations were studied in detail. X-ray diffraction and diffuse reflectance spectrophotometry were used for the characterization of the photocatalysts. The Ni–N–TiO 2 photocatalysts were then tested in photocatalytic water splitting under visible light. The optimum dopant concentration was found to be 10 lmol Ni/g N–TiO 2 for Ni–N–TiO 2 . The photocatalyst, Ni–N–TiO 2 , has shown a stable and high activity, 490 lmol of H 2 g cat -1 h -1 for the first 6 h of operation. Keywords Photocatalysis Nitrogen-doped TiO 2 Metal loading Ni-doping H 2 evolution Introduction Non-renewable energy resources, such as coal, petroleum products, etc., supply the most of the world’s energy requirements but these energy resources are rapidly depleting. Hydrogen is an alternative clean energy carrier, which satisfies the environmental and energy requirements. Since Fujishima and Honda [1] first reported the photocatalytic activity of TiO 2 to generate hydrogen by M. Z. Selcuk M. S. Boroglu I. Boz (&) Department of Chemical Engineering, Faculty of Engineering, Istanbul University, Avcilar, 34320 Istanbul, Turkey e-mail: [email protected]123 Reac Kinet Mech Cat (2012) 106:313–324 DOI 10.1007/s11144-012-0434-4
Transcript
Hydrogen production by photocatalytic water-splittingusing nitrogen and metal co-doped TiO2 powderphotocatalyst
Munevver Zeynep Selcuk • Mehtap Safak Boroglu •
Ismail Boz
Received: 13 September 2011 / Accepted: 29 February 2012 / Published online: 18 March 2012
� Akademiai Kiado, Budapest, Hungary 2012
Abstract Nitrogen-doped titanium dioxide (N–TiO2) powders were synthesized
by hydrolysis and used as a support for doping with various metals, such as, Fe, Cr,
Ni, and Pt. Aqueous solutions of metal salts were used as a metal source and metals
were deposited on N–TiO2 powders. Ni–N–TiO2 catalysts with various nickel
concentrations were studied in detail. X-ray diffraction and diffuse reflectance
spectrophotometry were used for the characterization of the photocatalysts. The
Ni–N–TiO2 photocatalysts were then tested in photocatalytic water splitting under
visible light. The optimum dopant concentration was found to be 10 lmol Ni/g
N–TiO2 for Ni–N–TiO2. The photocatalyst, Ni–N–TiO2, has shown a stable and
high activity, 490 lmol of H2 gcat-1 h-1 for the first 6 h of operation.
Hydrogen production by photocatalytic water-splitting 317
123
The UV–Vis absorption spectra of TiO2, N–TiO2, Fe–N–TiO2, Cr–N–TiO2,
Ni–N–TiO2 and Pt–N–TiO2 photocatalyst samples are presented in Fig. 3. The
spectra of all photocatalysts showed a major absorption peak ending at around
380 nm in the UV region. When doped with metal ontoN-TiO2, slight upright and
albeit red shift of the peak towards the visible range at around 400–800 nm occurred
for all the samples. Because of doping by nitrogen and metal, visible light
absorption above 380 nm was created as indicated by shoulders in the absorption
spectra. The visible light absorption was due to excitations of electrons in 3d bands
to the conduction band of N–TiO2. Appreciable shift was not anticipated under
visible light because of wide band gap nature of N–TiO2.
It was found that, after being treated under ammonia solution vapor atmosphere,
the TiO2 powder changed its color from white to pale canary yellow, and after
doping with metals, the Me–N–TiO2 powder changed its color from pale canary
yellow to dirty yellow. In general, the color of a solid was determined by the
position of its absorption edge; a slight shift of the absorption edge towards a higher
wavelength could result in slight absorption in the visible range of spectra [14]. In
Fig. 3, small absorption shoulders (at 430 and 450 nm) were observed in the visible
region too. This was a characteristic feature of nitrogen doping [15]. The energy
band gap (Eg; eV) is determined by extrapolating of the onset of the rising part to x-
axis (k, nm) of the plots and calculation Eg = 1,240/k and band gaps are tabulated
in Table 1. The calculated band gap values also did not point out an appreciable
change due to metal doping.
UV–Vis absorption spectra of Ni–N–TiO2 with different nickel doping concen-
tration are presented in Fig. 4. It was apparent that all samples doped with nitrogen
and/or Ni have shown small shoulders (at 430 and/or 450 nm) and slightly increased
300 400 500 600 7000.0
0.5
1.0
1.5
2.0
2.5
Abs
orba
nce
(a.u
.)
Wavelength (nm)
TiO2
N-TiO2
Fe-N-TiO2
Cr-N-TiO2
Ni-N-TiO2
Pt-N-TiO2
Fig. 3 The UV–Vis absorption spectra of TiO2, N–TiO2, Fe–N–TiO2, Cr–N–TiO2, Ni–N–TiO2 and Pt–N–TiO2 photocatalyst samples
318 M. Z. Selcuk et al.
123
absorbance in the visible range. It has been reported that metal doping could form a
dopant energy level within the band gap of TiO2. The electronic transitions from the
valence band to dopant level or from the dopant level to the conduction band can
effectively show changes in the band edge adsorption threshold [16]. Band gaps
calculated from the extension of the imaginary slopes onto the x-axis are tabulated
in Table 2.
SEM images (Fig. 5a, b) of the Ni–N–TiO2 (10) photocatalyst demonstrated that
the calcination of the solid precursor at 450 �C in ammonia solution vapor
atmosphere resulted in rather homogeneous powder, while the energy dispersive
X-ray (EDX) analysis (Fig. 5c) revealed that nickel particles existed on Ni–N–TiO2
(10) photocatalyst. By using EDX, the presence of nitrogen cannot be observed.
However, there was indirect evidence that proved the presence of the nitrogen on
TiO2. The proof was the slight red shift and increase in absorbance observed on the
absorption spectrum (Figs. 3, 4) of N–TiO2and Me–N–TiO2 photocatalysts.
The photocatalytic activity of the TiO2, N–TiO2 and metal–N–TiO2 was
quantitatively followed in an aqueous methanol solution for a typical six hours of
Table 1 Band gaps of TiO2, N–
TiO2, Fe–N–TiO2, Cr–N–TiO2,
Ni–N–TiO2 and Pt–N–TiO2
photocatalyst samples
Catalysts x-intercept (nm) Band Gap (eV)
TiO2 379.0 3.27
N–TiO2 401.0 3.09
Fe–N–TiO2 401.3 3.09
Cr–N–TiO2 402.4 3.08
Ni–N–TiO2 403.0 3.08
Pt–N–TiO2 409.4 3.03
300 400 500 600 7000
1
2
Abs
orba
nce
(a.u
.)
Wavelength (nm)
Ni-N-TiO2 (10)
Ni-N-TiO2 (20)
Ni-N-TiO2 (50)
Ni-N-TiO2 (100)
Ni-N-TiO2 (500)
Ni-N-TiO2 (5000)
Fig. 4 The UV–Vis absorption spectra of Ni–N–TiO2 with various nickel doping levels
Hydrogen production by photocatalytic water-splitting 319
123
operation under visible light irradiation. As shown in Figs. 6 and 7, the amounts of
H2 produced were constant with the irradiation times up to 6 h. The slope of straight
line showed the rate of hydrogen evolution and, in the first 6 h of operation, all the
catalysts exhibited a constant rate of hydrogen production. In Fig. 6, the activities of
Table 2 Band gaps of Ni–N–
TiO2 (10), Ni–N–TiO2 (20), Ni–
N–TiO2 (50), Ni–N–TiO2 (100),
Ni–N–TiO2 (500) and Ni–N–
TiO2 (5,000) photocatalyst
samples
Photocatalysts x-intercept (nm) Band Gap (eV)
Ni–N–TiO2 (10) 406.2 3.05
Ni–N–TiO2 (20) 405.0 3.06
Ni–N–TiO2 (50) 403.0 3.08
Ni–N–TiO2 (100) 401.5 3.09
Ni–N–TiO2 (500) 400.0 3.10
Ni–N–TiO2 (5,000) 399.0 3.11
Fig. 5 SEM images and EDX analysis of Ni–N–TiO2 (10) photocatalyst
320 M. Z. Selcuk et al.
123
Fe–N–TiO2 and Cr–N–TiO2 were considerably lower than those of TiO2 and
N–TiO2. However, the activity of Pt–N–TiO2and Ni–N–TiO2 (Fig. 7) were much
higher than that of N–TiO2 in the hydrogen generation [17, 18]. While cumulative
hydrogen production of Pt–N–TiO2 catalyst was 11,620 lmol, hydrogen production
of Ni–N–TiO2 catalyst was 2,946 lmol for the first 6 h of irradiation. Durability was
an important parameter in the selection of photocatalysts. The hydrogen production
reaction was an activated process and the photons absorbed on the surface of catalyst
1 2 3 4 5 6
0
60
120
180
240
300
360
Cum
ulat
ive
Hyd
roge
n P
rodu
ctio
n (µ
mol
)
Irradiation Time (h)
TiO2
N-TiO2
Fe-N-TiO2
Cr-N-TiO2
Fig. 6 Cumulative hydrogen evolution profiles of TiO2, N–TiO2, Fe–N–TiO2 and Cr–N–TiO2 (thephotocatalytic water splitting in 10 % methanol aqueous solution under the irradiation of visible light)
1 2 3 4 5 6
0
2000
4000
6000
8000
10000
12000
Irradiation Time (h)
TiO2 N-TiO2 Ni-N-TiO2 Pt-N-TiO
2
Cum
ulat
ive
Hyd
roge
n P
rodu
ctio
n (µ
mol
)
Fig. 7 Cumulative hydrogen evolution of TiO2, N–TiO2, Ni–N–TiO2 and Pt–N–TiO2. (thephotocatalytic water splitting in 10 % methanol aqueous solution under the irradiation of visible light)
Hydrogen production by photocatalytic water-splitting 321
123
increased with an increase in the irradiation time, which in turn helped in the
photodecomposition process. The activity results proved that Ni–N–TiO2 would be a
reliable alternative photocatalyst to a costly Pt–N–TiO2 for the methanol/water
photocatalytic decomposition, hence Ni–N–TiO2 was chosen for further study with
varying concentrations of nickel loadings.
The Ni–N–TiO2 photocatalysts with following loading levels (10, 20, 50, 100, 500,
5000 lmol Ni/g N–TiO2) were also tested. Fig. 8 showed the effect of various Ni
dopant concentrations. The deposition of Ni on N–TiO2 resulted in a substantial
improvement in the H2 evolution. In Fig. 8, Ni–N–TiO2 (10, 20, 50, 100 lmol of Ni)
samples showed much higher photocatalytic activity compared with undoped N–TiO2.
When the Ni doping concentration increased above 100 lmol, the photocatalytic
activities of Ni–N–TiO2 decreased abruptly. This was probably due to the surface
coverage by nickel particles so that the light absorption by N–TiO2 decreased too. It was
concluded that the H2 evolution rate depended on the Ni loading. The higher
photocatalytic activity of Ni-doped samples with increasing Ni loading up to 100 lmol
could be due to the improved dispersion of Ni nanoparticles over N–TiO2 photocatalyst.
Ni nanoparticles behaved as an electron sink to promote the interfacial charge transfer
process, subsequently enhancing the charge separation in/on the photocatalyst [6].
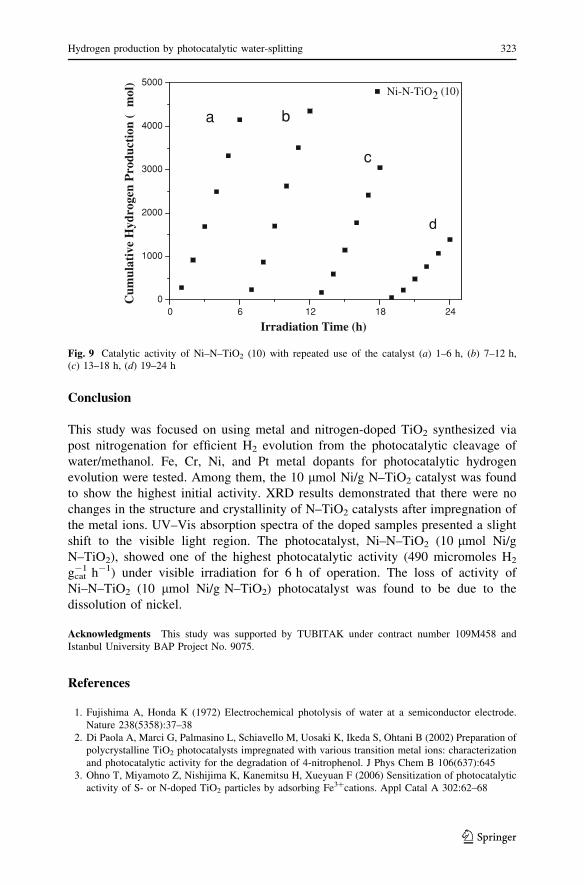
The Ni–N–TiO2 (10) sample exhibited the highest hydrogen synthesis activity.
Therefore, the time-on-stream behavior was studied on Ni–N–TiO2 (10) photocat-
alyst. Fig. 9 exhibits H2 production rates with consecutive and repeated use of the
same Ni–N–TiO2 (10) photocatalyst. As shown in Fig. 9, the catalytic activity
decreased slightly after 12 h. The concentration of nickel dissolved in the aqueous
medium after filtration of photocatalysts particles showed that nickel dissolution in
appreciable ratios occurred by time-on-stream after 24 h of operation. The
dissolution of nickel dopant was considered to be the major deactivation process.
1 2 3 4 5 6
0
500
1000
1500
2000
2500
3000
3500
4000
4500
Irradiation Time (h)
N-TiO2 Ni-N-TiO2 (10)
Ni-N-TiO2 (20)
Ni-N-TiO2 (50)
Ni-N-TiO2 (100)
Ni-N-TiO2 (500)
Ni-N-TiO2 (5000)
Cum
ulat
ive
Hyd
roge
n P
rodu
ctio
n (µ
mol
)
Fig. 8 Cumulative hydrogen evolution of N–TiO2 and Ni–N–TiO2, (10, 20, 50,100, 500, 5000) in thephotocatalytic water splitting in 10 % methanol aqueous solution under the irradiation of visible light
322 M. Z. Selcuk et al.
123
Conclusion
This study was focused on using metal and nitrogen-doped TiO2 synthesized via
post nitrogenation for efficient H2 evolution from the photocatalytic cleavage of
water/methanol. Fe, Cr, Ni, and Pt metal dopants for photocatalytic hydrogen
evolution were tested. Among them, the 10 lmol Ni/g N–TiO2 catalyst was found
to show the highest initial activity. XRD results demonstrated that there were no
changes in the structure and crystallinity of N–TiO2 catalysts after impregnation of
the metal ions. UV–Vis absorption spectra of the doped samples presented a slight
shift to the visible light region. The photocatalyst, Ni–N–TiO2 (10 lmol Ni/g
N–TiO2), showed one of the highest photocatalytic activity (490 micromoles H2
gcat-1 h-1) under visible irradiation for 6 h of operation. The loss of activity of
Ni–N–TiO2 (10 lmol Ni/g N–TiO2) photocatalyst was found to be due to the
dissolution of nickel.
Acknowledgments This study was supported by TUBITAK under contract number 109M458 and
Istanbul University BAP Project No. 9075.
References
1. Fujishima A, Honda K (1972) Electrochemical photolysis of water at a semiconductor electrode.
Nature 238(5358):37–38
2. Di Paola A, Marci G, Palmasino L, Schiavello M, Uosaki K, Ikeda S, Ohtani B (2002) Preparation of
polycrystalline TiO2 photocatalysts impregnated with various transition metal ions: characterization
and photocatalytic activity for the degradation of 4-nitrophenol. J Phys Chem B 106(637):645
3. Ohno T, Miyamoto Z, Nishijima K, Kanemitsu H, Xueyuan F (2006) Sensitization of photocatalytic
activity of S- or N-doped TiO2 particles by adsorbing Fe3?cations. Appl Catal A 302:62–68
0 6 12 18 240
1000
2000
3000
4000
5000
Irradiation Time (h)
Ni-N-TiO2 (10)
a b
c
d
Cum
ulat
ive
Hyd
roge
n P
rodu
ctio
n (µ
mol
)
Fig. 9 Catalytic activity of Ni–N–TiO2 (10) with repeated use of the catalyst (a) 1–6 h, (b) 7–12 h,(c) 13–18 h, (d) 19–24 h
Hydrogen production by photocatalytic water-splitting 323
123
4. Sun D, Xu S (2009) Significant improvement of photocatalytic hydrogen generation rate over TiO2
with deposited CuO. Int J Hydrogen Energy 34:6096–6104
5. Jing D, Zhang Y, Guo Y (2005) Study on the synthesis of Ni doped mesoporous TiO2 and its
photocatalytic activity for hydrogen evolution in aqueous. Chem Phys Lett 415:74–77
6. Kim HG, Jeong ED, Hong TE, Yoon JH, Jin JS, Bae SW, Borse PH, Hong SJ, Jang JS, Lee JS (2007)
Photophysical properties of nanosized metal-doped TiO2 photocatalyst working under visible light.
J Korean Phys Soc 51:22–26
7. Sato S (1986) Photocatalytic activity of NOx-doped TiO2 in the visible light region. Chem Phys Lett
123:126–128
8. Asahi R, Morikawa T, Ohwaki T, Aoki K, Taga Y (2001) Visible-light photocatalysis in nitrogen-
doped titanium oxides. Science 293:269–271
9. Irie H, Watanabe Y, Hashimato K, (2003) Nitrogen concentration dependence on photocatalytic
activity of TiO2-xNx powders. J Phys Chem B, 5483–5486
10. Kuroda Y, Mori T, Yagi K, Makihata N, Kawahara Y, Nagao M, Kittaka S (2005) Preparation of
visible-light-responsive TiO2-xNx photocatalyst by a sol gel method: analysis of the active center on
TiO2 that reacts with NH3. Langmuir 21:8026–8034
11. Ohno T, Akiyoshi M, Umebayashi T, Asai K, Mitsui T, Matsumura M (2004) Preparation of S-doped
TiO2 photocatalysts and their photocatalytic activities under visible light. Appl Catal A 265:115–121
12. Xiao Q, Ouyang L (2009) Photocatalytic activity and hydroxyl radical formation of carbon-doped
TiO2 nanocrystalline: effect of calcination temperature. Chem Eng J 148:248–253
13. Aries AM, Adan C, Bahamonde A, Garcia MF (2007) Structure and activity of nanosized iron-doped
anatase TiO2 catalysts for phenol photocatalytic degradation. Appl Catal B 72:11–17
14. Sun J, Qiao L, Sun S, Wang G (2008) Photocatalytic degradation of orange G on nitrogen-doped
TiO2 catalysts under visible light and sunlight irradiation. J Hazard Mater 155:312–319
15. Yang S, Gao L (2004) New method to prepare nitrogen-doped titanium dioxide and its photocatalytic
activities irradiated by visible light. J Am Ceram Soc 87:1803–1805
16. Tayade RJ, Kulkarni RG, Jasra RV (2006) Transition metal ion impregnated mesoporous TiO2 for
photocatalytic degradation of organic contaminants in water. Ind Eng Chem Res 45:5231–5238
17. Lin WC, Yang WD, Huang IL, Wu TS, Chung ZJ (2009) Hydrogen production from methanol/water
photocatalytic decomposition using Pt/TiO2-xNx catalyst. Energy Fuels 23:2192–2196
18. Cui W, Feng L, Xu C, Lu S, Qiu F (2004) Hydrogen production by photocatalytic decomposition of
methanol gas on Pt/TiO2 nano-film. Catal Commun 5:533–536
19. Gao L, Zhang Q, Guo J (2000) Effects of calcination on the photocatalytic properties of nanosized
TiO2 powders prepared by TiCl4 hydrolysis. Appl Catal B26:207–215