Page 1
Hydrogen Production Using Catalytic
Supercritical Water Gasification of
Lignocellulosic Biomass
by
Pooya Azadi Manzour
A thesis submitted in conformity with the requirements
for the degree of Doctor of Philosophy
Graduate Department of Chemical Engineering and Applied Chemistry
University of Toronto
© Copyright by Pooya Azadi Manzour 2012
Page 2
ii
Hydrogen Production Using Catalytic Supercritical Water
Gasification of Lignocellulosic Biomass
Pooya Azadi Manzour
Doctor of Philosophy
Department of Chemical Engineering and Applied Chemistry
University of Toronto
2012
Abstract
Catalytic supercritical water gasification (SCWG) is a promising technology for
hydrogen and methane production from wet organic feedstocks at relatively low
temperatures (e.g. <500 oC). However, in order to make this process technically and
economically viable, solid catalyst with enhanced activity and improved hydrogen
selectivity should be developed. In this study, different aspects of catalytic SCWG have
been investigated. The performance of several supported-nickel catalysts were examined
to identify catalysts that lead to high carbon conversion and high hydrogen yields under
near-critical conditions (i.e. near 374 oC). Moreover, for the first time, the effects of
several parameters which dominated the activity of the supported nickel catalysts have
been systematically investigated. Among the several different catalyst supports evaluated
at 5% nickel loading, α-Al2O3, carbon nanotube (CNT), and MgO supports resulted in
Page 3
iii
highest carbon conversions, while SiO2, Y2O3, hydrotalcite, yttria-stabilized zirconia
(YSZ), and TiO2 showed modest activities. Comparing the XRD patterns for the support
materials before and after the exposure to supercritical water, α-Al2O3, YSZ, and TiO2
were found to be hydrothermally stable among the metal oxide supports. Using the same
amount of nickel on α-Al2O3, the methane yield decreased by increasing the nickel to
support ratio whereas the carbon conversion was only slightly affected. At a given nickel
to support ratio, a threefold increase in methane yield was observed by increasing the
temperature from 350 to 410 oC. The catalytic activity also increased by the addition
small quantity of potassium. The activity of Ni/γ-Al2O3 catalyst varied based on the
affinity of the catalyst to form nickel aluminate spinel. This is also the first report on the
role of oxidative pretreatment of the carbon nanotubes by nitric acid on the performance
of these catalysts for the supercritical water gasification process. Using different
lignocellulosic feeds, it was found that the gasification of glucose, fructose, cellulose,
xylan and pulp resulted in comparable gas yields (± 10%) after 60 min, whereas alkali
lignin was substantially harder to gasify. Interestingly, gasification yield of bark, which
had a high lignin content, was comparable to those of cellulose. In summary, the Ni/α-
Al2O3 catalyst had a higher hydrogen selectivity and comparable catalytic activity to the
best commercially available catalysts for SCWG of carbohydrates.
Page 4
iv
Acknowledgements
I would like to express my deepest gratitude to Professor Ramin Farnood for his
invaluable supports and wise guidance over the past few years. I am thankful for his
patience and confidence in my work.
I would also like to thank the members of my PhD committee, Professor Mims, Professor
Saville, Professor Acosta, Professor Kirk and Professor Jia for their valuable suggestions
and advises. I sincerely thank Professor Nejat Veziroglu from the University of Miami
for kind serving as my external appraiser.
My appreciation goes to Professor James Dumesic at the University of Wisconsin-
Madison, Professor Otomo and Professor Oshima and Dr. Hatano at the University of
Tokyo, and Professor Khodadadi and Professor Mortazavi at the University of Tehran for
the opportunity that they gave me to work in their group.
I would also like to extend my gratitude to Professor Ning Yan and Professor C. Q. Jia
for kindly providing me with some samples and letting me use their equipments.
As well, thanks are given to my friends who helped me with my project: Hooman, Elie,
Faraz, Frida, Sami, Clement, Kashif, Emanuel, Emmanuel, Isabella and Coralie.
Page 5
v
Table of Contents
1- INTRODUCTION......................................................................................... 1
1.1 BACKGROUND ................................................................................................. 1
1.2 OBJECTIVES AND HYPOTHESES ....................................................................... 2
1.3 STRUCTURE OF THE THESIS ............................................................................. 3
1.4 CONTRIBUTION AND SIGNIFICANCE ................................................................. 5
1.5 PUBLICATIONS ................................................................................................ 5
2- REVIEW OF HETEROGENEOUS CATALYSTS FOR
SUPERCRITICAL WATER GASIFICATION........................................ 7
2.1 INTRODUCTION ............................................................................................... 7
2.2 CURRENT STATUS OF CATALYTIC SCWG .................................................... 16
2.3 PERFORMANCES OF SOLID CATALYSTS ......................................................... 19
2.4 CONCLUDING REMARKS ............................................................................... 39
2.5 REFERENCES ................................................................................................. 39
3. SCREENING OF NICKEL CATALYSTS FOR SELECTIVE
HYDROGEN PRODUCTION USING SUPERCRITICAL WATER
GASIFICATION OF GLUCOSE ............................................................. 52
3.1 INTRODUCTION ............................................................................................. 53
3.2 EXPERIMENTAL ............................................................................................. 56
3.3 RESULTS AND DISCUSSION ............................................................................ 61
3.4 CONCLUSIONS ............................................................................................... 86
Page 6
vi
3.5 REFERENCES ................................................................................................. 87
4- CARBON-NANOTUBE SUPPORTED NICKEL CATALYST FOR
SCWG ......................................................................................................... 89
4.1 INTRODUCTION ............................................................................................. 90
4.2 EXPERIMENTAL METHODS ............................................................................. 92
4.3 RESULTS AND DISCUSSIONS .......................................................................... 94
4.4 ACTIVITY OF NI/MWCNT CATALYST FOR SCWG OF GLUCOSE ................ 112
4.5 CONCLUSION ............................................................................................... 116
4.6 REFERENCES ............................................................................................... 117
5- CATALYTIC SCWG OF VARIOUS LIGNOCELLULOSIC
MATERIALS ........................................................................................... 118
5.1 INTRODUCTION ........................................................................................... 119
5.2 MATERIALS AND METHODS ........................................................................ 122
5.3 RESULTS ..................................................................................................... 128
5.4 CONCLUDING REMARKS ............................................................................. 135
5.5 REFERENCES ............................................................................................... 136
6- SUMMARY AND FUTURE WORK ...................................................... 138
6.2 COMPARISON OF ACTIVE METALS .............................................................. 141
6.3 CONCLUDING REMARKS ............................................................................. 142
6.4 RECOMMENDATION FOR FUTURE WORK ...................................................... 144
Page 7
vii
APPENDIX A: .................................. COMPLEMENTARY LITERATURE REVIEW
.................................................................................................................... 145
APPENDIX B: ........................................................ EQUILIBRIUM CALCULATIONS
.................................................................................................................... 155
Page 8
viii
List of Tables
TABLE 2.1 SELECTED RESULTS OF CATALYTIC SCWG USING ACTIVATED
CARBON AS CATALYST. ...................................................................... 22
TABLE 2.2 SELECTED RESULTS OF CATALYTIC SCWG USING RANEY
(SKELETAL) NICKEL CATALYST. ..................................................... 27
TABLE 2.3 SELECTED RESULTS OF CATALYTIC SCWG USING
SUPPORTED NICKEL CATALYSTS. .................................................. 31
TABLE 2.4 PERFORMANCE OF SUPPORTED CATALYSTS FOR
GASIFICATION OF 2 WT% GLUCOSE SOLUTION. 380O
C, 15MIN,
GLUCOSE 0.2G, CATALYST 1G, 5 WT% NI, WATER 9.8G. ........... 35
TABLE 2.5 SELECTED RESULTS OF CATALYTIC SCWG USING
SUPPORTED RUTHENIUM CATALYSTS. ......................................... 36
TABLE 3.1 CHARACTERISTICS OF THE SUPPORTS USED IN THIS STUDY.
...................................................................................................................... 60
TABLE 3.2 THE EQUILIBRIUM GAS COMPOSITION CALCULATED BASED
ON SCWG OF 2 WT% GLUCOSE AND WATER DENSITY OF 200
KG/M3 USING ASPEN PLUS SOFTWARE. ......................................... 62
TABLE 3.3 PERFORMANCE OF ALUMINA-SUPPORTED CATALYSTS (380
OC, 15MIN, 2 WT% GLUCOSE, 1G CATALYST). .............................. 69
Page 9
ix
TABLE 3.4 PERFORMANCE OF OTHER SUPPORTED CATALYSTS (380 O
C,
15MIN, 2 WT% GLUCOSE, 1 G CATALYST). .................................... 76
TABLE 3.5 EFFECTS OF THE ADDITION OF PROMOTERS TO NI/Α-AL2O3
CATALYSTS ON GASIFICATION OF 2 WT% GLUCOSE
SOLUTION. (380 O
C, 15MIN, 0.05G NI). ............................................... 85
TABLE 4.1 ELEMENTAL COMPOSITION OF NICKEL DECORATED MWCNT
OBTAINED BY XPS NITRIC ACID CONCENTRATION. ................ 95
TABLE 4.2 WEIGHT PERCENT OF THE REMOVED FUNCTIONAL GROUPS
OBTAINED FROM TGA IN NITROGEN. ............................................ 99
TABLE 4.3 GAS FORMATION FROM THE CATALYST SUPPORT (WITH NO
GLUCOSE). 380 O
C, 30MIN, 0.5 G CATALYST, 9.8 G WATER.
YIELD AND CGR ARE CALCULATED WITH 0.2 G GLUCOSE AS
A HYPOTHETICAL FEED. .................................................................. 114
TABLE 5.1 PHYSICAL CHARACTERISTICS OF THE CATALYSTS USED IN
THIS STUDY. .......................................................................................... 125
TABLE 5.2 THERMODYNAMIC EQUILIBRIUM OF 2 WT% FEEDS AT 380 O
C
AND 230 BAR. ......................................................................................... 129
TABLE 5.3 GAS YIELD AND CGR OBTAINED FROM CATALYST-FREE
SCWG OF 2 WT% FEEDS AT 380 O
C IN 15MIN BATCH
EXPERIMENTS. ..................................................................................... 130
Page 10
x
TABLE A.1 REACTIONS RATES OF GLUCOSE DECOMPOSITION [S-1
] WITH
RESPECT TO FIGURE 2.1 .................................................................... 146
TABLE A.2 REACTION RATE AND ORDER FOR GLUCOSE
DECOMPOSITION IN SWC [3]. .......................................................... 147
TABLE A.3 CORRESPONDING ACTIVATION ENERGY AND ARRHENIUS
FACTOR, A, FOR REACTIONS PRESENTED IN FIGURE 2.3 [4]. 148
TABLE A.4 REACTION RATES [S-1
] CORRESPONDING TO FIGURE 2.5 [12].
.................................................................................................................... 150
TABLE A.5 REACTION RATES AND PRODUCT’S MASS FRACTION BASED
ON FIGURE 2.7 [14]. .............................................................................. 152
Page 11
xi
Table of Figures
FIGURE 2.1 .... PROCESS FLOW DIAGRAM OF SCWG AND ITS SUBSEQUENT
APPLICATIONS. ........................................................................................ 9
FIGURE 2.2 ....... VARIATION OF ENTHALPY OF WATER AS A FUNCTION OF
TEMPERATURE. ..................................................................................... 16
FIGURE 2.3 .......................... CATALYST DESIGN TRIANGLE INTRODUCED BY
RICHARDSON [45] (ADAPTED FROM [46]). ...................................... 18
FIGURE 3.1 REACTION PATHWAYS FOR PRODUCTION OF HYDROGEN BY
REACTIONS OF OXYGENATED CARBOHYDRATES WITH
WATER ADAPTED FROM [17]. (* REPRESENTS A SURFACE
METAL SITE) ........................................................................................... 54
FIGURE 3.2 ..... SCHEMATIC DIAGRAM OF THE EXPERIMENTAL SET-UP: 1)
MOLTEN SALT BATH, 2) REACTOR, 3) ELECTRICAL HEATER,
4) THERMOCOUPLE, 5) PID TEMPERATURE CONTROLLER, 6)
FIRST VALVE, 7) LOW-PRESSURE GAUGE, 8) SECOND VALVE.
...................................................................................................................... 61
FIGURE 3.3 ..... HYDROGEN AND METHANE YIELDS AND SELECTIVITY VS.
CARBON CONVERSION USING 5% NI/ALUMINA CATALYSTS,
Α-AL2O3 (),Γ-AL2O3 (), LA2O3-Γ-AL2O3 (), AND
EQUILIBRIUM VALUES (X). (380 O
C, 15MIN, 2 WT% GLUCOSE,
1G CATALYST). ....................................................................................... 70
Page 12
xii
FIGURE 3.4 HYDROGEN YIELD AND SELECTIVITY VS. SUPPORT SURFACE
AREA USING 5% NI/ALUMINA CATALYSTS, Α-AL2O3 (),Γ-
AL2O3 (), LA2O3-Γ-AL2O3 (). (380 O
C, 15MIN, 2 WT% GLUCOSE,
1G CATALYST). ....................................................................................... 71
FIGURE 3.5 .. XRD PATTERNS OF 5% NI ON A) Α-AL2O3 REDUCED AT 500 O
C
B) Γ-AL2O3 (A-6) REDUCED AT 500 O
C, C) Γ-AL2O3 (A-6)
REDUCED AT 800 O
C, AND D) Γ-AL2O3 (A-8) REDUCED AT 700 O
C.
THE VERTICAL DASHED LINES REPRESENT NICKEL PEAKS. 72
FIGURE 3.6 . XRD PATTERNS OF DIFFERENT TYPES OF ALUMINA BEFORE
(BOTTOM) AND AFTER (TOP) EXPOSURE TO THE
SUPERCRITICAL WATER AT 380 O
C FOR 1H. ................................ 73
FIGURE 3.7 ..................... HYDROGEN YIELD AND SELECTIVITY VS. CARBON
CONVERSION (CGR) USING 5% NI/SUPPORT CATALYSTS, (380
OC, 15MIN, 2 WT% GLUCOSE, 1 G CATALYST). MOLECULAR
SIEVE (), YSZ (), HYDROTALCITE (), SILICA (), TITANIA
(), YTTRIA (), MAGNESIA (), AND CNT (). .......................... 77
FIGURE 3.8 ..... XRD PATTERNS OF MGO, Y2O3, TIO2, HYDROTALCITE, CEO2
AND YSZ BEFORE (BOTTOM) AND AFTER (TOP) EXPOSURE TO
THE SUPERCRITICAL WATER AT 380 O
C FOR 1H. ....................... 78
Page 13
xiii
FIGURE 3.9 .. CARBON GASIFICATION RATIO AND METHANE YIELD VS. NI
LOADING (ON Α-AL2O3 (A-4)) AT 410 O
C (), 380 O
C (), AND 350
OC (), (15MIN, 2 WT% GLUCOSE, 0.05 G NI). ................................. 81
FIGURE 3.10 ... HYDROGEN SELECTIVITY VS. NI LOADING (ON Α-AL2O3 (A-
4)) AT 350 O
C, 380 O
C, AND 410 O
C, (15MIN, 2 WT% GLUCOSE, 0.05
G NI). ........................................................................................................... 82
FIGURE 3.11 ..... EFFECTS OF CALCINATION TEMPERATURE (FOR 2H) AND
TIME (AT 350 O
C) ON PRODUCT YIELDS FOR SCWG USING 5%
WT NI/Α-AL2O3 (A-4) CATALYST, (380 O
C, 15MIN, 2 WT%
GLUCOSE, 1 G CATALYST). CARBON MONOXIDE YIELD
REMAINED LESS THAN 0.3 MMOL/G (NOT SHOWN). .................. 83
FIGURE 3.12 ......... EFFECTS OF REDUCTION TEMPERATURE (FOR 2H) AND
TIME (AT 500 O
C) ON THE GAS YIELDS USING 5% NI/Α-AL2O3
CATALYST, (380 O
C, 15MIN, 2 WT% GLUCOSE, 1 G CATALYST).
CARBON MONOXIDE YIELD REMAINED LESS THAN 0.3
MMOL/G (NOT SHOWN). ...................................................................... 83
FIGURE 3.13 ............ HYDROGEN YIELD, METHANE YIELD AND HYDROGEN
SELECTIVITY VS. CARBON CONVERSION USING PROMOTED
NI/Α-AL2O3 CATALYSTS. NO PROMOTER (), SN (), NA (), CS
(), AND K (), (380 O
C, 15 MINUTES, 1 G CATALYST). ............... 86
Page 14
xiv
FIGURE 4.1 ................................................ TGA OF FRESH AND FMWCNT IN AIR.
...................................................................................................................... 96
FIGURE 4.2 .......................... ZETA POTENTIAL OF FMWCNT VS. NITRIC ACID
CONCENTRATION.................................................................................. 97
FIGURE 4.3 ... CONCENTRATION OF CARBOXYL GROUPS VS. TREATMENT
TIME. .......................................................................................................... 98
FIGURE 4.4 ........ TEM MICROGRAPHS OF 20% NI/FMWCNT, 5H OXIDATIVE
TREATMENT WITH NITRIC ACID 4M (LEFT) AND 16M (RIGHT)
.................................................................................................................... 100
FIGURE 4.5 ................................ NICKEL CRYSTALLITE SIZE VS. NITRIC ACID
CONCENTRATION FOR 20% NI/FMWCT. ...................................... 100
FIGURE 4.6 ...................... TEM MICROGRAPHS OF 20% NI/MWCNT, WITH NO
TREATMENT (LEFT) AND WITH 24H TREATMENT IN 10M
NITRIC ACID. ......................................................................................... 101
FIGURE 4.7 .. NICKEL CRYSTALLITE SIZE VS. TREATMENT TIME FOR 20%
NI/FMWCNT. .......................................................................................... 102
FIGURE 4.8 .................. EFFECT OF OXIDATIVE TREATMENT ON CRACKING
TEMPERATURE OF 20%NI/MWCT WITH AND WITHOUT ACID
TREATMENT. ......................................................................................... 103
Page 15
xv
FIGURE 4.9 .. NICKEL CRYSTALLITE SIZE VS. TREATMENT TYPE FOR 20%
NI/FMWCNT. .......................................................................................... 104
FIGURE 4.10 .... XRD PATTERNS OF DECORATED CARBON NANOTUBES AT
DIFFERENT NICKEL LOADINGS. .................................................... 105
FIGURE 4.11 ..... NICKEL CRYSTALLITE SIZE AND DISPERSION VS. NICKEL
LOADING. TREATMENT TIME: 5 HOURS). ................................... 106
FIGURE 4.12 TEM MICROGRAPHS OF NI/FMWCNT AT DIFFERENT METAL
LOADINGS, A) 5% B) 20% C) 50% D) POROUS NICKEL
CRYSTALS FORMED ON 50% NI/FMWCNT. ................................. 107
FIGURE 4.13 ............... DERIVATE IF WEIGHT LOSS VS. TEMPERATURE FOR
DIFFERENT NICKEL LOADINGS. .................................................... 108
FIGURE 4.14 ....... ZETA POTENTIAL OF NI/FMWCNT VS. NICKEL LOADING.
.................................................................................................................... 109
FIGURE 4.15 .... NICKEL CRYSTALLITE SIZE FOR DIFFERENT PRECURSOR
SOLVENTS. ............................................................................................. 110
FIGURE 4.16 ........................... NICKEL CRYSTALLITE SIZE VS. CALCINATION
TEMPERATURE FOR 20% NI/FMWCNT. ........................................ 111
FIGURE 4.17 TEMPERATURE PROGRAMMED REDUCTION OF NI/FMWCNT
AND NIO POWDER AT HEATING RATE OF 10O
C/MIN. .............. 112
Page 16
xvi
FIGURE 4.18 ..... CARBON CONVERSION AND GAS YIELDS VS. NITRIC ACID
CONCENTRATION. 380 O
C, 30MIN, 0.5 G CATALYST, 9.8 G
WATER, 0.2 G GLUCOSE, MWCNT PRETREATMENT TIME=5 H.
.................................................................................................................... 115
FIGURE 4.19 ..................... CARBON CONVERSION AND GAS YIELDS VS. ACID
TREATMENT TIME. 380 O
C, 30MIN, 0.5 G CATALYST, 9.8 G
WATER, 0.2 G GLUCOSE. NITRIC ACID CONCENTRATION=10
M. ............................................................................................................... 116
FIGURE 5.1 ..... SCHEMATIC DIAGRAM OF THE EXPERIMENTAL SET-UP: 1)
MOLTEN SALT BATH, 2) REACTOR, 3) ELECTRICAL HEATER,
4) THERMOCOUPLE, 5) PID TEMPERATURE CONTROLLER, 6)
FIRST VALVE, 7) LOW-PRESSURE GAUGE, 8) SECOND VALVE.
.................................................................................................................... 125
FIGURE 5.2 SEM MICROGRAPH OF THE CATALYSTS USED IN THIS WORK
. A) RANEY NICKEL, B) NI/Α-AL2O3, C) RU/C, D) RU/Γ-AL2O3 ... 126
FIGURE 5.3 ......................... PORE SIZE DISTRIBUTION OF Α-AL2O3 (TOP) AND
HYDROTALCITE (BOTTOM). THE UNIT OF THE Y-AXIS IS
CC/Å/G ..................................................................................................... 127
FIGURE 5.4 .. SCWG OF LIGNOCELLULOSIC FEEDS USING RANEY NICKEL
CATALYST. 380 O
C, 2 WT% FEED, 5, 15, 30 AND 60MIN (BARS
FROM LEFT TO RIGHT RESPECTIVELY), 120 MG NI. ............... 132
Page 17
xvii
FIGURE 5.5 .... SCWG OF LIGNOCELLULOSIC FEEDS USING NI/Α-AL2O3. 380
OC, 2 WT% FEED, 5, 15, 30 AND 60MIN (BARS FROM LEFT TO
RIGHT RESPECTIVELY), 120 MG NI. .............................................. 132
FIGURE 5.6 .................................. SCWG OF LIGNOCELLULOSIC FEEDS USING
NI/HYDROTALCITE. 380 O
C, 2 WT% FEED, 5, 15, 30 AND 60MIN
(BARS FROM LEFT TO RIGHT RESPECTIVELY), 120 MG NI. .. 133
FIGURE 5.7 ...... SCWG OF LIGNOCELLULOSIC FEEDS USING RU/C. 380 O
C, 2
WT% FEED, 5, 15, 30 AND 60 MIN (BARS FROM LEFT TO RIGHT
RESPECTIVELY), 6 MG RU. ............................................................... 134
FIGURE 5.8 ... SCWG OF LIGNOCELLULOSIC FEEDS USING RU/Γ-AL2O3. 380
OC, 2 WT% FEED, 5, 15, 30 AND 60MIN (BARS FROM LEFT TO
RIGHT RESPECTIVELY), 6 MG RU. ................................................. 135
FIGURE 6.1 ..... THE REACTION PATHWAY FOR THE CATALYTIC SCWG OF
BIOMASS. ................................................................................................ 139
FIGURE 6.2 ...... HYDROGEN SELECTIVITY VS. CARBON CONVERSION FOR
NICKEL-CATALYZED SCWG OF GLUCOSE. DATA: TIME
DEPENDENT FROM CHAPTER 5, NON ALUMINA, PROMOTERS,
GAMMA ALUMINA AND ACTIVATION FROM CHAPTER 3, CNT
FROM CHAPTER 4. ............................................................................... 140
FIGURE 6.3 ...... HYDROGEN SELECTIVITY VS. CARBON CONVERSION FOR
NI/Α-AL2O3 CATALYZED SCWG OF GLUCOSE WITH
Page 18
xviii
DIFFERENT METAL LOADINGS (G NI/G SUPPORT). THE
DASHED LINE REPRESENTS THE TREND IN FIGURE 6.2. ....... 141
FIGURE 6.4 ...... HYDROGEN SELECTIVITY VS. CARBON CONVERSION FOR
RUTHENIUM-CATALYZED SCWG OF GLUCOSE. THE DASHED
LINE REPRESENTS THE TREND IN FIGURE 6.2. ......................... 142
FIGURE A.1 .. PROPOSED REACTION PATHWAY FOR DECOMPOSITION OF
GLUCOSE [1]. ......................................................................................... 146
FIGURE A.2 ......... MORE DETAILED REACTION PATHWAY OF GLUCOSE [2]
.................................................................................................................... 147
FIGURE A.3 ........ DECOMPOSITION OF GLUCOSE IN SUBCRITICAL WATER
PROPOSED BY QI [4]. ........................................................................... 148
FIGURE A.5 REACTION PATHWAY FOR DECOMPOSITION OF CELLULOSE
AND STARCH IN SCW [12]. ................................................................. 150
FIGURE A.6 . DECOMPOSITION OF GLUCOSE IN SCW ACCORDING TO [13].
.................................................................................................................... 151
FIGURE A.7 ....... REACTION PATHWAYS AND PRODUCT DISTRIBUTION OF
GLUCOSE GASIFICATION IN QUARTZ CAPILLARIES [14]. A, B,
C, D, E, AND F, REPRESENT THE MASS FRACTION OF EACH
PRODUCT. ............................................................................................... 152
Page 19
xix
Nomenclature
A Specific surface area of catalyst [m2/g]
AS Aluminum silicate
BC Biocrude oil
BET Brunauer-Emmett-Teller method
CGR Carbon gasification ratio
CNT Carbon nanotube
d Metal dispersion [%]
EG Ethylene glycol
FMWCNT Functionalized multiwalled carbon nanotube
HA Hmuic acid
HGR Hydrogen gasification ratio
HMF Hydroxymethylfurfural
HS Hydrogen selectivity
LMC Lignin model compound
MA Microalgae
MWCNT Multiwalled carbon nanotube
P Pressure [bar]
PEG Polyethylene glycol
PS Peanut shell
SEM Scanning electron microscopy
SCW Supercritical water
SCWG Supercritical water gasification
SFS Sunflower stalk
SLW Synthetic liquefied wood
Page 20
xx
T Temperature [oC]
TEM Transmission electron microscopy
TGA Thermogravimetry analysis
TCD Thermal conductivity detector
TiO2-AR Mixed anatase and rutile titania
TiO2-R Rutile titania
TPR Temperature programmed reduction
WGS Water-gas shift reaction
XRD X-ray diffraction
XPS X-ray photoelectron spectroscopy
YSZ Yttria-stabilized zirconia
Page 21
1
1- Introduction
1.1 Background
Substantial efforts have been devoted to decrease our dependence on fossil fuels, and
much of these efforts heavily rely on the development of new and improved catalytic
processes. Among various catalytic processes, hydrogen production from wet biomass
and organic compounds in sub- and supercritical water (SCW) has gained significant
attention over the past two decades (in this document, the terms “supercritical water” and
“hydrothermal” are used interchangeably). In this process, catalysts are employed to
enhance the gas formation rate at moderate temperatures (e.g. <450 oC). Catalysts can be
also utilized to shift the product distribution towards a more desirable compound (e.g.,
hydrogen). The effectiveness of various types of heterogeneous catalysts, mainly based
on nickel and ruthenium metals, have been demonstrated for hydrothermal gasification of
organic compounds. Catalyst formulation along with the operating conditions such as
temperature and feed concentration can significantly affect the conversion and selectivity
of the process. In spite of major advancements over the past decades, there are still
important challenges that need to be addressed to make catalytic SCWG technically and
economically viable for hydrogen production. Poor hydrogen selectivity, catalyst
instability, tar and char formation, heat recovery and precipitation of inorganic matters
are among the most important issues that are yet to be addressed. The low hydrogen
selectivity is caused by the high activity of nickel and ruthenium to open the C-O bonds,
which in turn results in the formation of alkanes. Also, most solid catalysts suffer from
instability in SCW due to sintering, metal oxidation and support phase transformation and
Page 22
2
hydrolysis. Furthermore, the high reactivity of oxygenated compounds in SCW, specially
the carbohydrates, results in char formation through bimolecular condensation reactions.
Review of literature indicated that the physical and chemical properties of nickel catalyst
have significant impacts on the performance of these catalysts for SCWG of biomass. It
is also known that the catalytic properties depend upon the support materials, addition of
promoters and catalyst preparation. Therefore, this study was focused on the development
of solid nickel catalysts for SCWG of biomass using industrial catalyst supports such as
metal oxides, but other catalyst supports such as carbon nanotubes which are more
suitable for fundamental studies have been also considered. Study of other challenges
such as heat recovery and ash precipitation fall beyond the scope of this work and will
not be covered in this document.
1.2 Objectives and Hypotheses
The overall objective of this project is to identify/develop solid catalysts to improve the
conversion of supercritical water gasification of lignocellulosic biomass at mild reaction
conditions (i.e. <400 oC), and particularly increasing the hydrogen yield by decreasing
the alkane selectivity. The specific objectives of this project are:
1- To identify/develop catalysts with high catalytic activity and high hydrogen
selectivity for the gasification of biomass model compounds in supercritical
water.
2- To study the relation between the physical and chemical characteristics of nickel
catalysts with their performance for SCWG reactions.
Page 23
3
3- To evaluate the performance of the promising catalysts as identified in the first
part for the SCWG of different types of feedstocks, particularly the lignocellulosic
materials.
The hypotheses of this work were as follows:
1- The catalytic activity and hydrogen selectivity of nickel catalysts can be tailored
by selecting the catalyst support, tuning the metal loading, and optimizing the
catalyst preparation conditions.
2- The catalytic activity and hydrogen selectivity of nickel catalysts can be improved
by the addition of alkali promoters and tin.
3- Multiwalled carbon nanotube-supported nickel catalysts are active for SCWG of
biomass and its catalytic activity and hydrogen selectivity can be modified by
oxidative pretreatment of the support.
4- Due to the presence of strong linkages between the phenolic monomers, and
thereby the low hydrolysis yield, (extracted) lignin is substantially more difficult
to decompose compared to the carbohydrates.
1.3 Structure of the Thesis
A critical review of the current literature on the catalytic supercritical water gasification
(SCWG) of biomass is given in the next chapter. In this review, performance and
durability of commercially available and laboratory-made catalysts including supported
and skeletal metal catalysts, activated carbon, metal wires and other innovative catalysts
for the purpose of hydrothermal hydrogen production from biomass are discussed. Our
review suggests that it may be possible to improve the performance of supported nickel
Page 24
4
catalysts under near critical conditions by the proper catalyst design. Hence, there is a
need for a more comprehensive screening of nickel catalysts, aiming to address the
following issues: first , by conducting the experiments under similar operating conditions,
one can better understand the effects of catalyst support on the activity and selectivity
through comparison of the results, and second, by considering a wider range of support
materials, there will be a possibility to come across new catalyst formulations which
overperform the existing ones in terms of activity, selectivity and stability. Chapter 3
presents the results of the catalyst screening study for identifying useful nickel catalysts
for the gasification of glucose in supercritical water. Among the 44 supports studied, α-
Al2O3 and carbon nanotube were identified as most promising catalysts and were
subsequently subjected to a more in depth investigation. The effects of metal loading,
catalyst preparation conditions and promoters on the performance of Ni/α-Al2O3 are also
discussed in Chapter 3. The effects of various parameters on the structure of Ni/carbon
nanotube catalyst (CNT), identified as one of the most active catalysts in the previous
chapter, is discussed in Chapter 4. The results of the SCWG of glucose using Ni/CNT is
also included in the same chapter. To further examine the performance of Ni/α-Al2O3 for
hydrogen production from real lignocelllosic biomass, catalytic supercritical water
gasification of different feedstocks; including wood pulp, lignin, and bark, are examined
and compared to those of selected commercially available catalysts in Chapter 5. Finally,
the concluding remarks and recommendations for the future work are discussed in
Chapter 6. Also, a complementary literature review on some other aspects of the SCWG
is provided in Appendix A.
Page 25
5
1.4 Contribution and significance
The contribution of this study to the field of catalytic supercritical water gasification can
be summarized as follows:
1- The major findings of catalytic SCWG of biomass in the past two decades are
critically reviewed and remarks on the future direction were given.
2- A comprehensive set of nickel catalysts were synthesized and ranked with regard to
their activity and hydrogen selectivity for the SCWG of biomass model compound.
3- The relationship between the catalyst properties and the performance within the
context of SCWG was discussed in details.
4- The effect of oxidative pretreatment of carbon nanotubes (CNT) on the dispersion and
other characteristics of nickel-decorated CNT catalysts were studied, and the subsequent
effect on the catalytic activity of such materials for SCWG were evaluated.
5- Being identified in the previous section as the most promising catalyst, the activity of
Ni/ α-Al2O3 catalyst for gasification of different lignocellulosic materials was examined.
It was found that this catalyst have a high activity and selectivity for the SCWG of
carbohydrates.
1.5 Publications
Each chapter of this document is based on a journal paper as listed below.
Page 26
6
Chapter 2: P. Azadi, R. Farnood, Review of Heterogeneous Catalysts for Sub and
Supercritical Water Gasification of Biomass and Wastes, International
Journal of Hydrogen Energy, 2011, 36, 9529-9541
Chapter 3: P. Azadi, E. Afif, F. Azadi, R. Farnood, Catalyst Screening for Selective
Hydrogen Production Using Supercritical Water Gasification of Biomass,
Green Chemistry. DOI:10.1039/C2GC16378K.
Chapter 4: P. Azadi, R. Farnood, E. Meier. Preparation of Multiwalled Carbon Nanotube-
Supported Nickel Catalysts Using Incipient Wetness Method. Journal of
Physical Chemistry A, 2010; 114:3962-3968.
Chapter 5: P. Azadi, S. Khan, F. Strobel, F. Azadi, R. Farnood, Hydrogen Production
from Cellulose, Lignin, Bark and Model Carbohydrates in Supercritical Water
using Nickel and Ruthenium Catalysts, Applied Catalysis B: Environmental,
117, 330-338.
In addition, the following papers have been published or submitted for publication from
my PhD work.
P. Azadi, R. Carrasquillo-Flores, Y.J. Pagán-Torres, E.I. Gürbüz, R. Farnood, J.
Dumesic, Catalytic Conversion of Biomass Using Solvents Derived from Lignin,
Green Chemistry, 2012, DOI: 10.1039/C2GC35203F
P. Azadi, J. Otomo, H. Hatano, Y. Oshima, R. Farnood, Interactions of Supported
Nickel and Nickel Oxide Catalysts with Methane and Steam at High
Temperatures, Journal of Chemical Engineering Science, 2011, 66, 41964202.
Page 27
7
P. Azadi, Clement Vuillardot, R. Farnood, Estimation of Heating Time and
Length in Supercritical Water Reactors, Journal of Supercritical Fluids, 2010, 55,
1038-1045.
P. Azadi, J. Otomo, H. Hatano, Y. Oshima, R. Farnood, Hydrogen production by
catalytic near-critical water gasification and steam reforming of glucose,
International Journal of Hydrogen Energy, 2010, 35, 3406-3414
P. Azadi, K. M. Syed, R. Farnood, Catalytic Gasification of Biomass Model
Compound in Near-Critical Water. Journal of Applied Catalysis A, 2009, 358, 65-
72.
P. Azadi, A. Khodadadi, Y. Mortazavi, R. Farnood, Hydrothermal Gasification of
Glucose using Raney Nickel and Organometallic Catalysts. Journal of Fuel
processing technology, 2009, 90, 145-151.
2- Review of Heterogeneous Catalysts for Supercritical Water
Gasification
* Based on: P. Azadi, R. Farnood, (2011), Review of Heterogeneous Catalysts for Sub and Supercritical
Water Gasification of Biomass and Wastes, International Journal of Hydrogen Energy, 36, 9529-9541
2.1 Introduction
Gasification is an effective thermochemical route to convert carbon-containing feeds into
carbon monoxide, hydrogen, carbon dioxide and methane. The resulting gas (i.e.
collectively known as syngas) can be combusted to produce heat or it can be further
processed to produce more hydrogen by water-gas shift reaction, methanol, and synthetic
liquid fuels using Fischer-Tropsch process. Currently, hydrogen is mainly produced by
Page 28
8
steam reforming of natural gas and naphtha due to their lower costs compared to biomass.
However, it is anticipated that biomass as feedstock for hydrogen production will have a
more significant contribution in near future because of the increasing demand for natural
gas and the undesirable environmental impacts associated with the excessive use of fossil
fuels. Since biomass gasification is theoretically carbon neutral, it is expected to play a
crucial role in future energy. In conventional gasification techniques, a controlled amount
of oxygen and/or steam are injected into the gasifier to partially oxidize or reform the
carbon, resulting in the formation of hydrogen, carbon monoxide and carbon dioxide.
Partial oxidation releases energy that is used to keep the temperature of the gasifier at the
desired value. Also, injection of steam into the reactor promotes hydrogen production by
the water gas shift reaction. One important drawback of this process is the need for
preprocessing of the feed to reduce its water content. As an alternative, researchers have
studied the gasification processes in sub and supercritical water to address this issue.
Supercritical water (SCW) can be used as both reaction media and reactant
simultaneously. Hydrogen production is a promising application of the catalytic SCWG
process. In this process, biomass is decomposed to form hydrogen, methane, carbon
dioxide, carbon monoxide, and small amounts of higher hydrocarbons [1-12]. The unique
properties of SCW such as harsh critical temperature and pressure along with its low
dielectric constant make SCW an attractive solvent with tunable dissolving power. Many
permanent gases and most organic compounds are soluble in SWC; therefore, the mass
transfer barrier between different phases does not exist in reactions occurring in SCW. It
should be noted that depending on the temperature and pressure, the density of water near
Page 29
9
its critical point varies between 100 to 600 kg/m3. These properties render SCWG as a
promising technology for gasification of dilute wet feeds.
Figure 2.1 demonstrates the process flow diagram of SCWG of wet feeds along with its
subsequent applications.
Figure 2.1 Process flow diagram of SCWG and its subsequent applications.
2.1.1 Feedstocks
Performance of catalytic SCWG is generally influenced by feedstock type and
concentration, catalyst type and loading, and the contact time between the catalyst and
the feed. Two different types of feedstocks are typically utilized in the laboratories to
evaluate the effectiveness of the SCWG process: real biomass and model compounds.
Page 30
10
Investigations on real biomass feeds provide practical information on the performance of
gasifier at different operating conditions while model compounds are used for sake of
more fundamental studies, aiming at representing the actual gasification conditions.
A variety of real biomasses including lignocellulosic biomass from different sources,
sewage sludge, chicken manure, food wastes, algae, and fermentation residue have been
successfully gasified in SCW. However, as lignocellulosic biomass is the most abundant
type of biomass on earth, gasification of such materials has been the primary focus of
many investigations. There are three constituents in lignocellulosic biomass: cellulose,
hemicellulose and lignin. Cellulose is a linear biopolymer with both crystalline and
amorphous structures made of glucose monomers. Hemicellulose is an amorphous
polymer with different sugar monomers such as xylose and glucose. Lignin is a highly
cross-linked copolymer mostly made of three types of phenylpropane monomers which
are methoxylated to different degrees: para-coumaryl alcohol, coniferyl alcohol and
sinapyl alcohol.
During the SCWG, cellulose, which is the major component of woody biomass, is
initially hydrolyzed at temperatures above 200oC, resulting in formation of glucose,
fructose and sugar oligomers [1]. This step is known to be fast and it is associated with
high yields. Subsequently, furfural, phenols, acids and other intermediates are formed
from soluble carbohydrates, which further undergo decomposition and reforming to
generate hydrogen, carbon dioxide, carbon monoxide and methane. However, at low
temperature hydrothermal gasification, specially in absence of catalysts, a significant
amount of char is produced due to condensation reactions.
Page 31
11
Gasification of model compounds can be studied both as a single component and as
mixtures of various model molecules to determine possible interactions among different
reactants during the gasification process. Examples of single reactant are glucose,
cellulose, xylan, ethylene glycol, glycerol and various functional types such as alkanes,
alcohols, phenolics, organic acids to name a few. It has been found that due to the very
fast hydrolysis of the cellulose and the consequent formation of glucose and sugar
oligomers, gasification of glucose and cellulose practically lead to identical gas yields
[13]. Moreover, mixtures of cellulose/xylan, cellulose/lignin and xylan/lignin have been
considered for gasification [14]. Fundamental studies by these model compounds
indicated that there is a strong deviation from rule of mixture while gasifying a mixture
of lignin with cellulose and xylan [14, 15]. However, mixtures of cellulose and xylan at
any ratio exhibit a very predictable gasification efficiency that perfectly matches with the
expectations from the rule of mixtures in terms of gas composition and yield [14, 15].
Similar deviation from the rule of mixture has been observed when humic acid is mixed
with other model compounds representing activated sludge [16]. Despite the existence of
some similarities between gasification of real biomass and pure model compounds
obtained by utilization of fresh catalysts, gasification of these two types of feedstocks
may result in a significant difference in the rate of catalyst deactivation. This is partly due
to the existence of sulfur and other inorganic compounds (e.g. ash) that react with the
active metal and form a dramatically less active surface, or physically block the catalyst
pores and reduce the number of accessible sites [17].
Page 32
12
2.1.2 Types of reactors
During the past years, different laboratory reactor systems have been utilized to study the
catalytic gasification in supercritical water medium, including batch, fixed bed, CSTR,
and quartz capillary reactors. Also, few studies reported application of fluidized beds in
SCWG [18, 19]. During the course of these studies, researchers found that tar formation
is accelerated when the reactants are kept at moderate temperatures for a prolonged time.
Although tarry materials undergo further decomposition to form gases at high
temperatures, it is suggested that their contribution to char formation is significant [13,
20]. Therefore, in order to avoid char formation or to minimize this effect, the heating
rate should be as high as possible. Typical heating rate values in literature range from 1 to
500oC/min. Recently, a computational fluid dynamics model has been developed to
estimate the heating rate of tubular SCW reactors [21].
Batch reactors are essentially autoclaves with a typical volume between few milliliters to
1 liter. Since the vapor pressure of water is significantly higher than the partial pressure
of the produced gases at the reaction conditions, the pressure of the batch reactors cannot
be easily controlled and it is mainly governed by the reaction temperature and the fraction
of reactor initially filled with water. Furthermore, since reactions also take place during
the warm-up time, the heating rate may affect the product distribution. Therefore,
autoclaves heated by external electrical heaters would not be appropriate systems for
investigating catalysis in SCWG process. Nonetheless, such systems have been widely
used for SCWG experiments and there is a large body of literature that overlooked this
issue by the inaccurate reporting of the batch reaction time. Utilization of molten salt bath
Page 33
13
with a high thermal mass and superior heat transfer properties, sand bath and injection of
concentrated feed to a previously heated reactor via high pressure pumps are among the
possible solutions to this issue.
It is suggested that capillary quartz tubes may be a safe and cheap high-pressure batch
reactor with a high heating rates [22-29]. Although the final gasification products can be
evaluated both visually and quantitatively, these capillary tubes does not seem to be
suitable for testing catalyst powders due to their small inner diameter which leads to non-
uniform distribution of catalyst along the reactor. As a result, diffusion in the small
capillary tubes could become the rate limiting step and affect the product yields. Overall,
these capillary tubes are quite useful in providing additional information in terms of
visual observation and gaseous products for catalyst-free tests.
Continuous flow reactors have been also used in SCW experiments. However, due to
practical difficulties with pumping precise amounts of slurries into high-pressure
reactors, except for a few studies, their application was mostly limited to soluble organic
feeds. Running the flow reactors at high heating rates is not a serious issue as there are a
variety of techniques to fulfill this task, among them are utilization of a preheater [30],
multiple zone furnaces [31], mixing of a concentrated feed with hot water right before the
catalyst bed [32], and using a swirl generator at the entrance of the reactor [33].
2.1.3 The role of catalysts in SCWG
Gasification of organics in SCW without catalyst has been studied thoroughly. A part of
data on this topic has been reported in papers dealing with catalytic SCWG for evaluating
Page 34
14
the catalyst effectiveness. Catalyst-free SCWG usually results in a higher CO
concentration due to intrinsically low rate of water-gas shift reaction. Also, very high
temperatures are required to achieve acceptable conversions. A comprehensive overview
of the SCWG without catalyst is provided in [1].
In terms of reaction temperature, three ranges have been considered for SCWG process
[2]: high temperature supercritical water, low temperature supercritical water and
subcritical water gasification. The reaction mechanism changes from free radical to ionic
by decreasing the temperature [3, 34]. A typical temperature range for high temperature
supercritical water gasification is between 550 to 700oC. Thanks to high reaction rates,
complete gasification is achievable in the absence of catalysts or by utilization of carbon
(e.g., coconut shell activated carbon) or alkali salts to inhibit tar formation [2, 35, 36]. It
was shown that a solution containing 11 wt% glucose can be completely gasified at
700oC using a flow reactor [37].
For low temperature (374 to 550oC) supercritical water gasification, transition metal
catalysts, such as nickel and ruthenium, are usually employed to overcome the energy
barriers at lower reaction temperatures [2, 3, 38, 39]. Although complete gasification of
cellulose and lignin has been reported for this range of temperature, catalyst deactivation
is still problematic and needs further improvements [39].
In subcritical region, only highly active metal catalysts such as Raney nickel and
platinum at low space velocities are useful for gasifying oxygenated organic compounds
[40].
Page 35
15
Gasification in SCW is overall an endothermic reaction. Since SCWG is operated at very
high water content and given the considerably high specific heat of water, it is of great
interest to reduce the reaction temperature as much as possible. Also, it is crucial to
recover the thermal energy of the reactor’s effluent to heat up the feed. Figure 2.2 shows
the change in the enthalpy of water as a function of temperature. It is worth mentioning
that running the reactor in the temperature range at which a sudden increase in enthalpy
of water occurs may dramatically decrease the efficiency of the heat recovery and thus,
should be avoided [1, 32].
In this paper, different aspects of SCWG with heterogeneous catalysts are critically
reviewed. Without underestimating the possible roles of homogeneous catalysts for
conversion of biomass into gases in SCW, this review paper solely focuses on catalytic
SCWG catalyzed by solid catalysts. The heterogeneous catalysts are categorized in three
major groups: activated carbon, metal, and oxide catalysts. Metal catalysts are further
divided to unsupported (e.g., metal wires and skeletal catalysts) and supported catalysts.
Major findings regarding activity, selectivity, stability and the rationale for use of such
catalysts are presented.
Page 36
16
Figure 2.2 Variation of enthalpy of water as a function of temperature.
2.2 Current Status of Catalytic SCWG
Being the subject of research for more than 20 years, SCWG has been now established as
one of the most promising routes for converting wet biomass to gaseous fuels. Three
different scenarios for SCWG are practically possible, each of which offers its own
advantages and drawbacks: a) high temperature SCWG either in absence of catalysts or
with activated carbon as the catalyst; b), gasification in the presence of homogeneous
alkali catalysts and c) gasification at milder conditions with the aid of active metal
catalysts.
During the past two decades, over 100 journal papers have been published regarding
different aspects of heterogeneous catalysis in the SCWG process. These studies include
both commercial as well as catalysts tailored for gasification in SCW.
Page 37
17
Majority of commercially available catalysts applied in SCWG process are industrially
practiced for hydrogenation (e.g., Raney nickel) and steam reforming of methane and
naphtha (e.g., Ni/Al2O3). In addition to this, supported noble metal catalysts (e.g., Ru/C,
Ru/Al2O3 and Pt/Al2O3) prepared by catalyst manufacturers are widely used for their high
activity and ease of use as there is often no need for reduction of the active metal prior to
the experiment. Also, dispersion of the noble metals in commercial catalysts are rather
high (e.g., 30-50%), providing a greater number of catalytic sites per mass of active metal
and thus, lowering the price of the catalyst. Modification of some industrial nickel
catalysts have been carried out aiming at increasing the life time of the catalyst (e.g.,
addition of Ru to BASF reforming catalyst [38]) or improving the selectivity (e.g., Sn
incorporated onto the surface of Raney nickel [41-44]).
So far, extensive efforts have been made by researchers to demonstrate the potential
application of SCWG process to convert various types of biomass into hydrogen,
methane and syngas. A great deal of investigation has been focused on the effects of
operating conditions and reactor design on gasification efficiency. Although many
researchers made use of heterogeneous catalysts to accelerate the gasification rate, few
studies were solely dedicated to design of novel catalysts tailored for SCWG, and provide
fundamental insight that leads to further advancements in the field. This was partly due to
the fact that the available catalysts in the market or laboratory-made supported catalysts
with simplest formulations (such as nickel on alumina or magnesia) were sufficiently
active to make a remarkable difference in the gas yields obtained from catalyzed and
uncatalyzed experiments and prove the potential advantageous of a catalytic process.
Page 38
18
However, the key to further advance the effectiveness of heterogeneous catalysts for
SCWG is to develop a better fundamental understanding of the relationships between
catalyst formulation and structure to its performance. Particularly, formulating bimetallic,
alkali promoted and sulfur resistant catalysts would be very beneficial for improving
selectivity and lifetime of the catalyst and consequently, making SCWG process an
economically viable process.
Successful design of catalysts depends on careful consideration of its catalytic,
chemicophysical and mechanical properties. This concept has been introduced by
Richardson [45] as the catalyst design triangle (Figure 2.3).
Figure 2.3 Catalyst design triangle introduced by Richardson [45] (adapted from
[46]).
Review of open literature on catalytic SCWG indicates that among the above factors,
only catalytic activity has been well studied. On the other hand, very limited studies were
focused on enhancing the selectivity and stability of the heterogeneous catalysts for
Page 39
19
SCWG. More detailed fundamental studies in future should be undertaken to clarify the
relationship between chemicophysical and mechanical properties of catalysts to their
performance.
It is known that the electronic structure of a metal or alloy is solely responsible for its
catalytic activity with respect to any given reaction [47]. Recent advancements in
computer-based catalyst design, particularly in density functional theory (DFT), has now
made it possible to predict the reactivity of catalytic surfaces and reactants as a tool to
improve catalytic performance and for the design of better catalysts. One is now able to
find more active, more selective and perhaps cheaper catalysts for SCWG by applying
these methods to transition metals and their alloys. From economic perspectives, it is of
particular value that the formulations of the new catalysts for SCWG be preferably based
on earth-abundant elements.
2.3 Performances of Solid Catalysts
Review of literature indicates that three types of heterogeneous catalysts have been used
for accelerating the reactions associated with the gasification of organics in SCW:
activated carbon, transition metals, and oxides. In this section, we review the major
findings in the field of catalytic SCWG and present the achievements in gasification of
biomass in SCW.
Selected results from literature are tabulated and captured in terms of carbon conversion
and gas yields. Carbon gasification ratio (CGR) is defined as the ratio of carbon in the
final gas products over initial amount in the feed to the reactor. Yields of hydrogen and
methane, the two most useful products of SCWG, are reported per unit mass of the
Page 40
20
organic feed. As for the continuous reactors this is represented by weight hourly space
velocity (WHSV) which is reported as the mass flow rate of the organic matter passed per
unit mass of the catalyst.
2.3.1- Activated carbon
Carbons obtained from natural sources such as trees, plants, shells, coal and wood can be
treated in high-temperature inert gas, carbon dioxide and/or steam to tailor its properties
for being used as a catalyst support or as a catalyst by itself. The physical and chemical
properties of carbons are not only affected by the treatment conditions but also by the
source of carbon. Treatment of carbon at a moderate temperature and an active
atmosphere results in the production of activated carbon of ultra-high surface area. On the
contrary, treatment at higher temperatures an inert atmosphere produces low-surface area
graphite. The pore size and surface area of the activated carbons typically varies between
0.5-1nm and 800-1500 m2/g, respectively. Due to their superior stability in reducing
environments, negligible effects on the reaction, and high degree of metal dispersion,
carbon supported metal catalysts are widely used in industry for hydrogenation reactions
in production of fine chemicals.
Activated carbons from different sources are found to be catalytically active for high
temperature SCWG reactions (Table 2.1). The idea of using activated carbon as a catalyst
was possibly originated from their previously proven performance for tar cracking in
downdraft gasifiers. Despite the fact that activated carbon is the best known
Page 41
21
heterogeneous catalyst for high temperature (e.g. > 600oC) SCW applications in terms of
cost, the exact mechanism of its action as a catalyst in the context of SCWG is still
unknown. Since the activity of the carbon catalyst was not a strong function of its total
surface (i.e. sum of outer and pore surfaces), it was concluded that only the external
surface of carbon particles takes part in gasification [33, 48]. Furthermore, the presence
of different minerals in the activated carbons from various sources did not alter the
gasification rate [33]. Also, it has been reported that the rate of gasification of activated
carbon in SCW at 600oC and 650
oC are about 2.7x10
-6 and 7.2x10
-6 s
-1, respectively [30].
Accordingly, at 650oC, about half of the initial mass of carbon catalyst would be gasified
in about 27 h. The hydrogen to carbon dioxide ratio in the produced gas from activated
carbon in SCW was roughly two and the small amount of methane formed in such
reactions likely had a pyrolytic origin [30].
Using carbon in low temperature SCW cannot enhance the rate of gasification [49]. Thus,
useful data on activity of carbon for catalyzing SCWG reactions are limited to high
temperature SCWG region. However, due to high conversion of gasification at such high
temperature SCW even in absence of catalyst (typically above 80%), comparison
between the results obtained from uncatalyzed and carbon-catalyzed experiments is
challenging. Nevertheless, the gas mixtures obtained from carbon-catalyzed SCWG in
continuous reactors contain significantly smaller amounts of carbon monoxide. Overall,
more fundamental research should be conducted to clearly explain the role of carbon in
SCWG reactions, particularly for tar cracking and water-gas shift reactions, and to better
demonstrate its usefulness in practical applications.
Page 42
22
Table 2.1 Selected results of catalytic SCWG using activated carbon as catalyst. T
emp.
Rea
ctor
*
Fee
d
Conc.
Cat
alyst
Fee
d /
Cat
alyst
Tim
e
WH
SV
CG
R
H2
CH
4
Ref
.
[oC] - - wt% - g/g min h
-1 % mmol/g mmol/g -
400 B Lignin 3.3 Charcoal 0.7 60 - 8 0.3 0.8 50
500 C Glucose 18 Coconut
shell AC - - 14 51 2.5 1.3 33
600 C Glucose 22 Coal AC - - 20 97 8.2 5.7 33
600 C Glucose 22 Coconut
shell AC - - 22 100 12.4 6.8 33
600 C Glucose 22 Spruce
wood
charcoal - - 13 99 21.4 7.5 33
600 C Sewage
sludge 3
Coconut
shell AC - - 0.5 11 0.6 33
650 C Corn
starch 10
Coconut
shell AC - - 3.8 100 31 9.2 51
650 C Glucose 11 Activated
charcoal - - 12 92 8.9 7.2 52
710 C Potato
starch 12
Coconut
shell AC - - 89 15.5 10.5 48
* B: batch, C: continuous
Separation and recovery of activated carbon catalyst is an important practical
consideration when catalyst is suspended in the reactor. This concept has been
Page 43
23
successfully illustrated in a pilot scale SCWG plant used for gasification of poultry
manure [53].
2.3.2- Transition metals
There is a wide range of metal catalysts with adjustable physicochemical properties that,
in contrast to activated carbon catalyst, could be tailored to meet the requirements of the
catalytic process of interest. In SCWG process, metal catalysts have been employed in
both supported and unsupported forms.
2.3.2.1- Unsupported catalysts
Within the context of catalytic SCWG, unsupported metal catalysts can be categorized in
two groups: powders and wires with low specific surface area and skeletal structures (i.e.
Raney catalysts). Applications of both forms in SCWG are discussed in details below.
Powders and wires
Few researchers have used metals and metal oxides in forms of powder or wire as a
catalyst for SCWG process. There are two motivations behind using such materials in
laboratory experiments: 1) demonstrating the inherent ability of different metals for
catalyzing SCWG reactions (mostly in case of metal wires), and 2) to examine the
possibility of using these unsupported metal particles as the actual catalyst in real large
scale gasification process. It should be noted that, in most cases, the specific surface areas
of these two forms of metallic materials are very small (i.e. <<1 m2/g). Indeed, metal
powders and wires have an extremely limited number of catalytically active sites. Nickel
[39, 54], nickel oxide [55], inconel [29], ruthenium [24], ruthenium oxide [55, 56], and
Page 44
24
platinum [57] have been tested for catalyzing gasification of organics in supercritical
water. Pt-black, which has an appreciable surface area, showed considerable turnover
frequency for gasification of ethylene glycol at low temperatures [57]. However, given
the high price and low dispersion of platinum or other noble metals in powder form,
application of such materials has been limited to fundamental laboratory studies. Except
Pt-black, other metal powders have exhibited insignificant activity at low temperatures.
For instance, complete gasification of cellulose was achieved at 450o
C in the presence of
RuO2 powder whereas no improvement over uncatalyzed experiment was observed for
the same reactions at 350oC [55]. Moreover, lignin and lignin-containing mixtures
inhibited the catalytic effects of RuO2 [56]. It has been hypothesized that the flexible
structure of lignin’s aliphatic chains captured the RuO2 catalyst and diminished its
catalytic effects. However, more detailed investigations on this issue are needed to
validate this hypothesis.
Metal wires have been used to act as catalyst in capillary quartz reactors. In such reactors,
the distance between the reactants and the metallic surface (i.e. catalyst) is small and it is
always less than the tube diameter. Nevertheless, there are some concerns regarding the
application of metal wires to catalytic supercritical water gasification reactions. Firstly,
metal wires are unable to provide a reasonable surface area per mass of the feed in the
reactor. Secondly, catalysts cannot be reduced in situ prior to the experiment to ensure its
surface reactivity. Furthermore, since the diameters of these wires (e.g. 0.25 mm) are
typically comparable to the inner diameter of the capillary reactors (e.g. 1-2 mm), both
free volume and open cross section of the capillary tubes may change upon use of wires,
Page 45
25
especially if multiple wires are employed. Overall, quartz capillary tubes seem to be quite
suitable for study of unanalyzed SCWG reactions due to elimination of wall effects, but
their utility for heterogeneous catalysis is inherently limited.
Raney (skeletal) catalysts
Raney catalysts are prepared by leaching out aluminum from a metal-aluminum alloy,
resulting in formation of the target metal with a spongy structure. The remaining material
typically contains a few percent of aluminum [58]. The low initial cost of the raw
materials per unit mass of metal used for making skeletal nickel results in lowest the cost
per unit mass of active catalyst [59]. Among various skeletal catalysts, Raney nickel is
found to be most active in SCWG [60]. Despite the fact that many different Ni-Al phases
can be treated with a solvent to leach away aluminum, the ratio between nickel and
aluminum in the initial alloy plays an important role on the activity of such catalysts.
Ni2Al3 (59% Ni) and NiAl3 (42% Ni) are the two most commonly used proportions for
synthesis of Raney nickel catalysts. Dissolving of NiAl3 in an alkali solution occurs more
effectively than Ni2Al3. In the early stages of development of Raney nickel catalysts, the
Ni-Al alloys were used to treat with excess amounts of sodium hydroxide at relatively
high temperatures (~120 oC) at prolonged times (~7h). It should be noted that reaction of
aluminum with sodium hydroxide is extremely exothermic and digestion of aluminum at
high temperatures and long treatment times would result in formation of alumina hydrate
(i.e., Al(OH)3) through hydrolysis of sodium aluminate. In order to address this issue,
several methods have been suggested by the researchers, among them are the gradual
Page 46
26
addition of Ni-Al alloy to the caustic alkali and the addition of Ni-Al alloy to the solvent
at a low temperatures (e.g. -20 oC). For more detailed information on the preparation of
Raney catalysts refer to [58].
The specific surface area of fresh Raney nickel ranges from 50 to 100 m2/g. However,
there are some evidences that Raney nickel may undergo aging even at room temperature
and partially lose its active area and the stored hydrogen and slowly forms nickel oxide
on the surface [61, 62]. Therefore, it is suggested that skeletal nickel catalysts should be
used within a year after synthesis.
Raney nickel is often available in the slurry form in degassed water and it is often used
without any pretreatment (such as reduction). It should be also noted that depending on
the preparation method, Raney nickel may contain a considerable amount of stored
hydrogen in its structure. This amount can be as much as one order of magnitude greater
than the amount of hydrogen that is chemisorbed on the catalyst surface [59]. When
Raney nickel catalyst is subjected to hydrothermal environment, it may release the stored
hydrogen. Consequently, at high catalyst to feed ratio in batch experiments, the release of
stored hydrogen along with the partial oxidation of nickel by water may lead to the
formation of considerable amounts of hydrogen in the gas phase, leading to erroneous
results that are difficult to interpret and sometimes misleading. The X-ray photoelectron
spectroscopy (XPS) analysis as well as CO and CH4 formation in SCW in absence of
organic feed indicated that the surface of fresh commercial Raney nickel catalyst may
also contain carbon [24, 42].
Page 47
27
Table 2.2 Selected results of catalytic SCWG using Raney (skeletal) nickel
catalyst.
Tem
p.
Rea
ctor
*
Fee
d
Conc.
Fee
d /
Cat
alyst
Pro
mote
r
Hea
ting
tim
e
tim
e
WH
SV
CG
R
H2
CH
4
Ref
.
oC - - wt % g/g min min h
-1 % mmol/g mmol/g
225 C Sorbitol 5 Sn 0.27 59 20.2 2.9 41
225 C Glycerol 5 Sn 0.54 81 46 3.2 41
265 C Sorbitol 5 Sn 0.54 75 22.6 3.6 41
265 C Glycerol 5 Sn 0.54 99 51.3 5.8 41
350 B Cresol 10 45 90 93 0.7 39.8 39
350 B Glucose 1 2 1 15 70 6.8 4.5 63
350 B Glucose 6 3 1 15 43 5.4 1.2 63
380 B Glucose 6 7 1 15 45 7 5.6 60
380 B Glucose 6 7 Mo 1 15 43 7.2 5.2 60
380 B Sludge 3 0.5 1 15 68 11.8 11.7 17
380 B Glycerol 3 1.3 1 15 87 27.1 15.4 16
380 B Glycine 3 1.3 1 15 51 16.7 5.1 16
380 B HAa 3 1.3 1 15 19 9.2 2.0 16
400 C SLW b 20 5 ~3 ~6 64
400 B Sawdust 10 2 5 24 46 1.2 7.4 65
400 B Sawdust 10 2 6 92 100 3.3 20.1 65
450 B PS c 10 2 Fe 30 20 - 22 16 66
450 B PS c 10 2 Mo 30 20 94 17 13 67
500 B Glucose 5 10 475 60 45 8.3 4 20
500 B Glucose 5 10 158 60 38 9 2.2 20
500 B SFS d 6 10 158 60 8 3.2 68
500 B Corncob 6 10 158 60 3.5 3.7 68
650 B Methane 15 26% 66% 69
750 C Coal 2 15 60% 10% 70
* B: batch, C: continuous a Humic acid
b synthetic liquefied wood
c peanut shell
d sunflower stalk
Selected results obtained from SCWG of organic maters with Raney nickel catalyst are
listed in Table 2.2. These results indicate that carbon conversion and hydrogen yield
strongly depend on the nature of the feed, feed to catalyst ratio and the contact time
between the feed and the catalyst. Raney nickel has been applied to a variety of feeds at
a wide range of operating conditions in SCWG process. In all cases, authors reported a
Page 48
28
significant improvement in conversion upon utilization of this catalyst. Furthermore, it
should be highlighted that whenever Raney nickel and other catalysts were used in the
same reaction, Raney catalysts resulted in one of the highest conversions compared to
other catalysts. Fresh skeletal nickel catalyst has a considerable capability in cleaving C-
O bonds. Therefore, if used for gasification of oxygenated compounds, it consumes a
portion of the produced hydrogen and results in a methane-rich gas mixture. This is
particularly more pronounced at lower operating temperatures and higher feed
concentrations which both favor high methane concentrations at equilibrium. If hydrogen
production is the target of gasification, three approaches can be utilized to address this
concern and increase the hydrogen selectivity. Firstly, reaction time (or equivalently
weight hourly space velocity) can be optimized to achieve maximum amount of hydrogen
before substantial methanation occurs. Consequently, the maximum hydrogen yield may
not translate to complete carbon gasification and its exact value depends on the feed type,
concentration as well as the reaction temperature. However, there is always a risk
associated with this strategy: partial carbon gasification could result in faster catalyst
deactivation and/or reactor clogging due to formation of tarry materials over time. The
second strategy to address the low hydrogen selectivity of Raney nickel catalyst is to
modify its surface chemistry to retain its high C-C breaking activity but to retard C-O
breaking ability. It has been shown that surface modification of Raney nickel with small
quantities of tin can fulfill this requirement and significantly enhance the hydrogen to
methane ratio in the products [41-44]. Other than tin, the addition of other promoters such
as Mo and Fe may also alter the activity and selectivity of Raney nickel, but the effects of
these promoters are far less pronounced. The third strategy to increase the hydrogen
Page 49
29
selectivity, which is only applicable to the supported catalysts, is utilization or
modification of the supports. For instance, it has been shown that addition of ceria to
alumina support can enhance the selectivity of the catalyst for SCWG reactions [71].
Also, it should be noted that methanation reaction is more sensitive to metal dispersion,
and as a result, increasing the metal loading on the catalyst may improve the hydrogen
selectivity.
2.3.2.2- Supported catalysts
Supported nickel catalysts
A wide variety of supported nickel catalysts have been used for catalyzing SCWG (Table
2.3). In the absence of an organic feed, nickel is found to react with SCW to form nickel
oxide and hydrogen. Nickel oxide hardly has any catalytic activity for the reactions
involved in SWG. Given that, a minimum feed concentration is needed to keep the nickel
surface reduced. A large number of papers on the activity of nickel catalysts in SCW
have been published where stability of the support in SCW was overlooked. In batch
experiments, the rates of gasification reactions and deactivation of a catalyst with an
unstable support (i.e., due to hydrolysis, phase change, etc.) may be comparable.
Therefore, even for a typical batch experiment (e.g. ~30 min), instability of catalyst
supports may significantly affect the carbon conversion and product distribution. Due to
the high turnover frequency associated with nickel (mostly edges and steps [47]) for
cleaving C-O bonds, high carbon conversions in batch reactors are always associated
with low hydrogen selectivity whereas higher hydrogen selectivity may be obtained in a
Page 50
30
continuous reactor with the same catalyst at the same carbon conversion. Until now, no
useful support or promoter has been found to be able to significantly improve the
hydrogen selectivity of supported nickel catalysts. Our recent study showed that using the
same total weight of nickel, hydrogen selectivity improves by increasing the nickel
loading on an alumina support. Typically, if a nickel/support catalyst is found to be active
for gasifying a certain type of biomass or a model compound under hydrothermal
condition, the same catalyst will be effective for the decomposition of other organic feeds
under similar operating conditions. One major exemption from this rule is gasification of
lignin, which is highly cross-linked biopolymers, as well as the humic substances.
Page 51
31
Table 2.3 Selected results of catalytic SCWG using supported nickel catalysts.
Tem
p.
Rea
ctor
*
Support
Ni
Fee
d
Conc.
Fee
d /
Cat
alyst
Tim
e
WH
SV
CG
R
H2
CH
4
Ref
.
oC - - % - wt % g/g min h
-1 % mmol/g mmol/g -
210 C SiO2 19 EG a 10 12 1.6 1.1 72
350 B G1-80BASF Phenol 10 120 88 1.9 31.6 38
350 B -Al2O3 48 Cresol 10 0.7 100 89 2.8 34.8 73
350 B -Al2O3 48 Ethanol 10 0.7 80 100 1.3 32.8 73
350 B YSZ Cresol 10 60 0.2 39
350 B Graphite Cresol 10 60 ~ 0 39
350 B SiO2-Al2O3 62 Cresol 10 100 54 1.5 21 39
350 B Kieselguhr 50 Cresol 10 100 38 1.8 15 39
350 B MgO-Al2O3 25 Cresol 10 80 24 10.1 7.7 39
350 B -Al2O3 25 Cresol 10 100 5 4.3 1.3 39
350 C -Al2O3 48 Cresol 2 99 1 40 74
350 C BASF Cresol 2 97 0.7 34.5 74
350 C SiO2-Al2O3 62 Cresol 2 69 1.9 28.9 74
350 B Ni5132-Engel. Cellulose 2.5 20 74 11 7 15
350 B Ni5132-Engel. Xylan 2.5 20 69 7.5 8.5 15
350 B Ni5132-Engel. Lignin 2.5 20 9 1 0.5 15
350 B SiO2-Al2O3 50 Cellulose 14 2.5 70 14 6.8 86
350 B AS b Cellulose 14 2.5 ~30 58 8.6 6.7 75
350 B SiO2 Cellulose 14 2.5 ~30 46 6.6 4.5 75
350 B MgO Cellulose 14 2.5 ~30 76 8 12.8 75
350 C C 46 Phenol 0.26 0.18 100 6.3 35 76
390 C ZrO2 15 PEG d 50 37 3 77
400 C Ni5256-Engel. Glucose 0.4 ~60 15 1 78
400 B MgO 20 Lignin 5.5 1 120 15 5 2.5 79
400 B Kieselguhr Cellulose 33 5 60 67 3.5 10.6 80
400 B Ni5132-Engel. Cellulose 2.5 20 80 10 8 14
400 B Ni5132-Engel. Cellulose 1.3 20 90 8 14 14
400 B Ni5132-Engel. Lignin 0.8 20 17 1 3 14
400 B C 5 Lignin 3.3 0.7 60 19 0.7 2.6 49
400 B -Al2O3 20 Glucose 9 5 20 33 10.5 2.5 71
400 B CeO2- -Al2O3 20 Glucose 9 5 20 35 12.7 2.1 71
420 B -Al2O3 Wood 1 23 4.2 1.7 81
500 B CNT d 58 Cellulose 9 1.6 15 30 8 3.4 82
500 B SiO2-Al2O3 65 Glucose 4.5 6.3 30 78 6.2 4.1 83
550 C 32 Decane 7.5 50 26.7 26 84
600 C ZrO2 10 BC e ~2.5 0.2 96 39.2 ~ 8 85
600 C TiO2 10 BC e ~2.5 0.2 74 21.6 ~6.1 85
650 C C 16 Glucose 11 98 13.6 6.2 52
* B: batch, C: continuous a ethylene glycol b
aluminum silicate c polyethylene glycol d
carbon nanotube e Biocrude oil obtained from switchgrass
Page 52
32
Many research groups have studied the performance of supported nickel catalysts for
SCWG. However, since the gas yield strongly depends on reactor design, feed
concentration and operating conditions (e.g. temperature, feed to catalyst ratio, water
density and reaction time), direct comparison between these results is rather challenging,
if not impossible. Critical review of the literature on the SCWG of biomass with
supported nickel catalysts reveals that no clear correlation between support’s properties
and gasification yield is yet established. Instability of the support and its impact to the
activity of the supported catalysts adds to the complexity of this issue.
Our recent results in batch experiments (to be published elsewhere) showed that nickel
dispersion, which can be implicitly correlated to metal loading and support’s surface area,
mostly affects the methane formation rate, whereas its impact on the carbon gasification
efficiency is less pronounced. This is consistent with the results presented in [86] that
there is no clear evidence that carrier’s surface area can directly affect the carbon
conversion. However, the suggestion that only nickel particles deposited on the external
surface of the catalysts contributes to the gasification [86] is questionable. In fact, it has
been reported that ruthenium/activated carbon catalyst, in which the active metal is
dispersed into the fine pores of activated carbon (see table 2.5), is quite effective for the
gasification of various biomass compounds. Furthermore, our experiments with pelletized
and powder Ni/Al2O3 catalysts produced the same amount of gas with similar
composition (15min, 380 oC and 2 wt% glucose). This result suggests that gasification
reactions, at least at the condition mentioned above, are not diffusion limited.
Page 53
33
Catalyst supports with strong acidic properties such as zeolites result in the dehydration
of the organics in aqueous phase, which subsequently consumes a portion of the
generated hydrogen to hydrogenate the carbon double bond. The existence of carbon
double bond would also lead to C-C bond formation, and as a result, lower gasification
efficiency will be achieved. These two pathways eventually lead to poor CGR and
hydrogen selectivity.
In order to better understand the effects of catalyst carrier on the catalytic gasification of
organics in SCW, we have recently carried out a high throughput catalyst screening.
Table 2.4 lists some of the results obtained from the gasification of 2 wt % glucose
solution using 1 g of supported catalysts containing 5 wt% reduced nickel. This study
was conducted using a 50 mL stainless steel batch reactor that was heated by immersing
into a molten salt bath at 380oC. For more detailed information about the experimental
setup and analytical methods, please refer to [17].
According to Table 2.4, Ni/α-Al2O3 was found to be, at least as active as Ni/γ-Al2O3
under the conditions tested, clearly in contrast to previously published data [39, 81]. We
also found that catalyst particle size affected neither the carbon gasification efficiency nor
gas composition. The complete set of results and more detailed experimental methods
will be published elsewhere.
Although nickel crystallites may sinter under hydrothermal conditions, the long term
activities of supported nickel catalysts are closely related to the stability of the carrier
under the reaction conditions. Stable supports in SCW are found to be carbon (e.g.
activated carbon [39, 52], carbon nanotube [82, 87]), α-Al2O3, rutile TiO2, and
Page 54
34
monoclinic ZrO2 [39]; whereas silica, alumina (except α-Al2O3), MgO, Cubic ZrO2,
silica-alumina, aluminosilicate, and most zeolites are unstable in SCW. γ-Al2O3 is
reported to transform into α-Al2O3 [88] or boehmite (AlO(OH)) [39]. Using XRD
analysis, we confirmed the phase change from γ-Al2O3 to boehmite by hydrothermal
treatment of γ-Al2O3 at 380oC and 250bar for 60 minutes. Our studies indicated that
although α-Al2O3 does not undergo any phase change in SCW, it becomes more
crystalline upon exposure to SCW even for few minutes. Also, there is an inconsistency
in the literature regarding stability of high surface area TiO2 (i.e., anatase phase) in SCW
[38, 88]. A 15 wt% Ni/ZrO2 has been shown to retain its activity for at least 85h in SCW
at 390oC [77]. Stabilities of other supports such as YSZ have not been yet evaluated in
the literature.
It has been reported that doping of the supported nickel catalysts with Ru, Cu and Ag
[38] can improve the catalyst lifetime by suppressing the hydrothermal crystallite growth.
Catalyst regeneration (Ni/MgO) after SCWG has been also attempted [89]. It was found
that MgO interacts with SCW to form Mg(OH)2, and the initial composition can be
retrieved upon calcination at 750oC. However, the reduction of regenerated catalyst
resulted in lower active surface and hence, less catalytic activity.
Page 55
35
Table 2.4 Performance of supported catalysts for gasification of 2 wt% glucose
solution. 380oC, 15min, glucose 0.2g, catalyst 1g, 5 wt% Ni, water 9.8g.
Support BET
[m2/g]
Particle
size
[µm]
CGR
%
H2
[mmol/g]
CH4
[mmol/g]
Catalyst-free - - 22 2.7 0.1
α-Al2O3 powder 10 1 84 18.3 9.5
α-Al2O3 powder 8 118 73 21.3 5.6
γ-Al2O3 spheres 225 4000 65 19.0 4.1
γ-Al2O3 powder 225 100 68 18.6 5.0
TiO2 49 59 16.7 3.5
MgO 14 71 26.6 6.2
YSZ 144 0.1 51 11.5 2.4
Supported ruthenium catalysts
Ruthenium is found to be very active for reactions involved in SCWG. Ruthenium as
well as other noble metal catalysts usually have a higher metal dispersion compared to
nickel catalysts, partly because their lower metal loadings on the support (typically below
5%), limited surface mobility and hence better resistance against sintering due to their
high melting points, and finally, their milder reduction temperatures. Table 2.5
summarizes the results obtained from ruthenium-catalyzed SCWG of different organic
materials.
Page 56
36
Table 2.5 Selected results of catalytic SCWG using supported ruthenium
catalysts.
Tem
p.
Rea
cto
r *
Support
Ru
Fee
d
Conc.
Fee
d /
Cat
alyst
Tim
e
WH
SV
CG
R
H2
CH
4
Ref
.
oC - - % - wt % g/g min h
-1 % mmol/g mmol/g -
250 B TiO2-AR a 3 Phenol 10 120 61 1.1 18.1 38
350 B TiO2-R b 3 Phenol 10 100 76 1 28.7 38
350 B TiO2-AR 3 Phenol 10 100 94 0.2 33.4 38
350 B C 8 Phenol 10 122 88 0.6 32.8 38
350 B -Al2O3 5 Cresol 10 90 89 0.6 34.8 39
350 B -Al2O3 5 Cresol 10 120 44 2.2 15.8 39
350 B -Al2O3 5 Cresol 10 120 ~ 0 0.6 0 39
350 B ZrO2 5 Cresol 10 90 29 2.9 10.7 39
350 C Al2O3 5 Cresol 2 100 0.4 13 74
380 B -Al2O3 5 Glucose 6 3.5 15 47 5.5 5.2 60
380 B C 5 Glucose 6 3.5 15 42 4 5.1 60
360 C C 5 Glucose 2 1.2 82 3.2 8.8 32
400 C C 5 Glucose 2 1.2 98 18.5 11 32
400 B C 2 Algae 5 0.5 60 45 2.7 4 94
400 B ZrO2 2 Algae 10 0.7 63 25 2.4 2.6 94
400 B TiO2 2 Cellulose 5 0.3 15 74 2.7 13.4 95
400 B -Al2O3 5 LMC c 17 4 15 15 1.3 6.6 96
400 B C 5 LMC c 17 4 15 5 0.6 2.2 96
400 C C 2 SLW d 20 1.6 100 ~ 0 25.5 64
400 B -Al2O3 5 Lignin 3.3 120 75 2.4 30 88
400 B TiO2 2 Lignin 3.3 0.3 180 97 2.6 28.5 92
400 B C 5 Lignin 3.3 0.7 60 80 2.4 23.6 91
450 B C 5 Lignin 3.3 0.7 60 100 4.1 27.7 49
450 C C 5 Glucose 2 1.2 100 33.4 6.5 32
500 B C 5 Cellulose 10 2.5 20 100 17 12 97
550 C ZrO2 1 Glycerol 5 20 6.3 2.1 98
600 C TiO2-R b 3 Glucose 10 30
e 85 21 8 28
600 C TiO2-R b 3 Glycerol 10 30
e 100 22.3 12 28
600 B TiO2 2 MA f 7 2 72 10 6 29
600 B TiO2-R b 3 Glucose 5 1 100 22.8 9.7 27
600 B TiO2-R b 3 Glucose 17 1 100 4.4 16.1 27
600 C ZrO2 2 BC j ~2.5 0.2 67 ~0 11.1 85
600 C TiO2 2 BC j ~2.5 0.2 78 26.0 6.5 85
700 C -Al2O3 5 Glycerol 5 2.5 98 55.4 5.8 99
800 C -Al2O3 5 Glycerol 5 2.5 93 70.6 3.7 99
* B: batch, C: continuous a mixture of anatase and rutile
b rutile
c lignin model compound (alkylphenol)
d synthetic liquefied wood e
30 Nm3/ (h. m
3cat)
f microalgae j
Biocrude oil obtained from
switchgrass
Page 57
37
The most frequently used supported ruthenium catalysts for SCWG are Ru/C, Ru/TiO2
and Ru/Al2O3. Carbon is widely used as a catalyst support without solid acid-base
properties; however, it is difficult to create and retain high dispersions of metals on the
surface of carbon due to the lack of metal-support interaction. In general, there are two
approaches to anchor an active metal onto the surface of carbon: fixing the active metal
to the defects (e.g., steps in a basal plane of graphite) as well as attachment of metals to
the previously created oxygen functional groups [59]. Wide varieties of different
functional groups may exist on the surface of carbon and the performance of carbon as
both catalyst and support is highly related to the types and concentrations of these
functional groups at the surface. The most abundant hetro-atoms found on the surface of
carbon are hydrogen and oxygen. It has been also suggested that the chemical vapor
deposition (CVD) techniques can be used to apply carbon on the uncovered surface of a
conventional oxide-supported catalyst to suppress its acid-base properties.
There are few of studies focused on the stability of supported ruthenium catalysts [38, 49,
64, 72, 74, 88, 90-93]. Ruthenium is more resistant than nickel against oxidation as well
as hydrothermal sintering. Ruthenium supported on rutile titania [38] and carbon [64] are
confirmed to have a good long term stability. However, presence of sulfur-containing
compounds, even at very low concentrations, dramatically deactivates the catalyst by
successive adsorption and/or solid state reaction on the metal surface [64, 90-92]. One
possible solution to address this concern is to remove sulfur in a hydrothermal salt
separator before passing the feed over the catalytic bed [94]. The salt separator should be
operated at near-critical water conditions to take the advantageous of the low solubilities
Page 58
38
of the salts. In the context of steam reforming of natural gas, the sulfur content of the feed
should be normally reduced to less than 0.01 ppm, which is well within the capabilities of
the existing sulfur removal processes. In order to develop a viable biomass SCWG
process, more detailed studies on both salt separator unit and development of sulfur-
resistant catalysts should be conducted.
Other precious metals such as platinum [44, 57, 72, 100] and palladium [63, 72, 100,
101] have been also found to be active for catalyzing the decomposition reactions in
SCW.
2.3.3- Oxides
Few oxides such as CaO [102], ZrO2 [103], CeO2 [31] and RuO2 [55, 56, 104] have been
also employed for catalyzing the SCWG. CaO is known to capture the produced carbon
dioxide (and forms carbonate); hence, it resulted in an increase in the hydrogen
concentration [102]. Zirconia was found to be useful in increasing the hydrogen yield
obtained from SCWG of glucose [103]. Using ceria as a catalyst did not significantly
increase the carbon gasification efficiency [31].
Red mud, a byproduct of Bayer process for aluminum production from bauxite, has been
also used as a potential catalyst for SCWG [68]. Red mud contains large amounts of iron
oxides (typically 30-60%) and smaller quantities of other oxides (such as CaO and NaO).
Red mud can facilitate the rate of hydrogen production in SCWG likely through
accelerating the water-gas shift reaction [68]. However, further experiments with pure
Fe2O3 and other oxides that present in red mud (e.g. CaO and NaO), particularly with
Page 59
39
biomass model compounds, are needed to identify the active element(s) and the exact
mechanism that leads to the higher hydrogen production yields.
2.4 Concluding Remarks
In this paper, a comprehensive review of the recent advancements in heterogeneous
catalysis for supercritical water gasification has been provided. Performance and
durability of commercially available and laboratory-made catalysts including supported
and skeletal metal catalysts, activated carbon, metal wires and other innovative catalysts
for the purpose of hydrothermal hydrogen production from biomass are discussed.
Experimental data presented here covered a wide range of reaction temperature and types
of catalysts and was presented on a common basis in terms of carbon conversion and
hydrogen and methane yields. This information can be served as a useful tool for the
selection and design of new catalysts and SCWG processes. Despite recent advances,
there is a need to better understand the relationship between chemical and physical
properties of solid catalysts to their performances in catalyzing different reactions
involved in SCWG.
2.5 References
[1] Kruse A. Supercritical Water Gasification. Biofuels, Bioprod Bioref 2008; 2:415–437.
[2] Osada M, Sato T, Watanabe M, Shirai M, Arai K. Catalytic Gasification of Wood
Biomass in Subcritical and Supercritical Water. Combust Sci Technol 2006; 178: 537–
552.
Page 60
40
[3] Matsumura Y, Minowa T, Potic B, Kersten SRA, Prins w, Van Swaaij WPM, Van de
Beld B, Elliott DC, Neuenschwander GG, Kruse A, Antal MJ. Biomass gasification in
near- and super-critical water: Status and prospects. Biomass & Bioenergy 2005; 29:269–
292.
[4] Matsumura Y, Sasaki M, Okuda K, Takami S, Ohara S, Umetsu M, Adschiri T.
Supercritical Water Treatment of Biomass for Energy and Material Recovery. Combust
Sci Technol 2006; 178:509–536.
[5] Kruse A, Vogel H. Heterogeneous Catalysis in Supercritical Media: 2. Near-Critical
and Supercritical Water. Chem Eng Technol 2008; 31:1241–1245.
[6] Davda RR, Shabaker JW, Huber GW, Cortright RD, Dumesic JA. A review of
catalytic issues and process conditions for renewable hydrogen and alkanes by aqueous-
phase reforming of oxygenated hydrocarbons over supported metal catalysts. Appl Catal
B 2005; 56:171–186.
[7] Chheda JN, Huber GW, Dumesic JA. Liquid-Phase Catalytic Processing of Biomass
Derived Oxygenated Hydrocarbons to Fuels and Chemicals. Angew Chem Int Ed 2007;
46:7164 – 7183.
[8] Huber GW, Dumesic JA. An overview of aqueous-phase catalytic processes for
production of hydrogen and alkanes in a biorefinery. Catal Today 2006; 111:119–132.
[9] Elliott DC. Catalytic hydrothermal gasification of biomass. Biofuels, Bioprod Bioref
2008; 2:254–265.
[10] Guo Y, Wang SZ, Xu DH, Gong YM, Ma HH, Tang XY. Review of catalytic
supercritical water gasification for hydrogen production from biomass. Renew Sustain
Energ Rev 2010; 14:334–343.
Page 61
41
[11] Savage PE. A perspective on catalysis in sub- and supercritical water. J Supercrit
Fluids 2009; 47:407–414.
[12] Calzavara Y, Joussot-Dubien C, Boissonnet G, Sarrade S. Evaluation of biomass
gasification in supercritical water process for hydrogen production. Energ Convers
Manage 2005; 46:615–631.
[13] Minowa T, Fang Z, T. Ogi, Varhegyi G. Decomposition of Cellulose and Glucose in
Hot-Compressed Water under Catalyst-Free Conditions. J Chem Eng Jpn 1998; 31:131-
134.
[14] Yoshida T, Oshima Y, Matsumura Y. Gasification of biomass model compounds
and real biomass in supercritical water. Biomass & Bioenergy 2004; 26:71-78.
[15] Yoshida T, Matsumura Y. Gasification of Cellulose, Xylan, and Lignin Mixtures in
Supercritical Water. Ind Eng Chem 2001; 40:5469-5474.
[16] Afif E, Azadi P, Farnood R. Catalytic Gasification of Model Compounds of
Activated Sludge and their Mixtures in Supercritical Water. Unpublished results.
[17] Afif E, Azadi P, Farnood R. Catalytic Hydrothermal Gasification of Activated
Sludge. Appl Catal B; In press, doi:10.1016/j.apcatb.2011.04.003.
[18] Matsumura Y, Minowa T. Fundamental design of a continuous biomass gasification
process using a supercritical water fluidized bed. Int J Hydrogen Energy 2003; 29:701-
707.
[19] Lu YJ, Jin H, Guo LJ, Zhang XM, Cao CQ, Guo X. Hydrogen production by
biomass gasification in supercritical water with a fluidized bed reactor. Int J Hydrogen
Energy 2008; 33:6066-6075.
Page 62
42
[20] Sınag A, Kruse A, Rathert J. Influence of the Heating Rate and the Type of Catalyst
on the Formation of Key Intermediates and on the Generation of Gases During
Hydropyrolysis of Glucose in Supercritical Water in a Batch Reactor. Ind Eng Chem
2004; 43:502-508.
[21] Azadi P, Farnood R, Vuillardot C. Estimation of Heating Time in Tubular
Supercritical Water Reactors. J Supercrit Fluids 2011; 55:1038-1045.
[22] Potic B, Kersten SRA, Ye M, Van der Hoef MA, Kuipers JAM, Van Swaaij WPM.
Fluidization with hot compressed water in micro-reactors. Chem Eng Sci 2005; 60:5982
– 5990.
[23] DiLeo GJ, Neff ME, Kim S, Savage PE. Supercritical Water Gasification of Phenol
and Glycine as Models for Plant and Protein Biomass. Energy Fuels 2008; 22:871–877.
[24] Resende FLP, Savage PE. Effect of Metals on Supercritical Water Gasification of
Cellulose and Lignin. Ind Eng Chem 2010; 49:2694–2700.
[25] DiLeo GJ, Savage PE. Catalysis during methanol gasification in supercritical water.
J Supercrit Fluids 2006; 39:228–232.
[26] DiLeo GJ, Neff ME, Savage PE. Gasification of Guaiacol and Phenol in
Supercritical Water. Energy Fuels 2007; 21:2340-2345.
[27] Kersten SRA, Potic B, Prins W, Van Swaaij WPM. Gasification of Model
Compounds and Wood in Hot Compressed Water. Ind Eng Chem 2006; 45:4169-4177.
[28] Rossum GV, Potic B, Kersten SRA, Van Swaaij WPM. Catalytic gasification of dry
and wet biomass. Catal Today 2009; 145:10–18.
Page 63
43
[29] Chakinala AG, Brilman DWF, Van Swaaij WPM. Kersten SRA. Catalytic and Non-
catalytic Supercritical Water Gasification of Microalgae and Glycerol. Ind Eng Chem
2010; 49:1113–1122.
[30] Matsumura Y, Xu X, Antal MJ. Gasification characteristics of activated carbon in
supercritical water. Carbon 1997; 35:819-824.
[31] Lu YJ, Guo LJ, Ji CM, Zhang XM, Hao XH, Yan QH. Hydrogen production by
biomass gasification in supercriticalwater: A parametric study. Int J Hydrogen Energy
2006; 31:822-831.
[32] Azadi P, Otomo J, Hatano H, Oshima Y, Farnood R, Hydrogen production by
catalytic near-critical water gasification and steam reforming of glucose. Int J Hydrogen
Energy 2010; 35:3406-3414.
[33] Xu X, Matsumura Y, Stenberg J, Antal MJ. Carbon-Catalyzed Gasification of
Organic Feedstocks in Supercritical Water. Ind Eng Chem 1996; 35:2522-2530.
[34] Matsumura Y, Yanachi S, Yoshida T, Glucose Decomposition Kinetics in Water at
25 MPa in the Temperature Range of 448-673 K. Ind Eng Chem 2006; 45:1875-1879.
[35] Schmieder H, Abeln J, Boukis N, Dinjus E, Kruse A, Kluth M, Petrich G, Sadri E,
Schacht M. Hydrothermal gasification of biomass and organic wastes. J Supercrit Fluids
2000; 17:145–153.
[36] Fang Z, Minowa T, Smith RL, Ogi T, Kozinski JA. Liquefaction and Gasification of
Cellulose with Na2CO3 and Ni in Subcritical Water at 350°C. Ind Eng Chem 2004;
43:2454-2463.
[37] Lee IG, Kim MS, Ihm SK. Gasification of glucose in supercritical water. Ind Eng
Chem 2002; 41:1182-1188.
Page 64
44
[38] Elliott DC, Hart TR, Neuenschwander GG. Chemical Processing in High-Pressure
Aqueous Environments. 8. Improved Catalysts for Hydrothermal Gasification. Ind Eng
Chem 2006; 45:3776-3781.
[39] Elliott DC, Sealock LJ, Baker EG. Chemical Processing in High-pressure Aqueous
Environments. 2. Development of Catalysts for Gasification. Ind Eng Chem 1993;
32:1542-1548.
[40] Davda RR, Dumesic JA. Renewable hydrogen by aqueous-phase reforming of
glucose. Chem Commun 2004; 36–37.
[41] Huber GW, Shabaker JW, Dumesic JA. Raney Ni-Sn Catalyst for H2 Production
from biomass-derived hydrocarbon. Science 2003; 300:2075-2077.
[42] Shabaker JW, Simonetti DA, Cortright RD, Dumesic JA. Sn-modified Ni catalysts
for aqueous-phase reforming: Characterization and deactivation studies. J Catal 2005;
231:67–76.
[43] Shabaker JW, Dumesic JA. Kinetics of Aqueous-Phase Reforming of Oxygenated
Hydrocarbons: Pt/Al2O3 and Sn-Modified Ni Catalysts. Ind Eng Chem 2004; 43:3105-
3112.
[44] Shabaker JW, Huber GW, Dumesic JA. Aqueous-phase reforming of oxygenated
hydrocarbons over Sn-modified Ni catalysts, J Catal 2004; 222:180–191.
[45] Richardson JT. Principles of Catalyst Development. New York, Plenum Press; 1989.
[46] Bartholomew CH, Farrauto RJ. Fundamentals of industrial catalytic processes. 2nd
edition. NJ, John Wiley and Sons; 2006.
[47] Nørskov JK, Bligaard T, Rossmeisl J, Christensen CH. Towards the Computational
Design of Solid Catalysts. Nature Chemistry 2009; 1:37-46.
Page 65
45
[48] Antal MJ, Allen SG, Schulman D, Xu X. Biomass Gasification in Supercritical
Water. Ind Eng Chem 2000; 39:4040-4053.
[49] Yamaguchi A, Hiyoshi N, Sato O, Bando KK, Osada M, Shirai M. Hydrogen
production from woody biomass over supported metal catalysts in supercritical water.
Catal Today 2009; 146:192–195.
[50] Yamaguchi A, Hiyoshi N, Sato O, Osada M, Shirai M. EXAFS Study on Structural
Change of Charcoal-supported Ruthenium Catalysts during Lignin Gasification in
Supercritical Water. Catal Lett 2008; 122:188–195.
[51] Xu X, Antal MJ. Gasification of Sewage Sludge and Other Biomass for Hydrogen
Production in Supercritical Water. Environmental Progress 1998; 17:215-220.
[52] Lee IG, Ihm SK. Catalytic Gasification of Glucose over Ni/Activated Charcoal in
Supercritical Water. Ind Eng Chem 2009; 48:1435–144.
[53] Yanagida T, Minowa T, Shimizu Y, Matsumura Y, Noda Y. Recovery of activated
carbon catalyst, calcium, nitrogen and phosphate from effluent following supercritical
water gasification of poultry manure. Bioresour Technol 2009; 100:4884–4886.
[54] Fang Z, Minowa T, Fang C, Smith RL, Inomata H, Kozinski JA. Catalytic
hydrothermal gasification of cellulose and glucose. In J Hydrogen Energy 2008; 33:981–
990.
[55] Yamamura T, Mori T, Park KC, Fujii Y, Tomiyasu H. Ruthenium(IV) dioxide-
catalyzed reductive gasification of intractable biomass including cellulose, heterocyclic
compounds, and sludge in supercritical water. J Supercrit Fluids 2009; 51:43–49.
[56] Izumizaki Y, Park KC, Tachibana Y, Tomiyasu H, Fujii Y. Organic Decoposition in
Supercritical Water by an aid of Ruthenium (IV) Oxide as a Catalyst -Exploitation of
Page 66
46
Biomass Resources for Hydrogen Production. Progress in Nuclear Energy 2005; 47:544-
552.
[57] Shabaker JW, Huber GW, Davda RR, Cortright RD, Dumesic JA. Aqueous-phase
reforming of ethylene glycol over supported platinum catalysts. Catal Lett 2003; 88:1-8.
[58] Nishimura S. Handbook of Heterogeneous Catalytic Hydrogenation for Organic
Synthesis. 1st edition. NJ, John Wiley and Sons; 2001.
[59] Ertl G, Knozinger H, Weitkamp J. Preparation of Solid Catalysts. 1st edition. Wiley-
VCH; 1999.
[60] Azadi P, Syed KM, Farnood R. Catalytic gasification of biomass model compound
in near-critical water. Appl Catal A 2009; 358:65–72.
[61] Smith HA, Bedoit WC, Fuzek JF. The preparation and aging of Raney nickel
catalysts. J Am Chem Soc 1949; 71:3769–3771.
[62] Pattison JN, Degering F. Some factors influencing the activity of Raney nickel
catalyst. II The role of oxygen in the aging of Raney nickel catalyst. J Am Chem Soc
1951; 73:486–487.
[63] Azadi P, Khodadadi AA, Mortazavi Y, Farnood R. Hydrothermal gasification of
glucose using Raney nickel and homogeneous organometallic catalysts. Fuel Process
Technol 2009; 90:145–151.
[64] Waldner MH, Krumeich F, Vogel F. Synthetic natural gas by hydrothermal
gasification of biomass Selection procedure towards a stable catalyst and its sodium
sulfate tolerance. J Supercrit Fluids 2007; 43:91–105.
[65] Waldner MH, Vogel F. Renewable Production of Methane from Woody Biomass by
Catalytic Hydrothermal Gasification. Ind Eng Chem 2005; 44:4543-4551.
Page 67
47
[66] Pei A, Zhang L, Jiang B, Guo L, Zhang X, LV Y, Jin H. Hydrogen production by
biomass gasification in supercritical or subcritical water with Raney-Ni and other
catalysts. Front. Energy Power Eng. China 2009, 3(4): 456–464
[67] P. Aixia, G. Liejin, J. Hui, Experimental research on catalysts and their catalytic
mechanism for hydrogen production by gasification of peanut shell in supercritical water.
Front Energy Power Eng China 2007; 1:451–456.
[68] Yanik J, Ebale S, Kruse A, Saglam M, Yuksel M. Biomass gasification in
supercritical water: II. Effect of catalyst. Int J Hydrogen Energy 2008; 33:4520–4526.
[69] Kruse A, Dinjus E. Hydrogen from Methane and Supercritical. Angew Chem Int Ed
2003; 42:909-911.
[70] Li Y, Guo L, Zhang X, Jin H, Lu Y. Hydrogen production from coal gasification in
supercritical water with a continuous flowing system. Int J Hydrogen Energy 2010;
35:3036–3045.
[71] Lu Y, Li S, Guo L, Zhang X. Hydrogen production by biomass gasification in
supercritical water over Ni/Al2O3 and Ni/CeO2-Al2O3 catalysts. Int J Hydrogen
Energy 2010; 35:7161–7168.
[72] Davda RR, Shabaker JW, Huber GW, Cortright RD, Dumesic JA. Aqueous-phase
reforming of ethylene glycol on silica-supported metal catalysts. Appl Catal B 2003;
43:13–26.
[73] Elliott DC, Sealock LJ, Baker EG. Chemical Processing in High-pressure Aqueous
Environments. 3. Batch Reactor Process Development Experiments for Organics
Destruction. Ind Eng Chem 1994; 33:558-565.
Page 68
48
[74] Elliott DC, Phelps MR, Sealock LJ, Baker EG. Chemical Processing in High-
pressure Aqueous Environments. 4. Continuous-Flow Reactor Process Development
Experiments for Organics Destruction. Ind Eng Chem 1994; 33:566-574.
[75] Minowa T, Inoue S. Hydrogen Production from biomass by catalytic gasification in
hot compressed water. Renew Energ 1999; 16:1114-1117.
[76] Sharma A, Nakagawa H, Miura K. Uniform dispersion of Ni nano particles in a
carbon based catalyst for increasing catalytic activity for CH4 and H2 production by
hydrothermal gasification. Fuel 2006; 85:2396–2401.
[77] Yan B, Wu J, Xie C, He F, Wei C. Supercritical water gasification with Ni/ZrO2
catalyst for hydrogen production from model wastewater of polyethylene glycol. J
Supercrit Fluids 2009; 50:155–161.
[78] Yoshida T, Oshima Y. Partial Oxidative and Catalytic Biomass Gasification in
Supercritical Water: A Promising Flow Reactor System. Ind Eng Chem 2004; 43:4097-
4104.
[79] Furusawa T, Sato T, Sugito H, Miura Y, Ishiyama Y, Sato M, Itoh N, Suzuki N.
Hydrogen production from the gasification of lignin with nickel catalysts in supercritical
water. Int J Hydrogen Energy 2007; 32:699–704.
[80] Minowa T, Ogi T, Dote Y, Yokoyama S. Methane production from cellulose by
catalytic gasification. Renew Energ 1994; 5:813-815.
[81] Vogel F, Hildebrand F. Catalytic Hydrothermal Gasification of Woody Biomass at
High Feed Concentrations. Chem Eng Trans 2002; 2:771-777.
Page 69
49
[82] Taylor AD, DiLeo GJ, Sun K. Hydrogen production and performance of nickel
based catalysts synthesized using supercritical fluids for the gasification of biomass. Appl
Catal B 2009; 93:126–133.
[83] Youssef EA, Chowdhury MBI, Nakhla G, Charpentier P. Effect of nickel loading on
hydrogen production and chemical oxygen demand (COD) destruction from glucose
oxidation and gasification in supercritical water. Int J Hydrogen Energy 2009; 35:5034-
5042.
[84] Pinkwart K, Bayha T, Lutter W, Krausa M. Gasification of diesel oil in supercritical
water for fuel cells. J Power Sources 2004; 136:211–214.
[85] Byrd AJ, Kumar S, Kong L, Ramsurn H, Gupta RB. Hydrogen production from
catalytic gasification of switchgrass biocrude in supercritical water. Int J Hydrogen
Energy 2011; 36:3426-3433.
[86] Minowa T, Fang Z. Hydrogen production from cellulose using a reduced nickel
catalyst. Catal Today 1998; 45:411-416.
[87] Azadi P, Farnood R, Meier E. Preparation of Multiwalled Carbon Nanotube-
Supported Nickel Catalysts Using Incipient Wetness Method. J Phys Chem A 2010;
114:3962-3968.
[88] Osada M, Sato O, Arai K, Shirai M. Stability of Supported Ruthenium Catalysts for
Lignin Gasification in Supercritical Water. Energy Fuels 2006; 20:2337-2343.
[89] Furusawa T, Sato T, Saito M, Ishiyama Y, Sato M, Itoh N, Suzuki N. The evaluation
of the stability of Ni/MgO catalysts for the gasification of lignin in supercritical water.
Appl Catal A 2007; 327:300–310.
Page 70
50
[90] Elliott DC, Neuenschwander G, Hart TR, Butner RS, Zacher AH, Engelhard MH,
Young JS, McCready DE. Chemical Processing in High-pressure Aqueous Environments.
7. Process Development for Catalytic Gasification of Wet Biomass Feedstocks. Ind Eng
Chem 2004; 43: 1999-2004.
[91] Osada M, Hiyoshi N, Sato O, Arai K, Shirai M. Effect of Sulfur on Catalytic
Gasification of Lignin in Supercritical Water. Energy Fuels 2007; 21:1400-1405.
[92] Osada M, Hiyoshi N, Sato O, Arai K, Shirai M. Reaction Pathway for Catalytic
Gasification of Lignin in Presence of Sulfur in Supercritical Water. Energy Fuels 2007;
21:1854-1858.
[93] Vogel F, Waldner MH, Rouff AA, Rabe S. Synthetic natural gas from biomass by
catalytic conversion in supercritical water. Green Chem 2007; 9:616–619.
[94] Stucki S, Vogel F, Ludwig C, Haiducb AG, Brandenberger M. Catalytic gasification
of algae in supercritical water for biofuel production and carbon capture. Energ Environ
Sci 2009; 2:535–541.
[95] Osada M, Sato T, Watanabe M, Adschiri T, Arai K. Low-Temperature Catalytic
Gasification of Lignin and Cellulose with a Ruthenium Catalyst in Supercritical Water.
Energy Fuels 2004; 18:327-333.
[96] Sato T, Osada M, Watanabe M, Shirai M, Arai K. Gasification of Alkylphenols with
Supported Noble Metal Catalysts in Supercritical Water. Ind Eng Chem 2003; 42:4277-
4282.
[97] Hao X, Guo L, Zhang X, Guan Y. Hydrogen production from catalytic gasification
of cellulose in supercritical water. Chem Eng J2005; 110:57–65.
Page 71
51
[98] May A, Salvadó J, Torras C, Montane D. Catalytic gasification of glycerol in
supercritical water. Chem Eng J 2010; 160:751–759.
[99] Byrd AJ, Pant KK, Gupta RB. Hydrogen production from glycerol by reforming in
supercritical water over Ru/Al2O3 catalyst. Fuel 2008; 87:2956–2960.
[100] Youssef EA, Nakhla G, Charpentier PA. Oleic acid gasification over supported
metal catalysts in supercritical water: Hydrogen production and product distribution. Int J
Hydrogen Energy 2011; 36:4830-4842.
[101] Youssef EA, Elbeshbishy E, Hafez H, Nakhla G, Charpentier P. Sequential
supercritical water gasification and partial oxidation of hog manure. Int J Hydrogen
Energy 2010; 35:11756-11767.
[102] Zhang R, Jiang W, Cheng L, Sun B, Sun D, Bi J. Hydrogen production from lignite
via supercritical water in flow-type reactor. Int J Hydrogen Energy 2010; 35:11810-
11815.
[103] Watanabe M, Inomata H, Arai K. Catalytic hydrogen generation from biomass
(glucose and cellulose) with ZrO2 in supercritical water. Biomass & Bioenergy 2002;
22:405–410.
[104] Park KC, Tomiyasu H. Gasification reaction of organic compounds catalyzed by
RuO2 in supercritical water. Chem Commun 2003; 21:694–695.
Page 72
52
3. Screening of Nickel Catalysts for Selective Hydrogen Production
Using Supercritical Water Gasification of Glucose
* Based on P. Azadi, E. Afif, F. Azadi, R. Farnood, Catalyst Screening for Selective Hydrogen Production
Using Supercritical Water Gasification of Biomass, Journal of Green Chemistry, DOI:
10.1039/c2gc16378k.
Abstract
In this chapter, we report the activity and the selectivity of several heterogeneous nickel
catalysts for the supercritical water gasification (SCWG) of biomass. The effects of
catalyst support on the carbon conversion and hydrogen selectivity were demonstrated
using 44 different materials, covering a wide range of chemical and physical properties.
At 5% nickel loading, α-Al2O3, carbon nanotube (CNT), and MgO supports resulted in
high carbon conversions, while SiO2, Y2O3, hydrotalcite, yttria-stabilized zirconia (YSZ),
and TiO2 showed modest activities. Utilization of different γ-Al2O3 supports resulted in a
wide range of catalytic activities from almost inactive to highly active. Other catalyst
carriers such as zeolites, molecular sieves, CeO2, and ZrO2 had an insignificant activity at
the conditions tested (i.e. 380 oC, 2 wt% feed). Aside from the catalytic activity, the
stable metal oxide supports at the experimental conditions of this work, as identified by
XRD, were α-Al2O3, Boehmite, YSZ, and TiO2. Given the high hydrogen yield and
carbon conversion as well as its superior stability in supercritical water, α-Al2O3 was
chosen for a more elaborate investigation. It was found that using the same amount of
nickel, the methane yield significantly decreased by increasing the nickel to support ratio
whereas the carbon conversion was only slightly affected. At a given nickel to support
ratio, a threefold increase in methane yield was observed by increasing the temperature
from 350 to 410 oC. The catalyst activation conditions (e.g., calcination and reduction)
had a small impact on its catalytic performance. The catalyst activity increased with the
Page 73
53
addition of alkali promoters (i.e., K, Na, Cs) and decreased with the addition of tin. The
highest catalytic activity was obtained with the addition of 0.5% potassium. In summary,
nickel loading and alkali promoters improved the hydrogen selectivity and the carbon
conversion of the Ni/α-Al2O3 catalyst.
3.1 Introduction
Catalytic hydrogen production is among the most important industrial processes for the
production of high quality fuels and foods. Hydrogen is used in ammonia and methanol
syntheses, fuel cells, hydrotreating and hydrogenation processes. Currently, hydrogen is
mainly produced by steam reforming of natural gas and naphtha due to their low costs.
However, it is anticipated that utilization of biomass as a feedstock for hydrogen
production will gain a more significant share in the near future due to the increasing
concerns over the adverse environmental impacts of the fossil fuels. Since lignocellulosic
materials are the most abundant biomass species, it is highly desirable to produce
renewable hydrogen from such resources.
Supercritical water gasification (SCWG) is a promising technology for the conversion of
wet biomass into a gas mixture composed of hydrogen, methane, carbon dioxide and
carbon monoxide without the need for drying the feedstock. The gasification of organics
in supercritical water typically proceeds at lower temperatures (e.g. < 600 oC) compared
to the conventional gasification processes (e.g. >800 oC). Considering the amount and the
high specific heat of water as well as the high costs associated with the construction and
operation of high pressure/high temperature equipments, it is highly desirable to operate
Page 74
54
the supercritical water gasifiers at milder reaction conditions. To achieve this goal, solid
catalysts are employed to enhance the gasification rates and obtain a high conversion at
temperatures below 500 oC and more preferably, below 400
oC [1-14]. Nickel and
ruthenium have been found to be active for catalyzing the SCWG reactions which require
C-C bond cleavage at such low temperature. For a review of the recent advances in
catalytic SCWG please refer to [15, 16].
Figure 3.1 Reaction pathways for production of hydrogen by reactions of
oxygenated carbohydrates with water adapted from [17]. (* represents a surface
metal site)
The reaction pathway for the nickel-catalyzed supercritical water gasification of
cellulosic biomass is depicted in Figure 3.1. According to this figure, the polysaccharides
are initially hydrolyzed to sugar monomers and small oligomers, followed by chemical
Page 75
55
transformation to other intermediates such as alcohols and acids. Decomposition of these
chemical intermediates on the surface of a metal catalyst through C-C bond cleavage
results in the formation of syngas. The syngas is further upgraded to hydrogen and carbon
dioxide by water-gas shift reaction on the metal. On the other hand, if the catalyst has a
high activity for the cleavage of C-O bonds, the produced hydrogen will be used for
hydrogenation of the adsorbed species and results in the formation of methane and other
alkanes. From a thermodynamic standpoint, reforming of the oxygenated compounds
(e.g. biomass) at lower temperatures and higher pressures favors greater alkane yields and
thus, results in poorer hydrogen selectivity. Consequently, water near its critical point
(374 oC and 221 bar) is a highly effective medium for the formation of alkanes, especially
methane. Fortunately, methane formation in SCWG of biomass does not have a pyrolytic
origin and it is almost solely formed through the catalytic cleavage of C-O bonds in the
presence of hydrogen. Due to this reason, at low conversions where the H2, CO and CO2
partial pressures are still low, the methane yield is negligible. However, when the
reaction proceeds further, the partial pressures of these gases increase and as a result of
that, the methanation rate increases. In spite of the high activity of nickel for C-C bond
scission and the water-gas shift reaction, the undesirable high activity of this metal for C-
O bond cleavage makes hydrogen production in SCW challenging. Dumesic et al.
showed that the addition of tin to Raney nickel can considerably suppress the ability of
the catalyst for cleaving the C-O bonds while retaining its original activity for the
cleavage of the C-C bonds [18-21].
Page 76
56
Although there is a large body of literature on the catalytic supercritical water
gasification of biomass [15], little is still known about the effects of catalyst support and
structure on its catalytic performance and there is a need for a systematic study to address
this issue. Hence, in this study, we systematically examined the performance of several
supported nickel catalysts for SCWG of glucose in terms of carbon conversion and
hydrogen selectivity. The reaction conditions (i.e., 380 oC, 15min, 2 wt% feed, 1 g
catalyst) resulted in a wide range of carbon conversions and hydrogen selectivities,
allowing for a fair distinction between the catalyst performance in terms of the activity
and selectivity. The catalyst supports included various materials covering a wide range of
chemical and physical characteristics. Among the catalysts tested, Ni/α-alumina catalyst
was selected for a more detailed investigation. The effects of nickel to carrier ratio,
reaction temperature, catalyst activation conditions and promoters were studied.
3.2 Experimental
The catalysts used in this study were prepared by impregnation of the supports with a
nickel nitrate hexahydrate (Sigma-Aldrich, Canada) precursor using incipient wetness
method. The characteristics of these supports are given in Table 3.1. A-1 to A-4, A-12,
Ca-1, HT-1, Mg-1, Mg-2, MS-1, MS-2, Si-1, Si-2, Yt-1, YZ-1, Ze-4, and Zr-1 were
obtained from Sigma Aldrich, Canada. A-5 to A-11, SA-1 to SA-4, Si-3, Si-4, Ze-2, and
Ze-3 were obtained from Grace Davision, USA. Ca-2 was obtained from Cheap Tubes
Inc. (Brattleboro, USA), Ti-1 to Ti-4 were obtained from Degussa AG (Germany), and
Ze-1 was obtained from United Catalyst Inc. (USA). In some experiment, as indicated by
“*” in Tables 3.3 & 3.4, the support pellets were crushed to fine powder prior to the
Page 77
57
impregnation. The catalytic activity of all catalyst support materials prior to the
deposition of nickel nanoparticles were found to be negligible. Following the
impregnation of the support materials with the desired amount of nickel nitrate solution,
catalysts were dried at 110 oC and calcined at 350
oC for 2 h (except for Ca-1 and Ca-2).
Then, catalysts were reduced in flowing hydrogen (50 ml/min STP, 30% H2, 70% N2) for
2 h. The appropriate reduction temperature for each catalyst was identified in preliminary
experiments and it ranged from 400 to 950 oC, depending on the severity of interaction
between nickel oxide and the catalyst carrier. The desired amount of potassium nitrate,
sodium nitrate, cesium carbonate and tri-n-butyltin acetate (Sigma Aldrich) were
dissolved in water and added together with the nickel nitrate to synthesize the promoted
catalysts.
A schematic of the experimental setup is shown in Figure 3.2. A 50 mL stainless steel
batch reactor was used in this study to evaluate the activity of supported nickel catalysts
for supercritical water gasification of biomass. The reactor was used several times prior
to the experiments to ensure a minimal catalytic effect of the walls. The heating medium
was a molten salt bath containing sodium nitrate, potassium nitrate, and sodium nitrite by
which an initial heat-up rate of greater than 300oC/min was achieved. Using the explained
reaction system, 90% of the temperature change occured within the first 100s of the
experiments and the temperature reached its final value in about 3min. One should refer
to [7] for typical variation of the reactor temperature and pressure using the salt bath
systems and to [4] for the heat transfer issues from molten salts to SCW reactors.
Generally, the pressure inside the reactor closely matched with the corresponding water
Page 78
58
vapor pressure at any given time during the heat-up. The temperature of the salt bath was
measured using a Type K thermocouple (Omega Engineering, Canada) and was
maintained at the desired value using a temperature controller (Hanyoung Electronic Co.
Ltd., Korea). In all experiments, 0.2 g of glucose (Sigma-Aldrich, Canada) was added to
9.8 g of deionized water to obtain a 2 wt% solution. This solution along with the desired
amount of catalyst was then introduced into the reactor and immersed in the molten salt
bath. After 15min, the reactor was taken out from the bath and immediately quenched in
a cold water bath. Then, the pressure in the reactor was determined using a digital
pressure gauge (Cecomp Electronics, USA) and was used to calculate the gas yield using
the ideal gas law. The gaseous product was then collected in a gas bag for composition
analysis. In all experiments, the amount of nickel metal was set at 50 mg regardless of the
catalyst formulation. In the support screening section, 1g of 5 wt% Ni catalyst was used
to gasify the feed at 380 °C. The corresponding pressure in the reactor at 380 oC was
estimated to be approximately 230 bar. A gas chromatograph (Hewlett-Packard 5890
series) equipped with a thermal conductivity detector and argon as the carrier gas was
used to determine the product gas composition. The data reproducibility was confirmed
to be within ± 5% by performing at least one replicate run for each data point.
The BET surface areas of the catalyst supports were obtained using Quantachrome
Autosorb catalyst characterization system (Quantachrome, USA). The equilibrium gas
compositions were calculated using Aspen Plus software (AspenTech, Burlington, USA).
The results are reported in terms of gas yields (mmol/g glucose), carbon gasification ratio
(CGR), hydrogen gasification ratio (HGR) and hydrogen selectivity (HS). The CGR and
Page 79
59
HGR are defined as the ratio of carbon and hydrogen in the gas products to the carbon
and hydrogen in the initial feed, respectively. We note that the maximum amount of
hydrogen that can be generated from glucose is 66.6 mmol/g that is twice the amount of
hydrogen initially presented in the glucose molecules; therefore, the HGR as defined here
can reach a maximum value of 200%. Hydrogen selectivity is defined as the number of
moles of H2 to the number of moles of hydrogen in methane. The CGR, HGR and
hydrogen selectivity have been calculated throughout this study as follow:
100/
42
feedgCmmol
YYYCGR
COCHCO
(3.1)
100/
2
2
42
feedgHmmol
YYHGR
CHH
(3.2)
4
2
22
CH
H
Y
YySelectivitH
(3.3)
.
Page 80
60
Table 3.1 Characteristics of the supports used in this study.
Entry Support BET
[m2/g]
Particle size
[µm]
Pore vol.
[cc/g] Comment
A-1 γ-Al2O3 200 * 100 Acid, pH 5
A-2 γ-Al2O3 200 * 100 Basic, pH 9
A-3 γ-Al2O3 200 * 100 Neutral, pH 7
A-6 γ-Al2O3 147 * 4100 1.2 Spheres
A-7 γ-Al2O3 225 * 4100 1.1 Spheres
A-8 γ-Al2O3 170 * 15 0.7 Powder
A-9 γ-Al2O3 210 * 1900 1.1 Minispheres
A-10 La2O3-γ-Al2O3 200 * 78 0.8 4% Lanthana
A-11 γ-Al2O3 165 * 70 0.5 Microspheres
A-4 α- Al2O3 8.2 118 0.12 Corundum
A-12 α- Al2O3 0.6 * 10
A-13 α- Al2O3 5.5 * 35 Powder
A-14 α- Al2O3 10 * 1 Powder
A-15 α- Al2O3 7.5 110 0.05 Crystalline
A-5 AlO(OH) 312 * 15 0.9 Pseudo-boehmite
Ca-1 Activated carbon 600 * 6500
Ca-2 Carbon nanotube 495 20 1.1 Multiwalled, OD<8nm
Ce-1 CeO2 3 5
Ce-2 CeO2 39 0.02 Nano powder
HT-1 Hydrotalcite 12 1 0.06 Synthetic
Mg-1 MgO 14 40 0.13
Mg-2 MgO 0.5 70
MS-1 Molecular sieve 338 4 Organophilic
MS-2 Aluminosilicate MCM41 800 1.0 3% Al, 5nm pore
Si-1 SiO2 500 * 0.01 Nano powder
Si-2 Silica gel 357 13 0.7 Pore diameter 6nm
Si-3 SiO2 40 * 50 1.0 Large pore size
Si-4 SiO2 687 * 2000 0.4 Granules
SA-1 Silica-alumina 424 * 74 1.1 13% Al2O3 powder
SA-2 Silica-alumina 327 * 59 0.6 SLA pyridine catalyst
SA-3 Silica-alumina 364 * 74 1.1 13% Al2O3 powder
SA-4 Silica-alumina 573 * 73 0.8 13% Al2O3 powder
SA-5 Silica-alumina 552 * 78 0.8 25% Al2O3 powder
Ti-1 TiO2 49 0.9 7710
Ti-2 TiO2 57 PF2
Ti-3 TiO2 50 1600 0.4 7711, 75% anatase
Ti-4 TiO2 50 PF25
YT-1 Y2O3 7 6
YZ-1 Yttria-stabilized zirconia 144 0.1 YSZ, 8% Yttria
Ze-1 Zeolite pentasil 298 2500 Extrudate
Ze-2 Zeolite H-ZSM5 414 * 14 0.2
Ze-3 Zeolite USY 760 * 5 0.3
Ze-4 Zeolite Y 748
ZR-1 ZrO2 7 5 *Reported by the manufacturer.
Page 81
61
Figure 3.2 Schematic diagram of the experimental set-up: 1) molten salt bath, 2)
reactor, 3) electrical heater, 4) thermocouple, 5) PID temperature controller, 6) first
valve, 7) low-pressure gauge, 8) second valve.
3.3 Results and Discussion
In the first part of this section, the calculated equilibrium gas composition is given. Then,
the effects of the supports on the catalytic activity are discussed. In addition to that, the
effects of the nickel to support ratio, the reaction temperature, the catalyst activation
conditions and the addition of promoters have been studied for one of the promising
alumina catalysts found in the course of catalyst screening.
Thermodynamic considerations
Table 3.2 shows the equilibrium gas composition calculated at 350, 380, and 410 oC (and
at their corresponding pressures). It is known that the hydrogen mole fraction at
equilibrium is positively correlated with temperature and inversely correlated with the
pressure. Since the pressure inside a closed vessel (e.g., batch reactor) dramatically
Page 82
62
changes with temperature near the critical point of water, the hydrogen mole fraction at
equilibrium decreases with increasing temperature at the conditions studied in this work.
However, the variation of the gas yields with temperature within the investigated
temperature range was rather small. The calculation of the gas composition at equilibrium
revealed that only about 6 mmol of hydrogen would be formed per gram of glucose, and
a larger fraction of the hydrogen will be consumed to hydrogenate carbon dioxide. The
corresponding equilibrium hydrogen selectivity and hydrogen gasification ratio (HGR) at
the conditions relevant to this work was found to be approximately 0.2 and 108%,
respectively.
Table 3.2 The equilibrium gas composition calculated based on SCWG of 2
wt% glucose and water density of 200 kg/m3 using Aspen Plus software.
T
[oC]
P
[bar]
H2
[mmol/g]
CO
[mmol/g]
CH4
[mmol/g]
CO2
[mmol/g]
Hydrogen
selectivity
HGR
[%]
350 165 6.7 0.005 14.9 18.4 0.22 110
380 230 5.5 0.008 15.2 18.1 0.18 108
410 320 4.7 0.012 15.4 17.9 0.15 107
Alumina-supported catalysts
Table 3.3 demonstrates the gas yields and the carbon conversion of glucose using the
alumina-supported catalysts at 380 oC. For comparison, results from the SCWG of
glucose under the catalyst-free condition are also given in this table. The CGR obtained
from these Ni/Al2O3 catalysts ranged from 21% (the same as catalyst-free) to 84%,
implying that the chemistry of the support material (Al2O3 in this case) was not solely
responsible for catalyst activity, and other factors significantly influenced the catalytic
Page 83
63
performance as well. It should be noted that the variation in the catalytic activity among
the Ni/α-Al2O3 was less pronounced (typically CGR > 70%) compared to that of Ni/γ-
Al2O3 (i.e. 21%<CGR<79%). Figure 3.3 shows the variation of hydrogen yield and
selectivity with carbon conversion using alumina-supported catalysts. It was observed
that up to carbon conversions of about 60-70%, the hydrogen yield increased, after which
it leveled off. The initial increase in hydrogen yield, however, appeared to be due to the
increase in conversion, such that the hydrogen selectivity remained constant at low
conversions. At higher conversions (i.e. CGR > 60%), hydrogen selectivity showed a
clear declining trend with CGR. This observation can be justified considering the partial
pressures of the hydrogen and carbon dioxide (and carbon monoxide to a lesser extent).
At low carbon conversions, the partial pressure of the hydrogen and carbon dioxide are
low and hence, the rates of the formation of these two compounds (from the remaining
feed and the intermediates) are much higher than their consumption rate by methanation
reactions. At moderate conversions, hydrogen formation and consumption rates are
comparable and therefore the hydrogen yield remains almost constant. At higher
conversions, hydrogen is formed at a lower rate due to the progressive consumption of
the feed and intermediates, while the rate of hydrogen consumption is significantly higher
due to the higher partial pressures of hydrogen and carbon dioxide. As a result, at high
carbon conversions, the net rate of change in hydrogen yield is expected to decrease. It is
worthwhile to mention that the amount of hydrogen at the highest carbon conversion was
almost threefold higher than the equilibrium hydrogen yield (see Table 3.2), indicating
that the gas phase composition was far from equilibrium.
Page 84
64
Given that all catalysts in Table 3.3 (except A-15) have the same chemical formula and
were prepared using the same procedure, the large differences among the performance of
these catalysts could be attributed to one or more of the following reasons: i) nickel
dispersion, ii) severity of the nickel-support interaction, iii) support stability, iv) mass
transfer issues, and v) support’s acidity. Here, we discuss the possibility of how and to
what extent each of these parameters could affect the catalytic performance in SCWG.
i) Nickel dispersion
As a general rule, the activity of a catalyst is proportional to the number of the available
active sites. At a given metal loading, the number of active sites in a catalyst is a function
of the metal dispersion, which is defined as the fraction of the total atoms of the active
element that is exposed at the surface. The dispersion is, in turn, inversely proportional to
the crystallite size. In the case of commercial Ni/Al2O3 catalysts, the metal dispersion is
typically below 15%, corresponding to an average crystallite size of about 6.5 nm (and
larger). The main factors that govern the dispersion of Ni on alumina include the support
surface area, the metal loading, and the activation conditions. Since the metal loading and
the activation conditions were identical for all catalysts shown in Table 3.3, the support
surface area was the only parameter which could possibly change the metal dispersion.
Using Scherrer equation, it was revealed that the size of NiO (before reduction, XRD not
shown here) and Ni (XRD shown in Figure 3.5) on α-Al2O3 were approximately 20 nm
and 32 nm, respectively. These crystallite sizes correspond to 5% and 3% dispersion,
respectively. These values are consistent with the previously reported data for the
dispersion of nickel on α-Al2O3 at low metal loadings [22]. Therefore, considering the
Page 85
65
metal dispersion in α-Al2O3 and γ-Al2O3-supported catalysts, no clear relationship was
observed between the metal dispersion and the activity of the catalyst for the gasification
of glucose in SCW. However, Ni dispersion effects might have been masked by other
factors (discussed below) that had more pronounced impacts on the activity of the
alumina-supported catalysts. Figure 3.4 demonstrates the hydrogen yield and selectivity
as a function of support surface area. Similar to the carbon conversion (CGR), no
correlation between hydrogen yield and selectivity and the support surface area was
observed.
ii) Nickel-support interaction
The physicochemical properties of Ni/alumina are affected by the thermal treatment
process prior and after the metal deposition. The amorphous transition alumina phases
(i.e. γ, δ, θ) undergo phase transformation to form crystalline α phase upon calcination at
high temperatures (e.g. 1300 oC). This phase change causes a significant
dehydroxylation, loss of surface area and pore volume and an increase in the average
pore diameter. Three distinguishable species of nickel oxide can present upon calcination
of a nickel salt deposited on alumina [23]: bulk NiO (reducible at ~ 400 oC), nickel oxide
with strong interaction with support (reducible at ~ 400-800 oC), and surface and bulk
nickel aluminate spinel (hardly reducible at > 800 oC). Nickel aluminate (NiAl2O4) is
formed through strong bond between Ni2+
and the divalent vacancy in transition alumina.
The formation of nickel aluminate on α-Al2O3 only occurs at high calcination
temperatures (e.g. > 600 oC), whereas nickel aluminate is the most dominant species
found in unreduced NiO/γ-Al2O3 catalysts regardless of the calcination temperature [22,
Page 86
66
24], particularly at low metal loadings where the surface cation vacancies of the γ-Al2O3
are yet to be fully occupied by the Ni2+
ions. Also, it has been shown that the reducibility
of NiO/Al2O3 is typically facilitated by increasing the metal loadings and decreasing the
calcination temperature [22]. It has been also reported that the addition of a few percent
La2O3 to γ-Al2O3 had little influence on the nickel-support interaction [25]. In summary,
at low metal loadings (e.g. 5 wt%), NiO and NiAl2O4 are the more dominant species in α-
Al2O3 and γ-Al2O3-supported catalysts, respectively. Therefore, the greater catalytic
activity of Ni/α-Al2O3 compared to that of Ni/γ-Al2O3 can be partly attributed to the
better reducibility of Ni2+
deposited on α-Al2O3 and consequently, the higher extent of
reduction (EOR). It is worth mentioning that reduction of 5% Ni/ γ-Al2O3 (A-8) catalyst
at 500, 700 and 950 oC failed to activate the catalyst for the reaction of interest. The XRD
pattern of this catalyst (Figure 3.5) exhibited broad peaks associated with nickel alumina
spinel, implying the formation of well-dispersed spinel phase at the surface and perhaps
in the bulk of the γ-Al2O3 support.
iii) Support stability
Chemical degradation and/or phase transformation of the catalyst support in SCW may
diminish the catalytic activity even during a short batch experiment. Figure 3.6 shows the
XRD of patterns of α-Al2O3 (A-4), γ-Al2O3 (A-6), La2O3- γ-Al2O3 (A-10), and AlO(OH)
(A-5) supports before and after exposure to SCW at 380 oC for 1h. Thanks to its high
surface area and superior thermal stability over a wide range of temperatures, γ-Al2O3 is
the most widely used industrial catalyst support. However, as previously reported in the
literature, γ-Al2O3 undergoes phase transition to boehmite upon exposure to SCW [10].
Page 87
67
The phase transformation of γ-Al2O3 resulted in a significant loss of the mesopores and
thus, the surface area [26]. This would, in turn, lead to the occlusion of the catalytically
active crystallites (i.e. nickel) and cause a fast catalyst deactivation. In contrast, α-Al2O3
was found to be fairly stable under similar conditions. We note that the BET surface area
of α-Al2O3 also remained unchanged after exposure to SCW. Exposure of the high-
surface area pseudo-boehmite to SCW for 1h increased the crystallinity of the material
but did not change its chemistry. Consequently, one can expect that crystalline pseudo-
boehmite could potentially be a good candidate as a catalyst carrier in SCW.
Unfortunately, the Ni/pseudo-boehmite catalyst exhibited negligible activity for SCWG
of glucose (Table 3.3). Addition of small quantities of lanthanum oxide did not improve
the hydrothermal stability of γ-Al2O3. Considering the above discussions, instability of γ-
Al2O3 as well as the negligible activity of the boehmite-supported nickel catalysts can be
partly responsible for the higher activity of Ni/ α-Al2O3 compared to that of γ-Al2O3.
Therefore, except for Ni/α -Al2O3, no practical use is foreseen for other alumina
supported catalysts in SCWG process. It should be also emphasized that the extremely
small solubility of α-Al2O3 in supercritical water [27] along with its superior mechanical
strength [26] render α-Al2O3 an appropriate candidate for catalysis in SCW. We
experimentally confirmed that the BET surface area of α-Al2O3 remained unchanged after
the exposure to SCW.
iv) Mass transfer issues
Under similar operating conditions, the rate of mass transfer towards the active sites of a
catalyst depends on the morphological and textural characteristics of the catalyst
Page 88
68
particulate (pellet, extrudate, granule, sphere, powder). The SCWG of glucose with finely
crushed spheres (A-6*, A-7
*, and A-9
*) revealed that, expectedly, the inter-particle pores
had no measureable impact on the catalytic activity. Moreover, considering the data
presented in Tables 3.1 and 3.3 for original and crushed catalyst, it becomes apparent that
there was no relationship between the catalyst particle size and activity. This implies that
the mass transfer in the mesopores was not the rate determining factor under the
experimental conditions used.
Therefore, based on these evidences and also considering the high diffusion coefficients
in supercritical state [28, 29], the chemical reaction on the catalytic active site was most
likely the rate determining step under the conditions used in this study.
v) Support acidity
In SCW, sugars undergo dehydration on the catalyst acidic sites. Utilization of
bifunctional catalysts, with active hydrogenation metal and strong acidic sites, results in
successive dehydration/hydrogenation and therefore, produces higher alkanes. The acid
sites also promote the polymerization reactions, which in turn, lead to the formation of
tarry materials. Among the various alumina phases, α-Al2O3 is the least acidic one [26].
Therefore, the higher gasification efficiency obtained by Ni/α-Al2O3 can be partly due to
the weaker acidic strength of α-Al2O3 compared to that of γ-Al2O3.
Page 89
69
Table 3.3 Performance of alumina-supported catalysts (380 oC, 15min, 2 wt%
glucose, 1g catalyst).
Support Ni
[%]
H2
[mmol/g]
CO
[mmol/g]
CH4
[mmol/g]
CO2
[mmol/g]
CGR
[%]
HGR
[%]
No
catalyst - 2.7 1.0 0.1 6.5 22 9
A-1 5 20.5 0.3 8.1 17.9 79 110
A-2 5 22.3 0.3 5.0 18.6 72 97
A-3 5 8.8 0.6 1.6 10.9 39 36
A-6 5 20.8 0.5 4.1 17.1 65 87
A-6* 5 16.2 0.2 4.9 15.7 62 78
A-7 5 19.0 0.5 4.1 17.1 65 81
A-7* 5 18.6 0.4 5.0 17.3 68 85
A-8 5 2.5 1.1 0.0 6.1 21 7
A-9 5 19.5 0.5 3.6 17.1 63 80
A-9* 5 18.8 0.4 4.8 17.3 67 85
A-10 5 11.6 0.5 2.1 12.4 45 47
A-11 5 14.5 0.5 2.3 13.1 48 57
A-4 5 24.3 0.3 4.6 17.4 67 101
A-12 5 16.8 0.5 2.9 13.8 51 68
A-13 5 17.9 0.4 7.4 16.8 73 98
A-14 5 18.3 0.4 9.5 18.0 84 112
A-15 5 17.6 0.2 9.9 17.8 84 112
A-5 5 1.4 1.3 0.0 6.4 23 4
* Catalyst pellets were crushed to fine powders before impregnation.
Page 90
70
Figure 3.3 Hydrogen and methane yields and selectivity vs. carbon conversion
using 5% Ni/alumina catalysts, α-Al2O3 (),γ-Al2O3 (), La2O3-γ-Al2O3 (), and
equilibrium values (X). (380 oC, 15min, 2 wt% glucose, 1g catalyst).
0
5
10
15
20
25
30
30 40 50 60 70 80 90 100
H2 yie
ld [
mm
ol/
g]
CGR %
0
5
10
15
20
30 40 50 60 70 80 90 100
CH
4 yie
ld [
mm
ol/
g]
CGR %
0
1
2
3
30 40 50 60 70 80 90 100
H2 se
lect
ivit
y
CGR %
Page 91
71
Figure 3.4 Hydrogen yield and selectivity vs. support surface area using 5%
Ni/alumina catalysts, α-Al2O3 (),γ-Al2O3 (), La2O3-γ-Al2O3 (). (380 oC, 15min,
2 wt% glucose, 1g catalyst).
0
5
10
15
20
25
30
0 50 100 150 200 250 300
H2 yie
ld [
mm
ol/
g]
Surface area [m2/g]
0
1
2
3
0 50 100 150 200 250 300
H2 se
lect
ivit
y
Surface area [m2/g]
Page 92
72
Figure 3.5 XRD patterns of 5% Ni on a) α-Al2O3 reduced at 500 oC b) γ-Al2O3
(A-6) reduced at 500 oC, c) γ-Al2O3 (A-6) reduced at 800
oC, and d) γ-Al2O3 (A-8)
reduced at 700 oC. The vertical dashed lines represent nickel peaks.
0
200
400
600
800
1000
30 40 50 60 70
Position [2 Theta]
c
d
a
b
Page 93
73
Figure 3.6 XRD patterns of different types of alumina before (bottom) and after
(top) exposure to the supercritical water at 380 oC for 1h.
In summary, the following factors were proposed to influence the catalytic activity of
alumina-supported nickel catalysts for SCWG in this study: a) reducibility and the form
of nickel oxide prior to the reduction (NiO vs NiAl2O4), b) support stability, and c)
support acidity.
Page 94
74
Other catalysts
The gas yields and carbon conversion for the SCWG of glucose using other catalyst
support materials are shown in Table 3.4 and the corresponding hydrogen yields and
selectivities versus carbon conversion are plotted in Figure 3.7. The relative activity for
these catalysts reduced depending on the support material in the following orders: carbon
nanotube (CNT) > MgO > Y2O3, TiO2, SiO2 > Hydrotalcite, YSZ > CeO2, activated
carbon, ZrO2, molecular sieve, silica-alumina and zeolites. The result obtained from
gasification of glucose in the presence of carbon nanotube (and activated carbon) should
be interpreted with caution when using a batch reactor as the catalyst support may be also
partially gasified. Zeolite pentasil (Ze-1) showed an exceptionally high hydrogen yield
(~30 mmol/g). Similarly, MgO and Y2O3 performed better than alumina supports
(hydrogen yield: ~ 24-26 mmol/g). Hydrotalcite (HT) also demonstrated a extraordinarily
high hydrogen selectivity of ~6.5 but with a modest CGR of 54%. The XRD spectra of
the studied catalyst supports before and after 1h exposure to SCW at 380 oC are given in
Figure 3.8. Based on these plots, TiO2 and YSZ were the only stable supports in such
conditions and other supports materials; including MgO, hydrotalcite, Y2O3, and CeO2
underwent chemical reaction with water and/or phase transformation and thereby, were
not useful for the process of interest. The high hydrogen selectivity obtained from
Ni/hydrotalcite may be attributed to the decomposition of the support. Despite YSZ was
chemically stable under the SCW conditions, its specific surface area decreased from 144
to 103 m2/g upon 3h exposure to SCW at 380
oC. Also the Silica-containing supports
such as SiO2, molecular sieves, silica alumina and zeolites are unstable under
Page 95
75
hydrothermal conditions. For instance, the BET surface area of molecular sieve and
MCM41 changed from 338 and 800 m2/g to 10 and 13 m
2/g after 3h exposure to SCW at
380 oC, respectively. As discussed in the previous section for the Ni/Al2O3 catalysts, the
acidic supports (e.g. zeolites, silica-alumina) led to very poor gasification yields. Once
again, no clear relationship was observed between the support surface area and particle
size with the catalyst activity for SCWG of glucose.
Page 96
76
Table 3.4 Performance of other supported catalysts (380 oC, 15min, 2 wt%
glucose, 1 g catalyst).
Support Ni
[%]
H2
[mmol/g]
CO
[mmol/g]
CH4
[mmol/g]
CO2
[mmol/g]
CGR
[%]
HGR
[%]
No catalyst - 2.7 1.0 0.1 6.5 22 9
Ca-1 5 3.1 0.7 0.1 8.3 27 10
Ca-2 5 17.3 0.4 9.8 18.1 85 111
Ce-1 5 6.0 1.0 0.1 7.0 24 19
Ce-2 5 14.1 0.7 0.7 10.7 36 46
HT-1 5 24.5 0.15 1.9 15.9 54 85
Mg-1 5 26.6 0.3 6.2 17.3 71 117
Mg-2 5 26.9 0.6 4.6 18.9 72 108
MS-1 5 13.0 0.7 2.6 10.9 43 55
MS-2 5 10.0 1.8 1.2 4.7 20 37
SA-1 5 3.4 2.5 0.2 4.8 22 11
SA-2 5 4.5 1.9 0.04 4.5 19 14
SA-3 5 2.5 2.4 0.07 4.1 20 8
SA-4 5 3.4 2.4 0.4 4.7 22 13
SA-5 5 2.6 2.7 0.1 4.3 21 8
Si-1 5 20.5 0.2 3.7 14.4 53 84
Si-2 5 13.6 1.2 4.5 13.6 58 68
Si-3 5 16.8 1.0 3.7 13.7 55 73
Si-4 5 4.3 1.2 1.0 6.3 25 19
Si-4* 5 5.2 1.2 1.4 6.8 28 24
Ti-1 5 16.7 0.6 3.5 15.6 59 71
Ti-2 5 15.6 0.4 1.8 13.1 46 58
Ti-3 5 14.6 0.3 2.8 14.4 53 61
Ti-4 5 12.8 0.3 2.1 11.0 40 51
YT-1 5 26.5 0.3 7.3 12.0 59 123
YZ-1 5 11.5 0.6 2.4 14.0 51 49
Ze-1 5 30.7 0.2 2.7 7.2 30 108
Ze-2 5 4.9 3.8 0.3 5.6 29 16
Ze-3 5 6.5 1.8 0.3 6.0 24 21
Ze-4 5 0.5 1.4 0.14 7.0 26 2
ZR-1 5 2.9 1.1 0.1 7.3 26 9
* Catalyst pellets were crushed to fine powders before impregnation.
Page 97
77
Figure 3.7 Hydrogen yield and selectivity vs. carbon conversion (CGR) using 5%
Ni/support catalysts, (380 oC, 15min, 2 wt% glucose, 1 g catalyst). Molecular sieve
(), YSZ (), Hydrotalcite (), Silica (), Titania (), Yttria (), Magnesia (),
and CNT ().
0
5
10
15
20
25
30
40 50 60 70 80 90 100
H2 yie
ld [
mm
ol/
g]
CGR %
0
2
4
6
40 50 60 70 80 90
H2 se
lect
ivit
y
CGR %
Page 98
78
Figure 3.8 XRD patterns of MgO, Y2O3, TiO2, hydrotalcite, CeO2 and YSZ
before (bottom) and after (top) exposure to the supercritical water at 380 oC for 1h.
Optimization of Ni/α-Al2O3 Catalyst
Page 99
79
Based on the above findings, among the active catalysts, Ni/α-Al2O3 and Ni/CNT had
high CGR values (~ 85%) and high hydrogen yields (~ 17-24 mmol/g) while Ni/MgO
exhibited an excellent hydrogen yield (~26 mmol/g) and a CGR of about 72%.
Considering its low cost and high stability, α-Al2O3 was chosen as support for further
study to enhance catalyst performance by optimizing synthesis conditions and by
introducing promoters.
Effects of nickel loading at different reaction temperatures
Figure 3.9 shows the relationship between the nickel loading and the catalyst activity for
SCWG of glucose at 350, 380 and 410 oC. It should be noted that regardless of the level
of nickel loading on the support, the total nickel weight was kept constant in the
experiments (i.e. 0.05g). It can be seen that carbon conversion slightly decreased (with a
slope of approximately -0.5 %CGR / %Ni with a R2 value of 0.7-0.8) while the methane
yield substantially dropped by increasing the nickel to the support ratio. As discussed
earlier, nickel loading affects the nickel crystalline size and the nickel-support
interactions. Therefore, it may be hypothesized that under the experimental conditions of
this work, the methane formation, which is mostly a secondary reaction, was more
affected by the nickel crystallite size and the extent of Ni-support interaction than the
primary reactions such as C-C bond rupture. For Raney nickel-catalyzed SCWG it has
been reported that the methane formation rate considerably decreased over time (due to
substantial sintering and hence, crystallite growth) while the carbon conversion did not
drop at the same pace [3]. Moreover, according to Figure 3.9, the methanation rate was
Page 100
80
heavily dependent on the reaction temperature. A threefold increase in methane yield was
observed upon increase of temperature from 350 to 410 oC at any level of the nickel
loading which in turn, dramatically decreased the hydrogen selectivity (Figure 3.10).
Page 101
81
Figure 3.9 Carbon gasification ratio and methane yield vs. Ni loading (on α-
Al2O3 (A-4)) at 410 oC (), 380
oC (), and 350
oC (), (15min, 2 wt% glucose, 0.05
g Ni).
0
20
40
60
80
100
0 5 10 15 20
CG
R
%Ni/alumina
0
2
4
6
8
10
12
0 5 10 15 20
CH
4 [
mm
ol/
g]
%Ni/alumina
Page 102
82
Figure 3.10 Hydrogen selectivity vs. Ni loading (on α-Al2O3 (A-4)) at 350 oC, 380
oC, and 410
oC, (15min, 2 wt% glucose, 0.05 g Ni).
Effects of catalyst activation
Figure 3.11 & 3.12 demonstrate the effects of calcination and reduction on the activity of
the catalyst, respectively. Based on the results presented in Figure 3.11, the calcination
temperature and duration had a relatively small impact on the performance of the catalyst
for SCWG. In fact, the highest methane yield was obtained with the catalyst that was
prepared without calcination. Furthermore, the rate of methane formation decreased with
increasing reduction temperature. This observation may be justified due to the possible
decrease in the metal dispersion caused by sintering of the crystallites at higher reduction
temperatures.
0
1
2
3
4
5 10 15 20
H2 se
lect
ivit
y
Nickel [wt%]
350 380 410
Page 103
83
Figure 3.11 Effects of calcination temperature (for 2h) and time (at 350 oC) on
product yields for SCWG using 5% wt Ni/α-Al2O3 (A-4) catalyst, (380 oC, 15min, 2
wt% glucose, 1 g catalyst). Carbon monoxide yield remained less than 0.3 mmol/g
(not shown).
Figure 3.12 Effects of reduction temperature (for 2h) and time (at 500 oC) on the
gas yields using 5% Ni/α-Al2O3 catalyst, (380 oC, 15min, 2 wt% glucose, 1 g
catalyst). Carbon monoxide yield remained less than 0.3 mmol/g (not shown).
0
10
20
30
40
50
280 350 500 0 120 400
Yie
ld [
mm
ol/
g]
Temperature [oC]
CO2 CH4 H2
Time [min]
0
10
20
30
40
50
500 600 700 30 120 240
Yie
ld [
mm
ol/
g]
Temperature [oC]
CO2 CH4 H2
Time [min]
Page 104
84
Effects of promoters
Due to the proven usefulness of alkali metals for facilitating the SCWG reactions [30-32],
these metals have been added to the Ni/α-Al2O3 catalyst as promoters. Additionally,
when added to the surface of Raney nickel, tin has been found to dramatically decrease
the methane formation rate and improve the hydrogen selectivity [18-21]. Hence, the
addition of tin as a promoter was also considered to potentially enhance the hydrogen
selectivity of Ni/α-Al2O3.
The corresponding results obtained from SCWG of glucose using promoted α-Al2O3 are
presented in Table 3.5. For comparison, performance of the same catalyst without a
promoter is also given in the same table. It can be seen that addition of tin while
enhanced hydrogen selectivity also considerably decreased the activity of the Ni/α-Al2O3
catalyst for gasification of glucose. On the other hand, the addition of small quantities of
alkali metals improved the CGR and methane yield but decreases the hydrogen
selectivity. A near complete carbon conversion was achieved upon the addition of 0.5%
K to 10% Ni/α- Al2O3. Figure 3.13 illustrated the hydrogen and methane yields and the
corresponding hydrogen selectivity using alkali and tin-promoted nickel catalysts. It was
found that the hydrogen yield remained almost constant while the methane yield
increased upon doping of the catalyst with alkali metals, particularly with potassium. In
all cases, the hydrogen selectivity was inversely correlated with the carbon conversion.
Page 105
85
Table 3.5 Effects of the addition of promoters to Ni/α-Al2O3 catalysts on
gasification of 2 wt% glucose solution. (380 oC, 15min, 0.05g Ni).
Ni
%
Promoter H2
[mmol/g]
CO
[mmol/g]
CH4
[mmol/g]
CO2
[mmol/g]
CGR
[%]
HGR
[%] Element [%]
No catalyst 2.7 1.0 0.1 6.5 22 9
5 - - 24.3 0.3 4.6 17.4 67 101
5 Sn 0.50 9.8 0.3 1.6 11.4 40 39
5 Sn 1.00 11.1 0.4 1.9 12.2 43 45
5 Cs 0.50 21.7 0.3 6.7 18.7 77 105
5 Cs 1.00 22.1 0.4 6.2 18.1 74 103
5 Na 0.25 20.3 0.3 5.7 17.4 70 95
5 Na 0.50 21.3 0.3 5.7 17.6 71 98
5 Na 1.00 21.5 0.2 5.2 16.8 67 96
5 K 0.25 22.7 0.3 6.1 18.9 76 105
5 K 0.50 21.2 0.4 6.8 19.6 80 104
5 K 1.00 20.6 0.3 5.9 17.6 71 97
10 K 0.25 21.2 0.3 9.4 20.7 92 120
10 K 0.50 21.3 0.3 10.5 22.6 99 127
Page 106
86
Figure 3.13 Hydrogen yield, methane yield and hydrogen selectivity vs. carbon
conversion using promoted Ni/α-Al2O3 catalysts. No promoter (), Sn (), Na (),
Cs (), and K (), (380 oC, 15 minutes, 1 g catalyst).
3.4 Conclusions
The performance of supported nickel catalysts for the gasification of a biomass model
compound in supercritical water was studied. The support materials covered a wide range
0
5
10
15
20
25
35 45 55 65 75 85 95
H2 yie
ld [
mm
ol/
g]
CGR%
No promoter
Sn
Cs
Na
K
0
5
10
15
35 45 55 65 75 85 95
CH
4 yie
ld [
mm
ol/
g]
Carbon conversion %
Page 107
87
of physical and chemical characteristics, allowing for the determination of the effects of
different parameters (such as chemistry, surface area, and particle size) on the catalytic
performance. Among the tested catalysts, α-Al2O3, carbon nanotube (CNT), and MgO
supports resulted in the highest carbon conversions, while SiO2, Y2O3, hydrotalcite,
yttria-stabilized zirconia (YSZ), and TiO2 showed modest activities and other catalysts
including zeolites showed negligible activities. γ-Al2O3 supports resulted in a wide range
of catalytic activities from almost inactive to highly active. No clear relationship was
found between the catalyst surface area (and particle size) and the catalytic activity.
However, it is possible that other factors; such as acidity, nickel-support interaction and
stability, played a more dominant role under the conditions used in this study. The
hydrogen selectivity significantly increased by increasing the nickel loading on α-Al2O3
catalyst. The maximum hydrogen selectivity was obtained using a 20% Ni/ α-Al2O3 at
380 oC. Addition of alkali promoters enhanced the carbon conversion whereas addition of
tin decreased the catalyst activity.
3.5 References
[1] T. Yoshida, Y. Oshima, Y. Matsumura, Biomass Bioenerg, 2004, 26, 71-78.
[2] T. Yoshida, Y. Matsumura, Ind Eng Chem, 2001, 40, 5469-5474.
[3] E. Afif, P. Azadi, R. Farnood, Appl. Catal B- Environ, 2011, 105, 136-143.
[4] P Azadi, R. Farnood, C. Vuillardot, J Supercrit Fluids, 2011, 55, 1038-1045.
[5] P. Azadi, J. Otomo, H. Hatano, Y. Oshima, R. Farnood, Int J Hydrogen Energy, 2010,
35, 3406-3414.
[6] P.Azadi, K. M. Syed, R. Farnood, Appl Catal A- Gen, 2009, 358, 65–72.
Page 108
88
[7] P. Azadi, A.A. Khodadadi, Y. Mortazavi, R. Farnood, Fuel Process Technol, 2009,
90, 145–151.
[8] P. Azadi P, R. Farnood, E. Meier, J Phys Chem A, 2010, 114, 3962-3968.
[9] D.C. Elliott, T.R. Hart, G.G. Neuenschwander, Ind Eng Chem, 2006, 45, 3776-3781.
[10] D.C. Elliott, L.J. Sealock, E.G. Baker, Ind Eng Chem 1993, 32, 1542-1548.
[11] T. Minowa, S. Inoue, Renewable Energy, 1999, 16, 1114-1117
[12] P. Azadi, S. Khan, F. Strobel, F. Azadi, R. Farnood, Appl. Catal B- Environ, 2012,
DOI 10.1016/j.apcatb.2012.01.035
[13] T. Minowa, Z. Fang, Catalysis Today, 45, 1998, 411-416
[14] L. Zhang, P. Champagne, C. Xu, Int J Hydrogen Energy, 2011, 36, 9591-9601.
[15] P. Azadi, R. Farnood, Int J Hydrogen Energy, 2011, 36, 9529-9541.
[16] D.C. Elliott, Biofuels, Bioprod Bioref, 2008, 2, 254–265.
[17] R. D. Cortright, R. R. Davda, J. A. Dumesic , Nature, 2002, 418, 964-967
[18] G.W Huber, J.W. Shabaker, J.A. Dumesic, Science, 2003, 300, 2075-2077.
[19] J.W. Shabaker, D.A. Simonetti, R.D. Cortright, J.A. Dumesic, J Catal, 2005, 231,
67–76.
[20] J.W. Shabaker, J.A. Dumesic, Ind Eng Chem Res, 2004, 43, 3105-3112.
[21] J.W. Shabaker, G.W. Huber, J.A. Dumesic, J Catal 2004, 222,180–191.
[22] R. Molina, G. Poncelet, J Catal, 1998, 173, 257-267.
[23] J. G. Seo, M. H. Youn, S. Park, I. K. Song, 2008, 33, 7427-74334.
[24] I. Chen, S. Y. Lin, D. W. Shiue, Ind Eng Chem Res, 1988, 27, 926-929.
[25] L. Zhang, J. Lin, Y. Chen, J. Chem. Soc. Faraday Trans., 1992, 88, 497-502.
Page 109
89
[26] Bartholomew CH, Farrauto RJ. Fundamentals of industrial catalytic processes. 2nd
edition. NJ, John Wiley and Sons; 2006.
[27] K. H. Becker L. Cemic, K. Langer, Geochimica et Cosmochimica Acta, 1983, 47,
1573-1578.
[28] H. Weingartner and E. U. Franck, Angew. Chem., Int. Ed., 2005, 44, 2672-2692
[29] A. Kruse, E. Dinjus, J. Supercrit. Fluids, 2007, 39, 362-380
[30] H.X. Hao, L.J. Guo, Z. Mao, Z.M. Zhang, X.J. Chen, Int J Hydrogen Energy 2003,
28, 55–64.
[31] J.A. Onwudili, P. T. Williams, Int J Hydrogen Energy, 2009, 34, 5645-5656.
[32] A. Kruse, D. Meier, P. Rimbrecht, M. Schacht, Ind. Eng. Chem. Res., 2000, 39,
4842-4848.
4- Carbon-nanotube Supported Nickel Catalyst for SCWG
Parts of this chapter have been published under: Azadi P, Farnood R, Meier E.
Preparation of Multiwalled Carbon Nanotube-Supported Nickel Catalysts Using Incipient
Wetness Method, Journal of Physical Chemistry A 2010, 114, 3962-3968.
Abstract
Page 110
90
In this work, a systematic study on preparation of multiwalled carbon nanotube
(MWCNT)-supported nickel catalyst is pursued. Functional groups are introduced on the
surface of MWCNT using nitric acid, sulfuric acid as well as partial oxidation in air.
Nickel oxide nanoparticles are formed on the surface of functionalized multi-walled
carbon nanotubes (FMWCNT) by incipient wetness impregnation of nickel nitrate,
followed by calcination in air. Effects of acid type and concentration, acid treatment time,
partial oxidation, nickel loading, precursor solvent and calcination temperature on size of
the nickel nanoparticles and homogeneity of the composite material are evaluated.
Characteristics of the Ni/MWCNT catalysts were examined using BET, scanning
transmission electron microscope (STEM), X-ray diffraction (XRD), thermogravimetric
analysis (TGA) in air and nitrogen, temperature programmed reduction (TPR), X-ray
photoelectron spectroscopy (XPS), acid-base titration and zeta potential analyzer. Results
of this work are useful for formulating CNT supported nickel catalysts for a wide range
of different applications such as reforming of hydrocarbons, catalytic hydrothermal
gasification of biomass, and energy storage. Moreover, the results obtained from SCWG
of glucose using Ni/MWCNT are presented in the last section of this chapter.
4.1 Introduction
Since their discovery in 1991, many applications have been suggested for carbon
nanotubes (CNT). Carbon nanotubes offer excellent properties as a catalyst support such
as proper pore sizes, moderate to high specific area, great thermal stability and stability in
acidic or basic environments. Due to the novel properties of these cylindrical carbon
molecules, they can act as catalyst support. However, due to lack of oxygen functional
Page 111
91
groups on their outer surface and their hydrophobicity, formation of bonds between metal
precursor and CNT is not an easy task compared to the metal oxide supported catalysts
such as alumina. Once synthesized, CNT contain some impurities. Hence, some
pretreatment steps are usually implemented in preparation of CNT-supported catalysts
(like mild acid treatment) for removal of amorphous carbon and the metal nanoparticles
that are used to catalyze the CNT synthesis. Then, a controlled amount of oxygen
functional groups are added to the outer surface by either partial oxidation in air or by
means of a liquid oxidizing agent such as hydrogen peroxide, nitric acid, etc [1].
A few number of techniques [2] have been developed for decoration of carbon nanotubes,
among them are electrochemical methods [3-5], wet impregnation [6] and incipient
wetness [7]. Each method leads to a certain degree of control over nanoparticle size and
metal dispersion. The functionalized CNT readily interact with the metal precursors
which can be reduced either directly to metal in a reducing atmosphere or it can be
calcined to create metal oxides followed by a reduction in hydrogen flow. Regarding the
oxidation of CNT, it is found that acid concentration and treatment time play a significant
role in functionalization of the nanotubes. Also, it has been reported that the carboxylic
groups are the dominant groups added on the CNT during the oxidative treatment by
nitric acid. Furthermore, acid treatment may increase the specific area of the CNT,
particularly for multiwalled carbon nanotubes by oxidizing and dissolving the outer wall
of CNT, as well as breaking the CNT particles.
Although many researchers investigated the activity of CNT supported catalyst for
variety of applications including synthesis of more carbon nanotubes [1], reforming of
Page 112
92
hydrocarbons [7], hydrogen storage [8] and hydrogenation [9], but there is a lack for a
systematic study on different aspects of particles formation on the surface of carbon
nanotubes.
4.2 Experimental methods
Multiwall carbon nanotube with average length and diameter of 7m and 120 nm
obtained form Sigma-Aldrich. An oxidative pretreatment in boiling nitric or sulfuric acid
is conducted to introduce oxygenated functional groups onto the surface of the nanotubes.
The following conditions were used throughout catalyst preparation unless mentioned
otherwise. The nitric acid concentration and treatment time were 10M and 5h
respectively. In all experiments, 0.2g MWCNT was dispersed in 50ml acid and the
mixture was boiled using a hot plate and reflux system. The functionalized CNTs were
washed with water, centrifuged twice and dried at 110oC overnight. Following this step,
MWCNT is impregnated with nickel precursor, followed by calcination at 350oC for 3 h.
The nickel loadings were controlled by changing the concentration of nickel nitrate. A
Quantachorome catalyst characterization unit has been utilized to study the pore size
distribution of the carbon nanotubes as well as reduction of nickel oxide nanoparticles in
flowing hydrogen at heating rate of 10oC/min. Scanning transmission electron
microscopy (STEM) was performed on a Hitachi HD-2000 STEM microscope.
Thermogravimetric Analysis (TGA) scans were obtained using a TGA Q500 apparatus
from TA instruments. X-ray diffraction (XRD) patterns obtained from a Philips XRD
system at a scanning rate of 0.015° per second. The average size of nickel oxide
nanoparticles were calculated by Scherrer equation and corrected to account for the
Page 113
93
instrument line broadening obtain from standard LaB6 [10]. The metal dispersion is
defined as the percentage of metal atoms exposed on the surface and it can be calculated
based on crystallite size.
In order to determine the amount of carboxyl groups on the MWCNTs, 20mg of
functionalized carbon nanotubes was dispersed in 50ml of 0.001M NaOH solution by
ultrasonic bath and then titrated with 0.001M HCL solution.
A 50 mL stainless steel batch reactor was used throughout all gasification experiments.
The heating medium was a molten salt bath. In all experiments, 0.2 g of glucose was
added to 9.8 g of pure water to obtain a 2 wt% solution. This solution along with 0.5 g of
catalyst was then introduced into the reactor which was further immersed in the salt bath
at 380 oC. After reacting for 30min, the reactor was immediately cooled to room
temperature by quenching in cold water. Then, the pressure in the reactor was determined
using a digital gauge. The gaseous product was then collected in a gas bag for
composition analysis by GC.
High surface area multiwalled carbon nanotube was obtained from Cheap Tube Inc.
(Vermont, USA). The length, outer and inside diameter of the nanotubes are 20 µm, 8 nm
and 2-5 nm, respectively. The BET surface area of the CNT was measured at 495 m2/g.
The oxidative pretreatment was performed by nitric acid on the MWCNT prior to the
impregnation. Catalysts were prepared by impregnation of the functionalized MWCNT to
the incipient wetness using nickel nitrate (Sigma Aldrich) precursor. After drying at 110
oC overnight, the catalysts were reduced in 20% hydrogen for 2 h at 400
oC.
Page 114
94
4.3 Results and Discussions
In this section, physical properties of MWCNT are given and different aspects of
functionalization of carbon nanotubes and their impact on surface and structural
properties are discussed. Following this part, effect of different parameters on
impregnation and calcination of functionalized multi-walled carbon nanotubes
(FMWCNT) will be presented.
Physical properties of MWCNT
According to the manufacturer, the average length, diameter and density of the multi-
walled carbon nanotubes are 7 m, 120 nm and 2.1 g/ml, respectively. Based on our
nitrogen adsorption tests, the specific area of these multi-walled carbon nanotubes is
equal to 14.3 m2/g. The total pore volume and average pore diameter are equal to 0.1
ml/g and 27.7 nm, respectively.
Functionalization of MWCNTs
In order to be able to uniformly attach metal nanoparticles on the carbon nanotubes, the
surface of MWCNT should be chemically modified by an oxidizing agent. It is known
that oxidative treatment not only introduces oxygen-containing functional groups such as
carboxyl and hydroxyl onto the outer surface of carbon nanotubes, but also it increases
the specific surface area of the multi-walled carbon nanotubes. The BET surface area of
the MWCNTs used in this study changed from 14.3 m2/g to 19.5 m
2/g after five hours of
treatment in 10M nitric acid. The extent of this surface treatment can be determined by
different analytical methods such as UV spectroscopy, XPS and acid-case titration.
Page 115
95
Table 4.1 summarizes the elemental composition of the catalysts at different preparation
steps obtained from XPS. As it is expected, the amount of oxygen increases after the acid
treatment. Then, addition of nickel nitrate hexahydrate further increases the oxygen
content of the surface. Finally, nickel nitrate hexahydrate is decomposed to nickel oxide
and as a result, the surface concentration of oxygen decreases.
Table 4.1 Elemental composition of nickel decorated MWCNT obtained by XPS
Nitric acid concentration.
Preparation step Carbon Oxygen Nickel Nitrogen
No treatment 98.5 1.5 0 0
Acid treated 89 11 0 0
Impregnated 75 19 2.8 3.2
Calcined 82 11.6 6.4 0
Figure 4.1 depicts TGA of fresh and FMWCNT in air. Expectedly, due to an increase in
defective sites and addition of oxygen-containing functional groups, the cracking
temperature of nanotubes decreases upon subjecting to an oxidative treatment. This result
is consistent with previous literature.
Page 116
96
Figure 4.1 TGA of fresh and FMWCNT in air.
It is also found that treatment in boiling nitric acid can decrease the zeta potential of the
carbon nanotubes to more negative values. This effect is more pronouned for treatment in
higher acid concentrations. Figure 4.2 shows the zeta potential after five hours treated
MWCNT at different acid concentrations. Increase in the negative surface charge of
FMWCNT improves its dispersion in water and enhance the impregnation and adsorption
of precursor on its surface.
Page 117
97
Figure 4.2 Zeta potential of FMWCNT vs. nitric acid concentration.
Acid treatment time
The concentration of carboxyl groups on the surface of FMWCNT is measured by acid-
base titration. Figure 4.3 shows the relationship between acid treatment time and the
concentration of carboxyl groups. Based on this figure, the concentration of carboxyl
groups significantly increases at prolonged treatment times.
-40
-35
-30
-25
-20
-15
-10
0 5 10 15
Zet
a p
ote
nti
al
(mV
)
Acid concentration (M)
Page 118
98
Figure 4.3 Concentration of carboxyl groups vs. treatment time.
In order to better evaluate the effectiveness of different oxidative treatments, a
thermogravimetric analysis in an inert environment is performed to thermally remove the
functional groups from the surface of FMWCNT. For all samples, temperature is raised
to 800oC at a heating rate of 10
oC/min and kept at 800
oC for 1 hour. Table 4.2 illustrates
the weight percent of removed functional groups by thermal annealing of functionalized
carbon nanotubes.
0
0.2
0.4
0.6
0.8
1
1.2
0 5 10 15 20 25
CO
OH
[m
mo
l/g
]
Treatment time [h]
Page 119
99
Table 4.2 Weight percent of the removed functional groups obtained from TGA
in nitrogen.
Sample Acid Conc. [M] Treat. Time [h] Percent removed
No treatment - - - 0.15
Acid treated Nitric 10 5 1.23
Acid treated Nitric 10 24 1.43
Acid treated Nitric 16 5 13.2
Acid treated Sulfuric 10 5 2.01
It should be also noted that almost no weight loss is observed below 700oC, therefore the
weight loss corresponds to removal of functional groups rather than the adsorbed species.
From this table, increasing acid concentration has a more dramatic effect on the surface
concentration of functional groups. Also, it is realized that at a same concentration,
sulfuric acid leads to a higher concentration of functional groups than nitric acid does.
Impregnation of functionalized MWCNT
Effect of acid concentration
It has been shown that the amount of oxygen-containing functional groups has a positive
relationship to concentration of the utilized acid. Figure 4.4 demonstrates two TEM
micrographs of carbon nanotubes decorated with nickel on their outer surface. Based on
this image, it is apparent that dispersion of nickel nanoparticles is considerably better
when MWCNT is functionalized in a more concentrated oxidizing agent. Figure 4.5
shows the effect of surface modification using different acid concentrations on the
average nickel crystallite size as determined using XRD. In all cases, nickel loading is
20% by weight and treatment time is set to 5 hours.
Page 120
100
Figure 4.4 TEM micrographs of 20% Ni/FMWCNT, 5h oxidative treatment with
nitric acid 4M (left) and 16M (right)
Figure 4.5 Nickel crystallite size vs. nitric acid concentration for 20%
Ni/FMWCT.
15
20
25
30
35
0 5 10 15
Siz
e [n
m]
Concentarion [M]
Page 121
101
Treatment time
Titration of functionalized MWCNT indicated that prolonged treatment times results in a
higher concentration of functional groups. Therefore, it is anticipated that nickel
dispersion increases with the extent of treatment. Figure 4.6 exhibits nickel nanoparticles
on 20% Ni/MWCNT catalysts with and without surface functionalization.
Using Scherrer equation, nickel crystallite size is calculated and results are plotted in
Figure 4.7. The average crystallite size decreases from 30nm to about 15nm upon surface
treatment of nanotubes for 24 hours in 10M nitric acid.
Figure 4.6 TEM micrographs of 20% Ni/MWCNT, with no treatment (left) and
with 24h treatment in 10M nitric acid.
Page 122
102
Figure 4.7 Nickel crystallite size vs. treatment time for 20% Ni/FMWCNT.
In order to better assess the effect of functionalization, oxidation of 20% Ni/MWCT with
and without surface modification is studied by TGA (Figure 4.8). It is obsereved that
20% Ni/FMWCNT has a single craking temperature at about 550oC, while the weight
derivative curve of the composite made of 20%Ni/MWCNT can be deconvluted into two
separate peaks whose centers are at 570oC and 740
oC. This further confirm that without
functionalization, a significant number of carbon nanotubes have no nickel attached to
their surface while other ones are decorated with nickel nanoparticles. This observations
confirms the nonuniformity of non-chemically modified catalysts as oppose to modified
ones.
10
15
20
25
30
35
0 4 8 12 16 20 24
Siz
e [n
m]
Treatment time [h]
Page 123
103
Figure 4.8 Effect of oxidative treatment on cracking temperature of
20%Ni/MWCT with and without acid treatment.
Treatment method
Four different oxidizing agents (HNO3, H2SO4, mixture of HNO3 and HCl as well as
partial oxidation in air) are considered for addition of functional groups onto MWCNT.
Partial oxidation is performed in air at 600oC until 20% of the weight is burned. As can
be seen in Figure 4.9, partial oxidation in air cannot improve the dispersion of
nanoparticles. For other treatment methods, at a same treatment condition (concentration
and time), sulfuric acid treated sample has the smallest crystallite size compared to the
other two. This finding suggest that at the same acid molar concentration, sulfuric acid
treatment can lead to a more uniform Ni nanoparticle dispersion.
0
0.2
0.4
0.6
0.8
1
350 450 550 650 750
Wei
gh
t d
eriv
ati
ve
Temp. [0C]
No treatment
5h treatment
Page 124
104
Figure 4.9 Nickel crystallite size vs. treatment type for 20% Ni/FMWCNT.
Nickel loading
Ni/FMWCNT catalysts with five different nickel loadings are prepared using incipient
wetness. The XRD pattern of these samples are given in Figure 4.10. The first peak at 26o
corresponds to CNT while the other two peaks at 37o and 43
o are NiO(111) and NiO(200)
respectively. However, MWCNT also has a very small peak at around 43o that coincides
with NiO(200).
0
10
20
30
40 S
ize
[nm
] HNO3 + HCl
Partial oxidation
HNO3
H2SO4
Page 125
105
Figure 4.10 XRD patterns of decorated carbon nanotubes at different nickel
loadings.
The nickel oxide crystallite size and its corresponding dispersion for FMWCNT are
presented in Figure 4.11. It is noted that nickel nanoparticles become larger at higher
loadings and as a result, better dispersions can be only achieved at low nickel
percentages.
Page 126
106
Figure 4.11 Nickel crystallite size and dispersion vs. nickel loading. Treatment
time: 5 hours).
Figure 4.12 shows TEM of decorated carbon nanotubes with 5%, 20% and 50% nickel.
As it was indicated by XRD, the nickel crystallites become larger at higher nickel
loadings, resulting in a poor dispersion. Furthermore, it is noticed that at high nickel
loadings, nickel crystallites are somewhat porous with a pore diameter of about few
nanometers. This phenomena has been observed for nickel nano-belts and it has been
suggested that it could be an artefect of interaction of effect of TEM electron beam with
nickel crystalls [11,12].
2
3
4
5
6
7
8
10
15
20
25
30
35
40
0 10 20 30 40 50 60
Dis
per
sio
n %
Siz
e [n
m]
Nickel loading %
Page 127
107
Figure 4.12 TEM micrographs of Ni/FMWCNT at different metal loadings, a) 5%
b) 20% c) 50% d) porous nickel crystals formed on 50% Ni/FMWCNT.
Thermogravimetric analysis of the samples with different nickel loadings (Figure 4.13)
indicated that at a lower nickel loadings (<20%) oxidation of NiO/FMWCNT is non-
uniform at occurs at two distinct temperatures (~600oC and 710
oC). Meanwhile, TEM
images show that nearly all FMWCNT are somewhat covered with Ni nanoparticles
regardless of Ni loading. This observation suggest that non-uniform oxidation of
FMWCNT are likely due to the presence of relatively large uncovered area on the surface
of individual CNT particles. This phenomenon can be different form Figure 4.8 where Ni
nanoparticles were absent from a portion of CNT’s. Also, higher peak for
a b
c d
Page 128
108
20%Ni/FMWCNT compared to that of 50% Ni/FMWCNT is due to lower amount of
residue (i.e. nickel oxide).
Figure 4.13 Derivate if weight loss vs. temperature for different nickel loadings.
It is found that the zeta potential of the nickel-decorated carbon nanotubes increases from
-32 to about zero by increasing the nickel content of the samples from 0 to 50% (Figure
4.14). This increase in hydrophobicity of the Ni/FMWCNT may cause clustering of the
catalyst in aqueous solutions.
0
0.2
0.4
0.6
0.8
1
370 470 570 670 770
Wei
gh
t d
eriv
ati
ve
Temp. [0C]
5% Nickel
10% nickel
20% Nickel
50% Nickel
Page 129
109
Figure 4.14 Zeta potential of Ni/FMWCNT vs. nickel loading.
Due to high hydrophobicity of carbon, solvent polarity adversely affects the size of Ni
nanoparticles. Therefore, it is anticipated that organic solvents result in a better metal
dispersion compared to water-based precursors. To examine this effect, three solvents
(i.e. water, methanol and acetone) with different dielectric constants are used for the
preparation of nickel nitrate precursor (Figure 4.15). The corresponding dielectric
constant of water, methanol and acetone are 80, 33 and 21, respectively. Figure 4.16
presents size of the nickel oxide nanoparticles obtained from Scherrer equation. It
becomes apparent that the nanometal crystallite size significantly decreases by decreasing
the polarity of the solvent.
-35
-30
-25
-20
-15
-10
-5
0
5
0 10 20 30 40 50
Zet
a p
ote
nti
al
(mV
)
Nickel %
Page 130
110
Figure 4.15 Nickel crystallite size for different precursor solvents.
Calcination and Reduction
Calcination temperature
Drying of impregnated samples forms nickel nitrate crystals on the surface of FMWCNT.
Following this step, calcination of the catalyst at higher temperatures decomposes the
nickel nitrate crystals to nickel oxide with permanent chemical bonds to the functional
groups of the FMWCNT. Figure 4.16 (left) shows the decomposition of Ni(NO3)2.
6H2O in air as measured using TGA. It can be seen that at 225oC water is completely
evaporated and nickel nitrate starts to decompose to nickel oxide at temperatures greater
than 280oC. Therefore, the calcination temperature should be greater than 280
oC. Figure
4.17(right) illustrates the effect of calcination temperature on nickel oxide crystallite size.
It is found that calcination temperature does not affect the crystal size up to 450oC.
5
10
15
20
25
Water Methanol Acetone
Siz
e [n
m]
Page 131
111
Figure 4.16 Nickel crystallite size vs. calcination temperature for 20%
Ni/FMWCNT.
Finally the calcined samples are reduced in a TPR unit to study the reduction temperature
of nickel oxide nanoparticles.
The TPR results (Figure 4.17) of the Ni/FMWCNT at a heating rate of 10oC/min indicate
that the reduction of nickel oxide starts at about 320oC. However, depending on the
amount of nickel, it might be required to increase the reduction temperature up to 550oC
to obtain a complete reduction. Also, it is realized that due to the interaction between
nickel oxide and carbon support, the peak temperature for a same amount of nickel oxide
(i.e. 10% NiO/FMWCNT and nickel oxide powder) is shifted towards higher
temperatures.
Page 132
112
Figure 4.17 Temperature programmed reduction of Ni/FMWCNT and NiO
powder at heating rate of 10oC/min.
4.4 Activity of Ni/MWCNT Catalyst for SCWG of Glucose
In this section, results of the hydrothermal gasification of glucose with Ni/MWCNT are
presented. Figure 4.18 illustrates the effects of acid concentration on the catalytic activity
of 7% and 20% Ni/MWCNT for the gasification of glucose in SCW. It was observed that
the carbon conversion and methane yield dramatically dropped upon oxidative
pretreatment of the MWCNT in 5 M nitric acid. However, the activity of the catalysts
increased when the carbon nanotubes were functionalized in a more concentrated acid. In
order to better understand the variation in catalytic activity of Ni/MWCNT, a few number
of experiments without the addition of glucose were carried out. These experiments
(Table 4.3) helped to determine the approximate amount of carbon originally from the
catalyst that ends up in the gas phase upon the exposure to SCW. It was found that the
MWCNT support without nickel is fairly stable in SCW condition (entry 1). The amount
Page 133
113
of carbon in the gas phase increased by the impregnation of the nickel, and it was further
increased by the oxidative pretreatment of the nanotubes. Therefore, it can be concluded
that functionalization of the carbon nanotube makes it more vulnerable to gasification in
SCW medium. On the other hand, addition of oxygen functional group and defects that
were created during the acid pretreatment increased the metal dispersion which may
change the catalytic activity on Ni/MWCNT through changing the metal crystallite size.
This decrease in the metal nanoparticle size may have a positive or negative effects. The
positive effect can be attributed to the greater number of active sites at higher dispersions
and the negative effect may be due to the loss of catalytic activity of metal crystallite at
extremely small sizes. The effect of acid treatment time was almost identical to the effect
of acid concentration, the catalytic activity dropped to a minimum and then increased.
Page 134
114
Table 4.3 Gas formation from the catalyst support (with no glucose). 380 oC,
30min, 0.5 g catalyst, 9.8 g water. Yield and CGR are calculated with 0.2 g glucose
as a hypothetical feed.
Entry Ni
[wt %]
Nitric
acid
[M]
Treatment
time
[h]
pf
[bar]
Yield
[mmol/g]
CGR
%
1 0 - - 0.14 1.2 4
2 20 - - 0.27 2.4 8
3 20 5 5 0.54 4.5 14
4 20 10 5 0.41 3.4 10
5 20 16 5 0.81 6.8 20
Page 135
115
Figure 4.18 Carbon conversion and gas yields vs. nitric acid concentration. 380 oC, 30min, 0.5 g catalyst, 9.8 g water, 0.2 g glucose, MWCNT pretreatment time=5
h.
Page 136
116
Figure 4.19 Carbon conversion and gas yields vs. acid treatment time. 380
oC,
30min, 0.5 g catalyst, 9.8 g water, 0.2 g glucose. Nitric acid concentration=10 M.
4.5 Conclusion
In this study, different aspects of formation of nickel nanoparticles on multi-walled
carbon nanotubes are discussed. It has been shown that functionalization of MWCNT in a
concentrated oxidizing agent for prolonged times results in a better dispersion of the
nanoparticles. Also, it is found that nickel crystal size increases by increasing nickel
loading. Non-polar solvents such as acetone are found to be more appropriate for
formation of well-dispersed nickel nanoparticles. Calcination temperature does not
change the crystallite size of nickel nanoparticles in temperature range of 280 oC to 450
Page 137
117
oC. Based on TPR test, the nickel oxide deposited on carbon nanotube can be reduced
between 350 oC to 450
oC.
4.6 References
[1] Iosif Daniel Rosca, Fumio Watari, Motohiro Uo, Tsukasa Akasaka, Oxidation of
multiwalled carbon nanotubes by nitric acid, Carbon, 43, 2005, pg. 3124–3131
[2] Gregory G. Wildgoose, Craig E. Banks, and Richard G. Compton, Metal
Nanoparticles and Related Materials Supported on Carbon Nanotubes: Methods and
Applications, Small, 2(2), 2006, pg. 182–193
[3] Huaping Liu, Guoan Cheng, Ruiting Zheng, Yong Zhao, Changlin Liang, Influence of
synthesis process on preparation and properties of Ni/CNT catalyst, Diamond & Related
Materials, 15, 2006, pg. 15–21
[4] H. Liu, G. Cheng, R. Zheng, Y. Zhao, C. Liang, Influence of acid treatments of
carbon nanotube precursors on Ni/CNT in the synthesis of carbon nanotubes, Journal of
Molecular Catalysis A: Chemical, 230, 2005, pg. 17–22
[5] L.M. Ang, T.S.A. Hor, G.Q. Xu, C.H. Tung, S.P. Zhao, J.L.S. Wang, Decoration of
activated carbon nanotubes with copper and nickel, Carbon, 38, 2000, pg. 363–372
[6] H. M. Yang, P. H. Liao, Preparation and activity of Cu/ZnO CNTs nano-catalyst on
steam reforming of methanol, Applied Catalysis A: General, 317, 2007, pg. 226–233
[7] P.G. Savva, G.G. Olympiou, C.N. Costa a, V.A. Ryzhkov, A.M. Efstathiou,
Hydrogen production by ethylene decomposition over Ni supported on novel carbon
nanotubes and nanofibers, Catalysis Today, 102–103, 2005, pg. 78–84
Page 138
118
[8] H.S. Kim, H. Lee, K. S. Han, J.-H. Kim, M. S. Song, M. S. Park, J. Y. Lee, J. Kang,
Hydrogen Storage in Ni Nanoparticle-Dispersed Multiwalled Carbon Nanotubes, Journal
of Physical Chemistry B, 109,2005, pg. 8983-8986
[9] J. M. Planeix, N. Coustel, B. Coq, V. Bretons, P. S. Kumbhar, R. Dutartre, P.
Geneste, P. Bernier, P. M. Ajayan, Application of Carbon Nanotubes as Supports in
Heterogeneous Catalysis, Journal of American Chemical Society, 116,1994, pg. 7935-
7936
[10] C. H. Bartholomew, R. J. Farrauto, Fundamental of Industrial Catalytic Processes,
2nd Edition, Wiley, New York, 2005
[11] L. Dong, Y. Chu, W. Sun, Controllable Synthesis of Nickel Hydroxide and Porous
Nickel Oxide Nanostructures with Different Morphologies, Chemistry European Journal,
14, 2008, pg. 5064–5072
[12] W. Yue, W. Zhou, Porous crystals of cubic metal oxides templated by cage
containing mesoporous silica, Journal of Materials Chemistry, 17, 2007, pg. 4947–4952
5- Catalytic SCWG of Various Lignocellulosic Materials
* Based on: P. Azadi, S. Khan, F. Strobel, F. Azadi, R. Farnood, Hydrogen Production
from Cellulose, Lignin, Bark and Model Carbohydrates in Supercritical Water using
Nickel and Ruthenium Catalysts, Applied Catalysis B: Environmental, 117, 330-338.
Abstract
In this chapter, the catalytic activity and hydrogen selectivity of Ni/α-Al2O3,
Ni/hydrotalcite, Raney nickel, Ru/C and Ru/γ-Al2O3 catalysts for hydrothermal hydrogen
production from lignocellulosic biomass have been evaluated. The feedstocks included
glucose, cellulose, fructose, xylan, pulp, lignin and bark. The experiments were carried
Page 139
119
out at 380 oC in a batch reactor with 2 wt% feed concentration. It was found that the
gasification of glucose, fructose, cellulose, xylan and pulp resulted in comparable gas
yields (± 10% at 60min), whereas lignin was substantially harder to gasify. Interestingly,
gasification yield of bark which has a high lignin content was comparable to those of
carbohydrates after 60min reaction time. For a given feedstock, catalyst type affected
both the gasification yield and the product distribution. Ni/α-Al2O3 and Ni/hydrotalcite
catalysts were not only highly active for the gasification of carbohydrates, but also had
better hydrogen selectivity when compared to Raney nickel, Ru/C and Ru/γ-Al2O3. In
particular, gasification of bark in the presence of these catalysts resulted in negligible
amounts of alkanes.
5.1 Introduction
Supercritical water gasification (SCWG) is a promising process for the production of
biorenewable hydrogen from biomass. In this process, wet biomass is decomposed to
form hydrogen, carbon dioxide, methane and carbon monoxide. In comparison with the
steam reforming process (e.g., T>650 oC and low pressures), catalytic supercritical water
gasification proceeds at milder temperatures (e.g., T<450 oC) with little or no char
formation [1]. In spite of major advancements over the past decades, there are still
important challenges that need to be addressed to make catalytic SCWG technically and
economically viable for hydrogen production. Poor hydrogen selectivity, catalyst
deactivation, tar and char formation, heat recovery and precipitation of inorganic salts are
among the most important issues that are yet to be addressed.
Page 140
120
Since SCWG is operated at a high water content (typically 80-90%), and given the
considerably high specific heat of water, it is of great importance to run the reaction at
the lowest possible temperatures. It has been shown that homogeneous alkali and nickel
and ruthenium-based solid catalysts are useful for enhancing the gasification rates at
moderate temperatures [2, 3]. Supercritical water gasification of glucose in presence of
different skeletal catalysts indicated that the inherent activity of the nickel is substantially
higher than that of cobalt and copper [4]. In general, catalyst formulation along with the
operating conditions such as temperature and feed concentration can significantly affect
the conversion and product distribution. More detailed discussion regarding the current
status of the catalytic SCWG can be found in [5-6].
Review of the literature illustrates that both real biomass and model compounds have
been employed to evaluate the effectiveness of the catalytic SCWG process [5-7].
Investigations on real biomass provides practical information on the performance of the
SCW gasifiers at various operating conditions while model compounds may be used in
the laboratory for fundamental studies. The real biomasses considered for gasification in
SCW include lignocellulosic biomass from different sources, sewage sludge [8-10], pulp
and paper wastes [11], chicken manure [12], food wastes [13], and algae [14, 15]. Given
the fact that lignocellulosic biomass is the most abundant type of biomass on the earth, its
conversion and upgrading is expected to play a significant role in the production of future
fuels. Representative model compounds of various types of biomass such as cellulose,
glucose, phenolics, glycerol and alcohols have been also considered in the literature.
Earlier studies have shown that due to the fast hydrolysis of cellulose to glucose and
Page 141
121
other sugar oligomers, gasification of glucose and cellulose led to identical gas yields
[16]. Osada et al. showed that ruthenium is an effective catalyst for decomposition of
organosolv lignin in SCW [17], but its activity decreased by the addition of sulfur to the
feed [18]. The same behavior was observed when sulfur was added to a Raney-nickel
catalyzed SCWG reaction [9]. Interaction among different reactants during the SCWG
has been also studied using representative mixtures of model compounds as a feedstock.
In the case of cellulose/lignin sulfonate mixtures at low catalyst loadings (0.4 g [Ni
5132P, Engelhard]/g feed), a strong negative deviation from the rule of mixtures in terms
of carbon conversion was observed whereas mixtures of cellulose and xylan at any ratio
were found to exhibit a very predictable gasification efficiency that closely matched the
rule of mixtures [19, 20]. The magnitude of the negative deviation for the cellulose-lignin
sulfonate substantially decreased at higher catalyst to feed ratios [20] and the authors
suggested that the possible mechanism for this deviation the catalyst deactivation by tarry
products formed due to the reaction between cellulose and lignin. Moreover, Yoshida et
al. [20] found that the gasification yield of saw dust was nearly 90% of the predicted
value based on the rule of mixtures.
In general, SCWG of carbohydrates using supported nickel catalysts at temperatures
below 400oC typically results in 1-15 mmol H2/g dry feed [6], corresponding to 1.5-23%
of the maximum stoichiometric value (not considering the thermodynamic equilibrium),
while the SCWG of lignin at the same operating range generate 1-2 mmol/g dry feed [6].
We note that it is not be possible to increase the hydrogen yield simply by extending the
reaction time, as the hydrogen yield decreases due to methanation reaction in the
Page 142
122
presence of typical Ni and Ru catalysts. The low hydrogen selectivity is caused by the
high activity of nickel and ruthenium to open the C-O bonds, which in turn would result
in the formation of alkanes. Although many studies have been devoted to evaluate the
short term activity of heterogeneous catalysts, limited work is done on enhancing the
hydrogen selectivity and decreasing the alkane selectivity. In one of the few attempts,
Dumesic et al. showed that the hydrogen selectivity of Raney nickel catalyst for aqueous
phase reforming can be significantly improved by adding tin onto the surface of the
Raney nickel catalysts [21-24]. Addition of molybdenum as a promoter to Raney nickel
did not have a pronounced effect on the catalyst performance [4].
In this chapter, we present a systematic study of SCWG of several lignocellulosic
materials with five promising catalysts including three nickel and two ruthenium
catalysts. Commercially available Raney nickel, Ru/activated carbon and Ru/γ-alumina
along with two laboratory-made nickel catalysts supported on α-alumina and hydrotalcite
were considered. The relationship between hydrogen selectivity and carbon conversion
for the gasification of glucose, cellulose, xylan, kraft lignin and birchwood bark is
discussed in details. To the best of our knowledge, this is the first paper concerning
supercritical water gasification of bark. Results of this study provide a better
understanding of the performance of solid catalysts for the gasification of lignocellulosic
biomass in supercritical water in terms of activity and hydrogen selectivity.
5.2 Materials and Methods
A schematic of the experimental setup is shown in Figure 1. A non-stirred 50 mL
stainless steel batch reactor was used in the SCWG experiments. In all experiments, 0.2 g
Page 143
123
of feedstock was added to 9.8 g of deionized water to obtain a 2 wt% mixture. This
mixture along with the desired amount of catalyst was introduced into the reactor and
immersed in a molten salt bath containing sodium nitrate, sodium nitrite (General
Chemical, USA), and potassium nitrate (Alphachem, USA). The heat transfer from
molten salts to SCW reactors has been discussed in [25].
The metal loadings of Ni and Ru (excluding the catalyst support) were set at 120 mg and
6 mg, respectively. These amounts were chosen in such way that the carbon conversions
of about 60% can be obtained from SCWG of glucose in 15min reaction experiments.
The temperature of the salt bath was measured using a Type K thermocouple (Omega
Engineering, Canada) and was maintained at 380 °C using a PID temperature controller
(Hanyoung, Electronic Co. Ltd., Korea). The corresponding pressure in the reactor at 380
oC was estimated to be 230 bar. Four different reaction times were considered: 5, 15, 30
and 60min. After a predetermined reaction time, the reactor was rapidly cooled by
quenching in cold water and allowed to reach the room temperature. Then, the pressure in
the reactor was determined using a digital pressure gauge (Cecomp Electronics) and was
used to calculate the gas yield using the ideal gas law. The gaseous product was then
collected in a gas bag for composition analysis. The data reproducibility was confirmed
to be within ± 5% by performing at least one replicate run for each data point.
A gas chromatograph (Hewlett-Packard 5890 series) equipped with a thermal
conductivity detector and argon as carrier gas was used to determine the product gas
composition. A 5m general SupelcoSS 60/80 CARBOXEN 1000 column (Sigma-
Page 144
124
Aldrich, Canada) was used for fractionation of the permanent gases. The oven, injector
and detector in the GC were all set at 140 °C.
The model compounds investigated in our experiments included: glucose (CAS 50-99-7),
microcrystalline cellulose (CAS 9004-34-6), alkali lignin (CAS 8068-05-1) and xylan
from oat spelts (CAS 9014-63-5), all of which were obtained from Sigma-Aldrich,
Canada. Kraft pulp was obtained from the National Institute of Standards and
Technology USA, and bark from birchwood was kindly provided by Professor Ning Yan
from the Department of Forestry at University of Toronto. The elemental analysis (2400
Series II CHNS Analyzer from Perkin Elmer operating at the C-H-N mode) indicated that
the empirical formulas of lignin and bark were CO0.95H0.63N0.002 and CO0.88H0.83N0.01,
respectively.
The commercial catalysts including Raney nickel 4200 (received as aqueous slurry
containing 50% solid content), 5% Ru/C and 5% Ru/γ-Al2O3 as well as α-Al2O3,
hydrotalcite (HT), and nickel nitrate were all obtained from Sigma-Aldrich Canada.
Ni/α-Al2O3 and Ni/HT catalysts were prepared by incipient wetness impregnation with
nickel nitrate solution. The catalyst precursors were dried at 110 oC over night and
calcined in air at 350 oC for 3 h. The catalyst was then reduced in flowing hydrogen for 2
h (50 ml STP/min, 30% H2, 70% N2) and stored in water before being used in the
experiments. The SEM micrographs of the catalysts used in this study are depicted in
Figure 2. These images are obtained using JEOL JSM-840 scanning microscope. The
BET surface area and metal dispersion were obtained using Quantachrome Autosorb
catalyst characterization system (Quantachrome, USA). Figure 3 shows the pore size
Page 145
125
distributions of α-Al2O3 and hydrotalcite based on nitrogen adsorption. The supports
materials were degassed under vacuum at 300 oC for 3 h prior to nitrogen adsorption.
Based on this figure, a large fraction of the pores in the α-alumina support were greater
than 40 nm whereas hydrotalcite had a bimodal pore size distribution at ~5 and 20 nm.
The characteristics of the utilized catalysts are listed in Table 1.
Table 5.1 Physical characteristics of the catalysts used in this study.
Catalyst Ni or Ru
wt%
Particle size
(µm)
BET
(m2/g)
Metal dispersion *
%
Raney nickel 93 35 78 13.4
Ni/α-Al2O3 5 118 8 4.5
Ni/Hydrotalcite 5 1 12 1.3
Ru/C 5 18 900 41.0
Ru/γ-Al2O3 5 40 90 16.7
* The metal dispersion obtained from [26] for Ru/C and [27] for Ru/γ-Al2O3.
Figure 5.1 Schematic diagram of the experimental set-up: 1) molten salt bath, 2)
reactor, 3) electrical heater, 4) thermocouple, 5) PID temperature controller, 6) first
valve, 7) low-pressure gauge, 8) second valve.
Page 146
126
The equilibrium gas yields were calculated using Gibbs free energy minimization using
Aspen Plus (AspenTech, Burlington, USA).
Figure 5.2 SEM micrograph of the catalysts used in this work . a) Raney nickel,
b) Ni/α-Al2O3, c) Ru/C, d) Ru/γ-Al2O3
Page 147
127
Figure 5.3 Pore size distribution of α-Al2O3 (top) and hydrotalcite (bottom). The
unit of the Y-axis is cc/Å/g .
0.0
0.5
1.0
1.5
2.0
10 100 1000
Dv
(r)
x 1
04
Pore width (Å)
0.0
0.5
1.0
1.5
2.0
10 100 1000
Dv
(r)
x 1
04
Pore width (Å)
Page 148
128
5.3 Results
The effects of catalyst type, feedstock, and the reaction time on the supercritical water
gasification of several lignocellulosic materials have been systematically investigated.
Experimental results are presented in terms of gas yields (mmol gas/ g feed), carbon
gasification ratio (CGR) and hydrogen selectivity. Carbon gasification ratio is defined as
the ratio of carbon in the gas products to the carbon in the initial feed. Hydrogen
selectivity is defined as the number of moles of H2 to the number of moles of hydrogen in
methane and it has been calculated as follow:
Hydrogen selectivity = moles of H2 / (2 × moles of CH4) (5.1)
Given the differences in the quantities of the active elements (i.e. Ni & Ru) and the metal
dispersions, comparison was only made between the activities of catalysts with the same
type of active metal. We also note that the CO yield in all catalytic SCWG experiments
were below 1 mmol/g and therefore not shown in the figures.
5.3.1. Thermodynamic considerations
The theoretical equilibrium concentrations of the gaseous products obtained using Gibbs
free energy minimization at 380 oC and 230 bar for the mixtures of 98 wt% water and 2
wt% feed are given in Table 2. Under these operating conditions, the equilibrium
hydrogen yield for the carbohydrates was limited to about 6mmol/g feed and the methane
yield varied from 15 to 17 mmol/g feed, with cellulose having the highest methane yield
compared to other carbohydrates examined in this work.
Page 149
129
As methane formation during gasification of biomass in SCW medium does not have a
pyrolytic origin and it is mostly formed through hydrogenation on the catalytically active
metal surface [28], it is possible to minimize the methane yield through careful design of
the reactor and the use of appropriate catalysts. Indeed, this highlights the need for design
of selective catalysts with minimal activities for hydrogenation through cleavage of C-O
bond.
Table 5.2 Thermodynamic equilibrium of 2 wt% feeds at 380 oC and 230 bar.
Feed Formula C/O
ratio
H2
(mmol/g)
CO
(mmol/g)
CH4
(mmol/g)
CO2
(mmol/g)
Hydrogen
selectivity
Glucose C6H12O6 1.00 5.7 0.008 15.2 18.1 0.19
Fructose C6H12O6 1.00 5.7 0.008 15.2 18.1 0.19
Cellulose (C6H10O5)n 1.20 5.8 0.009 17.0 20.0 0.17
Xylan (C5H8O4)n 1.00 5.7 0.008 15.2 18.1 0.19
Lignin CH0.63O0.95N0.002 1.05 4.8 0.009 11.0 24.8 0.22
Bark CH0.83O0.88N0.01 1.14 5.1 0.010 12.8 24.1 0.20
5.3.2. Catalyst-free SCWG
In order to evaluate the effectiveness of the catalysts, the gas yields and carbon
conversion obtained from catalyst-free supercritical water gasification in 15min batch
experiments are given in Table 3. It was found that without the addition of catalysts, the
Page 150
130
carbon conversions obtained from these compounds were typically between 6%-22%,
depending on the feedstock.
Table 5.3 Gas yield and CGR obtained from catalyst-free SCWG of 2 wt%
feeds at 380 oC in 15min batch experiments.
Feed H2
(mmol/g)
CO
(mmol/g)
CH4
(mmol/g)
CO2
(mmol/g)
CGR
%
Glucose 2.7 1.0 0.10 6.5 22
Fructose 1.5 0.7 0.02 4.9 17
Cellulose 1.1 1.0 0.10 6.3 20
Xylan 1.1 0.8 0.02 4.8 17
Lignin 1.6 0.1 0.14 1.8 6
Bark 1.3 0.4 0.03 3.2 9
5.3.3. Nickel-Catalyzed SCWG
Figures 5.3-5.5 illustrate the yields of gaseous products obtained from the catalytic
SCWG of different species using Raney nickel, Ni/α-Al2O3 and Ni/hydrotalcite,
respectively. It was observed that the gasification yields and the product distributions of
glucose and fructose were similar to those of cellulose (± 10 % at 60min). However,
SCWG of lignin was more difficult (i.e. lower yield) compared to carbohydrates.
Although hardwood bark typically contains 40-50% lignin, 32-47% carbohydrates and 5-
12% extractives [29], its gasification yield was found to be comparable to that of
carbohydrates and significantly higher than that of lignin. The experimental gas yields
positively deviated from the expected values based on the rule of mixtures. For example a
total gas yield of 70mmol/g feed was obtained for the gasification of bark with Ni/α-
Al2O3 catalyst after 60min whereas the expected value for this experiment based on the
Page 151
131
rule of mixtures was only 51mmol/g. Furthermore, we note that the decomposition of
bark in the presence of Ni/α-Al2O3 and Ni/hydrotalcite catalysts resulted in low methane
yields even after long reaction times. Yoshida et al. have previously shown that for the
mixture of cellulose and lignin sulfonate, the negative deviation from the expected yields
(obtained from the rule of mixtures) became less pronounced by increasing the catalyst
loading and reported that the gasification yield of sawdust in near critical water and in the
presence of nickel catalyst was nearly 90% of the theoretical value [20]. Similarly,
Waldner and Vogel [30] reported near-complete gasification yield of bark-free fir and
spruce sawdust at 400oC with Raney nickel as catalyst. These observations imply that
naturally occurring lignocellulosic compounds could be entirely gasified in supercritical
water with sufficient amount of catalyst. Hence, the low conversion of lignin and also the
negative deviation of blends of lignin and carbohydrates from the rule of mixtures are
likely caused by the catalyst poisoning due to the sulfur content and/or the condensed
chemical structure of lignin sulfonate (compared to the original protolignin in wood).
In general, in order to interpret the results obtained from the SCWG of a binary mixtures
of compounds A & B the following parameters should be considered: i) the relative
gasification rates of A and B, ii) the rates of bimolecular condensation reactions between
A-A, B-B and A-B, iii) the rate of catalyst deactivation by A, B and the reaction
intermediates, iv) the amount of the produced hydrogen from the easier-to-gasify
compound and v) the initial feed to catalyst ratio.
Page 152
132
Figure 5.4 SCWG of lignocellulosic feeds using Raney nickel catalyst. 380 oC, 2
wt% feed, 5, 15, 30 and 60min (bars from left to right respectively), 120 mg Ni.
Figure 5.5 SCWG of lignocellulosic feeds using Ni/α-Al2O3. 380 oC, 2 wt% feed,
5, 15, 30 and 60min (bars from left to right respectively), 120 mg Ni.
0
10
20
30
40
50
60
70
80
90
Glucose Fructose Cellulose Pulp Xylan Lignin Bark
Yie
ld [
mm
ol/
g f
eed
]CO2
CH4
H2
0
10
20
30
40
50
60
70
80
90
Glucose Cellulose Xylan Lignin Bark
Yie
ld [
mm
ol/
g f
eed
]
CO2
CH4
H2
Page 153
133
Figure 5.6 SCWG of lignocellulosic feeds using Ni/Hydrotalcite. 380 oC, 2 wt%
feed, 5, 15, 30 and 60min (bars from left to right respectively), 120 mg Ni.
5.3.4. Ruthenium-Catalyzed SCWG
Ruthenium has been reported to be quite active for reactions involved in SCWG [6].
Figures 5.7 and 5.8 depict the gas yields obtained from the catalytic SCWG of
lignocellulosic materials using Ru/C and Ru/γ-Al2O3 catalysts, respectively. After 60min,
Ru/γ-Al2O3 resulted in a total yield of about 45-60 mmol/g for glucose, fructose,
cellulose, xylan and pulp, whereas Ru/C resulted in a total yield of about 40-55 mmol/g
for the SCWG of the same compounds. Furthermore, it is demonstrated that even at low
catalyst loadings, ruthenium was highly active for the hydrogenation of CO2 and CO, and
consequently, resulted in poor hydrogen selectivity. Similar to nickel catalysts, alkali
lignin had the lowest total gasification yield likely due to catalyst poisoning and/or
condensed chemical structure of lignin. Contrary to nickel-catalyzed reactions, use of
ruthenium as catalyst resulted in a lower gas yield for gasification of bark (~ 40mmol/g)
0
10
20
30
40
50
60
70
80
90
Glucose Cellulose Xylan Lignin Bark
Yie
ld [m
mo
l/g
fee
d]
CO2
CH4
H2
Page 154
134
compared to cellulose and glucose (~ 50-60mmol/g). However, the gas yields obtained
from bark were still higher than the expected values based on the rule of mixtures
between the carbohydrates and lignin. The difference in the gasification yield of bark
may be due to the difference in the pore structure of catalysts. The pore size of nickel
catalysts used in this study is in the order of tens of nanometers while activated carbon
and γ-Al2O3 are known to have a smaller pore structure. Therefore, the rate of
gasification of larger molecules (e.g. lignin) generated by the hydrothermal degradation
of birchwood bark could be lowered due to the reduced diffusion rate of these molecules
in the smaller pore structure of Ru catalysts, reducing the total yield.
Figure 5.7 SCWG of lignocellulosic feeds using Ru/C. 380 oC, 2 wt% feed, 5, 15,
30 and 60 min (bars from left to right respectively), 6 mg Ru.
0
10
20
30
40
50
60
70
Glucose Fructose Cellulose Pulp Xylan Lignin Bark
Yie
ld [
mm
ol/
g f
eed
]
CO2
CH4
H2
Page 155
135
Figure 5.8 SCWG of lignocellulosic feeds using Ru/γ-Al2O3. 380 oC, 2 wt% feed,
5, 15, 30 and 60min (bars from left to right respectively), 6 mg Ru.
5.4 Concluding Remarks
In this paper, results of the supercritical water gasification of several lignocellulosic
materials using Ni/α-Al2O3, Ni/hydrotalcite, Raney nickel, Ru/C and Ru/γ-Al2O3
catalysts have been presented. It was found that for a given catalyst, gasification of
carbohydrates (i.e. glucose, fructose, cellulose, xylan and pulp) resulted in comparable
gas yields (± 10 %) after 60min reaction time. However at short reaction times (e.g.,
5min) and in the presence of Ni-based catalysts, cellulose had consistently higher carbon
conversion than glucose and xylan. Although lignin was substantially harder to gasify
than cellulose, gasification yield of bark, which has high lignin content, was comparable
to that of cellulose. Utilization of Raney nickel, Ru/C and Ru/γ-Al2O3 resulted in high
methane yields. In spite of the low surface area of the laboratory-made Ni/α-Al2O3 and
Ni/hydrotalcite catalysts, they exhibited high activities and superior hydrogen
0
10
20
30
40
50
60
70
Glucose Fructose Cellulose Pulp Xylan Lignin Bark
Yie
ld [
mm
ol/
g f
eed
]CO2
CH4
H2
Page 156
136
selectivities compared to those of the other catalysts tested in this work. More
specifically, the amount of alkane formed upon supercritical water gasification of bark in
the presence of Ni/α-Al2O3 and Ni/hydrotalcite catalysts was found to be very small (i.e.
< 1.5 mmol/g after 60 minutes). Additional work is ongoing to examine the stability and
possible deactivation of these catalysts under SCW conditions.
Acknowledgements
Financial support from NSERC CGS-D and NSERC-DG is gratefully acknowledged.
Also, the authors would like to thank Professor Ning Yan from University of Toronto for
providing bark samples, Professor C. Q. Jia for providing access to the pore analysis
equipment and Mr. Elie Afif for his help with the experiments.
5.5 References
[1] P. Azadi, J. Otomo, H. Hatano, Y. Oshima, R. Farnood, Int J Hydrogen Energy. 35
(2010) 3406-3414.
[2] D.C. Elliott, T.R. Hart, G.G. Neuenschwander, Ind Eng Chem. 45 (2006) 3776-3781.
[3] D.C. Elliott, L.J. Sealock, E.G. Baker, Ind Eng Chem. 32 (1993) 1542-1548.
[4] P. Azadi, K.M. Syed, R. Farnood, Appl Catal A. 358 (2009) 65–72.
[5] D.C. Elliott, Bioprod Bioref. 2 (2008) 254–265.
[6] P. Azadi, R. Farnood, Int J Hydrogen Energy. 36 (2011) 9529-9541.
[7] Y. Matsumura, T. Minowa, B. Potic, SRA Kersten, W. Prins, W.P.M. Van Swaaij, B.
Van de Beld, D.C. Elliott, G.G Neuenschwander, A. Kruse, M.J. Antal, Biomass
Page 157
137
Bioenergy. 29 (2005) 269–292.
[8] X. Xu X, M.J. Antal, Environ. Prog. 17 (1998) 215-220.
[9] T. Yamamura, T. Mori, K. C. Park, Y. Fujii, H. Tomiyasu, J. of Supercrit Fluids. 51
(2009) 43–49.
[10] E. Afif, P. Azadi, R. Farnood,. Appl Catal B. 105 (2011) 136-143.
[11] L. Zhang, C. Xu, P. Champagne, Bioresource Tech. 101 (2010) 2713–2721.
[12] T. Yanagida, T. Minowa, Y. Shimizu, Y. Matsumura, Y. Noda, Bioresour Technol.
100 (2009) 4884–4886.
[13] L. J. Sealock, D.C. Elliott, E.G. Baker, A.G. Fassbender, Laura J. Silva, Ind. Eng.
Chem. Res. 35 (1996) 4111-4118.
[14] S. Stucki, F. Vogel, C. Ludwig, A.G. Haiducb, M. Brandenberger, Energy Environ.
Sci. 2 (2009) 535–541.
[15] A.G. Chakinala, D.W.F. Brilman, W.P.M. Van Swaaij, S.R.A. Kersten, Ind Eng
Chem. 49 (2010) 1113-1122.
[16] T. Minowa, Z. Fang, T. Ogi, G. Varhegyi, J Chem Eng Jpn. 31 (1998) 131-134.
[17] M. Osada, T. Sato, M. Watanabe, T. Adschiri, K. Arai, Energ Fuel. 18 (2004) 327-
333
[18] M. Osada, N. Hiyoshi, O. Sato, K. Arai, M. Shirai, Energ Fuel. 21 (2007) 1400-1405
[19] T. Yoshida, Y. Oshima, Y. Matsumura, Biomass Bioenergy. 26 (2004) 71-78.
[20] T. Yoshida, Y. Matsumura, Ind Eng Chem. 40 (2001) 5469-5474.
[21] G.W. Huber, J.W. Shabaker, J.A. Dumesic, Science. 300 (2003) 2075-2077.
[22] J.W. Shabaker, D.A. Simonetti, R.D. Cortright, J.A. Dumesic, J Catal. 231 (2005)
67–76.
Page 158
138
[23] J.W. Shabaker, G.W. Huber, J.A. Dumesic, J Catal. 222 (2004) 180–191.
[24] J.W. Shabaker, J.A. Dumesic, Ind Eng Chem. 43 (2004) 3105-3112.
[25] P. Azadi, R. Farnood, C. Vuillardot, J Supercrit Fluids. 55 (2011) 1038-1045.
[26] T. Miyazawa, S. Koso, K. Kunimori, K. Tomishige, Appl Catal A. 318 (2007) 244-
251
[27] K. M. Eblagon, K. Tam, K. M. K. Yu, S. Zhao, X. Gong, H. He, L. Ye, L. Wang, A.
J. Ramirez-Cuesta, S. C. Tsang, J. Phys Chem. C. 114 (2010) 9720-9730
[28] R. D. Cortright, R. R. Davda & J. A. Dumesic, Nature 418 (2002) 964-967.
[29] Bowyer, Shmulsky, Haygreen, Forest products and wood science, an introduction,
fifth edition, Wiley-Blackwell, Iowa, 2007.
[30] M. H. Waldner, F. Vogel, Ind. Eng. Chem. Res. 44 (2005) 4543-4551
6- Summary and Future work
6.1 Comparison of Nickel Catalysts
The proposed reaction pathway for metal-catalyzed supercritical water gasification of
biomass is depicted in Figure 6.1. Based on this figure, methane is a secondary product
which is mainly formed over the metal catalyst through hydrogenation of CO2 and CO.
Therefore, the methane yield should be directly related to the partial pressure of the
primary products (i.e. H2, CO2 and CO) as well as activity of the catalyst for dissociating
hydrogen and cleaving the C-O bonds which will in turn lead to the formation of
Page 159
139
methane. In order to compare the selectivity of the catalysts, the hydrogen to methane
ratio at a specific carbon conversion should be considered because the carbon conversion
directly represents the partial pressure of the carbon-containing gases (Figure 6.2).
According to this figure, the hydrogen selectivity decreased at higher carbon conversions
as it was expected from the reaction pathway. Except for the higher nickel loading on the
alpha-alumina support (Figure 6.3), the selectivity-conversion data obtained from all
other catalysts followed a certain trend, implying that it the change in the activity of the
catalysts was mainly due to the change in the number of catalytic active sites.
Figure 6.1 The reaction pathway for the catalytic SCWG of biomass.
Ni
CO2 + H2
H2, CO2, CO Catalytic decomposition
Feed
Intermediates
Condensation
reactions Char
CO2 + 4 H2 CH4 + 2 H2O
CO + H2O Ni
Page 160
140
Figure 6.2 Hydrogen selectivity vs. carbon conversion for nickel-catalyzed
SCWG of glucose. Data: time dependent from chapter 5, non alumina, promoters,
gamma alumina and activation from chapter 3, CNT from chapter 4.
0
1
2
3
4
5
50 60 70 80 90 100
H2
sele
ctiv
ity
CGR %
gamma-alumina alpha-alumina Promoters
CNT non alumina Activation
time dependent Raney
Page 161
141
Figure 6.3 Hydrogen selectivity vs. carbon conversion for Ni/α-Al2O3 catalyzed
SCWG of glucose with different metal loadings (g Ni/g support). The dashed line
represents the trend in Figure 6.2.
Changing the nickel loading from 5% to 20% increased the hydrogen selectivity from
about 2 to 4. Further experiments with different nickel to support ratio should be
conducted to give a better understanding of the changes in the structure these catalysts by
changing the nickel to support ratio, which in turn resulted in a different selectivity-
conversion trend from the majority of other nickel catalysts.
6.2 Comparison of Active Metals
It was observed that the hydrogen selectivity obtained from ruthenium-catalyzed SCWG
slightly also slightly decreased with carbon conversion (Figure 6.4). Comparison of
selectivity-conversion plot obtained from ruthenium-catalyzed SCWG with that of
nickel-catalyzed results (dashed line in Figure 6.4) revealed that ruthenium was more
0
1
2
3
4
5
50 60 70 80 90 100
H2
sele
ctiv
ity
CGR %
Nickel loading
Page 162
142
active for the methanation reactions and therefore, it resulted in lower hydrogen
selectivity.
Figure 6.4 Hydrogen selectivity vs. carbon conversion for Ruthenium-catalyzed
SCWG of glucose. The dashed line represents the trend in Figure 6.2.
6.3 Concluding Remarks
Considering the objectives of this study as given in Chapter 1, we developed a cheap
catalyst based on nickel and alumina which showed high catalytic activity and hydrogen
selectivity for supercritical water gasification of carbohydrates. Also, we identified
Ni/CNT as an active catalyst for SCWG reactions. Finally, using the promising catalysts,
the SCWG of various lignocellulosic feedstocks were investigated. The conclusions of
this work can be summarized as follows.
0
1
2
3
4
5
50 60 70 80 90 100
H2
sele
ctiv
ity
CGR %
Ruthenium
Page 163
143
Among the support materials considered as a support for the nickel-catalyzed SCWG of
glucose, α-Al2O3, carbon nanotube (CNT), and MgO resulted in the highest carbon
conversions, while SiO2, Y2O3, hydrotalcite, yttria-stabilized zirconia (YSZ), and TiO2
showed modest activities and other catalysts including zeolites showed negligible
activities. γ-Al2O3 supports resulted in a wide range of catalytic activities from almost
inactive to highly active. No clear relationship was found between the catalyst surface
area (and particle size) and the catalytic activity. The hydrogen selectivity significantly
increased by increasing the nickel loading on α-Al2O3 catalyst. The maximum hydrogen
selectivity was obtained using a 20% Ni/α-Al2O3 at 380 oC. Addition of alkali promoters
enhanced the carbon conversion whereas addition of tin decreased the catalyst activity. In
summary, we developed a cheap catalyst based on nickel and alumina with acceptable
catalytic activity and tunable hydrogen selectivity. Furthermore, different aspects of the
formation of nickel nanoparticles on multi-walled carbon nanotubes are discussed. It has
been shown that functionalization of MWCNT in a concentrated oxidizing agent for
prolonged times results in a better dispersion of the nanoparticles. Also, it is found that
nickel crystal size increases by increasing nickel loading. Non-polar solvents such as
acetone are found to be more appropriate for formation of well-dispersed nickel
nanoparticles. Calcination temperature does not change the crystallite size of nickel
nanoparticles in temperature range of 280 oC to 450
oC. Based on TPR test, the nickel
oxide deposited on carbon nanotube was reducible at temperatures between 350 oC to 450
oC. Finally, results of catalytic gasification of several lignocellulosic materials have been
presented. It was found that for a given catalyst, gasification of glucose, fructose,
cellulose, xylan and pulp resulted in comparable yields (± 10 %) after 60 minutes
Page 164
144
reaction time. Although alkali lignin was substantially harder to gasify than cellulose,
gasification yield of bark which had high lignin content was comparable to that of
cellulose. Ruthenium catalysts showed high catalytic activity. However, utilization of
Ru/C and Ru/γ-Al2O3 resulted in a relatively high methane concentration in the
gasification products and as a result the hydrogen selectivity was poor. In spite of their
low surface area, the laboratory-made Ni/α-Al2O3 catalyst exhibited good activities and
superior hydrogen selectivity compared to those of commercial catalysts tested in this
work. More specifically, the amount of alkane that was formed by gasification of bark in
that presence of Ni/α-Al2O3 and Ni/hydrotalcite was very small (i.e. < 1.5 mmol/g after
60 minutes).
6.4 Recommendation for Future work
The recommendations for the future work are given below.
Studying the stability of Ni/α-Al2O3 and Ni/MWCNT catalysts in flow reactors.
Studying the deactivation mechanism and regeneration of supported nickel
catalysts for SCWG using continuous reactors.
Studying the effects of pressure (or water density) on the selectivity of the
promising catalysts using a flow reactor.
Synthesis of bimetallic catalysts in order to improve the catalytic activity and
hydrogen selectivity of nickel and ruthenium catalysts.
Performing a more detailed characterization of Ni/MWCNT in order to better
understand the structural/performance relationship.
Page 165
145
Conducting SCWG of different feedstocks using Ni/MWCNT catalyst.
Purging the batch reactor prior to the experiment to exclude the possible
homogeneous oxidation of the organic feed by air.
Studying the effects of hydrogen pressure on the gasification yield of lignin.
Appendix A: Complementary Literature Review
Kinetics of supercritical water decomposition of organics
As mentioned before, three applications have been proposed for reactions of organic
maters in supercritical water, namely: gasification, oxidation of hazardous substances and
material recovery.
Kinetics of supercritical water oxidation (SCWO) for several organic feeds has been
investigated by various researchers. However, due to utilization of an oxidizing agent
(such as H2O2), the rate constants obtained for SCWO reactions are not applicable to the
target of present work. In addition to this, majority of these studies reported the rate
constants based on the degradation of the feed rather than dealing with the end products
in the gas phase.
Many researchers studied material recovery and liquifaction of sugars in SCW.
Kabemaya et al [1] reported the values of rate constants for decomposition of glucose and
fructose. In the proposed reaction pathway, fructose is formed via isomerization of
glucose and both fructose and the remaining glucose may undergo other decomposition
reactions (Figure 2.1). According to this work and assuming that all reactions are first
Page 166
146
order with respect to the reactant, the following rate constants are obtained for
decomposition of glucose at 400bar:
Figure A.1 Proposed reaction pathway for decomposition of glucose [1].
Table A.1 Reactions rates of glucose decomposition [s-1
] with respect to figure
2.1
Temp. [C] kgf kg kf
300 0.35 0.15 1
350 1 1 3
400 6.9 8.9 21.4
They further studied the rates of glucose decomposition at 300-400oC and 250-400 bar in
a flow reactor with 0.02-2 seconds residence time [2]. In the course of their work, they
found that fructose, saccharinic acids, erythrose, glyceraldehyde, 1,6-anhydroglucose,
dihydroxyacetone, pyruvaldehyde, and 5-hydroxymethylfurfural are the products of
glucose decomposition. Furthermore, it was realized that pressure has no effect on the
decomposition rate of glucose in subcritical region while it has a negative impact on the
decomposition of glucose in supercritical condition. The following figure illustrates the
proposed reaction pathway for decomposition of glucose. The subsequent reaction rates
kf
Glucose Fructose
Other products
kgf
kg
Page 167
147
for each reaction were calculated at four different temperatures.
Figure A.2 More detailed reaction pathway of glucose [2]
Matsumura et al. [3] reported decomposition of glucose at 175-400oC and 250bar using a
flow reactor. In this study, the reaction rate and its order was determined based on
consumption of glucose and no further information on composition and concentration of
products are given. The result of this work is summarized in Table A.2.
Table A.2 Reaction rate and order for glucose decomposition in SWC [3].
Temp [oC] k [s
-1] n [-]
175 1.10*10-4
1.13
200 4.10*10-4
0.87
225 1.75*10-3
0.9
250 5.00*10-3
0.77
300 1.20*10-1
0.84
350 2.43*10-1
0.73
400 1.44 0.76
More recently, Qi et al. [4] conducted a series of experiments to identify the reaction
Glucose
Fructose 5-HMF
Acids Anhydroglucose
Erythrose
Glyceraldehyde
Page 168
148
rates of glucose in subcritical water (180-220oC, 100bar) using a batch reactor. The
following scheme summarizes the reaction pathway that has been suggested in this work.
Figure A.3 Decomposition of glucose in subcritical water proposed by Qi [4].
The values of activation energy’s and rate constants are given in Table A.3.
Table A.3 Corresponding activation energy and Arrhenius factor, A, for
reactions presented in figure 2.3 [4].
Reaction Activation energy [kJ/mol] A
1 108 5.06*109
2 135 4.3*1012
3 89 2.6*106
4 109 3.6*109
5 31 0.031
Kabemaya and his co-workers [5] also looked into decomposition and hydrolysis of
cellobiose in range of 300-400oC, 250-400bar and residence time of 0.04-2s. The
following reaction scheme was proposed for decomposition of cellobiose.
Glucose 5-HMF
Humic acid
1
2 4
3 Levulinic acid
Decomposition
products
5
Page 169
149
Figure A.4 Cellobiose hydrolysis and decomposition pathway proposed by [5].
In a series of papers Haghighat Khajavi et al. [6-8] investigated the decomposition of
monosaccharadies, sucrose and maltose in subcritical water (180-260oC, 100 bar) in a
flow reactor. Effects of pH, feed concentration and residence time on the reaction rates
were addressed.
Vostrikov et al [9] studied the kinetics of coal conversion in supercritical water medium
using a semi-batch reactor. The operating temperature and pressure and residence times
were 500-750oC, 300 bar and 60-720 s, respectively. The reported activation energy and
Arrhenius factor were 103kJ/mol and 1.3E3.1 (s-1
), respectively.
Sato et al. [10] investigated water-gas-shift reaction in supercritical water (380-400oC,
250-300bar and 0-300s residence time) by means of a flow reactor. The initial carbon
monoxide to water mole ratio was set at 0.03. According to this study, the rate constant
and activation energy of WGS reaction are found to be 10E3.09 and 1.16E5, respectively.
Kinetics of decomposition of microcrystalline cellulose have been determined by Sasaki
et al. [11] under T=290-400oC, 250 bar and t=0.02-13.1 s. In this study, it was proposed
that cellulose was first hydrolyzed into glucose, followed by subsequent glucose
decompositions. Later, Rogalinski et al. [12] reported the hydrolysis rate of cellulose and
Cellobiose
Glucose
Eruthrose
glycolaldehyde
glycosylerythrose
glycosylglycolaldehyde
Hydrolysis
Pyrolysis
Hydrolysis
Hydrolysis
Page 170
150
starch based on consumption of reactants as well as formation of glucose, followed by
decomposition of glucose. The operating conditions of this study were 230-310oC, 200-
250bar and with residence time of between5 and200s.
Figure A.5 Reaction pathway for decomposition of cellulose and starch in SCW
[12].
The corresponding reactions rates for the above reaction pathway are given in Table A.4.
Table A.4 Reaction rates [s-1
] corresponding to figure 2.5 [12].
Temp. [oC] 1 2 3 4 5 6
210 - 0.0006 - - - -
230 - - - - 1.3*10-3
5.2*10-3
250 0.0025 0.01 2*10-3
6*10-3
5.4*10-3
1.2*10-2
270 0.0214 0.0317 4*10-2
3*10-2
8.1*10-3
1.8*10-2
310 0.108 - 7.5*10-3
3.1*10-1
- -
Kinetics of glucose gasification:
Lee et al. [13] measured the reaction rates of glucose decomposition with respect to total
Cellulose Hydrolysis products 1
2 Starch Hydrolysis products
Glucose 6
Decomposition products
4 Cellulose Glucose 3
5 Starch
Page 171
151
amount of gas as well as liquid products (Figure 2.6). The operating condition that
considered in this work were 480-750oC, 280bar and t=10-50s.
Figure A.6 Decomposition of glucose in SCW according to [13].
The corresponding activation energies of reaction 1 and 2 are 67.6 and 71kJ/mol
respectively. Also, the reaction rate constants are found to be 10E3.09 and 10E2.95 s-1
.
Finally, Knezevic et al [14] reported the reaction rates of glucose gasification with
respect to total gas, water and acetone soluble compounds (WSS) and insoluble
compounds (WSIS). This work is based on about some of 600 experiments using quartz
capillary reactor. It is suggested that a portion of WSS materials is responsible for the
formation of WSIS, which will either remain in the liquid phase or it may further
decomposes into gas. Figure 2.7 illustrate the complex reaction pathway suggested in this
study, while the mass fraction of different components along with their corresponding
reaction rates at 300 & 350oC are tabulated in Table A.5.
Glucose Soluble
organics
1
2
Gas
Page 172
152
Figure A.7 Reaction pathways and product distribution of glucose gasification in
quartz capillaries [14]. a, b, c, d, e, and f, represent the mass fraction of each
product.
Table A.5 Reaction rates and product’s mass fraction based on figure 2.7 [14].
T 300oC 350
oC
a 0.1 0.12
b 0.4 0.33
c 0.07 0.12
d 0.13 0.13
e 0.3 0.3
f 0.35 0.35
ka [s-1
] 0.0042 0.108
kb [g-1
L s-1
] 0.000083 0.000083
kc [g-1
L s-1
] 0 0.0000033
kd [s-1
] 0.00025 0.00058
Glucose kg
n=1
a WSS-A gas ka, n=1
(1-f) WSIS-B
kd, n=1 f gas
d WSS-D
e water
kb, n=2 b WSS-B
c WSS-C kc, n=2
WSIS-
A
Page 173
153
References
[1] Bernard M. Kabyemela, Tadafumi Adschiri, Roberto M. Malaluan, and Kunio Arai,
Kinetics of Glucose Epimerization and Decomposition in Subcriticaland Supercritical
Water, Ind. Eng. Chem. Res. 1997, 36, 1552-1558
[2] Bernard M. Kabyemela,Tadafumi Adschiri, Roberto M. Malaluan, and Kunio Arai,
Glucose and Fructose Decomposition in Subcritical and Supercritical Water: Detailed
Reaction Pathway, Mechanisms, and Kinetics, Ind. Eng. Chem. Res. 1999, 38, 2888-2895
[3] Yukihiko Matsumura, Satoru Yanachi, and Takuya Yoshida, Glucose Decomposition
Kinetics in Water at 25 MPa in the Temperature Range of 448-673 K, Ind. Eng. Chem.
Res. 2006, 45, 1875-1879
[4] JING Qi and LÜ Xiuyang, Kinetics of Non-catalyzed Decomposition of Glucose in
High-temperature Liquid Water, Chinese Journal of Chemical Engineering, 2008, 16,
890-894
[5] B. M. Kabyemela, M. Takigawa, T. Adschiri, R. M. Malaluan, and K. Arai,
Mechanism and Kinetics of Cellobiose Decomposition in Sub- and Supercritical Water,
Ind. Eng. Chem. Res. 1998, 37, 357-361
[6] Shabnam Haghighat Khajavi, Yukitaka Kimura, Toshinobu Oomori, Ryuichi
Matsuno, Shuji Adachi, Degradation kinetics of monosaccharides in subcritical water,
Journal of Food Engineering 68 (2005) 309–313
[7] Shabnam Haghighat Khajavi, Yukitaka Kimura, Toshinobu Oomori, Ryuichi
Matsuno, Shuji Adachi, Kinetics on sucrose decomposition in subcritical water, LWT 38
(2005) 297–302
Page 174
154
[8] Shabnam Haghighat Khajavi, Yukitaka Kimura, Toshinobu Oomori, Ryuichi
Matsuno, Shuji Adachi, Decomposition kinetics of maltose in subcritical water, Biosci.
Biotechnol. Biochem. 68, 2004, 91-95
[9] Anatoli A. Vostrikov, Sergey A. Psarov, Dmitri Yu. Dubov, Oxana N. Fedyaeva, and
Mikhail Ya. Sokol, Kinetics of Coal Conversion in Supercritical Water, Energy & Fuels
2007, 21, 2840-2845
[10] Takafumi Sato, Shutaro Kurosawa, Richard L. Smith Jr., Tadafumi Adschiri, Kunio
Arai, Water gas shift reaction kinetics under noncatalytic conditions in supercritical
water, J. of Supercritical Fluids 29 (2004) 113–119
[11] Mitsuru Sasaki, Tadafumi Adschiri, Kunio Arai, Kinetics of Cellulose Conversion at
25 MPa in Sub- and Supercritical Water, AIChE Journal, 50, 2004, 192-202
[12] Rogalinski, T., Liu, K., Albrecht, T., Brunner, G., Hydrolysis kinetics of
biopolymers in subcritical water, Journal of Supercritical Fluids, 46, 2008, Pages 335-341
[13] In-Gu Lee, Mi-Sun Kim, and Son-Ki Ihm, Gasification of Glucose in Supercritical
Water, Ind. Eng. Chem. Res. 2002, 41, 1182-1188
[14] Knežević, D., Van Swaaij, W.P.M., Kersten, S.R.A., Hydrothermal conversion of
biomass: I, glucose conversion in hot compressed water, Industrial and Engineering
Chemistry Research 48, 2009, Pages 4731-4743
Page 175
155
Appendix B: Equilibrium Calculations
All the thermodynamic equilibrium yields in this study were calculated using Aspen Plus
simulation software. Due to the low feed concentrations used in this study (e.i. 2 wt%), It
was assumed that the entire amount of carbon initially presented in the feed will present
in the gas phase and no carbon-containing compound will remain as liquid or solid once
the system reached equilibrium. Also, when comparing the experimental yields obtained
in this study, we assumed that the gas composition does not change by cooling down the
reaction products to the ambient temperature as cooling happens in extremely short time
periods and reaction rates dramatically decline at lower temperatures. The elemental
composition of solid feedstocks were used for defining the feed and the software was
allowed to find the composition at which a mixture of carbon dioxide, hydrogen,
methane, carbon monoxide and water had the lowest Gibbs Free Energy. Due to high
accuracy for the prediction of fluid properties near the critical point, the Peng-Robonson
equation of state was employed in the calculations.
P = [RT / (Vm - b)] - [(aα) / (Vm2 + 2bVm – b
2)] (B.1)
where:
a= (0.4572 R2 Tc
2) / Pc (B.2)
b= (0.07779 R Tc) / Pc (B.3)
α= (1+ κ (1 - Tr0.5
))2 (B.4)
κ = 0.3746 + 1.54226 ω – 0.2699 ω2 (B.5)
Page 176
156
Tr = T/Tc (B.6)


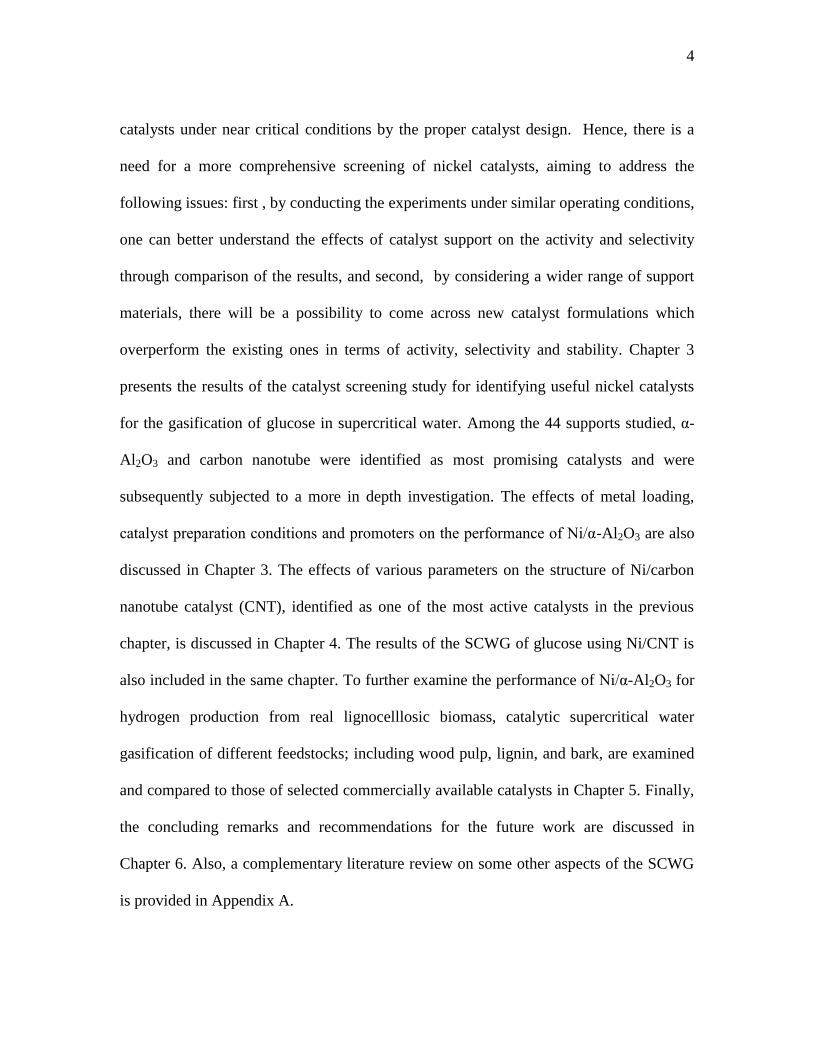


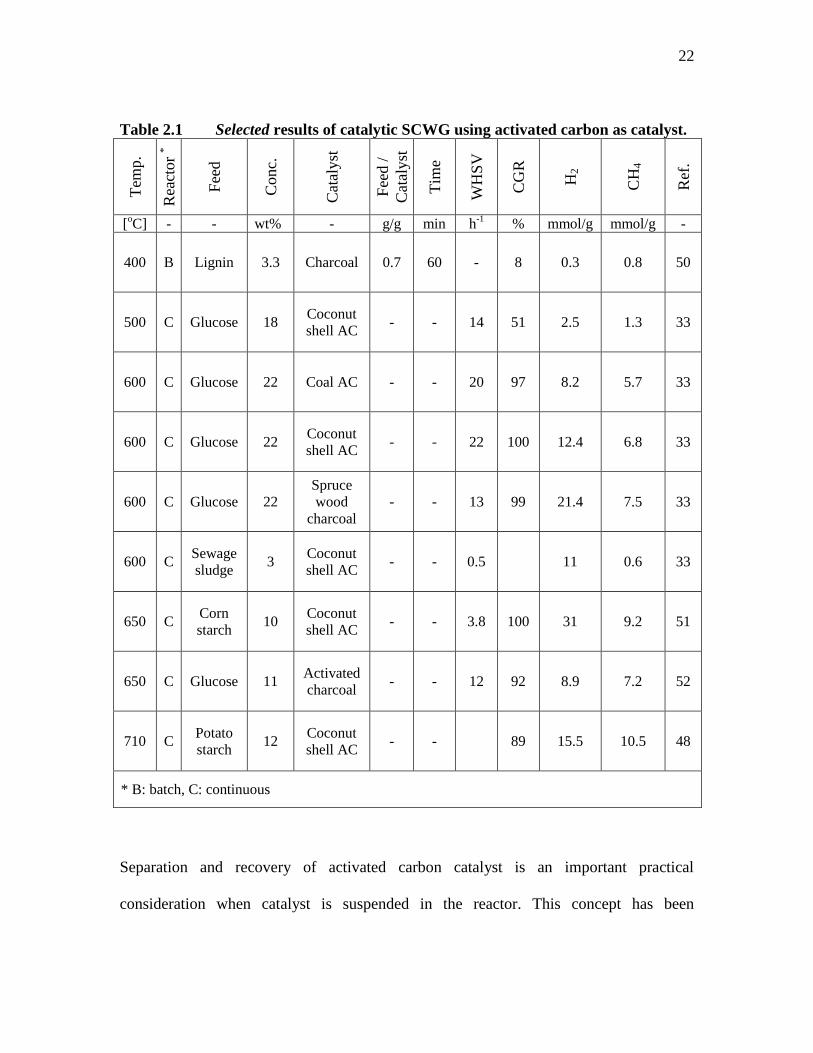


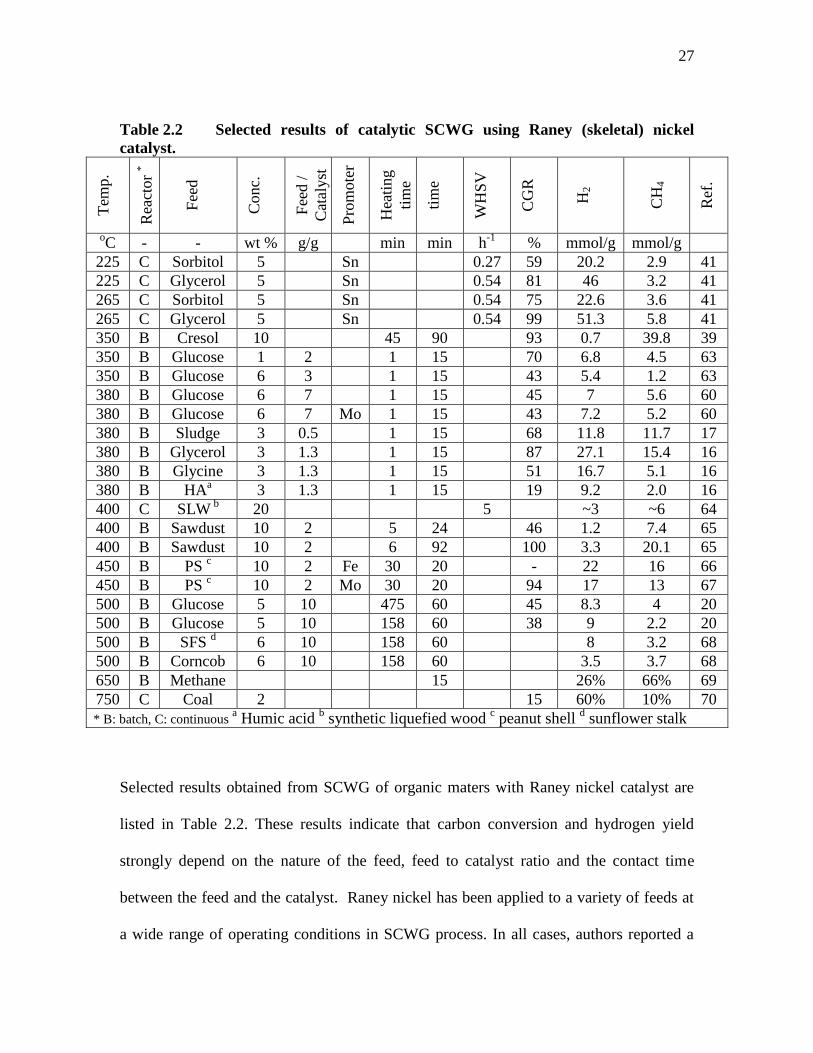


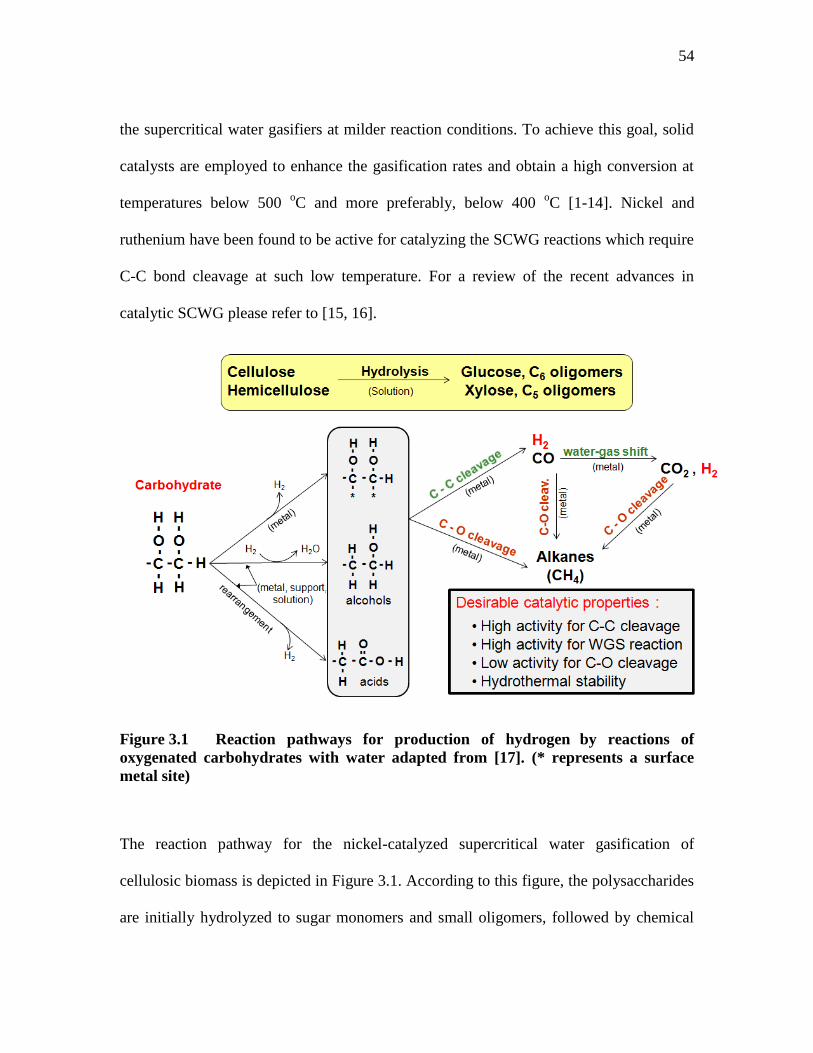


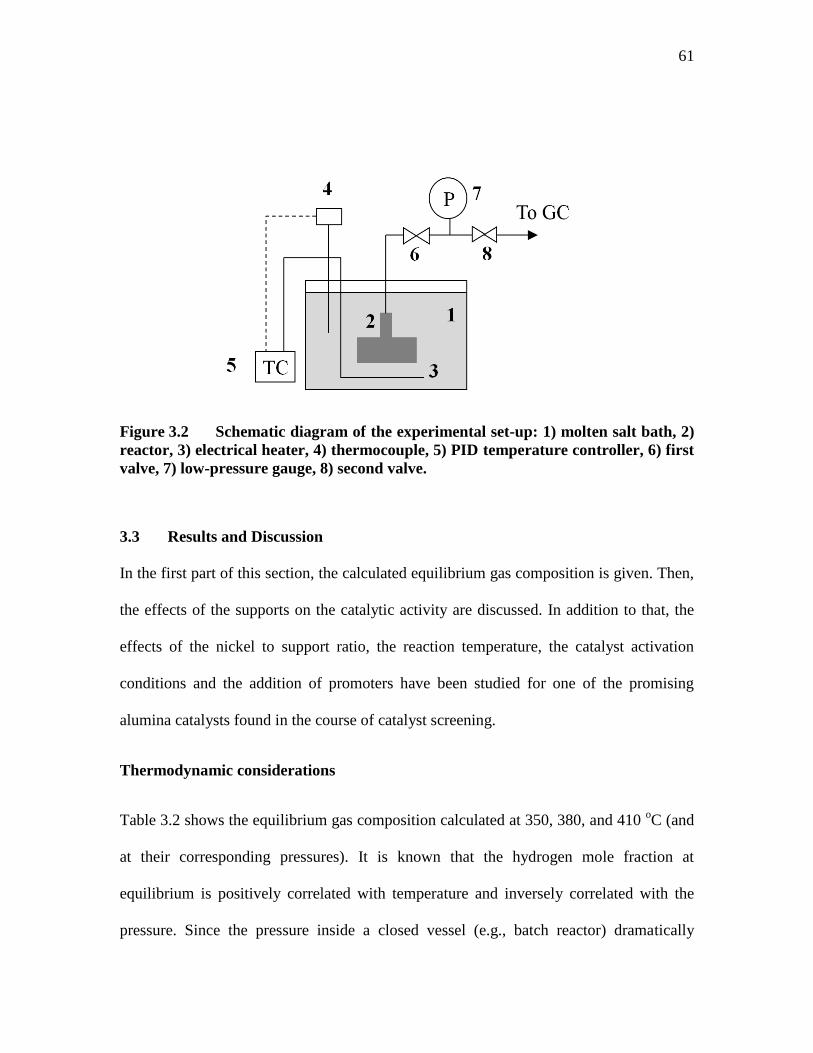
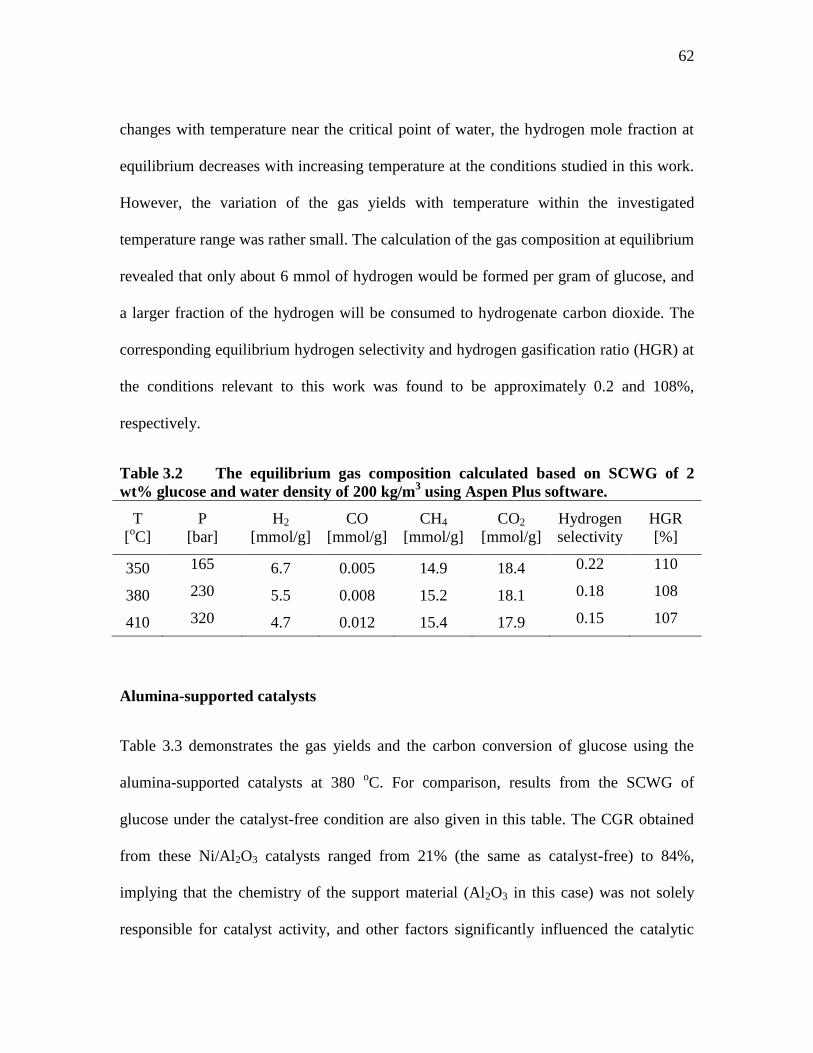


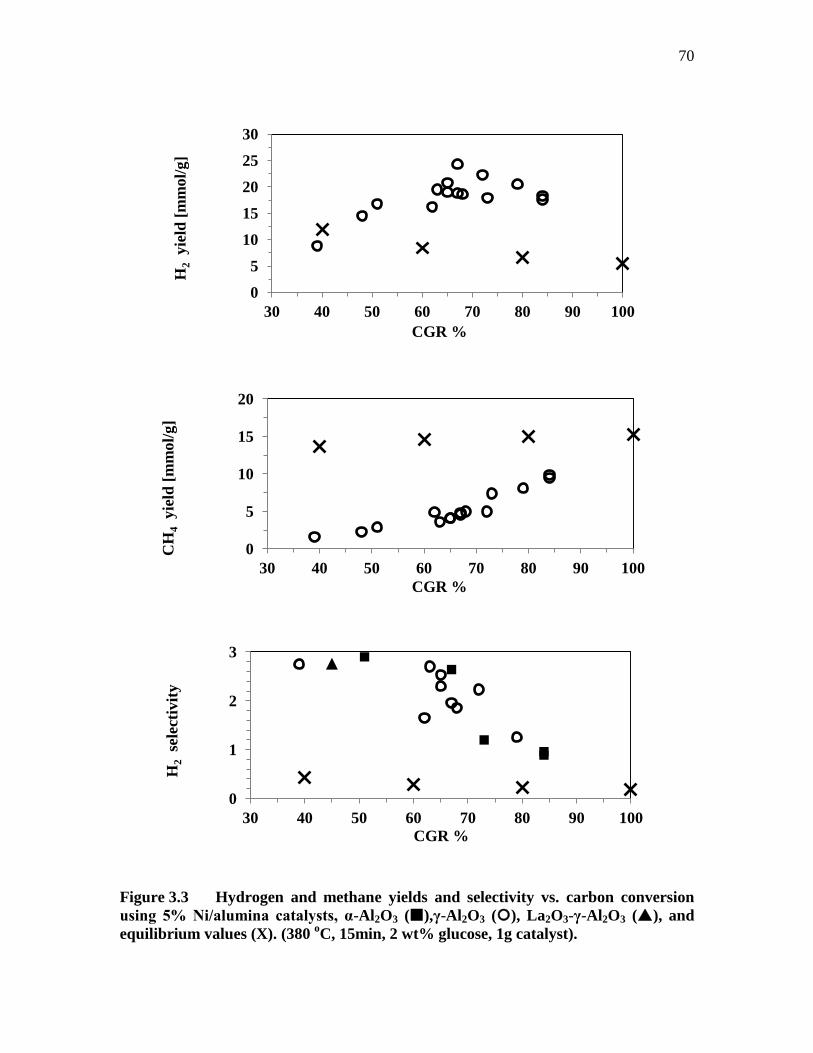


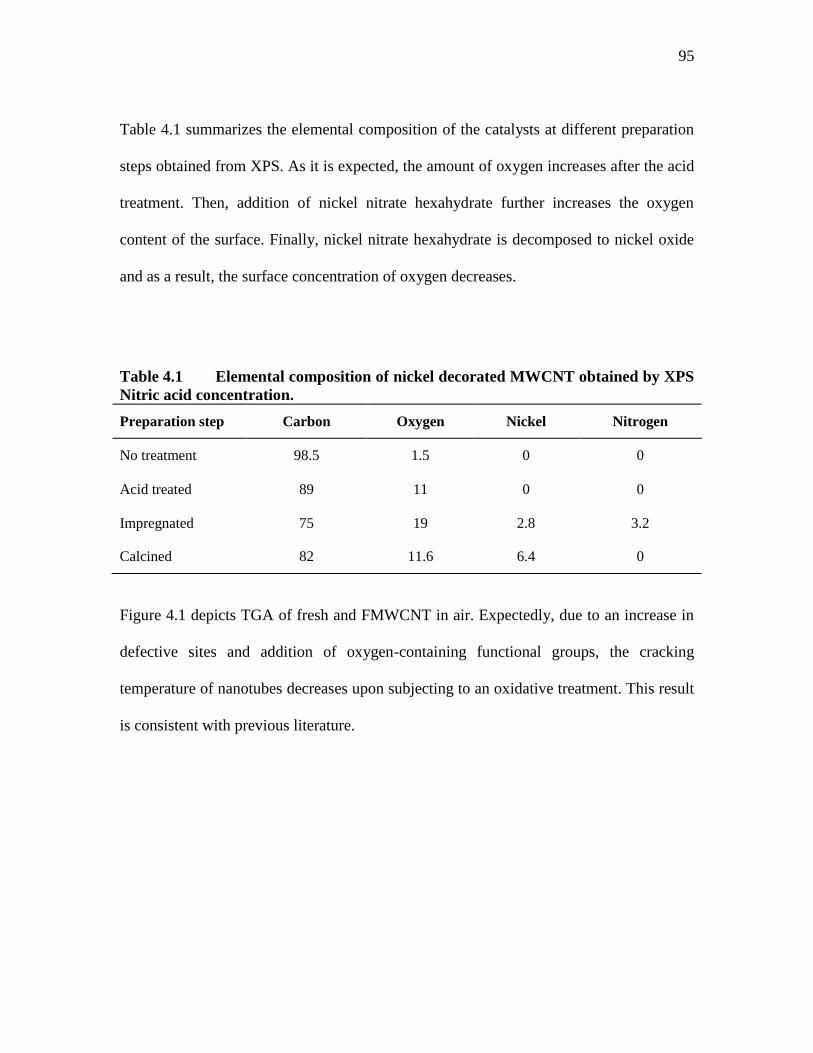


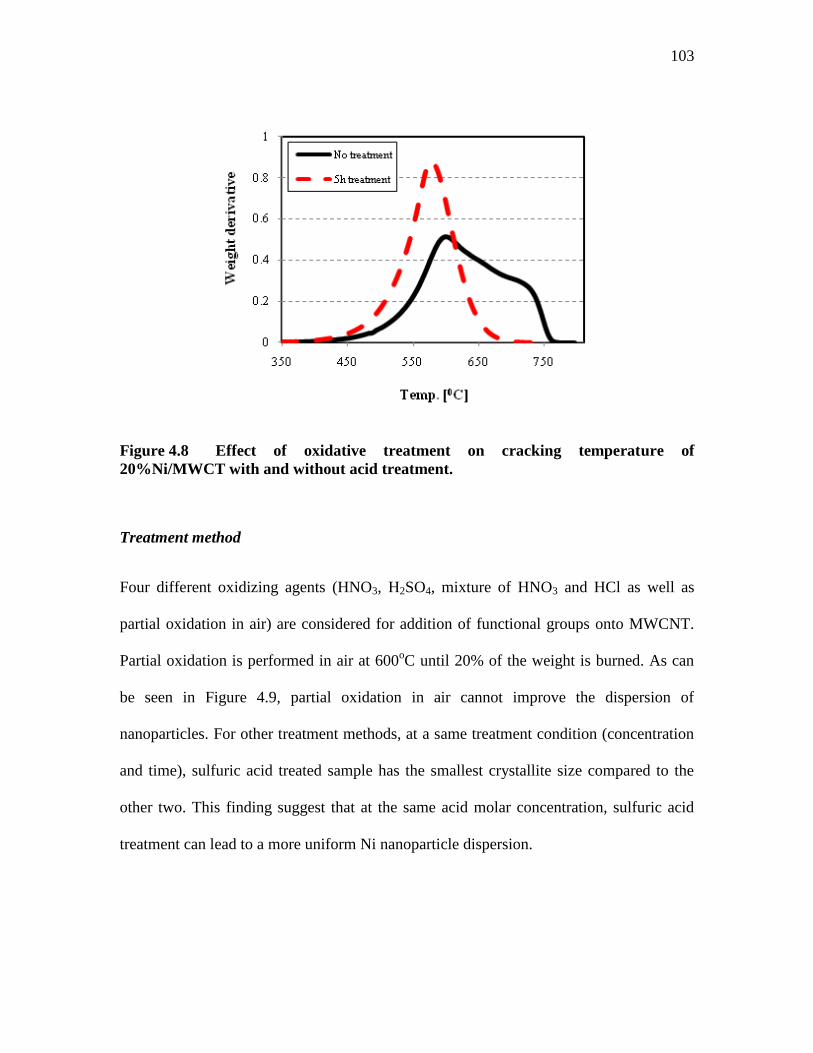


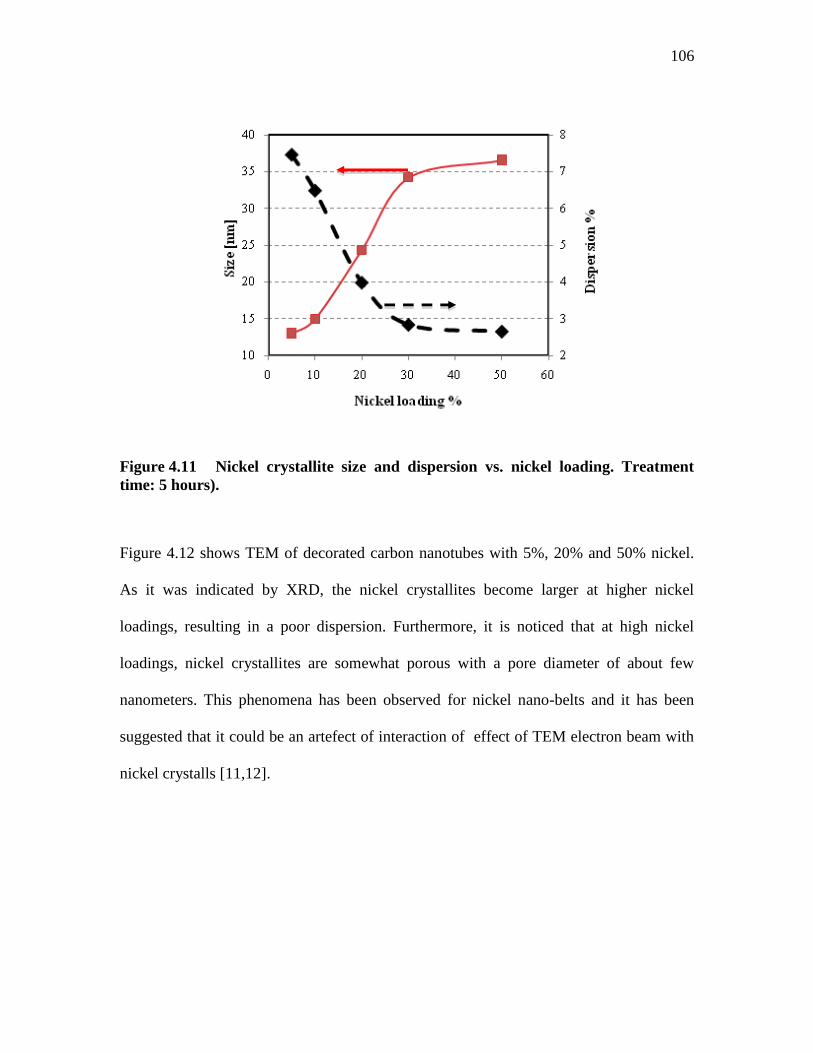


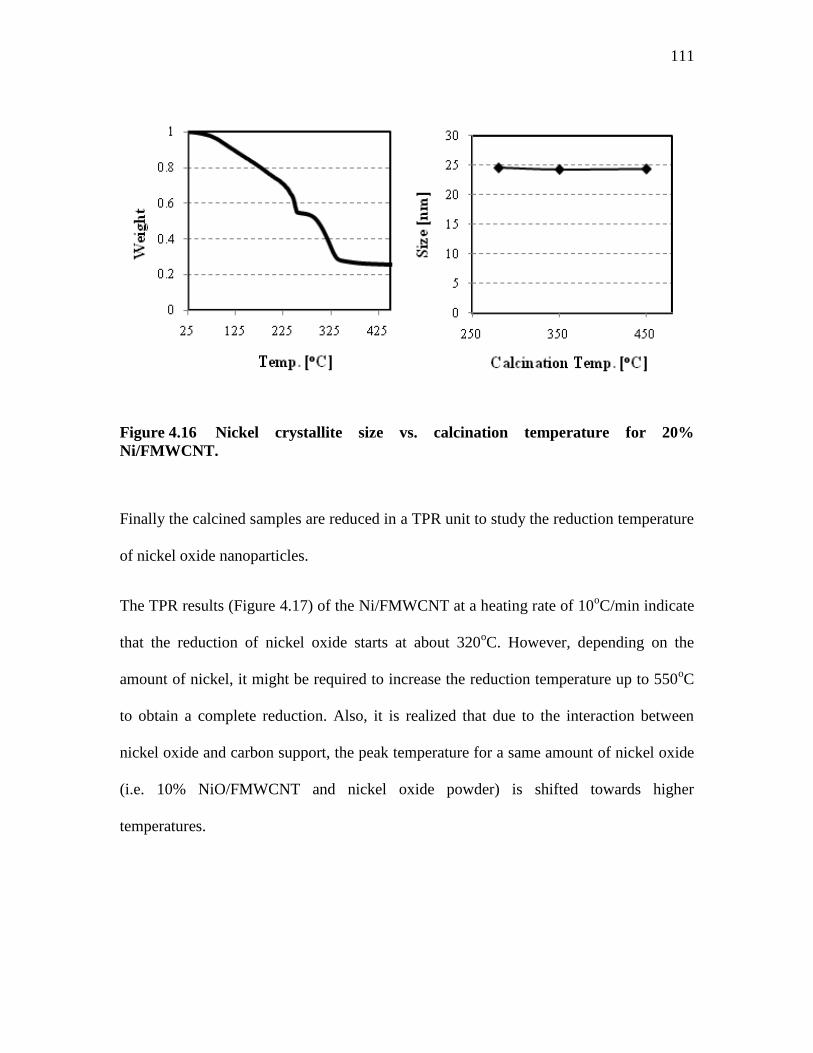


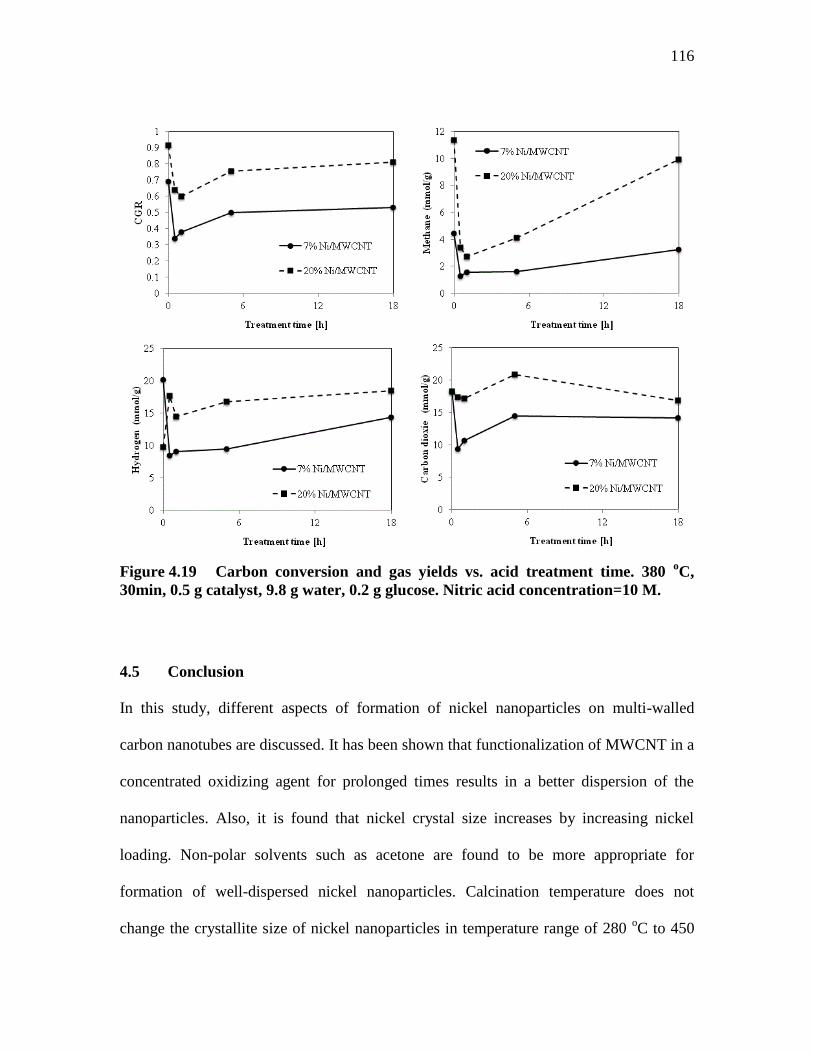


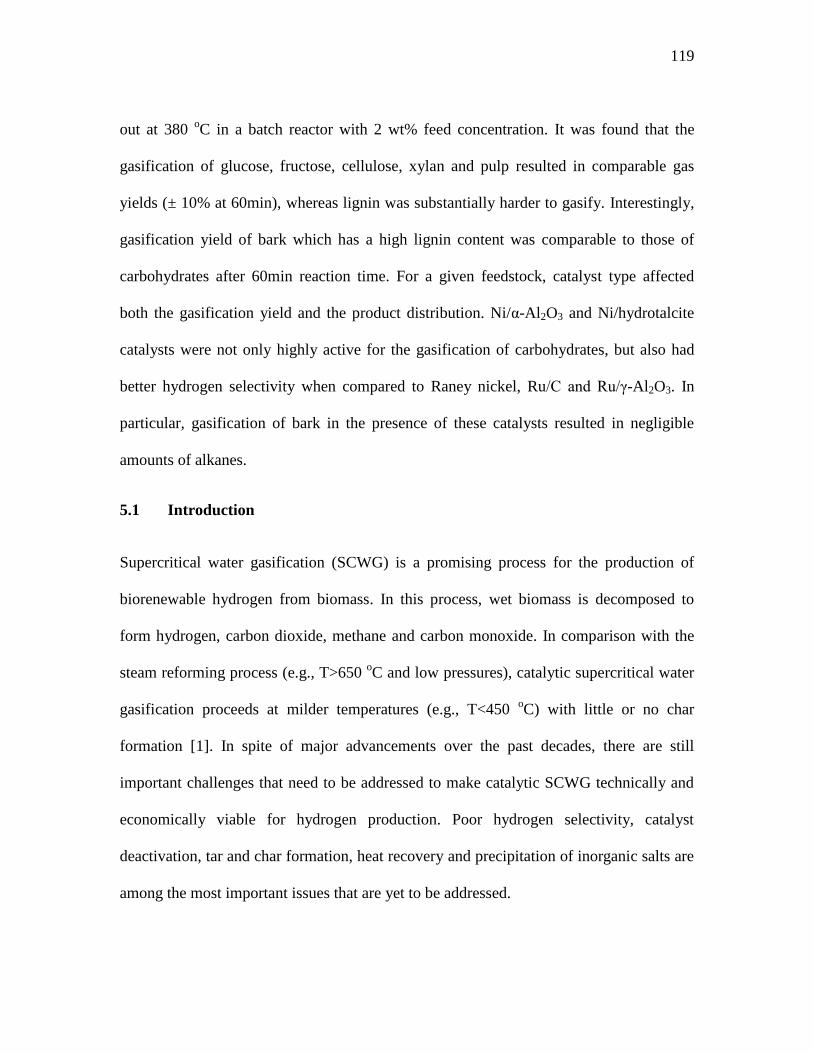
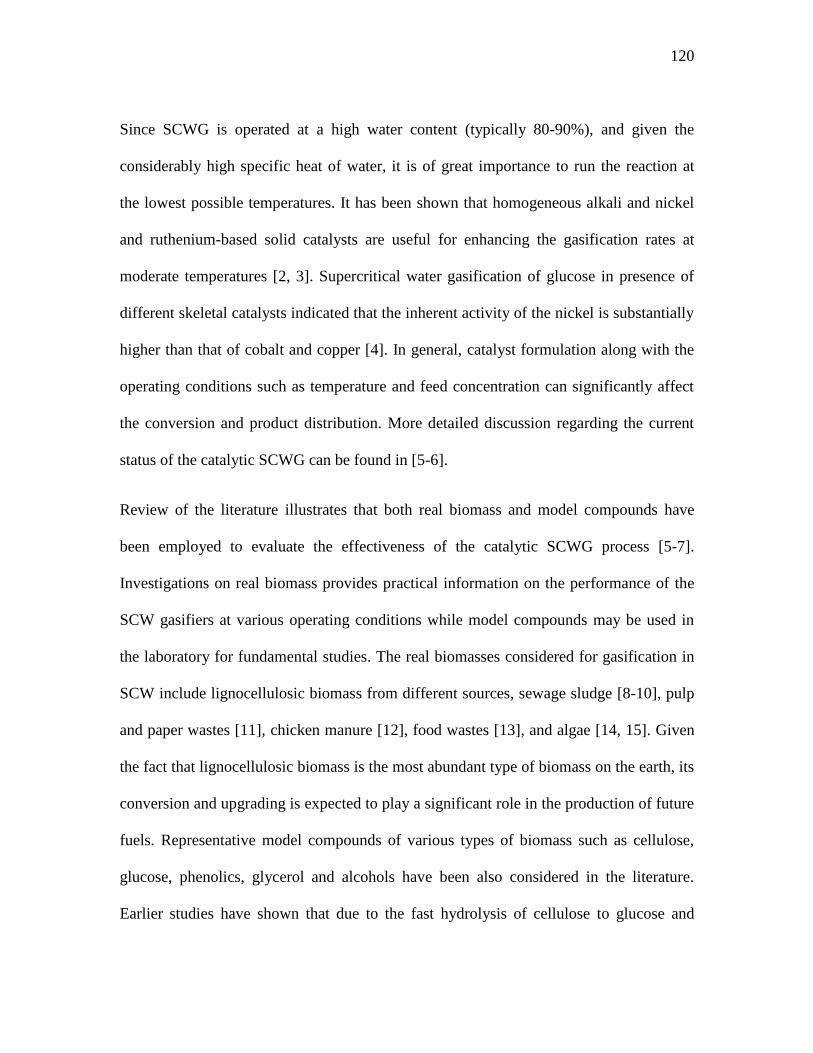
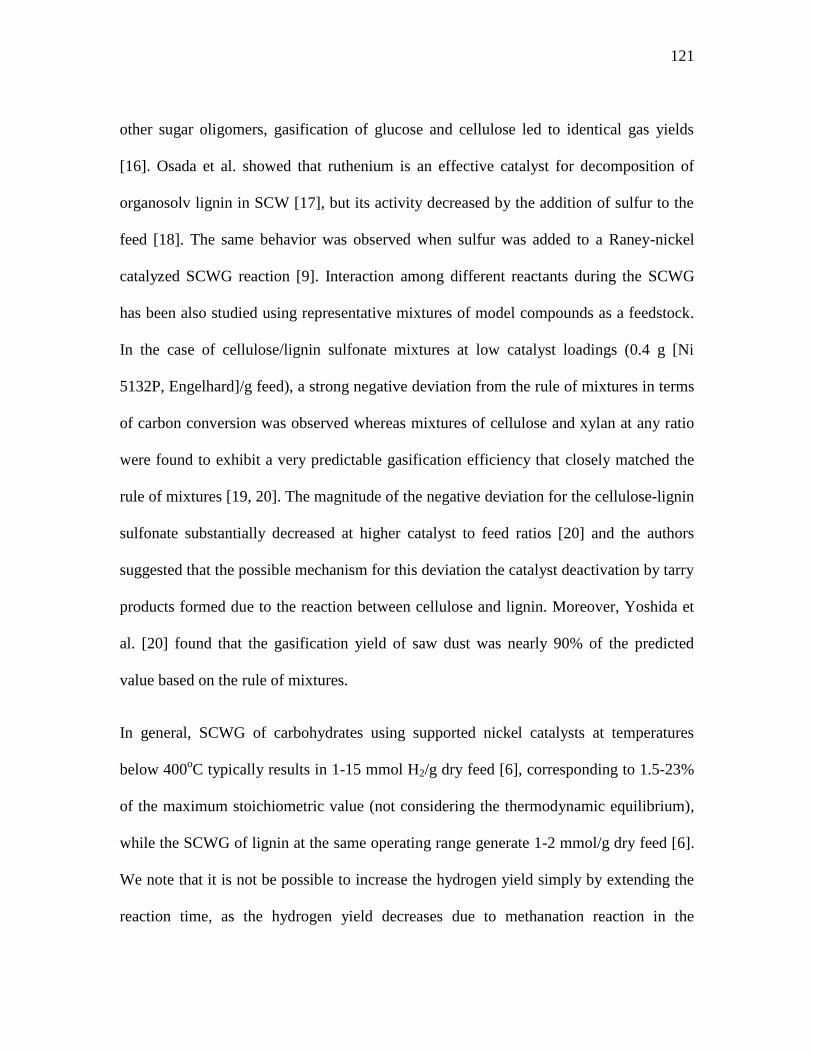

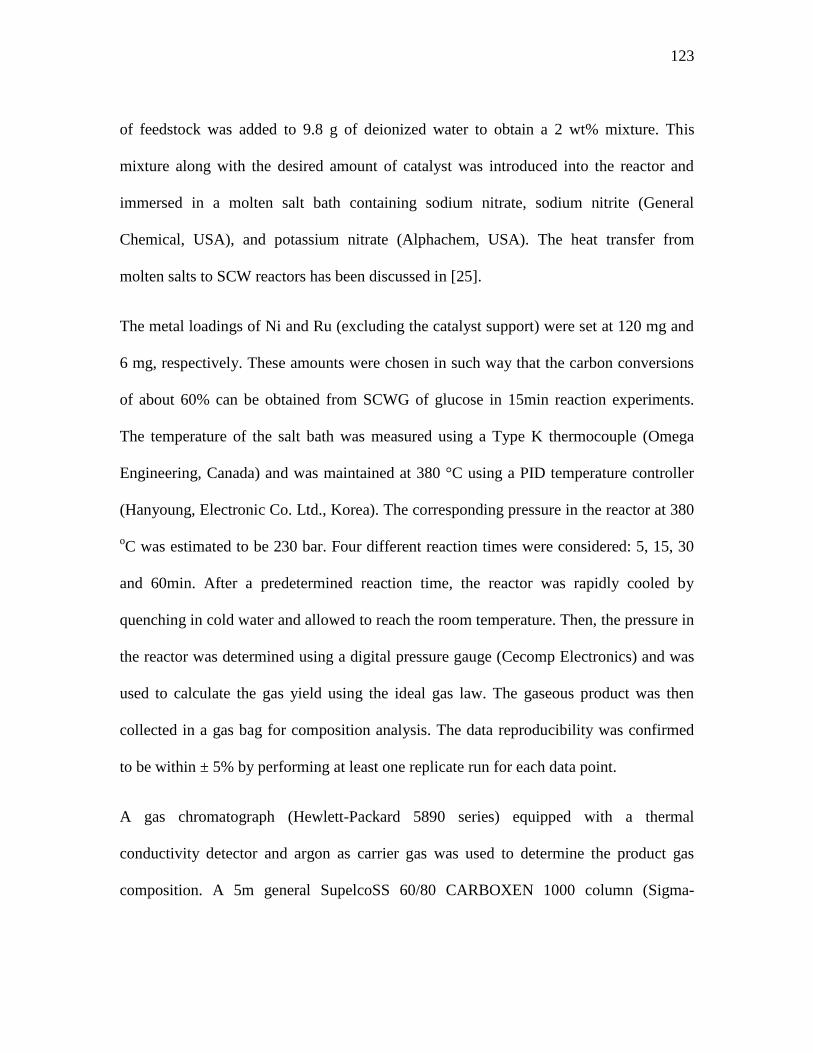


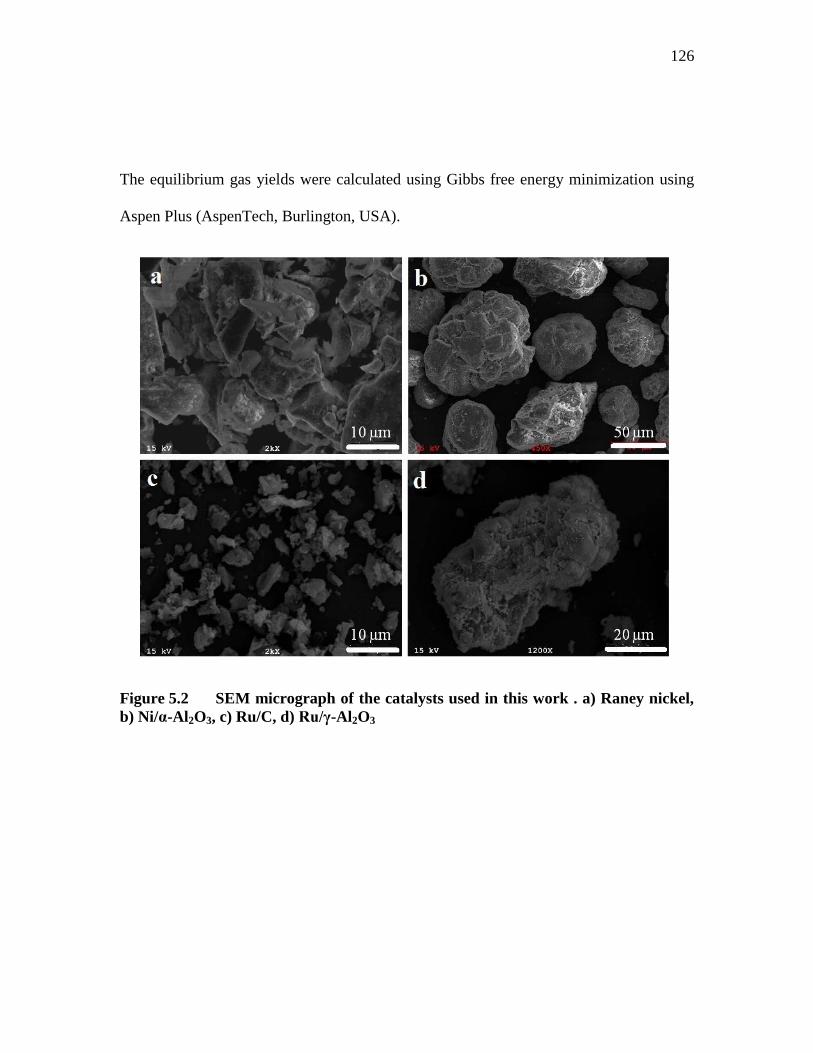


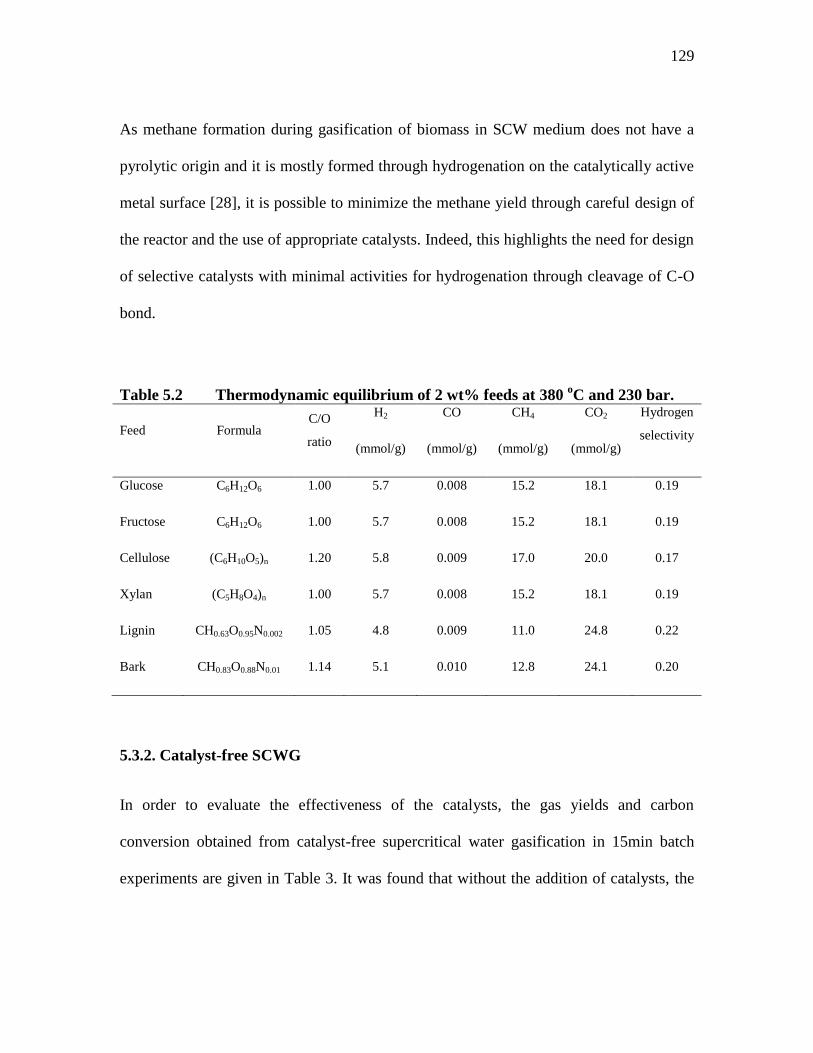


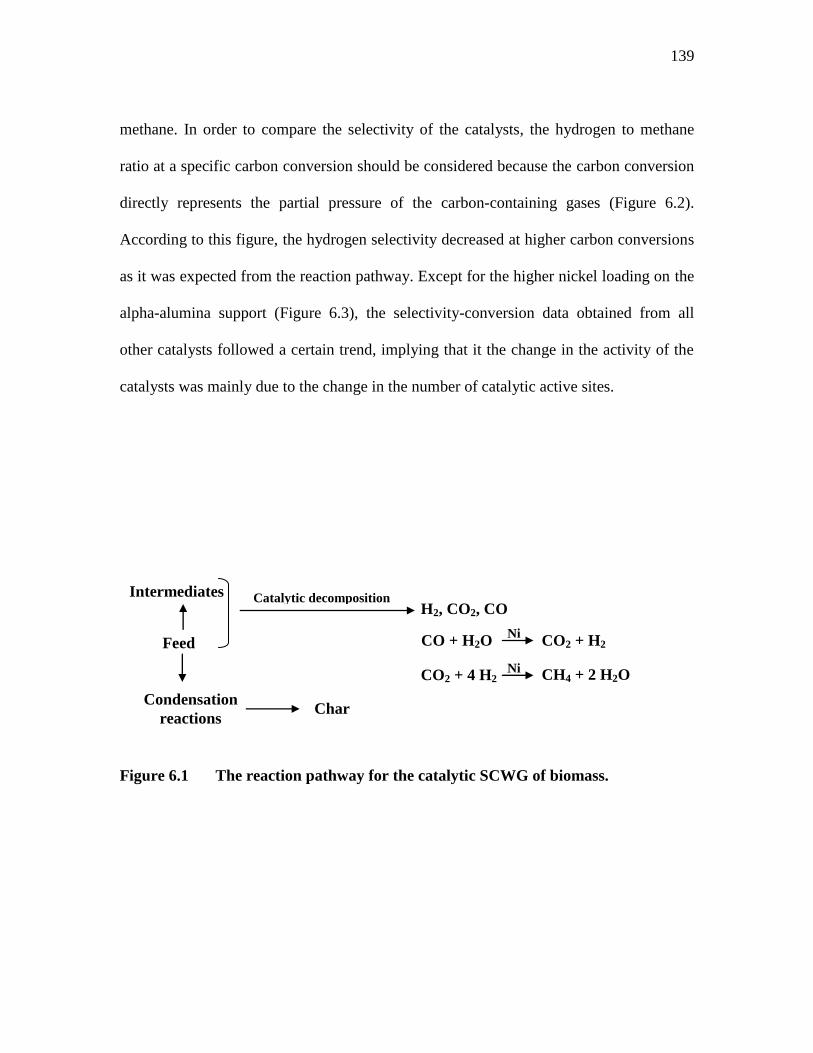


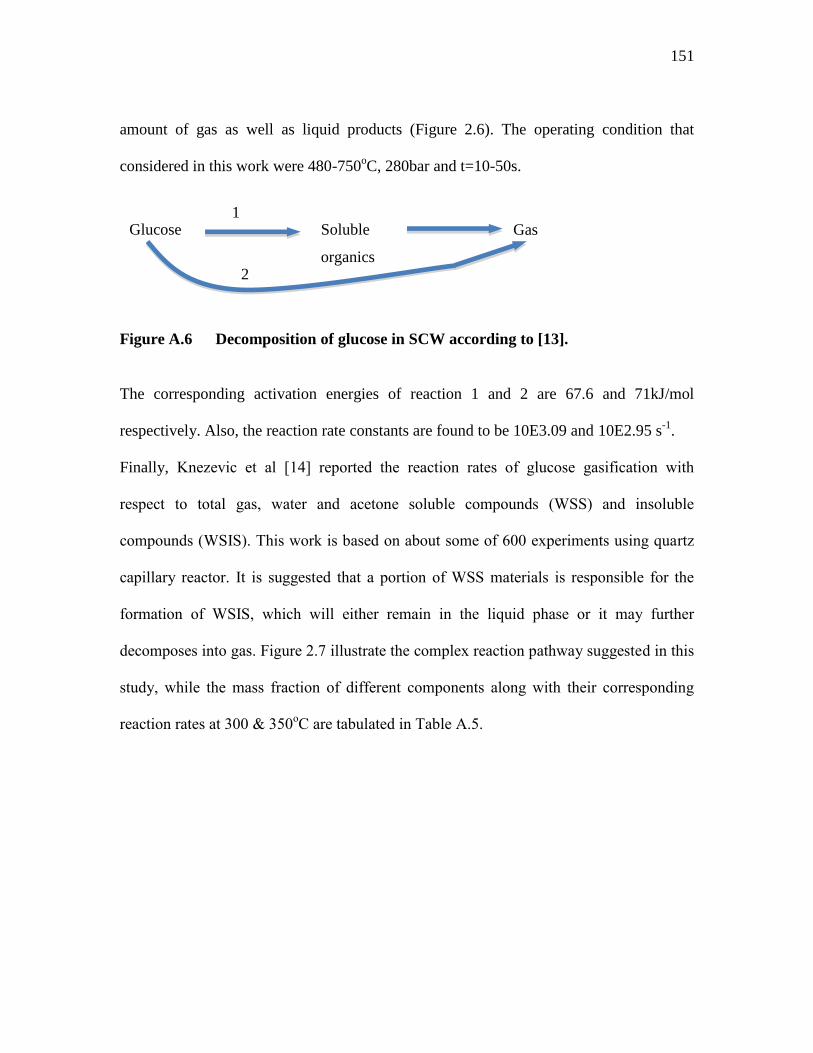


![i s t ry & Shah et al., h e m A C Modern Chemistry ... · bio-oil, including catalytic hydrodeoxygenation [7-9], catalytic cracking, steam reforming, catalytic esterification, supercritical](https://static.documents.pub/doc/80x56/5e16f3bd25fd914ac96a7a7e/i-s-t-ry-shah-et-al-h-e-m-a-c-modern-chemistry-bio-oil-including-catalytic.jpg)


